Communication

Demonstration of Sensitivity of the Total-Electron-Yield Extended X-ray Absorption Fine Structure Method on Plastic Deformation of the Surface Layer

1
Institute of Materials Research, Slovak Academy of Sciences, Watsonova 47, 040 01 Košice, Slovakia
2
Faculty of Materials, Metallurgy and Recycling, Technical University of Košice, Letná 9, 042 00 Košice, Slovakia
*
Author to whom correspondence should be addressed.
Coatings 2024, 14(3), 295; https://doi.org/10.3390/coatings14030295
Submission received: 25 January 2024 / Revised: 23 February 2024 / Accepted: 27 February 2024 / Published: 28 February 2024

Abstract

:
X-ray Absorption Fine Structure Spectroscopy (XAFS) has proven instrumental for the study of atomic-scale structures across diverse materials. This study conducts a meticulous comparative analysis between total electron yield (TEY) and absorption coefficients at the K absorption edge of polycrystalline Fe and Zr60Cu20Fe20 alloy. Our findings not only highlight differences between TEY and transmission XAFS measurements but also demonstrate the capabilities and limitations inherent in these measurement modes within the context of XAFS. This article provides an experimental exploration of widely used X-ray absorption spectroscopy methods, shedding light on the nuances of TEY and transmission XAFS. Through presenting experimental results, we aim to offer insights crucial to the material science community, guiding experimentalists in optimizing measurements while raising awareness about potential misinterpretations.

1. Introduction

X-ray Absorption Fine Spectroscopy (XAFS) operates on the principle of the interaction between incident radiation and matter, where photon absorption by atoms inevitably triggers atom excitation. Specifically, in X-ray photoionization, absorption of a photon results in the ejection of a photoelectron from a core level [1]. The subsequently excited atom undergoes relaxation through various mechanisms, leading to the generation of fluorescence X-rays, Auger electrons, or secondary electrons. The probability of these decay processes is contingent upon the charge of the nucleus, exhibiting a charge dependence on level width [2].
Acquisition of XAFS data involves multiple detection modes. While direct measurement of X-ray transmission is recommended for homogenous and transparent samples, practical constraints often render samples nonhomogeneous, less transparent, or with low concentrations of absorbing atoms. In such scenarios, alternative detection modes, such as collecting fluorescence photons or electrons emitted in the decay (electron yield), become essential. This study focuses on a comparative analysis of XAFS signals measured in transmission and total-electron-yield (TEY) modes.
In a transmission experiment, the absorption coefficient
μ   or   μ × d ,
where d is the sample thickness, is calculated using
μ × d = ln I 0 I ,
where I0 and I represent the intensities of the incident and transmitted X-ray beams, respectively. Monitoring X-ray intensities typically employs ionization chambers filled with gases, adjusting the type and pressure to match the energy of interest. The resulting absorption coefficient is determined for the entire penetrated volume. On the other hand, TEY involves measuring the total electron yield, modified by electron multiplication in the detector gas due to impact ionization events. The TEY signal encompasses contributions from secondary electrons and inelastically and elastically scattered Auger electrons. Notably, in a gaseous environment, Auger contributions dominate the signal [3,4,5].
Given that Auger electrons exhibit typical escape depths ranging from 100 Å to a few 1000 Å [3,4], the TEY technique inherently possesses surface sensitivity. This allows researchers to specifically investigate the atomic structure and composition of a thin surface or coating itself, rather than being influenced by the underlying substrate. This is crucial for understanding properties like adhesion, wear resistance, and corrosion protection, which are primarily determined by the surface characteristics. Moreover, by varying the incident X-ray angle, TEY EXAFS can provide some depth profiling capability. This allows researchers to investigate the compositional variations within the top surface or coating layers, revealing whether it is uniform or has distinct interfacial regions. This information is critical for understanding the coating’s overall performance and designing improved structures such thin oxides or highly disordered layers [6,7,8].
This paper presents a comprehensive examination of XAFS signals, elucidating the distinctions between transmission and TEY modes, thereby contributing valuable insights to the broader scientific community engaged in surface analysis and X-ray absorption spectroscopy.

2. Materials and Methods

The XAFS measurements were conducted at the HASYLAB facility at DESY in Hamburg, Germany, specifically at the E4 experimental station situated at the DORIS III positron storage ring. The positron energy was maintained at 4.45 GeV, with a stored current ranging from 140 to 100 mA. Simultaneous acquisition of Fe K-edge transmission and TEY XAFS signals was performed through step scans covering an energy range from 6862 to 8300 eV, utilizing a Si(111) double-crystal monochromator. Beam harmonics rejection was executed using a gold-coated horizontal plane mirror upstream of the monochromator and by detuning the second monochromator crystal to 60% of the rocking curve height. The incident beam size at the sample was approximately 0.6 mm × 5 mm.
Monitoring of the incident and transmitted beam intensity (I0, I) was achieved by measuring the current in the first and second ionization chambers filled with Ar to 38 mbar (10% absorption) and 250 mbar (50% absorption), respectively. The TEY signal (Ie) was detected using an electrometer connected to the sample holder, biased at −90 V with respect to the ground. Helium with 300 mbar pressure served as the charge-transmitting medium between the photocathode (sample) and anode (electrode). For energy calibration, the Fe reference foil was measured concurrently with the sample in transmission mode.

3. Results and Discussion

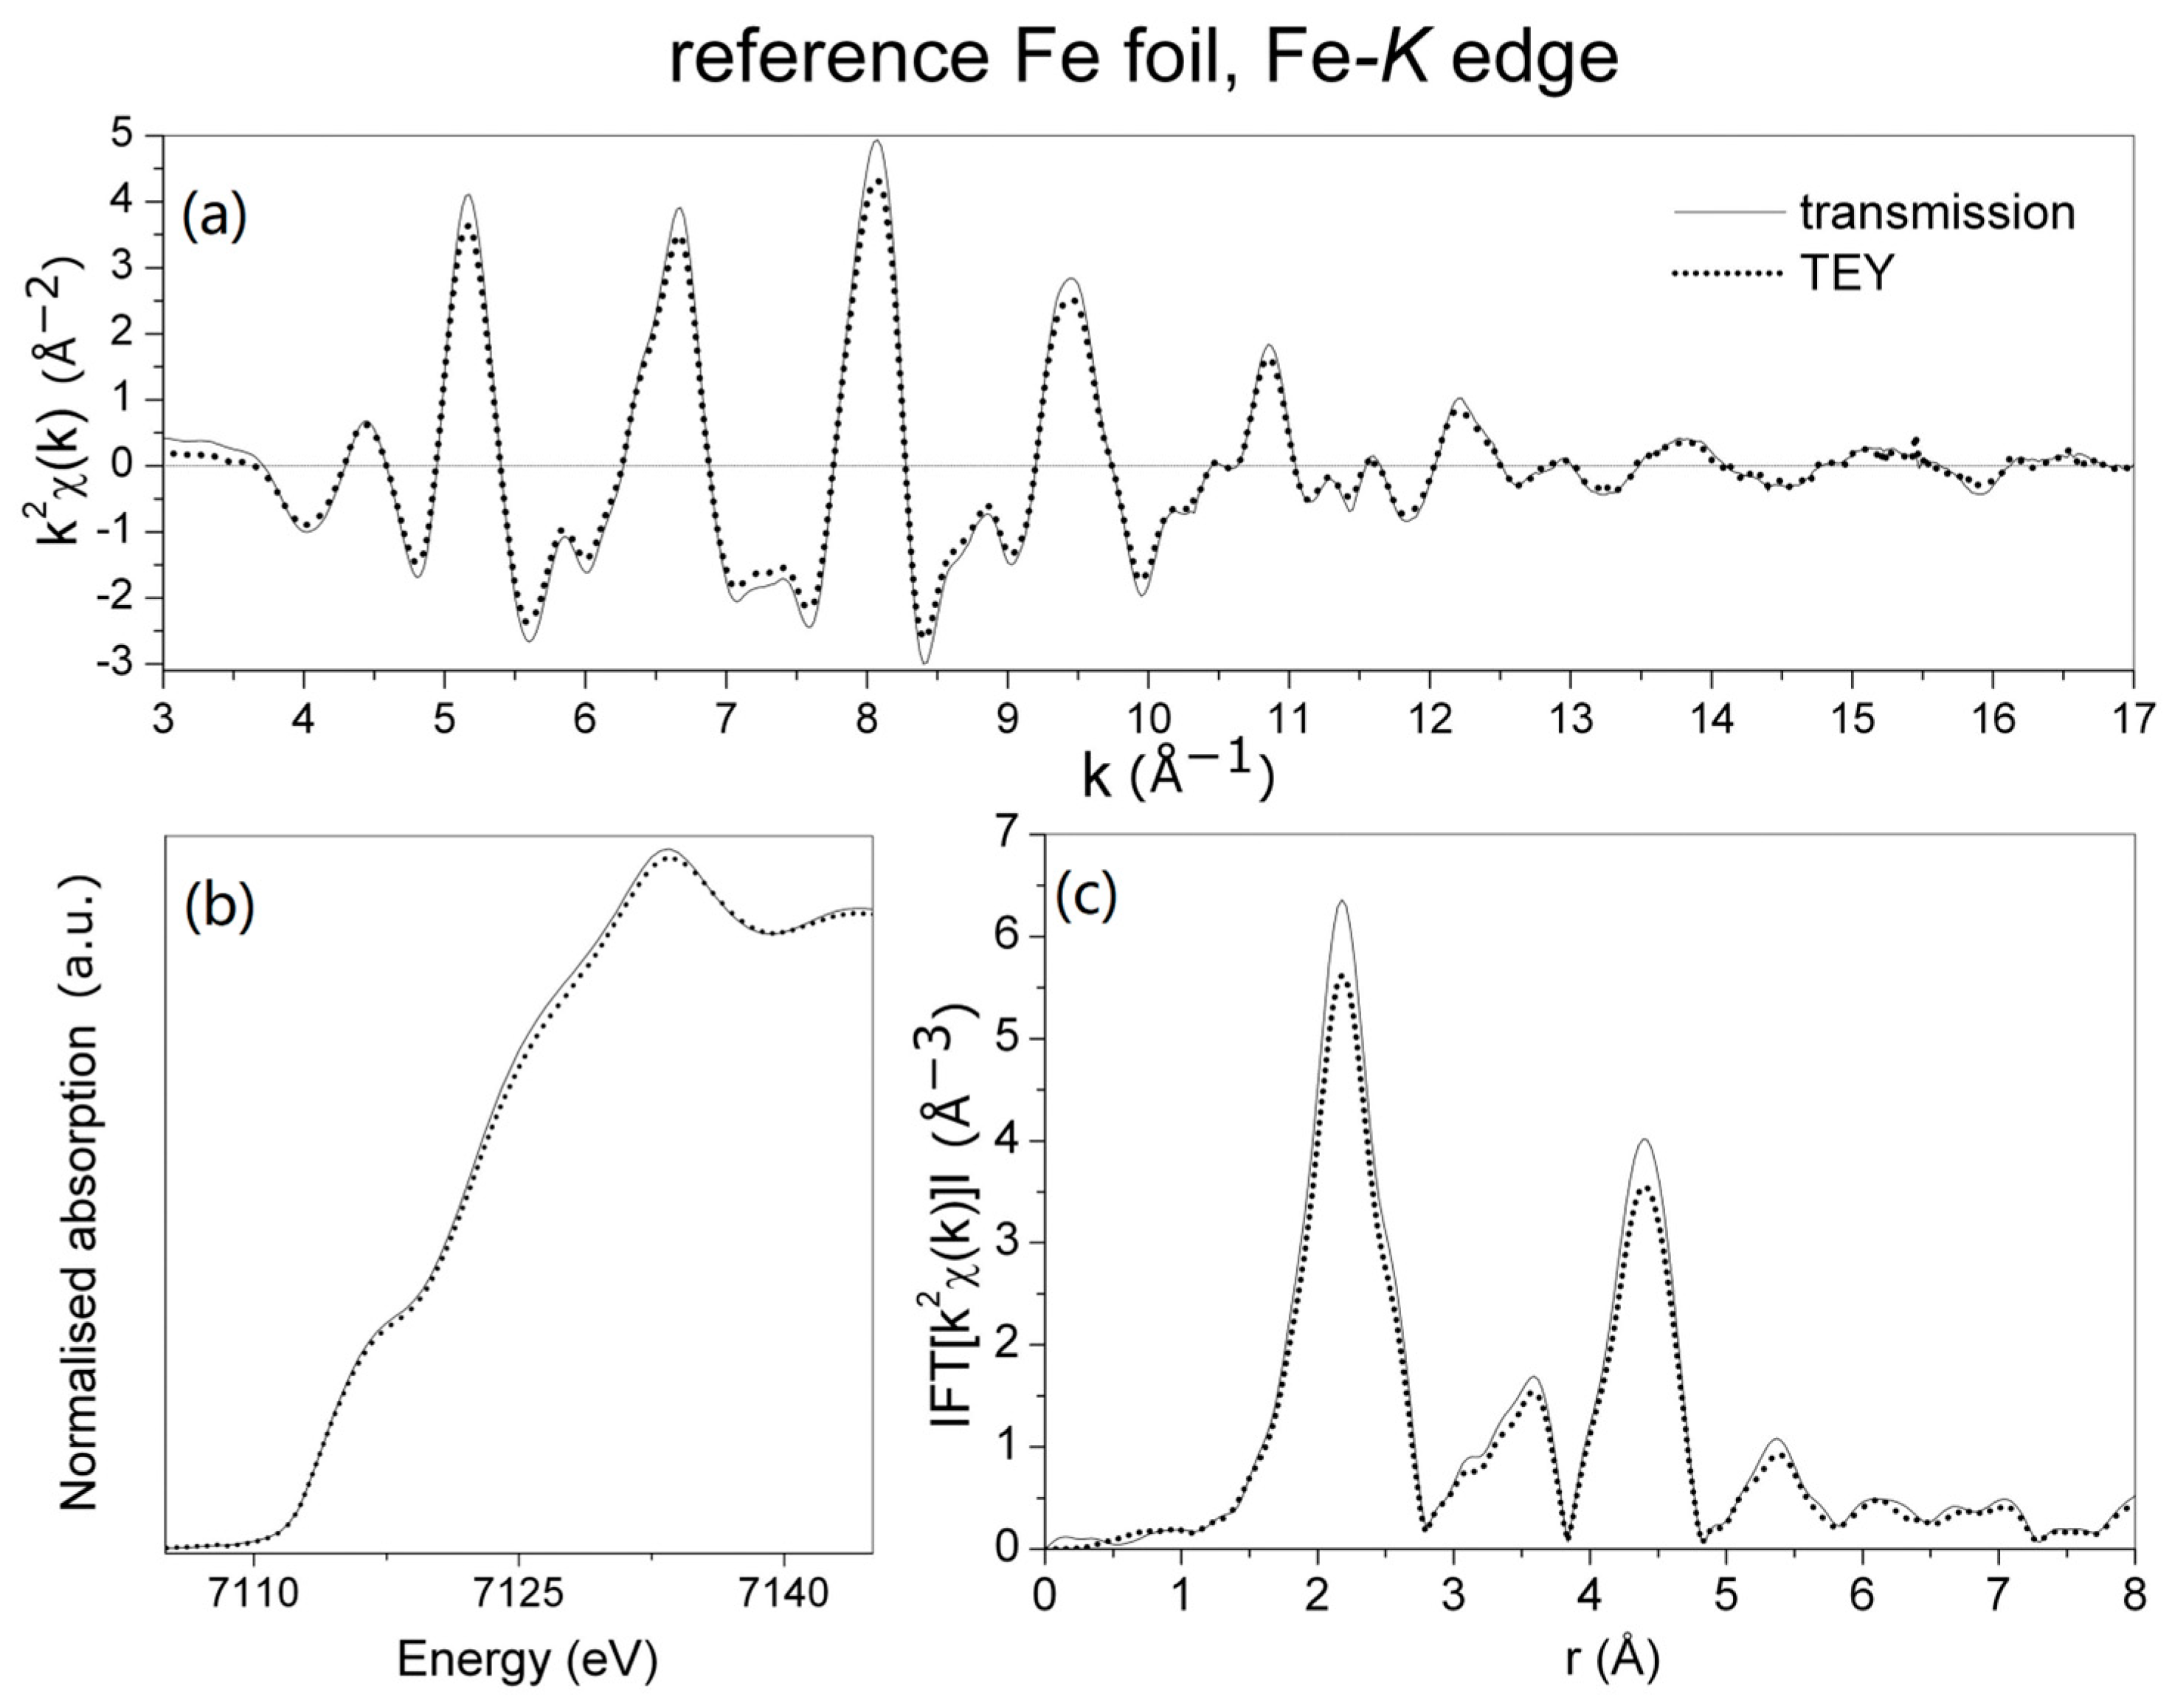
3.1. Measurement of the Reference Sample

To validate the functionality and sensitivity of the instrument, initial XAFS measurements were conducted on an 8 µm thick Fe foil of 99.9% purity, commonly utilized as a reference for transmission measurements. Figure 1 illustrates a comparison of the absorption coefficient from transmission (full) and electron yield (dotted) spectra. Near-edge features (XANES) and EXAFS oscillation signals were nearly identical in both measurements, although small differences in magnitudes were observed in the Fourier transforms. Numerical fitting of the transmission and TEY EXAFS signals yielded coordination numbers of 14 and 13.3, respectively. These results demonstrated that, for our Fe reference, both techniques yielded comparable outcomes.

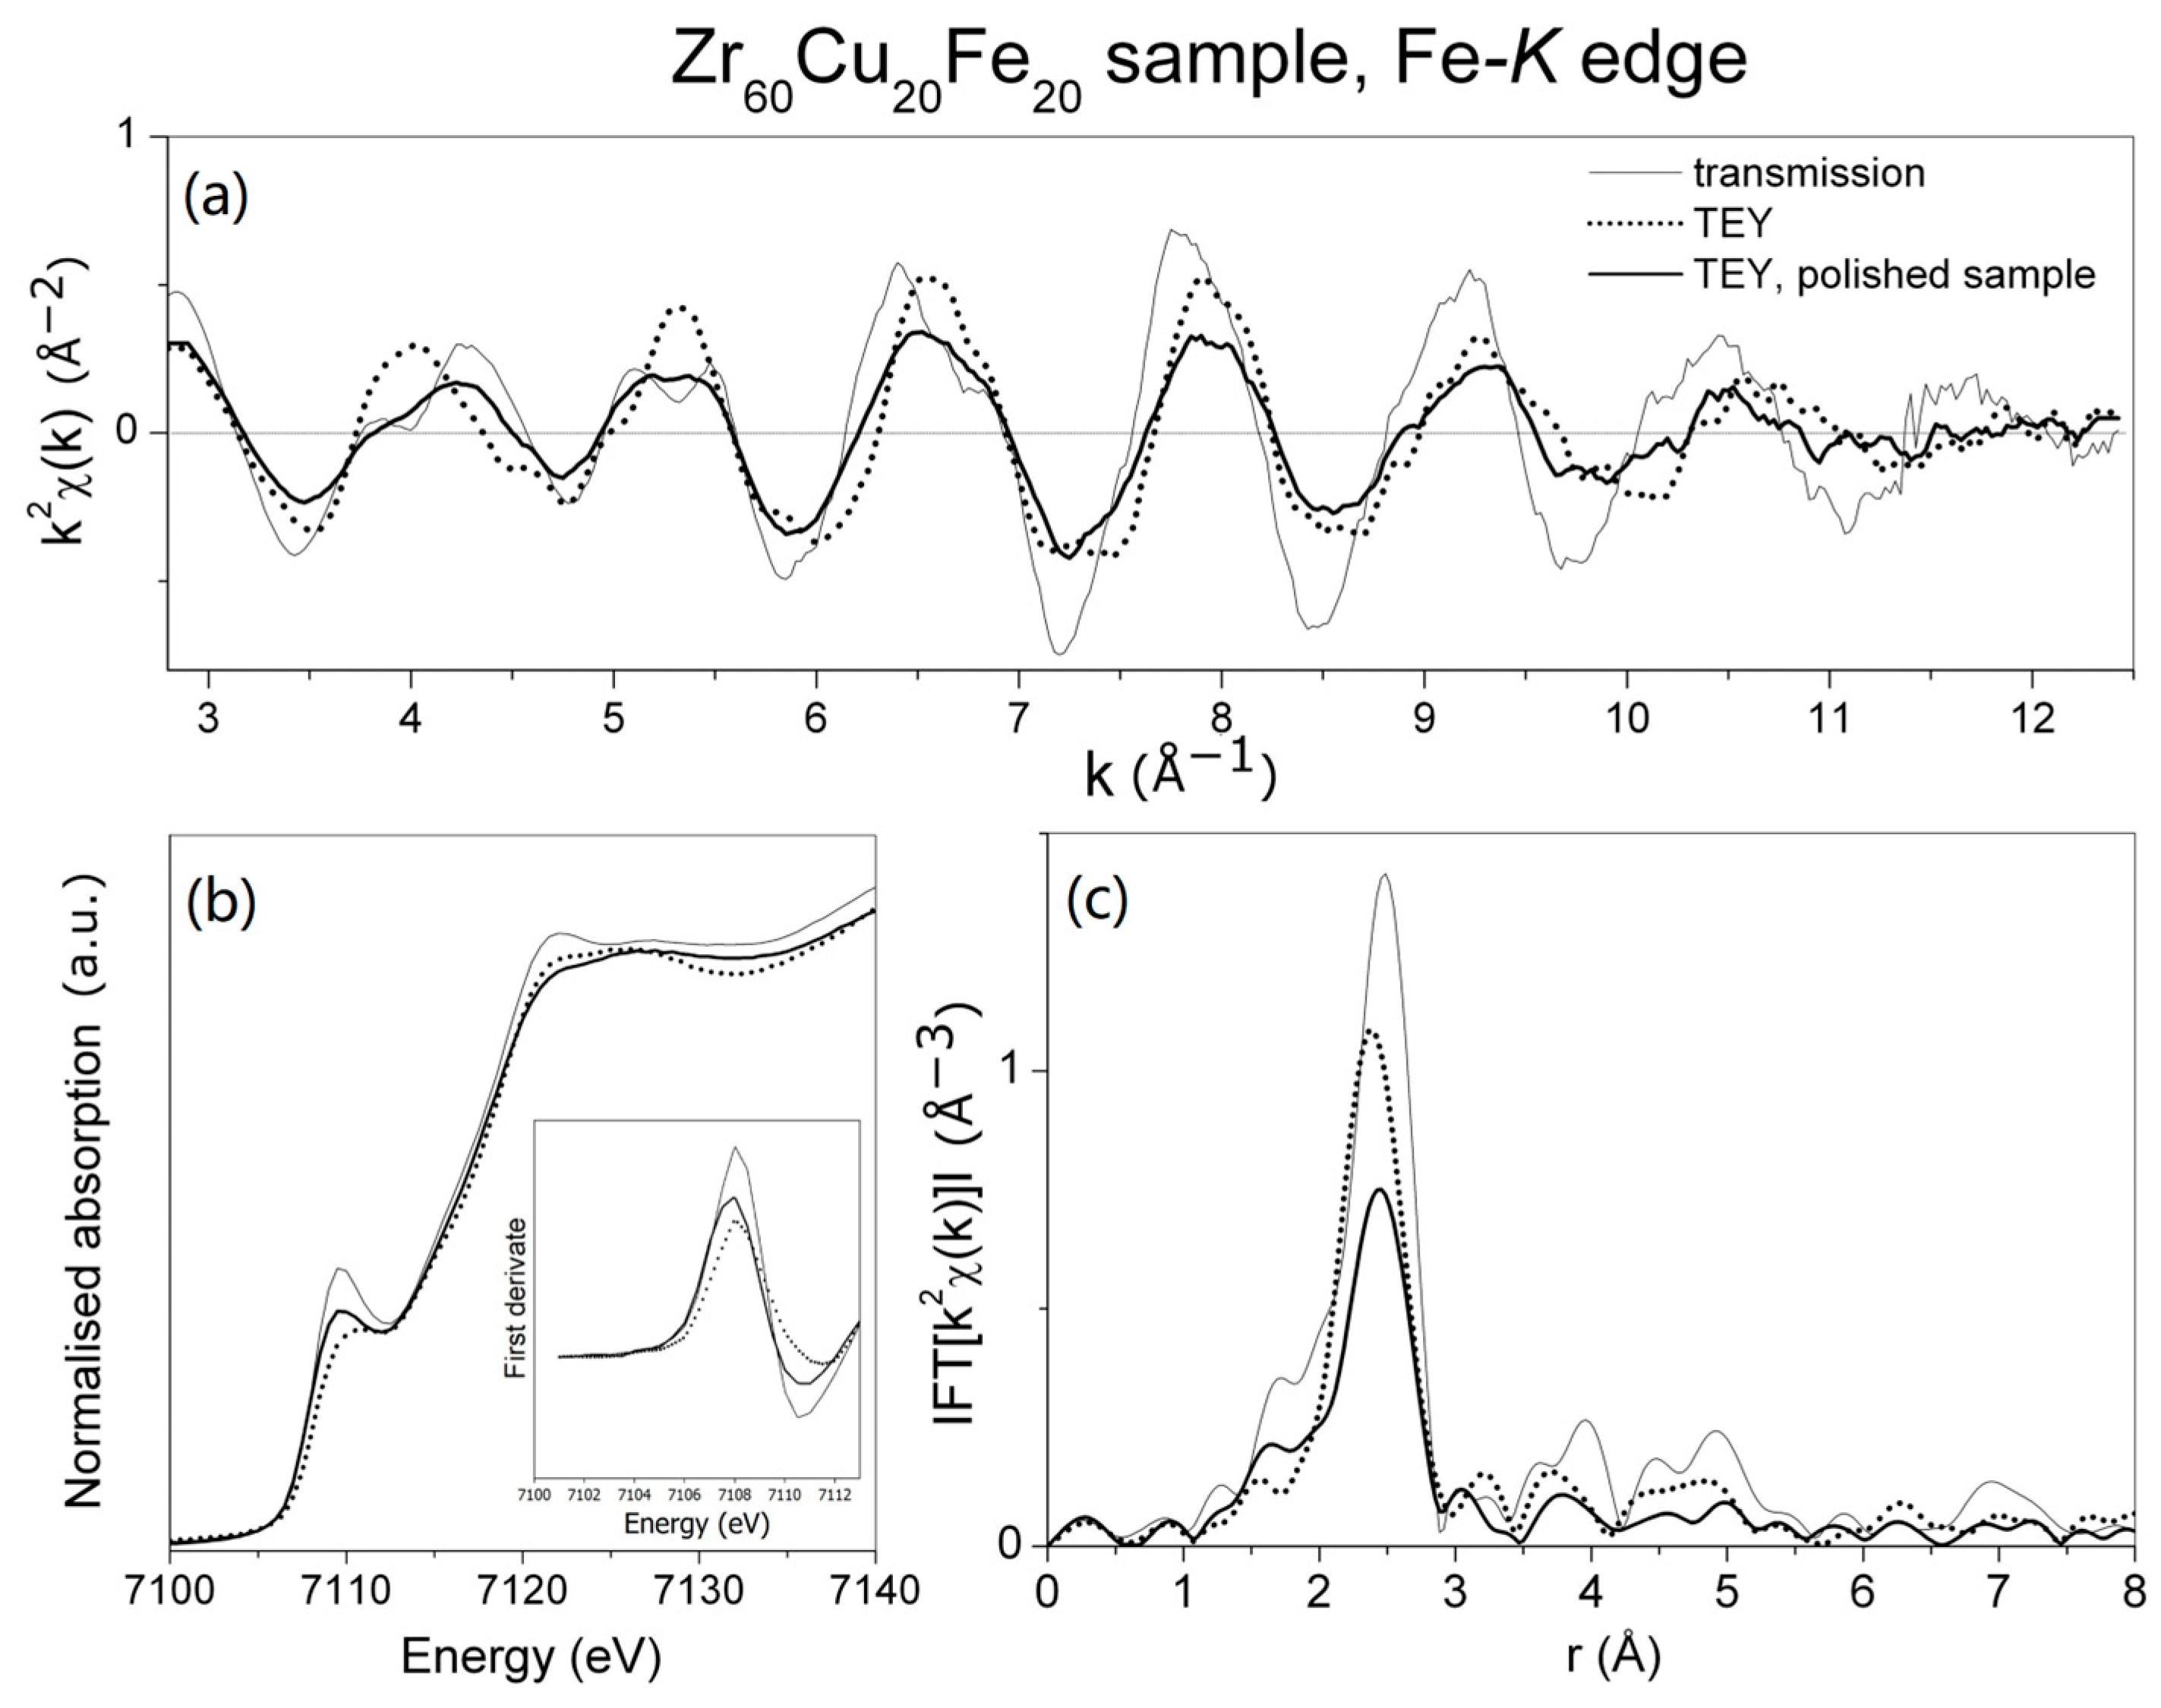
3.2. Measurement of Crystalline Zr60Cu20Fe20 Alloy

Extending this conclusion to non-reference samples, we examined the polycrystalline Zr60Cu20Fe20 alloy initially prepared as a 3 mm wide and 10 µm thick amorphous ribbon using the melt-spinning technique. As is well known, metallic glasses prepared by the method of ultra-rapid (up to 106 K/s) quenching of the melt are chemically homogeneous and isotropic. Such a precursor is very suitable for the preparation of homogeneous crystalline material by annealing in a vacuum. The sample underwent pre-annealing at 700 °C for 30 min in a vacuum of <10−5 mbar, resulting in a fully crystalline structure but maintaining a metallically shiny surface. It is well known that zirconium and its alloys are highly susceptible to oxidation. During the oxidation process, they form a dark, even black layer on the surface. Our originally amorphous alloy was fully crystallized by annealing. Since the annealing was carried out in a vacuum of <10−5 mbar, no thicker oxide layer was formed. However, despite the relatively high vacuum, it is reasonable to assume that a very thin oxide layer several atomic layers thick is present on the surface of the sample.
Figure 2 compares absorption coefficients (thin line), electron yield spectra from the pre-annealed sample (dotted), and electron yield spectra from the same sample after surface polishing toward the anode (bold line). Significant differences in the obtained absorption cross-sections were observed.
The TEY from the pre-annealed sample, when compared to transmission, exhibited a slight shift in the Fe-K absorption edge toward higher energies (blue shift) (Figure 2b), a reduced intensity of the pre-peak at 7108 eV, and different post-edge features. These differences were attributed to the presence of an oxide layer on the sample surface, where the chemical and geometrical environment of Fe atoms differed from the bulk. To verify this assumption, the sample surface was polished using fine sandpaper, and XAFS spectra were re-measured. The onset of the absorption edge coincides with the transmission result, and the pre-peak increases significantly, but the post-edge structure remains distinct. The “blue shift” is caused by the loss of electrons from Fe atoms due to the presence of an oxide bond. This shift is not large, but it is important to keep in mind that the oxide layer is very thin.
The EXAFS signals from measurements in transmission mode and in TEY mode (both after annealing and after removal of the oxide layer) are different. The electron yield from the pre-annealed sample displays distinct but out-of-phase oscillations with those observed in transmission, mainly in the region of k = 4 Å−1. This discrepancy becomes more pronounced after Fourier transformation into r-space, revealing a shift in the main peak to lower r values (0.1 Å). Simultaneously, the peak height is significantly lower (30%). After polishing of the sample, the electron yield EXAFS oscillations align more closely with the transmission, and the main Fourier-transformed peak reverts, albeit with an intensity merely half of the transmission signal. The observed disparity in electron yield intensity compared to absorption has been extensively discussed in the literature [9,10,11].
Stöhr et al. proposed utilizing the edge jump μK(E) absorption instead of background μ0(E) for μ(k) normalization, positing an improved TEY-transmission agreement [12]. However, our calculations indicate that the difference between normalizations is negligible. Instead, we attribute the measured amplitude variance to a distinct local atomic structure at the probed depth, which differs between these two techniques. As demonstrated by Erbil et al., the TEY signal is predominantly influenced by emitted Auger electrons, notably the KLL Auger process for Fe, with limited escape depths to several hundred angstroms [13]. Given the expectation of rapid nucleation starting at energetically favorable places, typically surfaces, the surface layer (a few hundred angstroms thick) is anticipated to be replete with grain boundaries, impurities, inclusions, and networked dislocations. These factors, along with oxide presence, effectively diminish the XAFS interference signal. While polishing removes the oxide layer, it concurrently introduces a highly plastically deformed zone, full of lattice defects, further reducing the amplitude. Therefore, although TEY facilitates the investigation of bulk properties, meticulous attention to sample surface preparation, such as electropolishing or ion milling, possibly combined with a suitable coating, becomes imperative.
Although the total electron yield (TEY) is less commonly used compared to the transmission or fluorescence X-ray absorption spectroscopy (XAS) techniques [14,15,16], it offers unique advantages in its sensitivity to surface properties and ability to provide detailed information about the valence state, local symmetry, and spatial distribution of atoms in a material. TEY is particularly suitable for studying thin films, surface engineering, corrosion, energy storage, electrocatalysis, and semiconductors [17,18]. Additionally, material preparation for TEY measurements is simpler than for the transmission or fluorescence mode, allowing for the use of thick and concentrated specimens.

4. Conclusions

In conclusion, our investigation utilizing the total-electron-yield EXAFS (TEY) method has provided unique insights into the impact of plastic deformation on the surface layer of materials. The comparison with traditional transmission measurements, particularly on a reference Fe foil, has underscored the capabilities and limitations of TEY in probing atomic-scale structures. The examination of the crystalline Zr60Cu20Fe20 alloy has revealed distinctive differences between TEY and transmission modes, emphasizing the necessity of meticulous sample surface preparation for accurate and reliable TEY measurements. We stress the importance of addressing potential misinterpretations and offer recommendations for optimizing TEY measurements based on the observed limitations. Our study serves as a guide for experimentalists conducting XAFS measurements, contributing to the advancement of the application and understanding of the TEY method in XAFS spectroscopy. Surface sensitivity, however, can also be a limitation. It only probes the top few nanometers of the coating, making it unsuitable for studying thicker layers or coatings or those with buried interfaces. Quantifying the composition and structure of a coating can be challenging due to complex scattering processes and limited accuracy in determining absolute atomic concentrations. Combining TEY EXAFS with other techniques like XRD or XPS can provide a more comprehensive understanding of the coating structure and composition.
As demonstrated by the simple example of the Zr60Cu20Ti20 alloy, the highly sensitive TEY EXAFS method can also be used to study thin layers after surface treatments other than abrasive cleaning, such as electropolishing or ion etching. However, it is necessary to critically evaluate the influence of surface contamination by corrosion products or ion deposition in this case.
Our results demonstrate the information depth and sensitivity of XAFS signal measurement by both the transmission and the TEY methods. We believe that our article will be an inspiration for readers of Coatings.

Author Contributions

Conceptualization, L.O.; methodology, K.S.; software, K.S.; validation, K.S., D.C. and K.N.; formal analysis, L.O., K.N., Z.M. and B.B.; investigation, L.O., K.S., D.C., K.N., Z.M. and B.B.; resources, K.S., D.C., Z.M. and B.B.; data curation, K.S. and L.O.; writing—original draft preparation, K.S. and L.O.; writing—review and editing, L.O., K.S., D.C., K.N., Z.M. and B.B.; visualization, L.O. and K.S.; supervision, K.S.; project administration, L.O. and K.N.; funding acquisition, K.S. and L.O. All authors have read and agreed to the published version of the manuscript.

Funding

This work was supported by the Slovak Research and Development Agency under Contract nos. APVV-20-0205 and APVV-21-0274, and by the Scientific Grant Agency of the Ministry of Education, Science, Research and Sport of the Slovak Republic and the Slovak Academy of Sciences VEGA, project no. 2/0039/22. This research was funded in part by the international projects EIG CONCERT-Japan/2021/215/EHSAL and M-ERA.NET 3/2022/235/H2MobilHydride.

Institutional Review Board Statement

Not applicable.

Informed Consent Statement

Not applicable.

Data Availability Statement

Data are contained within the article.

Acknowledgments

The XAFS experiments presented in this study were conducted at HASYLAB am Deutschen Elektronen Synchrotron, DESY, located at Notkestrasse 85 in Hamburg, Germany. We acknowledge the pivotal role of DESY in advancing scientific exploration in the field of XAFS spectroscopy. The contribution of DESY to this research is gratefully acknowledged, and their support has been instrumental in the successful completion of the XAFS experiments presented in this manuscript.

Conflicts of Interest

The authors declare no conflicts of interest.

References

  1. Teo, B.K. Derivations of EXAFS Theory. In EXAFS: Basic Principles and Data Analysis; Springer: Berlin/Heidelberg, Germany, 1986; p. 64. [Google Scholar] [CrossRef]
  2. Aksenov, V.L.; Kuzmin, A.Y.; Purans, J.; Tyutyunnikov, S.I. EXAFS spectroscopy at synchrotron-radiation beams. Phys. Part. Nucl. 2001, 32, 675–707. [Google Scholar]
  3. Schroeder, S.L.M.; Moggridge, G.D.; Ormerod, R.M.; Rayment, T.; Lambert, R.M. What determines the probing depth of electron yield XAS? Surf. Sci. 1995, 324, L371–L377. [Google Scholar] [CrossRef]
  4. Schroeder, S.L.M. Towards a ‘universal curve’ for total electron-yield XAS. Solid State Commun. 1996, 98, 405–409. [Google Scholar] [CrossRef]
  5. Schroeder, S.; Schroeder, S.L.M. Probing depth of total electron-yield XAS: Monte-Carlo simulations of auger electron trajectories. Le J. De Phys. IV 1997, 7, 153-C2. [Google Scholar] [CrossRef]
  6. Naftel, S.J.; Coulthard, I.; Hu, Y.; Sham, T.K.; Zinke-Allmang, M. X-ray Absorption Fine Structure (Xafs) Studies of Cobalt Silicide Thin Films. MRS Online Proc. Libr. 1998, 524, 273–277. [Google Scholar] [CrossRef]
  7. Kiryanov, S.A.; Sidorenko, A.F.; Babanov, Y.A.; Romashev, L.N.; Milyaev, M.A.; Kuznetsov, V.L.; Ustinov, V.V.; Vyalikh, D.V. TEY study of local atomic structure of interfaces in Fe/Cr multilayer prepared in situ at synchrotron BESSY II. Nucl. Instrum. Methods Phys. Res. 2005, 543, 196–201. [Google Scholar] [CrossRef]
  8. Rodríguez, A.F.; Sobal, N.S.; Wiedwald, U.; Spasova, M.; Hilgendorff, M.; Giersig, M.; Farle, M.; Arvanitis, D. Local structure of monodisperse Co nanoparticles. J. Magn. Magn. Mater. 2004, 272–276 (Suppl. S1), e1207–e1209. [Google Scholar] [CrossRef]
  9. Demchenko, I.N.; Chernyshova, M.; He, X.; Minikayev, R.; Syryanyy, Y.; Derkachova, A.; Derkachov, G.; Stolte, W.C.; Piskorska-Hommel, E.; Reszka, A.; et al. XANES: Observation of quantum confinement in the conduction band of colloidal PbS quantum dots. J. Phys. Conf. Ser. 2013, 430, 012030. [Google Scholar] [CrossRef]
  10. Poswal, A.K.; Basak, C.B.; Udupa, D.V.; Deo, M.N. Total electron-yield (TEY) detector for X-ray absorption spectroscopy in fluorescence mode. AIP Conf. Proc. 2020, 2265, 030203. [Google Scholar] [CrossRef]
  11. Indari, E.D.; Yamashita, Y.; Hasunuma, R.; Oji, H.; Yamabe, K. Relationship between electrical properties and interface structures of SiO2/4H-SiC prepared by dry and wet oxidation. AIP Adv. 2019, 9, 105018. [Google Scholar] [CrossRef]
  12. Stöhr, J.; Noguera, C.; Kendelewicz, T. Auger and photoelectron contributions to the electron-yield surface extended X-ray-absorption fine-structure signal. Phys. Rev. B 1984, 30, 5571–5579. [Google Scholar] [CrossRef]
  13. Erbil, A.; Cargill, G.S.; Frahm, R.; Boehme, R.F. Total-electron yield current measurements for near-surface extended X-ray-absorption fine structure. Phys. Rev. B 1988, 37, 2450–2464. [Google Scholar] [CrossRef]
  14. Iida, S.; Ohya, K.; Hirano, R.; Watanabe, H. An analysis of the impact of native oxide, surface contamination and material density on total electron yield in the absence of surface charging effects. Appl. Surf. Sci. 2016, 384, 244–250. [Google Scholar] [CrossRef]
  15. Monico, L.; d’Acapito, F.; Cotte, M.; Janssens, K.; Romani, A.; Ricci, G.; Miliani, C.; Cartechini, L. Total electron yield (TEY) detection mode Cr K-edge XANES spectroscopy as a direct method to probe the composition of the surface of darkened chrome yellow (PbCr1−XSXO4) and potassium chromate paints. Nucl. Instrum. Methods Phys. Res. B Beam Interact. Mater. At. 2023, 539, 141–147. [Google Scholar] [CrossRef]
  16. Muramatsu, Y.; Gullikson, E.M. Total-Electron-Yield Measurements by Soft X-ray Irradiation of Insulating Organic Films on Conductive Substrates. Anal. Sci. 2020, 36, 1507–1511. [Google Scholar] [CrossRef] [PubMed]
  17. van Spronsen, M.A.; Zhao, X.; Jaugstetter, M.; Escudero, C.; Duchoň, T.; Hunt, A.; Waluyo, I.; Yang, P.; Tschulik, K.; Salmeron, M.B. Interface Sensitivity in Electron/Ion Yield X-ray Absorption Spectroscopy: The TiO2-H2O Interface. J. Phys. Chem. Lett. 2021, 12, 10212–10217. [Google Scholar] [CrossRef]
  18. Sivkov, D.; Petrova, O.; Mingaleva, A.; Ob’edkov, A.; Kaverin, B.; Gusev, S.; Vilkov, I.; Isaenko, S.; Bogachuk, D.; Skandakov, R.; et al. The Structure and Chemical Composition of the Cr and Fe Pyrolytic Coatings on the MWCNTs’ Surface According to NEXAFS and XPS Spectroscopy. Nanomaterials 2020, 10, 374. [Google Scholar] [CrossRef] [PubMed]
Figure 1. Comparative analysis of absorption coefficient in transmission (full line) and electron yield (dotted line) spectra for an 8 µm thick Fe foil: (a) EXAFS signal measured above the Fe-K edge, (b) absorption edges, (c) magnitudes of k2-weighted Fourier transforms of the EXAFS signal.
Coatings 14 00295 g001
Figure 2. Comparative analysis of absorption coefficients and electron yield (dotted line) spectra for the crystalline Zr60Cu20Fe20 alloy: (a) EXAFS signal measured above the Fe-K edge; (b) absorption edges, inset shows the first peaks of first-order derivative of the absorption edges; (c) magnitudes of k2-weighted Fourier transforms of the EXAFS signal.
Coatings 14 00295 g002
Disclaimer/Publisher’s Note: The statements, opinions and data contained in all publications are solely those of the individual author(s) and contributor(s) and not of MDPI and/or the editor(s). MDPI and/or the editor(s) disclaim responsibility for any injury to people or property resulting from any ideas, methods, instructions or products referred to in the content.

