Article

Thermally Induced Polymorphic Changes in Poly(vinylidene Fluoride) Thin Layer Investigated Using Micro-Raman Spectroscopy

by
Munizer Purica
,
Florin Constantin Comanescu
and
Violeta Dediu
*
National Institute for R&D in Microtechnologies—IMT Bucharest, 077190 Voluntari, Ilfov, Romania
*
Author to whom correspondence should be addressed.
Coatings 2024, 14(12), 1520; https://doi.org/10.3390/coatings14121520
Submission received: 7 November 2024 / Revised: 29 November 2024 / Accepted: 30 November 2024 / Published: 2 December 2024
(This article belongs to the Special Issue Advanced Thin Films Technologies for Optics, Electronics, and Sensing)

Abstract

:
Poly vinylidene fluoride (PVDF) is a versatile polymer that shows polymorphism, and most of its applications are based on its piezoelectric properties given by its polar crystalline phases. Increasing the polymer’s polar β-phase content has been a major pursuit in material science. We present the results on the evolution of induced polymorphic changes of PVDF through thermal treatment and the presence of the nano-ZnO with different morphologies. Three types of samples—a PVDF pure layer, PVDF:ZnO nanoparticles (NPs) and PVDF:ZnO nanorods (NRs)—were subjected to stress by heating at different temperatures from 50 °C close to melting temperature, 170 °C. The changes in PVDF–ZnO composite layers were investigated in situ using an experimental setup consisting of a high-resolution micro-Raman spectrometer and a thermo-electric cell. The ZnO NPs and NRs added in PVDF lead to obtaining a PVDF nanocomposite in which the intensity of the β phase is much higher than that of the α phase: intensities ratio Iβ(840.6 cm−1)/Iα(798.9 cm−1) > 5.56. The phase is stable up to 150 °C, and with the increase in temperature to 170 °C, the β phase passes to a lower crystallinity α phase with a large amorphous content highlighted by the 400–700 cm−1 and 800–1000 cm−1 regions without Raman peaks.

1. Introduction

Poly(vinylidene fluoride) (PVDF) is one of the electroactive polymers that have gained renewed attention due to its remarkable piezo-, ferro-, pyro-electricity properties and to their potential applications in new fields such as flexible electronics, flexible memories, actuators, sensors, energy harvesting, electronic skins, and anti-fouling coating [1,2,3,4]. PVDF is a polymorphic polymer that may crystallize in five crystalline phases denoted as α, β, γ, δ, and ε. To date, at least four polymorphic forms with a permanent dipole moment (polar crystals) are known, denoted as β, γ, δ, and ε, in which the chains are packed so that the dipoles associated with the individual molecules are parallel to each other, which leads to a dipole moment of the crystal other than zero. In the α phase, the chains are packed so that the molecular dipoles are antiparallel and there is no net dipole in the crystal. PVDF is a semi-crystalline polymer, and the degree of crystallinity is approximately 50%, varying from 35% to more than 70%, depending on the polymerization method and the previously applied thermomechanical treatment. The α, β, γ phases of PVDF polymer are widely investigated for their properties and their extensive applications [5,6,7]. The non-polar α phase is thermodynamically stable with a monoclinic crystal structure and can be easily obtained during crystallization from solution or melt. The polar crystalline phases found in PVDF-based materials, like β and γ, with remarkable piezoelectric and pyroelectric properties, are difficult to obtain during conventional processing and can be induced by special methods such as mechanical stretching, applying pressure, electroforming, incorporating other components through copolymerization, adding additives and controlling thermal annealing [8,9]. When preparing a typical PVDF sample, a certain quantity of amorphous phase is obtained along with some crystalline phases. Many efforts have been made to obtain a certain polymorph under repeatable, well-monitored circumstances. The transformation from α to β phase is typically achieved in practice through mechanical stretching at elevated temperatures (80 °C), which reorients the PVDF chains. Regarding the additives’ utilization in PVDF-based materials, these functional substances can improve the β-form crystalline content of the PVDF and the dielectric constant of the resulting composites [10]. In this process, the interfacial interactions are supposed to be responsible for obtaining the β crystalline phase of the PVDF according to the percolation theory [11]. A recent trend to improve the piezoelectric phases is the direct mixing of nanoparticles in the PVDF matrix. Gaur et al. [12] studied the PVDF phase modification in the presence of AuNPs (size 20–30 nm) and found that it is due to the interactions between electric charge at the surface of AuNPs and CF2 dipoles. Multi-walled carbon nanotubes (MWNTs) well distributed in the PVDF matrix contributed to obtaining a high percentage of the β phase through the electrospinning-hot pressing method [13], which was due to the π–dipole interactions. Ternary nanocomposites formed by PVDF filled with organoclay (15A) and multi-walled carbon nanotubes (MWNTs) were obtained through a melt-mixing process [14]. 15A facilitated the formation of β-form PVDF, and MWNTs improved the dispersibility of 15A in the PVDF matrix. The influence of zinc oxide (ZnO) nanoparticles addition in PVDF crystallization in certain polar phases was also studied [15] and proved to effectively modulate some physical properties of a pristine PVDF polymer [16,17].
Another strategy to improve the content of polar phases is to use polar solvents. According to the literature, PVDF films made using DMF (dimethylformamide) have a more polar β phase [18]. The conversion from α to β phase via solution casting is influenced by the rate of the solvent evaporation [19]. Low evaporation rates provide the production of more β phase.
In this paper, we assess in situ the thermally induced phase changes in PVDF and PVDF:ZnO nanocomposites thin layers obtained through solution casting, using an experimental setup consisting of a high-resolution micro-Raman spectrometer and a thermo-electric cell with optical access to the sample. The novelty of this study consists of investigating the effect of zinc oxide nanofiller morphology on the polymorphic changes in PVDF thin films when these polymer materials are subjected to thermal treatment. The changes in the content of non-polar and polar phases in the PVDF at different temperatures have been investigated.

2. Materials and Methods

2.1. Material

PVDF powder with an average molecular weight of 534,000, zinc nitrate hexahydrate (Zn(NO3∙6H2O), sodium dodecyl benzenesulfonic acid (SDBS), potassium hydroxide (KOH) ≥ 85%, ethanol—C2H5OH (98%), and N,N-dimethylformamide (DMF) were purchased from Sigma-Aldrich (Darmstadt, Germany) and used without further purification. Acetone was purchased from Carl Roth (Karlsruhe, Germany).

2.2. Methodologies

2.2.1. Synthesis of PVDF Thin Films

Zinc oxide nanoparticles were obtained through a wet chemical method [20]. Zinc nitrate 3.05 g was dissolved in 100 mL of deionized water. Then, 0.8 g of NaOH was added to 200 mL of deionized water and slowly poured into zinc nitrate solution. The resulting precipitate was washed and dried at 80 °C for 24 h; then, it was heat treated at 250 °C for 2 h.
ZnO nanorods were obtained by the solvothermal method without seeding as in a previous paper [21]. Briefly, in a glass containing 40 mL of ethanol, 0.8925 g of zinc nitrate hexahydrate was dissolved by stirring for 20 min. Then, 1.0425 g of SDBS was added alongside 3 g of KOH. The solution was poured into a Teflon vessel and introduced into an oven preheated to 100 ° C for 10 h. The white precipitate was washed several times with deionized water and ethanol and dried in the oven at 60 °C for 6 h.
Samples were prepared using commercial PVDF powder dissolved in a mixture of 50% DMF and 50% acetone to form a PVDF solution with a concentration of 5% by weight. We added 0.02% zinc nitrate to this solution and stirred for 30 min. A thin layer was deposited in a Petri dish and vacuumed for degassing for 30 min. With the recipe described above, three sample types were prepared and placed on a Cu foil to ensure the rapid acquisition of the temperature from the thermo-electric cell. The schematic diagram of the synthesis procedure of PVDF-based thin films is presented in Figure 1.
Sample (P0) PVDF—the solution was deposited to obtain a thin film of PVDF, and the testing was performed after the evaporation of the solvent;
Sample (P1) PVDF/ZnO NPs—the solution prepared according to the recipe described above (but without the addition of zinc acetate) to which we added the obtained ZnO nanoparticles to reach a concentration of 2.5% (wt./wt.).
Sample (P2) PVDF/ZnO NRs—in the solution prepared according to the recipe described above (but without the addition of zinc acetate), ZnO nanorods obtained by the solvothermal method in the laboratory were added in a 2.5% (wt./wt.) concentration.

2.2.2. Experimental Setup

An experimental platform was configured and realized for in situ Raman analyses of the behavior of polymer and nanocomposite samples with temperature using a thermo-electric cell with rigorous temperature control. The experimental setup consisting of a high-resolution micro-Raman spectrometer (LabRAM HR 800, HORIBA France SAS, Paris, France), coupled thermo-electric cell (DSC600, Linkam, Salfords, UK) and accessories for high-precision temperature control is presented in Figure 2.
DSC600 cells ensure a cooling/heating temperature variation speed of a maximum 30 °C/min and stability of 0.1 °C with the possibility of establishing the desired temperature–time profile depending on the nature of the analyzed sample. Raman spectra were acquired and analyzed for the prepared samples having a size of 16 × 16 mm2 with the profile ramps presented in Figure 2b.
The measurements were performed at room temperature with a red laser (632.8 nm) and a confocal microscope with a special objective with a focal distance greater than 4.5 mm, 50× magnification. All Raman spectra are presented in the area of interest for the Raman lines related to the structural phases (400–1000 cm−1).
The morphology and size of the synthesized samples were observed using a Quanta Inspect F scanning electron microscope (FEI Company, Eindhoven, The Netherlands). X-ray diffraction analysis was performed using a 9 kW Rigaku-SmartLab diffractometer (Rigaku Corporation, Osaka, Japan) with an X-ray beam λCuKα1 = 0.154 nm.

3. Results and Discussion

Figure 3a,c present SEM images of the well-distributed nano-sized ZnO nanoparticles and nanorods. As can be seen from SEM images (Figure 3a), the nanoparticles are polycrystalline with different shapes, having crystals’ faces straight. The nanoparticles have a wide range of sizes distribution, from 13 to 218 nm, and an average dimension of 89.2 nm (Figure 3b). ZnO NRs are small with lengths below 100 nm (average value—41 nm, Figure 3d) and diameters less than 25 nm.
The structural characterization of neat PVDF, nano-ZnO and PVDF/ZnO samples was determined using X-ray diffraction. From the XRD patterns presented in Figure 3c, both types of ZnO synthesized have high crystallinity (large regions that disperse coherently) and low strain caused by crystal defects. Both samples, the nanoparticles and the nanorods, have a wurtzite structure (hexagonal phase, space group P63mc) with cell parameters a = b = 0.32 nm and c = 0.52 nm. The average size of the crystalline domains in the ZnO NPs sample is 23.2 nm, and in the ZnO NRs sample, it is 18.4 nm. Figure 3d shows the WAXD pattern of the thin films’ P1 and P2 samples treated at 50 °C. The diffraction peaks confirm β-phase crystallization at this temperature for both casted thin films. The P2 samples seem to be more crystalline than the P1 samples. The intensity of the ZnO peaks is low due to the small amounts added to the composites.
The chemical structure of PVDF is formed by repeating the (-CH2-CF2-) group. Each CH2-CF2 unit is presented by positively charged H atoms and opposing negatively charged F atoms. These dipoles are rigidly attached to the chain of carbon atoms; their orientation is directly controlled by how they sit in relation to the carbon chain and the way the molecules are packed. Due to the fact that in PVDF, the molecular interactions are dominated by short-range Van-der-Waals forces, as in the case of the α and β phase, the conversion between these polymorphs is easy, since the potential barriers for the related movements (rotations of the molecules of the chain) are very small [5,8]. This fact is also a source of instability, thus facilitating phase transitions. Table 1 shows the active Raman vibration modes in PVDF and the positions at which they appear in the Raman spectrum, and the last column lists the positions of the Raman bands acquired with the HR800 spectrometer.
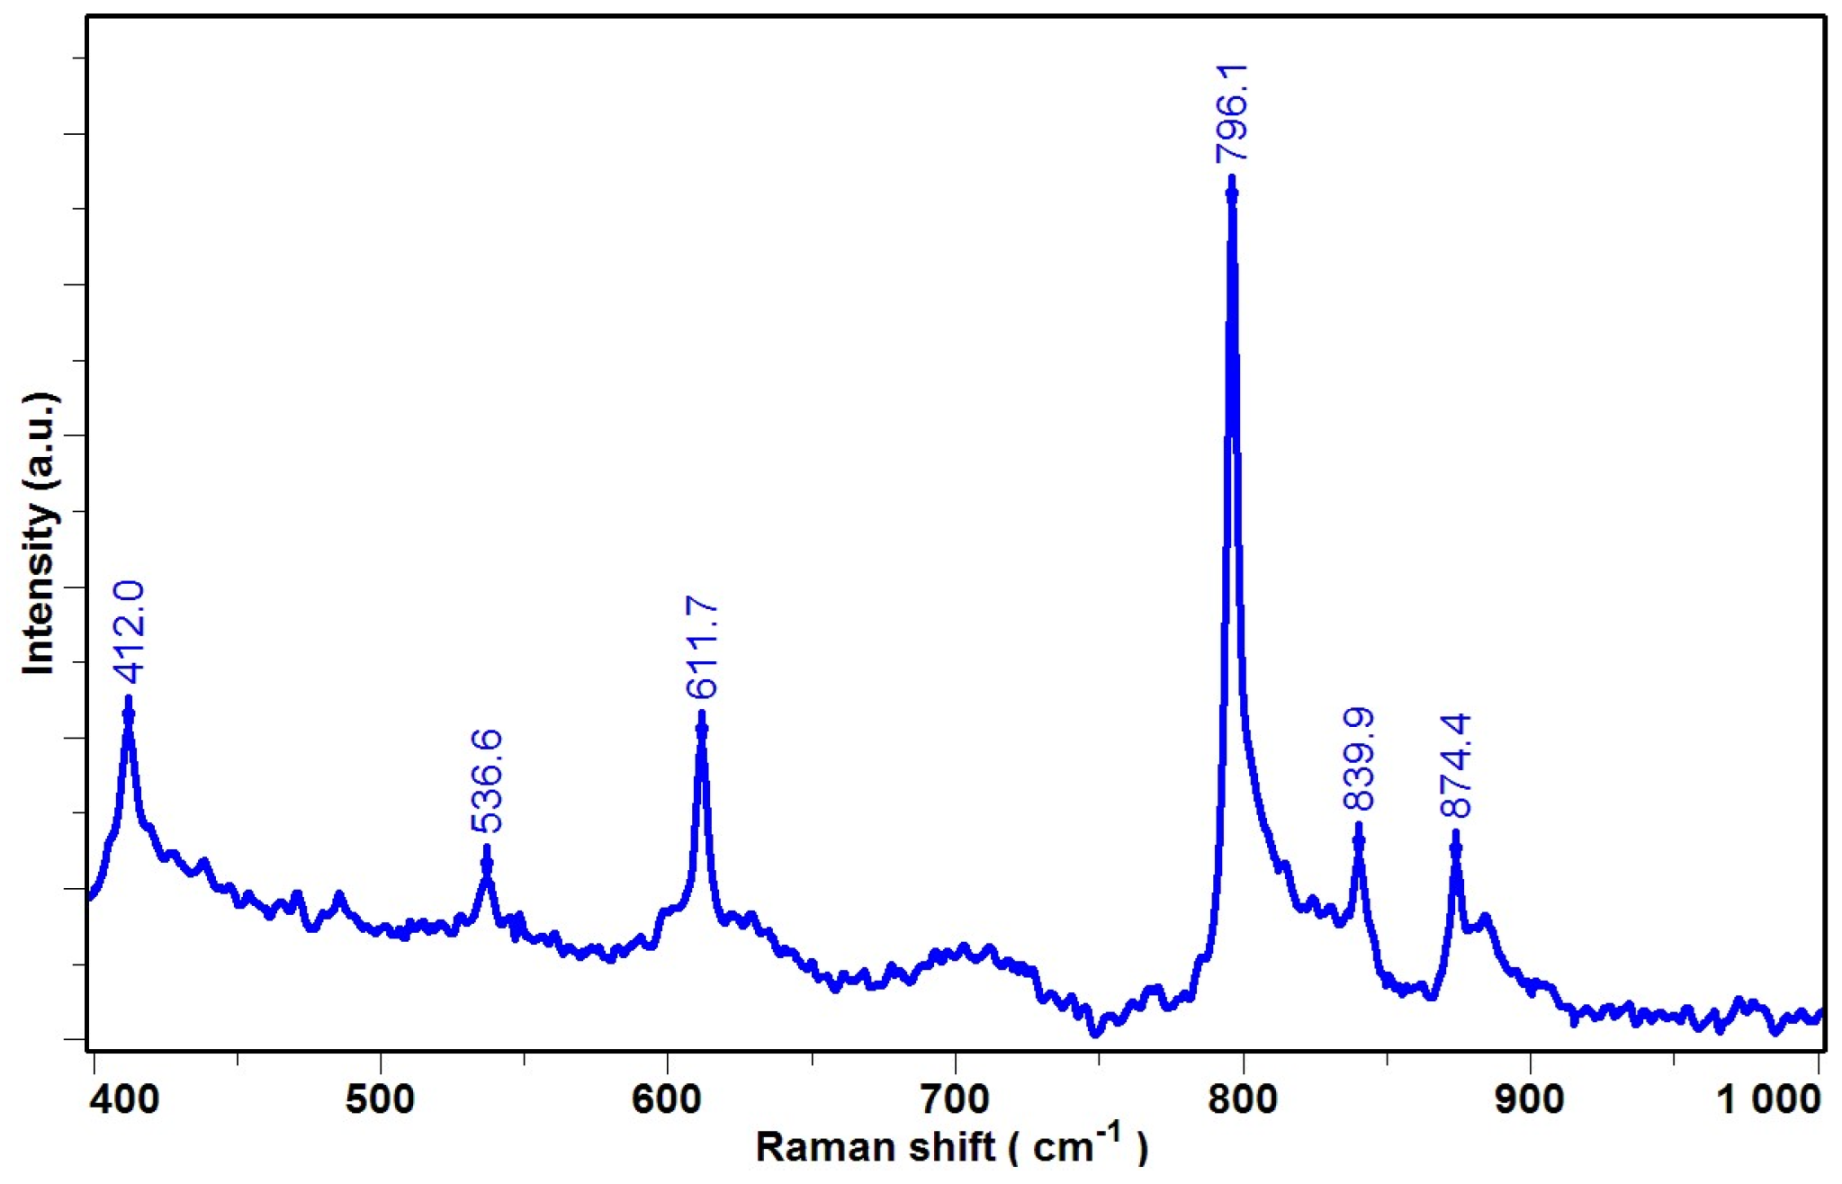
The α phase is the lowest energy conformation phase, it was prepared with the recipe described above, directly from the solution by stirring until it turned transparent, and it was poured on a glass substrate and placed over a plate at 50 °C during 15 min in order to evaporate the solution. Figure 4 shows the Raman spectrum of the prepared α-PVDF layer. It can be seen that all the Raman peaks predominant to crystalline α-PVDF (Table 1).
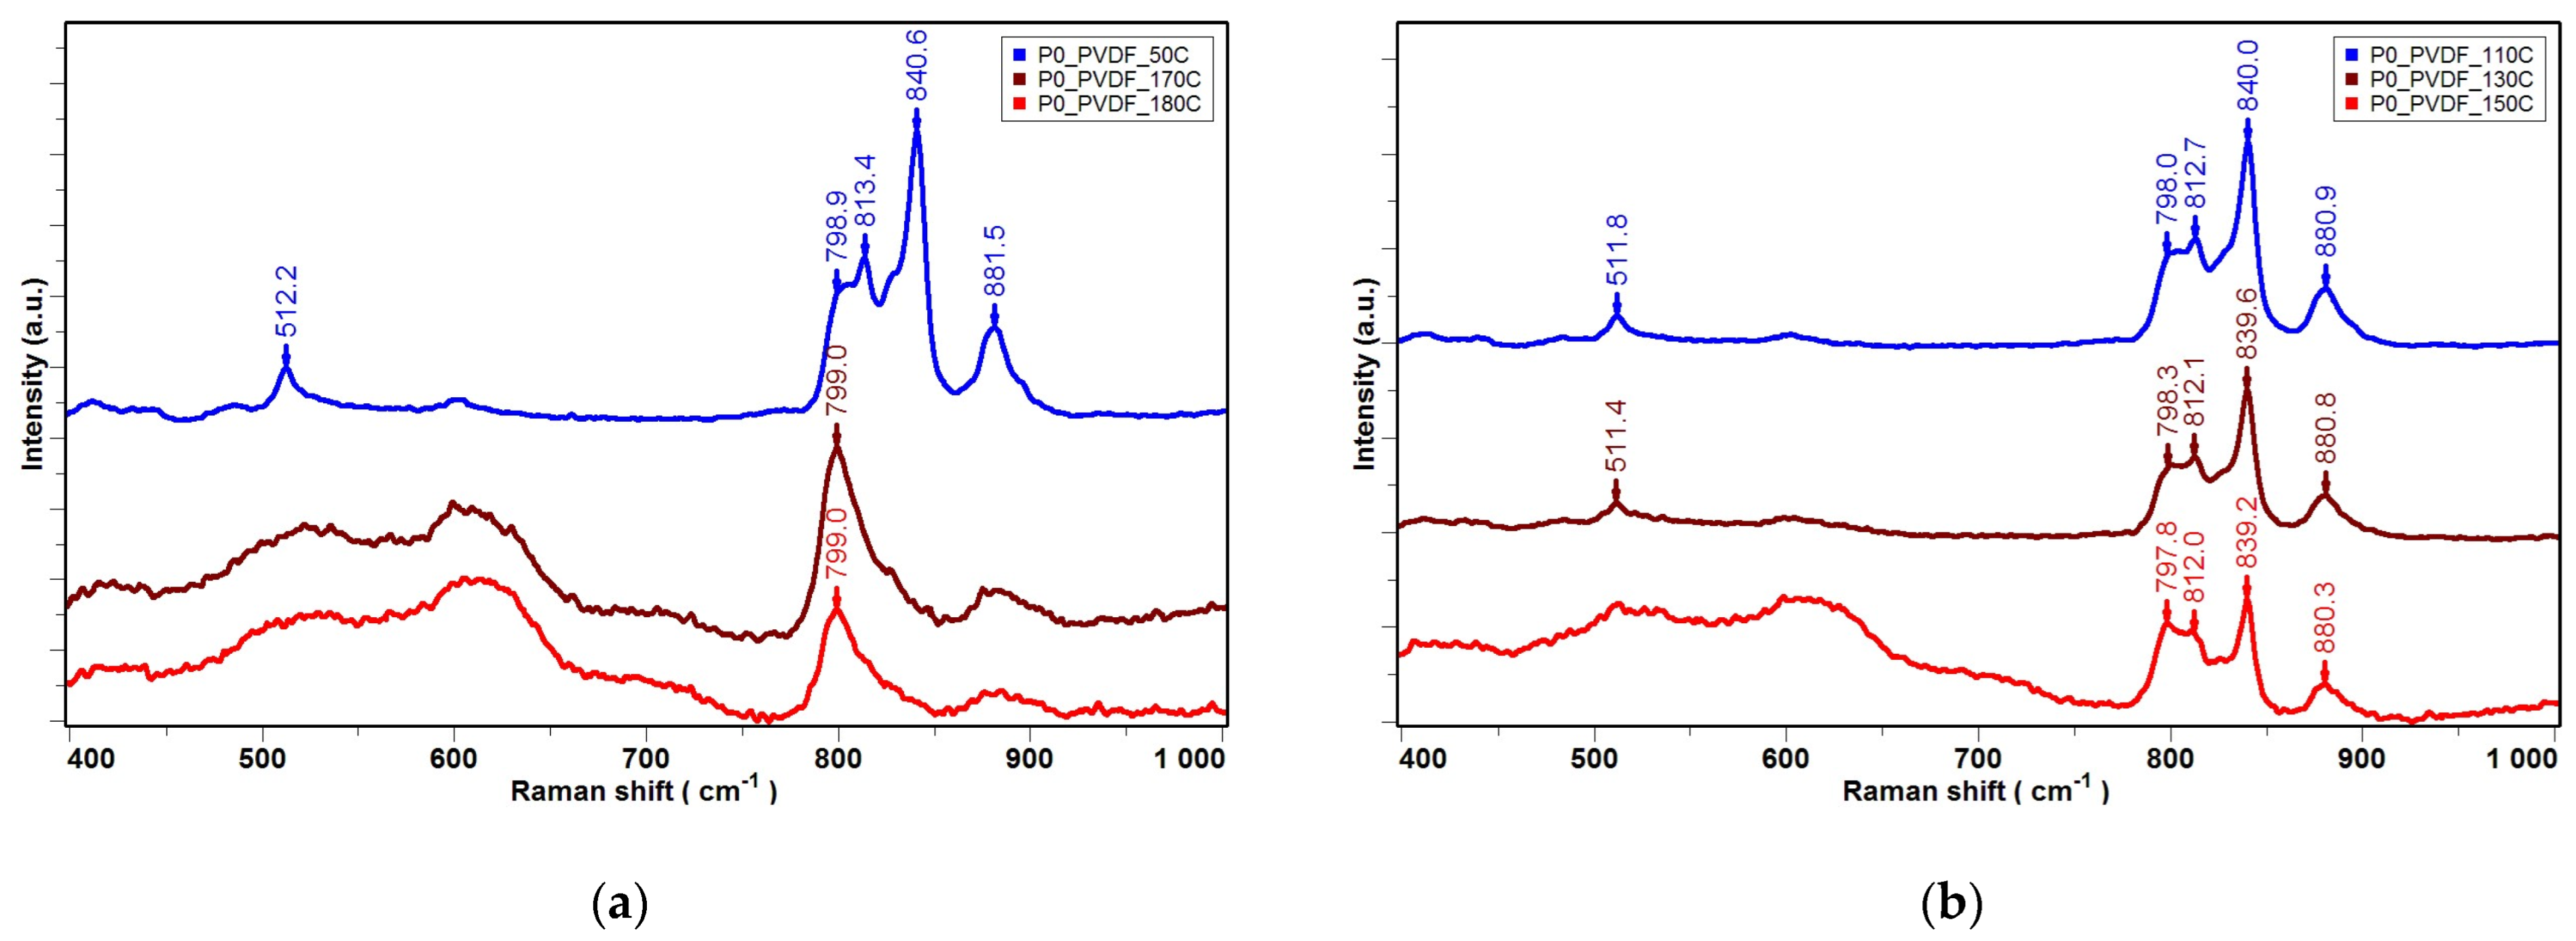
Raman spectra collected for the P0 sample (previously untreated) for different temperatures in the range of 50–180 °C are shown in Figure 5a,b. The evolution of the structure of the P0- PVDF sample can be observed depending on the temperature.
In the P0 sample prepared without initial thermal treatment, heating alters the Raman spectral peaks, specifically with a decrease in the 798 cm−1 band (indicative of the α phase) and an increase in the 840 cm−1 band (characteristic of the β phase). The α phase predominates initially, and from the temperature of 50 °C to close to 150 °C, the β phase is predominant. Near the melting point (170 °C), the tendency is to form the α-PVD phase with a large amorphous content highlighted by the 400–700 cm−1 and 850–1000 cm−1 regions without Raman peaks.
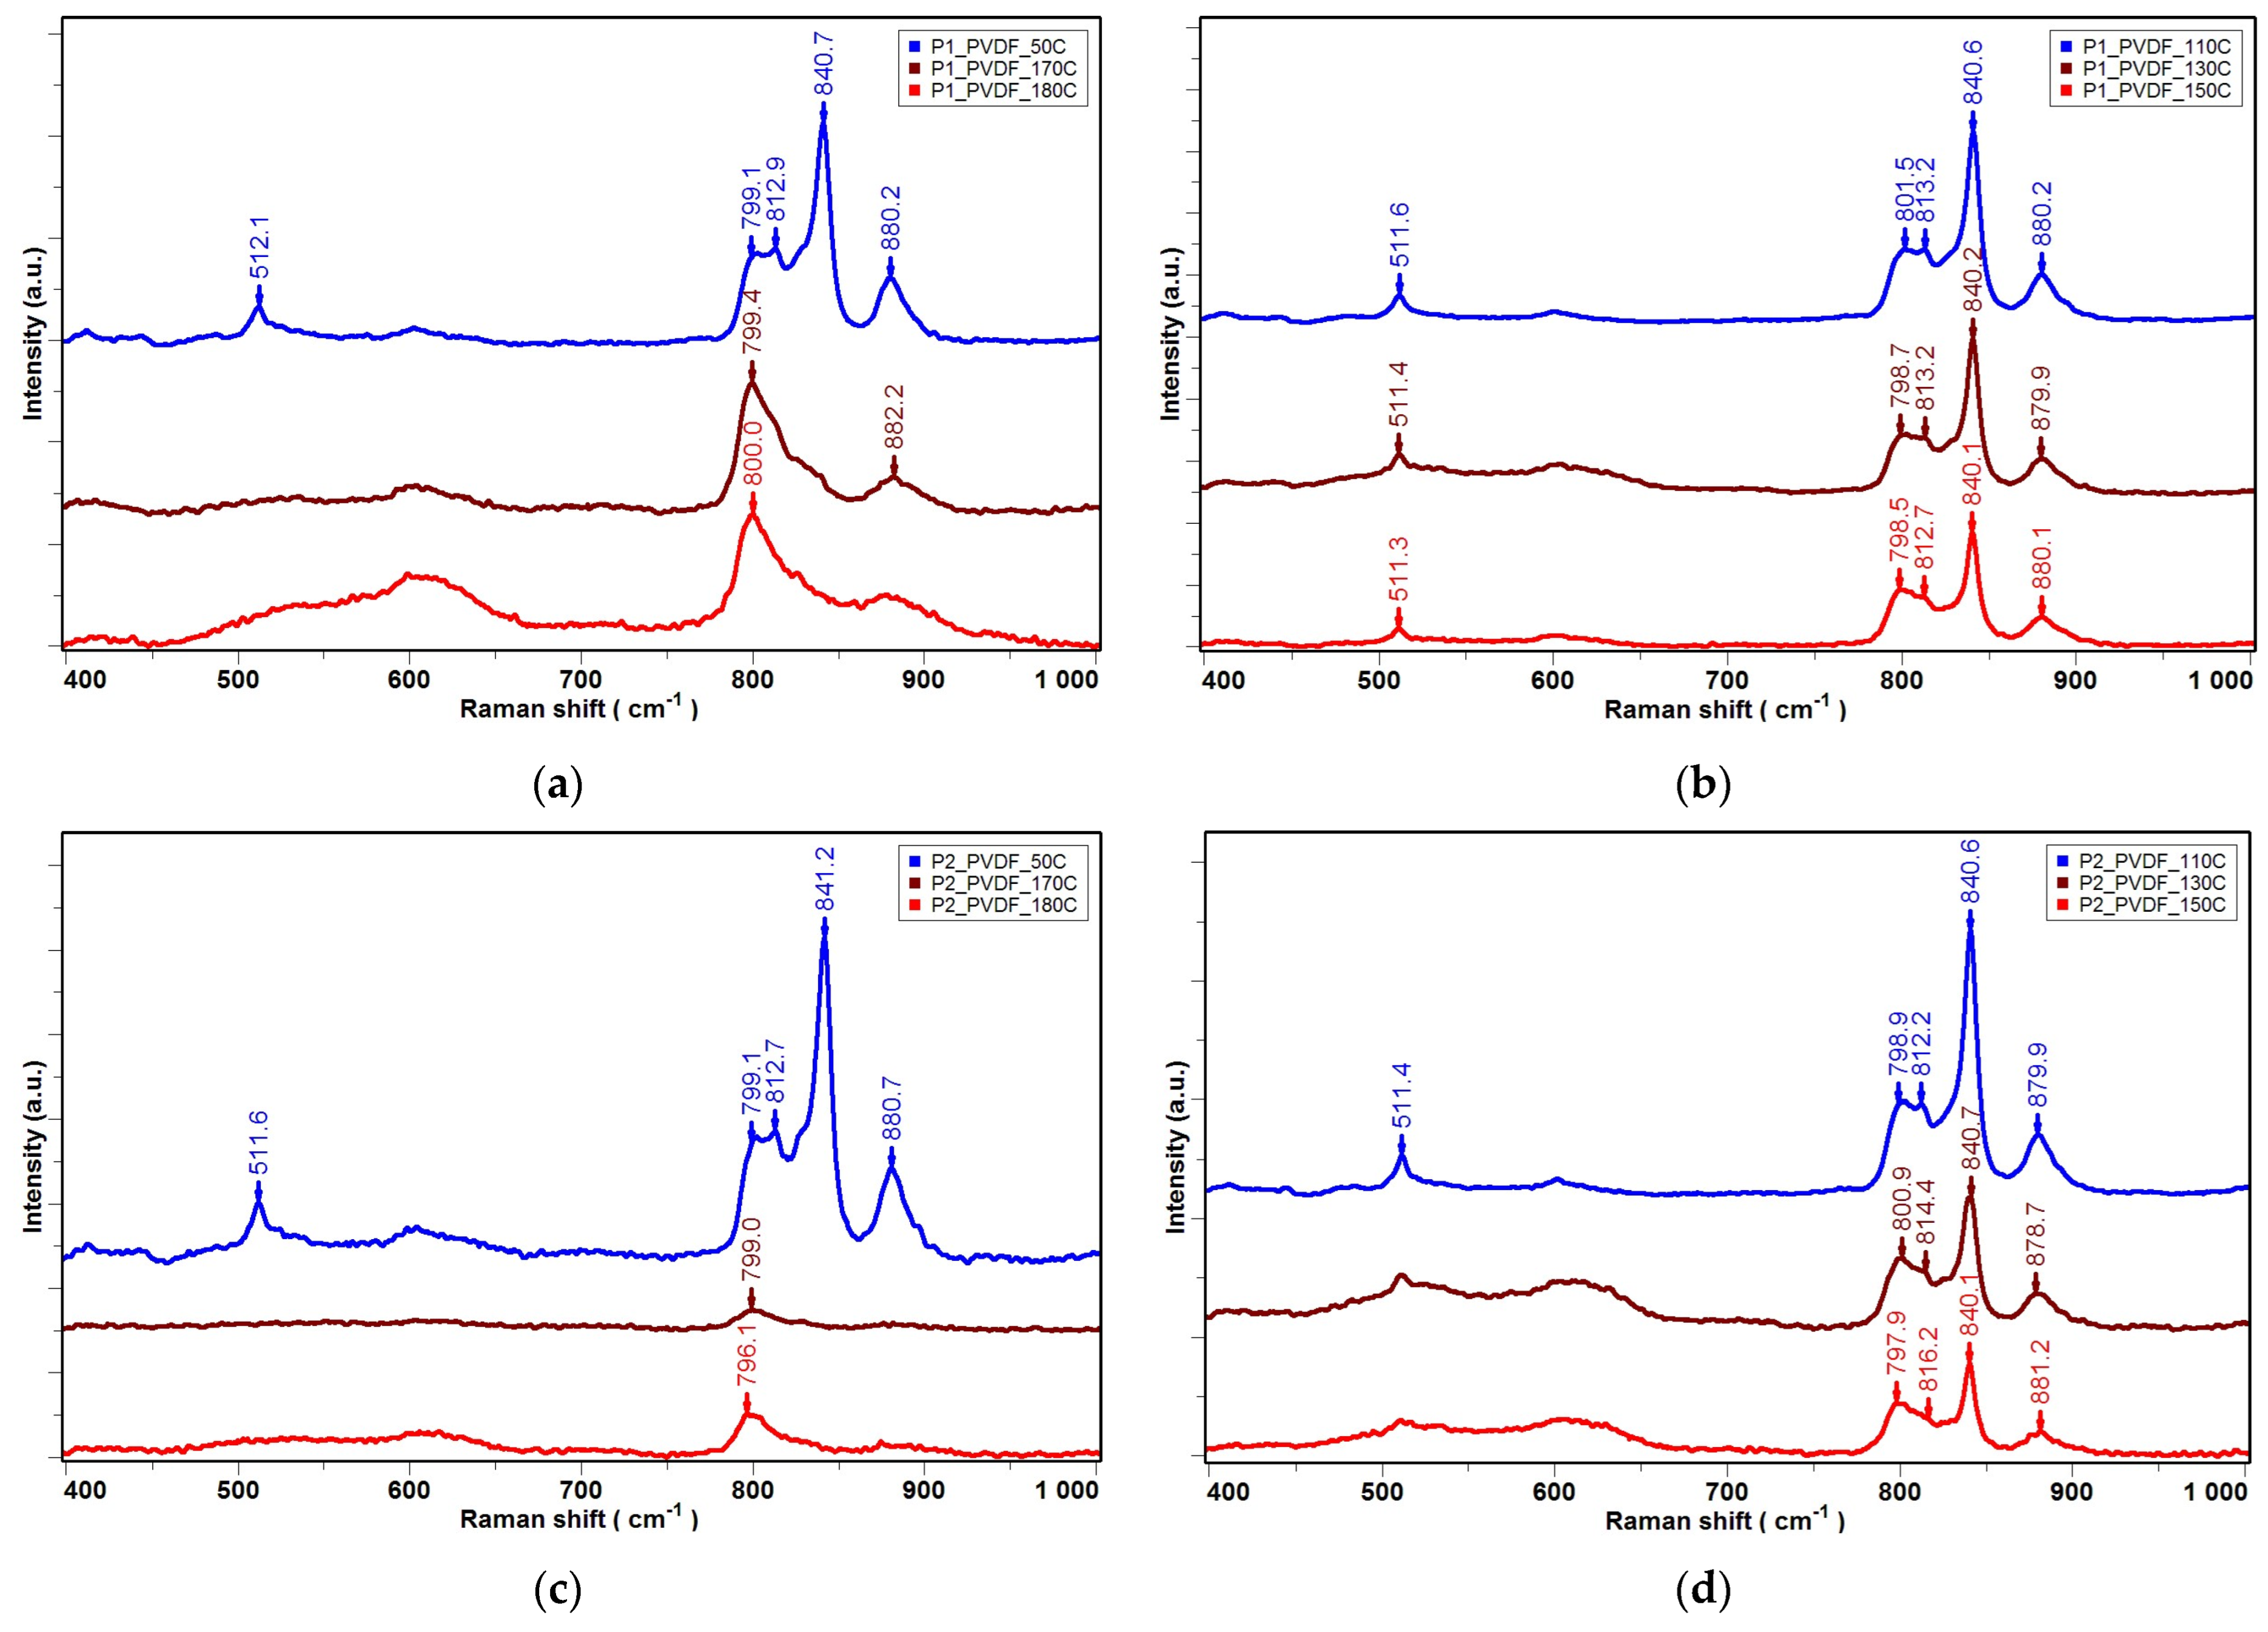
Figure 6a shows the Raman spectra for the thin film sample PVDF:ZnO NPs (P1), and Figure 6b,c show the Raman spectra for the PVDF:ZnO NRs sample (P2). From the intensity of the Raman peaks, it can be seen that the ZnO nanoparticles and nanorods contributed to the strengthening of the β phase and the γ phase (this can be seen in Figure 4 and Figure 5 also); both phases provide piezoelectric properties. Near the melting point, as shown in Figure 6c, the tendency is to form the α phase (~795 cm−1).
To obtain quantitative information regarding the thermally induced phase changes in PVDF thin films, a ratio between the intensity of the distinct Raman peaks β phase at ~840 cm−1 and α phase at ~794 cm−1 was calculated. The results obtained from the micro-Raman investigated samples are presented in Table 2.
It is observed that the introduction of ZnO nanorods leads to obtaining a PVDF composite in which the intensity of the β phase is much higher than that of the α phase (intensities ratio Iβ(839.5 cm−1)/Iα(798.5 cm−1) > 5.56). The phase is stable up to 150 °C, and above the temperature of 170 °C, the β phase changes to a lower crystallinity α phase with a large amorphous content highlighted by the 400–700 cm−1 and 800–1000 cm−1 regions without Raman peaks. Examining the structure and morphology of PVDF thin films having ZnO nanoparticles and nanorods as fillers, these materials showed an increased β-crystalline phase content. Tan et al. [29] also demonstrated that adding even a small amount such as 0.25 wt% of ZnO nanoparticles (particles size < 100 nm) in the PVDF matrix can increase the polar phase in PVDF obtained at 140 °C. The phase transition in PVDF has been investigated using micro-Raman scattering measurements before [26,30,31]. Neidhofer found no sign of phase reversibility at lower temperatures after the annealing treatment of PVDF [30].

4. Conclusions

Thermally induced phase changing in the PVDF thin layer incorporating a low content of ZnO nanoparticles or nanorods was investigated using an experimental platform consisting of a high-resolution micro-Raman spectrometer and a thermo-electric cell. Three types of sample—PVDF pure layer, PVDF:ZnO NPs and PVDF: ZnO:NRs, prepared by the solution-casting method using polar solvents, were subjected to thermal treatment from 50 °C close to melting temperature, 170 °C. Micro-Raman spectroscopy was used successfully to detect the variations of α and β-phases content. The maximum β-phase content was obtained at 130 °C for the PVDF thin films containing ZnO NRs cast from the solution. This simple fabrication method for poly(vinylidene fluoride) PVDF/ZnO nanocomposite thin films led to an increased electroactive phase that enhanced the piezoelectric properties, which is useful for sensor and energy-harvesting applications.

Author Contributions

Conceptualization, M.P. and V.D.; Data curation, V.D.; Formal analysis, F.C.C.; Investigation, M.P., F.C.C. and V.D.; Methodology, M.P.; Writing—original draft, V.D.; Writing—review and editing, M.P., F.C.C. and V.D. All authors have read and agreed to the published version of the manuscript.

Funding

This work was supported by the IMT Core Program μNanoEl, within the PNCDI 2022-2026, carried out with the support of Romanian Ministry of Research, Innovation and Digitization, project No. 2307.

Institutional Review Board Statement

Not applicable.

Informed Consent Statement

Not applicable.

Data Availability Statement

Data supporting the results of this study are available from the corresponding author. These data are not publicly available due to privacy or ethical constraints.

Conflicts of Interest

The authors declare no conflict of interest.

References

  1. Dallaev, R.; Pisarenko, T.; Sobola, D.; Orudzhev, F.; Ramazanov, S.; Trčka, T. Brief review of PVDF properties and applications potential. Polymers 2022, 14, 4793. [Google Scholar] [CrossRef] [PubMed]
  2. Chen, X.; Han, X.; Shen, Q.D. PVDF-based ferroelectric polymers in modern flexible electronics. Adv. Electron. Mater. 2017, 3, 1600460. [Google Scholar] [CrossRef]
  3. Wan, C.; Bowen, C.R. Multiscale-structuring of polyvinylidene fluoride for energy harvesting: The impact of molecular-, micro-and macro-structure. J. Mater. Chem. A 2017, 5, 3091–3128. [Google Scholar] [CrossRef]
  4. Veved, A.; Ejuh, G.W.; Djongyang, N. Review of emerging materials for PVDF-based energy harvesting. Energy Rep. 2022, 8, 12853–12870. [Google Scholar] [CrossRef]
  5. Ruan, L.; Yao, X.; Chang, Y.; Zhou, L.; Qin, G.; Zhang, X. Properties and applications of the β phase poly(vinylidene fluoride). Polymers 2018, 10, 228. [Google Scholar] [CrossRef]
  6. Concha, V.O.; Timóteo, L.; Duarte, L.A.; Bahú, J.O.; Munoz, F.L.; Silva, A.P.; Lodi, L.; Severino, P.; León-Pulido, J.; Souto, E.B. Properties, characterization and biomedical applications of polyvinylidene fluoride (PVDF): A review. J. Mater. Sci. 2024, 59, 14185–14204. [Google Scholar] [CrossRef]
  7. Mohammadpourfazeli, S.; Arash, S.; Ansari, A.; Yang, S.; Mallick, K.; Bagherzadeh, R. Future prospects and recent developments of polyvinylidene fluoride (PVDF) piezoelectric polymer; fabrication methods, structure, and electro-mechanical properties. RSC Adv. 2023, 13, 370–387. [Google Scholar] [CrossRef]
  8. Saxena, P.; Shukla, P. A comprehensive review on fundamental properties and applications of poly(vinylidene fluoride)(PVDF). Adv. Compos. Hybrid Mater. 2021, 4, 8–26. [Google Scholar] [CrossRef]
  9. Xu, F.; Zhang, K.; Zhou, Y.; Qu, Z.; Wang, H.; Zhang, Y.; Zhou, H.; Yan, C. Facile preparation of highly oriented poly(vinylidene fluoride) uniform films and their ferro-and piezoelectric properties. RSC Adv. 2017, 7, 17038–17043. [Google Scholar] [CrossRef]
  10. Jia, N.; Xing, Q.; Liu, X.; Sun, J.; Xia, G.; Huang, W.; Song, R. Enhanced electroactive and mechanical properties of poly(vinylidene fluoride) by controlling crystallization and interfacial interactions with low loading polydopamine coated BaTiO3. J. Colloid Interface Sci. 2015, 453, 169–176. [Google Scholar] [CrossRef]
  11. He, F.; Lau, S.; Chan, H.L.; Fan, J. High dielectric permittivity and low percolation threshold in nanocomposites based on poly(vinylidene fluoride) and exfoliated graphite nanoplates. Adv. Mater. 2009, 21, 710–715. [Google Scholar] [CrossRef]
  12. Kushwah, M.; Sagar, R.; Rogachev, A.; Gaur, M. Dielectric, pyroelectric and polarization behavior of polyvinylidene fluoride (PVDF)-gold nanoparticles (AuNPs) nanocomposites. Vacuum 2019, 166, 298–306. [Google Scholar] [CrossRef]
  13. Lin, B.; Chen, G.-D.; He, F.-A.; Li, Y.; Yang, Y.; Shi, B.; Feng, F.-R.; Chen, S.-Y.; Lam, K.-H. Preparation of MWCNTs/PVDF composites with high-content β form crystalline of PVDF and enhanced dielectric constant by electrospinning-hot pressing method. Diam. Relat. Mater. 2023, 131, 109556. [Google Scholar] [CrossRef]
  14. Chiu, F.-C. Comparisons of phase morphology and physical properties of PVDF nanocomposites filled with organoclay and/or multi-walled carbon nanotubes. Mater. Chem. Phys. 2014, 143, 681–692. [Google Scholar] [CrossRef]
  15. Kadir, E.; Gayen, R. Improved UV sensitivity in solution-processed PVDF/ZnO nanocomposites via piezo-phototronic effect. Mater. Today Commun. 2024, 39, 109174. [Google Scholar] [CrossRef]
  16. Sabry, R.S.; Hussein, A.D. Nanogenerator based on nanocomposites PVDF/ZnO with different concentrations. Mater. Res. Express 2019, 6, 105549. [Google Scholar] [CrossRef]
  17. Indolia, A.P.; Gaur, M. Optical properties of solution grown PVDF-ZnO nanocomposite thin films. J. Polym. Res. 2013, 20, 43. [Google Scholar] [CrossRef]
  18. Satapathy, S.; Pawar, S.; Gupta, P.; Varma, K. Effect of annealing on phase transition in poly(vinylidene fluoride) films prepared using polar solvent. Bull. Mater. Sci. 2011, 34, 727–733. [Google Scholar] [CrossRef]
  19. Chinaglia, D.L.; Gregorio Jr, R.; Stefanello, J.C.; Pisani Altafim, R.A.; Wirges, W.; Wang, F.; Gerhard, R. Influence of the solvent evaporation rate on the crystalline phases of solution-cast poly(vinylidene fluoride) films. J. Appl. Polym. Sci. 2010, 116, 785–791. [Google Scholar] [CrossRef]
  20. Ginghina, R.-E.; Toader, G.; Purica, M.; Bratu, A.-E.; Lazaroaie, C.; Tiganescu, T.-V.; Oncioiu, R.-E.; Iorga, G.-O.; Zorila, F.-L.; Constantin, M. Antimicrobial activity and degradation ability study on nanoparticle-enriched formulations specially designed for the neutralization of real and simulated biological and chemical warfare agents. Pharmaceuticals 2022, 15, 97. [Google Scholar] [CrossRef]
  21. Dediu, V.; Busila, M.; Tucureanu, V.; Bucur, F.I.; Iliescu, F.S.; Brincoveanu, O.; Iliescu, C. Synthesis of ZnO/Au nanocomposite for antibacterial applications. Nanomaterials 2022, 12, 3832. [Google Scholar] [CrossRef] [PubMed]
  22. Benz, M.; Euler, W.B. Determination of the crystalline phases of poly(vinylidene fluoride) under different preparation conditions using differential scanning calorimetry and infrared spectroscopy. J. Appl. Polym. Sci. 2003, 89, 1093–1100. [Google Scholar] [CrossRef]
  23. Hasegawa, R.; Kobayashi, M.; Tadokoro, H. Molecular conformation and packing of poly(vinylidene fluoride). Stability of three crystalline forms and the effect of high pressure. Polym. J. 1972, 3, 591–599. [Google Scholar] [CrossRef]
  24. Ievlev, A.V.; Susner, M.A.; McGuire, M.A.; Maksymovych, P.; Kalinin, S.V. Quantitative analysis of the local phase transitions induced by laser heating. ACS Nano 2015, 9, 12442–12450. [Google Scholar] [CrossRef]
  25. Zheng, J.; He, A.; Li, J.; Han, C.C. Polymorphism control of poly(vinylidene fluoride) through electrospinning. Macromol. Rapid Commun. 2007, 28, 2159–2162. [Google Scholar] [CrossRef]
  26. Constantino, C.; Job, A.E.; Simões, R.; Giacometti, J.A.; Zucolotto, V.; Oliveira Jr, O.; Gozzi, G.; Chinaglia, D. Phase transition in poly(vinylidene fluoride) investigated with micro-Raman spectroscopy. Appl. Spectrosc. 2005, 59, 275–279. [Google Scholar] [CrossRef]
  27. Silva, M.; Sencadas, V.; Botelho, G.; Machado, A.; Rolo, A.; Rocha, J.G.; Lanceros-Méndez, S. α-and γ-PVDF: Crystallization kinetics, microstructural variations and thermal behaviour. Mater. Chem. Phys. 2010, 122, 87–92. [Google Scholar] [CrossRef]
  28. Bormashenko, Y.; Pogreb, R.; Stanevsky, O.; Bormashenko, E. Vibrational spectrum of PVDF and its interpretation. Polym. Test. 2004, 23, 791–796. [Google Scholar] [CrossRef]
  29. Tan, K.; Gan, W.; Velayutham, T.; Abd Majid, W. Pyroelectricity enhancement of PVDF nanocomposite thin films doped with ZnO nanoparticles. Smart Mater. Struct. 2014, 23, 125006. [Google Scholar] [CrossRef]
  30. Neidhöfer, M.; Beaume, F.; Ibos, L.; Bernes, A.; Lacabanne, C. Structural evolution of PVDF during storage or annealing. Polymer 2004, 45, 1679–1688. [Google Scholar] [CrossRef]
  31. Purushothaman, S.M.; Tronco, M.F.; Ponçot, M.; CS, C.; Guigo, N.; Malfois, M.; Kalarikkal, N.; Thomas, S.; Royaud, I.; Rouxel, D. Quantifying the Crystalline Polymorphism in PVDF: Comparative Criteria Using DSC, WAXS, FT-IR, and Raman Spectroscopy. ACS Appl. Polym. Mater. 2024, 6, 8291–8305. [Google Scholar] [CrossRef]
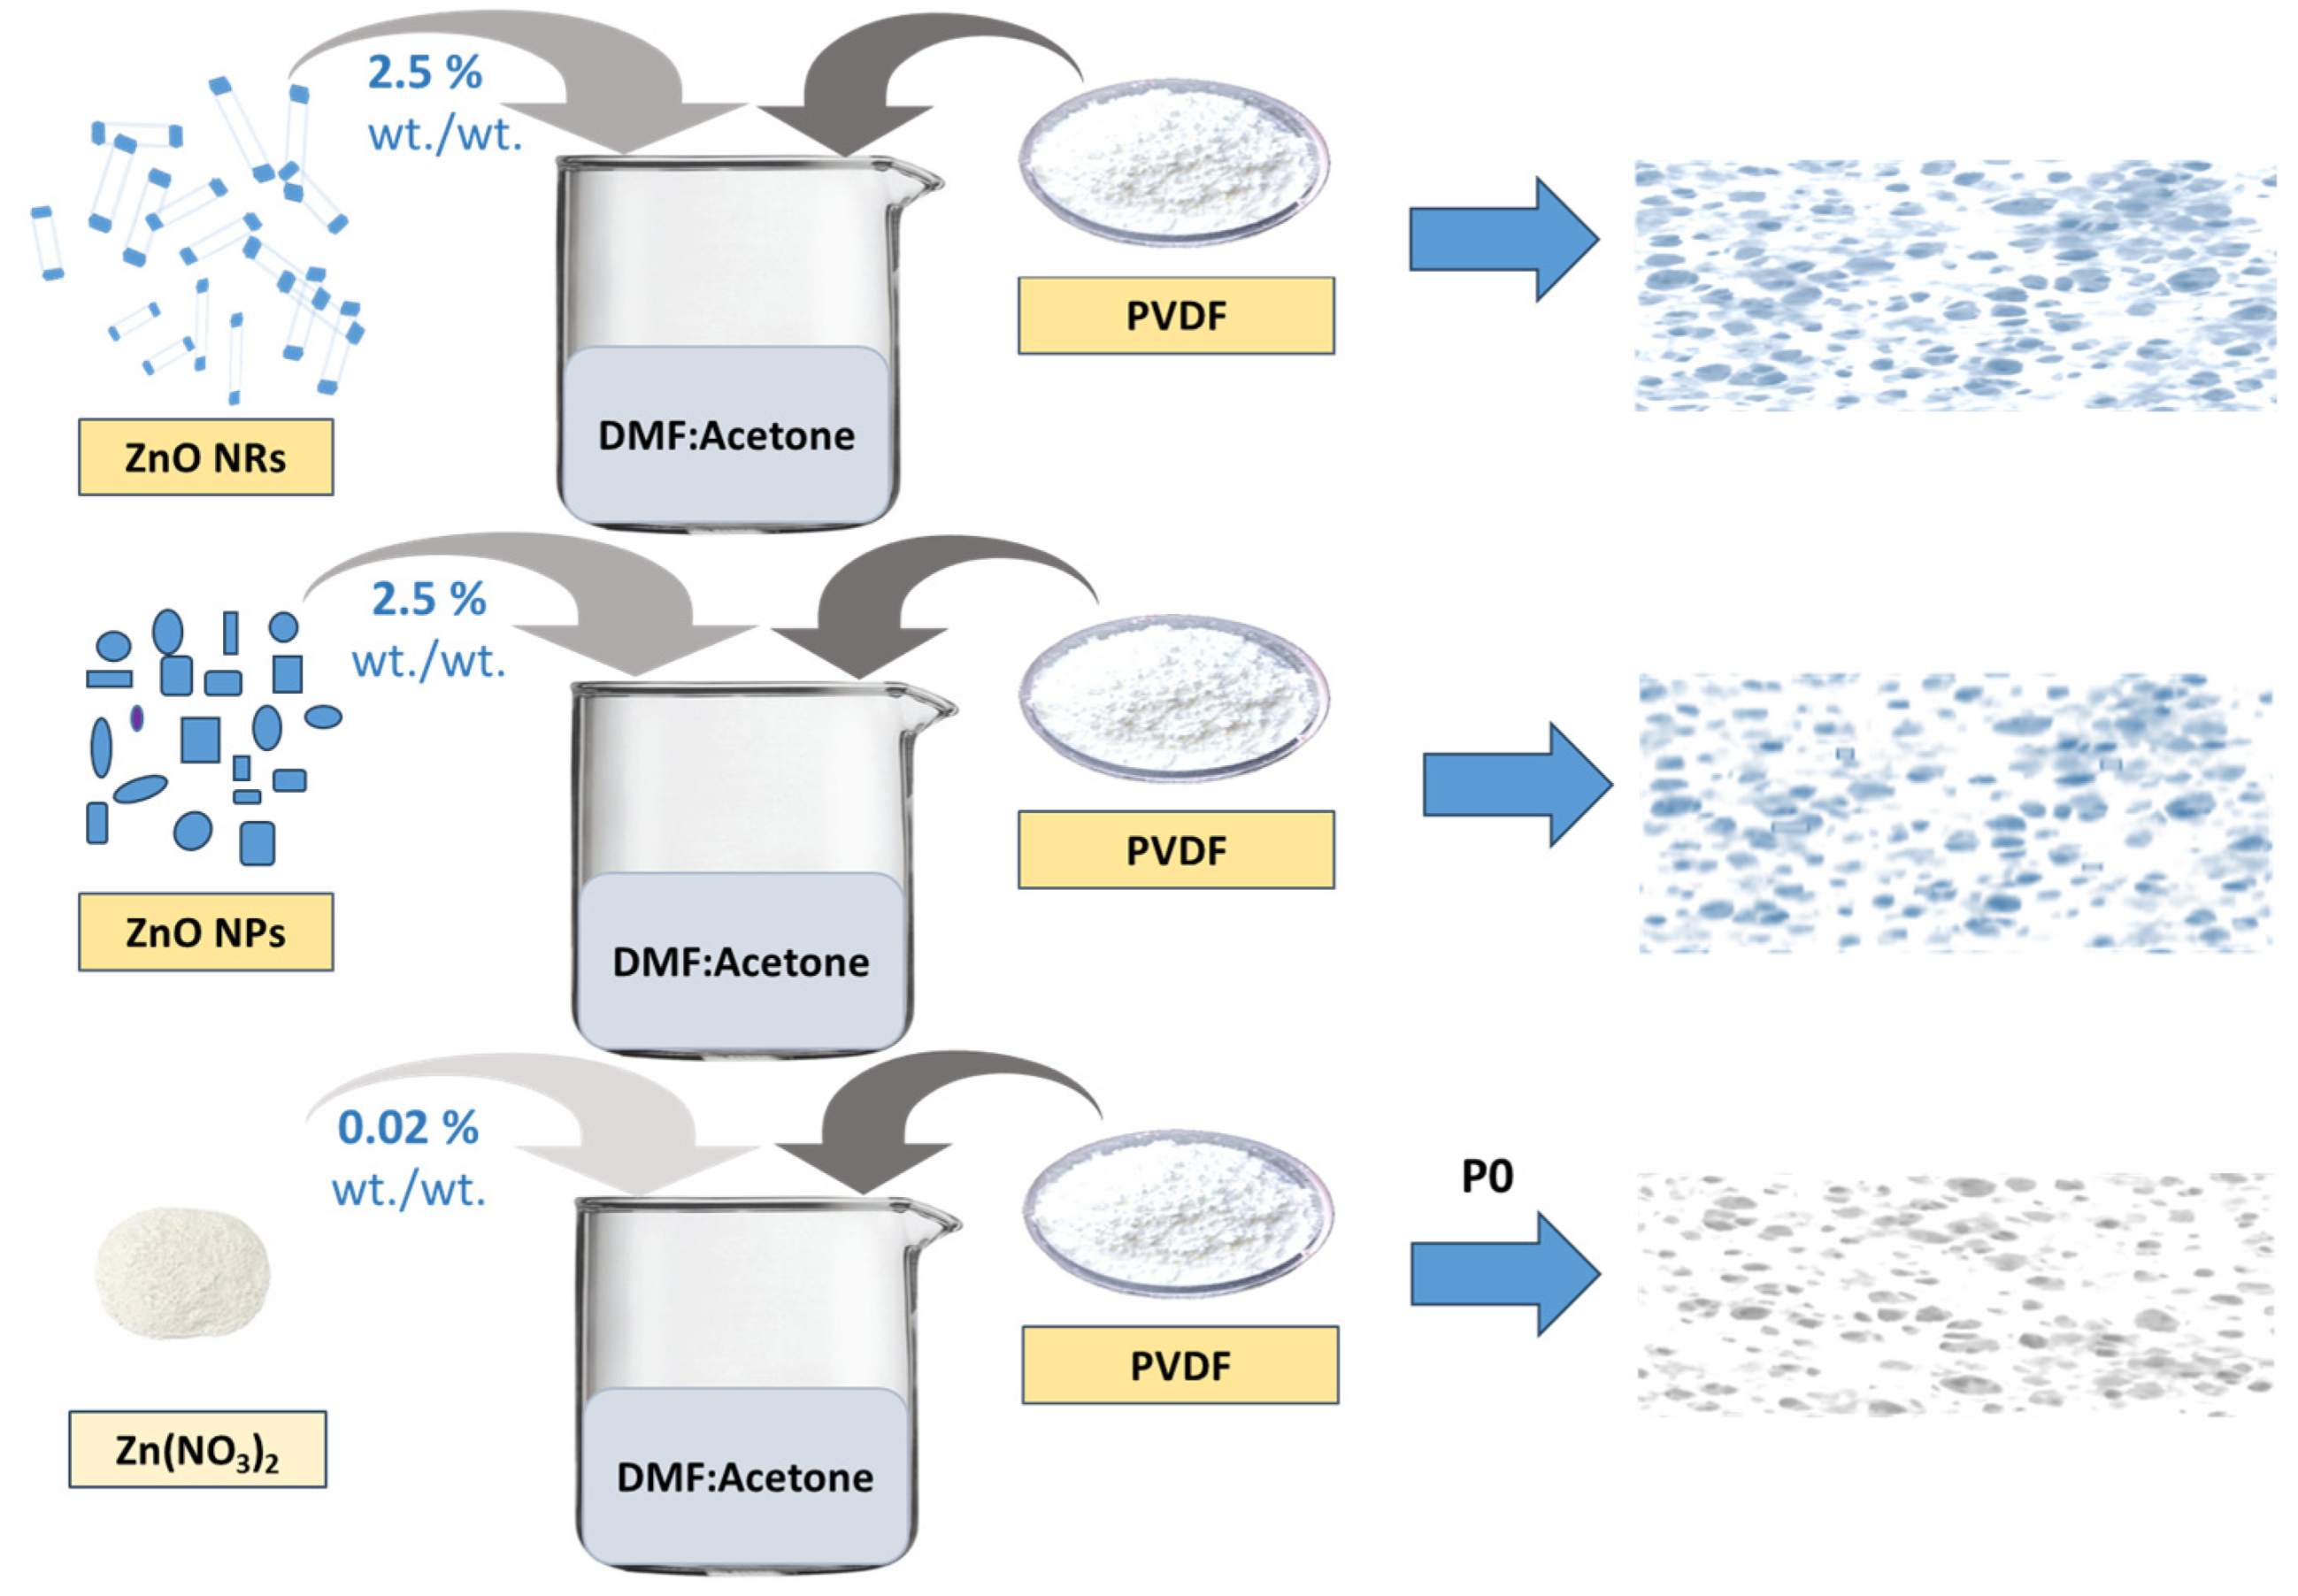
Figure 1. Schematic diagram of the synthesis procedure of PVDF-based thin films.
Coatings 14 01520 g001
Figure 2. (a) Experimental platform, micro-Raman spectrometer coupled with thermo-electric cell DSC600: 1—DSC600 with sapphire window for optical access; 2—micro-Raman spectrometer objective; 3—temperature controller; 4—water recirculation port. (b) Experimental profile of temperature–time program.
Coatings 14 01520 g002
Figure 3. SEM images of ZnO NPs (a) and the length size distribution (b), SEM images of ZnO NRs (c) and the length size distribution (d), XRD patterns of synthesized ZnO samples (e), and XRD patterns of PVDF/ZnO thin films treated at 50 °C (f).
Coatings 14 01520 g003aCoatings 14 01520 g003b
Figure 4. Raman spectrum of α-PVDF thin layer at room temperature, sample P0.
Coatings 14 01520 g004
Figure 5. Raman spectra collected at different temperatures for sample P0 (a,b).
Coatings 14 01520 g005
Figure 6. Raman spectra collected at different temperatures for sample P1—PVDF:ZnO NPs (a,b); sample P2—PVDF:ZnO NRs (c,d).
Coatings 14 01520 g006
Table 1. Main Raman peaks for crystalline PVDF.
Raman Peaks
[cm−1]
ReferencesPhaseExperimental Micro-Raman Peaks Position (λ = 632.8 nm)
485[22,23]γ484.5
513[22,23,24]β513.7
610[22,25,26]α606.2
795[22,23,27]α798.5
812[22,23]γ813.5
840[22,23,27]β840.5
881[25,26]α, β882.0
1076–3000[27,28]CC, CH2
Vibrations, common to the phases
Table 2. The values of Iβ/Iα (intensity of Raman shift at 839. 5 cm−1/intensity of Raman shift at 798.5 cm−1.
Temperature T [°C]50 °C110 °C130 °C150 °C
Iβ/Iα- sample P01.422.382.382.17
Iβ/Iα- sample P13.213.823.924.58
Iβ/Iα- sample P23.623.864.165.56
Disclaimer/Publisher’s Note: The statements, opinions and data contained in all publications are solely those of the individual author(s) and contributor(s) and not of MDPI and/or the editor(s). MDPI and/or the editor(s) disclaim responsibility for any injury to people or property resulting from any ideas, methods, instructions or products referred to in the content.