Article

The Interfacial Reaction Traits of (Al63Cu25Fe12)99Ce1 Quasicrystal-Enhanced Aluminum Matrix Composites Produced by Means of Hot Pressing

1
School of Intelligent Manufacturing and Elevator, Huzhou Vocational & Technical College, Huzhou 313000, China
2
School of Materials and Chemical Engineering, Xi’an Technological University, Xi’an 710021, China
*
Author to whom correspondence should be addressed.
Coatings 2024, 14(11), 1411; https://doi.org/10.3390/coatings14111411
Submission received: 18 October 2024 / Revised: 31 October 2024 / Accepted: 4 November 2024 / Published: 6 November 2024

Abstract

:
This study fabricated (Al63Cu25Fe12)99Ce1 quasicrystal-enhanced aluminum matrix composites using the hot-pressing method to investigate their interfacial reaction traits. Microstructure analysis revealed that at 490 °C for 30 min of hot-pressing, the interface between the matrix and reinforcement was clear and intact. Chemical diffusion between the I-phase and aluminum matrix during sintering led to the formation of Al7Cu2Fe, AlFe, and AlCu phases, which, with their uniform and fine distribution, significantly enhanced the alloy’s overall properties. Regarding compactness, it first increased and then decreased with different holding times, reaching a maximum of about 98.89% at 490 °C for 30 min. Mechanical property analysis showed that compressive strength initially rose and then fell with increasing sintering temperature. After 30 min at 490 °C, the reinforcement particles and matrix were tightly combined and evenly distributed, with a maximum compressive strength of around 790 MPa. Additionally, the diffusion dynamics of the transition layer were simulated. The reaction rate of the reaction layer increased with hot-pressing temperature and decreased with holding time. Selecting a lower temperature and appropriate holding time can control the reaction layer thickness to obtain composites with excellent properties. This research innovatively contributes to the preparation and property study of such composites, providing a basis for their further application.

1. Introduction

Particulate reinforced aluminum matrix composites (PRAMCs) show numerous benefits [1,2], among which are high specific strength [3] and outstanding high-temperature performance [4,5].
PRAMCs overcome the shortcomings of the fundamental metal aluminum and its alloys [6] and are extensively applied in aerospace, precision instruments, the automotive industry, and other spheres [7,8,9]. Reinforcements typically employed for the fabrication of PRAMCs consist of carbide substances, nitride materials [2], oxide compounds, intermetallic substances, and quasicrystal particles [10]. The wettability between ceramic particles (including silicon carbide and alumina [11]) and the base metal is poor, which can lead to the formation of a weak interface [12] during the composite formation stage, and this undermines the ultimate properties of the composite. Nonetheless, in the case of quasicrystal particle-reinforced metal matrix composites PRMCs, because quasicrystals have a metal crystal structure [13,14], that is, quasicrystal translation order, they have good wettability with the base metal [15,16,17]. Quasicrystals are new materials with unique structures and properties. The typical icosahedral quasicrystalline phase (IQC) is highly symmetric and orderly, composed of icosahedral units connected together, breaking the regular periodic lattice arrangement of crystals, showing a non-periodic long-range order and being between the crystalline and amorphous states. It should be noted that usually, quasicrystal alloys contain not only the quasicrystalline phase but also other phases. Therefore, when used as a reinforcing phase to be added to the matrix, generally, the quasicrystal master alloy is added. Here, the “IQC” mentioned later specifically represents the quasicrystal master alloy. The “I—phase” simply refers to the icosahedral quasicrystalline phase. Quasicrystal particles can also be reunited with the base metal once more to form a master alloy [18]. This is convenient for reuse, averts resource waste, and propels the progress of an environmentally friendly economy [19].
There have been numerous studies on quasicrystal PRAMCs [20,21,22,23,24,25]. Nevertheless, quasicrystals are apt to react easily with the base metal during the preparation process. In other words, the thermal stability of quasicrystals is rather low. They are inclined to transform into the quasicrystal approximate phase ω-Al7Cu2Fe in the hot pressing procedure [26]. Tsai et al. first introduced quasicrystal PRAMCs [16], preparing AlCuFe quasicrystal PAMCs by mechanical alloying and hot pressing. They discovered that the tetragonal phase Al7Cu2Fe is generated as a result of the diffusion of Al atoms from the matrix towards quasicrystal particles during hot pressing. The microhardness of the composite was enhanced in relative to the unreinforced matrix. However, when the reinforcing particles were changed into tetragonal Al7Cu2Fe, the hardness value decreased.
In this study, we have fabricated a quasicrystal particle-reinforced metal composite (Al-20IQC) through the hot pressing sintering method. Additionally, we have investigated the influence of holding time on the dynamic reaction process during which the I-phase in the composite transforms into the ω-Al7Cu2Fe phase under hot pressing. The effects of the hot pressing process on the thermal stability of quasicrystals and the microstructure of composites were also studied. With the purpose of further improving the impact of the transformation process from I-phase to ω-Al7Cu2Fe phase on the microstructure and characteristics of the composites, a systematic analysis is conducted on the interface microstructure and element diffusion dynamics at the interface of the composite. Moreover, the correlation between the interface microstructure and the properties of the composite is also thoroughly discussed.

2. Experimental

2.1. Selection of Raw Substances

The quasicrystal master alloy (Al63Cu25Fe12)99Ce1 (at %) (IQC) was prepared in a vacuum arc melting furnace. The detailed preparation process has been described in detail in the relevant literature [27]. Through heat treatment, the alloy containing only the I-phase and a small amount of Al13Ce2Cu13 phase was obtained. The detailed process of the heat treatment has been fully described in the relevant literature and will not be repeated here [28]. After that, it was manually ground and sieved, and the alloy particles with appropriate particle sizes were selected to be used as the reinforcements of the composite materials. The purity of the matrix was determined to be more than 99.7 wt%, and the particle size was 40~150 µm pure aluminum powder. The prepared reinforcing phase and matrix were mixed in a 20:80 vol% ratio, and the quasicrystal-reinforced pure aluminum matrix composites (IQC-Al) were prepared. A graphite mold with a diameter of φ30 mm was prepared, and the uniformly mixed powder was loaded into it. After closing the mold, under a vacuum of 10−3 Pa and a hot press sintering pressure of 30 MPa, the temperature was increased from room temperature to the target temperature (470 °C, 490 °C or 510 °C) at a heating rate of 5~10 °C/min. After reaching the target temperature, isothermal sintering was carried out according to different durations (10 min, 20 min, 30 min, 60 min, and 90 min). After the end, the furnace was cooled down with the sample inside. During the whole process, the vacuum environment served as a protective atmosphere to prevent material oxidation. Finally, the quasicrystal-reinforced pure aluminum matrix composite (IQC-Al) was prepared. Moreover, the influence of sintering parameters on the finished material was tested by hot press sintering at different temperatures and durations. The process flow chart is shown in Figure 1.

2.2. Material Characterization Methods

The forming phases in the alloys prepared by the hot pressing process were explored using X-ray diffraction (D8 DISCOVER A25, Bruker, Germany), a scanning speed of 4°/min, and 2θ = 20°~90°. Scanning electron microscopy (SEM, TESCAN, VEGA II-XMU), energy dispersive spectroscopy (EDS), and transmission electron microscopy (FEI Tecnai G2 F20) were utilized for characterizing the microstructures of the alloys.
The average particle size and area fraction of the reinforcing phase in the composites under different hot pressing process parameters were measured and computed with Image-Pro Plus 6.0 software (Media Cybernetics, Rockville, MD, USA). With the use of a densification tester employing the Archimedes drainage method, the density of the composites was measured. The sample to be tested was cut into a φ 6 × 9 mm cylindrical sample, and the compression performance of the material was then tested with a DDL300 electronic universal testing machine (Changchun New Testing Machine Co., Ltd., Changchun, China) and a compression speed of 0.5 mm/min. In order to guarantee the accuracy of the experimental results, five samples for each hot pressing temperature were tested.

3. Results

3.1. XRD Characterization

Figure 2 exhibits the phase analysis, morphology, and chemical constitution of the Al matrix and I-phase. Figure 2a shows the powder X-ray diffraction pattern of face-centered cubic FCC-Al (JCPDS #04-0787; a = b = c = 4.0494 Å, α = β = γ = 90 degrees), with all significant reflections, such as (111), (200), (220), (311), and (222). Figure 2b presents the powder XRD pattern of the cast Al-Cu-Fe-Ce alloy, which indicates that this material is primarily composed of I-phase and Al13Ce2Cu13 (a = b = c = 11.8916 Å, α = β = γ = 90 degrees, cubic, Fm-3c) following heat treatment.
Figure 2c,d are SEM images presenting the morphology of the pure aluminum powder and IQC alloy powder after vacuum arc melting and heating treatment, manual grinding, and vibration ball mill screening, respectively. The diameter of particles of the pure aluminum powder is about 75~150 µm, and the shape is a spherical, ellipsoidal, and irregular polygon (Figure 2c,e). While the reinforced particles have an irregular polygon and ellipsoid shape and a particle size of about 10~100 µm (Figure 2d). Due to the use of manual grinding and screening, large particles and small particles are intermingled in the process of grinding, and in this way, the reinforcing phase is supplemented to the matrix, which can significantly improve the reinforcing effect.
The XRD patterns of the composites prepared by different hot-pressing processes are shown in Figure 3a. It can be seen that the intensity of the diffraction peaks corresponding to the individual species in the composites changes with the increase in the holding time at a certain hot pressing temperature. The intensity of the diffraction peak corresponding to the quasicrystalline I-phase is stronger when the holding time is 20 min and 30 min, but the intensity of the diffraction peak of this phase decreases after 60 min of holding time. This indicates that the phase gradually decomposed or diffused with the increase in holding time during the hot pressing process.
Although the XRD patterns of the composites prepared by different hot pressing processes are slightly different, the constituent phases are roughly the same, which are the face-centered cubic aluminum phase, quasicrystalline I phase, and Al13Ce2Cu13 phase. For the specimens with the hot pressing temperature of 490 °C and the holding time of 30 min, the XRD magnification of the region was observed at the diffraction angle of 2θ from 21°~50°. The XRD magnification is shown in Figure 3. The presence of the Al7Cu2Fe phase (tetragonal crystal system, P4/mnc), β-AlFe (Cu) phase (cubic crystal system, pm—3m), and Al4Cu9 phase (cubic crystal system, p—43m) in the composites can be further determined by Figure 3b,c.
The formation of a β-AlFe (Cu) phase can be ascribed to two possible explanations. On one hand, it may form during the preparation of the quasicrystal master alloy ingot. On the other hand, it could result from diffusion between the I-phase and the matrix. Regarding the formation of an Al7Cu2Fe phase, there are three probable reasons [29]. Firstly, as temperature rises, the ternary phase is more stable than the binary phase [30,31,32]. Thus, the β-AlFe (Cu) phase may transform into ω-Al7Cu2Fe, which backs up the contention that an extended dwell time facilitates the formation and stable existence of the ω-phase. Secondly, during hot pressing, there is mutual diffusion between the I-phase and the Al matrix, leading to the transformation of the I-phase into ω-Al7Cu2Fe. Thirdly, the ω-Al-Cu-Fe phase may potentially be formed through the initial porosity of the quasicrystal layer via a temporary liquid phase.

3.2. Microstructure Analysis of Al-20IQC

Optimizing the sintering process parameters is conducive to improving the properties of composites. Figure 4a–d, Figure 5a–d and Figure 6a–d show the microstructure of Al-20IQC prepared by sintering at 470 °C, 490 °C, and 510 °C, under 30 MPa, and holding for 20 min, 30 min, 60 min, and 90 min, separately. The reinforcing particles are polygonal blocks, and the dark areas in the images are the Al matrix. By comparing the microstructures of the composites, it can be seen that when the temperature is 510 °C, some of the reinforcing particles dissolve. While at 470 °C, due to the relatively low hot—pressing temperature, there are some pores present. When the holding time is 30 min, the reinforcing particles are in close combination with the matrix. The interface between them is smooth and flat, and there are almost no cracks in the reinforcing particles (Figure 4b, Figure 5b and Figure 6b).
With the holding time reaching 90 min, the reinforced particles appear to crack (Figure 4d, Figure 5d and Figure 6d). It can be seen by combining with Figure 7 at the same time that, with the holding time being long, the volume shrinkage of the Al matrix is large, and the relatively large reinforced particles are subjected to a large shear force when rotating in the matrix, resulting in cracks at the sharp corners of reinforced particles, which is not beneficial for the improvement of mechanical properties of composites.
Consequently, the composite fabricated under 490 °C exhibited a dense microstructure. It had a more homogeneous particle distribution, unbroken particle interiors, and better matrix combination at various holding times. In the preparation of highly integrated and dense composites, a holding time of 30 min under 490 °C is beneficial.
This work later analyzed the Al-20IQCs particle sizes sintered under 490 °C under 4 diverse holding times. For the Al-20IQC prepared under each process, 10 SEM images under different magnifications were selected for statistical calculation, and then the average value was taken. Figure 8a–d show the results. When holding time increases, the reinforcement in the composite diffuses. At short holding times, the growth of reinforcement is not obvious. However, with the holding time being 90 min, the reinforced particles diffuse in a large area, contributing to an obvious reduction in the average particle size. Of the four holding times, when the holding time is 30 min, the particle size of reinforcement is moderate and evenly distributed.

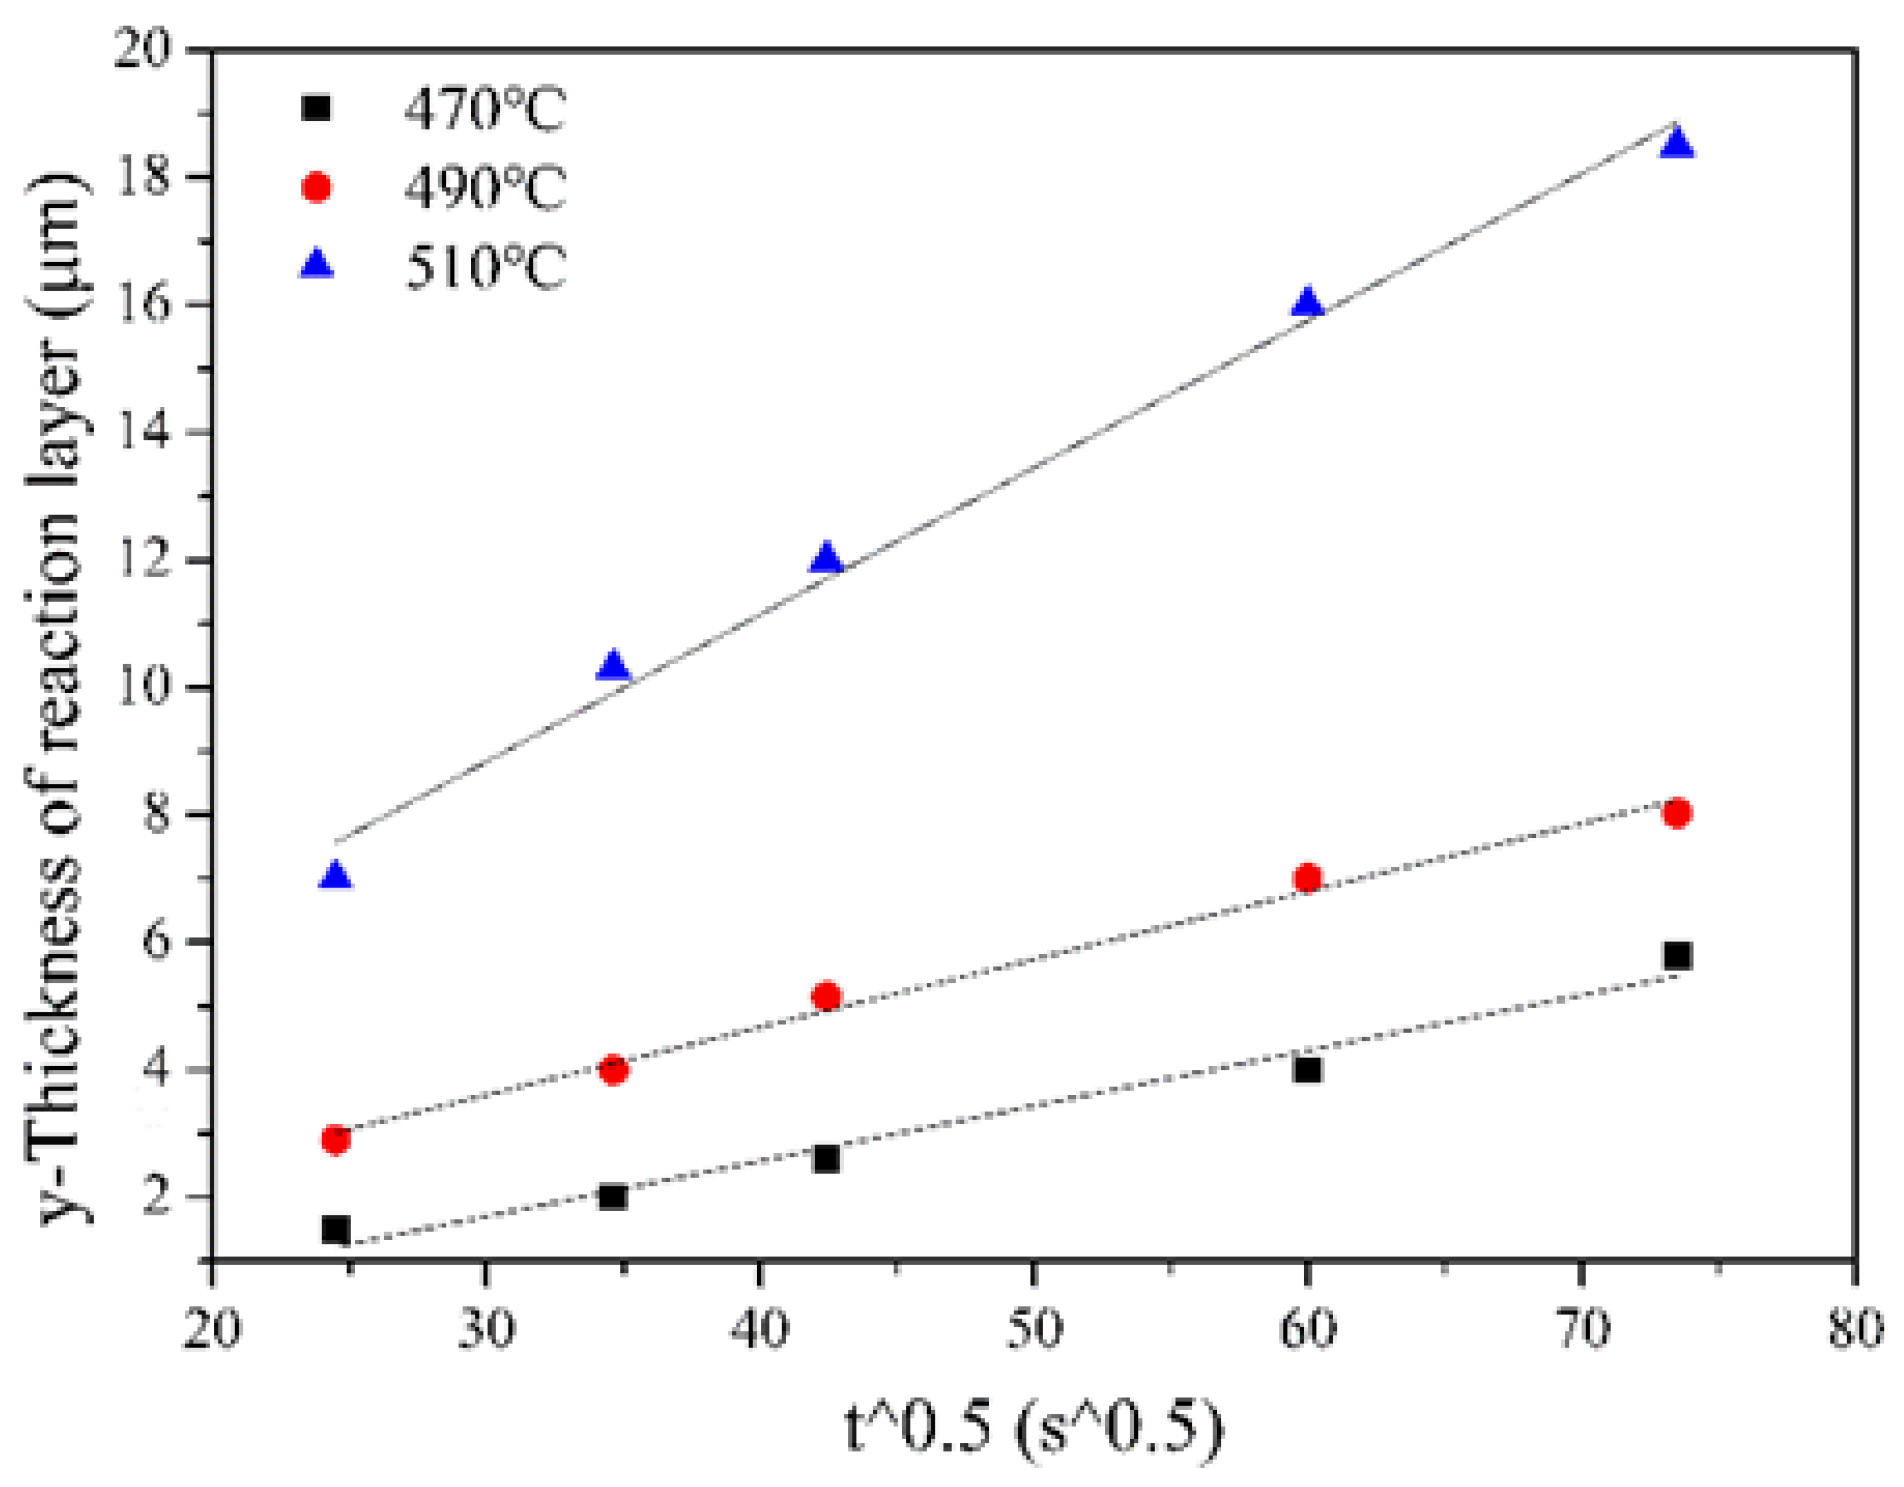
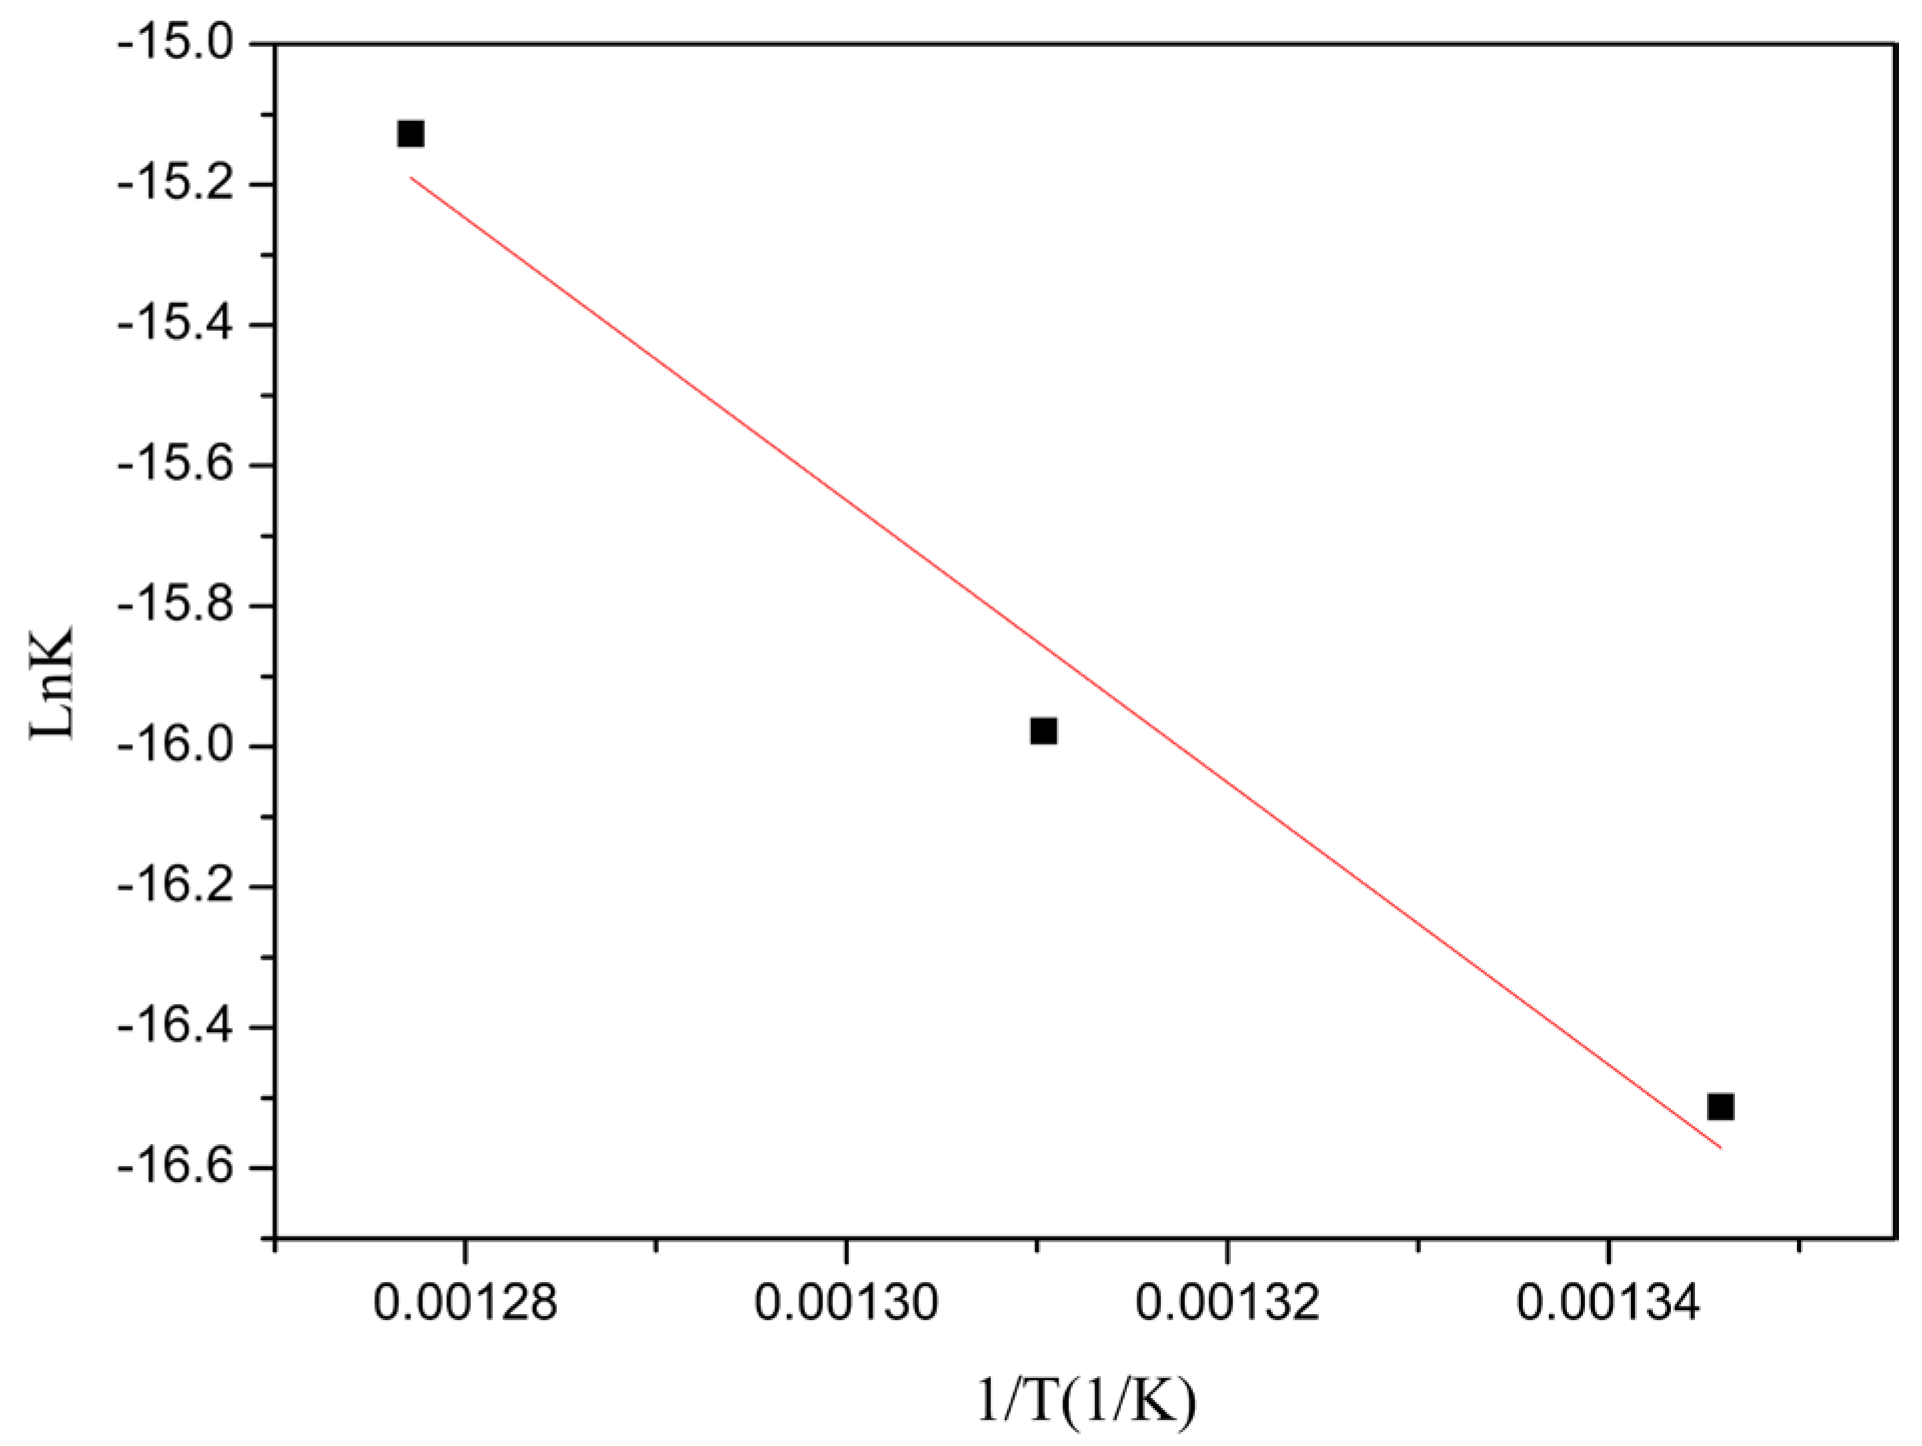
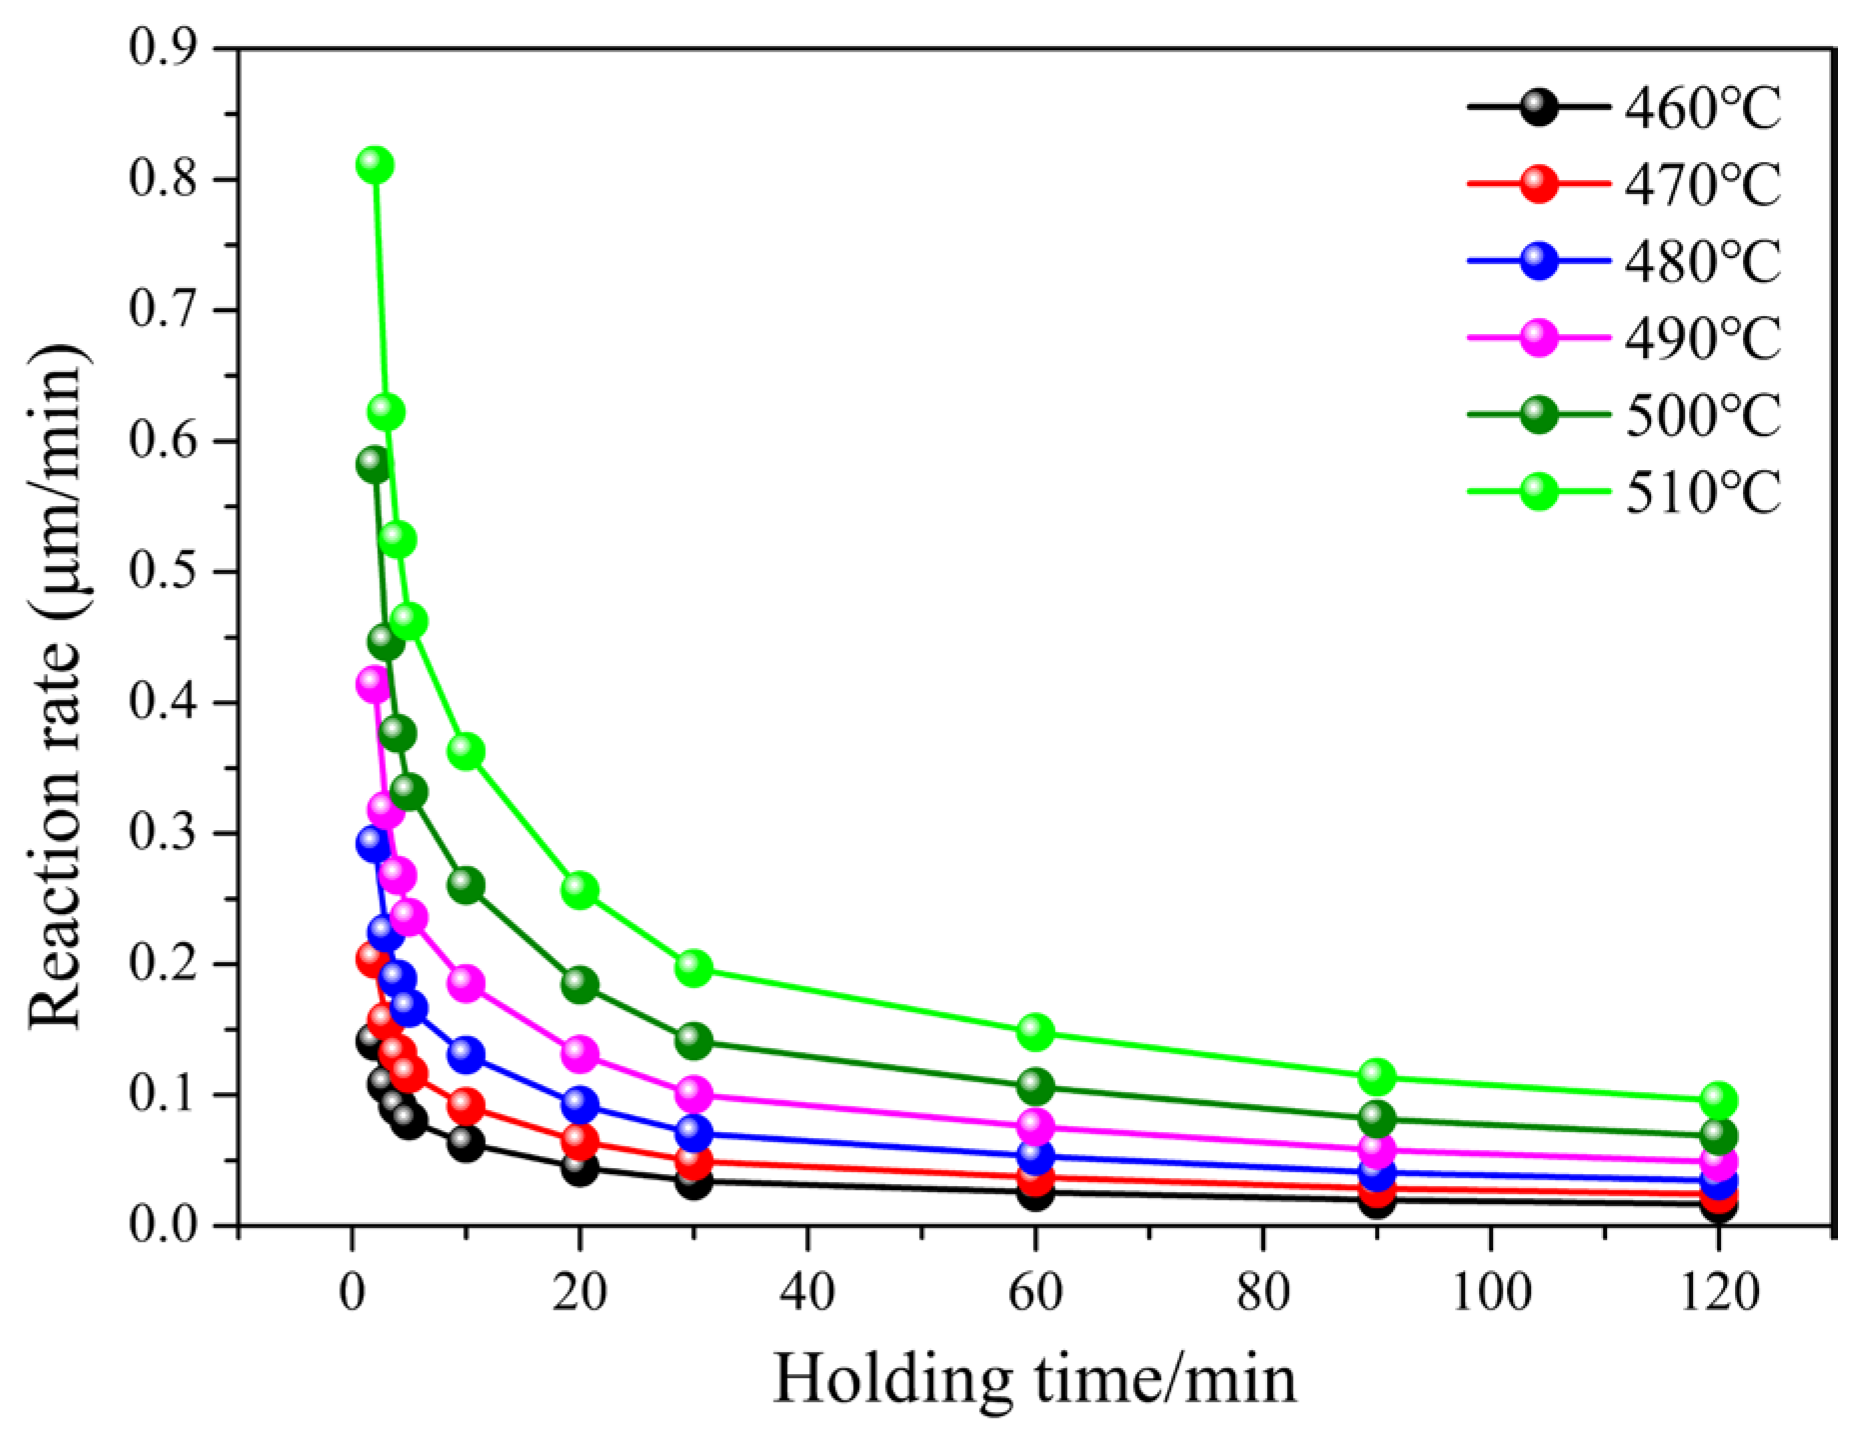
3.3. Diffusion Dynamics Analysis of the Hot Pressing Process

Based on the microstructural characteristics of Al-20IQCs fabricated at different heating temperatures and holding durations, the dynamic equation of the reaction layer during the hot pressing process was formulated. In the hot pressing procedure, the interfacial reaction is primarily governed by atomic diffusion. Consequently, the growth of the interfacial reaction layer adheres to the parabolic law of growth kinetics. The relationship between the thickness of the reaction layer and time is expressed as [33,34]:
y = K t 0.5
where y designates the thickness of the reaction layer of the product (m), K denotes the growth rate constant of the phase (m/ s n ), and t represents the reaction diffusion time (s).
The relationship between K and temperature is as follows:
l n K = l n K 0 E R T
where K 0 denotes the pre-exponential factor (m/ s n ), E represents the reaction activation energy (J/mol), R designates the gas constant (8.31 J/(mol·K)), and T is the absolute reaction temperature (K).
The thickness of the reaction layer of each sample is statistically calculated by using Image-Pro Plus 6.0 software. Specifically, the scanning topography images of composites at different magnifications are selected, and each sample is measured six times. Then, the average value is calculated to reduce errors and provide reliable data for the research. The measured values of reaction thickness for composites fabricated at different temperatures and holding durations can be obtained from Table 1.
At a specific temperature, the thickness of the reaction layer has a tendency to augment with the escalation of reaction time. Additionally, it also grows when the reaction temperature is increased. As a result, the thickness of the reaction layer shows a positive correlation with the time and temperature of the hot pressing process. Figure 9 illustrates the relationship between the logarithm of the product thickness and the logarithm of the holding periods at different temperatures.
The kinetic equation of the diffusion reaction is modified according to Equation (1). Figure 10 shows the correlation between the amount of product and reaction holding time.
The relationship between lnK and 1/T across all temperatures is shown in Figure 11:
By fitting the line, a relationship between lnK and 1/T is obtained as follows.
l n K = 10.45982 20083.99 1 T
By comparing Formulas (2) and (3), it can be observed that E/R equals 20083.99. Consequently, the reaction activation energy E is calculated as 20083.99 multiplied by 8.31 J/mol, which amounts to 166.9 KJ/mol. Additionally, when comparing Equations (2) and (3), it is found that lnK0 is equal to 10.45982. Therefore, K0 is determined to be 34885.27. Now, the full reaction kinetic equation of the Al-20IQCs during hot pressing can be described as follows:
y = 3.488 × 10 4 e x p ( 166.9 × 10 3 / R T ) t 0.5
In accordance with this equation, the thickness of the reaction product layer increases as the time and temperature of the hot pressing process increase.
Nevertheless, it is necessary to take into account that following hot pressing sintering conducted at a temperature of 490 °C for a duration of 90 min, there are areas within the composite where a reaction layer is formed; however, in many other areas, this does not occur. Additionally, the resulting products are relatively intricate and of limited size. This shows that the holding time in the hot pressing process should be kept at or below 90 min. Under this condition, the formula has stronger applicability.
The growth dynamic equation of the reaction layer was established. To verify the accuracy of Equation (4), the theoretical prediction value of the reaction layer during hot pressing was calculated in accordance with the dynamic equation. Figure 12 shows the variation in the test value and predicted value based on theory for the reaction layer with time under different hot pressing temperatures. It can be seen from Figure 12 that, within the error range, at the reaction temperature of 470 °C~510 °C, the test value is approximately equal to the theoretical prediction value. Therefore, the dynamic equation of the reaction layer can accurately calculate the reaction layer thickness of Al-20IQC under different hot pressing processes.
After calculating the change in reaction rate of the reaction layer with time under different hot pressing temperatures according to Formula (4), the calculation results are shown in Figure 13. It can be seen that the reaction rate increases with the increase in hot pressing temperature. At the same hot pressing temperature, the reaction rate gradually decreases with the extension of holding time. It shows that the thickness of the reaction layer can be effectively controlled by selecting a lower hot pressing temperature and an appropriate holding time, so as to obtain a composite with excellent structure and properties.

3.4. Densification Tests

According to Figure 14, at the same heating temperature, the densification of Al-20IQC exhibited a trend of initial increase followed by a decrease as the holding time was extended, reaching a peak at 30 min. This is due to the fact that initially, as the holding time increases, the atoms on the surface of the matrix acquire more energy, accelerating the diffusion. The matrix fills the gaps surrounding the reinforcing particles, the interface between the reinforcing particles and the matrix becomes more favorable, and consequently, the densification is enhanced.
However, when the holding time continues to increase, the plastic deformation ability of the matrix is stronger, and the aluminum matrix is bonded together, while the reinforcing particles, which are not easy to deform, are pushed out and agglomerate. Pores form between the agglomerates, contributing to a reduction in densification. Combined with Figure 4, Figure 5, Figure 6 and Figure 7, the existence of pores can be clearly seen. At the constant holding time, Al-20IQC density peaked at 490 °C. In particular, for the composite prepared for a 30 min period under 490 °C, its density peaked at around 98.89%. These findings conform to Al-20IQC microstructure analysis.
A study of the above microstructure and densification analysis shows that the most suitable hot pressing sintering process conditions are a temperature of 490 °C and a holding time of half an hour. Energy-dispersive X-ray spectroscopy (EDS) line scanning and surface elemental mapping analysis are carried out on the composites fabricated by this process to analyze the bonding between the reinforcing particles and the matrix. Surface elemental mapping analysis is employed to determine the elemental distribution in different regions.

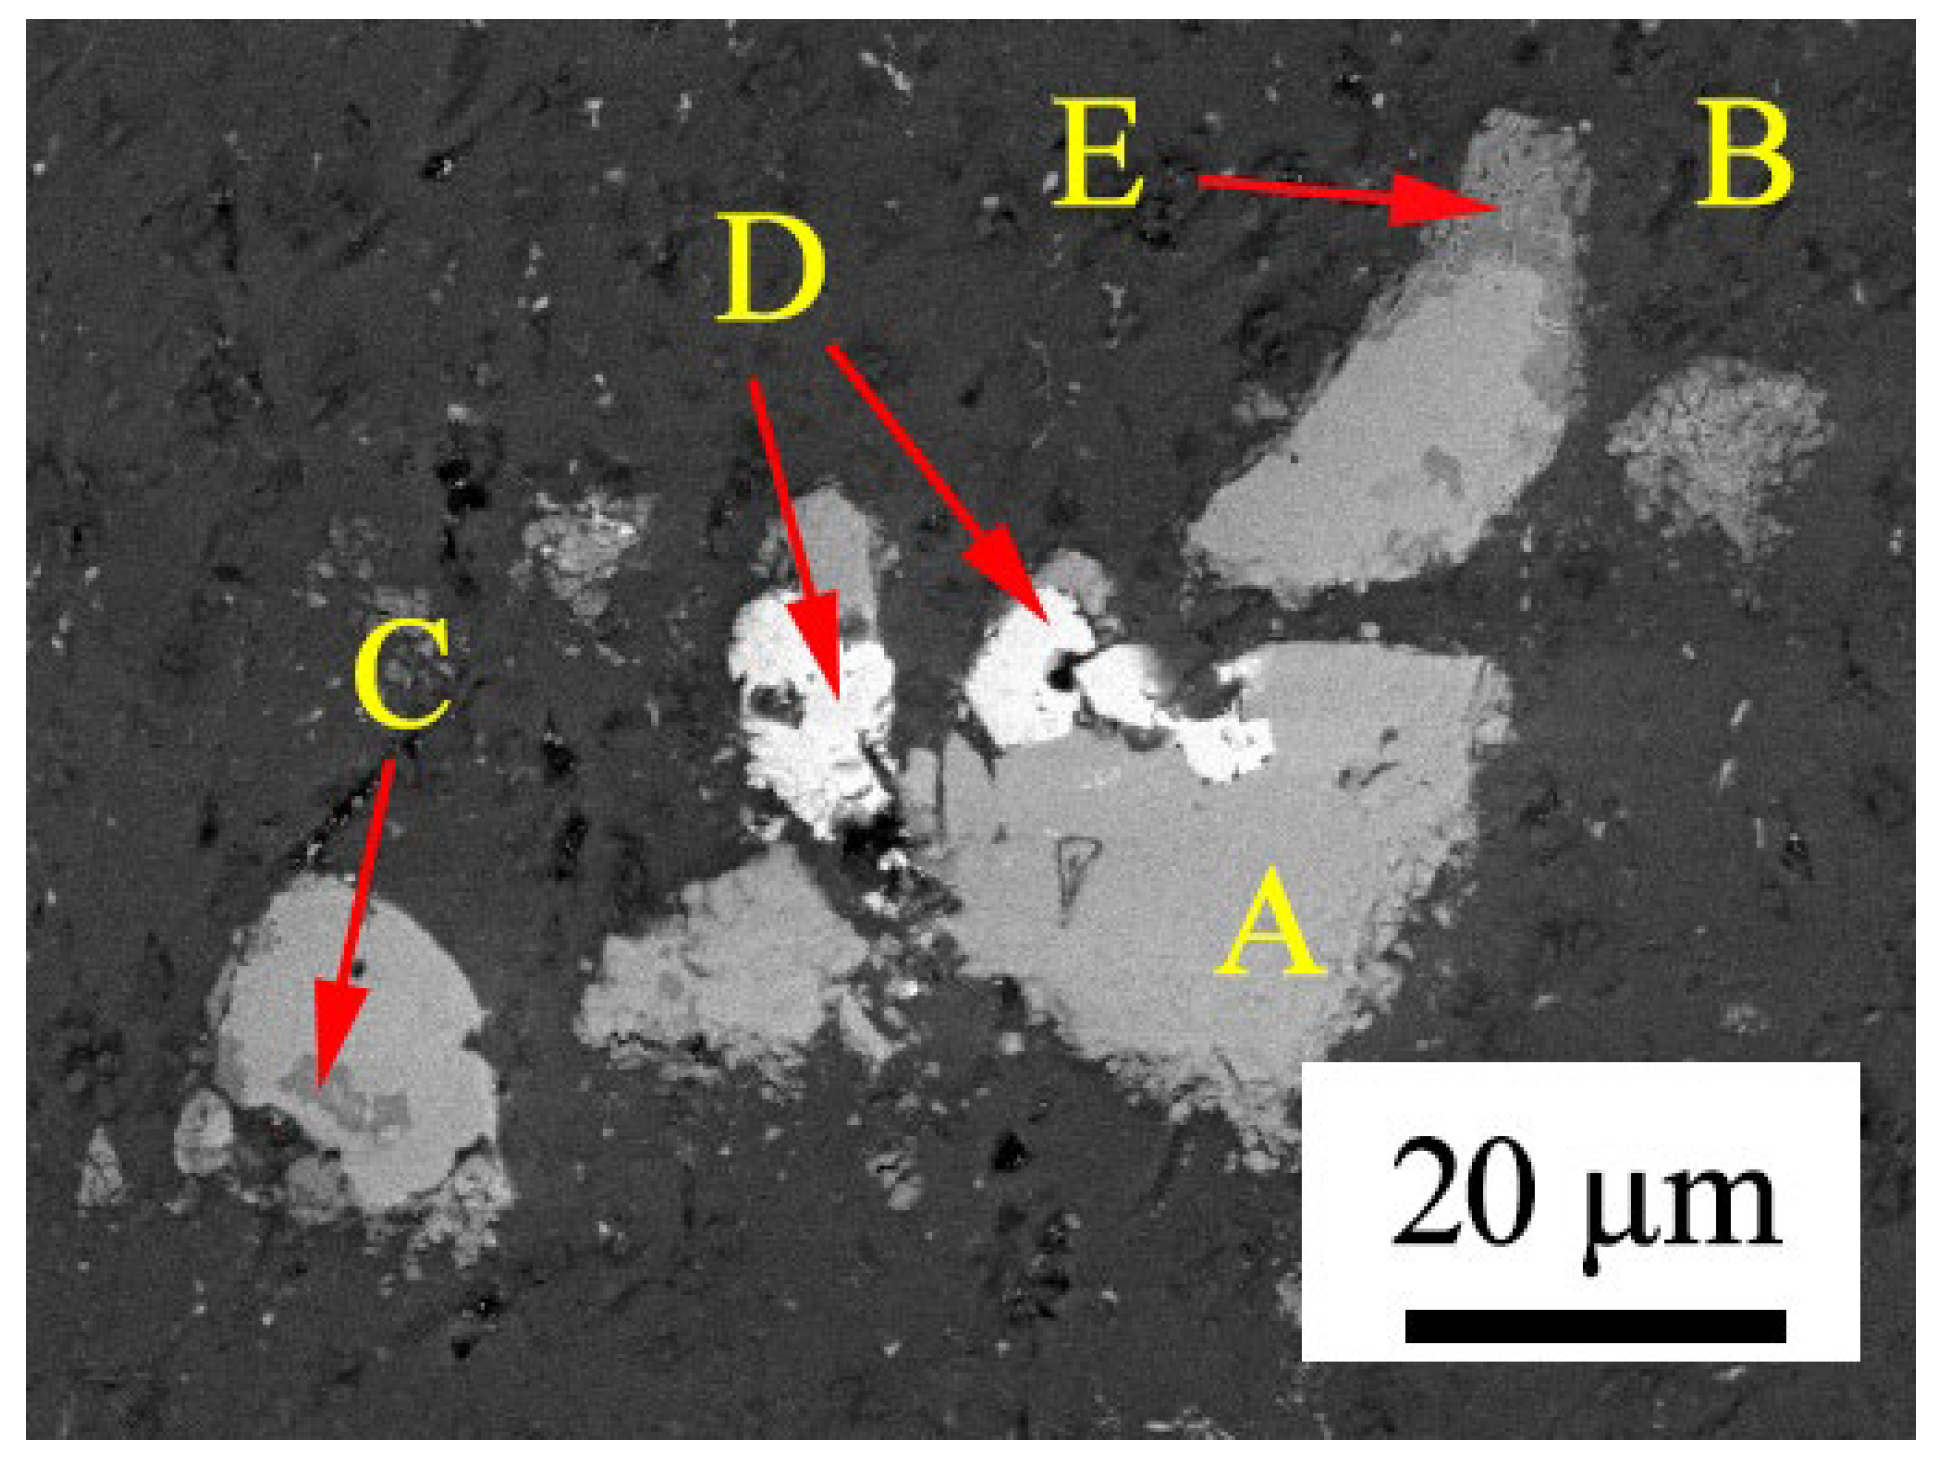
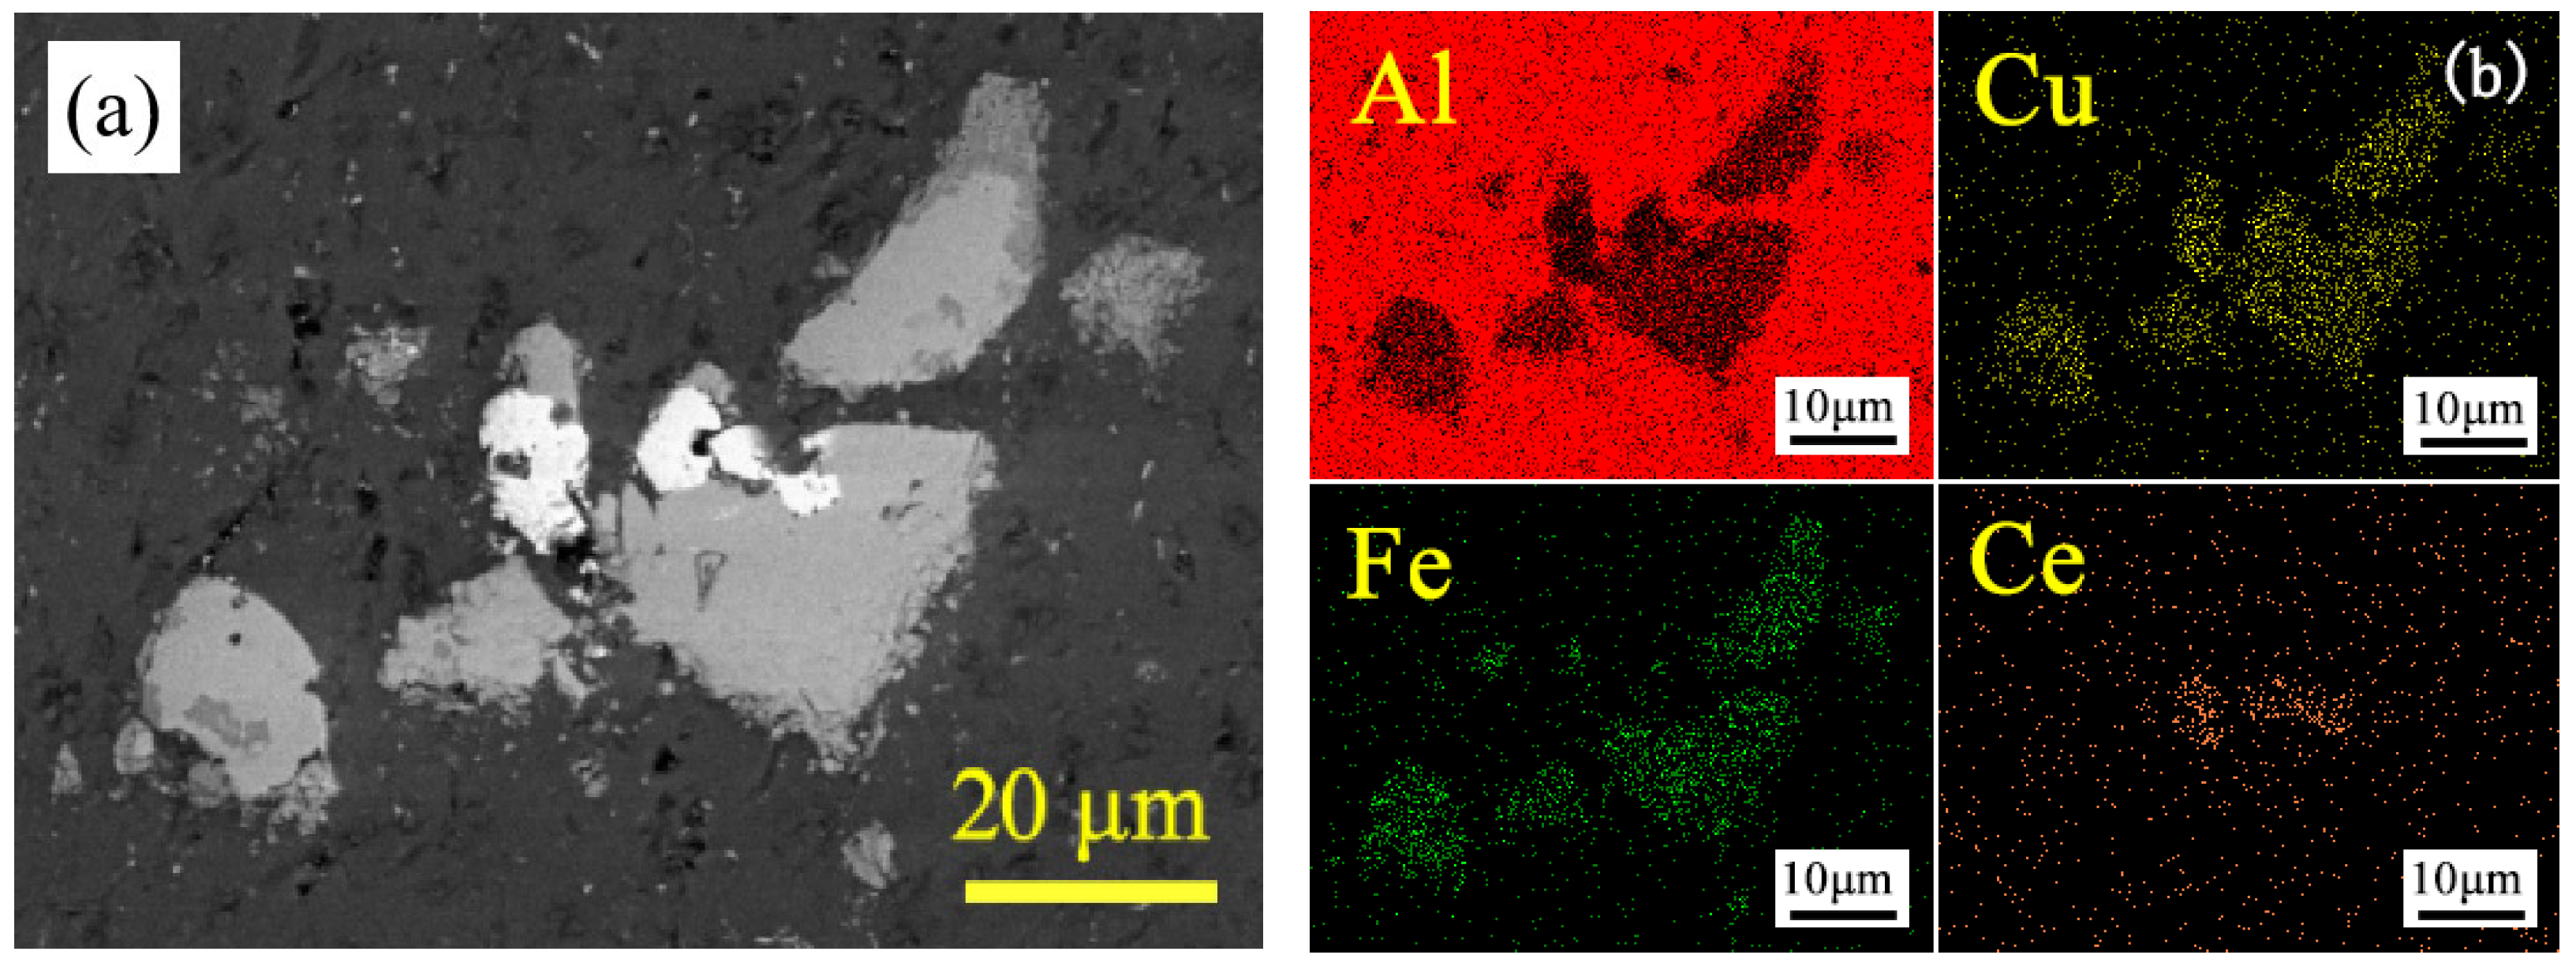
3.5. Energy Spectrum Analysis

We know from the microstructure and densification test results of the composites under various hot pressing processes that, after hot pressing at 490 °C for 30 min, the reinforcement phase in the composites is evenly distributed, and the densification is good.
Figure 15 shows the microstructure of Al-20IQC after hot pressing at 490 °C for 30 min at high magnification. By combining the previous XRD test results with the energy spectrum analysis results, the formed phase in the alloy can be identified.
Based on Figure 15 and Table 2, the dark gray B area can be identified as the aluminum matrix, the light gray A area as the I-phase, the dark gray C area as the AlFe phase, the white D area as Al13Ce2Cu13 phase, and the E region of the reaction layer between the reinforcing phase and the matrix as Al7Cu2Fe phase.

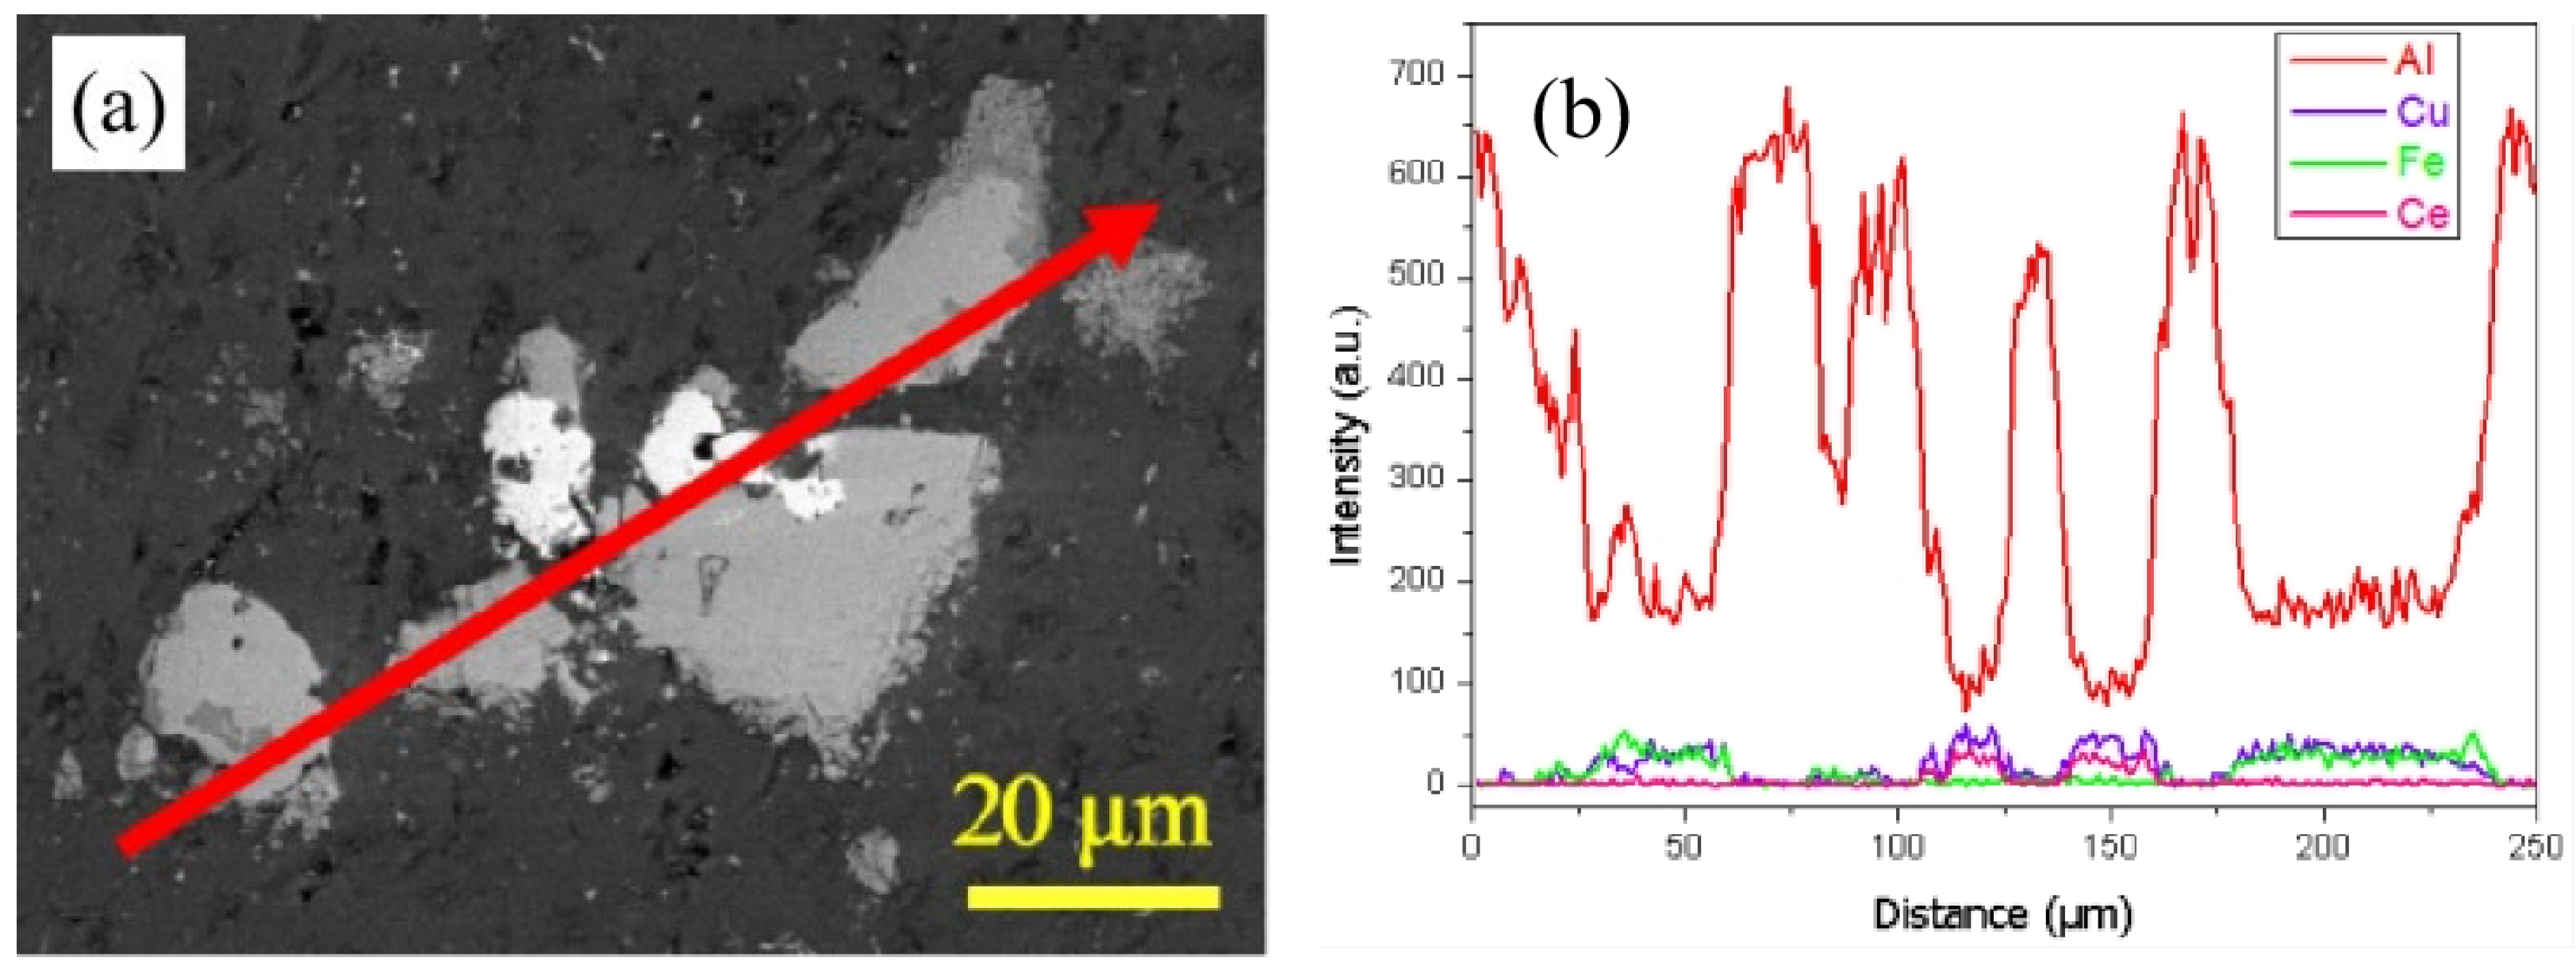
3.6. Analysis of the Surface Distribution and Line Scanning Distribution of Al-20IQC

The surface distribution and line scanning distribution of Al-20IQC (Figure 16 and Figure 17, respectively) show that the I-phase can be evenly distributed in the Al matrix; the white area is Al13Ce2Cu13 phase, and the I-phase is embedded in the matrix, with the good interface integrity.

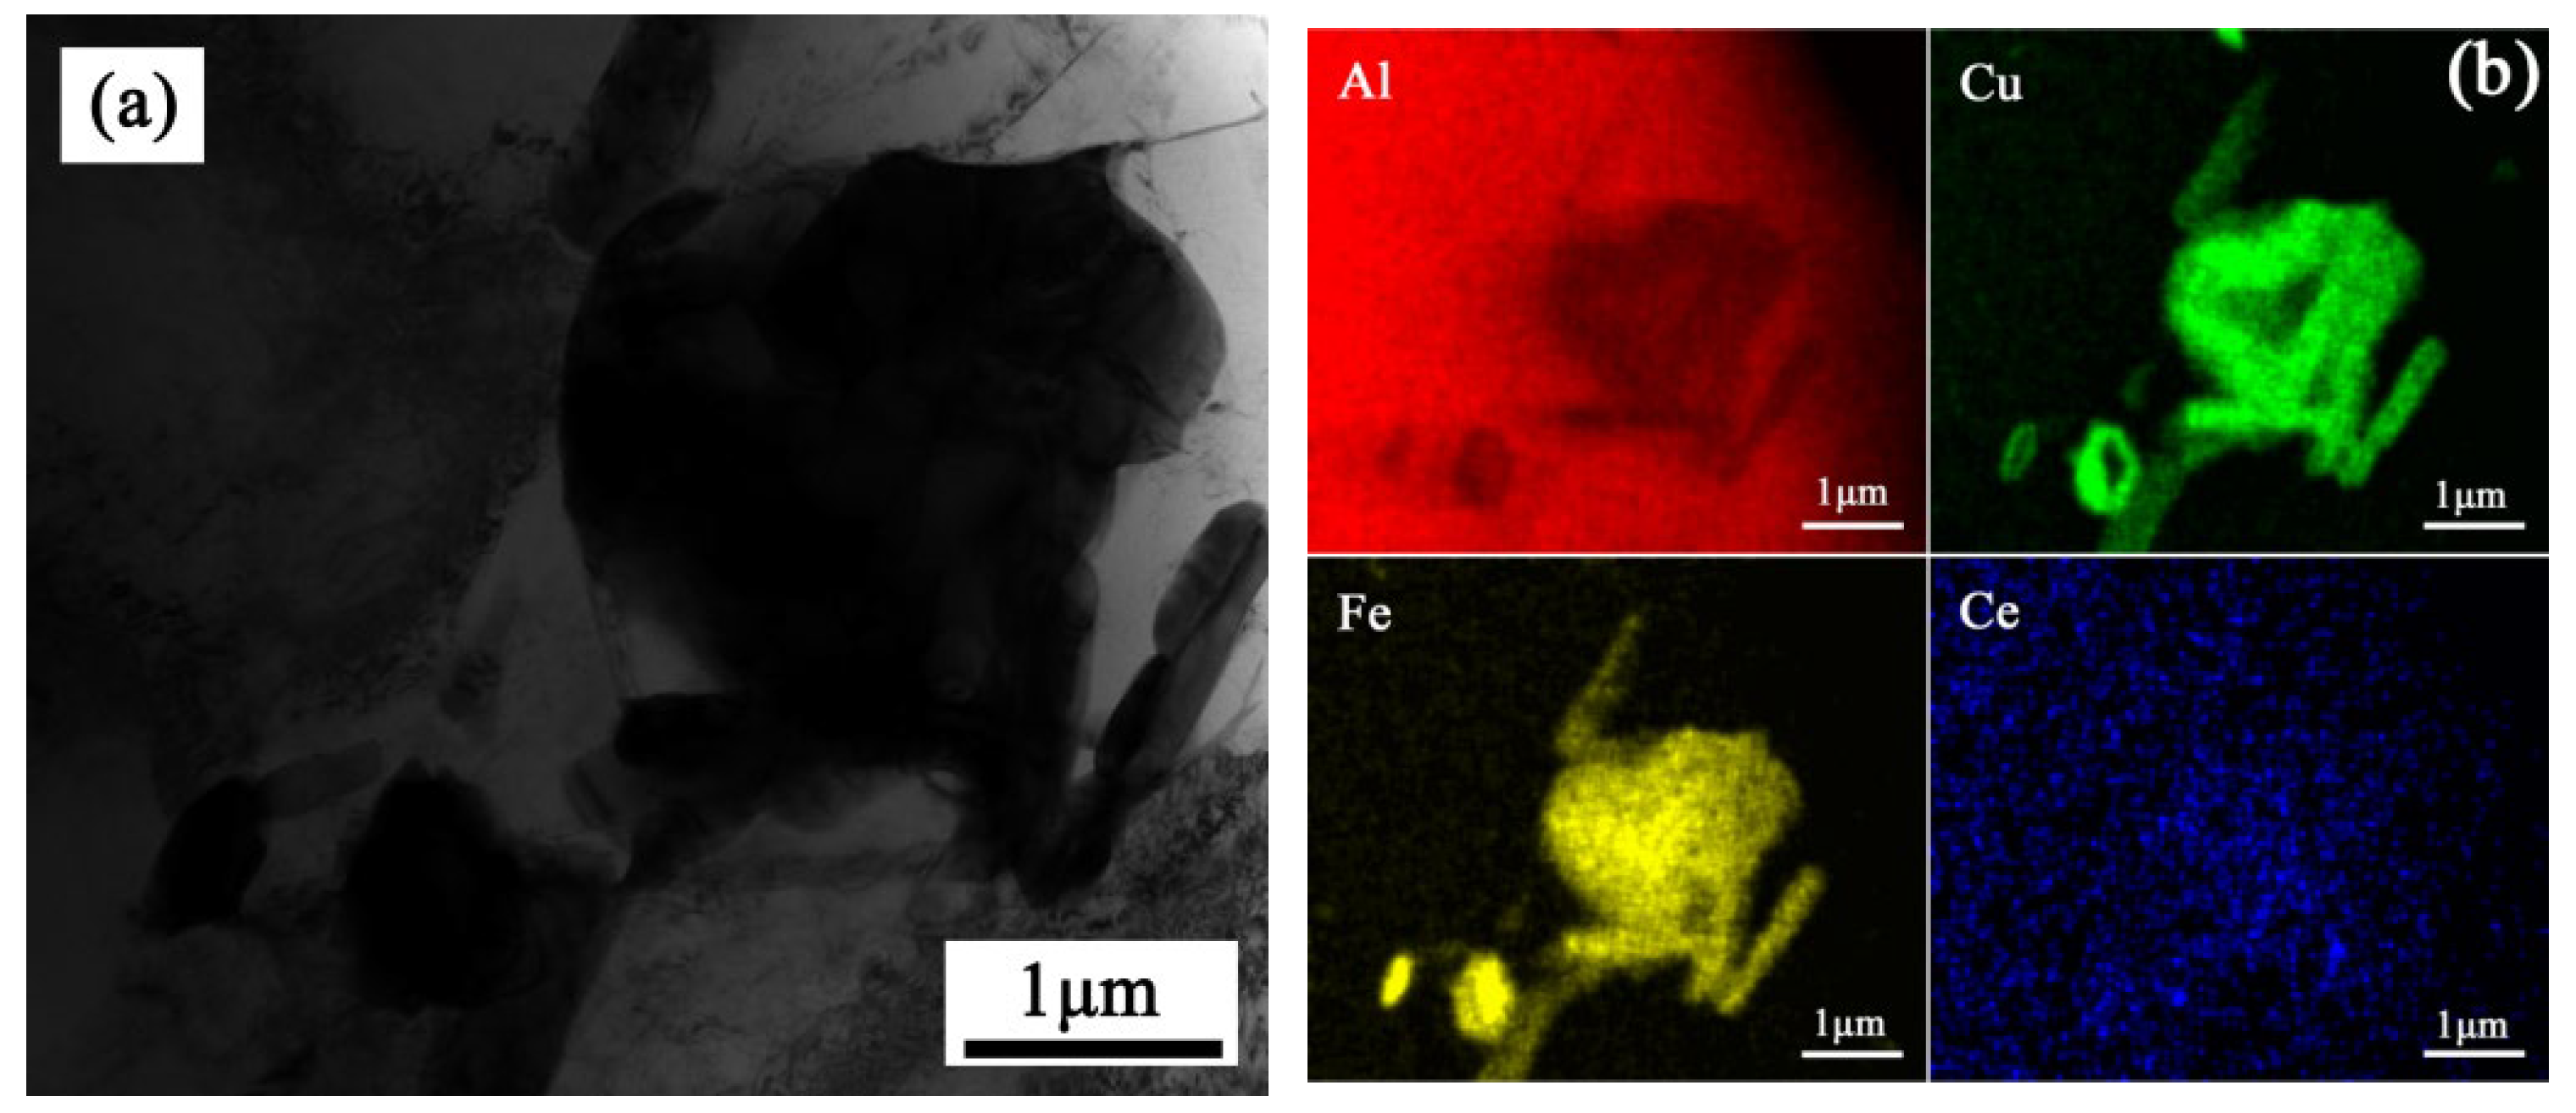
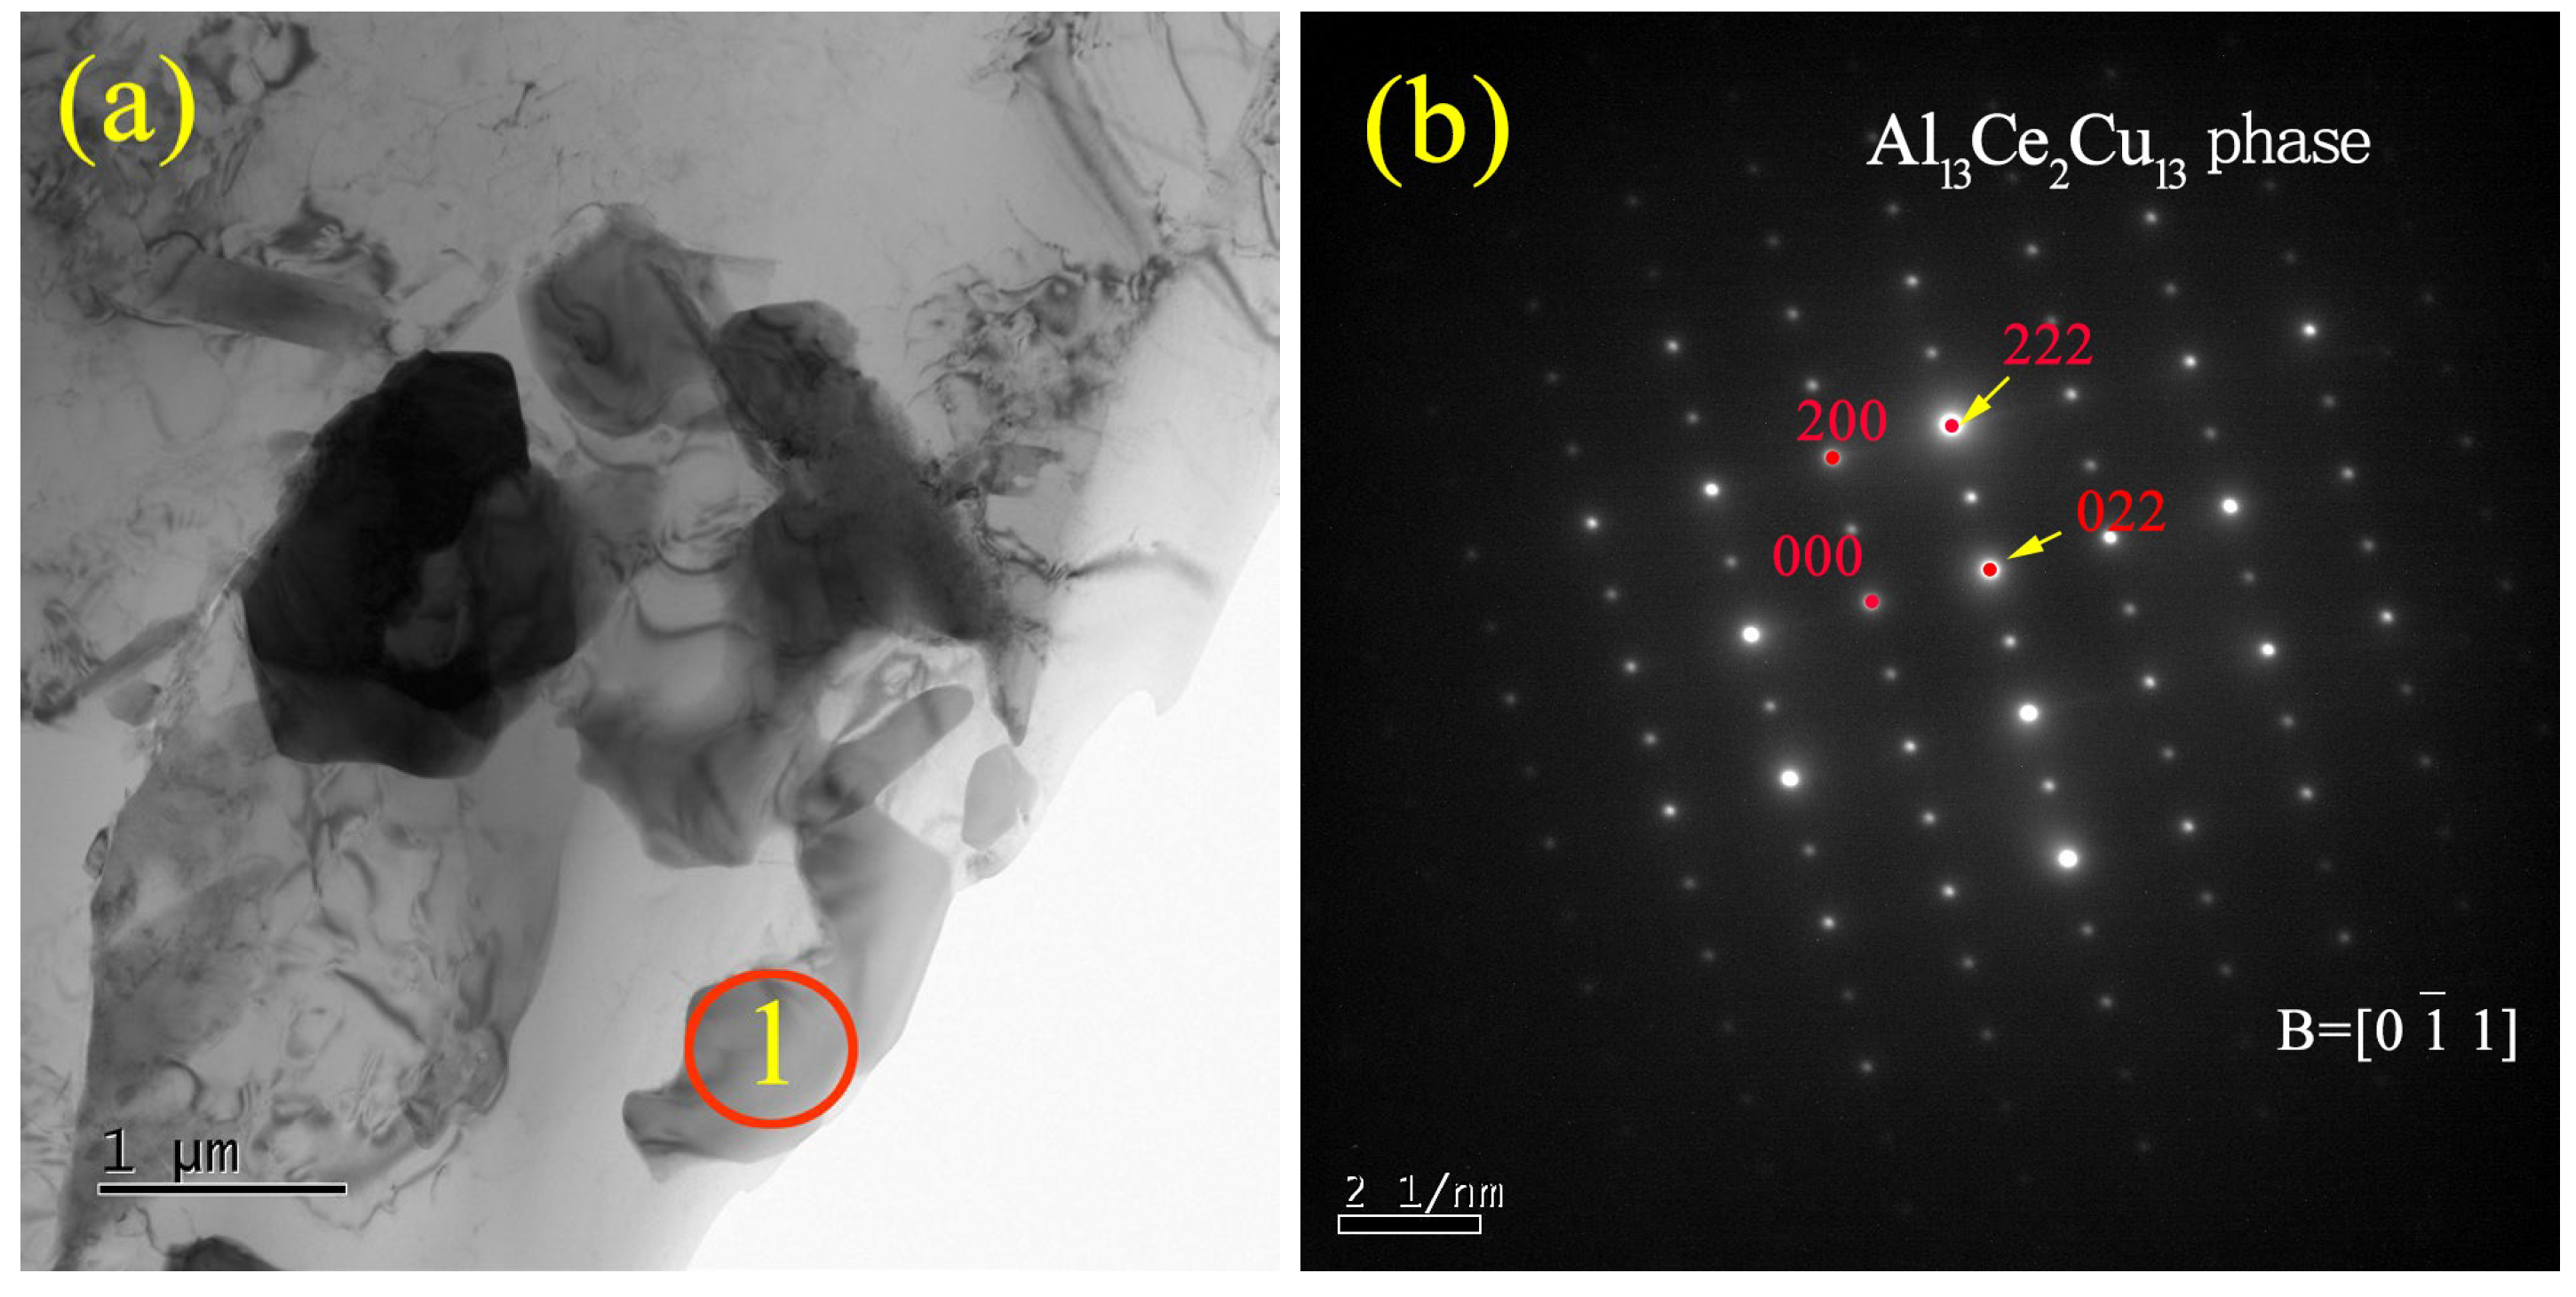
3.7. Transmission Electron Microscopy Analysis

The surface distribution and line scanning analysis of the Al-20IQC were investigated in more detail using transmission electron microscopy (TEM). This allowed the bonding interface between the I-phase and matrix to be found. It was observed at 3.05 µm perpendicular to the abscissa (as shown by the arrow in Figure 18). After entering one side of the matrix, the aluminum content in the reinforcing phase is much less than that in the matrix, but the iron content and copper content in the matrix rise near the interface, indicating that the copper and iron have short-range diffusion at this time. At the same time, Figure 18 and Figure 19 show that this area does not contain cerium, indicating that the phase containing cerium has good thermal stability and does not easily diffuse.
The transmission morphology of the ω-phase, Al4Cu9 phase, and I-phase in the composite was also studied, and the electron diffraction pattern of these regions was analyzed. The strong diffraction points and weak diffraction points are very sharp, with little diffuse scattering, indicating that the quality of the ω-phase, Al4Cu9 phase, and I-phase are very high. The region containing the Al4Cu9 phase was also found by TEM (Figure 20a). The selected area electron diffraction (SAED) pattern analysis of this phase determined that it was the Al4Cu9 phase along the axis of the [001] zone axis (Figure 20b).
The SAED pattern of the I-phase along the trigonal axis of symmetry indicates that this phase exists after hot pressing. However, there are other phases around the I-phase, indicating that the I-phase has been partially transformed during hot pressing (Figure 20c). The ω-Al7Cu2Fe was also observed by TEM, and the SAED pattern of the phase was analyzed (Figure 20d). Figure 20e is an atomic diagram ofω-phase belonging to the tetragonal system. The formation of the Al4Cu9 phase and ω-Al7Cu2Fe may be caused by heterogeneous nucleation using I-phase as the nucleation substrate.
The Al13Ce2Cu13 phase in the Al-20IQC composite was studied by TEM (Figure 21). The bright-field image under TEM is shown as region 1 in Figure 21a. Through a combination of energy spectrum analysis and TEM observation, it was further determined to be the Al13Ce2Cu13 phase.
The shape of region 1 is that of an irregular polygon. The combination between the Al13Ce2Cu13 phase and the matrix is relatively firm, there is no obvious reaction layer, and there is no element diffusion in the transition region. Figure 21b shows the SAED pattern of the Al13Ce2Cu13 phase taken along the [ 0 1 1 ] zone axis.

3.8. Mechanical Performances

Table 3 and Figure 22 present the results of Al-20IQC compressive strengths. At three sintering temperatures, with the increase in holding time, the compressive strength first increases and then decreases. Particularly, at 490 °C, when the holding time increases, the compressive strength (σbc) of the Al-20IQC rises from 654 MPa to 790 MPa and then falls again to 615, and 530 MPa. After holding at 490 °C for 30 min, the compressive strength of the composite can reach the maximum value of about 790 MPa. Compared with 20 min, 60 min, and 90 min hot pressing samples, the compressive strength increased by 20.8%, 28.5%, and 49.1%, respectively.
The hot pressing holding time exerts a great impact on the compressive yield strength, indicating that the choice of hot pressing process parameters exerts a significant impact on the improvement of the compressive yield strength of the Al-20IQC. The appropriate hot pressing process work hardens the matrix near the reinforcement particles [35], allowing the reinforcement particles to play more of a role in the load bearing in the matrix.

4. Discussion

The compressive strength of the Al-20IQCs prepared by hot pressing sintering is significantly improved after holding at 490 °C for 30 min. The properties of the Al-20IQCs are discussed below in combination with the models mentioned in the relevant literature [36] and the results presented in this study.
This study has systematically analyzed the compressive properties of the Al-20IQCs prepared in this according to the strengthening model of Scudino [37].
In quasicrystal-reinforced aluminum matrix composites, the strengthening effect of reinforcing particles is mostly due to two factors [36]: load transfer and dislocation strengthening. According to the revised formula developed by Scudino [37],
( y = y 0 ( 1 + f 1 ) ( 1 + f d ) ( 1 + f s )
where y 0 is the matrix yield strength without reinforcement particles, that is, the yield strength of pure aluminum, f1 refers to a reinforcing factor related to the load-bearing effect, and fd indicates the reinforcing factor associated with the dislocation strengthening. In terms of particle-reinforced composites, the general expression for f1 is [38]:
f1 = 0.5V = 10
f d = σ d i s / σ y 0
where σ d i s represents the enhancement of the yield strength resulting from dislocation strengthening, given by [39]:
σ d i s = ( σ o r ) 2 + ( σ t h e ) 2 + ( σ g e o ) 2 2
where σ o r designates the Orowan stress, namely the stress augmentation necessary for a dislocation to traverse an array of obstructive particles [40], σ t h e is the stress contribution attributable to the statistically stored dislocation resulting from the thermal expansion disparity between the matrix and second-phase particles [41], and σ g e o signifies the stress contribution on account of the consequences of strain gradient associated with the geometrically essential arrangements of dislocations required for compensating the plastic deformation incongruity between the matrix and particles. Replacing the latter part with the stress contribution stemming from the interaction of strain gradient with the dislocation configurations that are essential geometrically for adjusting the plastic deformation disparity between the matrix and particles [42].
σ o r = φ μ m b m L
where φ represents a constant of order 2 [40], b m and μ m represent the Burgers vector and the shear modulus of the metal matrix, respectively, and L is the interparticle spacing of the second-phase particles, which can be expressed by [40]:
L = D ( π 6 f ) 1 / 3
where f and D suggest the volume fraction and the diameter of the particles, separately.
σ t h e = η μ m b m ρ
Here, η represents a constant of approximately order 1, and ρ denotes the dislocation density. ρ is calculated from [43]:
ρ = 12 T α f b m D ( 1 f )
where α implies the disparity in thermal expansion coefficients (TEC) between the matrix and the reinforcing particles, and DT stands for the temperature change from the fabrication temperature to ambient temperature.
σ g e o = β μ m f ε m b m / D
where β denotes a geometric factor with a numerical value of 0.4, and ε m signifies the plastic strain of the metal matrix [44]. Similar to the widely known Hall–Petch relationship [45], the strength increment ( σ s ) arising from the reduction in the matrix ligament size can be expressed as follows:
f s = σ s / σ y o
σ s = k / λ
where k represents an enhancement constant, and λ can be calculated from the following:
λ = D [ 1 ( v / 100 ) 1 3 1 ]
where D refers to the particle size statistics of matrix particles, which is brought in according to the calculation results in Figure 8.
The compression performance is computed in accordance with the aforementioned modified formula, and the computed outcomes are in line with the experimental results. According to the results, the particle size of the composite diminishes progressively as the temperature and duration of holding in the hot pressing sintering process rise. After holding at 490 °C for 30 min, fine reinforced particles with high density are evenly distributed in the matrix, producing composites with excellent microstructure and properties.
Based on the Al-20IQC composite’s microstructure, even reinforcement distribution within the composite can be attained after 30 min sintering under 490 °C (Figure 5b), with nearly no decomposition. There is a tight reinforcement–matrix combination and poor matrix porosity, thereby enhancing composite performance. The mean reinforcement–matrix reaction layer thickness is around 5 μm at this moment. The reaction layer with moderate thickness decreases composite residual stress, increases reinforcement–matrix bonding, and promotes composite compressive performances.

5. Conclusions

In conclusion, by employing a vacuum hot pressing sintering technique, aluminum matrix composites reinforced with (Al63Cu25Fe12)99Ce1 quasicrystal particles were fabricated. The microstructure and element diffusion behavior at the interface of the composite were examined. The following inferences can be drawn:
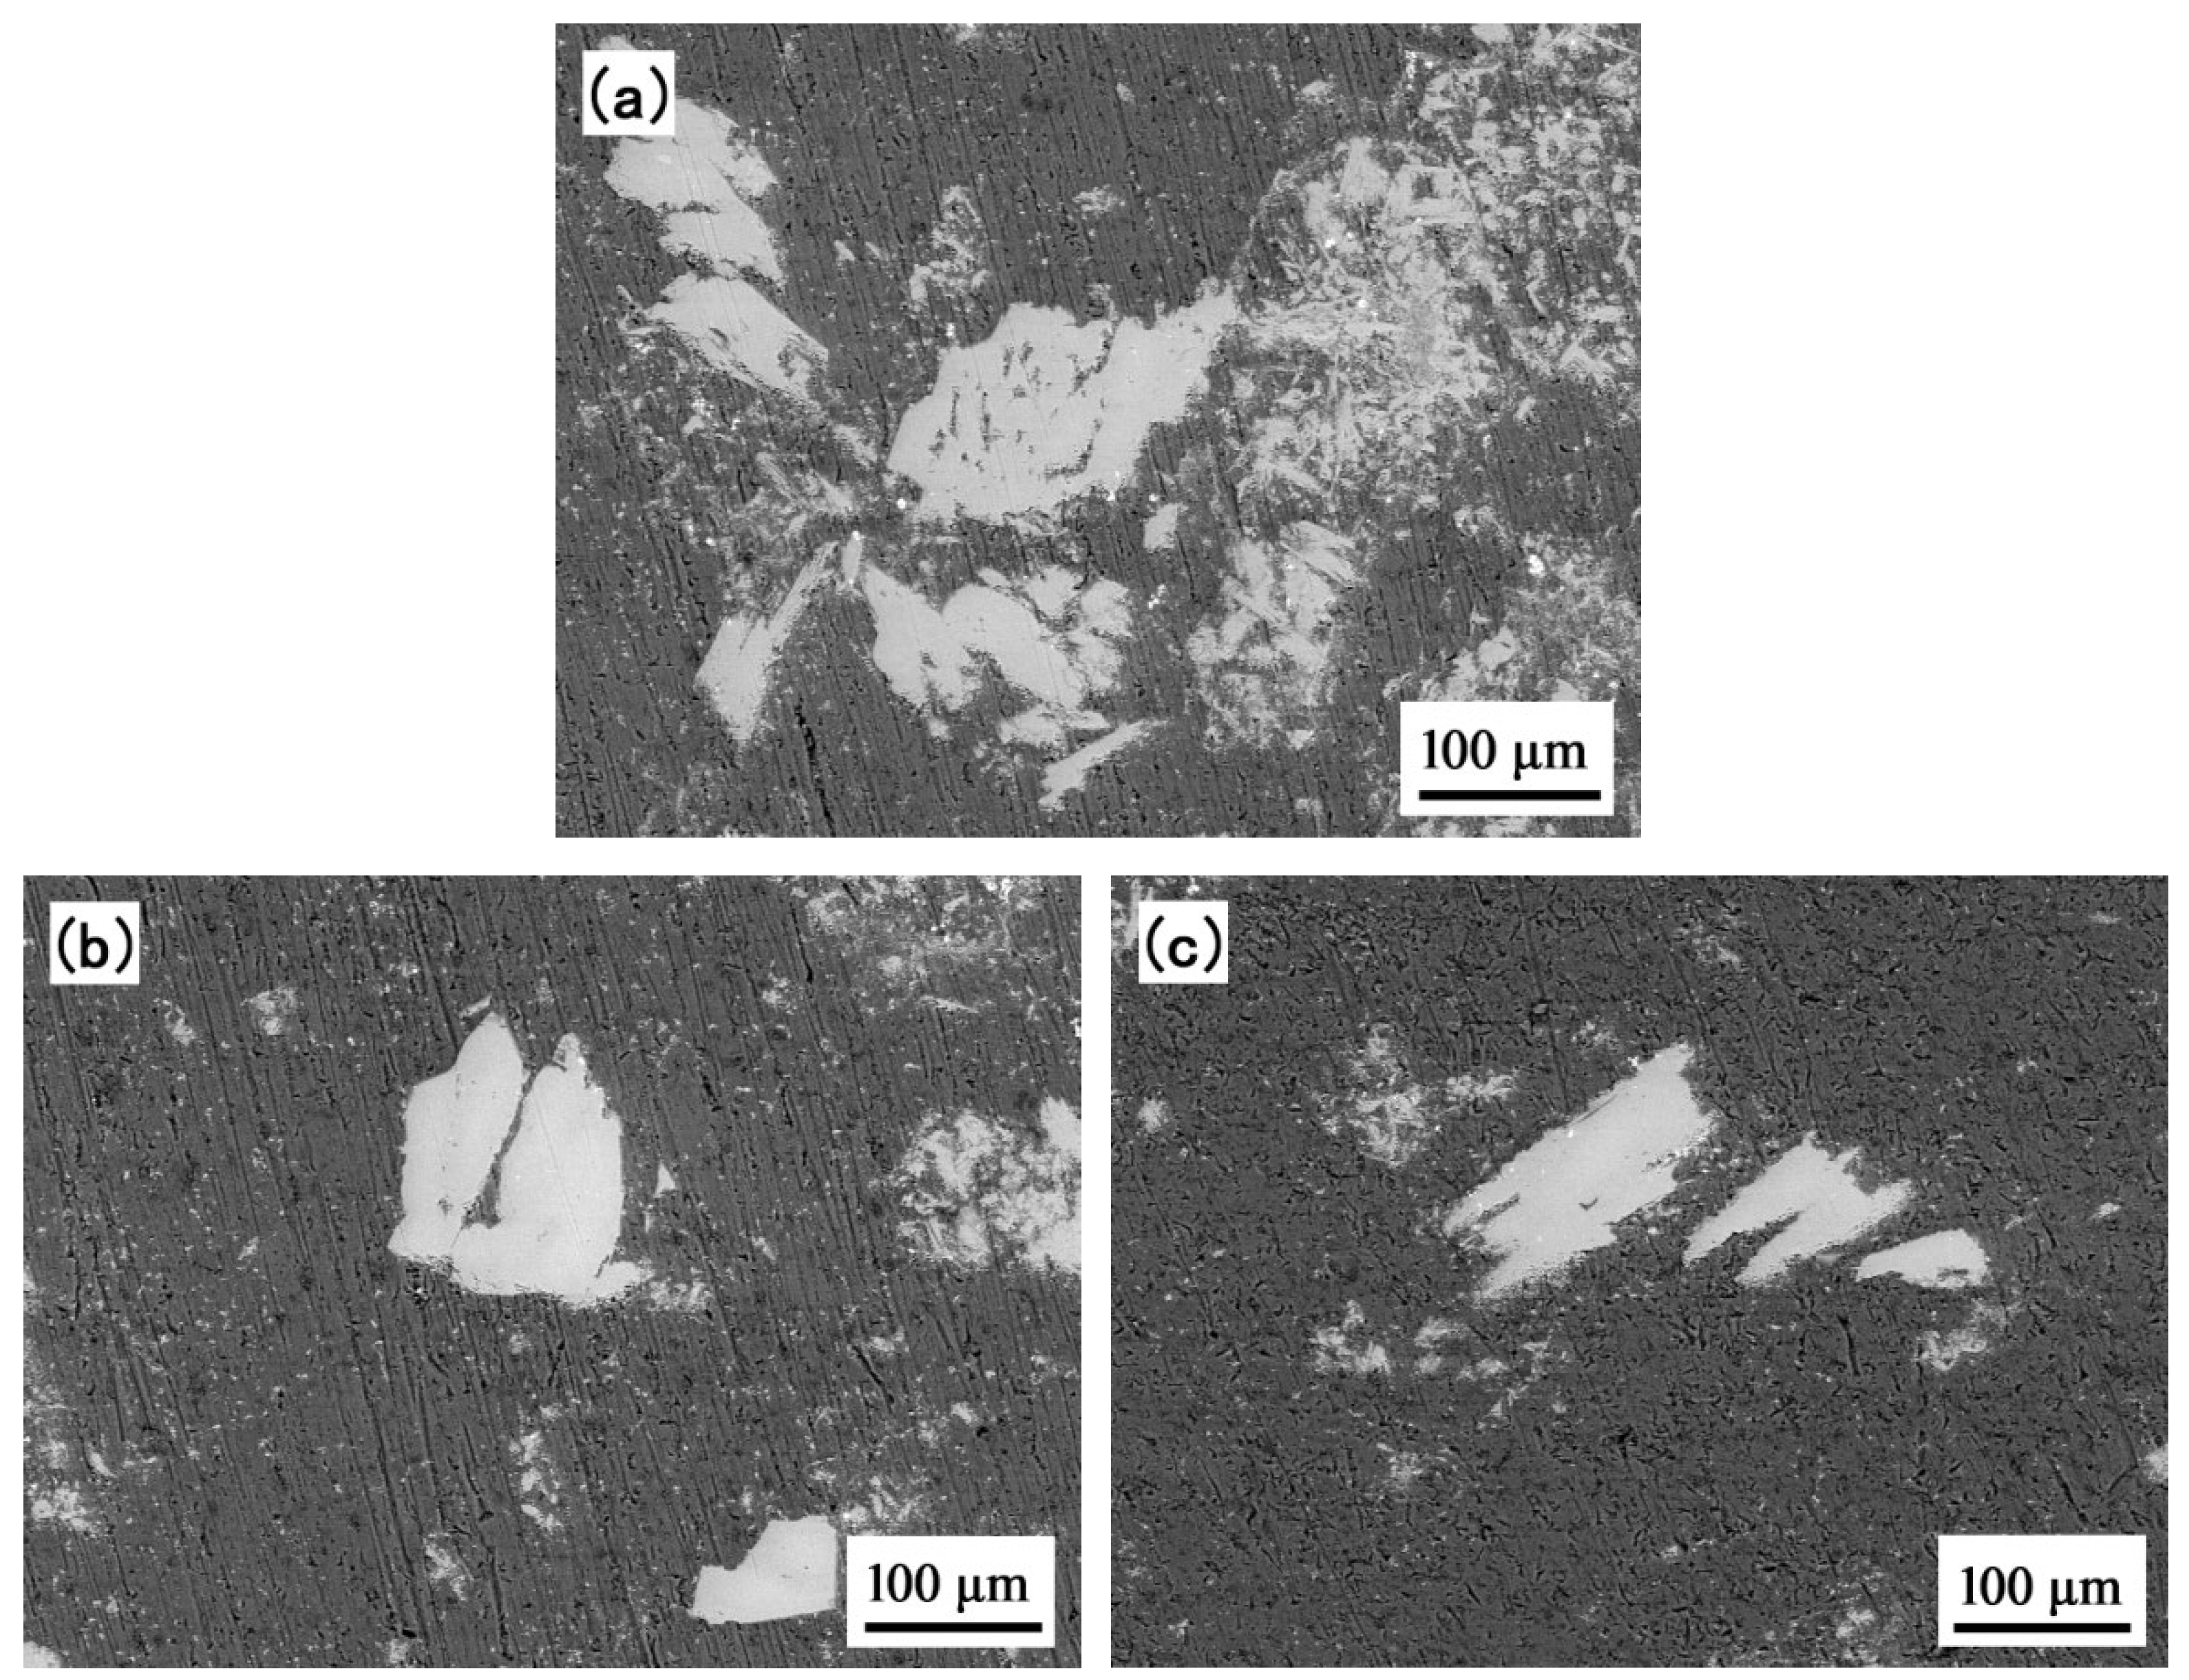
  • When the sintering temperature is 490 °C for 30 min, the interface between the composite matrix and reinforcement is clear, and the interface integrity is good. During hot pressing sintering, chemical diffusion occurs between the I-phase and aluminum matrix, forming part of the Al7Cu2Fe phase, AlFe phase, and AlCu phase. Due to the uniform and fine distribution of these phases, the overall properties of the alloy are obviously enhanced;
  • When the holding time increases, the compactness of the composite first increases and then decreases again. After holding at 490 °C for 30 min, the compactness of the composite reaches the maximum, which is about 98.89%;
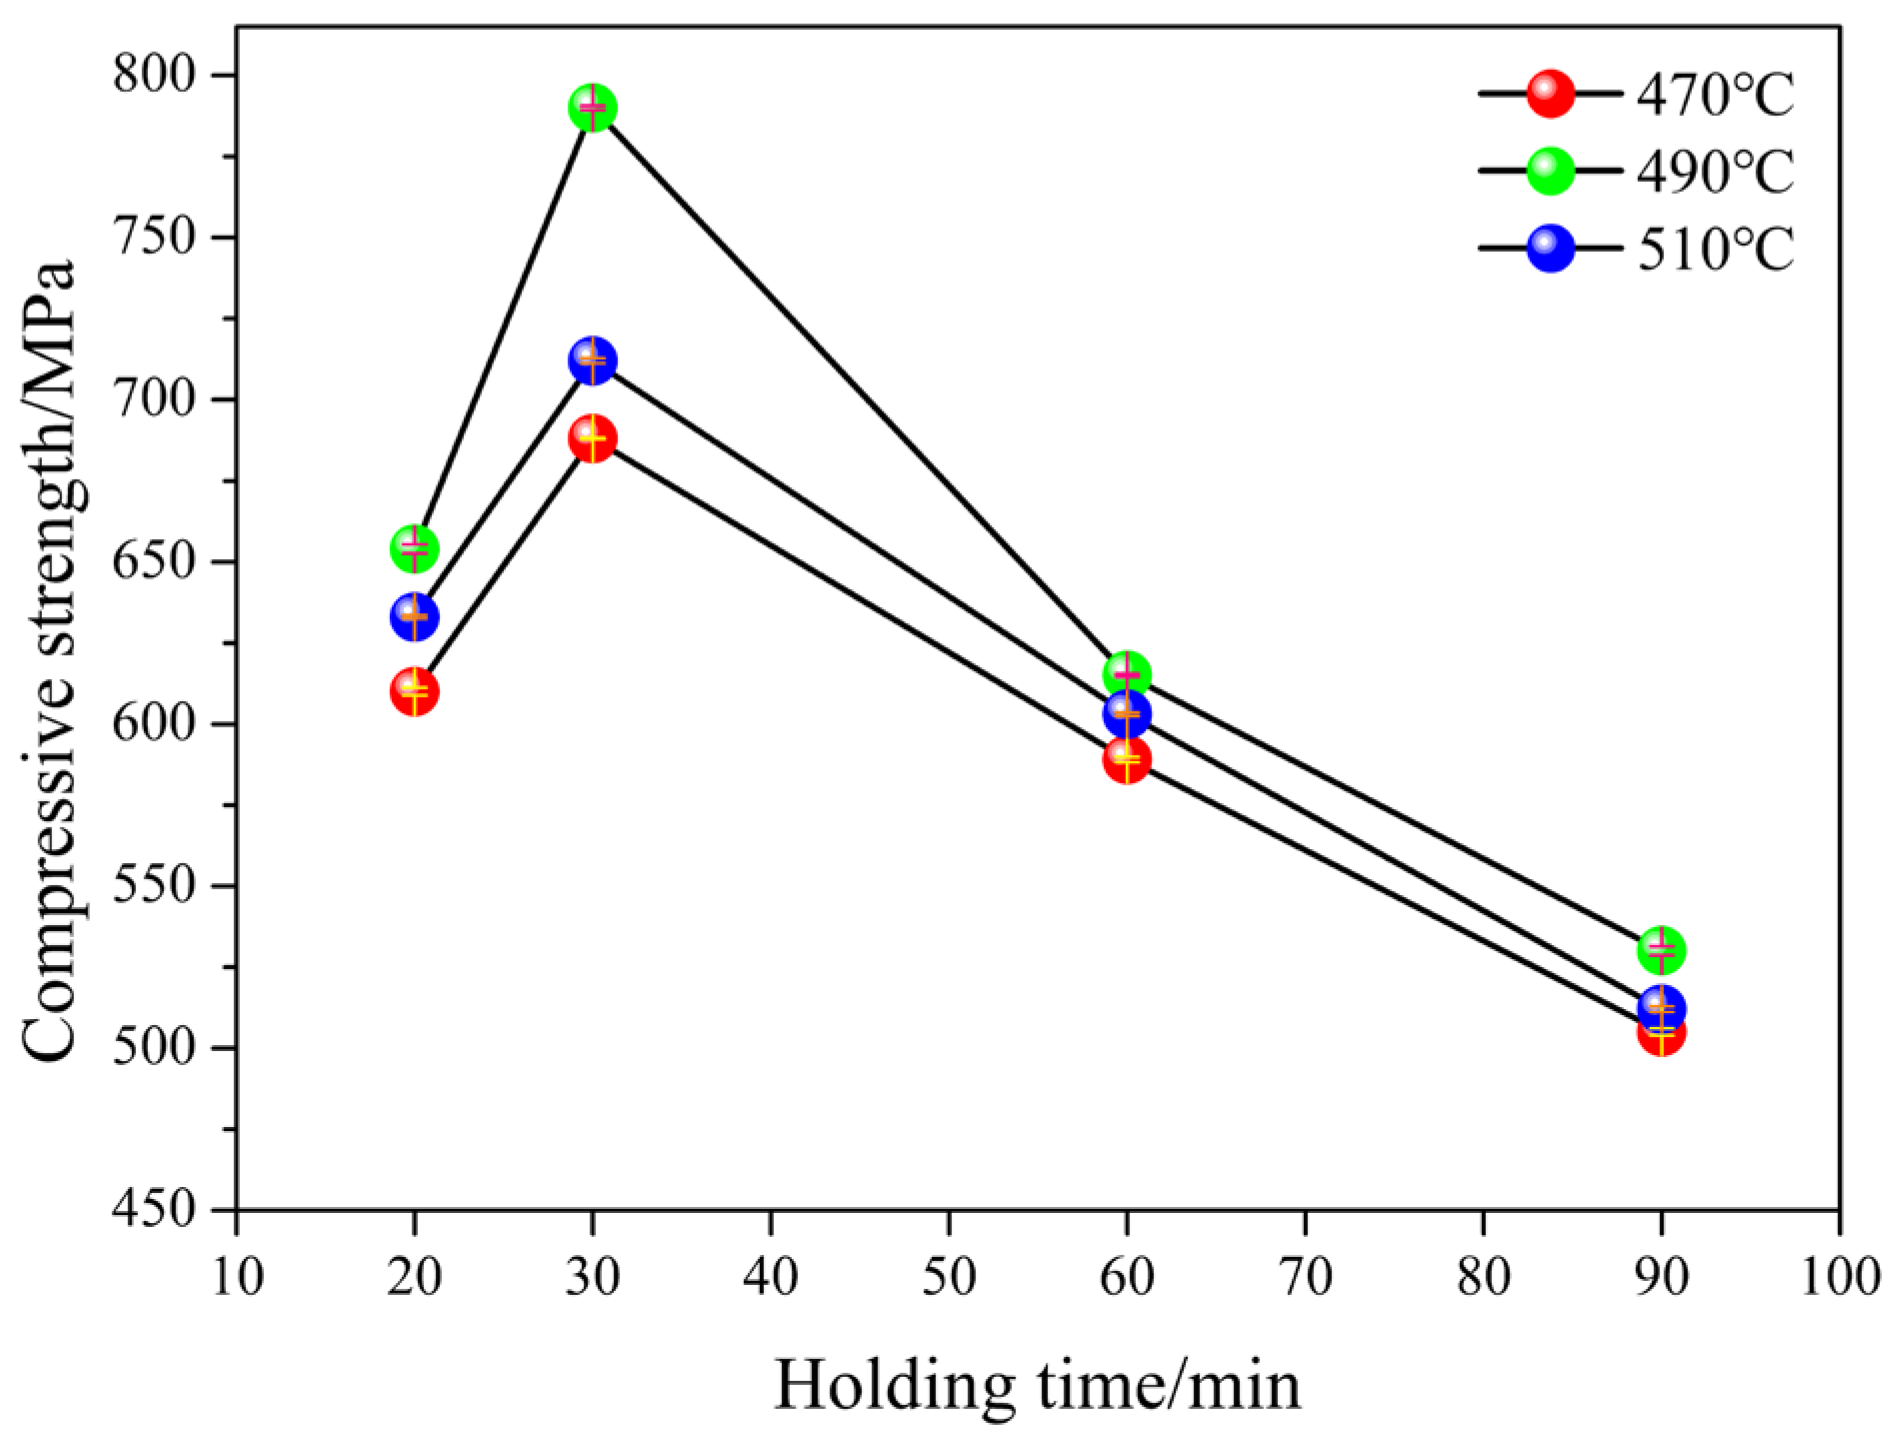
  • As sintering temperature increases, the composite shows a first increase and later decrease trend of compressive strength. Following 30 min holding under 490 °C, there is a dense reinforcement particles-matrix combination, accompanied by integrated reinforcement under even distribution within the matrix. Moreover, the composite has the highest compressive strength at around 790 MPa.

Author Contributions

Conceptualization, J.W.; methodology, J.W.; software, J.W.; validation, J.W. and Z.Y.; formal analysis, J.W.; investigation, J.W. and Z.Y.; resources, Z.Y.; data curation, Z.Y.; writing—original draft preparation, J.W. and Z.Y.; writing—review and editing, J.W.; visualization, Z.Y.; supervision, J.W.; project administration, J.W.; funding acquisition, J.W. and Z.Y. All authors have read and agreed to the published version of the manuscript.

Funding

The current work was funded by the Huzhou Vocational and Technical College, Special Exploration Project Funds for high-level Talents under grant no. 2024TS04.

Institutional Review Board Statement

Not applicable.

Informed Consent Statement

Not applicable.

Data Availability Statement

Data are contained within the article.

Conflicts of Interest

The authors declare no conflicts of interest.

References

  1. Bhowmik, A.; Sen, B.; Beemkumar, N.; Chohan, J.S.; Bains, P.S.; Singh, G.; Kumar, A.V. Development and wear resistivity performance of SiC and TiB2 particles reinforced novel aluminium matrix composites. Results Eng. 2024, 24, 102981. [Google Scholar] [CrossRef]
  2. Senthil, R.; Mohanavel, V. Effect of aluminium nitride (AlN) particles addition on mechanical and tribological properties of aluminium matrix composites. Mater. Today Proc. 2024. [Google Scholar] [CrossRef]
  3. Sun, X.; Xie, Y.; Meng, X.; Mao, D.; Zhang, Z.; Wang, J.; Ma, X.; Wang, N.; Huang, Y. Tailoring high-entropy oxides to ameliorate interfacial mismatch of aluminum-matrix composites towards superior strength-ductility balance. Mater. Sci. Eng. A 2024, 909, 146813. [Google Scholar] [CrossRef]
  4. Anirudh, V.; Vigneshwaran, M.; Vijay, E.; Pramod, R.; Kumar, G.V. Influence of Titanium Diboride and Graphite Reinforcement on Al6061 Alloy. Mater. Today Proc. 2018, 5, 25341–25349. [Google Scholar] [CrossRef]
  5. Singla, D.; Amulya, K.; Murtaza, Q. CNT Reinforced Aluminium Matrix Composite-A Review. Mater. Today Proc. 2015, 2, 2886–2895. [Google Scholar] [CrossRef]
  6. Ramnath, B.V.; Elanchezhian, C.; Jaivignesh, M.; Rajesh, S.; Parswajinan, C.; Ghias, A.S. Evaluation of mechanical properties of aluminium alloy–alumina–boron carbide metal matrix composites. Mater. Des. 2014, 58, 332–338. [Google Scholar] [CrossRef]
  7. Koli, D.; Agnihotri, G.; Purohit, R. Advanced Aluminium Matrix Composites: The Critical Need of Automotive and Aerospace Engineering Fields. Mater. Today Proc. 2015, 2, 3032–3041. [Google Scholar] [CrossRef]
  8. Xavior, M.A.; Kumar, H.G.P. Processing and Characterization Techniques of Graphene Reinforced Metal Matrix Composites (GRMMC); A Review. Mater. Today Proc. 2017, 4 Pt A, 3334–3341. [Google Scholar] [CrossRef]
  9. Wu, X.; Zhang, W. A review on aluminum matrix composites’ characteristics and applications for automotive sector. Heliyon 2024, 10, e38576. [Google Scholar] [CrossRef]
  10. Demuynck, M.; Erauw, J.; Van der Biest, O.; Delannay, F.; Cambier, F. Densification of alumina by SPS and HP: A comparative study. J. Eur. Ceram. Soc. 2012, 32, 1957–1964. [Google Scholar] [CrossRef]
  11. Aravindan, M.K.; Balamurugan, K.; Murali, G. Effect of reinforcement of AL-6063 with SiC on mechanical behavior and microstructure of metal matrix composites. Carbon Sci. Technol. 2014, 6, 388–394. [Google Scholar]
  12. Llorca, J.; Needleman, A.; Suresh, S. An analysis of the effects of matrix void growth on deformation and ductility in metal-ceramic composites. Acta Metall. Mater. 1991, 39, 2317–2335. [Google Scholar] [CrossRef]
  13. Texier, M.; Proult, A.; Bonneville, J.; Rabier, J.; Baluc, N.; Cordier, P. Microstructure of icosahedral Al-Pd-Mn quasicrystals deformed at room temperature in an anisotropic confining medium. Philos. Mag. Lett. 2002, 82, 659–669. [Google Scholar] [CrossRef]
  14. Lee, K.; Dai, W.; Naugle, D.; Liang, H. Effects of Microstructure of Quasicrystal Alloys on Their Mechanical and Tribological Performance. J. Tribol. 2018, 140, 051605. [Google Scholar] [CrossRef]
  15. Kim, Y.K.; Kim, W.T.; Kim, D.H. Quasicrystal-reinforced Mg alloys. Sci. Technol. Adv. Mater. 2014, 15, 024801. [Google Scholar]
  16. Tsai, A.; Aoki, K.; Inoue, A.; Masumoto, T. Synthesis of stable quasicrystalline particle-dispersed Al base composite alloys. J. Mater. Res. 1993, 8, 5–7. [Google Scholar] [CrossRef]
  17. Ying, Y.; Guan, Z.; Wang, X.; Wang, G.; Yan, W. Room temperature tensile creep behavior of Mg-6Zn-0.4Mn-0.3Al-0.2Ca (wt%) alloy containing icosahedral quasicrystals. Mater. Today Commun. 2024, 39, 108602. [Google Scholar] [CrossRef]
  18. Zhang, L.; Ai, T.; Tian, X.; Dai, S. An efficient removal mechanism for different hydrophilic antibiotics from aquatic environments by Cu–Al–Fe–Cr quasicrystals††Electronic supplementary information (ESI) available. RSC Adv. 2022, 12, 9995–10004. [Google Scholar] [CrossRef]
  19. Polozhentsev, O.E.; Kozakov, A.T.; Vlasenko, V.G.; Bryleva, M.A.; Kubrin, S.P.; Soldatov, A.V. The local atomic and electronic structure of quasicrystal i-Al65Cu23Fe12 powder. Mater. Today Commun. 2024, 39, 108747. [Google Scholar] [CrossRef]
  20. Shadangi, Y.; Sharma, S.; Shivam, V.; Basu, J.; Chattopadhyay, K.; Majumdar, B.; Mukhopadhyay, N.K. Fabrication of Al–Cu–Fe quasicrystal reinforced 6082 aluminium matrix nanocomposites through mechanical milling and spark plasma sintering. J. Alloys Compd. 2020, 828, 154258. [Google Scholar] [CrossRef]
  21. Silveira, A.D.; Silva, L.P.M.E.; Oliveira, T.C.D.; Castro, M.M.; Figueiredo, R.B.; Bolfarini, C.; Botta, W.J.; Wolf, W. Al-matrix composites reinforced with quasicrystals consolidated at room temperature using HPT. Mater. Lett. 2022, 317, 132107. [Google Scholar] [CrossRef]
  22. Wolf, W.; Bolfarini, C.; Kiminami, C.S.; Botta, W.J. Fabrication of Al-matrix composite reinforced with quasicrystals using conventional metallurgical fabrication methods. Scr. Mater. 2019, 173, 21–25. [Google Scholar] [CrossRef]
  23. Kang, N.; Fu, Y.; Coddet, P.; Guelorget, B.; Liao, H.; Coddet, C. On the microstructure, hardness and wear behavior of Al-Fe-Cr quasicrystal reinforced Al matrix composite prepared by selective laser melting. Mater. Des. 2017, 132, 105–111. [Google Scholar] [CrossRef]
  24. Wang, J.; Yang, Z.; Wang, L.; Li, J. Interfacial reaction kinetics of (Al63Cu25Fe12)99Ce1 quasicrystal reinforced 6061 aluminum matrix composites. J. Alloys Compd. 2023, 955, 170261. [Google Scholar] [CrossRef]
  25. Yavas, B.; Li, M.; Hung, C.J.; Hebert, R.J.; Alpay, S.P.; Aindow, M. Transformations in laser track microstructures for a quasicrystal-reinforced Al-Cu-Fe-Cr alloy. Mater. Charact. 2024, 217, 114345. [Google Scholar] [CrossRef]
  26. Ali, F.; Scudino, S.; Liu, G.; Srivastava, V.C.; Mukhopadhyay, N.K.; Khoshkhoo, M.S.; Prashanth, K.G.; Uhlenwinkel, V.; Calin, M.; Eckert, J. Modeling the strengthening effect of Al–Cu–Fe quasicrystalline particles in Al-based metal matrix composites. J. Alloys Compd. 2012, 536, S130–S133. [Google Scholar] [CrossRef]
  27. Wang, J.; Yang, Z.; Ma, Z.; Duan, H.; Zhang, J.; Tao, D.; Li, J. Effect of the addition of cerium on the microstructure evolution and thermal expansion properties of cast Al-Cu-Fe alloy. Mater. Res. Express 2021, 8, 036503. [Google Scholar] [CrossRef]
  28. Wang, J.; Yang, Z.; Duan, H.; Ma, Z.; Tao, D.; Li, J. Effect of heat treatment on microstructure and thermal expansion properties of as cast (Al63Cu25Fe12)99Ce1 alloy. Kov. Mater.-Met. Mater. 2021, 59, 367–377. [Google Scholar] [CrossRef]
  29. Joseph, A.; Gauthier-Brunet, V.; Monchoux, J.P.; Joulain, A.; Brisset, F.; Tromas, C.; Douin, J.; Pettinari, F.; Bonneville, J.; Dubois, S. Formation processes of the ω-Al70Cu20Fe10 phase synthesized by SPS technique. J. Alloys Compd. 2016, 699, 1157–1165. [Google Scholar] [CrossRef]
  30. Parsamehr, H.; Yang, C.L.; Liu, W.T.; Chen, S.W.; Chang, S.Y.; Chen, L.J.; Tsai, A.P.; Lai, C.H. Direct observation of growth and stability of Al-Cu-Fe quasicrystal thin films. Acta Mater. 2019, 174, 1–8. [Google Scholar] [CrossRef]
  31. Saâdi, N.; Harmelin, M.; Faudot, F.; Legendre, B. Enthalpy of formation of the Al0.63Cu0.25Fe0.12 icosahedral phase. J. Non-Cryst. Solids 1993, 153–154, 500–503. [Google Scholar] [CrossRef]
  32. Zhang, L.; Schneider, J.; Lück, R. Phase transformations and phase stability of the AlCuFe alloys with low-Fe content. Intermetallics 2005, 13, 1195–1206. [Google Scholar] [CrossRef]
  33. Fedorov, G.B.; Shevchuk, Y.A.; Khasaev, T.O. Growth kinetics of the intermetallic coating in mutual diffusion in systems of aluminium with titanium and titanium-zirconium alloys. Fiz. I Khimiya Obarabotki Mater. 1990, 24, 53–56. [Google Scholar]
  34. Luo, J.G.; Acoff, V.L. Using cold roll bonding and annealing to process Ti/Al multi-layered composites from elemental foils. Mater. Sci. Eng. A 2004, 379, 164–172. [Google Scholar] [CrossRef]
  35. Inoue, A.; Kimura, H. High-strength aluminum alloys containing nanoquasicrystalline particles. Mater. Sci. Eng. A 2000, 286, 1–10. [Google Scholar] [CrossRef]
  36. Lloyd, D.J. Particle reinforced aluminium and magnesium matrix composites. Int. Mater. Rev. 1994, 39, 1–23. [Google Scholar] [CrossRef]
  37. Scudino, S.; Liu, G.; Sakaliyska, M.; Surreddi, K.B.; Eckert, J. Powder metallurgy of Al-based metal matrix composites reinforced with β-Al3Mg2 intermetallic particles: Analysis and modeling of mechanical properties. Acta Mater. 2009, 57, 4529–4538. [Google Scholar] [CrossRef]
  38. Nardone, V.C.; Prewo, K.M. On the strength of discontinuous silicon carbide reinforced aluminum composites. Scr. Metall. 1986, 20, 43–48. [Google Scholar] [CrossRef]
  39. Andersen, S.I.; Lilholt, H.; Pedersen, O.B. Mechanical and physical behaviour of metallic and ceramic composites. In Proceedings of the 9th Risø International Symposium on Metallurgy and Materials Science, Roskilde, Denmark, 5–9 September 1988. [Google Scholar]
  40. Miller, W.S.; Humphreys, F.J. Strengthening mechanisms in particulate metal-matrix composites. Scr. Metall. Mater. 1991, 25, 2623–2626. [Google Scholar] [CrossRef]
  41. Hansen, N. The effect of grain size and strain on the tensile flow stress of aluminium at room temperature. Acta Metall. 1977, 25, 863–869. [Google Scholar] [CrossRef]
  42. Scudino, S.; Liu, G.; Prashanth, K.G.; Bartusch, B.; Surreddi, K.B.; Murty, B.S.; Eckert, J. Mechanical properties of Al-based metal matrix composites reinforced with Zr-based glassy particles produced by powder metallurgy. Acta Mater. 2009, 57, 2029–2039. [Google Scholar] [CrossRef]
  43. Arsenault, R.J.; Wang, L.; Feng, C.R. Strengthening of composites due to microstructural changes in the matrix. Acta Metall. Mater. 1991, 39, 47–57. [Google Scholar] [CrossRef]
  44. Brown, L.M.; Stobbs, W.M. The work-hardening of copper-silica v. equilibrium plastic relaxation by secondary dislocations. Philos. Mag. J. Theor. Exp. Appl. Phys. 1976, 34, 351–372. [Google Scholar] [CrossRef]
  45. Hall, E.O. The Deformation and Ageing of Mild Steel: {III} Discussion of Results. Proc. Phys. Soc. Sect. B 1951, 64, 747–753. [Google Scholar] [CrossRef]
Figure 1. Flowchart showing hot pressing sintering.
Coatings 14 01411 g001
Figure 2. XRD patterns of pure aluminum powder (a) and heat-treated Al-Cu-Fe-Ce IQC alloy powder (b); SEM micrographs showing the morphology of pure aluminum powder (c) and IQC alloy powder after heat treatment (d); particle size distribution diagram of pure aluminum powder (e).
Coatings 14 01411 g002
Figure 3. XRD patterns at different hot pressing temperatures and holding times: (a) expanded patterns of Al-20IQC at 21~25° and 36~50° (b,c).
Coatings 14 01411 g003
Figure 4. Al-20IQCs microstructure at 470 °C with diverse holding times: (a) 20 min, (b) 30 min, (c) 60 min, and (d) 90 min.
Coatings 14 01411 g004
Figure 5. Al-20IQCs microstructure at 490 °C for different holding times: (a) 20 min, (b) 30 min, (c) 60 min, and (d) 90 min.
Coatings 14 01411 g005
Figure 6. The microstructure of Al-20IQCs at 510 °C with different holding durations: (a) 20 min, (b) 30 min, (c) 60 min, and (d) 90 min.
Coatings 14 01411 g006
Figure 7. The microstructure of Al-20IQCs under heat preservation for 90 min at 470 °C (a), 490 °C (b) and 510 °C (c).
Coatings 14 01411 g007
Figure 8. Statistics of reinforcement size of Al-20IQCs under different holding times: (a) 20 min, (b) 30 min, (c) 60 min, and (d) 90 min.
Coatings 14 01411 g008
Figure 9. The relationship between product thickness and reaction time at various hot pressing temperatures.
Coatings 14 01411 g009
Figure 10. Correlation between product thickness and reaction holding time at varying hot pressing temperatures.
Coatings 14 01411 g010
Figure 11. A plot of lnK versus 1/T for the composites.
Coatings 14 01411 g011
Figure 12. Time-varying curves of theoretical prediction and experimental values of reaction layer of Al-20IQC sintered at different temperatures.
Coatings 14 01411 g012
Figure 13. Variation in the reaction rate of Al-20IQC reaction layer with time.
Coatings 14 01411 g013
Figure 14. The density of Al-20IQC samples prepared under different holding times.
Coatings 14 01411 g014
Figure 15. High magnification microstructure of Al-20IQC after hot pressing at 490 °C for 30 min.
Coatings 14 01411 g015
Figure 16. Al-20IQC microstructure at 490 °C for 30 min: (a) SEM image, and (b) Al, Cu, Fe, and Ce surface distribution.
Coatings 14 01411 g016
Figure 17. Al-20IQC microstructure at 490 °C for 30 min: (a) SEM image, and (b) Line Scan Analysis of Al, Cu, Fe, and Ce.
Coatings 14 01411 g017
Figure 18. Line scanning analysis of Al-20IQC under TEM.
Coatings 14 01411 g018
Figure 19. Analysis of the surface distribution of the Al-20IQC under TEM, (a) Microscopic morphology of Al-20IQC under TEM; (b) Face-scan distribution of the elements Al, Cu, Fe and Ce.
Coatings 14 01411 g019
Figure 20. Microstructure of the ω-phase, Al4Cu9 phase, and I-phase in the Al-20IQC under TEM, (a) transmission bright-field image, (b) selected area electron diffraction (SAED) pattern of the ω-phase, (c) SAED of the Al4Cu9 phase along the [001] direction, (d) SAED pattern corresponding to the I-phase, and (e) atomic diagram of ω-phase.
Coatings 14 01411 g020
Figure 21. (a) Transmission bright field image of Al13Ce2Cu13 phase, and (b) SAED pattern of the Al13Ce2Cu13 phase taken along the [ 0 1 1 ] zone axis.
Coatings 14 01411 g021
Figure 22. The compressive strength of Al-20IQC samples prepared under different holding times.
Coatings 14 01411 g022
Table 1. Variation in thickness of the reaction layer under diverse hot pressing temperatures and holding periods.
Temperature (°C)470470470470470490490490490490510510510510510
Time (min)102030609010203060901020306090
Reaction Layer Thickness (µm)1.522.645.782.945.1578.03710.3121618.5
Table 2. Phase elemental composition of Al-20IQC composite prepared by HPS at 490 °C for 30 min.
Elemental Composition of Phases in Al-20IQC Composite HPS at 490 °C
HPS TemperatureRegionAlFeCuCe
wt%at%wt%at%wt%at%wt%at%
490 °CA47.166.7517.0511.6831.8521.57
B96.7198.57 3.291.43
C31.7349.1267.4350.330.840.55
D24.4947.18 55.5145.41207.42
E49.9569.2615.610.4534.4520.28
Table 3. Compressive strength (σbc) of Al-20IQCs with different hot pressing processes.
Compressive StrengthSintering Temperature20 min30 min60 min90 min
σbc (MPa)470 °C610 ± 1.2688 ± 0.2589 ± 0.8505 ± 1.1
490 °C654 ± 1.42790 ± 0.68615 ± 0.44530 ± 1.38
510 °C633 ± 0.5712 ± 0.8603 ± 0.6512 ± 0.83
Disclaimer/Publisher’s Note: The statements, opinions and data contained in all publications are solely those of the individual author(s) and contributor(s) and not of MDPI and/or the editor(s). MDPI and/or the editor(s) disclaim responsibility for any injury to people or property resulting from any ideas, methods, instructions or products referred to in the content.

