Article

Facile Synthesis and Characterization of TiO2/SnS Nanocomposites by Eco-Friendly Methods

by
Asta Bronusiene
,
Ricardas Kleinauskas
and
Ingrida Ancutiene
*
Department of Physical and Inorganic Chemistry, Kaunas University of Technology, Radvilenu Str. 19, LT-50254 Kaunas, Lithuania
*
Author to whom correspondence should be addressed.
Coatings 2024, 14(1), 88; https://doi.org/10.3390/coatings14010088
Submission received: 27 November 2023 / Revised: 5 January 2024 / Accepted: 7 January 2024 / Published: 8 January 2024
(This article belongs to the Section Thin Films)

Abstract

:
The acid etching mechanism of FTO film using zinc powders has been explored, and sulfuric and hydrochloric acid solutions of different concentrations were tested as etching agents. Compact and mesoporous films of titanium dioxide were prepared by spin-coating and doctor blade techniques on FTO glass. Tin sulfide films were formed through a successive ionic layer adsorption and reaction (SILAR) process using different numbers of deposition cycles, and TiO2/SnS nanocomposites were synthesized. The thin films and the prepared composites were characterized using X-ray diffraction, UV-Vis spectroscopy, scanning electron microscopy and energy-dispersive X-ray spectroscopy analyses. In this study, the principal characteristics of deposited tin sulfide films on two different types of TiO2 films are shown.

1. Introduction

Energy consumption is an urgent issue for the economic and social development of the world [1]. This consumption of fossil fuels spreads harmful greenhouse gases that cause global warming and a series of environmental damage [2]. In order to reduce the consumption of fossil fuels, it is very necessary to use more renewable energy sources. Therefore, energy storage technologies must also be developed. Electrochemical storage and conversion devices take an important place as promising alternatives for energy storage and renewable energy sources, and the search for efficient alternative energy sources is getting more attention nowadays [3]. One of the most effective methods for the storage and conversion of renewable energy is based on electrochemical technologies, and one of the examples is supercapacitors. Supercapacitors, as a type of electrochemical capacitors, are one of the most promising energy storage devices due to a lot of advantages, such as high-power density, long cycle life, low cost and fast charge-discharge processes [4]. In recent decades, tests have been performed to enhance the specific capacitance values by the use of nanoscience and nanotechnology fields. Nevertheless, tin-based chalcogenides (such as SnS, SnS2, SnSe, etc.) have received more attention for application as supercapacitor materials. These layered structure materials were also explored as light absorbers in solar cells, photodetectors, etc.
Transparent conducting glasses, including FTO (fluorine-doped SnO2) and ITO (In2O3/SnO2), having high electrical conductivity, transparency, and thermal stability, have been intensively used in information displays (liquid crystal displays, plasma displays, touch panels, etc.) [5], solar cells [6,7], electrochromic devices [8], sensors [9,10], etc. To increase the realization of transparent conducting glasses in these applications, many experiments have been performed to make a porous structure in the conductive layer to increase the surface area and, at the same time, maintain high electrical conductivity and transparency. By optimizing the reaction parameters, the pores on the transparent conducting glasses can be obtained with a size ranging from several to a couple of hundred nanometers [11].
In recent studies, metal oxide semiconductors such as titanium dioxide have been characterized due to safety to the environment and a high specific capacity of 336 mAh/g. They also take a potential functional place toward lithium-ion battery anode materials [12,13]. However, TiO2 has some limitations for its photocatalytic performance. Furthermore, TiO2 has been used in the solar energy field, but one limiting factor was the ultraviolet (UV) light activator due to its wide bandgap of 3.2 eV [14]. Thus, photoexcitation is highly dependent on ultraviolet irradiation, which is only 4%–5% in the solar spectrum, while visible light counts for 40% [15]. Another reason for the reduced photocatalytic activity of TiO2 is the high recombination rate of photogenerated electrons and holes during the photocatalytic reaction [16]. To extend the response to visible light, modification methods such as metal deposition, ion doping, semiconductor coupling, etc., could be applied [17]. TiO2 is considered to be a promising candidate for hydrogen production, photocatalysts, solar cells, and gas detection [18]. A combination of TiO2 nanoparticles with a small bandgap semiconductor is an effective way to extend the absorption range to the visible light region, subsequently enhancing its photoelectrochemical (PEC) properties [13]. Tin sulfide is a suitable candidate, having a direct energy of 1.3 eV, which is close to the optimal value required for efficient optical absorption [18]. Moreover, tin sulfide possesses excellent properties, such as high absorption in the visible range, little toxicity, and inexpensiveness, which make it a photocatalyst of interest [19]. The p-type SnS semiconductor is being studied as a promising candidate for contact with the n-type TiO2 semiconductor due to the additive pathway associated with p-n junction formation, which can promote efficient separation of electron–hole (e−/h+) pairs and enhanced light absorption. Direct deposition of p-SnS nanoparticles onto the TiO2 surface poses a challenge in finding a new approach to creating SnS/TiO2 composites [20]. Hybrid solid-state solar cells, especially those based on TiO2, have become an object of increased interest for the creation of a new generation of photovoltaic devices, and their efficiency has exceeded 21% [21]. Compact TiO2 layer as a blocking layer, mesoporous TiO2 layer as an electron transport layer, and SnS layer as an absorber layer are used to fabricate solar cells [22].
The aim of this study was to form TiO2/SnS nanocomposites as thin films on FTO glass slides and to characterize the deposited tin sulfide films on the compact and mesoporous TiO2 films prepared using spin-coating and doctor blade techniques. Titanium dioxide is used as a buffer layer for SnS in photovoltaic applications. For the synthesis of SnS in the present work, the environmentally friendly SILAR method and aqueous solutions were used, as well as L-ascorbic acid as a capping agent. Morphology, structural, compositional, and optical properties of prepared thin films were investigated using X-ray diffraction (XRD), scanning electron microscopy coupled with energy-dispersive X-ray spectroscopy (SEM/EDX), and UV-Vis spectroscopy (UV-Vis) analyses.

2. Materials and Methods

FTO TEC 10 (20 mm × 15 mm, sheet resistance of 9.38 Ω) glass slides were used as substrates which were provided from Ossila.com. Hydrochloric acid, sulfuric acid, acetone and ethanol were delivered from Eurochemicals, while zinc powders, titanium paste, titanium diisopropoxide and L-ascorbic acid were delivered from Sigma Aldrich, Bellefonte, PA, USA. SnCl2·2H2O was supplied from Labochema, and Na2S·9H2O was acquired from Honeywell.com.
FTO etching. Before FTO etching, all substrates were washed with liquid soap and rinsed with flowing and distilled water. To remove residual contaminant, ultrasonic cleaning with acetone was applied for 10 min at 45 °C. After ultrasonic cleaning, substrates were rinsed with distilled water and dried. To ensure repeatability and stability of the etching in ambient atmosphere, all etching procedures were carried out with fresh solutions [23]. The FTO etching process is trickier since FTO cannot be reduced to metal by using hydrogen ions in a strong acid solution, so zinc metal powders are used as a catalyst [24]. Subsequently, the zinc powders were mashed and then covered on the part of the FTO glass slides, followed by HCl or H2SO4 solution while the reaction ended. After etching, all samples were washed with liquid soap, rinsed with distilled water and dried at 100 °C.
Compact plus mesoporous TiO2 films on FTO glass. Depending on the techniques of film formation, TiO2 exhibits different structural and optical properties. A compact TiO2 film with a dense and uniform surface is formed using organic titanium compounds, and a mesoporous film containing nanoparticles with a high specific surface area is prepared using a TiO2 nanoparticle precursor. Immediately after etching and cleaning, the FTO substrates were transferred to a hot plate and quickly warmed up to 500 °C. The substrates were left for 15 min at 500 °C before depositing a compact TiO2 (c-TiO2) film using the spin-coating method. A solution for spin-coating consisted of 0.07 mL titanium diisopropoxide added to 0.5 mL of ethanol and 0.007 mL of concentrated HCl added to 0.5 mL of ethanol. Then, both prepared solutions were mixed, and the mixture was shaken. A compact TiO2 film was fabricated by spin-coating the above dispersion on FTO substrates using a speed of 2000 rpm/s and an acceleration of 10 s. Immediately after spinning, the film was continuously dried at a temperature of 150 °C for 15 min, at 300 °C for 20 min, and at 500 °C for 20 min [25].
To prepare a mesoporous TiO2 (m-TiO2) film, 0.15 g of titanium dioxide paste diluted in 1 mL of dry ethanol was used. The obtained dispersion was stirred overnight before the use. A mesofilm of TiO2 was fabricated using spin-coating or doctor blade methods. The above dispersion on the compact-TiO2/FTO substrate was used by spin-coating at a speed of 5000 rpm/s and an acceleration of 20 s.
Thin tin sulfide films were deposited applying 30 SILAR deposition cycles as in the previous paper [26]. All procedures for the preparation of samples are given in Figure 1.
Film thickness. A MarSurf WS1 (Göttingen, Germany) white light interferometer was used to measure the thickness of the film. First, on the prepared sample, a line was scratched diagonally in order to seek FTO glass, and then a picture of the sample surface was recorded. A point measurement system was used. The heights between the FTO glass and the deposited film were measured, and this process was repeated 15 times in different parts of the film to measure the thickness precisely. Then, the average thicknesses were calculated.
X-ray diffraction analysis. X-ray diffraction analysis of the deposited titanium dioxide and tin sulfide films on the FTO glass substrate was carried out by using a D8 Advance diffractometer (Bruker AXS, Karlsruhe, Germany) operating at a tube voltage of 40 kV and a tube current of 40 mA. Diffraction patterns were obtained in a Bragg–Brentano geometry using a quick counting 1-dimensional detector Bruker LynxEye, which is based on the silicon strip technology. A 0.02 mm Ni filter was applied to filter the X-ray and inhibit Cu-Kβ radiation. The examples were tested in the range of 2θ = 5–70°. The scanning speed was 6°/min, and the coupled two theta/theta scan type was used. The diffractometer was involved with the software package DIFFRAC.SUITE (Diffract. EVA. v. 4.5, Bruker AXS, Karlsruhe, Germany). X-ray diffractograms of the deposited films were written using the Search Match software package Crystallographica Search Match v.2.1.
Scanning electron microscopy and electron dispersive X-ray analysis. The surface morphology of TiO2 and SnS films was analyzed by scanning electron microscopy (SEM, Hitachi S-3400N, Chiyoda, Tokyo, Japan). EDX imaging of the samples was carried out using QUANTAX EDS with X-Flash Detector 3001 (Bruker AXS Microanalysis GmbH, Berlin, Germany) and ESPRIT 1.9 software was installed.
UV-Vis characterization. The optical properties were studied by ultraviolet-visible (UV-Vis) light spectroscopy. The optical absorption spectra were recorded by using a PerkinElmer Lambda 35 UV-Vis Spectrometer (SpectraLab, Alexandria, VA, USA) featuring the Labsphere RSA-PE-20 Diffuse Reflectance Sphere. The recording range was 200–900 nm. The bandgap (Eg) was calculated using Tauc’s plot [27]. Tauc’s plot is based on the theory that the energy-dependent absorption coefficient α can be obtained by the following Equation (1):
αhν = B(hν − Eg)n
where the value of the exponent n marks the nature of the sample transition:
n = 2 marks indirect allowed transition, n = 1/2 marks direct allowed transition, n = 3/2 marks direct forbidden transition, and n = 3 marks indirect forbidden transition;
α—absorption coefficient; h—Planck constant; ν—photon’s frequency; Eg—bandgap energy; B—constant related to absorption;
α = (ln10∙A)/d
where: A—absorption; d—layer thickness.
The linear format of the graph indicates the transition type. It is obtained by plotting the graph between (αhν)n versus the photon energy (hν) and then extrapolating the linear part of the plot until it crosses the abscissa axis. Consequently, Eg = hν, when A = 0.

3. Results and Discussion

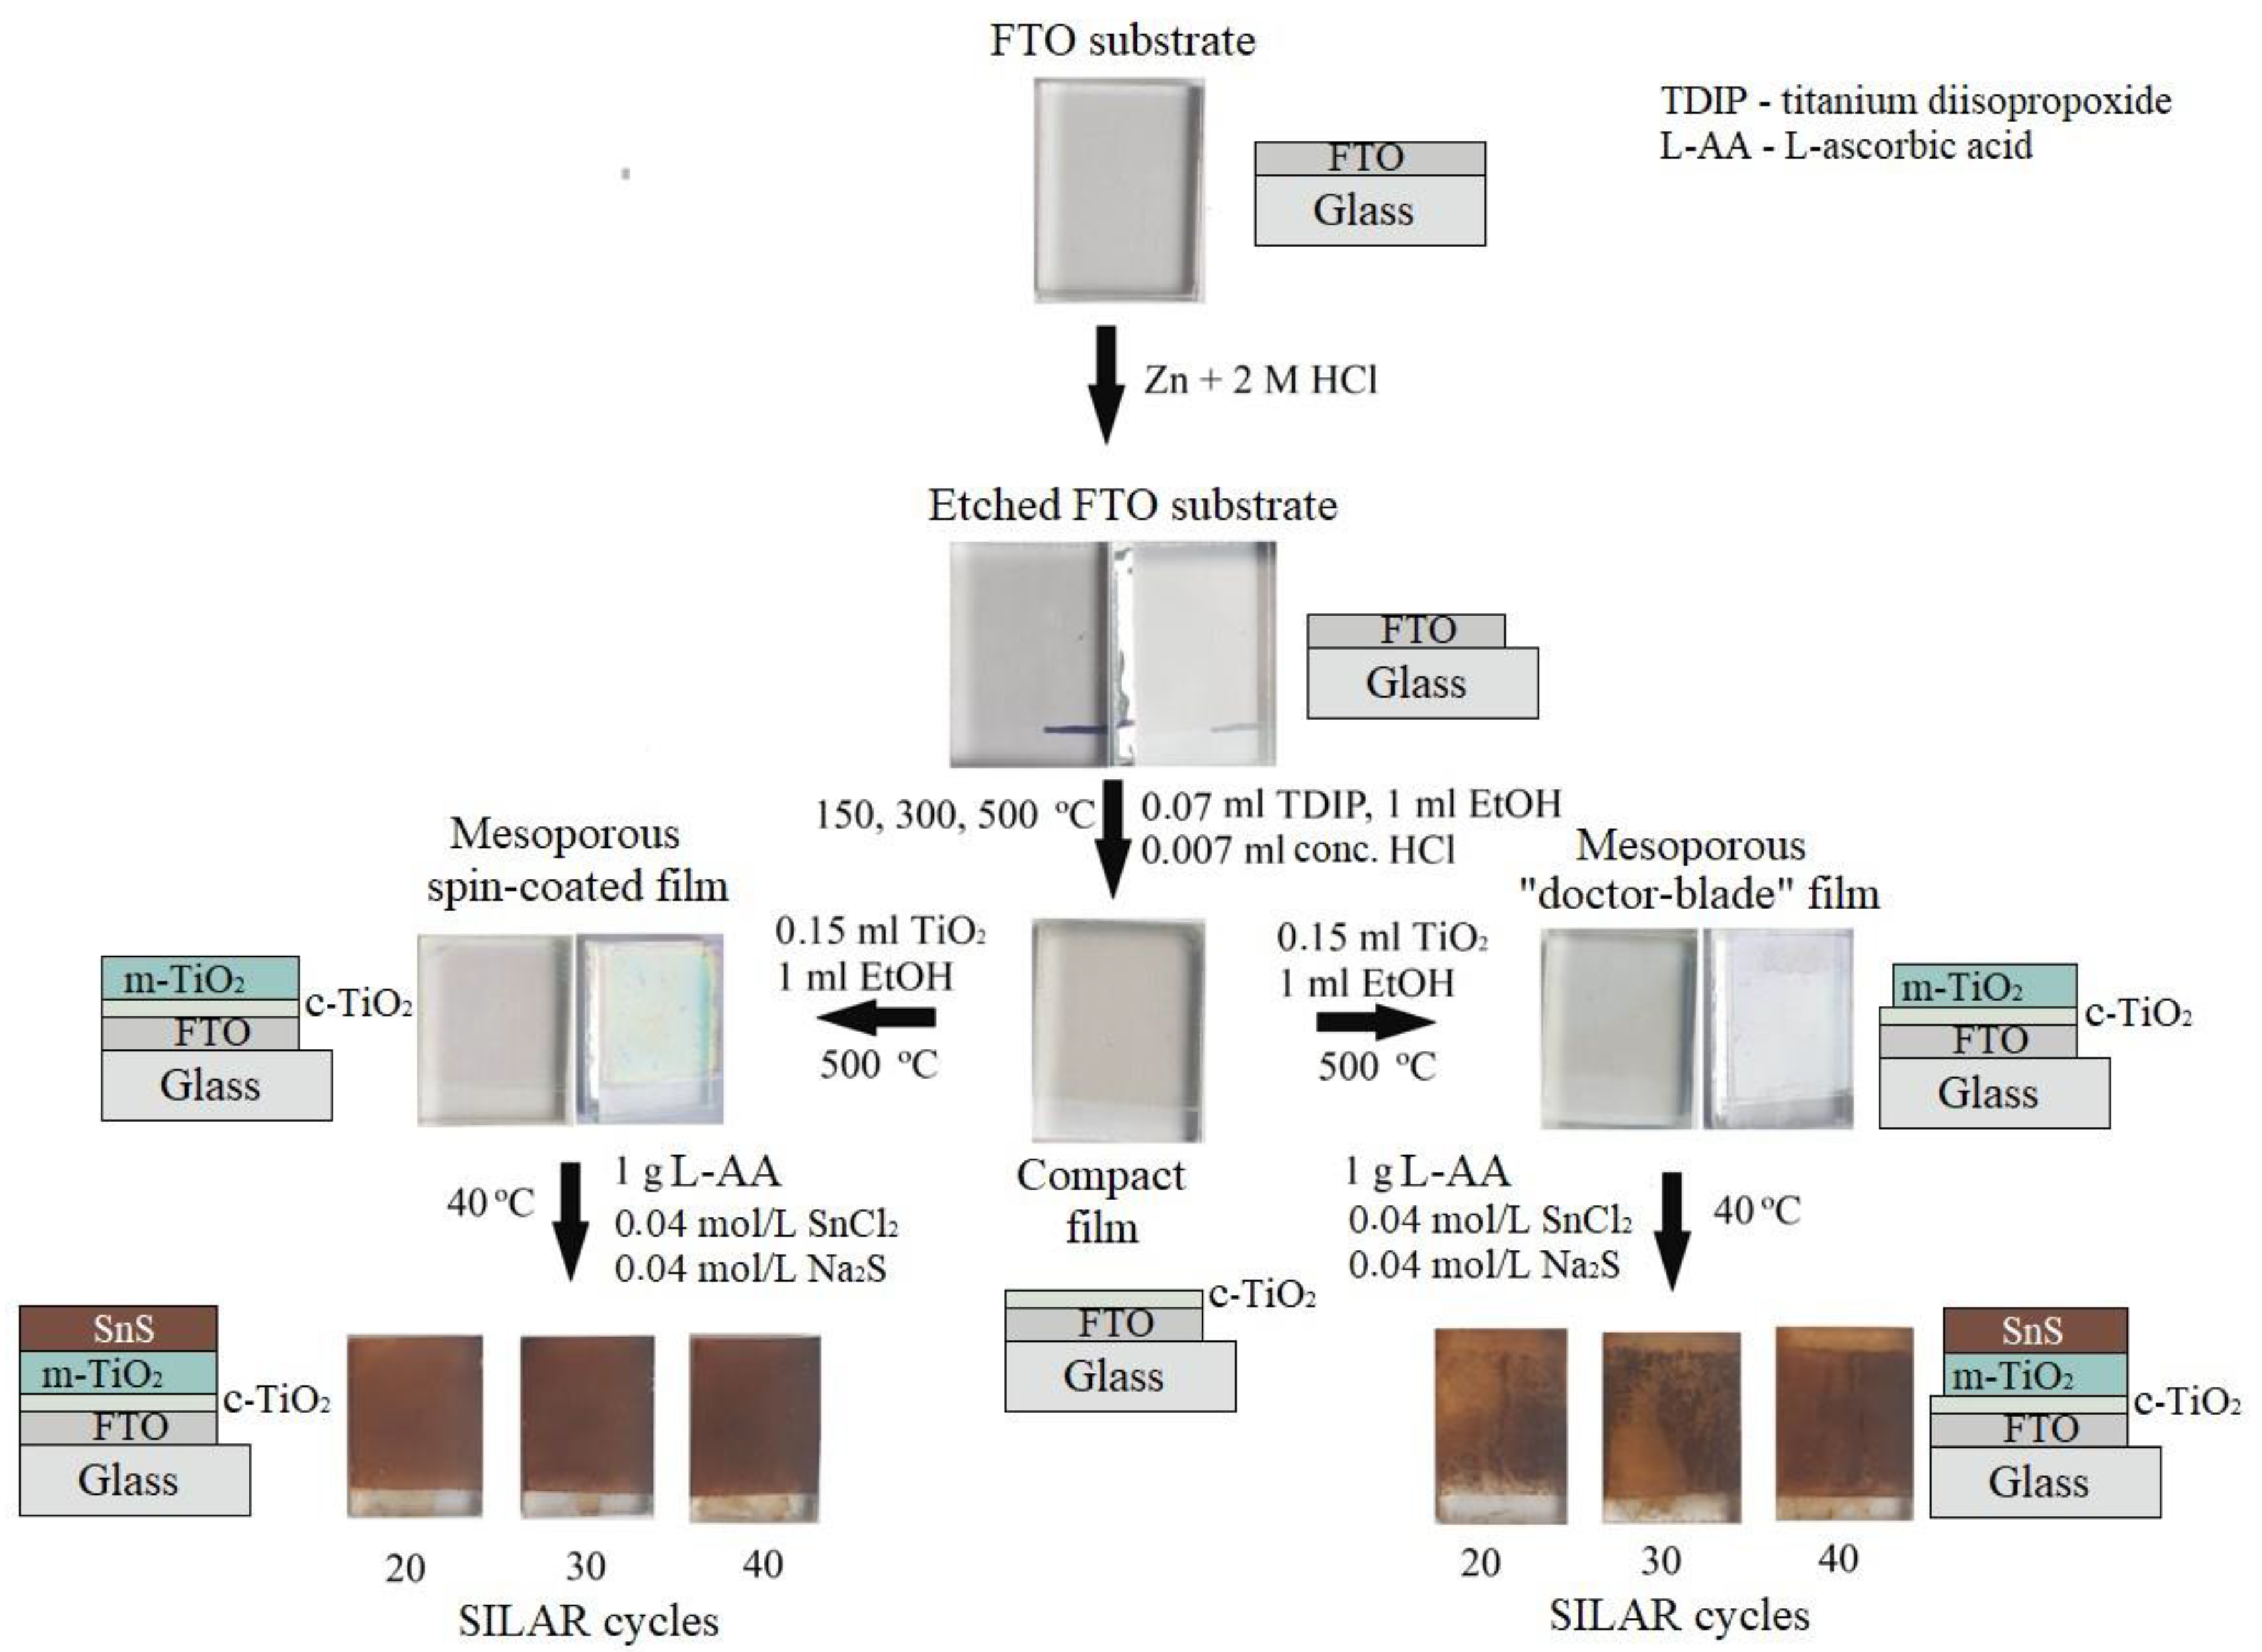
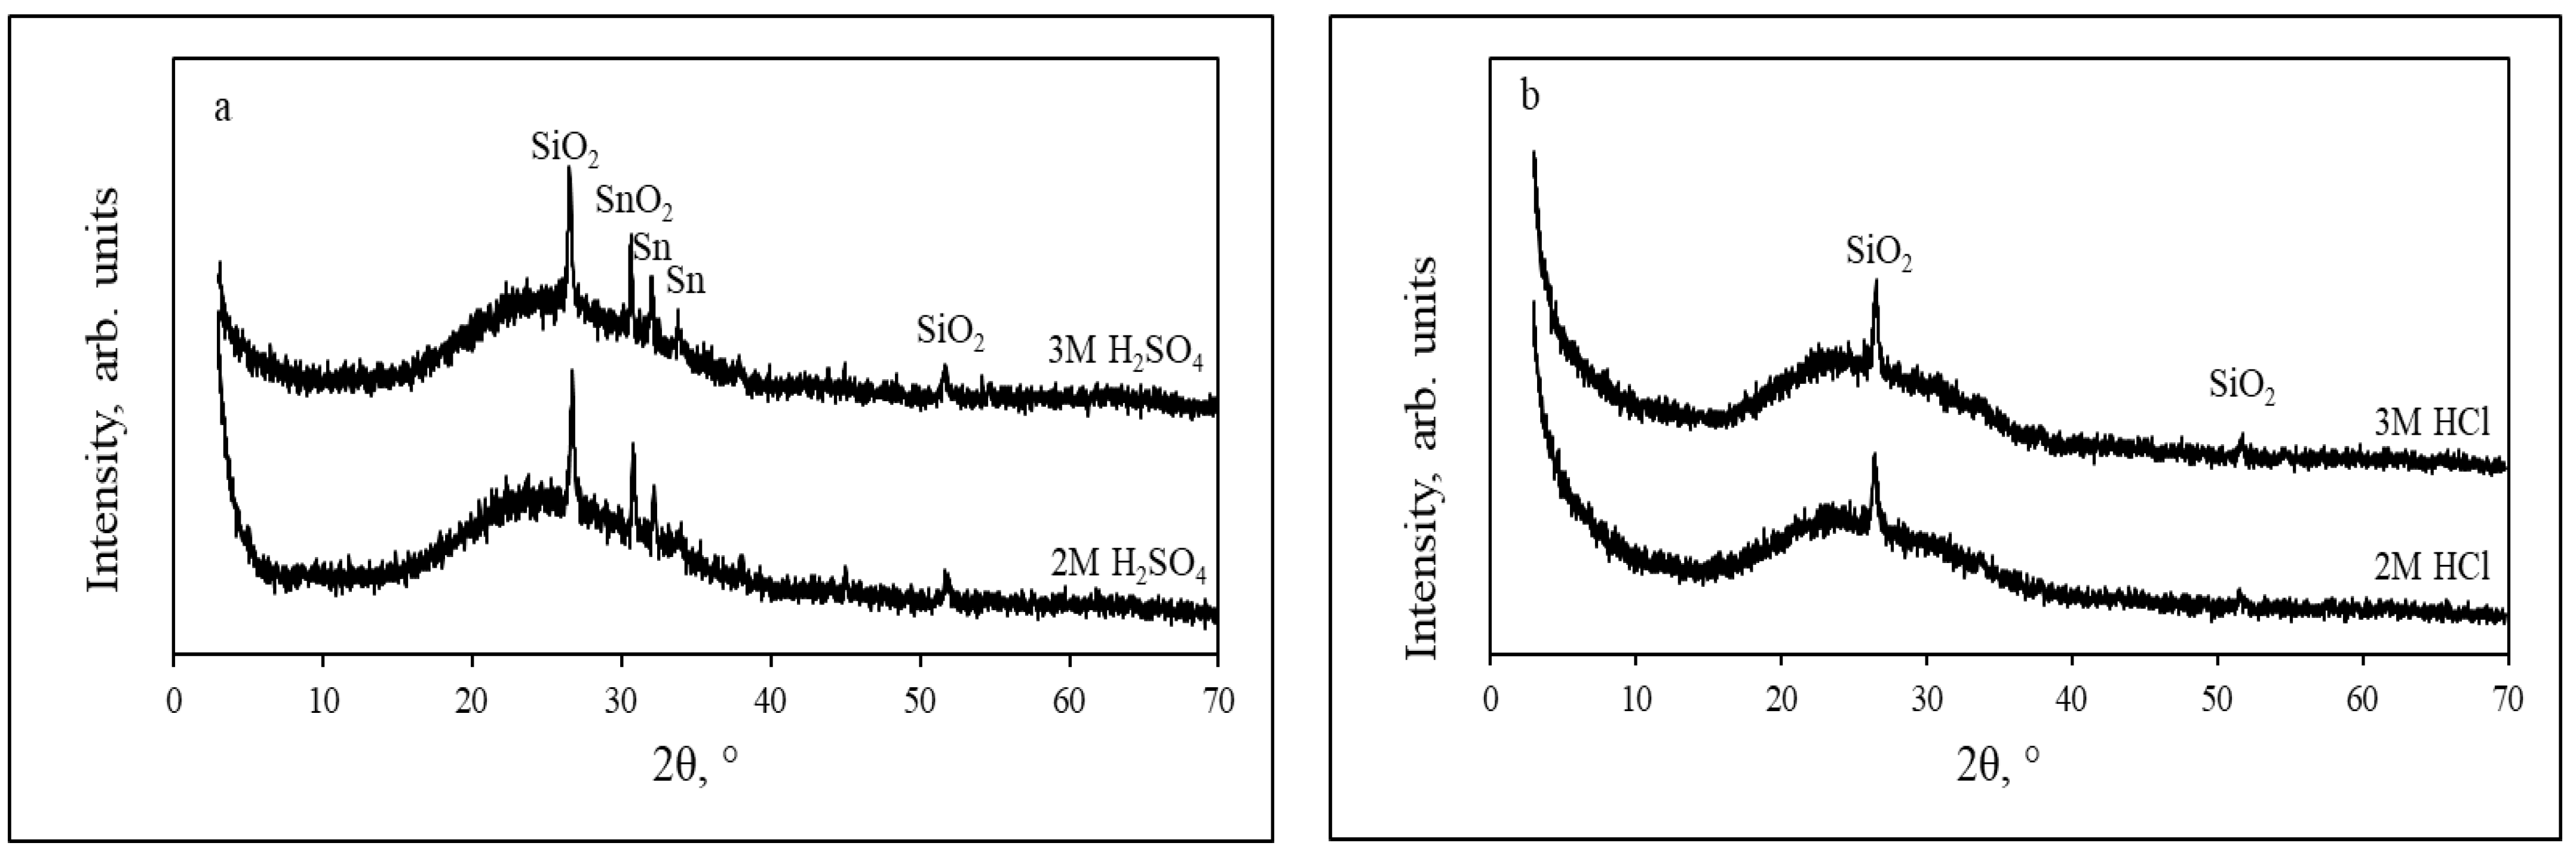
3.1. Etching of FTO Glass Substrates

The etching procedure was done in order to prepare a nonconductive and porous substrate with macro- and mesopores. This method can increase charge transfer [7]. Hydrochloric acid or sulfuric acid with zinc powder were used for the etching, and after the etching procedure, the FTO substrate became nonconductive. The FTO glass samples were etched using the solution of 2 M and 3 M hydrochloric or sulfuric acids. From the results obtained, it can be seen that hydrochloric acid was more suitable for etching, resulting in clear and transparent glass, while sulfuric acid resulted in the formation of gray residue on the glass substrate.
A mixture of HCl and Zn precursor is a good combination to clearly seen bubbles of H2. It means that H+ ions are formed, and they are needed to activate the SnO2 etching reaction [28]. Compared to the reaction of zinc powders and HCl, the reaction between SnO2 and H+ is mild [11,29]. Obviously, both the FTO etching procedures and preparation are supernatant. Controversially, the kinetics of the reaction between Zn and HCl should be opposite to the reaction between SnO2 and H+, at the same time enhancing the FTO etching procedure. The etching mechanism is given in Figure 2.
In order to investigate the surface composition of etched FTO glass slides, XRD measurements were done. The etching with sulfuric acid (Figure 3a) led to the detection of grey residues that are assigned to elemental tin (JCPDS card number 4-673) and can be formed due to the reduction of Sn4+ and Sn2+ [30]. The formation of elemental tin marks peaks at 2θ = 32.24 and 33.96°. The sulfuric acid concentration is probably low, so elemental tin could form [11]. The peaks at 2θ = 26.69, 30.71 and 45.01° are assigned to SiO2 (JCPDS card number 80-2148). Furthermore, the peak at 2θ = 51.78° is assigned to SnO2 (JCPDS card number 41-1445), which shows that tin dioxide remains on the substrate after etching. In Figure 3b, it can be seen that after etching with hydrochloric acid, only two peaks of SiO2 at 2θ = 26.41 and 51.69° were detected in the samples. The results obtained show that the surface composition does not depend on the concentration of the acid used, so for further studies, we considered using 2M hydrochloric acid as the etching agent.

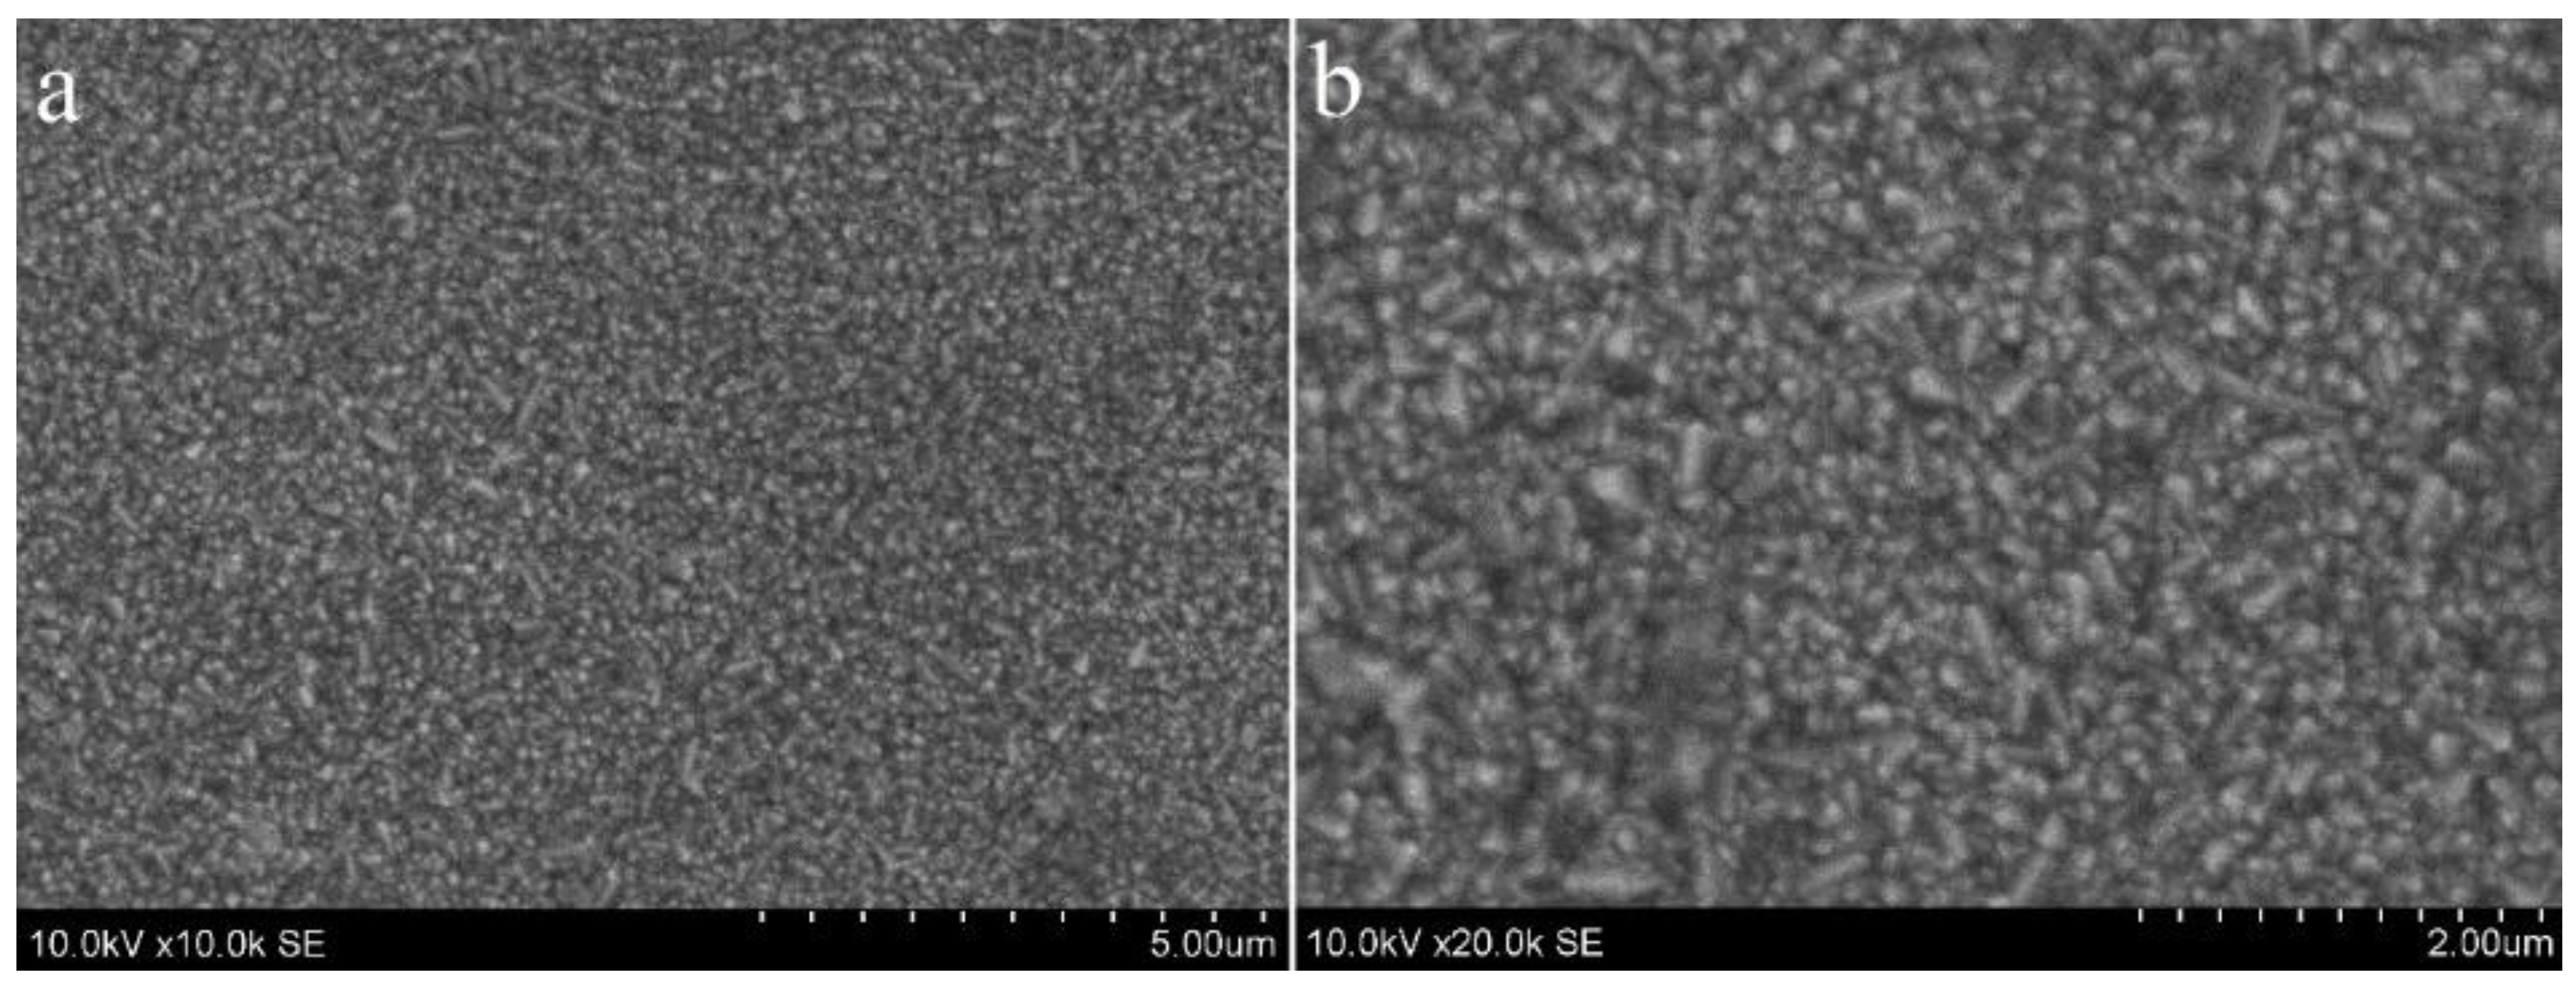
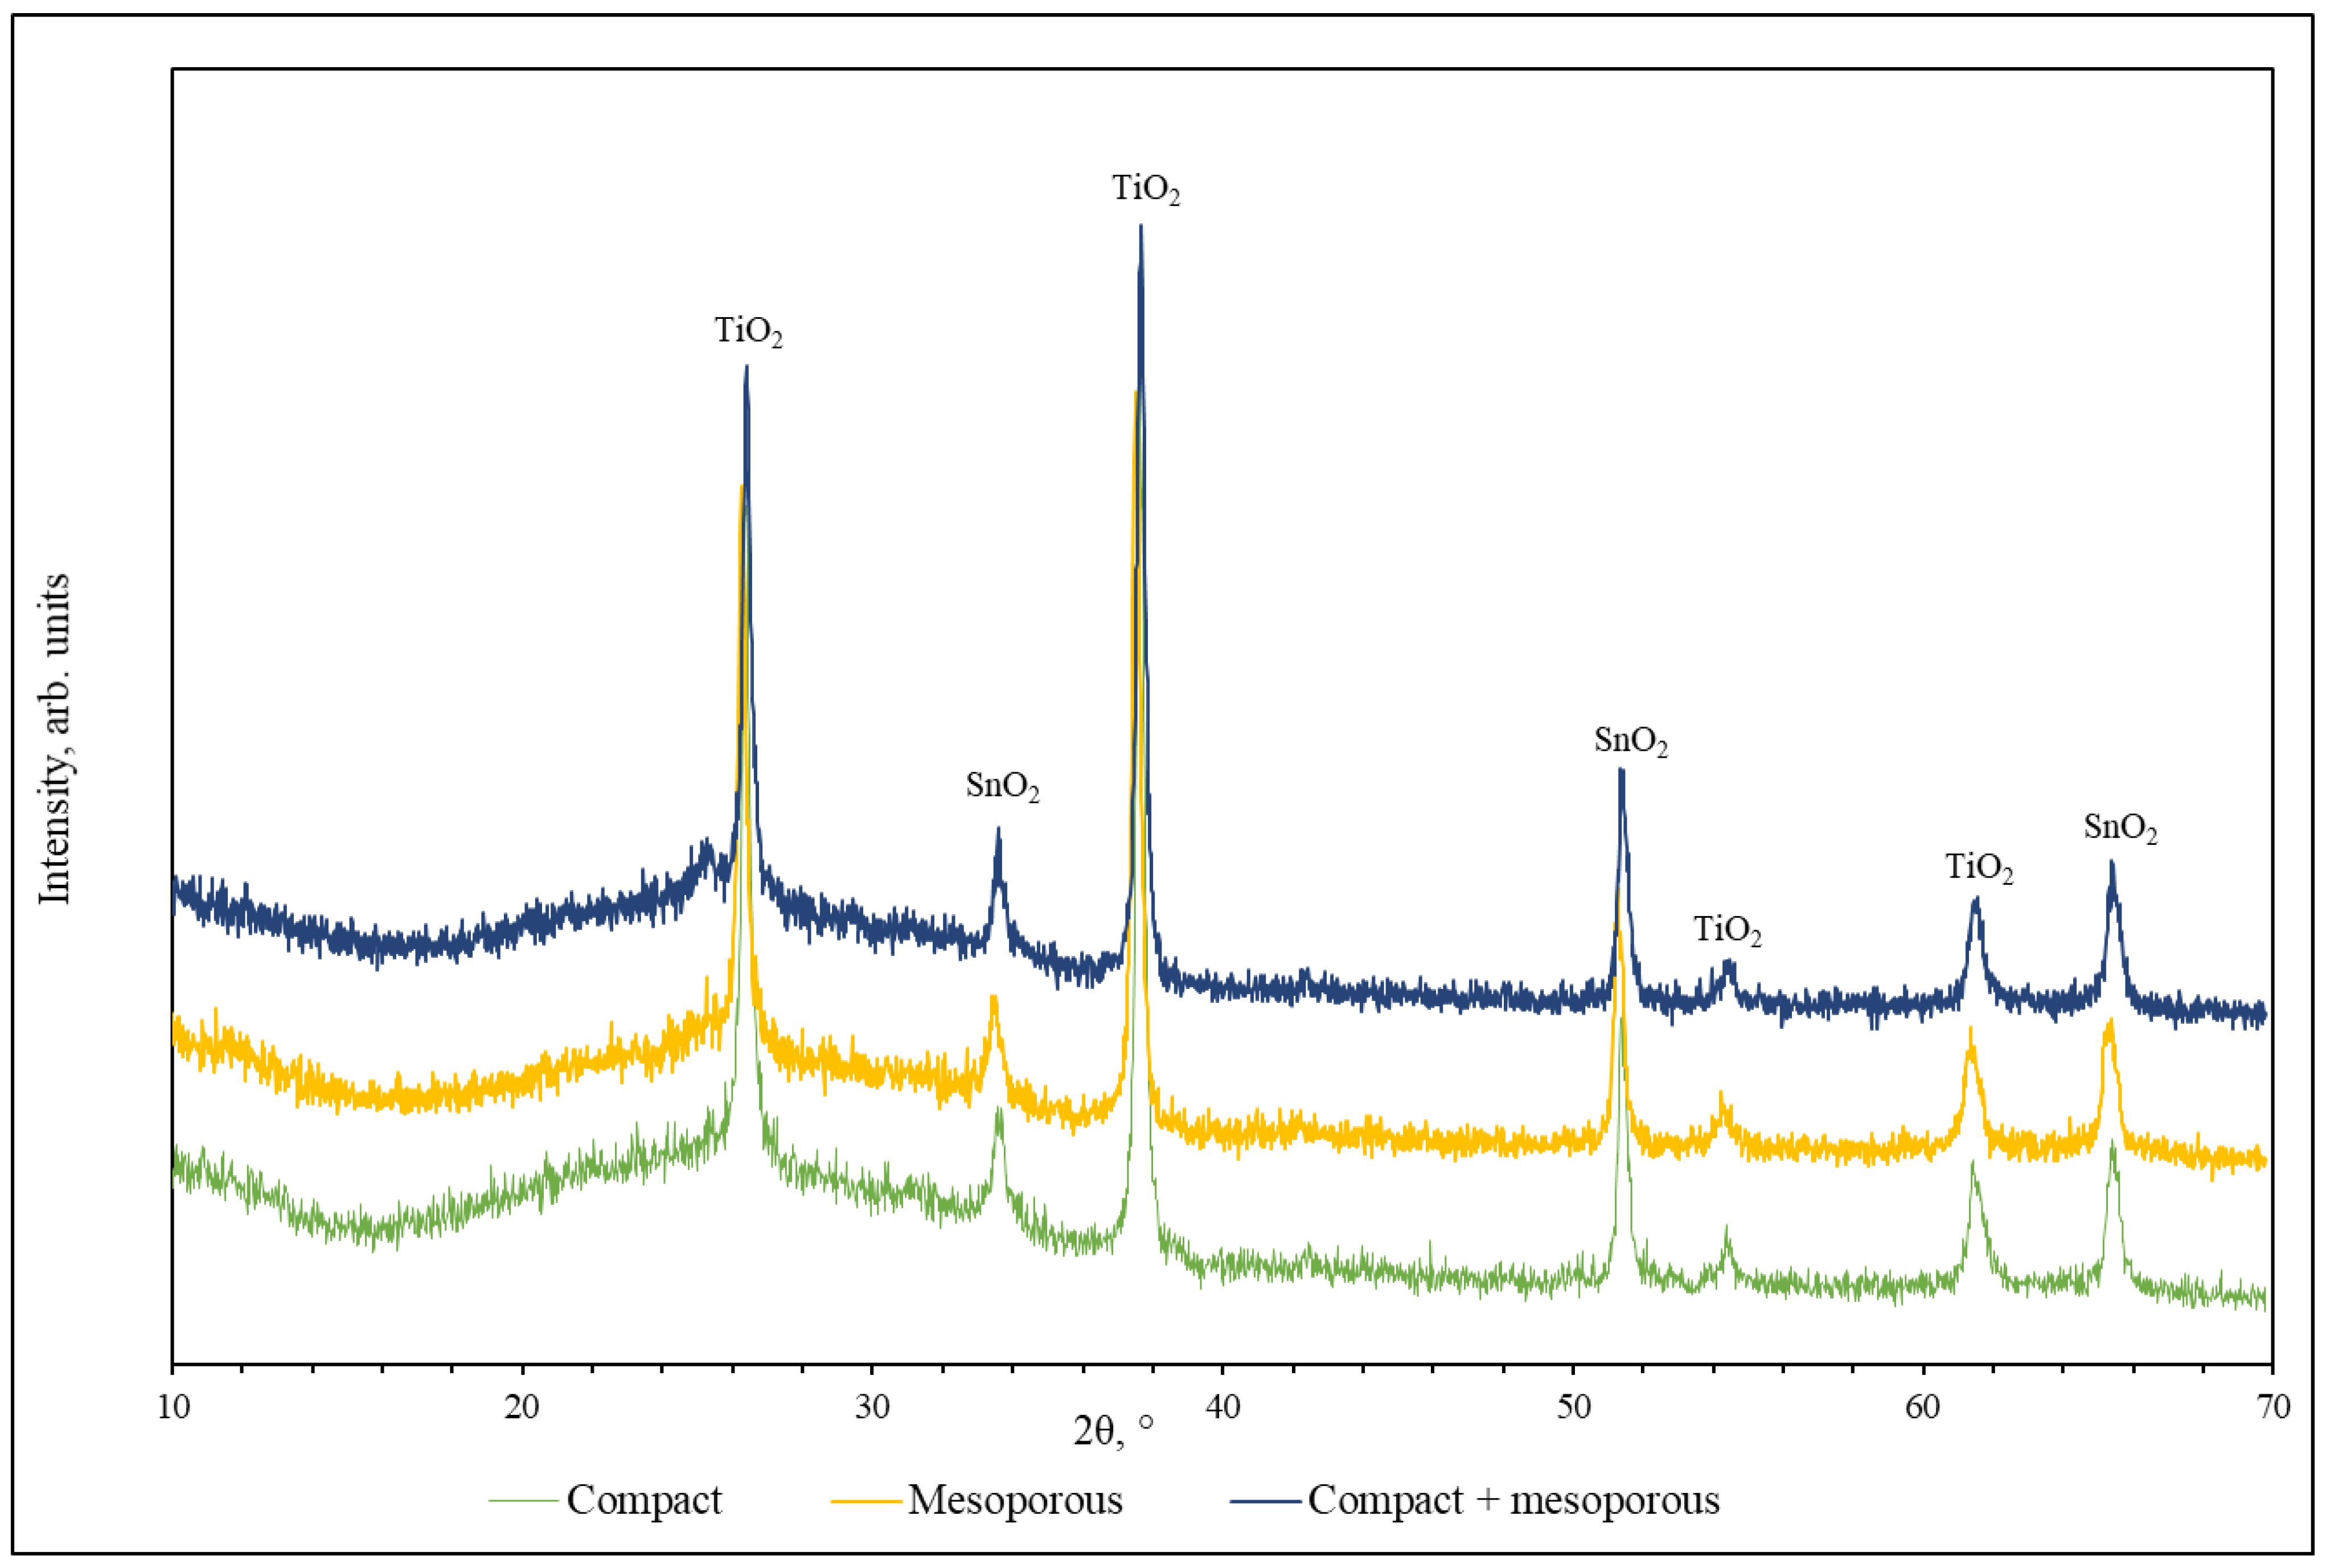
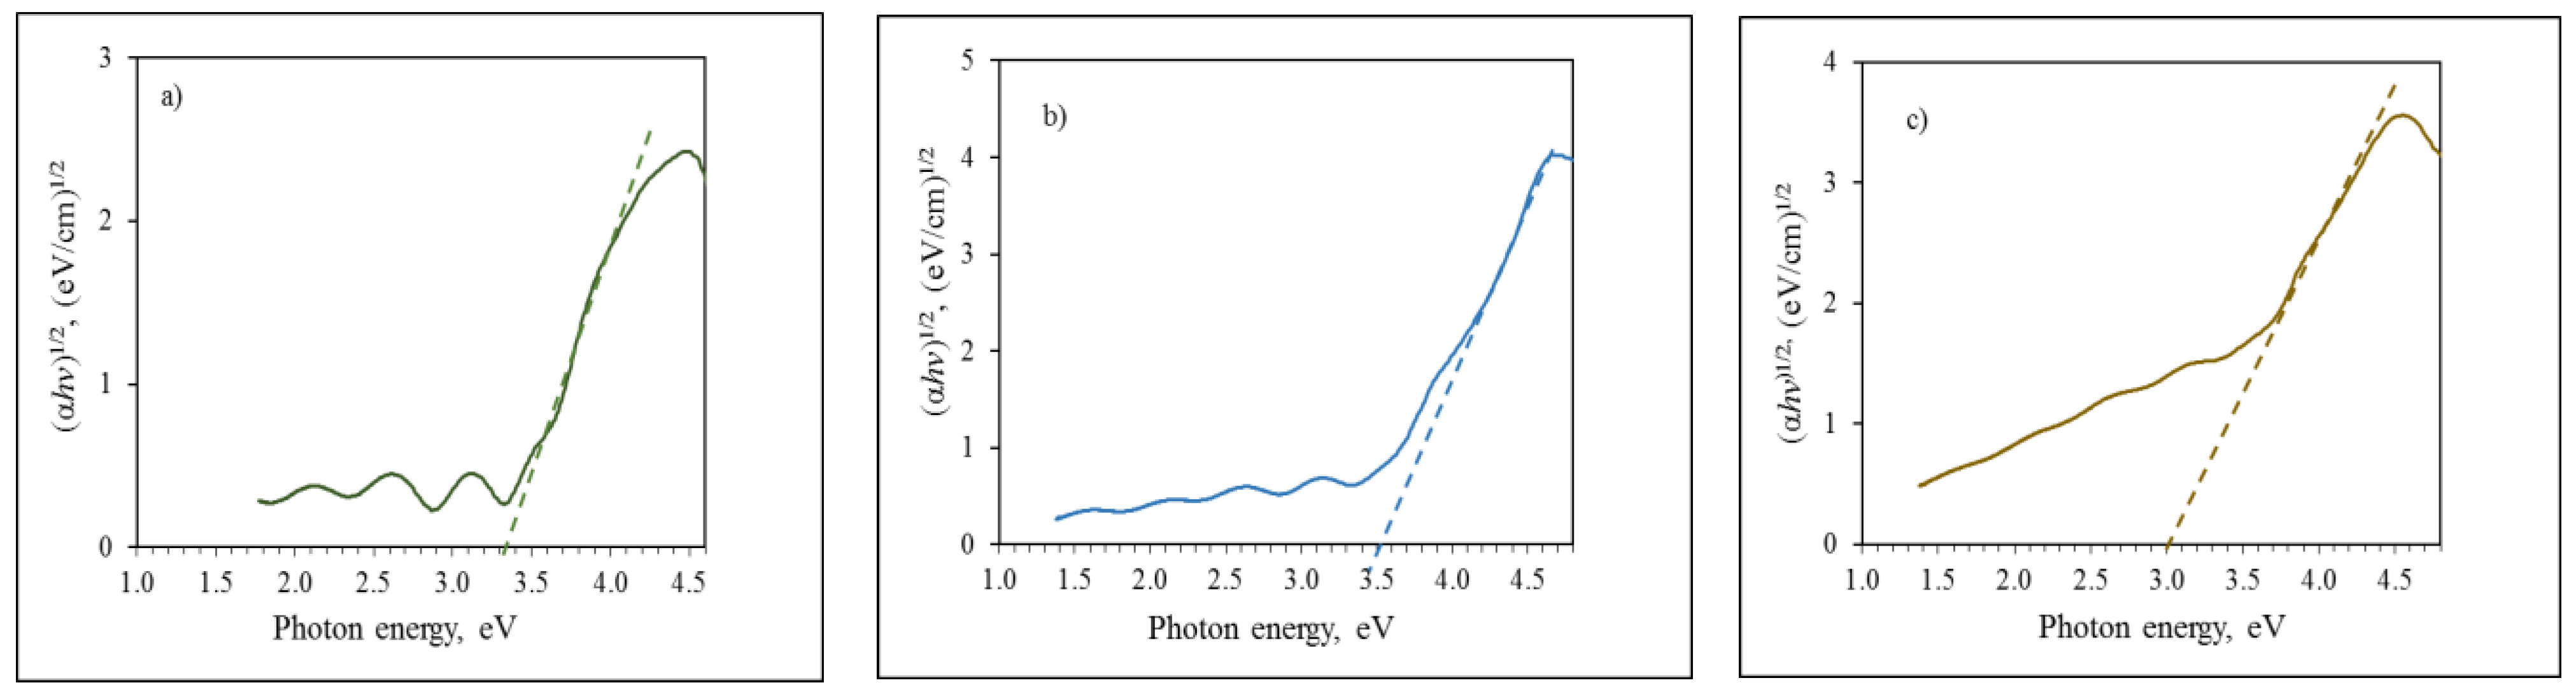
3.2. Compact and Mesoporous TiO2 Films

Scanning electron microscopy images in the top view of compact TiO2 film deposited on the etched FTO glass slide are shown in Figure 4. This picture illustrates that smooth film with compactly packed spherical grains with a size of 0.1–0.2 μm on the surface is formed [31]. The surface consists of well-defined grains of shape and size depending on TiO2 deposition route. Despite the distribution, the FTO glass substrate was well coated with TiO2 particles.
Data in Figure 5 represent SEM images of mesoporous TiO2 films obtained using the spin-coating technique. The surface of mesoporous TiO2 film is quite similar to compact film. The high-magnification SEM image (Figure 5b) shows microcracks along with TiO2 nanoparticles. Microcracks could appear on the surface due to different thermal expansion coefficients between the substrate and the deposited material [32]. Summarizing the results, it could be said that the surfaces of compact and mesoporous TiO2 films formed using the spin-coating method are quite similar to each other.
A structure of mesoporous TiO2 films deposited using the doctor blade method is shown in Figure 6. Here, the sample has randomly connected pores in their structures and lacks apparent order in the pore arrangement. In addition, the agglomeration of monodispersed TiO2 particles can be clearly seen in the SEM image with higher magnification. Suppose that close-packed agglomeration of uniform nanoparticles causes the mesoporous structure, which shows even the monodispersity of the mesopores. This growth of nanoparticles builds narrow channels that may serve as electronic injections or membranes [33].
The thickness of the mesoporous TiO2 film is one characteristic point for the composition of the active layer and improves the conversion efficiency of solar cells [34]. Generally, the thickness of TiO2 film has an important place in morphology, porosity, and composition [35]. The surfaces formed using the spin-coating technique have a few small holes formed due to atmospheric dust [36]. These samples had less dust allocated on the surface. In addition, dust could appear due to changes in annealing temperature [37]. The thickness was measured 15 times in different parts of the film. The compact TiO2 film was smooth with a thickness between 0.02 and 0.04 μm. The thickness of the mesoporous film formed using the spin-coating method was between 0.15 and 0.21 μm. Using the doctor blade method for the deposition of mesoporous TiO2 film, the obtained films were transparent but much thicker (0.45–0.52 μm) than those deposited using the spin-coating technique. The thickness can be derived by the concentration of the solution, the size of the gap between the blade and the substrate and the speed of the coating [37,38,39]. The thickness of the samples prepared using both methods (compact film by spin-coating and mesoporous by doctor blade method) was 0.3–0.4 μm.
XRD measurements were performed to investigate the structural characteristics and phase composition of the samples. Figure 7 represents X-ray diffractograms of titanium dioxide deposited on the FTO glass slides. It can be seen that in all samples, there are anatase peaks at 2θ = 25.76; 37.73 and 54.49° (JCPDS card no 76-1939) and rutile peak at 2θ = 61.55° (JCPDS card no 84-1285) for TiO2. Some peaks have similar intensity, and no phase changes were observed when the deposition route was changed. The existence of a rutile phase in the films was suggested to appear due to the epitaxial force between TiO2 and FTO [40]. In addition, the absence of more anatase and rutile peaks also indicates the epitaxial growth of TiO2 particles [39,40]. Peaks at 2θ = 33.66; 51.48 and 65.43° mark the existence of SnO2 (JCPDS card no 41-1445). This phase could be fixed due to very thin TiO2 films [41,42].
TiO2 is assigned to wide bandgap polymorphs and there are three common polymorphs: rutile, anatase and brookite [43]. The average bandgap of rutile is close to 3 eV, while brookite and anatase have a higher bandgap of 3.3–3.5 eV [42,43]. The optical bandgap energy of the TiO2 films was calculated using the Tauc plot. The calculation is briefly characterized in Materials and Methods. The plots of (αhϑ)2 versus the photon energy hϑ were used to calculate the bandgap energy of the films. The extrapolated linear part of the plot where (αhϑ)2 = 0 until it crosses the photon energy axis (A = 0), there Eg = hϑ [26]. The value n = 1/2 shows an indirect transition type. The calculated plots are given in Figure 8. The data obtained illustrate that the optical bandgap energies of TiO2 films prepared using different methods are 3.3; 3.4 and 3 eV. The bandgap values of TiO2 films are close to the theoretical values of TiO2 [43,44] because titanium dioxide has a bandgap value of 3.2 eV [18,45,46] or 3.0 eV [47]. Such bandgaps were probably due to the presence of rutile (3.0 eV) and anatase (3.2 eV) phases in TiO2 films, and this is consistent with the XRD results [47]. The bandgap of TiO2 film prepared using the doctor blade method is a little bit lower. This can be explained by the thickness of the film since as the film thickness increases, the bandgap decreases [43].

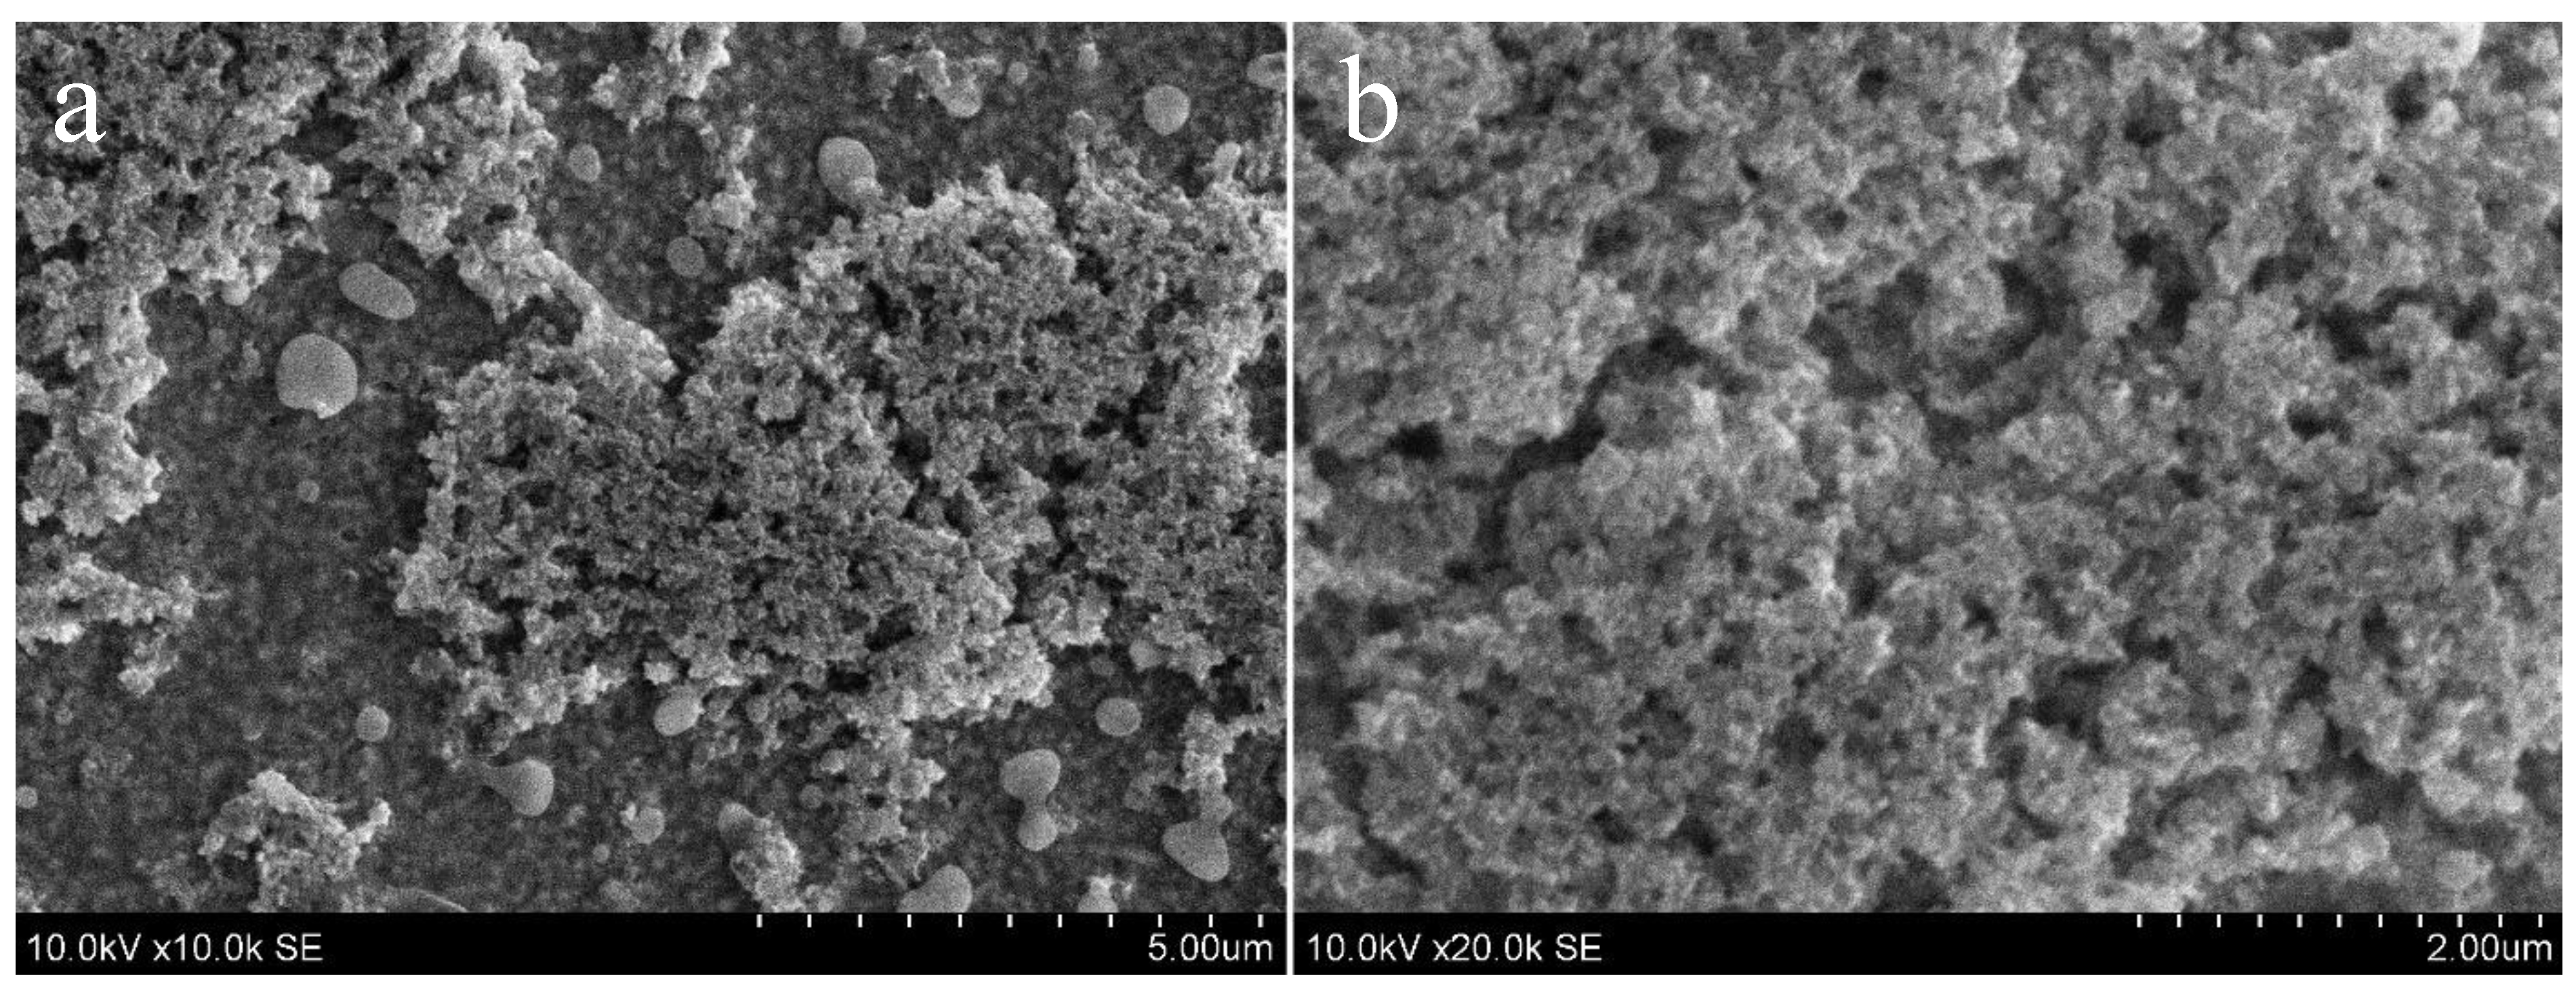
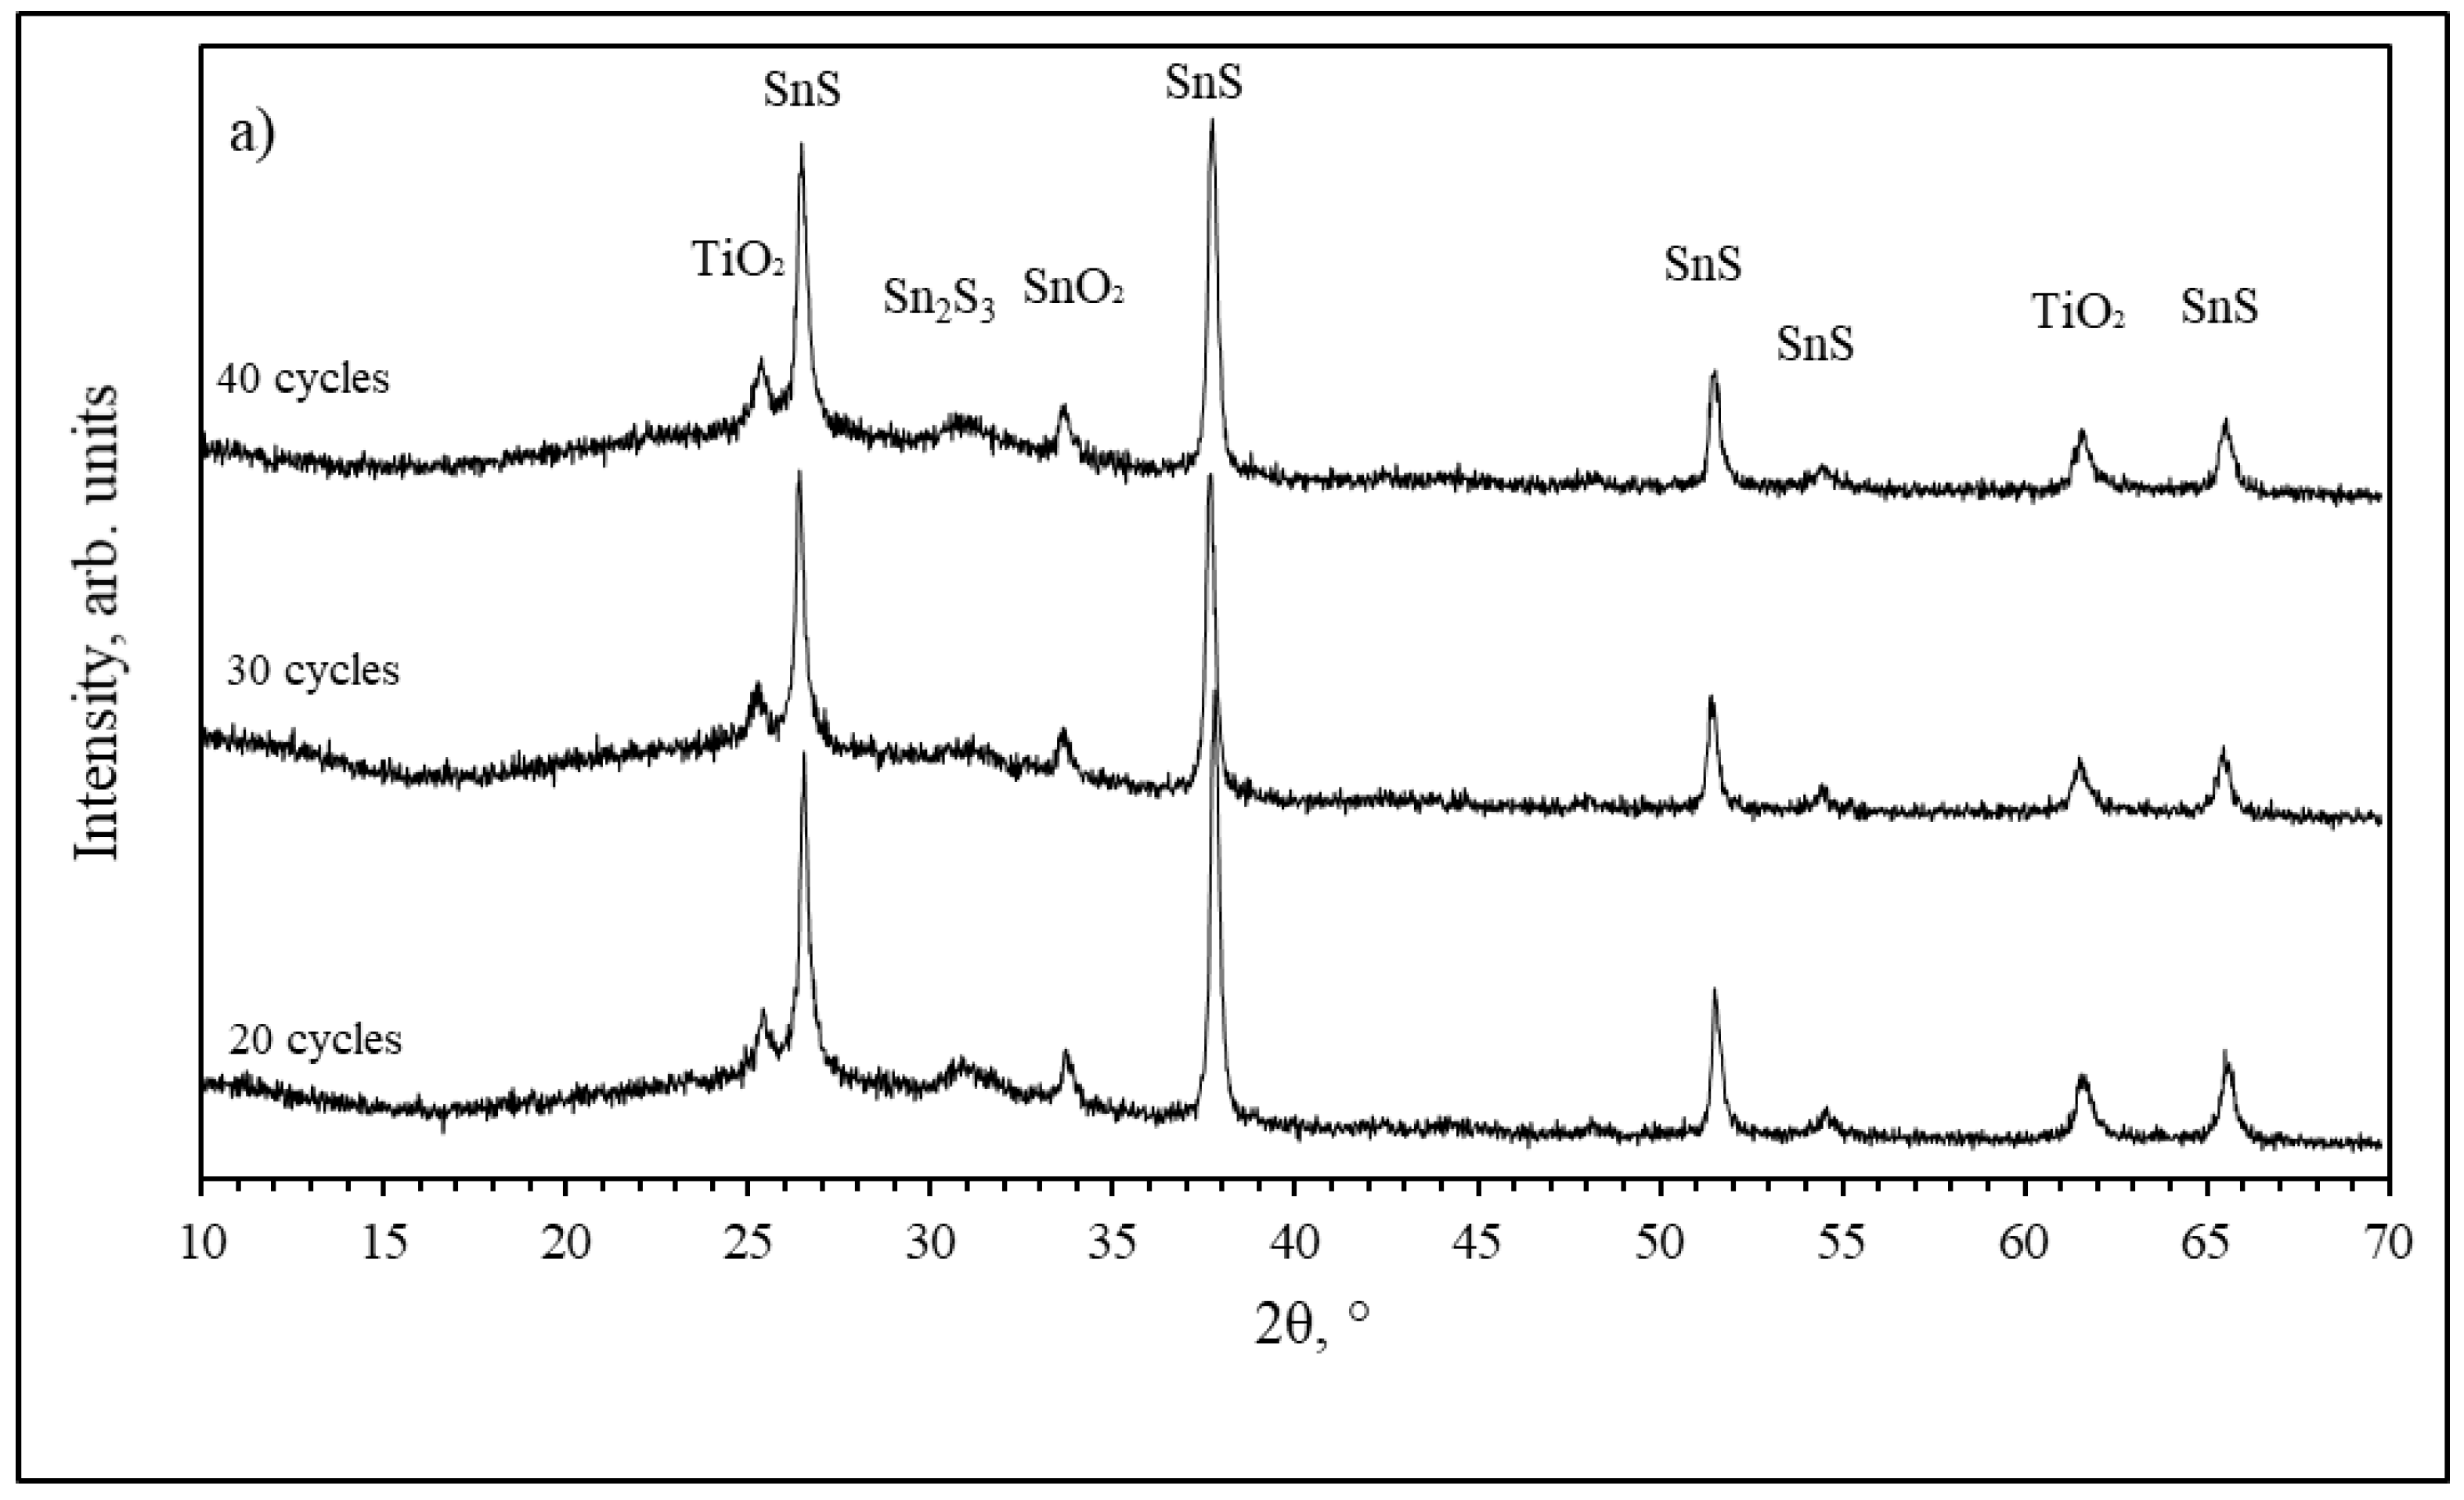
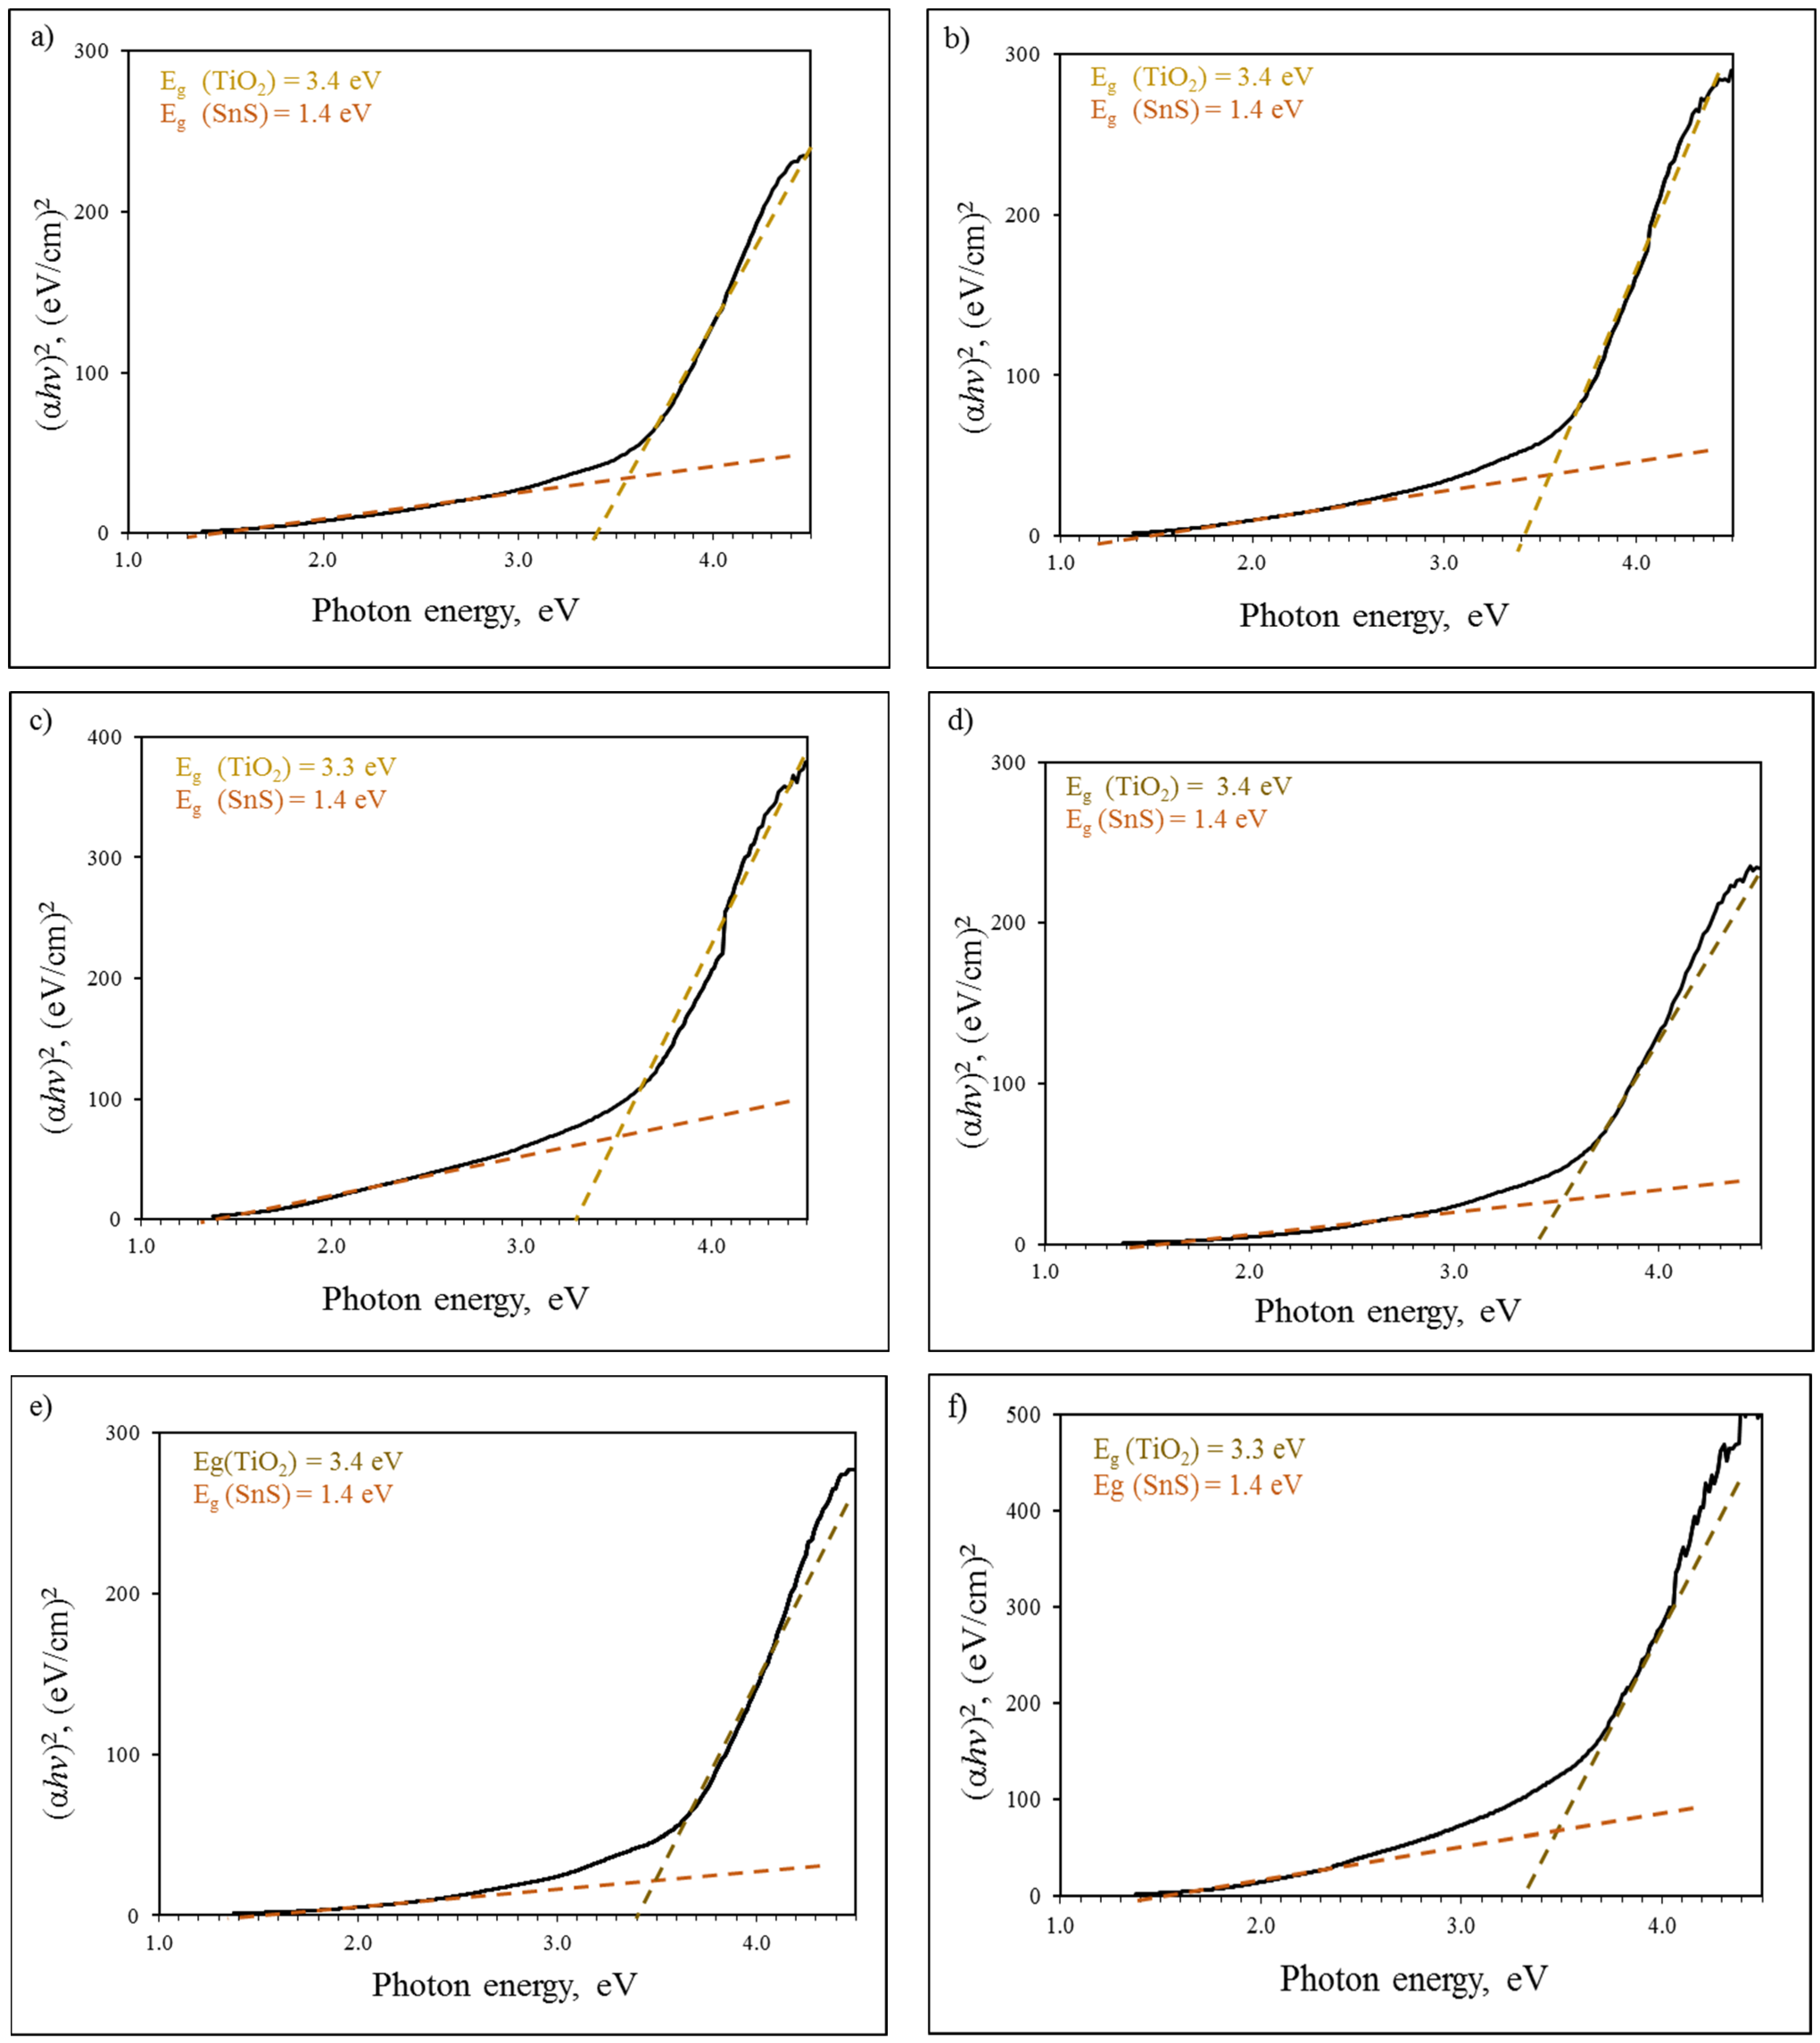
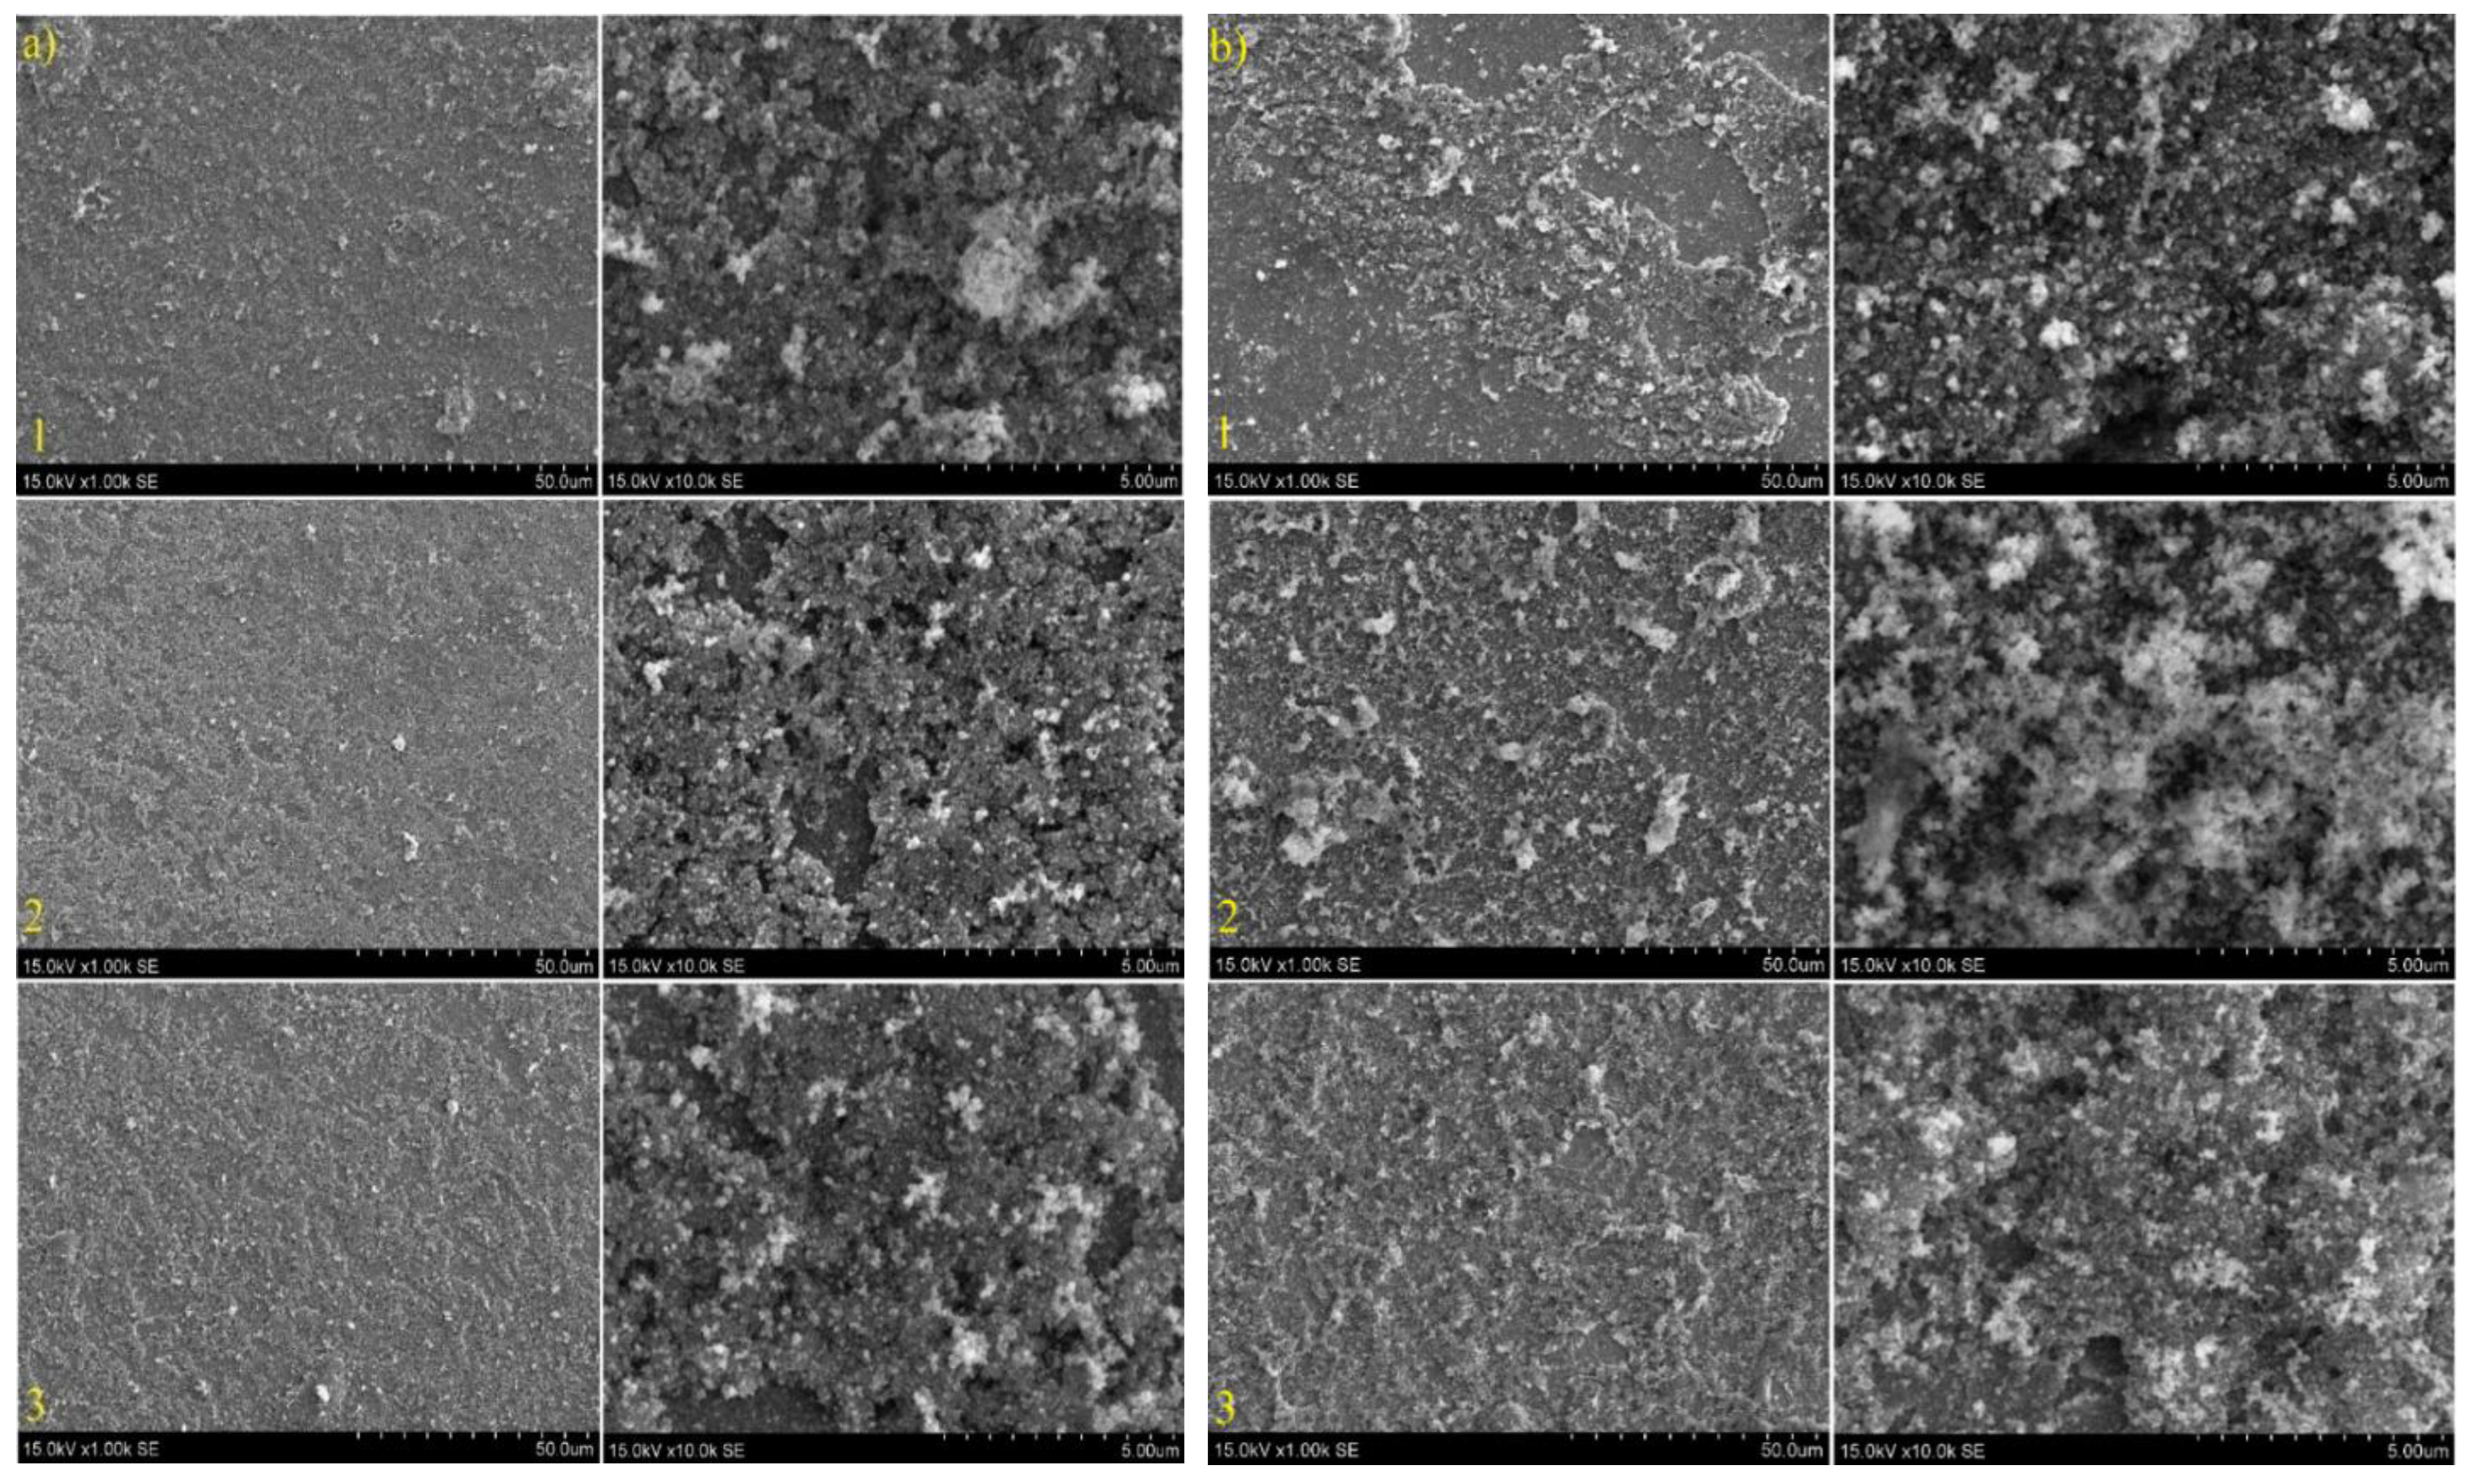
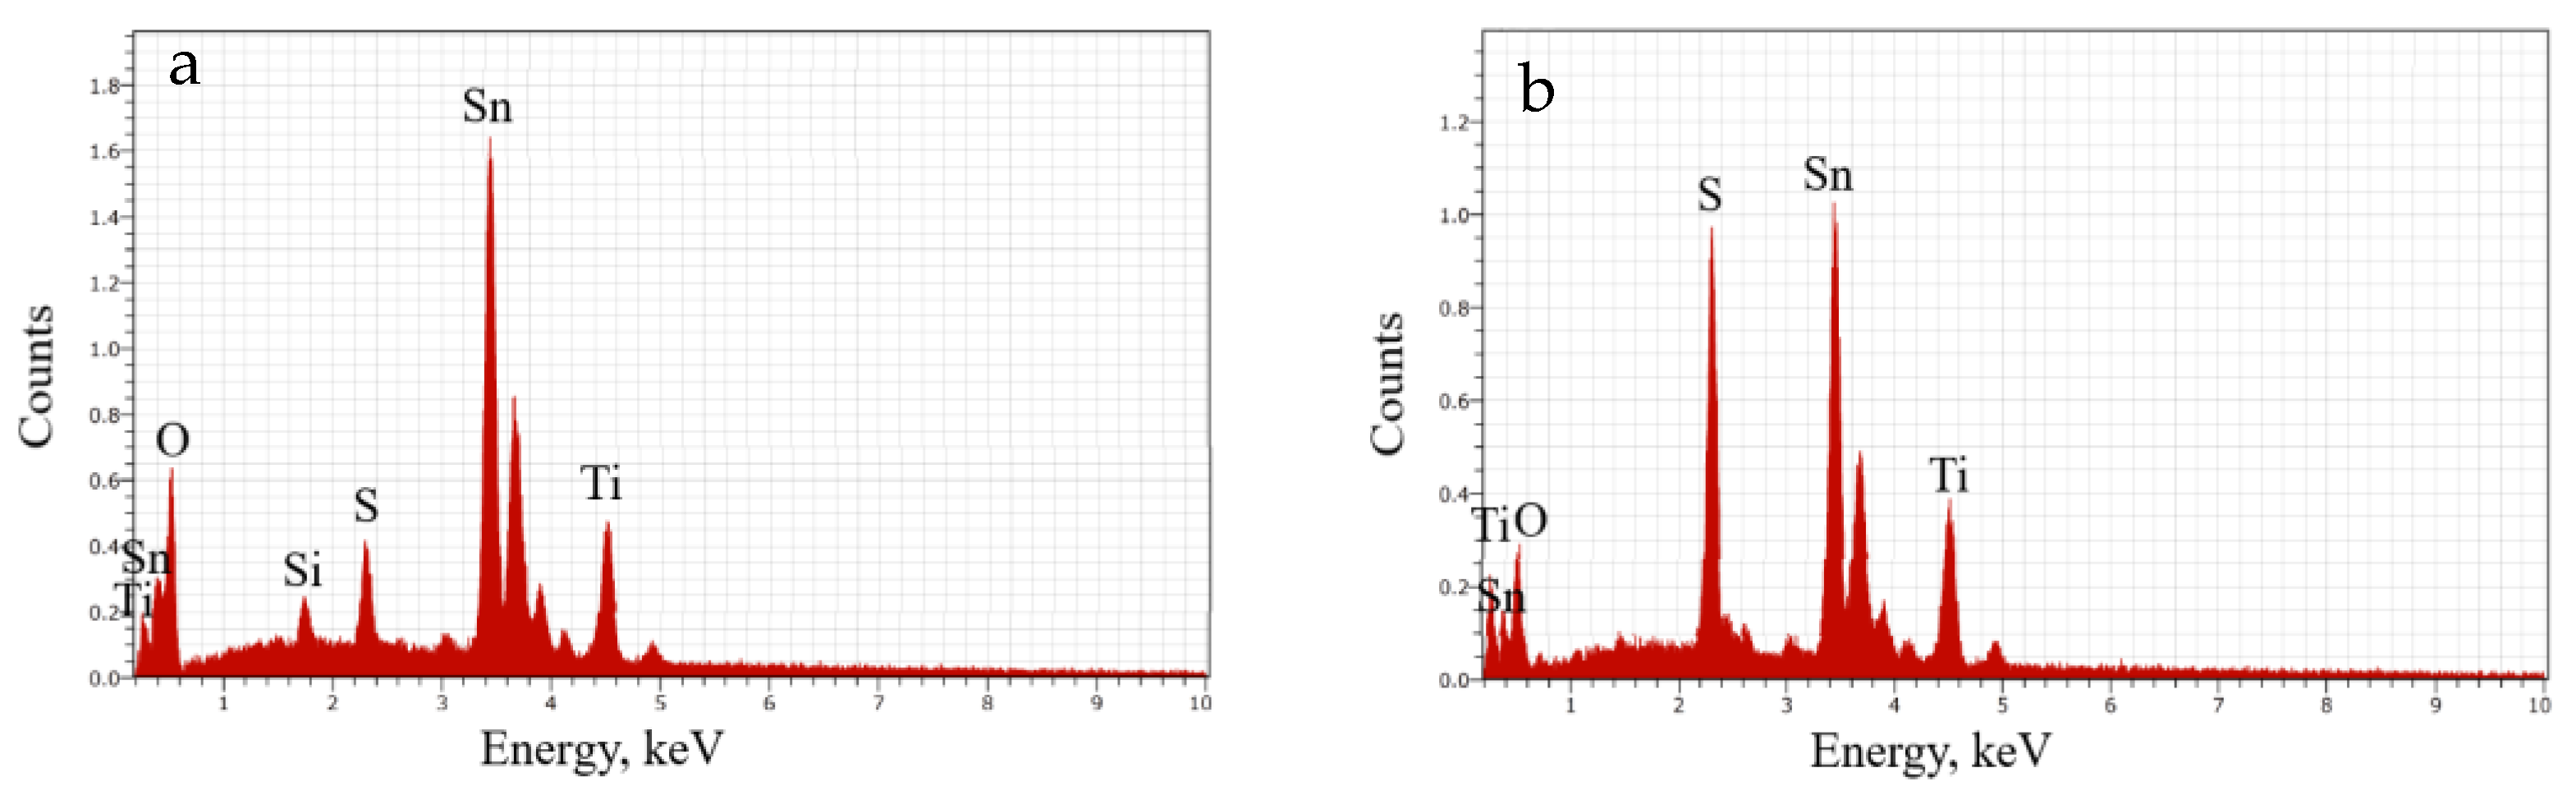
3.3. TiO2/SnS Nanocomposites

Thin tin sulfide films of grey-black color were deposited using the SILAR method and applying 20; 30 and 40 cycles. SnS thin films on the FTO glass slides were characterized in previous papers [26,48]. In this paper, the characterization of TiO2/SnS composites is developed. The XRD patterns of TiO2/SnS nanocomposites are shown in Figure 9. According to the XRD patterns, the most intense peaks are assigned to orthorhombic tin sulfide (JCPDS card no 83-1758). The peaks at 2θ = 26.44; 37.74; 51.45; 54.47 and 65.45°, which can be indexed to planes 021; 041; 221; 240 and 171, respectively, indicating that the samples are composed of highly crystalline tin sulfide. The XRD peaks at 2θ = 25.31 and 61.53° can be assigned as 101 and 213 planes of TiO2 (JCPDS card no 84-1285). A peak at 2θ = 33.63° attributed to SnO2 is still visible in the patterns. The reason for the tin dioxide peak could be the porous structure of the obtained films.
The absorbance of the obtained films was measured in the wavelength range of 200−900 nm at room temperature. The optical bandgap was estimated according to Tauc’s law:
( α h ϑ ) n = A ( E g h ϑ )
where n = 2 for direct transmission. The Tauc plots of (αhϑ)2 and the photon energy (hϑ) are shown in Figure 10. Here, two bandgap values corresponding to TiO2 and SnS were obtained. Calculated TiO2 bandgap values are very close to the results described before and to theoretical ones. The bandgap energy of SnS was determined by extrapolating the straight-line portion of the plot to intersect the hϑ axis and was 1.4 eV and is close to the optimal bandgap of 1.5 eV [15,19], 1.3 eV [18,49], the direct value of 1.4 eV [46] and 1.3 eV [47]. However, quantum confinement could be the reason for the enlargement of the bandgap due to particle size. There were no significant differences in the value of the direct bandgap of the samples. In addition, the incorporation of narrow bandgap SnS nanoparticles could reduce the bandgap of TiO2 [15]. Previously, the bandgap values of TiO2 were found to be in the range of 3–3.4 eV, while the TiO2 values in the nanocomposite were in the short range of 3.3–3.4 eV, and the TiO2 deposition method did not affect the bandgap value.
The morphology TiO2/SnS composite films was characterized by scanning electron microscopy. The SEM images of the obtained thin films are given in Figure 11. The surface consists of well-defined grains of shape and size with some voids depending on the TiO2 deposition route and the number of SnS deposition cycles. The films obtained were almost uniform and well-covered over the entire surface. Tin sulfide films on TiO2 deposited using the spin-coating technique (Figure 11a) are quite uniform and covered all over the surface with only a few parts of denser agglomeration. With an increase in the number of SILAR cycles, the content of SnS on the surface of TiO2 increases. TiO2 films deposited using the doctor blade method led to the formation of more uneven SnS films with higher and denser agglomerates. SEM pictures with a magnification of 20,000× illustrate the formation of the more porous surface. Summarizing the results obtained, it is clearly seen that the quality of tin sulfide film depends on the TiO2 deposition route. In addition, the number of SILAR deposition cycles also affects the formation of SnS film.
Elemental composition of the samples was estimated using EDX spectroscopy. The peaks of tin, titanium, oxygen, and sulfur are seen in Figure 12.
EDX results, especially for film marked b (Figure 12 and Table 1), show that the stoichiometric ratio is slightly sulfur-rich and confirms the formation of SnS [19]. Figure 13 represents the maps of elements, and it can be seen that elements of O, Ti, Sn and S are contained in all samples. Moreover, these constituent elements are evenly distributed in the obtained composite, suggesting that heterojunctions are likely formed between any two semiconducting materials in TiO2/SnS [50]. According to the data in Table 1, the main difference between the samples is the sulfur atomic percentages. Using the doctor blade method for the deposition of mesoporous TiO2, the atomic percentages of sulfur and tin are very similar, and the stoichiometric ratio is close to 1:1. Using the spin-coating technique for TiO2 formation, it is clearly seen the excess of tin. Figure 13 shows the dependence of tin atoms on titanium because both elements have visual signals at the same place. The concentration of tin stays almost the same, and these atoms cover all the substrate. Figure 13b shows quite thick agglomerates of tin sulfide. It can also be seen that the concentration of sulfur depends on the concentration of tin.

4. Conclusions

TiO2/SnS nanocomposites on the FTO glasses were prepared using simple and eco-friendly methods. In this study, the best etching agent for FTO glass was found to be 2 M HCl due to the resulting clear and transparent glass surface. Using scanning electron microscopy, the surfaces of both compact and mesoporous spin-coated TiO2 films were found to be smooth and densely packed, whereas the surface of the mesoporous TiO2 film formed using the doctor blade technique was uneven and noticeably porous. X-ray diffraction analysis showed the formation of an anatase phase with a small amount of rutile phase in compact and mesoporous TiO2 films and orthorhombic SnS in a tin sulfide film. Using electron dispersive X-ray spectroscopy, it was observed that the molar ratio of S to Sn in the composite was 1:1 when a thick mesoporous TiO2 film was deposited using the doctor blade technique. Detailed morphological characterizations showed good crystallinity of the deposited SnS films. The synthesized TiO2/SnS nanocomposites increased absorption in the UV, visible and near-IR ranges, and the absorption intensity increased with increasing film thickness. Calculated bandgap energy values are close to theoretical TiO2 and SnS values and were 1.4 eV for SnS and 3.3–3.4 eV for TiO2.

Author Contributions

Conceptualization, I.A. and A.B.; methodology, A.B.; software, A.B. and R.K.; validation, A.B., R.K. and I.A.; formal analysis, A.B. and R.K.; investigation, A.B. and R.K.; resources, I.A.; data curation, A.B.; writing—original draft preparation, A.B.; writing—review and editing, I.A.; visualization, A.B. and R.K.; supervision, I.A. All authors have read and agreed to the published version of the manuscript.

Funding

This research received no external funding.

Institutional Review Board Statement

Not applicable.

Informed Consent Statement

Not applicable.

Data Availability Statement

Data are contained within the article.

Conflicts of Interest

The authors declare no conflicts of interest.

References

  1. Abutbul, R.E.; Golan, Y. Chemical Epitaxy of π-Phase Cubic Tin Monosulphide. CrystEngComm 2020, 22, 6170. [Google Scholar] [CrossRef]
  2. Ahn, J.H.; Lee, M.J.; Heo, H.; Sung, J.H.; Kim, K.; Hwang, H.; Jo, M.H. Deterministic Two-Dimensional Polymorphism Growth of Hexagonal n-Type SnS2 and Orthorhombic p-Type SnS Crystals. Nano Lett. 2015, 15, 3703–3708. [Google Scholar] [CrossRef] [PubMed]
  3. Liu, C.; Li, F.; Ma, L.-P.; Cheng, H.-M. Advanced Materials for Energy Storage. Adv. Energy Mater. 2010, 22, E28–E62. [Google Scholar] [CrossRef]
  4. Chauhan, H.; Singh, M.K.; Hashmi, S.A.; Deka, S. Synthesis of Surfactant-Free SnS Nanorods by a Solvothermal Route with Better Electrochemical Properties towards Supercapacitor Applications. RSC Adv. 2015, 5, 17228–17235. [Google Scholar] [CrossRef]
  5. Betz, U.; Kharrazi Olsson, M.; Marthy, J.; Escolá, M.F.; Atamny, F. Thin Films Engineering of Indium Tin Oxide: Large Area Flat Panel Displays Application. Surf. Coat. Technol. 2006, 200, 5751–5759. [Google Scholar] [CrossRef]
  6. Garvey, T.R.; Farnum, B.H.; Lopez, R. Pulsed Laser Deposited Porous Nano-Carpets of Indium Tin Oxide and Their Use as Charge Collectors in Core-Shell Structures for Dye Sensitized Solar Cells. Nanoscale 2015, 7, 2400–2408. [Google Scholar] [CrossRef] [PubMed]
  7. Yu, H.; Lee, J.W.; Yun, J.; Lee, K.; Ryu, J.; Lee, J.; Hwang, D.; Kim, S.K.; Jang, J. Outstanding Performance of Hole-Blocking Layer-Free Perovskite Solar Cell Using Hierarchically Porous Fluorine-Doped Tin Oxide Substrate. Adv. Energy Mater. 2017, 7, 1700749. [Google Scholar] [CrossRef]
  8. Sivakumar, R.; Gopalakrishnan, R.; Jayachandran, M.; Sanjeeviraja, C. Investigation of X-Ray Photoelectron Spectroscopic (XPS), Cyclic Voltammetric Analyses of WO3 Films and Their Electrochromic Response in FTO/WO3/Electrolyte/FTO Cells. Smart Mater. Struct. 2006, 15, 877–888. [Google Scholar] [CrossRef]
  9. Rana, C.; Bera, S.R.; Saha, S. Growth of SnS Nanoparticles and Its Ability as Ethanol Gas Sensor. J. Mater. Sci. Mater. Electron. 2019, 30, 2016–2029. [Google Scholar] [CrossRef]
  10. Sharma, A.; Ahmed, A.; Singh, A.; Oruganti, S.K.; Khosla, A.; Arya, S. Review—Recent Advances in Tin Oxide Nanomaterials as Electrochemical/Chemiresistive Sensors. J. Electrochem. Soc. 2021, 168, 027505. [Google Scholar] [CrossRef]
  11. Zhang, J.; Han, J.; Shi, Z.; Ju, Y.; Zhang, Z.; Gu, M. Fabrication and Enhanced H2O2-Sensing Properties of the Uniform Porous FTO Glasses with Tunable Pore Sizes and Densities. Appl. Surf. Sci. 2019, 465, 357–361. [Google Scholar] [CrossRef]
  12. Vazquez-Santos, M.B.; Tartaj, P.; Morales, E.; Amarilla, J.M. TiO2 Nanostructures as Anode Materials for Li/Na-Ion Batteries. Chem. Rec. 2018, 18, 1178–1191. [Google Scholar] [CrossRef]
  13. Yang, L.X.; Luo, S.L.; Cai, Q.Y.; Yao, S.Z. A Review on TiO2 Nanotube Arrays: Fabrication, Properties, and Sensing Applications. Chin. Sci. Bull. 2010, 55, 331–338. [Google Scholar] [CrossRef]
  14. Ilyas, A.M.; Gondal, M.A.; Yamani, Z.H.; Baig, U. Facile Synthesis of Titanium Dioxide-Cadmium Sulfide Nanocomposite Using Pulsed Laser Ablation in Liquid and Its Performance in Photovoltaic and Photocatalytic Applications. Int. J. Energy Res. 2017, 41, 1422–1435. [Google Scholar] [CrossRef]
  15. Zhang, X.; Gao, Y.; Nengzi, L.C.; Li, B.; Gou, J.; Cheng, X. Synthesis of SnS/TiO2 Nano-Tube Arrays Photoelectrode and Its High Photoelectrocatalytic Performance for Elimination of 2,4,6-Trichlorophenol. Sep. Purif. Technol. 2019, 228, 115742. [Google Scholar] [CrossRef]
  16. Zhou, L.; Wang, L.; Lei, J.; Liu, Y.; Zhang, J. Fabrication of TiO2/Co-g-C3N4 Heterojunction Catalyst and Its Photocatalytic Performance. Catal. Commun. 2017, 89, 125–128. [Google Scholar] [CrossRef]
  17. Zhang, Y.; Xiong, X.; Han, Y.; Zhang, X.; Shen, F.; Deng, S.; Xiao, H.; Yang, X.; Yang, G.; Peng, H. Photoelectrocatalytic Degradation of Recalcitrant Organic Pollutants Using TiO2 Film Electrodes: An Overview. Chemosphere 2012, 88, 145–154. [Google Scholar] [CrossRef]
  18. Jia, Y.; Yang, F.; Cai, F.; Cheng, C.; Zhao, Y. Photoelectrochemical and Charge Transfer Properties of SnS/TiO2 Heterostructure Nanotube Arrays. Electron. Mater. Lett. 2013, 9, 287–291. [Google Scholar] [CrossRef]
  19. Wang, Y.; Gong, H.; Fan, B.; Hu, G. Photovoltaic Behavior of Nanocrystalline SnS/TiO2. J. Phys. Chem. C 2010, 114, 3256–3259. [Google Scholar] [CrossRef]
  20. Nengzi, L.C.; Yang, H.; Hu, J.Z.; Zhang, W.M.; Jiang, D.A. Fabrication of SnS/TiO2 NRs/NSs Photoelectrode as Photoactivator of Peroxymonosulfate for Organic Pollutants Elimination. Sep. Purif. Technol. 2020, 249, 117172. [Google Scholar] [CrossRef]
  21. Saliba, M.; Orlandi, S.; Matsui, T.; Aghazada, S.; Cavazzini, M.; Correa-Baena, J.P.; Gao, P.; Scopelliti, R.; Mosconi, E.; Dahmen, K.H.; et al. A Molecularly Engineered Hole-Transporting Material for Efficient Perovskite Solar Cells. Nat. Energy 2016, 1, 15017. [Google Scholar] [CrossRef]
  22. Cheraghizade, M.; Jamali-Sheini, F.; Shabani, P. Charge Transportation Mechanisms in TiO2/SnS/Ag Solar Cells. Mater. Res. Bull. 2020, 124, 110727. [Google Scholar] [CrossRef]
  23. Lee, C.Y.; Chang, C.; Shih, W.P.; Dai, C.L. Wet Etching Rates of InGaZnO for the Fabrication of Transparent Thin-Film Transistors on Plastic Substrates. Thin Solid Film. 2010, 518, 3992–3998. [Google Scholar] [CrossRef]
  24. Volkert, C.A.; Minor, A.M. Focused Ion Beam Microscopy and Micromachining. MRS Bull. 2007, 32, 389–399. [Google Scholar] [CrossRef]
  25. Saliba, M.; Correa-Baena, J.-P.; Wolff, C.M.; Stolterfoht, M.; Phung, N.; Albrecht, S.; Neher, D.; Abate, A. How to Make over 20% Efficient Perovskite Solar Cells in Regular (N−i−p) and Inverted (P−i−n) Architectures. Chem. Mater. 2018, 30, 4193–4201. [Google Scholar] [CrossRef]
  26. Bronusiene, A.; Popov, A.; Barauskiene, I.; Ancutiene, I. Effect of Ascorbic Acid on the Properties of Tin Sulfide Films for Supercapacitor Application. Surf. Interfaces 2021, 25, 101275. [Google Scholar] [CrossRef]
  27. Vikraman, D.; Thiagarajan, S.; Karuppasamy, K.; Sanmugam, A.; Choi, J.H.; Prasanna, K.; Maiyalagan, T.; Thaiyan, M.; Kim, H.S. Shape- and Size-Tunable Synthesis of Tin Sulfide Thin Films for Energy Applications by Electrodeposition. Appl. Surf. Sci. 2019, 479, 167–176. [Google Scholar] [CrossRef]
  28. Bae, J.W.; Koo, B.R.; An, H.R.; Ahn, H.J. Surface Modification of Fluorine-Doped Tin Oxide Films Using Electrochemical Etching for Dye-Sensitized Solar Cells. Ceram. Int. 2015, 41, 14668–14673. [Google Scholar] [CrossRef]
  29. Triana, S.L.; Kusumandari; Suryana, R. Effect of Wet Etching Process on the Morphology and Transmittance of Fluorine Doped Tin Oxide (FTO). J. Phys. Conf. Ser. 2016, 776, 012005. [Google Scholar] [CrossRef]
  30. Lee, K.T.; Lu, S.Y. Porous FTO Thin Layers Created with a Facile One-Step Sn 4+-Based Anodic Deposition Process and Their Potential Applications in Ion Sensing. J. Mater. Chem. 2012, 22, 16259–16268. [Google Scholar] [CrossRef]
  31. Miao, F.; Chu, F.; Sun, B.; Tao, B.; Zhang, P.; Zang, Y.; Chu, P.K. Dye-Sensitized Solar Cells Based on Au/SnS/TiO2 sensitized by Natural Dye. J. Mater. Res. Technol. 2022, 21, 704–711. [Google Scholar] [CrossRef]
  32. Jarernboon, W.; Pimanpang, S.; Maensiri, S.; Swatsitang, E.; Amornkitbamrung, V. Effects of Multiwall Carbon Nanotubes in Reducing Microcrack Formation on Electrophoretically Deposited TiO2 Film. J. Alloys Compd. 2009, 476, 840–846. [Google Scholar] [CrossRef]
  33. Zhang, Y.; Weidenkaff, A.; Reller, A. Mesoporous Structure and Phase Transition of Nanocrystalline TiO2. Mater. Lett. 2002, 54, 375–381. [Google Scholar] [CrossRef]
  34. Parida, B.; Singh, A.; Oh, M.; Jeon, M.; Kang, J.W.; Kim, H. Effect of Compact TiO2 Layer on Structural, Optical, and Performance Characteristics of Mesoporous Perovskite Solar Cells. Mater. Today Commun. 2019, 18, 176–183. [Google Scholar] [CrossRef]
  35. Li, Z.; Haidry, A.A.; Plecenik, T.; Vidis, M.; Grancic, B.; Roch, T.; Gregor, M.; Durina, P.; Yao, Z.J.; Plecenik, A. Influence of Nanoscale TiO2 Film Thickness on Gas Sensing Properties of Capacitor-like Pt/TiO2/Pt Sensing Structure. Appl. Surf. Sci. 2020, 499, 143909. [Google Scholar] [CrossRef]
  36. Klugmann-Radziemska, E. Degradation of Electrical Performance of a Crystalline Photovoltaic Module Due to Dust Deposition in Northern Poland. Renew. Energy 2015, 78, 418–426. [Google Scholar] [CrossRef]
  37. Kumar, A.; Saxena, V.K.; Thangavel, R.; Nandi, B.K. A Dual Effect of Surface Roughness and Photocatalysis of Crystalline TiO2-Thin Film for Self-Cleaning Application on a Photovoltaic Covering Glass. Mater. Chem. Phys. 2022, 289, 126427. [Google Scholar] [CrossRef]
  38. Hong, S.; Park, B.; Balamurugan, C.; Lee, J.; Kwon, S. Impact of Solvents on Doctor Blade Coatings and Bathocuproine Cathode Interlayer for Large-Area Organic Solar Cell Modules. Heliyon 2023, 9, e18209. [Google Scholar] [CrossRef]
  39. Kamarulzaman, N.H.; Salleh, H.; Dagang, A.N.; Mohd Ghazali, M.S.; Ishak, N.; Ahmad, Z. Optimization of Titanium Dioxide Layer Fabrication Using Doctor Blade Method in Improving Efficiency of Hybrid Solar Cells. J. Phys. Conf. Ser. 2020, 1535, 012025. [Google Scholar] [CrossRef]
  40. Plecenik, A.; Haidry, A.A.; Plecenik, T.; Durina, P.; Truchly, M.; Mosko, M.; Grancic, B.; Gregor, M.; Roch, T.; Satrapinskyy, L.; et al. Metal Oxide Gas Sensors on the Nanoscale. In Proceedings of the Micro- and Nanotechnology Sensors, Systems, and Applications VI; SPIE: Bellingham, WA, USA, 2014; Volume 9083, p. 90830Y. [Google Scholar]
  41. Usher, C.R.; Baltrusaitis, J.; Grassian, V.H. Spatially Resolved Product Formation in the Reaction of Formic Acid with Calcium Carbonate (1014): The Role of Step Density and Adsorbed Water-Assisted Ion Mobility. Langmuir 2007, 23, 7039–7045. [Google Scholar] [CrossRef]
  42. Suprayogi, T.; Masrul, M.Z.; Diantoro, M.; Taufiq, A.; Fuad, A.; Hidayat, A. The Effect of Annealing Temperature of ZnO Compact Layer and TiO2 Mesoporous on Photo-Supercapacitor Performance. IOP Conf. Ser. Mater. Sci. Eng. 2019, 515, 012006. [Google Scholar] [CrossRef]
  43. Lance, R.; Tate, J. Optical Analysis of Titania: Band Gaps of Brookite, Rutile and Anatase. Bachelor’s Thesis, Oregon State University, Corvallis, OR, USA, 2018. [Google Scholar]
  44. Möls, K.; Aarik, L.; Mändar, H.; Kasikov, A.; Niilisk, A.; Rammula, R.; Aarik, J. Influence of Phase Composition on Optical Properties of TiO2: Dependence of Refractive Index and Band Gap on Formation of TiO2-II Phase in Thin Films. Opt. Mater. 2019, 96, 109335. [Google Scholar] [CrossRef]
  45. Shanmugaratnam, S.; Selvaratnam, B.; Baride, A.; Koodali, R.; Ravirajan, P.; Velauthapillai, D.; Shivatharsiny, Y. Sns2/Tio2 Nanocomposites for Hydrogen Production and Photodegradation under Extended Solar Irradiation. Catalysts 2021, 11, 589. [Google Scholar] [CrossRef]
  46. Shao, J.; Zhang, Z.-D.; Wang, X.-T.; Zhao, X.-D.; Ning, X.-B.; Lei, J.; Li, X.-R.; Hou, B.-R. Synthesis and Photocathodic Protection Properties of Nanostructured SnS/TiO2 Composites. J. Electrochem. Soc. 2018, 165, H601–H606. [Google Scholar] [CrossRef]
  47. Jiang, Y.; Yang, Z.; Zhang, P.; Jin, H.; Ding, Y. Natural Assembly of a Ternary Ag-SnS-TiO2 Photocatalyst and Its Photocatalytic Performance under Simulated Sunlight. RSC Adv. 2018, 8, 13408–13416. [Google Scholar] [CrossRef]
  48. Bronusiene, A.; Popov, A.; Ivanauskas, R.; Ancutiene, I. Preparation and Characterization of Tin Sulfide Films with or without Sodium Chloride. Chem. Phys. 2020, 535, 110766. [Google Scholar] [CrossRef]
  49. Yun, H.S.; Park, B.W.; Choi, Y.C.; Im, J.; Shin, T.J.; Seok, S.I. Efficient Nanostructured TiO2/SnS Heterojunction Solar Cells. Adv. Energy Mater. 2019, 9, 1901343. [Google Scholar] [CrossRef]
  50. Liu, S.; Zhang, Y. Synthesis of CPVC-Modified SnS2/TiO2 Composite with Improved Visible Light-Driven Photocatalysis. Mater. Res. Bull. 2021, 135, 111125. [Google Scholar] [CrossRef]
Figure 1. Schematic diagram of the preparation of films.
Coatings 14 00088 g001
Figure 2. The etching mechanism of FTO glass.
Coatings 14 00088 g002
Figure 3. X-ray diffractograms of the samples etched with sulfuric acid (a) or hydrochloric acid (b).
Coatings 14 00088 g003
Figure 4. SEM images of the compact TiO2 film surface, magnification of 10,000× (a) and 20,000× (b).
Coatings 14 00088 g004
Figure 5. SEM images of the mesoporous TiO2 film deposited by spin-coating technique. Magnification of 10,000× (a) and 20,000× (b).
Coatings 14 00088 g005
Figure 6. SEM images of the mesoporous TiO2 film deposited using doctor blade technique. Magnification of 10,000× (a) and 20,000× (b).
Coatings 14 00088 g006
Figure 7. X-ray diffraction patterns of titanium dioxide films on the FTO glass substrate.
Coatings 14 00088 g007
Figure 8. The plot of (αhϑ)2 versus hϑ of TiO2 films: (a) compact, (b) compact + spin-coating mesoporous, (c) compact + doctor blade mesoporous.
Coatings 14 00088 g008
Figure 9. X-ray diffraction patterns of TiO2/SnS nanocomposites. SnS film prepared using 20, 30 or 40 SILAR cycles. Mesoporous TiO2 film deposited using spin-coating (a) or doctor blade (b) method.
Coatings 14 00088 g009aCoatings 14 00088 g009b
Figure 10. Bandgap energies of TiO2/SnS composite thin films. Mesoporous TiO2 was deposited using spin-coating technique and SnS using 20 (a), 30 (b) and 40 (c) SILAR cycles. Mesoporous TiO2 was deposited using doctor blade technique and SnS using 20 (d), 30 (e) and 40 (f) SILAR cycles.
Coatings 14 00088 g010
Figure 11. SEM images with magnification of 10,000× (left) and 20,000× (right) of TiO2/SnS nanocomposite films. Mesoporous TiO2 film was deposited using spin-coating (a) or doctor blade (b) method. SnS film prepared using 20 (1), 30 (2) or 40 (3) SILAR cycles.
Coatings 14 00088 g011
Figure 12. EDX spectra of TiO2/SnS nanocomposite films. Mesoporous TiO2 deposited using spin-coating (a) or doctor blade (b) method. SnS prepared using 30 SILAR deposition cycles.
Coatings 14 00088 g012
Figure 13. Maps of elements. SnS prepared using 30 SILAR cycles. Mesoporous TiO2 deposited using spin-coating (a) or doctor blade (b) methods.
Coatings 14 00088 g013
Table 1. The elemental composition by EDX analysis (excluding Si and C).
ElementsThin Film (a)Thin Film (b)
Ti (at.%)9.2811.93
O (at.%)67.9654.07
Sn (at.%)16.0115.11
S (at.%)2.6112.11
Disclaimer/Publisher’s Note: The statements, opinions and data contained in all publications are solely those of the individual author(s) and contributor(s) and not of MDPI and/or the editor(s). MDPI and/or the editor(s) disclaim responsibility for any injury to people or property resulting from any ideas, methods, instructions or products referred to in the content.

