Abstract
The effect of protective coatings on the crystallization of amorphous Co-based alloys was studied using the methods of X-ray diffraction, differential scanning calorimetry, and transmission electron microscopy. The crystallization of the amorphous alloys was studied on as-prepared samples, deformed samples, and deformed samples with a protective coating. After heat treatment, the fraction of the crystalline phase in the pre-deformed samples was higher than in the undeformed samples. When using a protective coating, the fraction of nanocrystals formed during heat treatment increased. The size of the crystals formed in deformed samples was smaller, and in the deformed samples with a protective coating, they were slightly larger than in the corresponding initial samples. The reasons for the differences in the formed structure in the amorphous alloys under study are discussed in terms of free volume.
1. Introduction
Composite amorphous–nanocrystalline alloys are a relatively new class of materials. The structure of partially crystalline alloys consists of nanocrystals and a surrounding amorphous matrix [1,2,3]. These materials are usually obtained by the controlled crystallization of amorphous alloys [4,5,6]. Most often, a nanocrystalline structure is obtained using heat treatment, and in recent years, deformation effects on the amorphous phase have also been used for this purpose [7,8,9,10,11,12,13,14,15,16,17,18]. Nanocrystals are usually formed by a primary crystallization reaction; the composition of nanocrystals and the surrounding amorphous matrix turn out to be different. During the formation and growth of nanocrystals, alloy components that are not part of the nanocrystals diffuse from the reaction front deep into the amorphous phase. The amorphous matrix changes its composition, the crystallization temperature of such an amorphous phase turns out to be higher, and an increase in the temperature is required for its crystallization. The presence of an amorphous layer ensures the stability of the amorphous–nanocrystalline structure.
Depending on the crystallization conditions, the crystal structure formed can have significantly different parameters: crystal size, phase composition, relative position or orientation of structural components, and crystalline phase fraction; in this case, the formation of metastable phases is often observed [19,20]. One example of the formation of different crystal structures is the widely studied Fe-B alloy. During its crystallization, eutectic colonies or a grain structure can be formed, and the crystal size can differ by an order of magnitude [21,22]. All these parameters affect the properties of the material. Thus, in Fe-based alloys, the coercivity can change by several times [23], and significant changes in mechanical properties occur in Zr-based alloys [24]. Numerous studies of the properties indicate their significant dependence on the parameters of the crystallized structure (the number, size, and location of nanocrystals, and the presence of orientational relationships between the lattices of the resulting phases). Currently, the search for ways to obtain amorphous–nanocrystalline structures is one of the most important areas of research into nanomaterials.
As shown in [25], the transformation of the amorphous phase into crystalline phases can occur through one of the following reactions: primary crystallization (formation of a crystal with a composition different from the composition of amorphous matrix), eutectic crystallization (simultaneous formation of two crystalline phases) and polymorphic crystallization (composition of the crystal and the amorphous phases are the same). During primary crystallization, a gradient of concentrations of components appears in front of the growing crystal. Since the reaction involves atoms diffusing over significant distances, the rate of crystal growth decreases over time. The main difference between polymorphic and eutectic crystallization is due to the fact that in the first case, the composition of the resulting crystal corresponds to the amorphous phase composition, and the redistribution of components does not occur. During eutectic crystallization, diffusion over long distances must occur, so one can expect that the growth rate will decrease as the distance between the components of the eutectic increases. In addition to crystal growth, crystal nucleation is an important process during crystallization. Crystal nucleation can occur by a homogeneous or heterogeneous mechanism [26,27]. The ratio of nucleation and growth rates is an important question in the formation of a structure. At a low nucleation rate and a high growth rate, a small number of crystals are formed in the amorphous matrix, which can reach significant sizes. In the case of a high nucleation rate and a low growth rate, a very large number of crystals are formed in the amorphous phase, the growth of which (especially according to the primary crystallization mechanism) quickly stops due to the overlap of diffusion fields, as a result of which a fine-crystalline structure will be formed in the material. As a rule, it is by this mechanism that a nanocrystalline structure based on metallic glasses is formed.
The development of methods for producing nanostructures with different structural parameters is based on the study of crystallization of the amorphous phase under various influences. The amorphous–crystalline structure formed under heat treatment usually consists of crystals that are randomly distributed in an amorphous phase [28]. For nanocrystals to be formed, the crystallization process must occur at a high nucleation rate and low crystal growth rate. In a number of systems, these conditions are easy to achieve. However, if the alloy contains rapidly diffusing components, the crystal growth rate is high. Such alloys include, in particular, the group of alloys such as Fe-B, Fe-Si-B [29], Co-Si-B [30] and others [31].
To obtain a nanostructure in these alloys, alloying components are added to their composition to ensure the required conditions are fulfilled: to provide a large number of potential sites for the nucleation of crystals and a low rate of their growth. Since, as noted above, generally, crystallization of the amorphous phase follows the primary mechanism of crystallization in a diffusion manner, components characterized by a low diffusion coefficient are introduced to slow down crystal growth. The first example of producing such an alloy was an Fe-Si-B alloy, to which Nb and Cu were added. The nanocrystalline Fe73.8Si13B9.1Cu1Nb3.1 alloy (Finemet) obtained by heat treatment [28] was the ancestor of a large group of ferromagnetic nanocrystalline materials. Nanostructures were obtained in a similar way in a number of amorphous alloys [32,33,34]. However, the addition of alloying components that promote the formation of a nanostructure can lead to deterioration in the properties of the material. For example, in the Finemet alloy, the presence of Nb and Cu worsens the soft magnetic properties of Fe-based alloys, reducing the saturation magnetization.
Another method to obtain a nanocrystalline structure from an amorphous phase is plastic deformation. Currently, there are many works on both the features of plastic deformation of the amorphous phase and the conditions for nanocrystal formation under deformation [31,35,36,37,38,39]. Plastic deformation in amorphous alloys has a number of distinctive features. According to Hooke’s law, under elastic deformation, elongation depends linearly on stress. At higher loads, this dependence deviates from the linear law, in particular, for amorphous alloys. If the shape of the sample is not completely restored when the load is removed, a so-called mechanical hysteresis loop appears, indicating inelastic deformation of the material. The energy corresponding to the area of this loop is used to displace atoms in unstable positions. The magnitude of these displacements in amorphous alloys is significantly greater (about an order of magnitude) than in crystalline alloys. It has been established that the inelasticity of amorphous phase is related to the free volume in their structure: as the free volume decreases, the inelastic deformation also decreases [40]. Further plastic deformation of amorphous alloys takes place through the formation and propagation of shear bands. An important feature of plastic deformation of amorphous alloys is an increase in the free volume concentration in the shear bands, i.e., an increase in the average distance between atoms.
Hence, the deformation of amorphous alloys is highly localized and leads to the formation of shear bands where the processes of diffusion mass transfer are facilitated (the density of amorphous phase in the shear bands is lower than that in the surrounding amorphous matrix). The thickness of shear bands is 5–20 nm [41,42,43], their structure is complex, and changes in the amorphous phase structure can spread over long distances from the shear band, up to 200 nm. The amorphous phase in shear bands has a lower density compared to the surrounding amorphous matrix [43], and the difference in density can reach 10% [44]. In these regions, the processes of diffusion mass transfer are naturally facilitated. It was found that the diffusion coefficient in shear bands at room temperature was five to six orders of magnitude higher than in the surrounding amorphous matrix [45]. The degree of changes in the structure in the shear band naturally depends on the deformation conditions. The formation of nanocrystals starts in shear bands and their surroundings [31]. Under deformation, nanocrystals are formed even in alloys where they are not formed under heat treatment. As a result of deformation, the structure of the amorphous alloy becomes inhomogeneous and represents a kind of nanoglass; the amorphous phase consists of regions of different densities: the regions of shear bands (lower density) and the undeformed amorphous phase (higher density).
The studies showed that the state of the amorphous phase before crystallization could significantly affect the parameters of the crystalline structure formed. When studying light Al-based alloys, it was found that the nanocrystals formed during plastic deformation were smaller than those of the nanocrystals formed under thermal treatment; the fraction of nanocrystals in the deformed samples was higher than that in the samples subjected to thermal treatment [46]. It was also found that when using a combined treatment (annealing after preliminary deformation), the size of the nanocrystals turned out to be intermediate.
As noted above, in the regions of shear bands, the concentration of free volume is increased [47], i.e., they are zones of lower density. With an increasing degree of plastic deformation, the concentration of free volume increases [48,49,50,51]. The formation of nanocrystals in these areas occurs more easily. However, under heating or annealing, the free volume concentration decreases. A decrease in the free volume leads to a change in the properties of the material: an increase in Young’s modulus, thermal resistance, embrittlement, and a decrease in the viscosity, internal friction, superconducting transition temperature, etc. [52,53,54]. To retain the high physical properties of the material, one needs to avoid a decrease in the free volume. To prevent free volume from reaching the surface of the sample, the authors of [55] proposed using special protective coatings made of crystalline materials. They showed that sprayed coatings will be effective if the energy of vacancy formation in the coating material is greater than in the amorphous phase. Under such conditions, the release of free volume from the amorphous phase through the crystalline coating material turns out to be thermodynamically unfavorable. This idea was implemented in [56], where it was shown that applying a protective coating to amorphous Al-based alloys actually allowed one to maintain free volume in the amorphous structure; the parameters of the structure formed under crystallization in the uncoated samples and those with a protective coating turned out to be different.
The amorphous Al-based alloys belong to the group of materials in which a nanocrystalline structure is formed during both thermal and deformation treatment. It would be interesting to compare crystallization processes in deformed Co-based alloys (Co-Si-B system), where a nanostructure is formed during heat treatment only with the addition of alloying components. Amorphous Fe- and Co- based alloys on iron and cobalt have high magnetic properties. The introduction of alloying components can have different effects on the magnetic properties [57]. For example, the addition of Fe to amorphous cobalt-based alloys increases the saturation magnetization and decreases the coercive force [58]; with the addition of Pt [59] in amorphous alloys of the Co-Si-B system, a decrease in saturation magnetization is observed. Amorphous Co-based alloys have a lower saturation magnetization than Fe-based alloys but a higher Curie temperature [60], which allows the use of such magnetic materials at elevated temperatures.
This work aimed to study the effect of a protective coating on the crystallization of deformed amorphous Co-based alloys.
2. Materials and Methods
Ingots of the Co67Si12B9Fe7Nb5 and Co56B20Fe16Nb8 alloys were prepared by arc melting under purified argon from pure (>99.9%) components; they were melted three times to homogenization before melt quenching in a high-purity argon atmosphere. The amorphous alloys were obtained through the rapid quenching of a melt in the form of ribbons. The cooling rate was 106 K/s. The thickness of the as-prepared ribbons was 20–30 μm, and the width was ~1 cm. The composition of the as-prepared ribbons was monitored using local X-ray microanalysis by means of a Zeiss Supra 50VP scanning electron microscope (Zeiss, Jena, Germany). The accuracy of determining the composition for all components, except for boron, was about 0.1%. The thermal analysis of the alloys under study was carried out on a Perkin-Elmer DSC-7 differential scanning calorimeter (Perkin-Elmer, Waltham, MA, USA). The samples were heated at rates of 5, 10 and 20 K/min. The amorphous ribbons were subjected to plastic deformation at room temperature by multiple rolling on a laboratory rolling mill manufactured by VEB Schwermaschinenbau (Brandenburg, Germany). The degree of deformation ε was calculated using the formula
where h0 and h1 are the thickness before and after deformation, respectively. A protective Ta coating was applied to both sides of the deformed amorphous ribbons. The coating was applied by cathode sputtering. Before coating, the surface of the samples was cleaned of contamination. Cleaning was carried out in an ultrasonic bath for 1 min. Cathode sputtering of tantalum was carried out with argon ions at a voltage of 3 kV for 30 min. The coating thickness was 100–200 nm. The quality and thickness of the coating were assessed using a Zeiss Supra 50VP scanning electron microscope. Figure 1a shows an example of the sample with a deposited Ta layer, and Figure 1b displays the EDS spectrum of the alloy with a Ta coating. Figure 1a is a secondary electron image of the sample surface, and the Ta layer is indicated by the arrows. Figure 1b shows an EDS spectrum of the sample surface indicating the presence of tantalum.
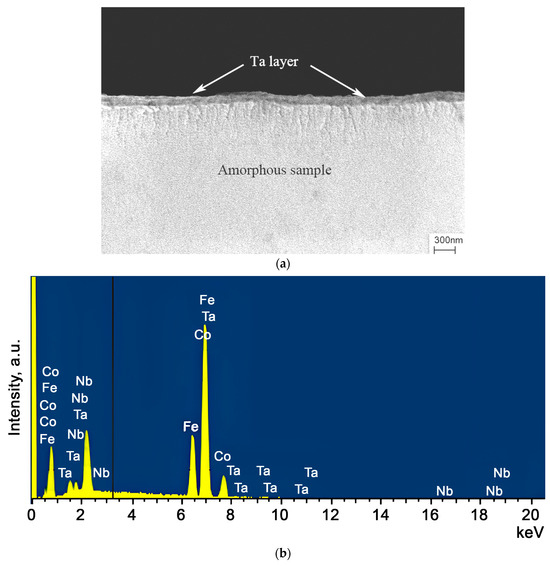
Figure 1.
(a) A SEM image of the Co56B20Fe16Nb8 alloy with a protective Ta coating. (b) EDS spectrum of the Co56B20Fe16Nb8 sample surface with a Ta coating.
The initial amorphous alloys and those after deformation (with and without a coating) were subjected to simultaneous isothermal annealing in a resistance furnace. The X-ray structural studies were carried out on a Siemens D-500 X-ray diffractometer using Co Kα radiation. Structure monitoring was carried out at each stage of sample processing (quenching, deformation, application of a protective Ta coating). When conducting X-ray diffraction studies, special substrates were used that did not produce their own reflections. To process the spectra, special programs were used to perform smoothing, background correction, and the separation of overlapping maxima. The size of the nanocrystals was estimated from the half-width of the diffraction line using the well-known Selyakov–Scherrer formula [61].
3. Results and Discussion
3.1. Thermal Characteristics of the as-Quenched Alloys
To determine the thermal characteristics and conditions of heat treatment, the method of differential scanning calorimetry was used. Figure 2 and Figure 3 illustrate DSC curves of the amorphous Co67Si12B9Fe7Nb5 and Co56B20Fe16Nb8 alloys for three different heating rates: 20 K/min (curve 1), 10 K/min (curve 2), and 5 K/min (curve 3). The data are given for the first crystallization stage (there is one peak in the DSC curves) at which nanocrystals are formed. Table 1 shows temperatures of the onset of the first stage of crystallization of the amorphous alloys under study for different heating rates. With an increase in the heating rate, the temperature of crystallization onset (as well as the temperature of the peak) shifts to higher temperatures. It can be seen that the temperature of beginning of crystallization onset strongly depends on the alloy composition: the temperature of crystallization start for the amorphous Co56B20Fe16Nb8 alloy is higher than for Co67Si12B9Fe7Nb5.
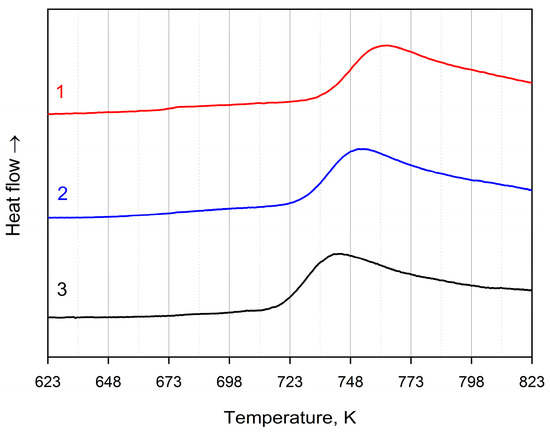
Figure 2.
DSC curves of the amorphous Co67Si12B9Fe7Nb5 alloy: heating rates of 20 K/min (1, red), 10 K/min (2, blue), 5 K/min (3, black).
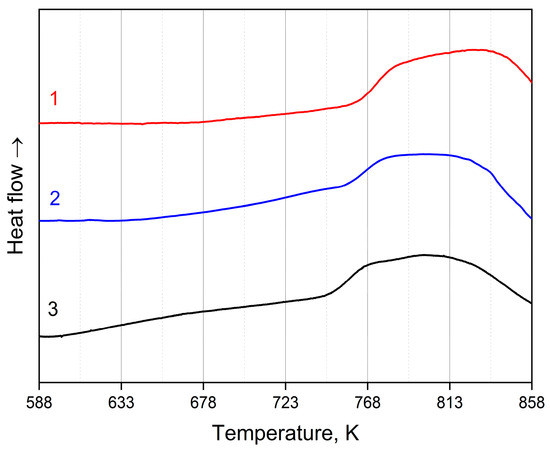
Figure 3.
DSC curves of the amorphous Co56B20Fe16Nb8 alloy: heating rates of 20 K/min (1, red), 10 K/min (2, blue), 5 K/min (3, black).

Table 1.
Temperature of the onset of the first crystallization stage of the amorphous Co67Si12B9Fe7Nb5 and Co56B20Fe16Nb8 alloys.
By using calorimetry data, the activation energy of the first crystallization stage of the amorphous Co67Si12B9Fe7Nb5 and Co56B20Fe16Nb8 alloys was calculated. The activation energy of crystallization was determined by the well-known Kissinger method [62] using the equation
where β is the heating rate, R is the gas constant, T is the temperature at which crystallization begins at a certain heating rate, and E is the desired activation energy of crystallization. The crystallization activation energy was calculated from the ln(Tκp2/β) − 1000/Tκp graphs, which give approximately straight lines. The slope of the graphs indicates the value of . Figure 4 shows Kissinger plots for the amorphous alloys under study; the numbers indicate the following: 1—the Co67Si12B9Fe7Nb5 sample; 2—the Co56B20Fe16Nb8 sample.
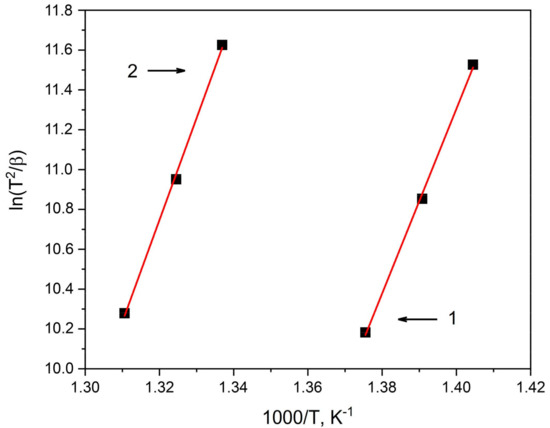
Figure 4.
Kissinger plot for determining the activation energy Ea of the first crystallization stage of amorphous alloys: 1—Co67Si12B9Fe7Nb5, 2—Co56B20Fe16Nb8.
To confirm the results obtained using the Kissinger method, two other related calculation methods, the Ozawa method [63] and the Augis–Bennett method [64], were used according to the corresponding equations
In this case, the activation energy was also calculated from the slope of the graphs ln(1/β) − 1000/Tκp and ln(Tκp/β) − 1000/Tκp (Figure 5 and Figure 6). In Figure 5 and Figure 6, the numbers indicate the following: 1—the Co67Si12B9Fe7Nb5 sample; 2—the Co56B20Fe16Nb8 sample. The values of the activation energy of the first crystallization stage of the amorphous alloys under study are summarized in Table 2.

Figure 5.
Ozawa plot for determining the activation energy Ea of the first crystallization stage of amorphous alloys: 1—Co67Si12B9Fe7Nb5, 2—Co56B20Fe16Nb8.
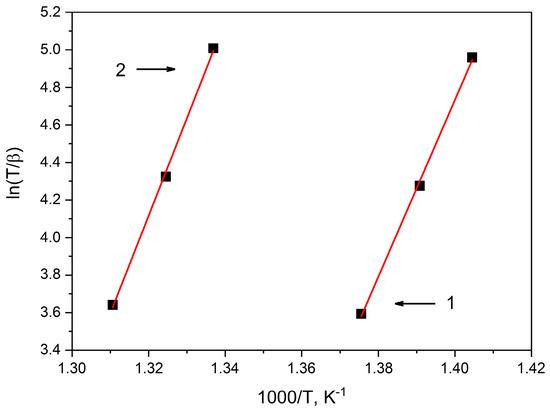
Figure 6.
Augis–Bennett plot for determining the activation energy Ea of the first crystallization stage of amorphous alloys: 1—Co67Si12B9Fe7Nb5, 2—Co56B20Fe16Nb8.

Table 2.
Activation energy of the first stage of crystallization of the amorphous Co67Si12B9Fe7Nb5 and Co56B20Fe16Nb8 alloys.
It can be seen that the values of the activation energy determined by the Kissinger, Ozawa, and Augis–Bennett methods are slightly different. The activation energy was higher in the case of using the Ozawa method, there was lower activation energy when using the Kissinger method, and the intermediate one was when using the Augis–Bennett method. The observed change in the activation energy with a change in the estimation method used is in good agreement with the literature data [56]. The results obtained showed that the activation energy of the first crystallization stage of the amorphous Co56B20Fe16Nb8 alloy was higher than that of the amorphous Co67Si12B9Fe7Nb5 alloy (for all three of these methods). The kinetics of crystallization of amorphous alloys is largely determined by the chemical composition of the alloys. The addition of elements with a large atomic radius to amorphous alloys prevents the diffusion of atoms, leading to an increase in the energy barrier to crystallization and, therefore, to higher activation energy of crystallization. In the alloys under study, niobium had the largest atomic radius (Nb—1.429 Å, Co—1.253 Å, Fe—1.241 Å, Si—1.170 Å, and B—0.831 Å). As follows from Table 2, the activation energy of crystallization of the alloy with higher Nb content (Co56B20Fe16Nb8) is indeed greater than that of Co67Si12B9Fe7Nb5 alloy. This indicates a higher thermal stability of the amorphous alloy with high Nb content.
3.2. Crystallization of Initial Samples after Quenching
Figure 7 illustrates an X-ray diffraction pattern of the initial samples. The X-ray diffraction pattern contains only a wide amorphous halo with no signs of crystalline phases. No signs of crystalline phases were found in the corresponding electron microscopic images.
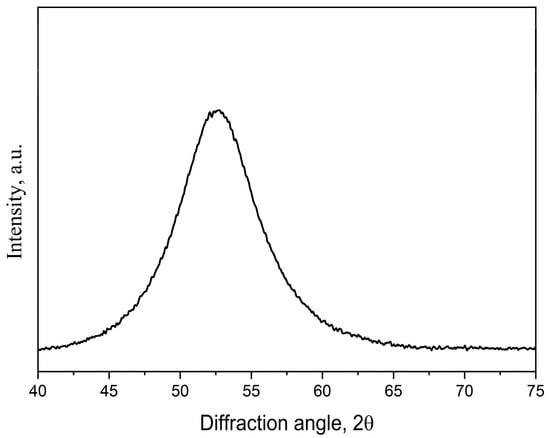
Figure 7.
An XRD pattern of the initial amorphous samples after quenching.
Figure 8 shows X-ray diffraction patterns of the samples of the Co67Si12B9Fe7Nb5 (1) and Co56B20Fe16Nb8 (2) alloys after isothermal annealing at 823 K for 1 h. These conditions correspond to the completion of the first crystallization stage of the Co67Si12B9Fe7Nb5 alloy and to the first crystallization stage for the Co56B20Fe16Nb8 alloy. These annealing conditions were chosen in order to study only the beginning of crystallization of both alloys. An increase in temperature (to complete the first stage of crystallization of the Co56B20Fe16Nb8 alloy) could lead to the development of the second stage of crystallization in the Co67Si12B9Fe7Nb5 alloy. X-ray diffraction studies showed that a phase with a bcc lattice was formed in both alloys at the first crystallization stage. This phase is atypical for Co-based alloys. Usually, during the crystallization of amorphous Co-based alloys, precipitates of Co or its borides are formed [65,66]. Crystals of Co borides and silicides are often formed at subsequent stages of amorphous phase crystallization [67]; the simultaneous formation of Co crystals of various modifications (α-Co with an hcp lattice and β-Co with an fcc lattice) can also be observed [68]. In the alloys under study, at subsequent crystallization stages, the formation of Co phases with hcp and fcc lattices is also observed; however, the first phase formed during heating is the phase with a bcc lattice.
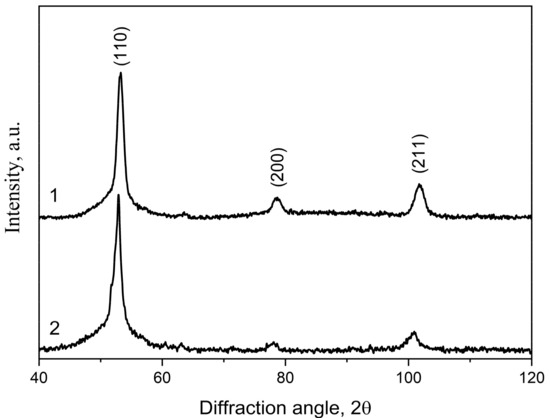
Figure 8.
XRD patterns of the annealed samples (823 K, 1 h): 1—Co67Si12B9Fe7Nb5, 2—Co56B20Fe16Nb8.
The formation of a phase with a bcc lattice in Co-based alloys was previously observed only at a high concentration of the alloying element Fe (at a Fe:Co ratio of at least 1:2). Later, it was shown that this phase could be formed at lower Fe concentrations [69], in particular, in a concentration range in which, according to the phase diagram, its formation is impossible. However, it is important to note that the formation of the bcc phase at lower Fe concentrations was observed only if another alloying component with a bcc lattice (Nb) was present in the alloy. It was shown in [70] that the formation of the bcc phase in Co-based alloys alloyed with Fe and Nb was due to the structural similarity (short-range order type) of the crystal lattices of the alloying elements and the formed phase. If in a heterogeneous amorphous phase there are ordered regions, the short-range order of which corresponds to that of the formed crystalline phase, these regions can be sites for the facilitated formation of crystals with the corresponding lattice. In the Co-based alloys under study, these regions may be Nb, Fe, or Nb/Fe clusters.
Figure 9 shows an electron microscopic image of the structure of the Co67Si12B9Fe7Nb5 alloy after the end of the first stage of crystallization. It can be seen that after the completion of the first crystallization stage, the structure contains bcc nanocrystals and the remaining amorphous phase. This structure is typical for the alloys under study and is similar to the structure of other multicomponent alloys with bcc alloying components [70].
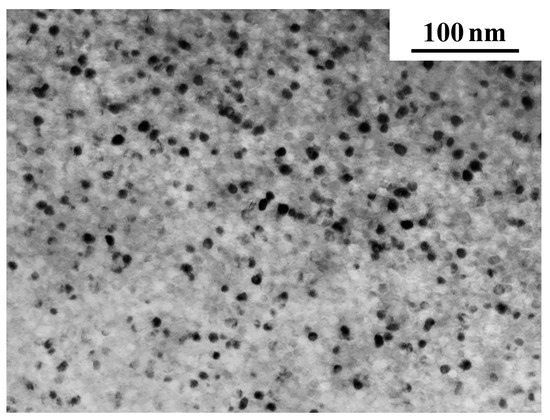
Figure 9.
An electron microscopic image of the structure of the Co67Si12B9Fe7Nb5 alloy after the completion of the first crystallization stage.
In the alloys under study, the lattice parameters of the bcc phases formed are 2.822 Å and 2.837 Ǻ for Co67Si12B9Fe7Nb5 and Co56B20Fe16Nb8, respectively. Obviously, the difference in the lattice parameters is due to different chemical compositions and is related to the formation of a solid solution of alloy components in cobalt.
Under subsequent heating, crystallization of the remaining amorphous phase and the formation of a multiphase structure occur. Figure 10 illustrates an X-ray diffraction pattern of the Co67Si12B9Fe7Nb5 alloy after isothermal annealing at 873 K. It contains reflections from crystals of two modifications of cobalt (with hcp and fcc lattices) and cobalt silicide (Co2Si), and part of the amorphous phase is retained. With a further increase in the temperature (or time) of isothermal annealing, crystals of cobalt borides appear, and the sample becomes completely crystalline.
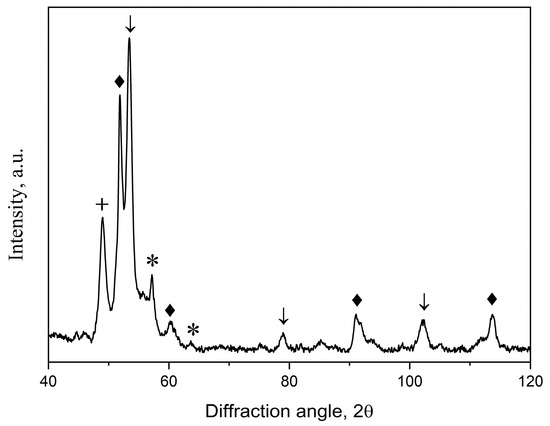
Figure 10.
An XRD pattern of the annealed at 873 K samples: arrows—bcc phase; rhombuses—fcc Co; asterisks—Co2Si; crosses—hcp Co.
3.3. Crystallization of Deformed Samples
It was previously established that not only lattice parameters but also the size of nanocrystals depended on the concentration of alloying elements with a bcc lattice. It was shown that with an increase in the concentration of alloying elements, the size of crystals decreased, and the fraction of crystals increased. As noted above, the deformation of the amorphous phase can also lead to the formation of smaller nanocrystals. Therefore, it is natural to compare the structure formed during crystallization in the as-prepared and deformed amorphous phases.
To investigate the effect of deformation on the crystallization of amorphous alloys, the samples were subjected to plastic deformation by multiple cold rolling. Under this deformation, shear bands are formed, which are the regions of localization of plastic deformation characterized by an enhanced free volume concentration. Figure 11 shows an image of the surface of the deformed amorphous Co67Si12B9Fe7Nb5 alloy, on which numerous steps are visible; they are the places where shear bands emerge on the sample surface.
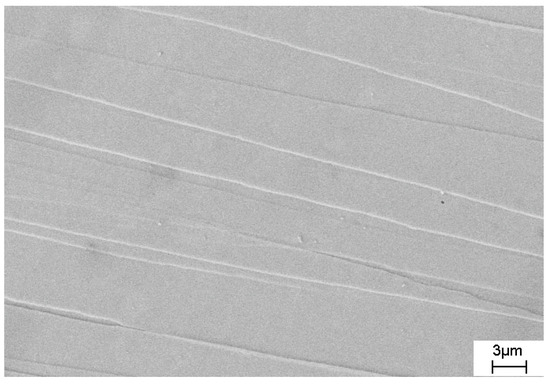
Figure 11.
An image of the surface of the deformed amorphous Co67Si12B9Fe7Nb5 alloy.
After deformation, the samples remained amorphous. The deformed samples after rolling and the initial undeformed samples were subjected to simultaneous isothermal annealing. The annealing conditions were selected based on the differential scanning calorimetry data and corresponded to the onset of the first crystallization stage. The temperature of isothermal annealing was 723 K for the amorphous Co67Si12B9Fe7Nb5 alloy and 758 K for the amorphous Co56B20Fe16Nb8 alloy; the annealing time was 1 h. At the initial crystallization stages, with a small fraction of the crystalline phase, the main changes in the X-ray diffraction patterns are observed in the region of the first diffuse maximum; therefore, these areas of the X-ray diffraction patterns are shown in the subsequent curves.
Figure 12 depicts X-ray diffraction patterns of the Co67Si12B9Fe7Nb5 samples annealed at 723 K for 1 h. The inset shows the peak of the maximum; the numbers indicate the following: 1—the initial undeformed sample (black curve); 2—the deformed sample with a deformation degree of 1% (blue curve); 3—the deformed sample with a deformation degree of 20% (red curve).
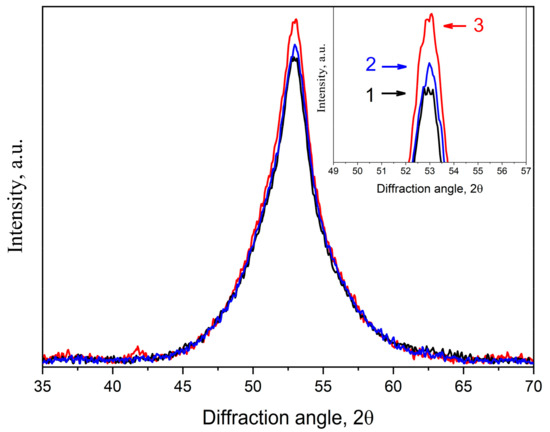
Figure 12.
X-ray diffraction patterns of the Co67Si12B9Fe7Nb5 alloy after isothermal annealing at 723 K for 1 h: 1—initial undeformed sample (black curve), 2, 3—deformed sample (deformation degree of 1%, blue curve, and 20%, red curve).
X-ray diffraction patterns of the samples at the first crystallization stage are a superposition of diffraction reflections from the crystalline phase and diffuse scattering from the amorphous phase. To determine the fraction and size of the formed crystals, the overlapping maxima were separated into crystalline and amorphous parts. When separating the overlapping maxima, the parameters (positions and half-widths) of the initial amorphous phases (samples before the treatment) were used. The X-ray diffraction patterns (Figure 12, curves 1–3) with separated maxima are presented in Figure 13. Figure 13a is an X-ray diffraction pattern of the initial undeformed sample (curve 1 in Figure 13); Figure 13b is an X-ray diffraction pattern of the deformed sample with a deformation degree of 1% (curve 2 in Figure 12); and Figure 13c corresponds to an X-ray diffraction pattern of the deformed sample with a deformation degree of 20% (curve 3 in Figure 13). In Figure 13a–c, the numbers indicate the following: 1—an experimental curve (black curve); 2—a total calculated curve (the sum of curves 3 and 4, red curve); 3—a diffuse reflection from the amorphous phase (blue curve); 4—a diffraction peak (110) corresponded to bcc crystals (green curve).
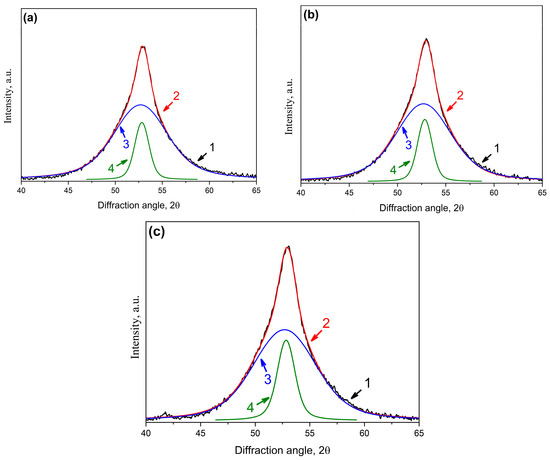
Figure 13.
XRD patterns of the Co67Si12B9Fe7Nb5 alloy after isothermal annealing at 723 K for 1 h: (a) undeformed sample; (b) deformed sample with a deformation degree of 1%; (c) deformed sample with a deformation degree of 20% (1—experimental curve (black), 2—total curve (curves 3 + 4, red), 3—diffuse scattering from the amorphous phase (blue), 4—diffraction peak from the crystalline phase—bcc crystals (green)).
An analysis of the integral reflection intensity showed that the intensity of the (110) diffraction line from bcc crystals (Figure 13a–c, curves 4) in the deformed samples was higher than in the initial sample. With an increase in the deformation, the intensity of reflection from bcc crystals increased, which indicates the formation of a larger number of nanocrystals in the deformed samples. The fraction of the crystalline phase increased with an increasing deformation degree. Based on the data obtained for the integral intensities of reflections from bcc crystals and scattering from the amorphous phase, the fraction of the crystalline phase in the samples under study was estimated. The estimation showed that the proportion of crystals in the initial sample was 14%. In the deformed sample with a deformation degree of 1%, the proportion of crystals slightly increased. In this sample, it was 17%. When analyzing the integral intensities of the maxima in the deformed sample with a higher deformation degree (20%), it turned out that the proportion of crystals increased noticeably. In this case, it was 20%. The crystal size was determined from the half-width of the diffraction line. In the initial sample and the deformed sample with a deformation degree of 1%, the crystal size was the same and was 10 nm. At a higher deformation degree, the size of the formed crystals turned out to be smaller—8 nm. The deformation did not lead to a change in the lattice parameter of the bcc crystals formed during heat treatment. The obtained data are summarized in Table 3.

Table 3.
Size and fraction of bcc crystals in the Co67Si12B9Fe7Nb5 samples after isothermal annealing at 723 K for 1 h.
The amorphous Co56B20Fe16Nb8 alloy was subjected to a lower degree of deformation. Figure 14 shows X-ray diffraction patterns of the Co56B20Fe16Nb8 samples annealed at 758 K for 1 h. The inset shows the peak of the maximum; the numbers indicate the following: 1—the initial undeformed sample; 2—the deformed sample with a deformation degree of 5%.
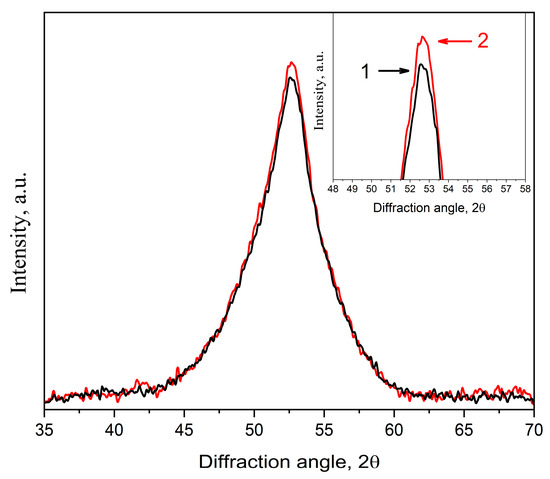
Figure 14.
XRD patterns of the Co56B20Fe16Nb8 alloy annealed at 758 K for 1 h: 1—initial undeformed sample (black curve), 2—deformed sample with a deformation degree of 5% (red curve).
It can also be seen that the intensity increased in the deformed sample (Figure 14, curve 2), which indicates a slight increase in the fraction of bcc crystals. The estimation showed that the fraction of crystals in the deformed sample was slightly higher than in the initial sample, while the nanocrystals size was the same and was 7 nm. The lattice parameter of bcc crystals in the deformed and undeformed samples was the same.
Hence, the proportion of nanocrystals in the pre-deformed amorphous alloys after heat treatment was higher than in the undeformed alloys, and the nanocrystal size was smaller. The observed effect (a change in the fraction and size of nanocrystals) in the amorphous Co67Si12B9Fe7Nb5 alloy was much greater than in Co56B20Fe16Nb8, which is obviously associated with different degrees of deformation.
3.4. Crystallization of Samples with a Protective Coating
As shown above, free volume plays a great role in the processes of crystallization of amorphous alloys. The results obtained in [71] indicate the possibility of obtaining a higher fraction of nanocrystals under conditions that would allow maintaining free volume. By analogy with [71], the crystallization of deformed amorphous alloys with a protective coating was studied. The studies were carried out on the amorphous Co56B20Fe16Nb8 alloy with a deformation degree of 5%. As mentioned in the Materials and Methods, the deformed Co56B20Fe16Nb8 sample was coated with a protective Ta coating (Figure 1); after the application, the sample remained amorphous. The coated and uncoated samples were subjected to isothermal annealing at 758 K for 1 h. Figure 15 shows X-ray diffraction patterns of the Co56B20Fe16Nb8 samples after annealing (1—the uncoated sample; 2—the sample with a protective Ta coating). As in previous cases, the experimental curves were divided into components (Figure 16a,b): diffuse scattering from the amorphous phase (curves 3 in Figure 16a,b) and diffraction reflection (110) from the bcc phase (curves 4 in Figure 16a,b).
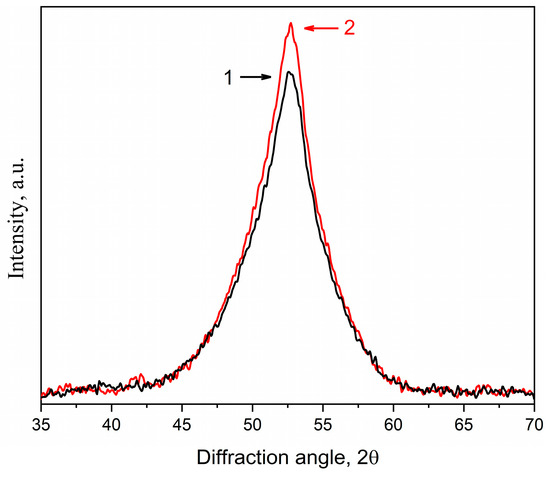
Figure 15.
XRD patterns of the Co56B20Fe16Nb8 alloy annealed at 758 K for 1 h: 1—uncoated sample (black curve), 2—sample with a protective Ta coating (red curve).
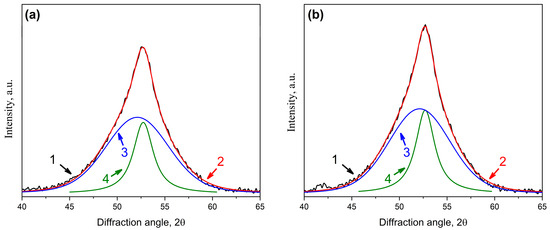
Figure 16.
XRD patterns of the Co56B20Fe16Nb8 alloy annealed at 758 K for 1 h: (a) uncoated sample; (b) sample with a protective Ta coating (1—experimental curve (black), 2—total curve (curves 3 + 4, red), 3—diffuse scattering from the amorphous phase (blue), 4—diffraction line from bcc crystals (green)).
It is clear from the obtained X-ray diffraction patterns that the peak intensity in the sample with a protective Ta coating is significantly higher than in the uncoated sample.
An analysis of the integral intensities of reflections from the bcc crystals and scatterings from the amorphous phase showed that the fraction of bcc crystals was 26% in the uncoated sample and 30% in the sample with a protective Ta coating. The size of the crystals in the uncoated sample was 7 nm, and in the sample with a protective Ta coating, it was slightly larger—7.5 nm. The lattice parameter of the bcc phase in the samples was the same. The obtained data are summarized in Table 4.

Table 4.
Size and fraction of bcc crystals in the Co56B20Fe16Nb8 samples after isothermal annealing at 758 K for 1 h.
The state of the coating is undoubtedly important for the kinetics of crystallization and, in particular, it can play a decisive role in the kinetics of the removal of free volume from the sample to the surface. The authors of [72] observed the formation of a porous structure at the interface between a nickel based superalloy and a high-entropy rare-earth aluminate (Y0.2Yb0.2Lu0.2Eu0.2Er0.2)3Al5O12 coating. The coating thickness in this case was 5 µm. In our case, the thickness of the coating was significantly smaller (100 nm), and we did not observe the formation of pores in the area between the sample and the coating.
As a result of the studies, we found the following:
- -
- At the initial stage of crystallization of amorphous alloys of the Co-(Si)-B system alloyed with Fe and Nb, nanocrystals of a metastable phase with a bcc lattice were formed, the parameters of which depended on the composition of the alloy;
- -
- Preliminary deformation before crystallization contributed to a rise in the proportion of the nanocrystalline phase, while its lattice parameter remained unchanged;
- -
- The proportion of the nanocrystalline phase in samples with a protective coating was higher than in samples without a coating.
The results obtained agree with the known data on the effect of free volume on the processes of crystallization of the amorphous alloys [43,44,71]. As mentioned above, plastic deformation leads to a noticeable increase in free volume and acceleration of diffusion mass transfer processes in the region of shear bands. The characteristics of shear bands (size, number, location, etc.) naturally depend on the method of deformation. When using the method of multiple rolling, the near-surface regions of the samples are subjected to the highest deformation. It was shown in [51] that with this deformation method, a change in the fraction of free volume in the near-surface and deeper layers of samples could differ by a factor of two to three. Since the amount of free volume depends on the deformation degree, crystallization processes in samples with a higher deformation degree should proceed faster, which is observed experimentally.
Under conditions of maintaining free volume, nanocrystallization processes should be facilitated. During heat treatment, the free volume leaves the amorphous phase by diffusion, annihilating on the sample surface. As mentioned above, to maintain the free volume in the amorphous phase, it was proposed in [55] to use protective crystalline coatings with a high energy of vacancy formation compared to that in the amorphous phase. Our estimate of the energy of vacancy formation in the Co56B20Fe16Nb8 alloy is 1.7 × 1029 eV/m3. Since the energy of vacancy formation in a protective Ta coating is approximately 1.6 times higher than that in the alloy under study (2.7 × 1029 eV/m3 in Ta and 1.7 × 1029 eV/m3 in the alloy under study), this coating should effectively prevent the release of free volume to the surface sample. The results obtained (an increase in the nanocrystal fraction in the coated sample) confirm the effectiveness of using a protective coating to maintain the free volume and increase the fraction of the nanocrystalline component in the structure. This increase in the fraction of the nanocrystalline phase in the samples with a protective coating agrees with the previously obtained data for Al87Ni8Gd5 [71] and Fe78Si13B9 [73].
The possibility of increasing the concentration of free volume in the amorphous phase during plastic deformation and maintaining it using protective coatings provides new ways to control the parameters of the crystal structure being formed, and, as a result, to obtain new materials with record physical and chemical properties.
Thus, the important results of the study are the following:
- -
- The coating of amorphous alloys with a crystalline layer proposed in [55], indeed, allow for maintaining the free volume in the amorphous phase,
- -
- The free volume introduced during the deformation of an amorphous alloy helps to accelerate the process of nanocrystallization.
Knowledge of these features of the amorphous alloy crystallization opens up ways to create structures with the desired structural parameters and, as a consequence, with the desired properties.
4. Conclusions
The effect of protective coatings on the crystallization of the amorphous Co67Si12B9Fe7Nb5 and Co56B20Fe16Nb8 alloys was studied using the methods of X-ray diffraction, differential scanning calorimetry, and transmission electron microscopy. The crystallization of the amorphous alloys was investigated on as-prepared samples, deformed samples, and deformed samples with a protective coating.
- -
- The activation energies of the first crystallization stage of both alloys were determined. The activation energy of crystallization of Co56B20Fe16Nb8 alloy is higher than that of Co67Si12B9Fe7Nb5 alloy.
- -
- The nanocrystals of a metastable bcc phase were formed in the amorphous alloy at the first crystallization stage.
- -
- The proportion of the formed nanocrystalline phase depended on the degree of deformation. After the completion of the first crystallization stage, the fraction of the nanocrystalline phase in the pre-deformed Co67Si12B9Fe7Nb5 alloy (deformation degree of 20%) was ~1.4 times higher than in the undeformed alloy.
- -
- The proportion of the crystalline phase in the samples with a protective Ta coating was higher than in the samples without a coating. The formed crystals in the deformed samples were smaller, and in the deformed samples with a protective Ta coating, they were slightly larger than in the corresponding initial alloys.
Author Contributions
Conceptualization, G.A. and A.A.; Software, V.C. and N.V.; Validation, N.V. and B.S.; Formal analysis, N.V. and B.S.; Investigation, G.A., V.C. and A.A.; Methodology, V.C. and B.S.; Data curation, N.V. and B.S.; Writing—Original draft, V.C.; Writing—Review and editing, G.A. and A.A.; Project administration, G.A. and A.A.; Funding acquisition, G.A. and A.A. All authors analyzed the data, discussed the results, and wrote the paper. All authors have read and agreed to the published version of the manuscript.
Funding
This work is supported by the Russian Science Foundation (Project No. 23-23-00171).
Institutional Review Board Statement
Not applicable.
Informed Consent Statement
Not applicable.
Data Availability Statement
Data can be provided upon request.
Acknowledgments
The authors are grateful to I. Bubnov for multiple rolling of the samples.
Conflicts of Interest
The authors declare no conflicts of interest.
References
- Uriarte, J.L.; Yavari, A.R.; Suriñach, S.; Rizzi, P.; Heunen, G.; Baricco, M.; Baró, M.D.; Kvick, A. Properties of FeNiB-Based Metallic Glasses with Primary BCC and FCC Crystallisation Products. J. Magn. Magn. Mater. 2003, 254–255, 532–534. [Google Scholar] [CrossRef]
- Kim, Y.-H.; Inoue, A.; Masumoto, T. Increase in Mechanical Strength of Al-Y-Ni Amorphous Alloys by Dispersion of Nanoscale Fcc-Al Particles. Mater. Trans. JIM 1991, 32, 331–338. [Google Scholar] [CrossRef]
- Gao, M.C.; Guo, F.; Poon, S.J.; Shiflet, G.J. Development of Fcc-Al Nanocrystals in Al–Ni–Gd Metallic Glasses during Continuous Heating DSC Scan. Mater. Sci. Eng. A 2008, 485, 532–543. [Google Scholar] [CrossRef]
- Anghelus, A.; Avettand-Fènoël, M.-N.; Cordier, C.; Taillard, R. Thermal Crystallization of an Al 88 Ni 6 Sm 6 Metallic Glass. J. Alloys Compd. 2015, 651, 454–464. [Google Scholar] [CrossRef]
- Abadlia, L.; Daoudi, M.I.; Alleg, S. Crystallization Process, Microstructure, Thermal Behavior, and Magnetic Properties of Melt-Spun Fe86Cr6P6C2 Ribbons. Appl. Phys. A 2023, 129, 487. [Google Scholar] [CrossRef]
- Luo, Y.; Ke, H.; Zeng, R.; Liu, X.; Luo, J.; Zhang, P. Crystallization Behavior of Zr60Cu20Fe10Al10 Amorphous Alloy. J. Non. Cryst. Solids 2020, 528, 119728. [Google Scholar] [CrossRef]
- Kovács, Z.; Henits, P.; Zhilyaev, A.P.; Révész, Á. Deformation Induced Primary Crystallization in a Thermally Non-Primary Crystallizing Amorphous Al85Ce8Ni5Co2 Alloy. Scr. Mater. 2006, 54, 1733–1737. [Google Scholar] [CrossRef]
- Lu, X.; Feng, S.; Li, L.; Zhang, Y.; Wang, X.; Li, Z.; Wang, L. Severe Deformation-Induced Microstructural Heterogeneities in Cu64 Zr36 Metallic Glass. Model. Simul. Mat. Sci. Eng. 2022, 30, 065005. [Google Scholar] [CrossRef]
- Stoica, M.; Das, J.; Bednarcik, J.; Franz, H.; Mattern, N.; Wang, W.H.; Eckert, J. Strain Distribution in Zr64.13Cu15.75Ni10.12Al10 Bulk Metallic Glass Investigated by in Situ Tensile Tests under Synchrotron Radiation. J. Appl. Phys. 2008, 104, 013522. [Google Scholar] [CrossRef]
- Boucharat, N.; Hebert, R.; Rösner, H.; Valiev, R.; Wilde, G. Nanocrystallization of Amorphous Al88Y7Fe5 Alloy Induced by Plastic Deformation. Scr. Mater. 2005, 53, 823–828. [Google Scholar] [CrossRef]
- Kovács, Z.; Henits, P.; Hóbor, S.; Révész, Á. Nanocrystallization Process in Amorphous Alloys during Severe Plastic Deformation and Thermal Treatments. Rev. Adv. Mater. Sci. 2008, 18, 593–596. [Google Scholar]
- Kim, J.-J.; Choi, Y.; Suresh, S.; Argon, A.S. Nanocrystallization During Nanoindentation of a Bulk Amorphous Metal Alloy at Room Temperature. Science 2002, 295, 654–657. [Google Scholar] [CrossRef] [PubMed]
- Boucharat, N.; Hebert, R.; Rösner, H.; Valiev, R.Z.; Wilde, G. Synthesis Routes for Controlling the Microstructure in Nanostructured Al88Y7Fe5 Alloys. J. Alloys Compd. 2007, 434–435, 252–254. [Google Scholar] [CrossRef]
- Chang, H.J.; Kim, D.H.; Kim, Y.M.; Kim, Y.J.; Chattopadhyay, K. On the Origin of Nanocrystals in the Shear Band in a Quasicrystal Forming Bulk Metallic Glass Ti40Zr29Cu9Ni8Be14. Scr. Mater. 2006, 55, 509–512. [Google Scholar] [CrossRef]
- Gunderov, D.; Astanin, V. Influence of HPT Deformation on the Structure and Properties of Amorphous Alloys. Metals 2020, 10, 415. [Google Scholar] [CrossRef]
- Hebert, R.J.; Perepezko, J.H. Effect of Intense Rolling and Folding on the Phase Stability of Amorphous Al-Y-Fe Alloys. Metall. Mater. Trans. A 2008, 39, 1804–1811. [Google Scholar] [CrossRef]
- Henits, P.; Révész, Á.; Zhilyaev, A.P.; Kovács, Z. Severe Plastic Deformation Induced Nanocrystallization of Melt-Spun Al85Y8Ni5Co2 Amorphous Alloy. J. Alloys Compd. 2008, 461, 195–199. [Google Scholar] [CrossRef]
- Yavari, A.R.; Georgarakis, K.; Antonowicz, J.; Stoica, M.; Nishiyama, N.; Vaughan, G.; Chen, M.; Pons, M. Crystallization during Bending of a Pd-Based Metallic Glass Detected by X-Ray Microscopy. Phys. Rev. Lett. 2012, 109, 085501. [Google Scholar] [CrossRef]
- Ogawa, Y.; Nunogaki, K.; Endo, S.; Kiritani, M.; Fujita, F.F. Crystallization of Amorphous Fe-B Alloys under Pressure. In Proceedings of the Fourth International Conference on Rapidly Quenched Metals, Sendai, Japan, 24–28 August 1981; pp. 675–678. [Google Scholar]
- Khan, Y.; Sostarich, M. Dynamic Temperature X-ray Diffraction Analysis of the Amorphous Fe80B20 Alloy. Int. J. Mater. Res. 1981, 72, 266–268. [Google Scholar] [CrossRef]
- Kulik, T. Nanocrystallization of Metallic Glasses. J. Non. Cryst. Solids 2001, 287, 145–161. [Google Scholar] [CrossRef]
- Zaluska, A.; Zaluski, L.; Witek, A. Application of Scanning Tunneling Microscopy for Crystallization Studies of Metallic Glasses. Mater. Sci. Eng. A 1989, 122, 251–255. [Google Scholar] [CrossRef]
- Cremaschi, V.; Arcondo, B.; Sirkin, H.; Vázquez, M.; Asenjo, A.; Garcia, J.M.; Abrosimova, G.; Aronin, A. Huge Magnetic Hardening Ascribed to Metastable Crystallites during First Stages of Devitrification of Amorphous FeSiBNbSn Alloys. J. Mater. Res. 2000, 15, 1936–1942. [Google Scholar] [CrossRef]
- Abrosimova, G.; Aronin, A.; Matveev, D.; Zverkova, I.; Molokanov, V.; Pan, S.; Slipenyuk, A. The Structure and Mechanical Properties of Bulk Zr50Ti16.5Cu14Ni18.5 Metallic Glass. J. Mater. Sci. 2001, 36, 3933–3939. [Google Scholar] [CrossRef]
- Herold, U.; Koster, U. Rapidly Quenched Metals III. Proceedings of the Third International Conference on Rapidly Quenched Metals, Organised Jointly by the Materials Science Group of the University of Sussex and the Metals Society, London, and Held at the University of Sussex, Brighton, on 3–7 July; Cantor, B., Ed.; Brighton Metals Society: London, UK, 1978. [Google Scholar]
- Birac, C.; Lesueur, D. Diffusion atomique du lithium dans l’alliage métallique amorphe Pd–Si. Phys. Status Solidi. 1976, 36a, 247. [Google Scholar] [CrossRef]
- Koster, U.; Herold, U. Glassy Metals II. Atomic Structure and Dynamics, Electronic Structure, Magnetic Property; Beck, H., Gűntherodt, H.-J., Eds.; Springer: Berlin, Germany, 1983. [Google Scholar]
- Cuevas, F.G.; Lozano-Perez, S.; Aranda, R.M.; Astacio, R. Crystallization Process and Microstructural Evolution of Melt Spun Al-RE-Ni-(Cu) Ribbons. Metals 2020, 10, 443. [Google Scholar] [CrossRef]
- Yoshizawa, Y.; Oguma, S.; Yamauchi, K. New Fe-Based Soft Magnetic Alloys Composed of Ultrafine Grain Structure. J. Appl. Phys. 1988, 64, 6044–6046. [Google Scholar] [CrossRef]
- Trudeau, M.L.; Huot, J.Y.; Schulz, R.; Dussault, D.; Van Neste, A.; L’Espérance, G. Nanocrystalline Fe-(Co,Ni)-Si-B: The mechanical crystallization of amorphous alloys and the effects on electrocatalytic reactions. Phys. Rev. 1992, B 45, 4626. [Google Scholar] [CrossRef]
- Greer, A.L.; Cheng, Y.Q.; Ma, E. Shear Bands in Metallic Glasses. Mater. Sci. Eng. R Rep. 2013, 74, 71–132. [Google Scholar] [CrossRef]
- Talaat, A.; Zhukova, V.; Ipatov, M.; Blanco, J.M.; Gonzalez-Legarreta, L.; Hernando, B.; Del Val, J.J.; Gonzalez, J.; Zhukov, A. Optimization of the Giant Magnetoimpedance Effect of Finemet-Type Microwires through the Nanocrystallization. J. Appl. Phys. 2014, 115, 17A313. [Google Scholar] [CrossRef]
- Conde, C.F.; Blázquez, J.S.; Conde, A. Nanocrystallization Process of the Hitperm Fe-Co-Nb-B Alloys. In Properties and Applications of Nanocrystalline Alloys from Amorphous Precursors; Idzikowski, B., Švec, P., Miglierini, M., Eds.; NATO Science Series; Springer-Verlag: Berlin/Heidelberg, Germany, 2005; Volume 184, pp. 111–121. ISBN 978-1-4020-2963-9. [Google Scholar]
- Kane, S.N.; Gupta, A.; Sarabhai, S.D.; Kraus, L. Influence of Co Content on Structural and Magnetic Properties of CoxFe84−xNb7B9 Alloys. J. Magn. Magn. Mater. 2003, 254–255, 495–497. [Google Scholar] [CrossRef]
- Şopu, D.; Scudino, S.; Bian, X.L.; Gammer, C.; Eckert, J. Atomic-Scale Origin of Shear Band Multiplication in Heterogeneous Metallic Glasses. Scr. Mater. 2020, 178, 57–61. [Google Scholar] [CrossRef]
- Maaß, R.; Löffler, J.F. Shear-Band Dynamics in Metallic Glasses. Adv. Funct. Mater. 2015, 25, 2353–2368. [Google Scholar] [CrossRef]
- Ma, G.Z.; Song, K.K.; Sun, B.A.; Yan, Z.J.; Kühn, U.; Chen, D.; Eckert, J. Effect of Cold-Rolling on the Crystallization Behavior of a CuZr-Based Bulk Metallic Glass. J. Mater. Sci. 2013, 48, 6825–6832. [Google Scholar] [CrossRef]
- Wilde, G.; Rösner, H. Nanocrystallization in a Shear Band: An in Situ Investigation. Appl. Phys. Lett. 2011, 98, 251904. [Google Scholar] [CrossRef]
- Davani, F.A.; Hilke, S.; Rösner, H.; Geissler, D.; Gebert, A.; Wilde, G. On the Shear-Affected Zone of Shear Bands in Bulk Metallic Glasses. J. Alloys Compd. 2020, 837, 155494. [Google Scholar] [CrossRef]
- Suzuki, K.; Fujimori, H.; Hashimoto, K. Materials Science of Amorphous Metals; Masumoto, T., Ed.; Ohmu: Tokyo, Japan, 1982. [Google Scholar]
- He, J.; Kaban, I.; Mattern, N.; Song, K.; Sun, B.; Zhao, J.; Kim, D.H.; Eckert, J.; Greer, A.L. Local Microstructure Evolution at Shear Bands in Metallic Glasses with Nanoscale Phase Separation. Sci. Rep. 2016, 6, 25832. [Google Scholar] [CrossRef]
- Hassanpour, A.; Vaidya, M.; Divinski, S.V.; Wilde, G. Impact of Cryogenic Cycling on Tracer Diffusion in Plastically Deformed Pd40Ni40P20 Bulk Metallic Glass. Acta Mater. 2021, 209, 116785. [Google Scholar] [CrossRef]
- Rösner, H.; Peterlechner, M.; Kübel, C.; Schmidt, V.; Wilde, G. Density Changes in Shear Bands of a Metallic Glass Determined by Correlative Analytical Transmission Electron Microscopy. Ultramicroscopy 2014, 142, 1–9. [Google Scholar] [CrossRef]
- Liu, C.; Roddatis, V.; Kenesei, P.; Maaß, R. Shear-Band Thickness and Shear-Band Cavities in a Zr-Based Metallic Glass. Acta Mater. 2017, 140, 206–216. [Google Scholar] [CrossRef]
- Aronin, A.S.; Louzguine-Luzgin, D.V. On Nanovoids Formation in Shear Bands of an Amorphous Al-Based Alloy. Mech. Mater. 2017, 113, 19–23. [Google Scholar] [CrossRef]
- Aronin, A.; Budchenko, A.; Matveev, D.; Pershina, E.; Tkatch, G.; Abrosimova, G. Nanocrystal Formation in Light Metallic Glasses at Heating and Deformation. Rev. Adv. Mater. Sci. 2016, 53–69. [Google Scholar]
- Fang, J.X.; Vainio, U.; Puff, W.; Würschum, R.; Wang, X.L.; Wang, D.; Ghafari, M.; Jiang, F.; Sun, J.; Hahn, H.; et al. Atomic Structure and Structural Stability of Sc75Fe25 Nanoglasses. Nano Lett. 2012, 12, 458–463. [Google Scholar] [CrossRef] [PubMed]
- Yavari, A.R.; Moulec, A.L.; Inoue, A.; Nishiyama, N.; Lupu, N.; Matsubara, E.; Botta, W.J.; Vaughan, G.; Michiel, M.D.; Kvick, Å. Excess Free Volume in Metallic Glasses Measured by X-ray Diffraction. Acta Mater. 2005, 53, 1611–1619. [Google Scholar] [CrossRef]
- Chen, N.; Frank, R.; Asao, N.; Louzguine-Luzgin, D.V.; Sharma, P.; Wang, J.Q.; Xie, G.Q.; Ishikawa, Y.; Hatakeyama, N.; Lin, Y.C.; et al. Formation and Properties of Au-Based Nanograined Metallic Glasses. Acta Mater. 2011, 59, 6433–6440. [Google Scholar] [CrossRef]
- Pan, J.; Chen, Q.; Liu, L.; Li, Y. Softening and Dilatation in a Single Shear Band. Acta Mater. 2011, 59, 5146–5158. [Google Scholar] [CrossRef]
- Abrosimova, G.; Gunderov, D.; Postnova, E.; Aronin, A. Changes in the Structure of Amorphous Alloys under Deformation by High-Pressure Torsion and Multiple Rolling. Materials 2023, 16, 1321. [Google Scholar] [CrossRef]
- Ramachandrarao, P.; Cantor, B.; Cahn, R.W. Viscous Behaviour of Undercooled Metallic Melts. J. Non-Cryst. Solids 1977, 24, 109–120. [Google Scholar] [CrossRef]
- Egami, T. Structural Relaxation in Amorphous Alloys - Compositional Short Range Ordering. Mater. Res. Bull. 1978, 13, 557–562. [Google Scholar] [CrossRef]
- Soshiroda, T.; Koiwa, M.; Masumoto, T. The Internal Friction and Elastic Modulus of Amorphous Pd–Si and Fe–P–C Alloys. J. Non-Cryst. Solids 1976, 22, 173–187. [Google Scholar] [CrossRef]
- Chen, Z.Q.; Huang, L.; Wang, F.; Huang, P.; Lu, T.J.; Xu, K.W. Suppression of Annealing-Induced Embrittlement in Bulk Metallic Glass by Surface Crystalline Coating. Mater. Des. 2016, 109, 179–185. [Google Scholar] [CrossRef]
- Li, Y.H.; Yang, C.; Kang, L.M.; Zhao, H.D.; Qu, S.G.; Li, X.Q.; Zhang, W.W.; Li, Y.Y. Non-Isothermal and Isothermal Crystallization Kinetics and Their Effect on Microstructure of Sintered and Crystallized TiNbZrTaSi Bulk Alloys. J. Non-Cryst. Solids 2016, 432, 440–452. [Google Scholar] [CrossRef]
- Han, J.; Hong, J.; Kwon, S.; Choi-Yim, H.J. Effect of Cr Addition on Magnetic Properties and Corrosion Resistance of Optimized Co and Fe-Based Amorphous Alloys. Metals 2021, 11, 304. [Google Scholar] [CrossRef]
- Veligatla, M.; Katakam, S.; Das, S.; Dahotre, N.; Gopalan, R.; Prabhu, D.; Babu, D.A.; Choi-Yim, H.; Mukherjee, S. Effect of Iron on the Enhancement of Magnetic Properties for Cobalt-Based Soft Magnetic Metallic Glasses. Metall. Mater. Trans. A 2015, 46, 1019. [Google Scholar] [CrossRef]
- Yoo, C.-S.; Lim, S.K.; Yoon, C.S.; Kim, C.K. Effect of Pt addition on the crystallization of Co-based amorphous metallic alloys. J. Alloys Compd. 2003, 359, 261. [Google Scholar] [CrossRef]
- Huang, D.; Li, Y.; Yang, Y.; Zhu, Z.; Zhang, W. Soft magnetic Co-based Co–Fe–B–Si–P bulk metallic glasses with high saturation magnetic flux density of over 1.2 T. J. Alloys Compd. 2020, 84, 154862. [Google Scholar] [CrossRef]
- Guinier, A. Théorie et Technique de La Radiocristallographie; Dunod: Paris, France, 1956. [Google Scholar]
- Kissinger, H.E. Variation of Peak Temperature with Heating Rate in Differential Thermal Analysis. J. Res. Natl. Bur. Stan. 1956, 57, 217. [Google Scholar] [CrossRef]
- Ozawa, T. A New Method of Analyzing Thermogravimetric Data. BCSJ 1965, 38, 1881–1886. [Google Scholar] [CrossRef]
- Augis, J.A.; Bennett, J.E. Calculation of the Avrami Parameters for Heterogeneous Solid State Reactions Using a Modification of the Kissinger Method. J. Therm. Anal. 1978, 13, 283–292. [Google Scholar] [CrossRef]
- Muhgalin, V.V.; Dorofeev, G.A.; Eremina, M.A.; Lad’yanov, V.I.; Sapegina, I.V. Nanocrystallization of the Amorphous Co-B-Si Alloys Formed by Melt Spinning and Mechanical Alloying. Phys. Metals Metallogr. 2011, 112, 596–602. [Google Scholar] [CrossRef]
- Babu, D.A.; Chelvane, J.A.; Akhtar, D.; Prasad, K.S.; Chandrasekaran, V. Influence of Quenching Rate on the Structural, Soft Magnetic and Magnetoimpedance Properties of Melt-Spun Co69Fe7Si14B10 Alloy. J. Magn. Magn. Mater. 2009, 321, 3084–3089. [Google Scholar] [CrossRef]
- Kulik, T.; Matyja, H.; Lisowski, B. Magnetization of Amorphous and Crystalline Co-Si-B Alloys. Mater. Sci. Eng. 1988, 99, 77–80. [Google Scholar] [CrossRef]
- Elmanov, G.N.; Chernavskii, P.A.; Kozlov, I.V.; Dzhumaev, P.S.; Kostitsyna, E.V.; Tarasov, V.P.; Ignatov, A.S.; Gudoshnikov, S.A. Effect of Heat Treatment on Phase Transformations and Magnetization of Amorphous Co69Fe4Cr4Si12B11 Microwires. J. Alloys Compd. 2018, 741, 648–655. [Google Scholar] [CrossRef]
- Abrosimova, G.; Volkov, N.; Orlova, N.; Aronin, A. BCC Nanocrystal Formation in an Amorphous Co-Si-B-Fe-Nb Alloy on Heating. Mater. Lett. 2018, 219, 97–99. [Google Scholar] [CrossRef]
- Abrosimova, G.E.; Volkov, N.A.; Pershina, E.A.; Chirkova, V.V.; Sholin, I.A.; Aronin, A.S. Formation of Bcc Nanocrystals in Co-Based Amorphous Alloys. J. Non-Cryst. Solids 2021, 565, 120864. [Google Scholar] [CrossRef]
- Abrosimova, G.; Chirkova, V.; Pershina, E.; Volkov, N.; Sholin, I.; Aronin, A. The Effect of Free Volume on the Crystallization of Al87Ni8Gd5 Amorphous Alloy. Metals 2022, 12, 332. [Google Scholar] [CrossRef]
- Wang, K.; Zhu, J.; Wang, H.; Yang, K.; Zhu, Y.; Qing, Y.; Ma, Z.; Gao, L.; Liu, Y.; Wei, S.; et al. Air plasma-sprayed high-entropy (Y0.2Yb0.2Lu0.2Eu0.2Er0.2)3Al5O12 coating with high thermal protection performance. J. Adv. Ceram. 2022, 11, 1571–1582. [Google Scholar] [CrossRef]
- Abrosimova, G.; Chirkova, V.; Matveev, D.; Pershina, E.; Volkov, N.; Aronin, A. Influence of a protective coating on the crystallization of an amorphous Fe78Si13B9 alloy. Metals 2023, 13, 1090. [Google Scholar] [CrossRef]
Disclaimer/Publisher’s Note: The statements, opinions and data contained in all publications are solely those of the individual author(s) and contributor(s) and not of MDPI and/or the editor(s). MDPI and/or the editor(s) disclaim responsibility for any injury to people or property resulting from any ideas, methods, instructions or products referred to in the content. |
© 2024 by the authors. Licensee MDPI, Basel, Switzerland. This article is an open access article distributed under the terms and conditions of the Creative Commons Attribution (CC BY) license (https://creativecommons.org/licenses/by/4.0/).