Abstract
As people spend more than 80% of the day in an indoor built environment, indoor air quality pollution caused by volatile organic compounds (VOCs) emitted from wood-based panels has attracted attention. PVC veneered plywood used in the indoor built environment and relevant VOCs and odor emission under different air exchange rates were studied in this research. Microcell thermal extraction technology was used to sample under the conditions of three different air exchange rates and loading factors: 0.2 m3·h−1·m−2, 0.5 m3·h−1·m−2, and 1.0 m3·h−1·m−2, respectively. Gas Chromatography-Olfactometry-Mass Spectrometry (GC-MS-O) was used to analyze VOCs and their odor release characteristics. The key odor characteristic compounds were analyzed by subjective and objective methods, and the main sources of odor release from the board were analyzed. In this experiment, the time-intensity method is mainly used to analyze the mass concentration of VOCs released from plywood. By comparing the mass concentration and odor intensity of VOCs released from plywood and its components under different air exchange rates and loading factors, the influence of the ratio of air exchange rate to loading factor on plywood is judged. The results show that with three different ratios of air exchange rate to loading factor, the VOCs emission concentration and odor intensity of plywood can be affected greatly and are the highest at 0.2 m3·h−1·m−2. The components released by PVC veneered plywood are mainly aromatic compounds, alkanes and aldehydes. The research findings can guide the indoor built environment design and construction process to control the emission of VOCs by adjusting the air exchange rate, which helps build more healthy and sustainable living environments for humans.
1. Introduction
With advances in science and technology, human beings have higher and higher requirements for their living environments and quality and pay more attention to indoor air pollution [1]. Therefore, it is urgent to solve the problem of indoor air pollution [2]. Veneer can not only protect wood furniture and enhance its durability, but also improve the beauty of furniture decoration. Thus, it is considered as a necessary means for the surface treatment of wood furniture. In fact, the same veneer can release different types, intensities, and toxicities of odors under different conditions [3]. In this experiment, the effect of the ratio of air exchange rate to the loading factor (the area occupied by the loaded materials within a certain volume space and its unit is m2/m3) [4] on the mass concentration of VOCs and odor intensity of the plywood was studied primarily. In order to reduce the harm of VOCs, it is necessary to understand and grasp the effect of the ratio of air exchange rate to the loading factor from plywood odor, discuss the release characteristics of VOCs, explore the odor characteristics and regularity of VOCs, and study their relationships [5,6].
Plywood material itself will emit VOCs. Adhesives and various additives used in the production processes of plywood, such as drying, hot pressing, and secondary veneering, also release a significant amount of VOCs [7]. These substances not only cause indoor air pollution, leading to a decrease in indoor air quality, but also bring serious health risks to humans. For instance, once they are absorbed by the human body, aromatic hydrocarbons contained in VOCs can accumulate and disrupt hematopoietic function, potentially causing disorders like leukemia [8]. Meanwhile, emissions of VOCs can lead to eye, nose, and throat irritation, as well as induce headaches, nausea, and difficulties with coordination. Being exposed to VOCs’ detrimental effects can lead to considerable damage to essential organs like the liver, kidneys, and central nervous system [9,10]. Presently, within the realm of indoor home furnishings, a significant number of plywood wood-based products are extensively employed due to their affordability and excellent shaping capabilities [7,8]. However, the prolonged emission of VOCs and unusual odors from these products can detrimentally impact indoor air quality and the well-being of individuals, both physically and mentally [11,12].
The use of Gas Chromatography-Mass Spectrometry-Olfactometry technology (GC-MS-O) has become a research hotspot in many fields, but it is not widely used in the indoor wooden decoration field [13,14,15,16]. The Mass Spectrometry (MS) technology can qualitatively identify the types of odor compounds, while the Gas Chromatography-Olfactometry (GC-O) technique enables the measurement of quantitative data for odor compounds. Each of these two techniques has its own advantages and drawbacks. The GC-MS-O technique efficiently combines the strengths of both methods, allowing for both qualitative and quantitative analysis of odor-characterizing compounds [17,18,19]. The odor of wood-based panels can reflect the composition of VOCs to a certain extent. Human sensory evaluation can be used to explore the odor release of wood products in order to obtain the relevant characteristics of wood products’ odor [20,21,22,23].
In this paper, a microcell extractor was used to collect the VOCs released from PVC veneered plywood under different ratios of air exchange rate to loading factor [24,25]. Combined with GC-MS-O technology, the main composition and concentration of the VOCs released by plywood were detected [26,27]. Moreover, the key odor substances released by plywood in the standard environment were analyzed and identified. The effects of VOCs and odor release level and the ratio of air exchange rate to loading factor on VOCs release and odor release from PVC veneered plywood were explored [28]. The utilization of a microcell extractor in conjunction with GC-MS-O technology enables a swift and objective investigation of the VOCs and odor emission from PVC-coated plywood [29,30]. The findings of this research can benefit the decision making of both the users and producers of plywood materials by providing better guidelines for implementing plywood to avoid extensive indoor air pollution.
There are several alternative technologies that can be applied to enhance indoor air quality and achieve a healthier indoor built environment. Ultraviolet (UV) oxidation involves using UV light to break down harmful airborne organic compounds, such as VOCs and microorganisms, into simpler and less harmful molecules [31]. Ozonation involves the use of ozone (O3) gas to eliminate odors and destroy bacteria, viruses, and other pollutants. Ozone breaks down pollutants through a process known as oxidation. However, ozone should be used carefully as high concentrations can be harmful to human health [32]. Non-thermal plasma technology generates ionized gas molecules that react with pollutants to break them down into less harmful substances. This technology can effectively target various pollutants and pathogens without requiring high temperatures, making it energy-efficient [33]. High-Efficiency Particulate Air (HEPA) filters are mechanical air filters designed to capture particles as small as 0.3 microns, including allergens, dust, and even some bacteria and viruses. They are commonly used in air purifiers and HVAC systems to improve indoor air quality [34,35]. These alternative technologies can work together with the regulation of air exchange rate studied in this experiment using GC-MS-O analysis, forming a comprehensive approach to achieving better indoor air quality and a healthier indoor environment. However, it is important to consider the specific needs and conditions of each space before implementing any technology to ensure optimal results and safety.
Based on the existing research related to VOCs emission from PVC veneered plywood, GC-MS-O technology, and the potential effect of air exchange rate, this research applies GC-MS-O technology for PVC veneered plywood VOCs emission regarding the influence of air exchange rate as is necessary. It combines several important research topics in the field of built environmental management and focuses on the issue of indoor VOCs removal which is significant in sustainable environment construction. The results of the research can offer insights for designing and constructing indoor environments, allowing for the regulation of VOC emissions through adjustments in air exchange rates. This contributes to the creation of healthier and more sustainable living spaces for humans.
2. Research Method
2.1. PVC Veneered Plywood Selection
In this experiment, plywood with the specifications of 1200 mm × 1200 mm, an 8 mm thickness, and a density of 0.70 g/cm3, sourced from a factory in Yunnan, served as the experimental base material. To meet surface decoration requirements, a veneer process was applied to the plywood. Moisture content was maintained within the range of 9% to 12%. The substrate material was subjected to hot-pressing at temperatures between 180 °C and 200 °C, while the veneered surface underwent hot-pressing at temperatures ranging from 165 °C to 215 °C. The hot-pressing factor for the substrate was 20 s per millimeter, and the finishing surface was hot-pressed for a duration of 60 to 80 s. The substrate material utilized melamine-modified urea-formaldehyde (MUF)/PF phenolic resin/urea-formaldehyde resin, while the veneer employed modified urea-formaldehyde resin adhesive. These are the critical process parameters for producing the veneered plywood.
2.2. Experimental Equipment
This research used the below equipment:
- (1)
- Sampling device
- Micro-thermal extractor: Micro-thermal extractor produced by Markes International, UK was selected. Micro-thermal extractors are widely used in the testing and research of a variety of different types of materials. Micro-thermal extractor consists of four cylindrical micro-cells, each with a diameter of 64 mm and a depth of 36 mm. It can simultaneously test organic volatile substances in four samples. After some modification, this instrument has realized the functions of stable balance control airflow, humidity and temperature regulation, and keeping the extremely low concentration in the cabin.
- Tenax-TA adsorption tube: Tenax-TA adsorption tube produced by British Markes Company (Cardiff, UK) was adopted. It is 89 mm in length and 6.4 mm in diameter. In addition, it contains Tenax-TA filler, and can effectively absorb the VOCs from the artificial board. Both ends are fitted with copper caps.
- TP-5000 universal thermal analyzer: TP-5000 universal thermal analyzer produced by Beijing Beifen Temple Instrument Technology Co., Ltd. (Beijing, China) was selected. It can release and purge the test material in Tenax adsorption tube.
- (2)
- Detection and analysis device
- Thermal desorption sampler: Thermal desorption sampler produced by Markes Company, UK was selected. The host system of Unity was adopted, high purity helium (purity greater than 99.999%) was used as carrier gas, resolution temperature of 300 °C, pipeline temperature of 180 °C, thermal resolution time of 10 min, and injection time of 1 min were set in the experiments.
- Thermal desorption automatic sampler: Thermal desorption automatic sampler produced by British Markes company was selected. It adopts automatic pressure injection with the 100-bit autosampler (a sampler that can hold 100 adsorption tubes simultaneously. This autosampler can automatically conduct detection and analysis in accordance with the sequence of these adsorption tubes) and can also be used online with the existing Unity thermal desorption host in the laboratory to achieve automatic injection.
- DSQIIGC-MS: DSQIIGC-MS produced by Thermo Co., Waltham, MA, USA was selected. It features high reliability and durability, high sensitivity, fast and accurate data analysis. Additionally, it can efficiently analyze the specific composition and concentration of VOCs. The chromatographic conditions for the experiment are as follows: chromatographic column used is a DB-5 type quartz capillary column with dimensions of 30 m × 0.25 mm × 0.25 μm. Additionally, the heating program for the experiment is as follows: initial temperature is set at 40 °C and maintained for 2 min. Within 5 min, the temperature is increased to 50 °C and held for 4 min. Over the course of 20 min, the temperature is further increased to 150 °C and maintained for 4 min. Finally, within 10 min, the temperature is raised to 250 °C and maintained for 8 min. The inlet temperature is set at 250 °C, and the split flow rate is 30 L·min−1.
- Sniffer 9000 smell detector: Smell detector produced by Swiss Brechbuhler Company (Schlieren, Switzerland) with the model of Sniffer 9100 was used. Its smell opening can be adjusted to arbitrary tilt angle, and it is flexible to operate. In addition, its heating and insulation of transmission pipeline can ensure that there is no cold spot and no sample cross contamination at the smell opening. Its humidification treatment can protect the nasal mucosa of olfactory discriminator. It can be connected with various types of gas phase or temperament. As an extension of GC technology, it provides a basic analysis platform for further judging the detailed structure of odor substances.
2.3. Sampling Method and Experiment Settings
One micro-thermal extractor was used to sample the VOCs on artificial board, with the steps as follows:
- Set the sampling conditions of the micro-thermal extractor.
- Thaw the frozen experimental samples, then put them into the micro-chamber of the micro-tank micro-thermal extractor, and close the chamber door to ensure the tightness of the chamber.
- With 8 h as the sampling cycle, insert the Tenax-TA adsorption tube into the special socket on the micro-chamber during sampling, and collect 2 L of gas material each time.
- Cover the adsorption tube for sample collection with copper cap, pack it with polytetrafluoroethylene plastic bag, label it with remarks, and place it in the refrigerator at −35 °C for future storage.
For experiment settings of this study, the experimental parameters such as exposed area of materials, chamber volume, and experiment temperature are shown in Table 1. According to the LY/T 3230-2020 standard [36], the air exchange rate under normal testing conditions should be set at 1.0 (times/hour). This study aims to investigate the data regarding the removal of indoor VOCs and odors through enhanced ventilation. Therefore, the experimental conditions are set as shown in Table 2.

Table 1.
Experimental Parameters.
Table 2.
The experimental conditions of the micro-thermal extractor.
2.4. Analysis Method
- (1)
- GC-MS
The gas in the adsorption tube was desorbed by thermal desorption through a thermal desorption injector, then the gas was analyzed by GC-MS to detect the specific gas composition and content. During the process of thermal desorption, high-purity nitrogen gas is used as the carrier gas at a flow rate ranging from 50 mL/min to 100 mL/min. The initial preheating temperature is set at 100 °C and maintained for 15 min. Afterward, the temperature is raised over 5 min to 200 °C and held for 15 min. Subsequently, the temperature is increased over 5 min to 300 °C, followed by a final temperature increase over 4 min to 380 °C. The analysis is concluded after maintaining this temperature for 15 min. Internal standard method (internal standard amount of 2 μL, and concentration of 200 ng/μL) was adopted and specific instrument software was used to study the gas chromatogram and mass spectrometry. Finally, the gas components and their respective contents were obtained.
- (2)
- GC-O
In this experiment, the time-intensity method was chosen as the analysis approach. Following the injection of the air sample and the detection of the chromatographic peak, evaluators perceived and described the outflow components from the chromatographic column via the ODP port. They meticulously documented pertinent information, encompassing the occurrence time, odor intensity, odor type, and other relevant details of these outflow components.
One GC-O odor analysis and evaluation team, which consisted of 2 sniffing ports and 4 olfactory observers, formed after screening and training in this study. All of them, aged 20~30, were non-smokers, and had no diseases of olfactory organs. Furthermore, all participants underwent odor training before the experiment. Each group of experimental samples was assigned to four analysts, each responsible for a specific dataset. The laboratory room temperature was maintained between 20 °C and 25 °C, with open windows to ensure adequate ventilation and the absence of any unfamiliar odors. Activities that could potentially affect indoor odors, such as dining, smoking, or using strongly fragranced cosmetics, were prohibited for at least 5 h prior to the test. When summarizing and consolidating experimental data and results, a minimum of two evaluators simultaneously assessed the samples. Consistent descriptions of odor characteristics were recorded, and the odor intensity results were averaged based on the assessments of all four evaluators to establish the final intensity value. Odor concentration levels were categorized in accordance with the intensity of subjects’ subjective perceptions. According to the odor classification and evaluation method for plywood panels and their products as indicated in LY/T 3236-2020 (Classification of Odors of Plywood and Its Products and Evaluation Methods) [37], the discrimination standard of the odor intensity in this experiment can be obtained (Table 3).
Table 3.
LY/T 3236-2020 standard of the odor intensity.
- (3)
- Qualitative analysis of compounds
The processing of experimental data was conducted using the Xcalibur software 4.1 system. Qualitative analysis of volatile components was confirmed using the NIST and Wiley spectroscopic libraries, with determinations featuring positive and negative match values greater than 800 (up to a maximum of 1000) retained for further analysis. Subsequently, the data were processed using Excel, and the relative percentages of various chemical components in wood odor substances were calculated using the area normalization method. This allowed for the identification of compounds, along with aroma classification and odor description.
3. Results and Discussion
3.1. Identification and Component Analysis of Odor Characteristic Compounds of PVC Veneered Plywood
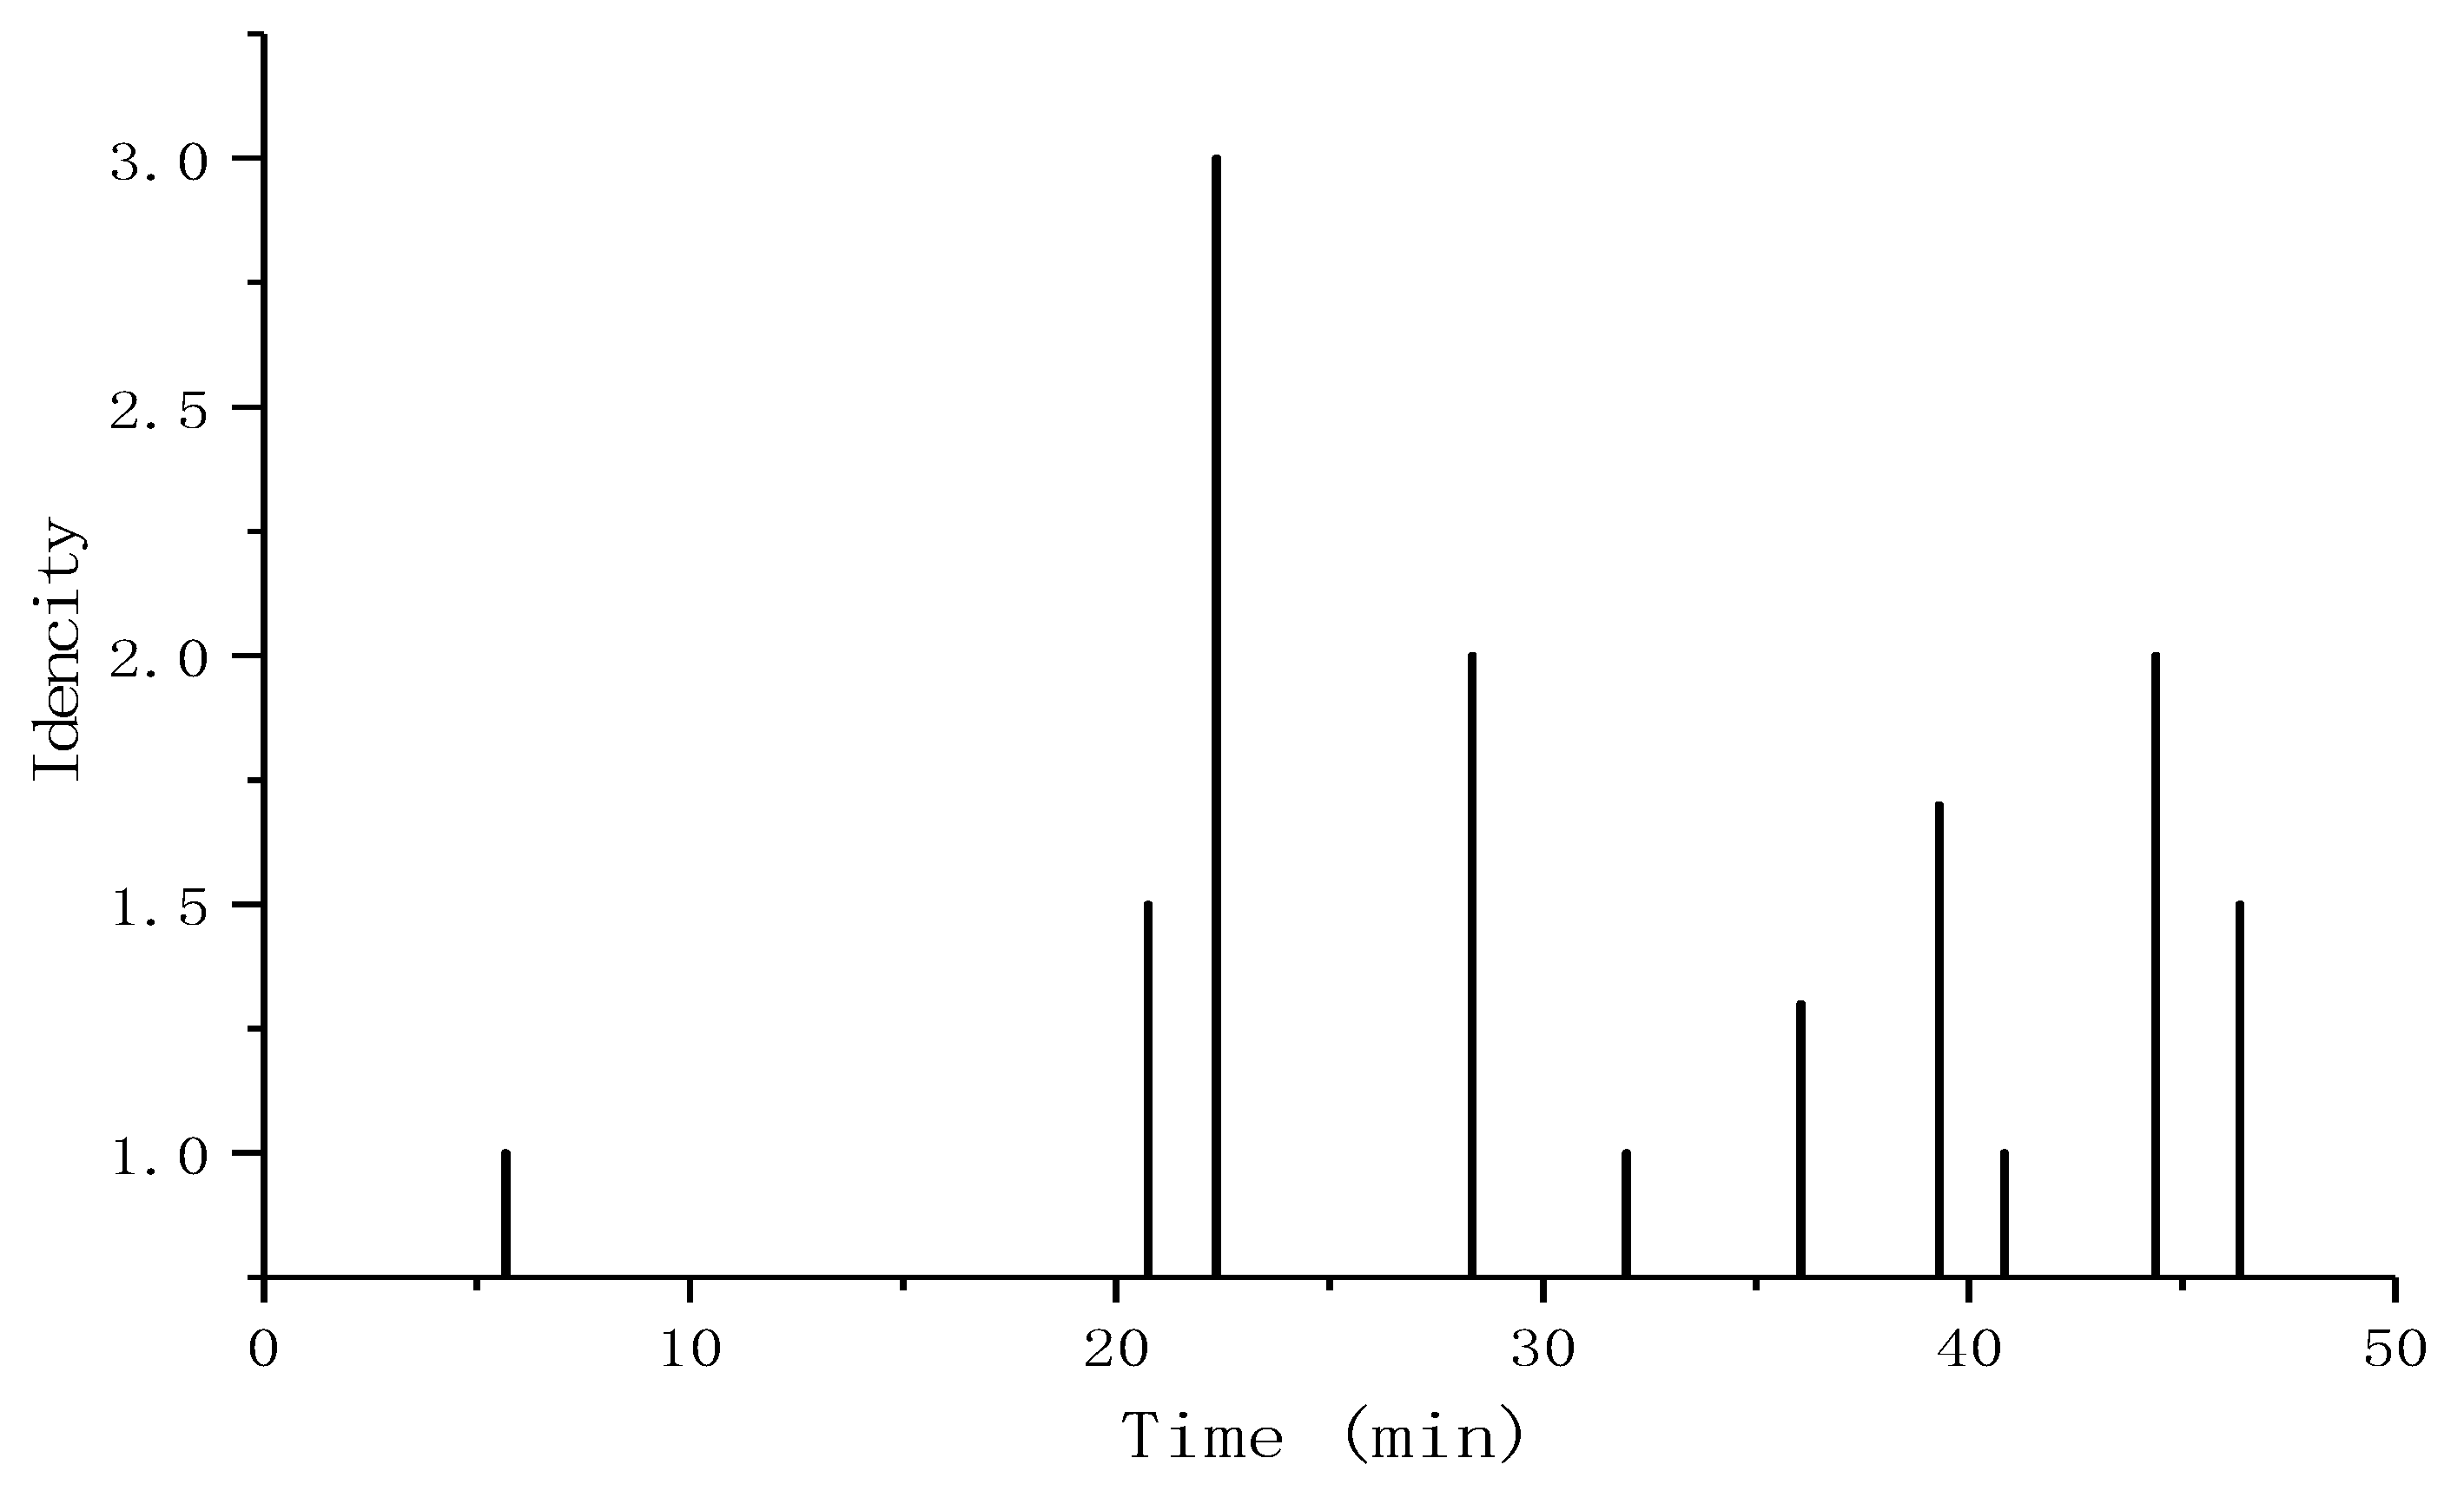
Under the experimental conditions of normal temperature (23 °C) and normal relative humidity (40%), the odor volatilized from PVC veneered plywood was collected by micro-cell extractor, and then the GC/MS internal standard method and sensory olfactory analysis method were combined for the quality analysis and qualitative study of the material released from plywood. Figure 1 shows the odor intensity map of PVC veneered plywood.
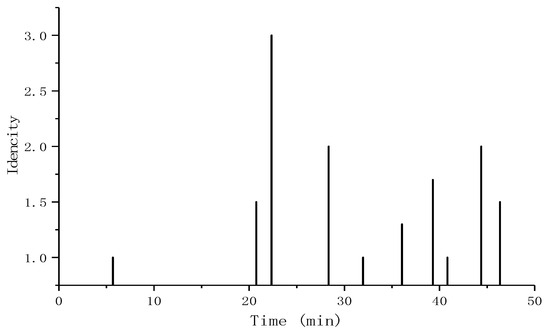
Figure 1.
Odor time-intensity map of PVC veneered plywood.
As depicted in Figure 1, the average odor intensity of the plywood board following PVC veneering treatment registered at approximately 1.5. The odor-characteristic compounds appearing around 22 min exhibited the highest odor intensity value, reaching a level of 3. The timing of odor occurrence in PVC veneered plywood material was somewhat scattered, yet predominantly centered between 20 and 50 min.
Table 4 presents a comprehensive breakdown, revealing that a total of 31 different substances were released from PVC veneered plywood. Among these, aromatic hydrocarbon compounds were the most prevalent, followed by alkanes, aldehydes, ketones, and esters. Notably, PVC veneered plywood released two additional types of volatile organic compounds (VOCs) compared to plain plywood boards. This can be attributed to the use of thermoplastic plastic film coating on the wood-based panel substrate, resulting in the PVC veneered material having a certain degree of volatile content and resin content.
Table 4.
The classification of compounds released from PVC veneered plywood.
Table 5 shows the types of the compound composition released by PVC plywood during the experiments. Based on the data obtained and analyzed by GC-O, 15 kinds of compounds in total were found. Among them, 10 have odor characteristics (some compounds are roughly regarded as odorless because their concentrations are below the odor threshold in this experiment), including benzene (baking aroma, and mass concentration of 6.67 µg·cm−3), toluene (odorless, and mass concentration of 25.51 µg·cm−3), 1,3-dimethylbenzene (odorless, and mass concentration of 10.47 µg·cm−3), 1-methylene-1H-indene (slightly bitter, and mass concentration of 14.23 µg·cm−3), 2-methylnaphthalene (wheat aroma, and mass concentration of 14.98 µg·cm−3), biphenyl (tasteless, and mass concentration of 13.26 µg·cm−3), 1,7-dimethylnaphthalene (mixed smell, and mass concentration of 8.15 µg·cm−3), acenaphthene (tasteless, and mass concentration of 17.46 µg·cm−3), dibenzofuran (almond flavor, and mass concentration of 41.48 µg·cm−3), fluorene (aromatic, and mass concentration of 45.86 µg·cm−3), phenanthrene (aromatic, and mass concentration of 26.97 µg·cm−3), 2,2,7,7-tetramethyloctane (floral, and mass concentration of 30.89 µg·cm−3), 2-ethyl-1-hexanol (burnt smell, and mass concentration of 23.53 µg·cm−3), and dibutyl phthalate (odor, and mass concentration of 12.1 µg·cm−3).
Table 5.
Odor characteristic compounds of PVC veneered plywood.
Most of these odorant compounds had higher mass concentration (larger content). Among them, benzene (baking aroma) had the shortest retention time, and dibutyl phthalate (odor) had the longest retention time. From the perspective of sensory evaluation, researchers used the evaluation criteria defined in standard LY/T 3236-2020 as reference to conduct the sensory assessment. The results showed the following:
- 2-methylnaphthalene (wheat aroma) had the highest value, followed by 1-methylene-1H-indene (slightly bitter odor), 1,7-dimethylnaphthalene (mixed odor), phenanthrene (aroma), and 2-ethyl-1-hexanol (burnt smell). The above five compounds contributed significantly to the odor of the PVC veneered plywood.
- Benzene (baking aroma), dibenzofuran (almond flavor), fluorene (aroma), 2,2,7,7-tetramethyloctane (floral), and dibutyl phthalate (odor) had relative low value in sensory evaluation. The five compounds had a minor effect on the odor of PVC veneered plywood.
- The aromatic compounds had the largest proportion of PVC veneered plywood (there were 12 substances), and were followed by alkanes, alcohols, and esters (each with one substance). In addition, the aromatic compounds that accounted for the largest proportion also had larger odor intensity, and their odor characteristics were mostly fragrant. Therefore, the aromatic compounds (with the smell of aroma) had a great impact on the odor of PVC veneered plywood.
3.2. Effect of Air Exchange Rate on TVOC and Odor Emission of Veneered Plywood
One micro-thermal extractor was used to sample under the experimental conditions of T1, T2, and T3. GC-MS-O was used to detect and analyze the VOCs released from PVC veneered plywood and their odor intensity. The TVOC release level was obtained, as shown in Table 6 and Table 7. Table 8 shows the Pearson Correlation analysis of VOCs mass concentration and odor intensity. The results indicate a strong correlation between the VOCs mass concentration and how people perceive the odor intensity. To some extent, this illustrates that VOCs pollution often accompanies noticeable abnormal odors. Therefore, controlling the odor compounds generated from plywood materials goes hand in hand with managing the associated VOCs air pollution.
Table 6.
The mass concentration of TVOCs released from PVC veneered plywood under different ratios of air exchange rates to loading factor.
Table 7.
The odor intensity of VOCs released from PVC veneered plywood under different ratios of air exchange rates to loading factor.
Table 8.
The Pearson Correlation analysis of VOCs mass concentration and odor intensity.
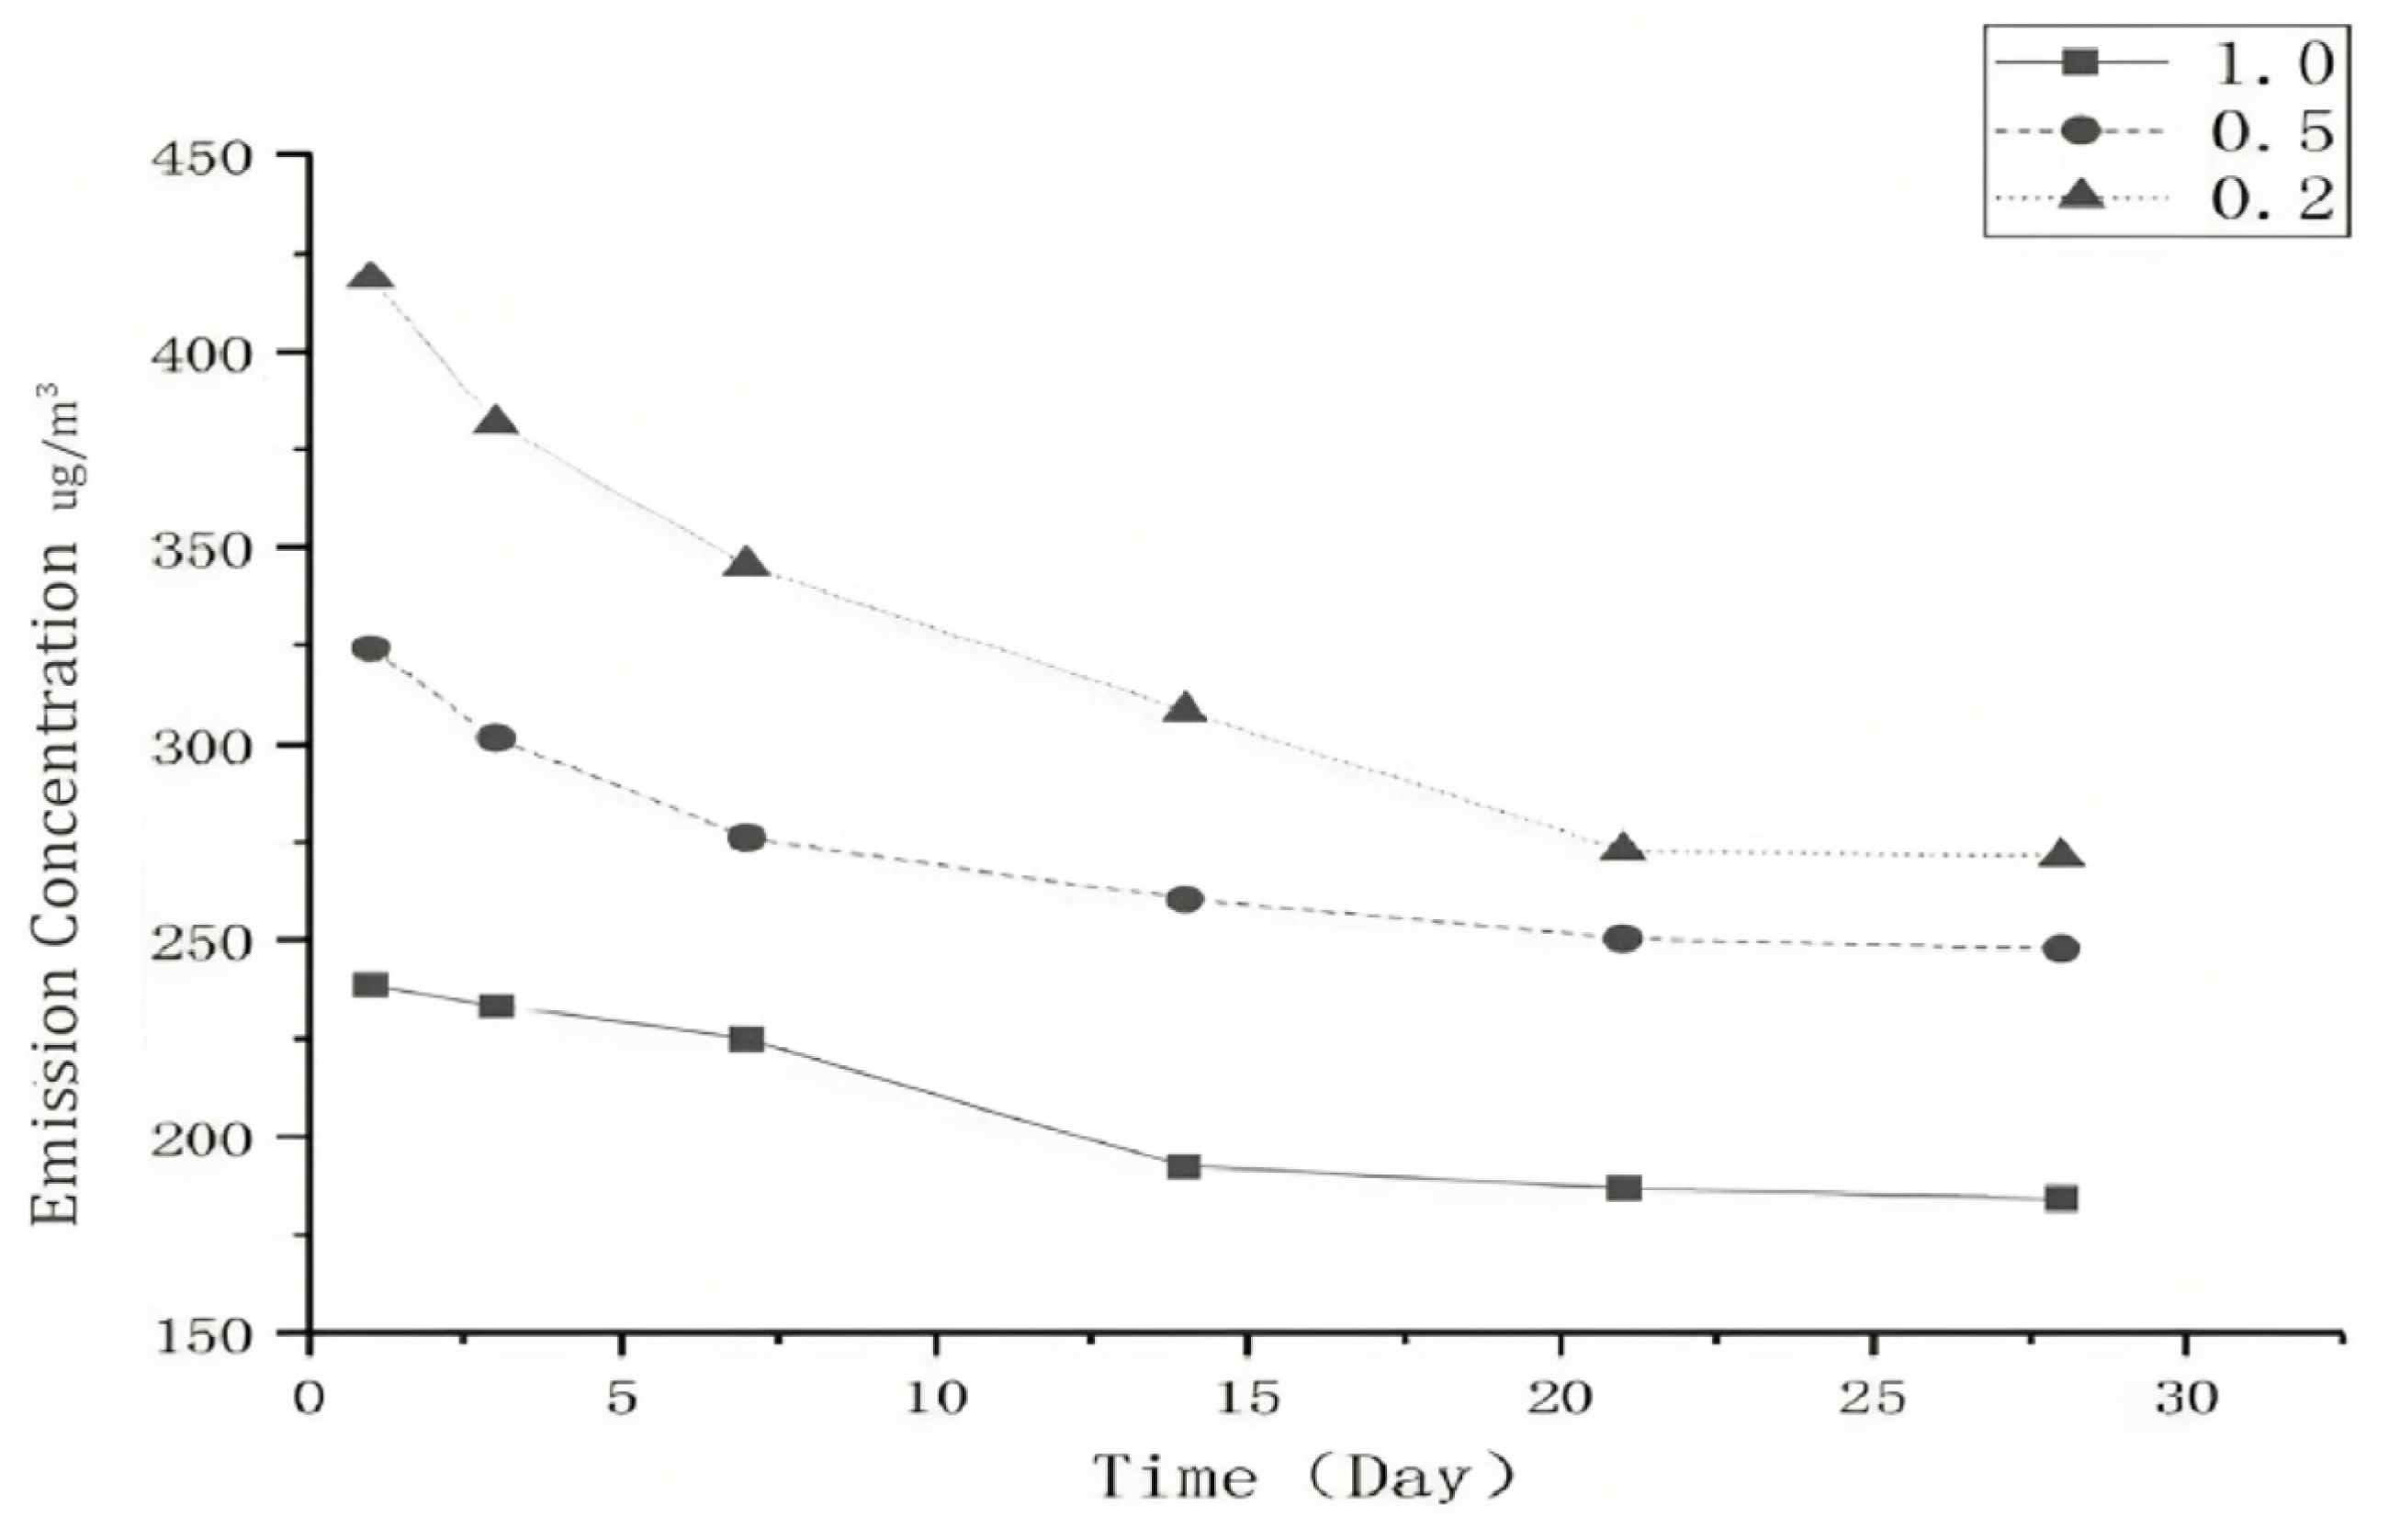
According to Table 6 and Table 7, the relationship between VOCs mass concentration and odor intensity of PVC veneered plywood with time under different ratios of air exchange rate and loading factor could be obtained, as shown in Figure 2 and Figure 3.
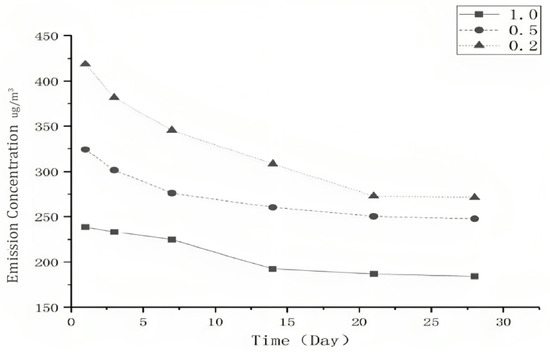
Figure 2.
The TVOC release level from PVC veneered plywood under different conditions of air exchange rate.
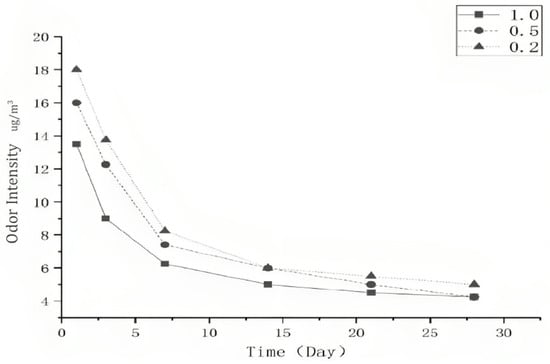
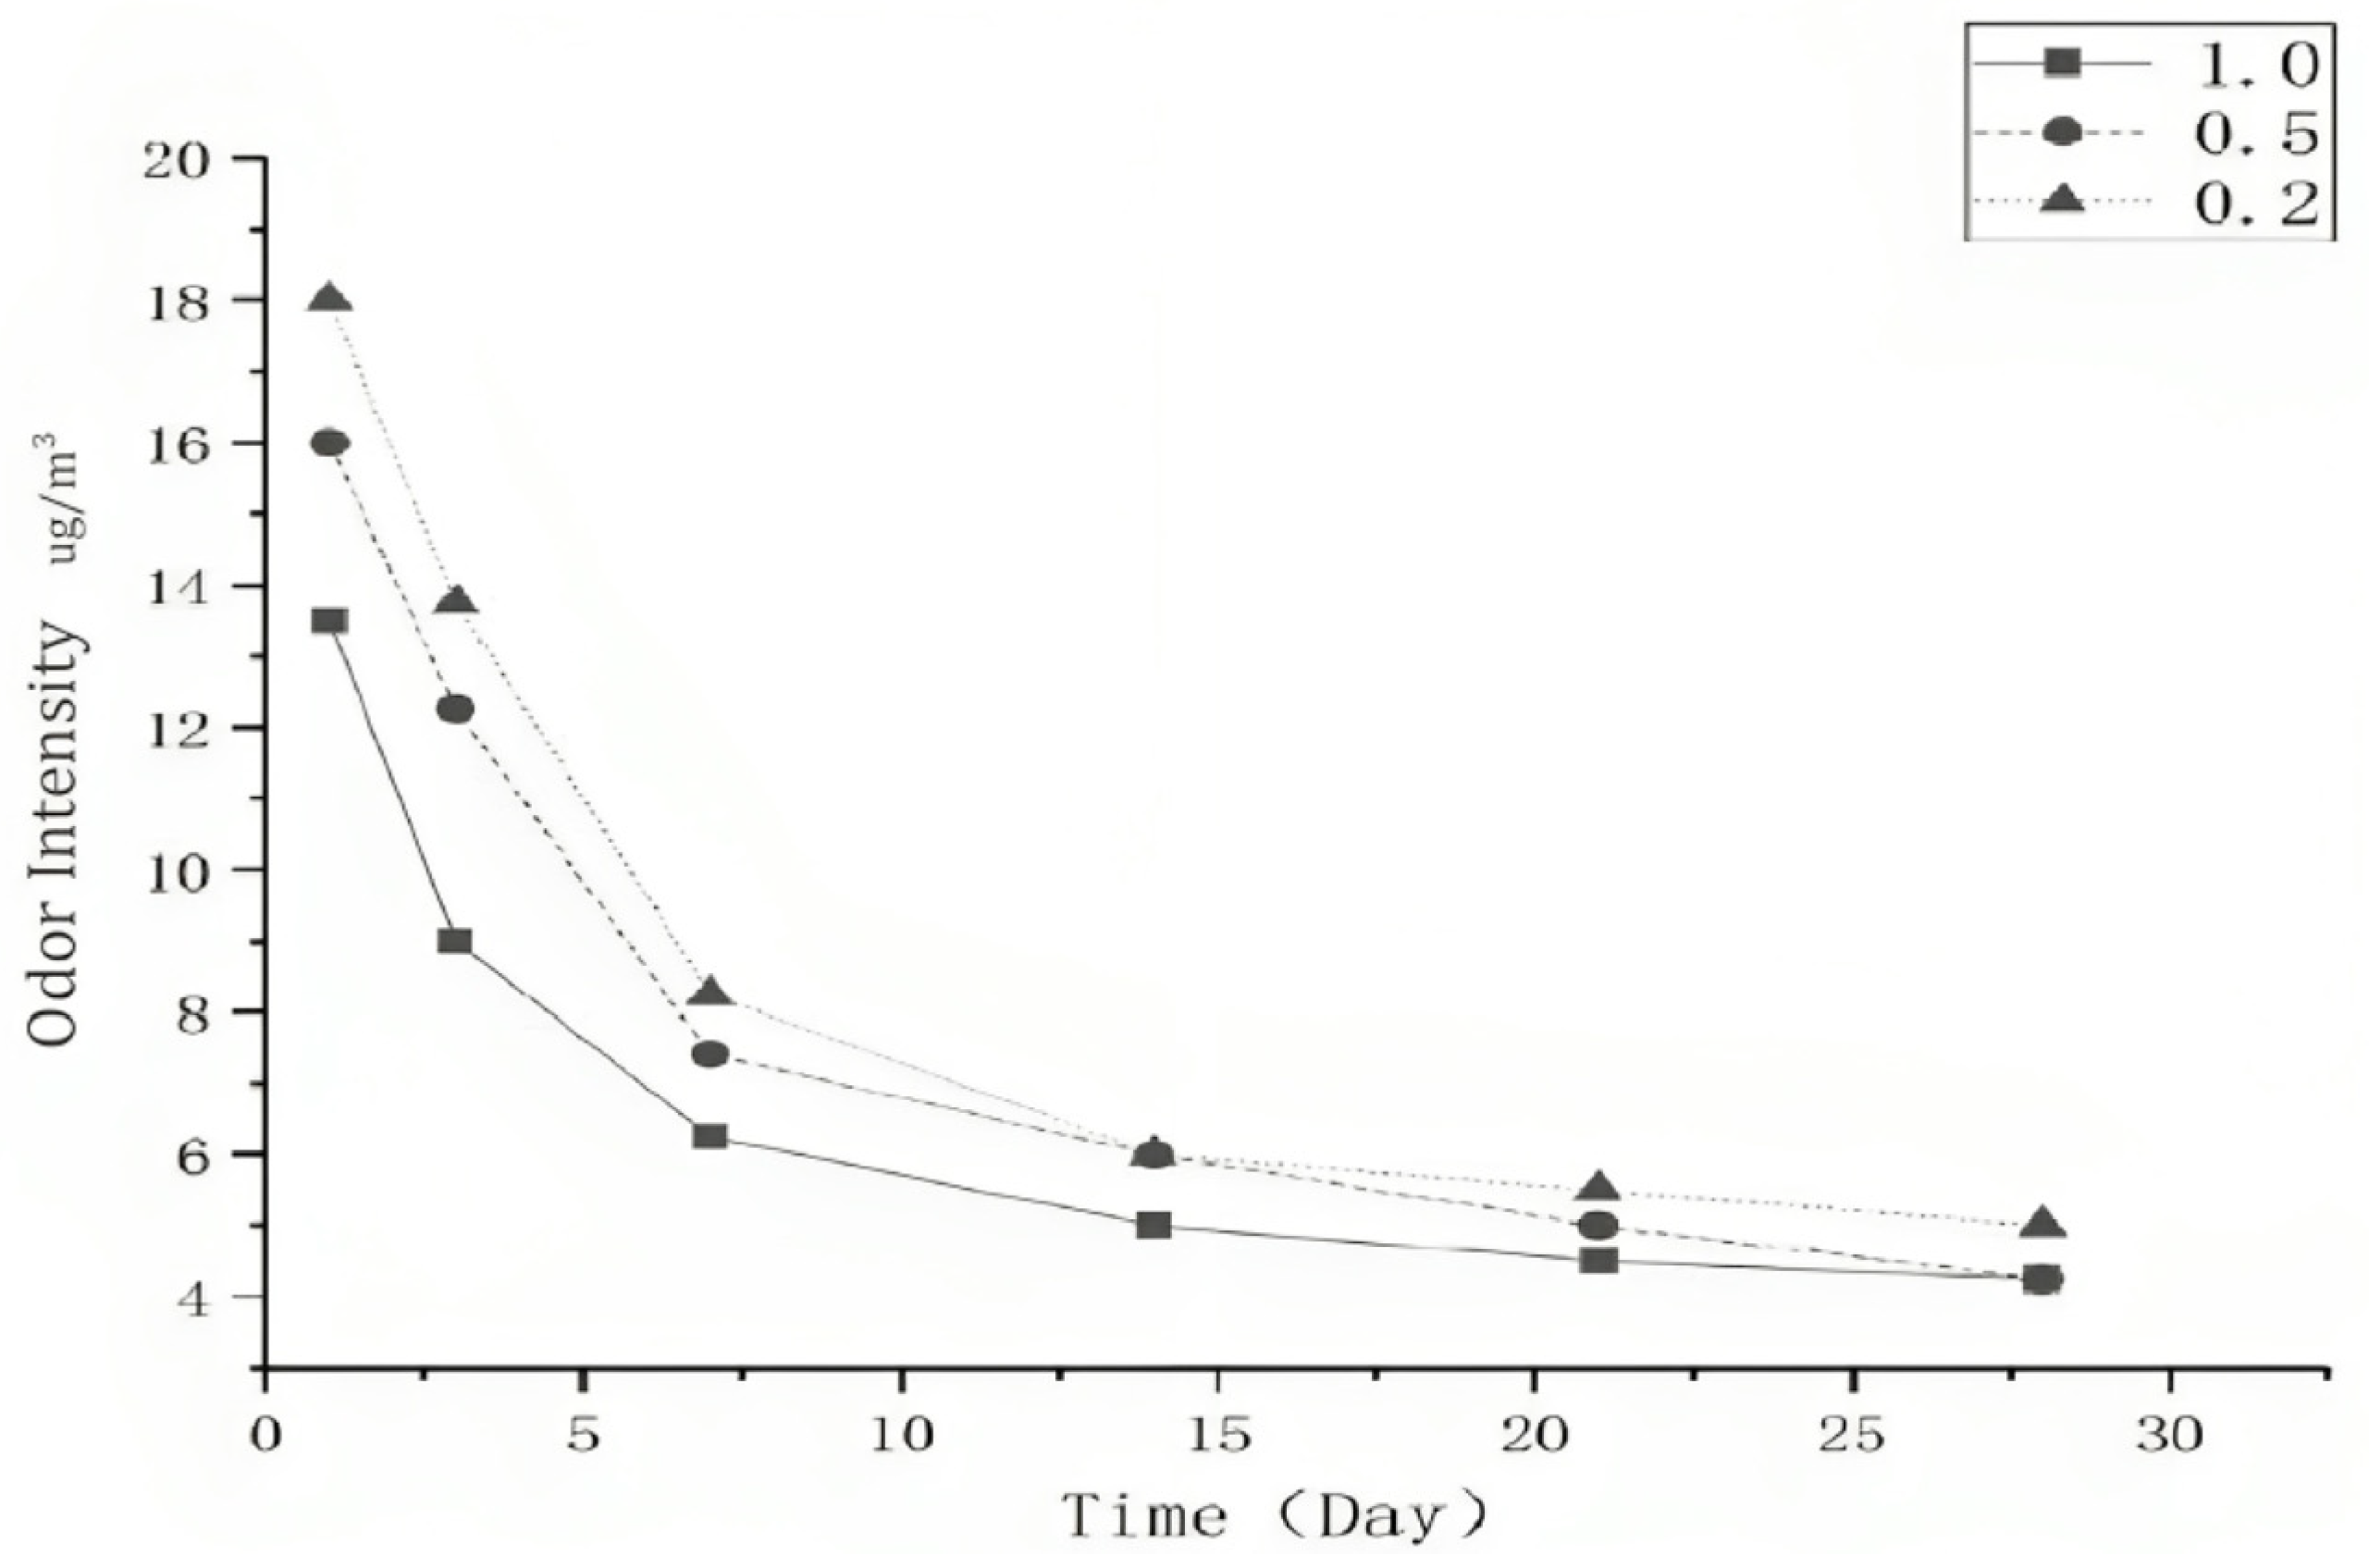
Figure 3.
The total odor intensity of PVC veneered plywood under different conditions of air exchange rate.
Table 6 shows the mass concentration of TVOCs released from PVC veneered plywood under different ratios of air exchange rates to loading factor. According to the analysis, the mass concentration of VOCs is highest when the air exchange rate is 0.2 times·m3·h−1·m−2. The lowest mass concentration of VOCs occurs when the air exchange rate is 1.0 times·m3·h−1·m−2. Over time, the mass concentration of TVOC consistently decreased, and this decline reached a stable rate by the 21st day. In general, the odor release intensity of PVC veneered plywood exhibited a descending order when the ratio of air exchange rate to loading factor was 0.2 times·m3·h−1·m−2, 0.5 times·m3·h−1·m−2, and 1.0 time·m3·h−1·m−2. Specifically, when the ratio of air exchange rate to loading factor was set at 1.0 time·m3·h−1·m−2, the odor release intensity continued to decrease and eventually stabilized after reaching its lowest point on the 21st day. Conversely, when the ratio was 0.5 times·m3·h−1·m−2 and 0.2 times·m3·h−1·m−2, the odor release intensity continued to decrease, with a slower rate of decline by the 21st day, although it still exhibited an overall downward trend.
Figure 2 shows the mass concentration release from PVC veneered plywood under different ratios of air exchange rate to loading factor. As shown in Figure 2, the initial emission concentration presented a decreasing order when the ratio of air exchange rate to loading factor was 0.2 times·m3·h−1·m−2, 0.5 times·m3·h−1·m−2, and 1.0 times·m3·h−1·m−2. Moreover, the emission concentration decreased at almost the same rate under 0.2 times·m3·h−1·m−2 and 0.5 times·m3·h−1·m−2 and it became stable around the 14th day. In contrast, the mass concentration decreased at a faster rate from the 1st to the 3rd day, changed very slowly at the 3rd~7th day until it became stable after nearly the 14th day. In general, the VOCs mass concentration of PVC veneered plywood from the beginning to the end presented a decreasing order when the ratio of air exchange rate to loading factor was 0.2 times·m3·h−1·m−2, 0.5 times·m3·h−1·m−2, and 1.0 times·m3·h−1·m−2.
Figure 3 shows the odor release intensity map of PVC veneered plywood under different ratios of air exchange rate to loading factor. Under the three conditions of air exchange rate ratio (0.2 times·m3·h−1·m−2, 0.5 times·m3·h−1·m−2, and 1.0 times·m3·h−1·m−2), the initial intensity decreased rapidly within the previous week, and the decreasing trend slowed down from the 7th to the 21st day. After 21 days, the odor intensity did not change basically under the condition of 1.0 time·m3·h−1·m−2, and the odor intensity still decreased slightly under the condition of 0.5 times·m3·h−1·m−2 and 0.2 times·m3·h−1·m−2. Overall, the odor intensity order of PVC veneered plywood presented a decreasing order under the condition of 0.2 times·m3·h−1·m−2, 0.5 times·m3·h−1·m−2, and 1.0 time·m3·h−1·m−2.
From the perspective of various VOCs compounds, the following findings can be concluded:
- Because the mass concentration of aromatic compounds was the highest under the three conditions, its odor intensity had the greatest influence on PVC veneered plywood. The mass concentration of aromatic compounds decreased with the increase in experimental time under the three conditions.
- During 1.0 times·m3·h−1·m−2, alcohols and esters were not found. However, during 0.5 and 0.2 times, their concentrations began to gradually increase.
- The mass concentration of alkenes and aldehydes also increased during the experiment. However, the mass concentration of alkenes decreased under the condition of 1.0 times·m3·h−1·m−2.
Overall, the odor intensity was higher under the condition of 0.5 times·m3·h−1·m−2 than that of 1.0 time·m3·h−1·m−2, and the decrease rate of odor intensity under the condition of 0.5 times·m3·h−1·m−2 was higher than that of 1.0 time·m3·h−1·m−2. This could be because after 21 days, under the air exchange rate of 1.0 times·m2·h−1·m−2, the concentration of odor compounds tended to stabilize, with a smaller reduction rate. Meanwhile, under the air exchange rate of 0.5 times·m3·h−1·m−2, the concentration of odor compounds was higher compared to the 1.0 times condition. Because the base concentration is higher and the compounds are relatively unstable, the reduction rate becomes higher accordingly.
3.3. Effect of Air Exchange Rate on Odor Emission Components of PVC Veneered Plywood
The VOCs from PVC veneered plywood were extracted using micro-thermal extraction technology under varying ratios of air exchange rate to loading factor. These VOCs included aromatic hydrocarbons, alkanes, alkenes, aldehydes, esters, and alcohols. The initial and steady state mass concentrations of odor components of plywood with different veneers under the conditions of T1–T3 are shown in Table 9. The initial state reflects the compounds concentration day 0 and the steady state represents the concentration day 28 after the start of the experiment. Under the three conductions, the aromatic compounds had the highest mass concentration, followed by alkanes. The release of alkanes and aromatic compounds showed a downward trend under the three conditions. The release of olefins decreased under the condition of 1.0 time·m3·h−1·m−2 and 0.2 times·m3·h−1·m−2 but increased under 0.5 times·m3·h−1·m−2. The concentration of aldehydes increased under the three conditions. No alcohols were released in the condition of 1.0 time·m3·h−1·m−2, and the mass concentration of alcohols also decreased with time in the other two cases. No ester was released under the condition of 1.0 time·m3·h−1·m−2 and 0.2 times·m3·h−1·m−2, but the release of ester showed a downward trend under 0.5 times·m3·h−1·m−2.
Table 9.
The initial and steady state mass concentrations of odor components of plywood under the conditions of T1–T3.
According to Table 9, the classification components and concentrations of VOCs released by PVC veneered plywood at different ratios of air exchange rates to loading factors were obtained. Table 9 displays the initial state and steady state mass concentrations of odor components released by PVC veneered plywood under various ratios of air exchange rates to loading factors. Upon analyzing the table, it becomes evident that the mass concentrations of aromatic hydrocarbons and alkanes decreased across all three conditions, from the initial state to the steady state process. This reduction in mass concentration might be attributed to various factors, such as the degradation of these compounds over time due to environmental factors or the reaction with other compounds present in the environment. It is possible that these compounds are being broken down or removed from the system. Based on Table 9, some detailed findings can be concluded as shown below:
- The mass concentration of olefins decreased under the conduction of 1.0 time·m3·h−1·m−2 and 0.2 times·m3·h−1·m−2 but increased under the conduction of 0.5 times·m3·h−1·m−2. This unexpected increase might be due to certain reactions or processes that favor the production or accumulation of olefins under this particular condition.
- The mass concentration of aldehydes increased under the three conditions.
- No alcohols were released under the condition of 1.0 time·m3·h−1·m−2, and the mass concentration of alcohols also decreased under the other two conditions.
- There were no esters under the condition of 1.0 time·m3·h−1·m−2 and 0.2 times·m3·h−1·m−2, but the mass concentration of esters also showed a downward trend under the condition of 0.5 times·m3·h−1·m−2. The downward trend in the mass concentration of esters suggests that there might be processes that lead to their decomposition, transformation, or removal from the environment. Esters can undergo hydrolysis, oxidation, or reactions with other compounds, which could contribute to their decrease in concentration over time.
- Under T1 condition, the initial concentration level from high to low was aromatic hydrocarbon, alkane, and olefin in order; no aldehydes, alcohols, and esters were detected at the initial state. When the steady state was reached, the mass concentrations of aromatic hydrocarbons, alkanes, and olefin all decreased, yet the mass concentrations of all alkenes decreased to 0; the mass concentrations of aldehydes increased, but the mass concentrations of aromatic hydrocarbons were still higher than those of aldehydes.
- Under T2 condition, there were no alkenes and aldehydes in the initial state, and the initial mass concentration level from high to low was aromatic hydrocarbons, alkane, alcohol and esters in order. When the steady state was reached, the mass concentrations of aromatic hydrocarbons, alkanes, and alkenes all decreased.
- Under T3 condition, the initial concentration level from high to low was aromatic hydrocarbons, alkenes, alkanes, alcohols, and no aldehydes and esters were detected. When the steady state was reached, the concentration of aromatic hydrocarbons, alkanes, and alcohols decreased; the concentration of olefin decreased to 0; the concentration of aldehydes increased, and there was still no ester.
These findings suggest that lower air exchange rates lead to a faster generation of alcohols, alkanes, and olefins in the enclosed space. Notably, significantly higher concentrations of nearly all VOC compounds were detected when air exchange rates were lower, both in the initial state and in the steady state. One possible explanation for this observation is that in environments with low air exchange rates and a substantial presence of particleboard materials, the dispersion rate of emitted VOCs becomes much slower than their release rate. Consequently, these VOCs tend to accumulate, resulting in elevated concentrations within the space.
4. Conclusions
In this paper, the VOCs released by PVC veneered plywood are collected by using micro-thermal extraction technology. Combined with objectivity and subjectivity research methods, namely, the objectivity of GC separation ability and the subjectivity of human nose sensitivity to odor, the VOCs released by PVC veneered plywood were detected and analyzed. Based on the experiment results, some primary conclusions can be derived. Among the identified VOCs released by PVC veneered plywood, many of them have characteristic odor. With the passage of time, the mass concentration and odor intensity of VOCs released by PVC veneered plywood continue to decrease and reach a balance. With the increase in the ratio of air exchange rate to loading factor, the TVOC emission and total odor intensity of the two kinds of veneered plywood show a downward trend.
Through the detection and analysis of the samples obtained under the conditions of 1.0 time·m3·h−1·m−2, 0.5 times·m3·h−1·m−2, and 0.2 times·m3·h−1·m−2, it is concluded that the concentration of VOCs released by the sample is the highest under the condition of 0.2 times·m3·h−1·m−2. The reason might be that if the air exchange rate in a room is slow and a significant amount of particleboard materials are stored, then the rate at which the emitted VOCs are dissipated is much lower than their release rate. This accumulation leads to higher VOC concentration in the space. Another reason might be that the small volume of the micro-chamber and the relatively high gas flow cause disturbances. In our experiment, when the air exchange rate/loading factor is 1.0 times·m3·h−1·m−2, 0.5 times·m3·h−1·m−2, and 0.2 times·m3·h−1·m−2, the surface flow rate was set to be 15 m/s, 7.5 m/s, and 3 m/s, respectively. According to related research [38], when the air exchange rate increases, the flow rate increases simultaneously, which could result in two vortices forming beneath the intake port, closer to the middle of the micro-chamber, and make the flow rate unexpectedly small. This small flow rate might affect the VOCs emission from the sample. However, this research is difficult to comprehensively explain regarding these phenomena. Future studies are required to better analyze this hypothesis.
For the analysis of the odor intensity of PVC veneered plywood, the odor is the strongest under the condition of 0.2 times·m3·h−1·m−2, and the aromatic compounds, alkane compounds, and alcohol compounds have the main influence on odor. The odor intensity of each component under the condition of 1.0 time·m3·h−1·m−2 is the lowest under the three conditions. Under the experimental condition of 0.2 times·m3·h−1·m−2, the odor intensity of PVC veneered plywood reaches the maximum under the three conditions.
To sum up, for design and construction of the indoor built environment, it is wise to try to control the ratio of the air exchange rate to the loading factor to be 1.0 time·m3·h−1·m−2. Only when the air exchange rate is 1 and the loading rate is 1, the lowest mass concentration of VOCs can be ensured. Meanwhile, the strange odor and other indoor air pollutants which are conducive to negative effects on human health can be reduced to an ideal level. One important conclusion derived from the experiment results is that the factory-produced plywood needs to be stored for 28 days under natural conditions before being used after leaving the factory. This requirement is also in line with the LY/T 3230-2020 standard. Additionally, when using plywood indoors, it is important to not only enhance air ventilation but also reduce the storage amount of these materials to ensure the air quality meets the necessary standards. The outcomes of this research provide valuable guidance for shaping the design and construction of indoor built environments. By fine-tuning the air exchange rates, it becomes possible to effectively manage and mitigate VOC emissions. This not only ensures a healthier and more comfortable living space but also contributes significantly to the creation of sustainable environments that promote the well-being of inhabitants. The integration of these findings into architectural practices signifies a proactive step towards fostering spaces that harmonize with both human health and the surrounding ecosystem.
Author Contributions
Conceptualization, M.G., Y.Z. (Yongli Zheng) and J.G.; methodology, Q.Z., M.G. and Y.Z. (Yongli Zheng); software, Y.Z. (Yifanzi Zhu); validation formal analysis, M.G.; investigation, Q.Z.; resources, J.G. and Q.Z.; data curation, Y.Z. (Yongli Zheng), Y.Z. (Yifanzi Zhu) and M.G.; writing—original draft preparation, M.G., Y.Z. (Yongli Zheng) and Y.Z. (Yifanzi Zhu); writing—review and editing, M.G., J.G. and Q.Z.; visualization, M.G., Y.Z. (Yongli Zheng) and Y.Z. (Yifanzi Zhu); project administration, M.G., J.G. and Q.Z.; funding acquisition, Q.Z. All authors have read and agreed to the published version of the manuscript.
Funding
Fund Project: Humanities and Social Science Research Youth Fund project of the Ministry of Education. [No.: 18YJC760128]: Test model and empirical study of urban street landscape design under low carbon background.
Institutional Review Board Statement
Not applicable.
Informed Consent Statement
Not applicable.
Data Availability Statement
The data presented in this study are available on request from the corresponding author.
Conflicts of Interest
The authors declare no conflict of interest.
References
- Bartsch, J.; Uhde, E.; Salthammer, T. Analysis of odour compounds from scented consumer products using gas chromatography-mass spectrometry and gas chromatography-olfactometry. Anal. Chim. Acta 2016, 904, 98–106. [Google Scholar] [CrossRef]
- Wang, H.; Hua, J.; Jiang, Y.; Yang, Y.; Wang, J.; Yuan, H. Influence of fixation methods on the chestnut-like aroma of green tea and dynamics of key aroma substances. Food Res. Int. 2020, 136, 109479. [Google Scholar] [CrossRef]
- Zhao, Y.; Xu, Y.; Li, J.; Duan, H.; Fan, W.; Zhao, G. Sensory analysis of main aroma substances in brandy. Sci. Technol. Food Ind. 2008, 3, 113–116. [Google Scholar]
- Zhou, C.; Zhan, Y.; Chen, S.; Xia, M.; Ronda, C.; Sun, M.; Chen, H.; Shen, X. Combined effects of temperature and humidity on indoor VOCs pollution: Intercity comparison. Build. Environ. 2017, 121, 26–34. [Google Scholar] [CrossRef]
- Amanpour, A.; Guclu, G.; Kelebek, H.; Selli, S. Characterization of key aroma compounds in fresh and roasted terebinth fruits using aroma extract dilution analysis and GC–MS-Olfactometry. Microchem. J. 2019, 145, 96–104. [Google Scholar] [CrossRef]
- Wang, M.-Q.; Ma, W.-J.; Shi, J.; Zhu, Y.; Lin, Z.; Lv, H.-P. Characterization of the key aroma compounds in Longjing tea using stir bar sorptive extraction (SBSE) combined with gas chromatography-mass spectrometry (GC–MS), gas chromatography-olfactometry (GC-O), odor activity value (OAV), and aroma recombination. Food Res. Int. 2020, 130, 108908. [Google Scholar] [CrossRef]
- Jiang, L.; Shen, J.; Li, H.; Wang, Q.; Shen, X. Effects of volatile organic compounds released by different decorative particleboards on indoor air quality. BioResources 2018, 13, 7595–7605. [Google Scholar]
- Wang, Q.; Shen, J.; Shao, Y.; Dong, H.; Li, Z.; Shen, X. Volatile organic compounds and odor emissions from veneered particleboards coated with water-based lacquer detected by gas chromatography-mass spectrometry/olfactometry. Eur. J. Wood Wood Prod. 2019, 77, 771–781. [Google Scholar] [CrossRef]
- Shen, X.; Handel, S.N.; Kirkwood, N.G.; Huang, Y.; Padua, M.G. Locating the responsive plants for landscape recovery: A toolkit for designers and planners. Ecol. Restor. 2022, 40, 33–35. [Google Scholar] [CrossRef]
- Ulker, O.C.; Ulker, O.; Hiziroglu, S. Volatile organic compounds (VOCs) emitted from coated furniture units. Coatings 2021, 11, 806. [Google Scholar] [CrossRef]
- Wang, Q.; Du, J.; Shen, J.; Wang, Y. Comprehensive evaluation model for health grade of multi-component compound release materials based on fuzzy comprehensive evaluation with grey relational analysis. Sci. Rep. 2022, 12, 19807. [Google Scholar] [CrossRef]
- Shen, X.; Sun, Q.; Mosey, G.; Ma, J.; Wang, L.; Ge, M. Benchmark of plant-based VOCs control effect for indoor air quality: Green wall case in smith campus at Harvard University. Sci. Total Environ. 2023; in press. [Google Scholar]
- Chen, J.-N.; Han, H.-T.; Liu, C.-J.; Gao, Q.; Wang, X.-W.; Zhang, J.-W.; Tanokura, M.; Xue, Y.-L. Characterization of aroma-active compounds in Dongli by quantitative descriptive analysis, gas chromatography-triple quadrupole tandem mass spectrometry, and gas chromatography-olfactometry. J. Food Sci. Technol. 2022, 59, 4108–4121. [Google Scholar] [CrossRef] [PubMed]
- Li, Q.; Li, Y.; Luo, Y.; Xiao, L.; Wang, K.; Huang, J.; Liu, Z. Characterization of the key aroma compounds and microorganisms during the manufacturing process of Fu brick tea. LWT 2020, 127, 109355. [Google Scholar] [CrossRef]
- Shao, Y.; Shen, J.; Shen, X.; Qin, J. Effect of panel area-volume ratio on TVOC released from decorative particleboards. Wood Fiber Sci. 2018, 50, 132–142. [Google Scholar] [CrossRef]
- Zhang, Q.; Wang, X.; Liu, Y. SDE-GC-Olfactometry combined study of volatile odor active compounds in silver carp meat. Anhui Agric. Sci. 2009, 37, 1407–1409. [Google Scholar]
- Liu, H.; Gao, R.; Kan, J.; Zhou, C.; Liu, F. Application of GC-O method in flavor analysis of meat products. Sci. Technol. Food Ind. 2011, 12, 577–580. [Google Scholar]
- Gou, M.; Bi, J.; Chen, Q.; Wu, X.; Fauconnier, M.-L.; Qiao, Y. Advances and perspectives in fruits and vegetables flavor based on molecular sensory science. Food Rev. Int. 2023, 39, 3066–3079. [Google Scholar] [CrossRef]
- Yue, Y.; Wang, C.; Chen, Y.; Zheng, M.; Zhang, Y.; Deng, Q.; Zhou, Q. Aroma characteristics of flaxseed milk via GC–MS-O and odor activity value calculation: Imparts and selection of different flaxseed varieties. Food Chem. 2023, 432, 137095. [Google Scholar] [CrossRef]
- Ma, L.; Gao, M.; Zhang, L.; Qiao, Y.; Li, J.; Du, L.; Zhang, H.; Wang, H. Characterization of the key aroma-active compounds in high-grade Dianhong tea using GC-MS and GC-O combined with sensory-directed flavor analysis. Food Chem. 2022, 378, 132058. [Google Scholar] [CrossRef] [PubMed]
- Perry, P.L.; Wang, Y.; Lin, J. Analysis of honeydew melon (Cucumis melo var. inodorus) flavour and GC–MS/MS identification of (E, Z)-2,6-nonadienyl acetate. Flavour Fragr. J. 2009, 24, 341–347. [Google Scholar] [CrossRef]
- Song, H.; Liu, J. GC-O-MS technique and its applications in food flavor analysis. Food Res. Int. 2018, 114, 187–198. [Google Scholar] [CrossRef]
- Starowicz, M.; Błaszczak, W.; Ciska, E.; Latocha, P. Characterization of volatile organic compounds in kiwiberries (Actinidia arguta) exposed to high hydrostatic pressure processing by HS-SPME/GC-MS. Molecules 2022, 27, 5914. [Google Scholar] [CrossRef] [PubMed]
- Dong, H.; Jiang, L.; Shen, J.; Zhao, Z.; Wang, Q.; Shen, X. Identification and analysis of odor-active substances from PVC-overlaid MDF. Environ. Sci. Pollut. Res. 2019, 26, 20769–20779. [Google Scholar] [CrossRef] [PubMed]
- He, J.; Song, H.; Chen, G.; Zhang, Z.; Ma, C. Analysis of aroma active compounds in Xuanwei ham. Food Sci. Technol. 2008, 33, 78–82. [Google Scholar]
- Tufariello, M.; Pati, S.; Palombi, L.; Grieco, F.; Losito, I. Use of multivariate statistics in the processing of data on wine volatile compounds obtained by HS-SPME-GC-MS. Foods 2022, 11, 910. [Google Scholar] [CrossRef] [PubMed]
- Nie, S.; Li, L.; Wang, Y.; Wu, Y.; Li, C.; Chen, S.; Zhao, Y.; Wang, D.; Xiang, H.; Wei, Y. Discrimination and characterization of volatile organic compound fingerprints during sea bass (Lateolabrax japonicas) fermentation by combining GC-IMS and GC-MS. Food Biosci. 2022, 50, 102048. [Google Scholar] [CrossRef]
- Joguet, N.; Jing, L.; Jamois, F.; Dumargue, P. Characterization of Volatile Organic Compounds (VOCs) from Farms Effluents: Interest of HS-SPME-GC-MS Technique for Laboratory and Field Test. Atmosphere 2023, 14, 928. [Google Scholar] [CrossRef]
- Li, C.; Al-Dalali, S.; Wang, Z.; Xu, B.; Zhou, H. Investigation of volatile flavor compounds and characterization of aroma-active compounds of water-boiled salted duck using GC–MS–O, GC–IMS, and E-nose. Food Chem. 2022, 386, 132728. [Google Scholar] [CrossRef]
- Chen, J.; Pu, D.; Shi, Y.; Sun, B.; Guo, H.; Li, K.; Zhang, Y. Characterization of the Key Aroma Compounds in Different Yeast Proteins by GC-MS/O, Sensory Evaluation, and E-Nose. Foods 2023, 12, 3136. [Google Scholar] [CrossRef]
- Rouhani, S.; Taghipour, F. Photocatalytic oxidation of volatile organic compounds (VOCs) in air using ultraviolet light-emitting diodes (UV-LEDs). Chem. Eng. Sci. 2023, 272, 118617. [Google Scholar] [CrossRef]
- Zhong, L.; Haghighat, F. Ozonation air purification technology in HVAC applications. ASHRAE Trans. 2014, 120, 1–8. [Google Scholar]
- Jung, J.S.; Kim, J.G. An indoor air purification technology using a non-thermal plasma reactor with multiple-wire-to-wire type electrodes and a fiber air filter. J. Electrost. 2017, 86, 12–17. [Google Scholar] [CrossRef]
- Aditya, R. A review of general and modern methods of air purification. J. Therm. Eng. 2018, 5, 22–28. [Google Scholar]
- Dubey, S.; Rohra, H.; Taneja, A. Assessing effectiveness of air purifiers (HEPA) for controlling indoor particulate pollution. Heliyon 2021, 7, e07976. [Google Scholar] [CrossRef] [PubMed]
- LY/T 3230-2020; Classification of Volatile Organic Compounds Emission Contents from Wood-Based Panels and Their Finishing Products. National Forestry and Grassland Administration: Beijing, China, 2020.
- LY/T 3236-2020; Grading and Evaluation Methods for Odor of Wood-Based Panels and Its Products. National Forestry and Grassland Administration: Beijing, China, 2020.
- Schripp, T.; Nachtwey, B.; Toelke, J.; Salthammer, T.; Uhde, E.; Wensing, M.; Bahadir, M. A microscale device for measuring emissions from materials for indoor use. Anal. Bioanal. Chem. 2007, 387, 1907–1919. [Google Scholar] [CrossRef]
Disclaimer/Publisher’s Note: The statements, opinions and data contained in all publications are solely those of the individual author(s) and contributor(s) and not of MDPI and/or the editor(s). MDPI and/or the editor(s) disclaim responsibility for any injury to people or property resulting from any ideas, methods, instructions or products referred to in the content. |
© 2023 by the authors. Licensee MDPI, Basel, Switzerland. This article is an open access article distributed under the terms and conditions of the Creative Commons Attribution (CC BY) license (https://creativecommons.org/licenses/by/4.0/).