Article

Microstructure, Texture, and Anisotropic Properties of High-Strength Low-Alloy Steel

1
School of Materials Science and Engineering, Shanghai University, Shanghai 200444, China
2
Baosteel Research Institute, Shanghai 201900, China
3
State Key Laboratory of Development and Application Technology of Automotive Steels, Baosteel, Shanghai 201900, China
*
Author to whom correspondence should be addressed.
Coatings 2023, 13(8), 1442; https://doi.org/10.3390/coatings13081442
Submission received: 24 July 2023 / Revised: 7 August 2023 / Accepted: 14 August 2023 / Published: 16 August 2023
(This article belongs to the Special Issue Advancement in Heat Treatment and Surface Modification for Metals)

Abstract

:
The effects of cold rolling reduction rates and recrystallization annealing temperature on the microstructure, texture, and anisotropic properties of high-strength low-alloy (HSLA) steel were investigated using scanning electron microscopy and electron backscatter diffraction. The results revealed that the constituents of recrystallized, substructured, and deformed structures were strongly affected by cold rolling reduction rates ranging from 33.3% to 66.7% and recrystallization temperatures ranging from 780 to 840 °C. At an annealing temperature of 820 °C, when the cold rolling reduction rate was 33.3%, HSLA steel exhibited a low percentage of recrystallization, with cubic, γ-linear, rolled, and Z-texture (the texture at Euler angles φ1 = 30° and Φ = 20°–30°) structures. The rolled texture and Z-texture increased the strength anisotropy and disappeared at high cold rolling reduction rates. When the annealing temperature was increased from 780 °C to 820 °C, the proportion of recrystallized grains increased, the rolling texture disappeared, and grain orientation gradually gathered in the cubic texture and γ line texture, resulting in low anisotropy of strength. At an annealing temperature of 840 °C, the deformation of the grain disappeared; however, the anisotropy increased compared to annealing at 820 °C because of the formation of a new texture of {001}<−1–20>.

1. Introduction

High-strength low-alloy (HSLA) steels are a type of engineered structural steel characterized by low carbon content, which allows for weldability by adjusting the carbon and alloy element contents in the steel and subjecting it to heat treatment [1,2,3]. The total alloy elemental composition of HSLA steels is typically less than 5%, and their yield strength is greater than 275 MPa. HSLA steels are widely used in the automotive industry because of their excellent strength–ductility balance, good weldability, manufacturability, and low cost [4,5,6]. The strength of HSLA steels has been continuously improved for lightweight design purposes [7,8,9,10]. However, HSLA steels exhibit more pronounced anisotropy as their strength increases, leading to unstable formability and unexpected cracks [11].
The comprehensive effect of microstructure morphology and crystallographic texture on the tensile strength, toughness anisotropy, fracture, and other mechanical behaviors of thermomechanically rolled HSLA steel is intricate [12]. This complexity is attributed to the steel composition and the resulting structure obtained from the thermomechanically controlled rolling process. The relative strength and contribution of texture components, as well as microstructural characteristics, such as the second phase and non-metallic inclusions, play a crucial role in controlling mechanical anisotropy [13,14].
Prior studies suggest that the deformation and annealing processes of steel can change the grain orientation and influence the texture structure [15,16,17], thereby affecting the anisotropy of the macroscopic properties. M. S. Jooa discovered that Charpy specimens of pipeline steel, which exhibit anisotropic fracture toughness, demonstrate relatively lower impact properties in the transition temperature range when they are cut along the normal direction of the plate and processed at an angle of 45° to the rolling direction [18]. Samajdar et al. used electron backscatter diffraction (EBSD) to study the development of recrystallization textures in Interstitial-Free (IF) Steel containing Ti, where both the α (RD//<110>) and β (ND//<111>) textures were enhanced during cooling [19]. During deformation, the reduction in γ-fiber increases from 0% to 50%. In contrast, α-fiber increased steadily; however, a steady increase in γ coincided with no significant changes in α during recrystallization [20]. After the welding and annealing of 2205 duplex stainless steel, the microstructure of the heat-affected zone of the steel increases during the recrystallization process. Moreover, as the annealing temperature increases, the Cu and Goss texture in the γ phase decreases, the maximum in the δ phase moves along the α-fiber, and the overall anisotropy of the material becomes more pronounced [21,22]. Kononov [23] subjected electrical steels to a two-stage rolling process. After the first cold rolling stage, the electrical steel had GOSS-oriented grains surrounded by large angular grain boundaries. After the second rolling stage, the GOSS-oriented grains were deflected, showing that the amount of rolling deformation had a significant effect on the material texture and anisotropy. Andrea et al. [24] showed that the {111}<112> component of the γ-fiber reduces the effect of the anisotropy coefficient on the material. The EBSD characterization of ferritic stainless steel showed that γ-fiber {111} texture formed after rolling and annealing, which was more favorable for deep drawing [25]. In contrast, the stronger components of the {111}<112> texture compared to those of the {111}<110> texture led to anisotropy in the mechanical properties of the steel sheet.
Although the formation and characteristics of texture structures have been extensively studied [26,27], the link between the microstructural texture and anisotropic properties, particularly for steels subjected to different cold rolling processes and annealing temperatures, is still not understood. Additional experimental efforts are required to fully explore the relationship between these two factors. Therefore, this study aimed to investigate the correlation between the microstructure, texture, and anisotropic properties of a HSLA steel by examining its texture evolution patterns at different cold rolling reduction rate strains and annealing temperatures.

2. Material and Experimental Procedures

The HSLA steel used in this study had a nominal chemical composition of 0.06C0.5Si1.2Mn0.12 (Nb+Ti) (wt. %). It was hot-rolled to a thickness of 3 mm and subsequently cold-rolled at different reduction rates to obtain sheet thicknesses of 2, 1.5, and 1 mm, corresponding to cold rolling reduction rates of 33.3%, 50%, and 67.7%. Subsequently, the sheets were further annealed at 780 °C, 800 °C, 820 °C, and 840 °C for 4 min. Test specimens were obtained from the rolling direction (RD), transverse direction (TD), and normal direction (ND). The length of the plate tensile specimens was 200 mm. The tensile tests were performed using the INSTRON 5985 tensile testing machine at the strain rate of 10−4 s−1. Tensile test method refers to ASTM-E8 standard. Three RD and three TD tensile specimens were tested. The strength difference is the uniform difference between the RD and TD (Rp0.2: yield strength, Rel: Lower yield strength, Rm: Tensile strength).
The microstructure and texture were characterized using a scanning electron micro-scope (Zeiss Sigma 300, Carl Zeiss, Jena, Germany) equipped with an EBSD detector (HKL Channel 5, Oxford Instruments, Oxford, UK) at an operating voltage of 20 kV and a step size of 0.15 μm. Samples for EBSD were obtained using an automatic twin-jet electropolisher after the material was polished to a thickness of 60 μm. A 6% alcohol solution containing perchloric acid was used as the electrolyte. The EBSD data were analyzed using the HKL Channel 5 software.

3. Results

3.1. Microstructure, Texture, and Anisotropic Behaviors of a Hot-Rolled Steel Plate

The crystal orientation distribution in the hot-rolled HSLA steel plate is shown in Figure 1a alongside the RD inverse pole figure (RD-IPF) orientation diagram, from which it can be observed that the matrix has an elongated ferrite (bcc) structure along the RD, with fine grains and an anisotropic grain orientation distribution. The average size of the ferrite particles is 0.76 μm. The recrystallized volume ratio was obtained by distinguishing between the recrystallized and original grains, using the recrystallized fraction component function in the Channel 5 software. The standard angle θc for subgrain boundary determination and angle θGB for grain boundary determination were set to θc = 3° and θGB = 15° [28]. The average orientation difference θ0 in each grain was determined and compared to θc: if θ0 > θc, the grain was defined as deformed, whereas if θ0 < θc in each subcrystal and the orientation difference between subcrystals θi > θc, the grain was defined as substructured. This grain was defined as a substructured grain, and all other grains were defined as recrystallized grains. Figure 1b shows the grain orientation spread (GOS) of the ferrite grain structure, which was mainly composed of recrystallized, subcrystalline, and deformed grains. The fractions of the recrystallized grains and subcrystalline grains in the hot-rolled state were 47% and 58.6%, respectively, indicating that some of the grains underwent recrystallization and the microstructure was uniform. The texture of the material was analyzed by establishing the orientation distribution fraction (ODF) using the EBSD data because each direction of the plotted ODF was represented by three Euler angles: φ1, Φ, and φ2. These angles varied between 0 and 90° because of the orthogonal anisotropic symmetry; therefore, the direction of φ2 = 45° was considered [21,22,29]. Figure 1c shows a cross-sectional view of the ODF in the hot-rolled state at φ2 = 45°. Two textures with polar densities greater than three were observed: the {116}<1–20> and {113}<1–41> textures, with the majority of the overall grain orientation in the anisotropic state. Figure 1d shows the differences between the mechanical properties of the hot-rolled state in the longitudinal and cross-sectional directions. The difference between the strengths in the RD and TD was within 30 MPa, and the material was relatively uniform, which is consistent with the outcomes of the anisotropic grain orientation.

3.2. Effect of the Cold Rolling Reduction Rate on the Microstructure, Texture, and Anisotropic Behaviors

The steel plates were cold-rolled to reduce their thicknesses by 33.3%, 50%, and 66.7% after annealing at 820 °C; three-dimensional (3D) reconstructions of their microstructures are shown in Figure 2a,c,e, respectively. As the thickness was reduced further by cold rolling, the ferrite structure became elongated along the RD, the ferrite phase interface between the RD and TD faces became thinner, and the grain size became finer. Figure 2b,d,f show the corresponding RD-IPF maps. Compared with the microstructure of the hot-rolled state, the ferrite grains were conspicuously refined after the cold rolling and annealing processes, resulting in fine grain reinforcement. Moreover, some of the ferrite grains reached sub-micron sizes. When the cold rolling reduction rate was 33.3%, the fer-rite grains were uniform, and the average ferrite particle size was 0.66 μm. Their orientation tended to be along the (001) and (111) planes, with fewer grains oriented along the (101) planes, because the ferrite crystals of the bcc structure are more likely to converge to the (111) planes during cold rolling deformation [30]. When the cold rolling reduction rate was increased to 50% and 66.7%, most of the ferrite grains were oriented along the (001) and (111) planes, and some of the deformed grains recrystallized and began to grow.
The constituents of the recrystallized, subcrystallized, and deformed structures at different cold rolling reduction rates were analyzed using the recrystallized fraction component function, and the results are summarized in Figure 3. After annealing at 820 °C, the microstructures exhibited negligible changes, with deformations measuring 1% and 4% at cold-rolled reduction rates of 33.3%, 50%, and 66.7%, respectively. However, the fraction of recrystallized grains gradually increases from 23% to 41% with increasing cold rolling reduction rates. It was assumed that the stored energy, as a driving force for the subsequent recrystallization, increases as the reduction rates increase [31,32,33], resulting in a larger fraction of recrystallized grains. Grain recrystallization induces fewer internal substructured grains, forming equiaxed grains. Therefore, the RD and TD properties became more uniform.
Figure 4a–c show the cross-sectional views of the ODF at φ2 = 45° for each cold rolling reduction rate. At a 33.3% reduction rate, the {001}<1–10>, {001}<−1–10>, {111}<1–21>, and {111}<−1–13> textures are present in the larger extreme density regions of the cross-section. In this region, the {001}<1–10> and {001}<−1–10> texture are cubic textures, and the {111}<1–21> and {111}<−1–13> textures belong to the γ-line texture of {111}//ND, which is a recrystallized texture. The rolled texture of {223}<1–10> also occurs at φ1 = 0° and 45° [31,34]. At a reduction rate of 50%, the cubic and recrystallized texture remained; however, the texture at φ1 = 30° and Φ = 20°~30° (referred to as the Z-texture) decreased instantly, and the extreme density of recrystallized and rolled texture increased. When the cold rolling reduction rate reached 66.7%, the cold-rolled and Z-textures disappeared, the γ-line texture decreased, the recrystallized texture decreased, and the maximum polar density was mainly cubic. The difference in mechanical properties between the TD and RD of the specimens after annealing at different cold rolling reduction rates is shown in Figure 4d, where the difference in mechanical properties between the TD and RD of the specimens at 50% and 66.7% was low.

3.3. Effect of Annealing Temperature on the Microstructure, Texture, and Anisotropic Properties

The inverse pole figure (IPF) diagrams of the annealed microstructure of the hot-rolled samples of HSLA steel annealed at 780, 800, 820, and 840 °C after a cold rolling process with deformation of 66.7% are shown in Figure 5. Under the same deformation conditions, the ferrite grains all mainly tended to be on the (001) and (111) grain planes. When annealed below 820 °C, most of the grains were in a deformed state, with sub-structures within the grains and some of the grain sizes in the sub-micron range. When the annealing temperature reached 840 °C, the grains formed equiaxed crystals with a size of approximately 10 μm.
The grain compositions of the specimens annealed at different temperatures are shown in Figure 6. An increase in the annealing temperature caused the deformed grains of the material to undergo different degrees of recrystallization, and the deformed grains were gradually replaced by recrystallized grains. As the annealing temperature increased from 780 to 840 °C, there was a greater propensity for substructural and dislocation recovery in the deformed grains. Consequently, the percentage of recrystallization increased from 33% to 86%. At 840 °C, the recrystallization process for most of the grains was completed.
Figure 7 shows a cross-sectional view of the ODF at φ2 = 45° for each annealed specimen. When the annealing temperature was 780 °C, cubic textures of {001}<1–10> and {001}<−1–10>, rolling textures of {112}<1–10>, and γ-line textures with grain orientations close to {111}//ND were observed. When the annealing temperature was 800 °C, the grain orientation of the rolled texture gradually converged towards the cubic texture, the γ-line texture began to disperse, the polar density decreased, and the grain orientation began to converge towards the ends of the γ-line texture. When the annealing temperature increased to 820 °C, the rolling texture began to disappear gradually, the grain orientation gathered at the two ends of the γ-line texture, and the grain orientation in the region of maximum polar density exhibited a cubic texture. When the annealing temperature was increased to 840 °C, the cubic texture of {001}<−1–10> shifted to form a new {001}<−1–20> texture, the rolling texture disappeared completely, the recrystallization texture gradually decreased, and the grain orientations accumulated in {114}<1–20> to form a new texture. These results indicate that the complete recrystallization of the grains resulted in a shift in the texture and the formation of a variety of new texture structures [35,36], which affected the RD and TD properties of the HSLA steel.
The differences in the RD and TD mechanical properties of the specimens annealed at different temperatures are shown in Figure 8. The strength difference of the specimens in the RD and TD after annealing at 780 °C was above 60 MPa. This is because most of the grains were deformed, the deformed grains elongated along the RD, the grain orientation gathered in the rolling texture, and the γ-line texture shifted in the {111}//ND direction, resulting in a larger difference between the steel strengths in the RD and TD. When the annealing temperature was between 800 and 820 °C, the proportion of recrystallized grains of ferrite increased, part of the large grain internal substructure disappeared, and the organization of the rolling texture disappeared. Moreover, the grain orientation gathered in the cubic texture and in the {111}//ND direction of the γ-line texture, reducing the steel RD and TD strength difference. For annealing temperatures ≥ 840 °C, the deformed grains disappeared, a new texture was formed within the tissue, and the RD and TD strength difference increased.

4. Discussion

Figure 9a shows the yield strengths of the TD and RD versus deformation. At an annealing temperature of 820 °C, the difference in yield strengths was within 40 MPa for deformations of 50% and 66.7%. As deformation increased, the proportion of recrystalli-zation increased (23.3%, 33.8%, and 41% for deformations of 33.3%, 50%, and 66.7%, respectively), the recrystallized texture other than the {111}<1–21> and {111}<−1–12> species decreased, the Z-texture disappeared, and the {223}<1–10> rolled texture weakened. The anisotropy mechanism is illustrated in Figure 9b: after the increase in deformation, more rolled oriented grains recrystallize, the rolled texture weakens, and more residual small crystals are left as recrystallized cores in the crystal rotation trajectory line, which prompts more grains to gather toward the recrystallized orientation. The yield strength of the TD remained unchanged, and Rm (TD) > Rm (RD), which reduced the difference in the yield strength between the TD and RD. The weakening of the rolled texture and the formation of {111}<1–21> and {111}<−1–12> recrystallized textures at a recrystallization ratio of 41% at 66.7% deformation were the main reasons for the reduction in the anisotropic properties of the RD and TD differences.
Figure 10a shows the relationship between the yield strengths of the TD and RD and the annealing temperature. The difference in the yield strength of TD and RD is within 40 MPa at 66.7% deformation and at annealing temperatures ranging from 800 °C to 840 °C. The increase in the annealing temperature (from 780 °C to 800, 820, and 840 °C) was followed by an increase in the recrystallization ratio (from 32.5% to 41% and 85.4%). More-over, the rolled texture {112}<1–10> decreased continuously, the recrystallized texture changed from {111}<1–44> to {111}<1–21> and {111}<−1–12> textures, and various recrystallized textures with low values of polar density were formed. The anisotropic mechanism is illustrated in Figure 10b. With the increase in annealing temperature, more rolling-oriented grains recrystallized, the rolling texture was weakened, and more residual small crystals were left as recrystallized cores in the crystal rotation trajectory line, which prompted more grains to gather toward the recrystallization orientation. Moreover, Rm (TD) > Rm (RD), which reduced the strength difference between the TD and RD. When the annealing temperature was 780 °C, the rolling orientation of the grains was retained (Rm (TD) < Rm (RD)), and reducing the difference in the yield strengths of TD and RD be-came difficult. When the annealing temperature was higher than 780 °C, the rolled oriented grains were retained, and the yield strengths in the TD and RD were similar. At 820 °C, a recrystallization ratio of 41%, the weakening of rolled texture, and the formation of the {111}<1–21> and {111}<−1–12> recrystallization textures were the main reasons for the reduction in the difference between the anisotropic properties of the RD and TD.

5. Conclusions and Perspectives

(1)
The HSLA steel in the hot-rolled state has an elongated ferrite (bcc) microstructure in the RD, with most of the ferrite grains consisting of a substructure and recrystallization.
(2)
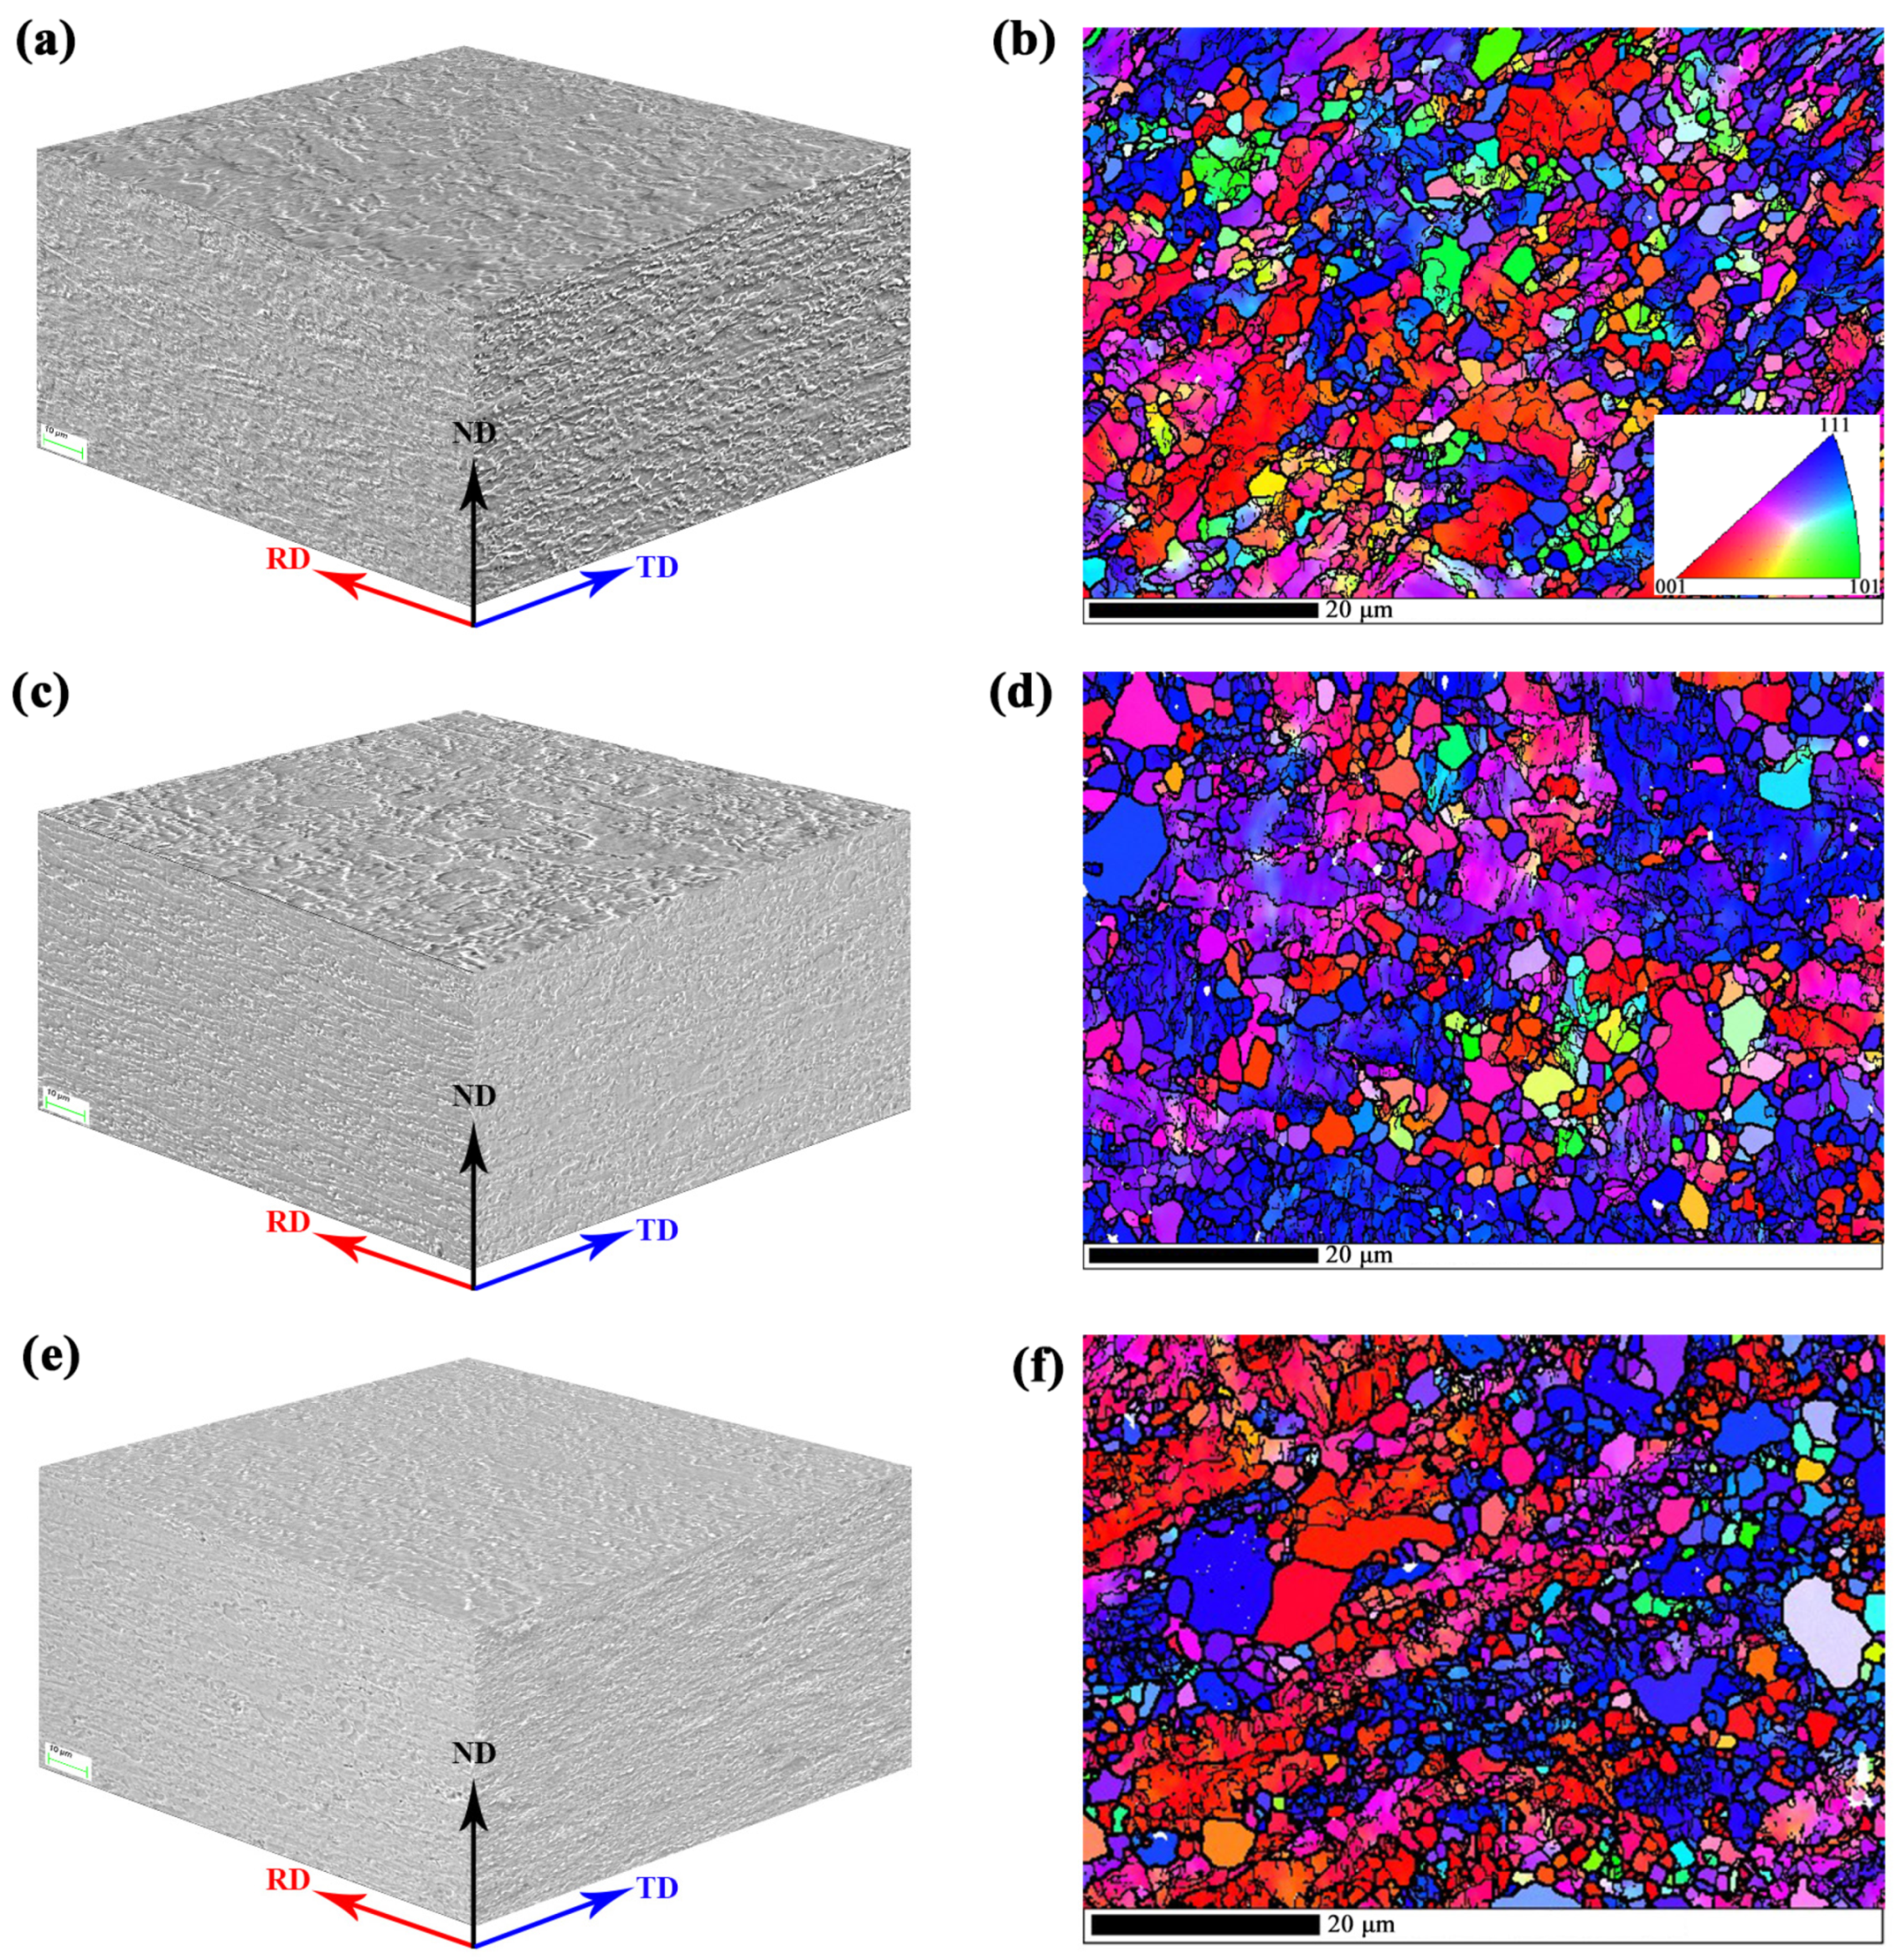
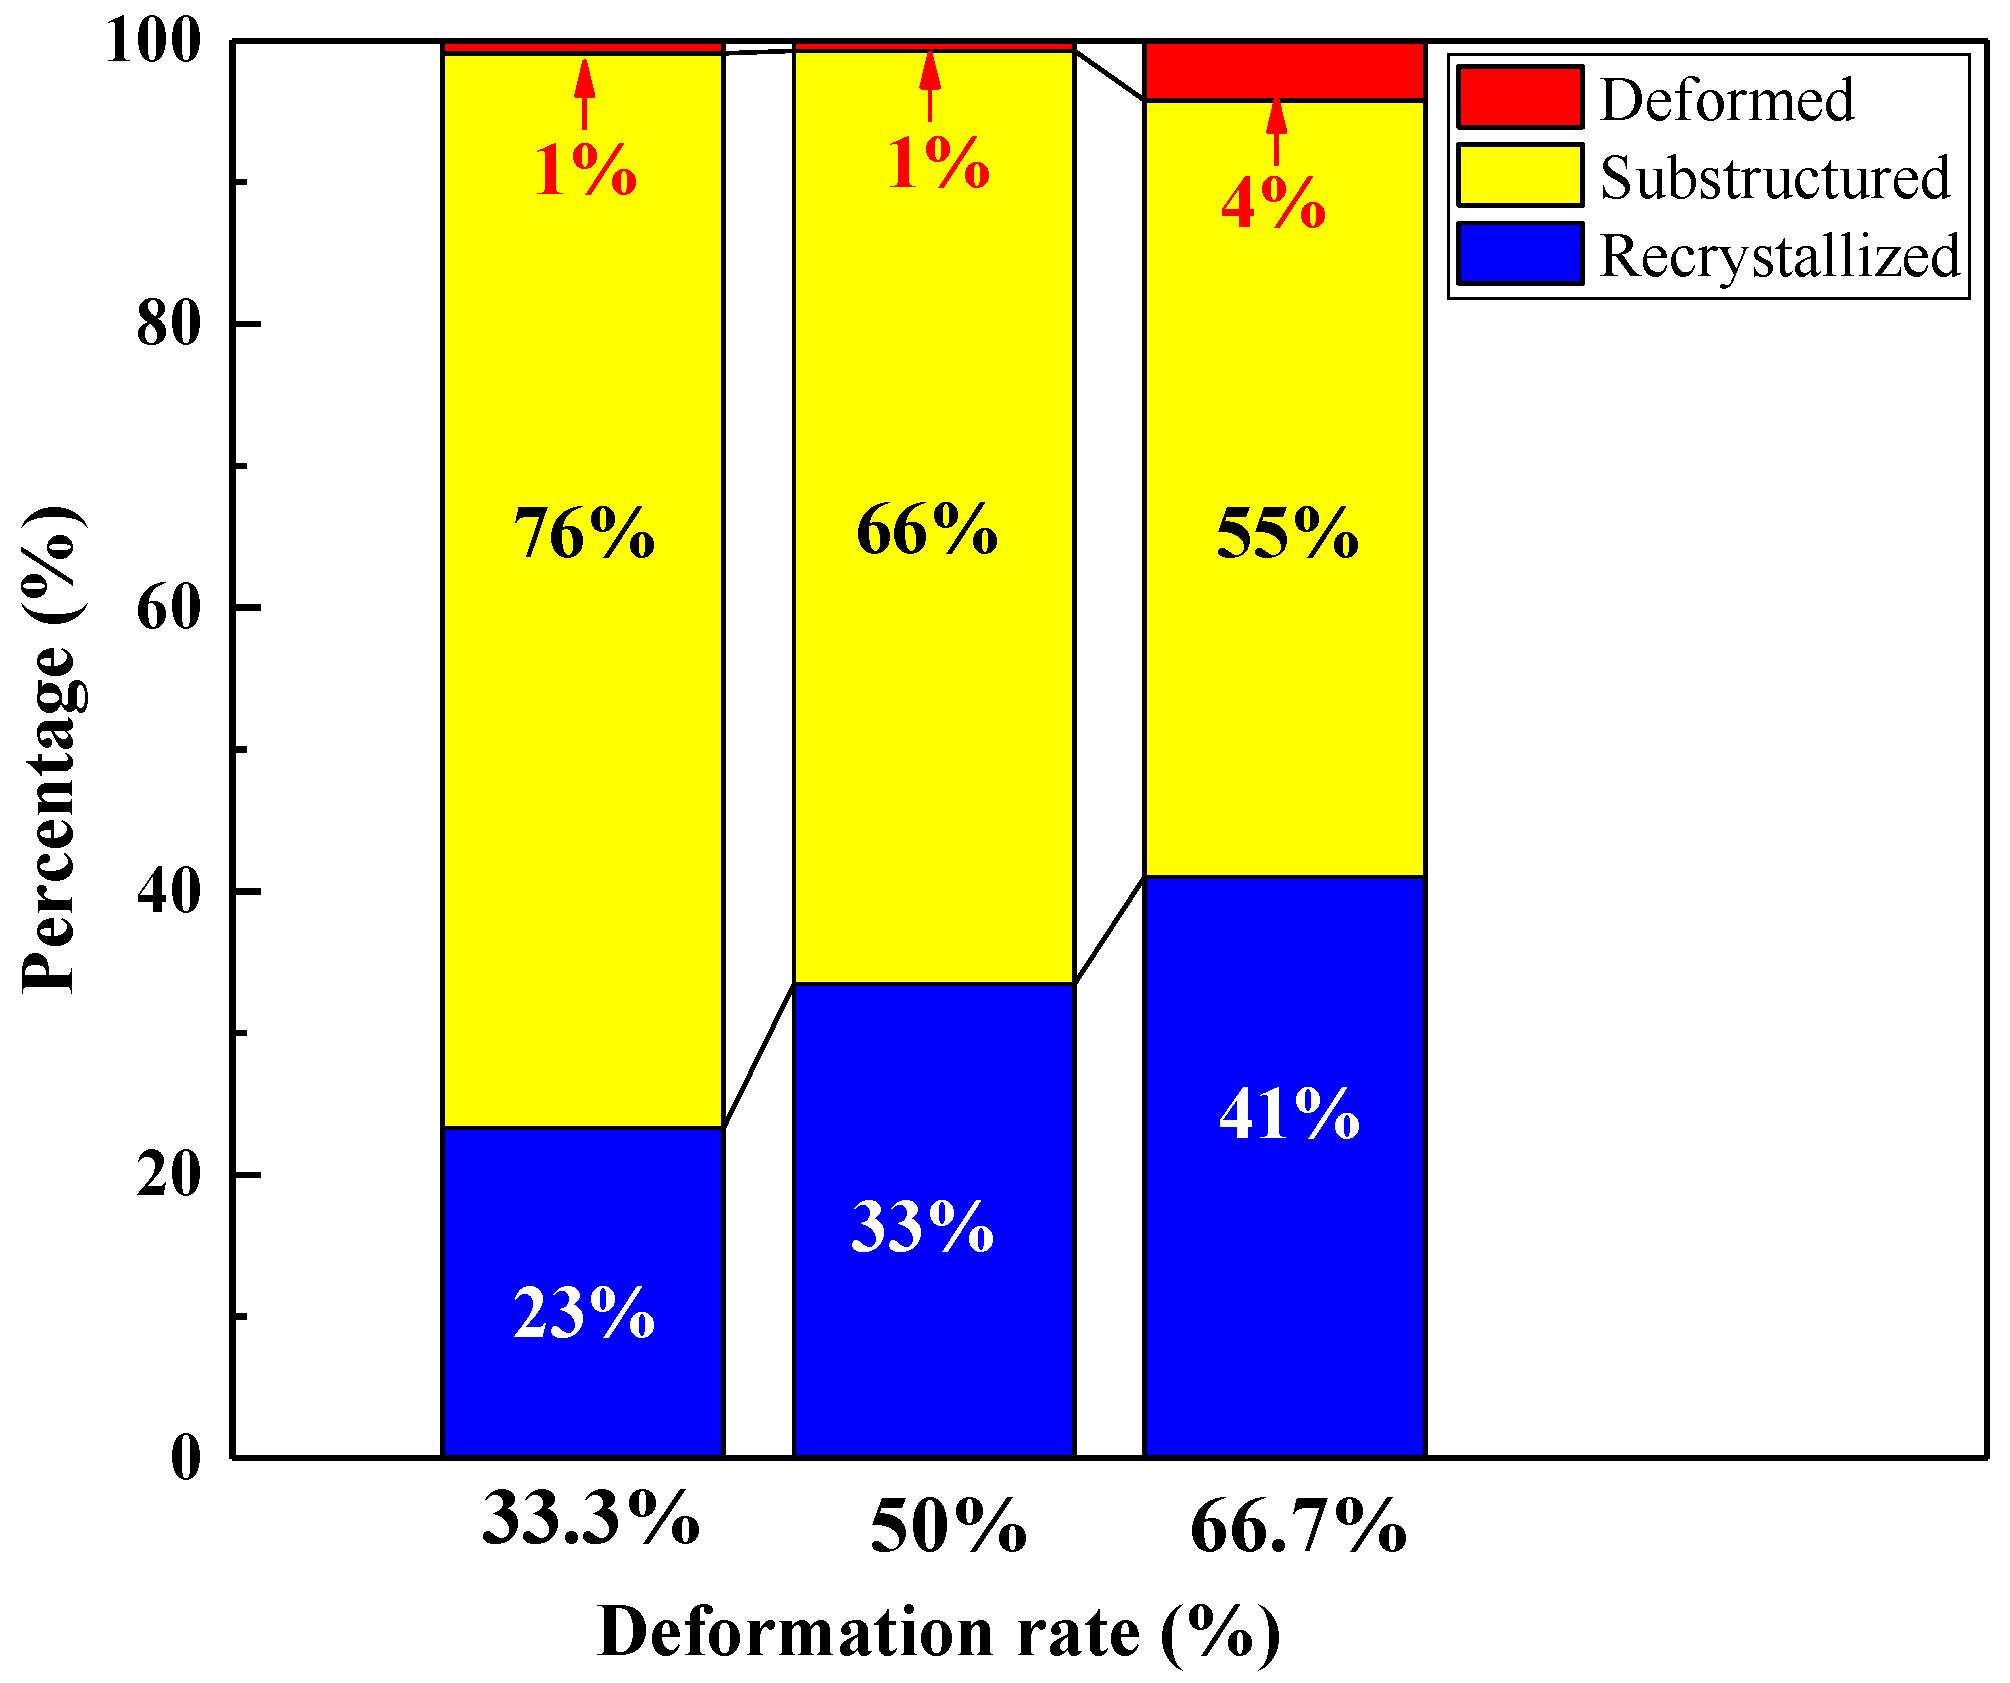
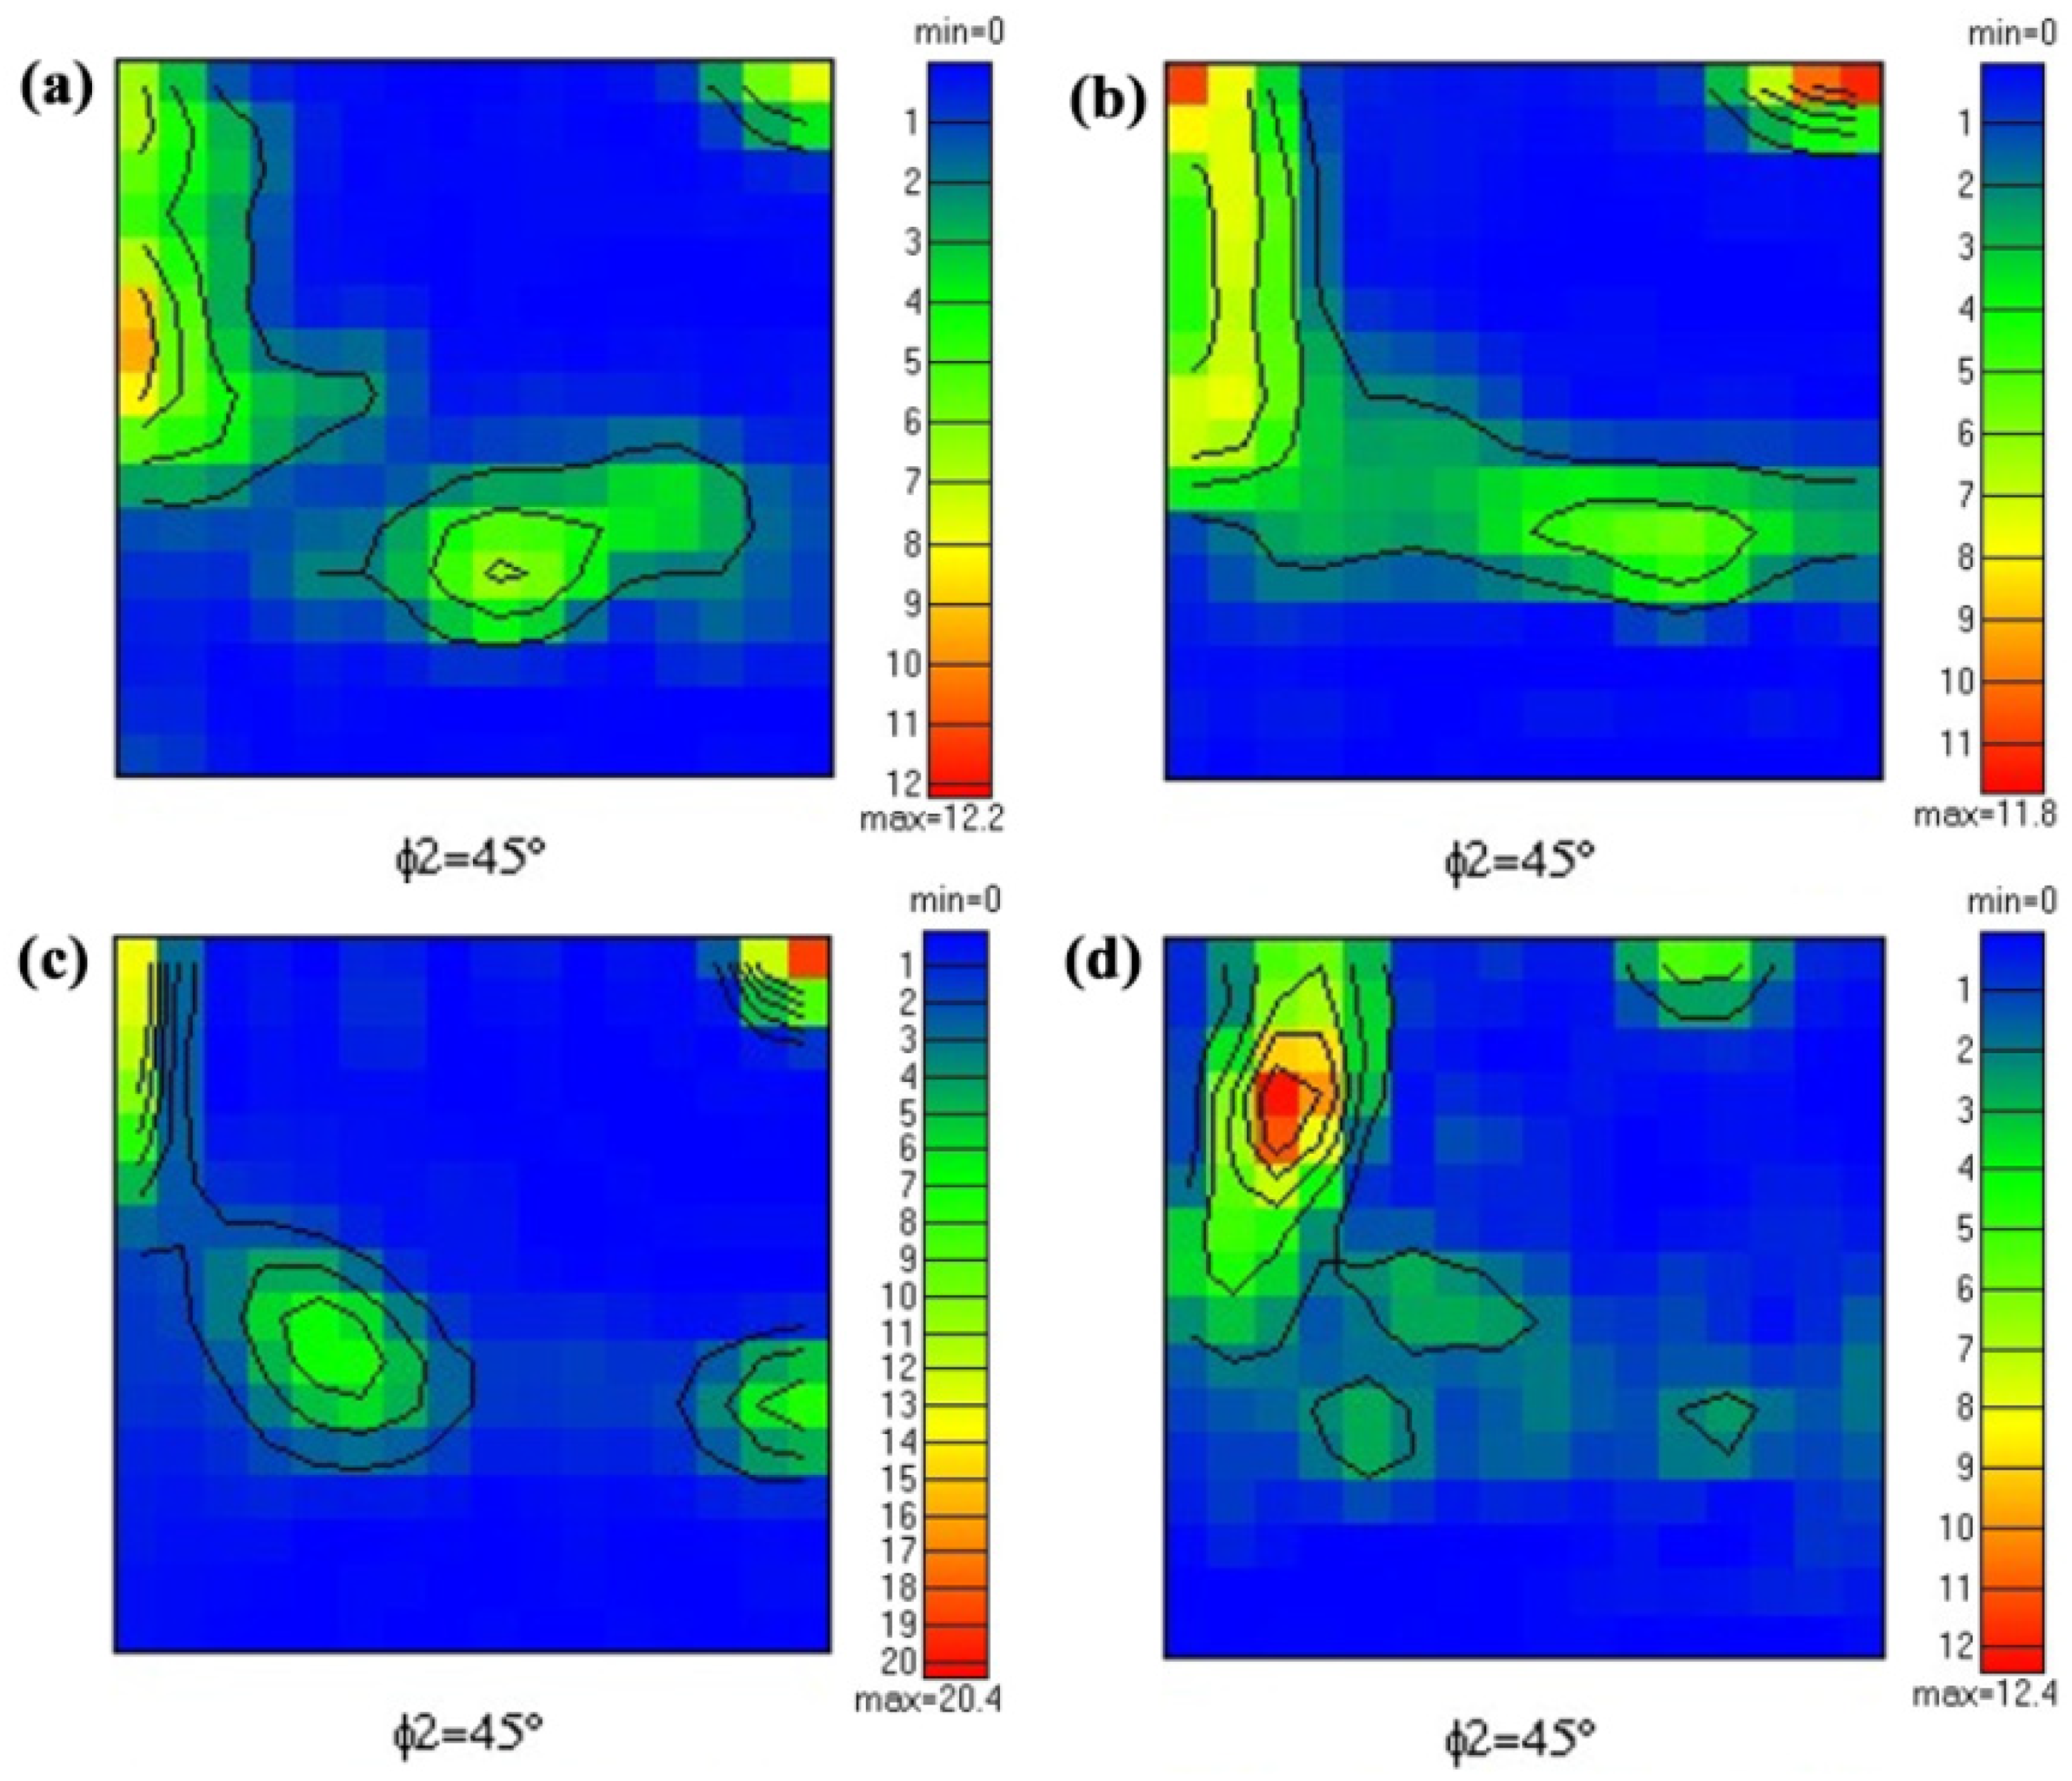
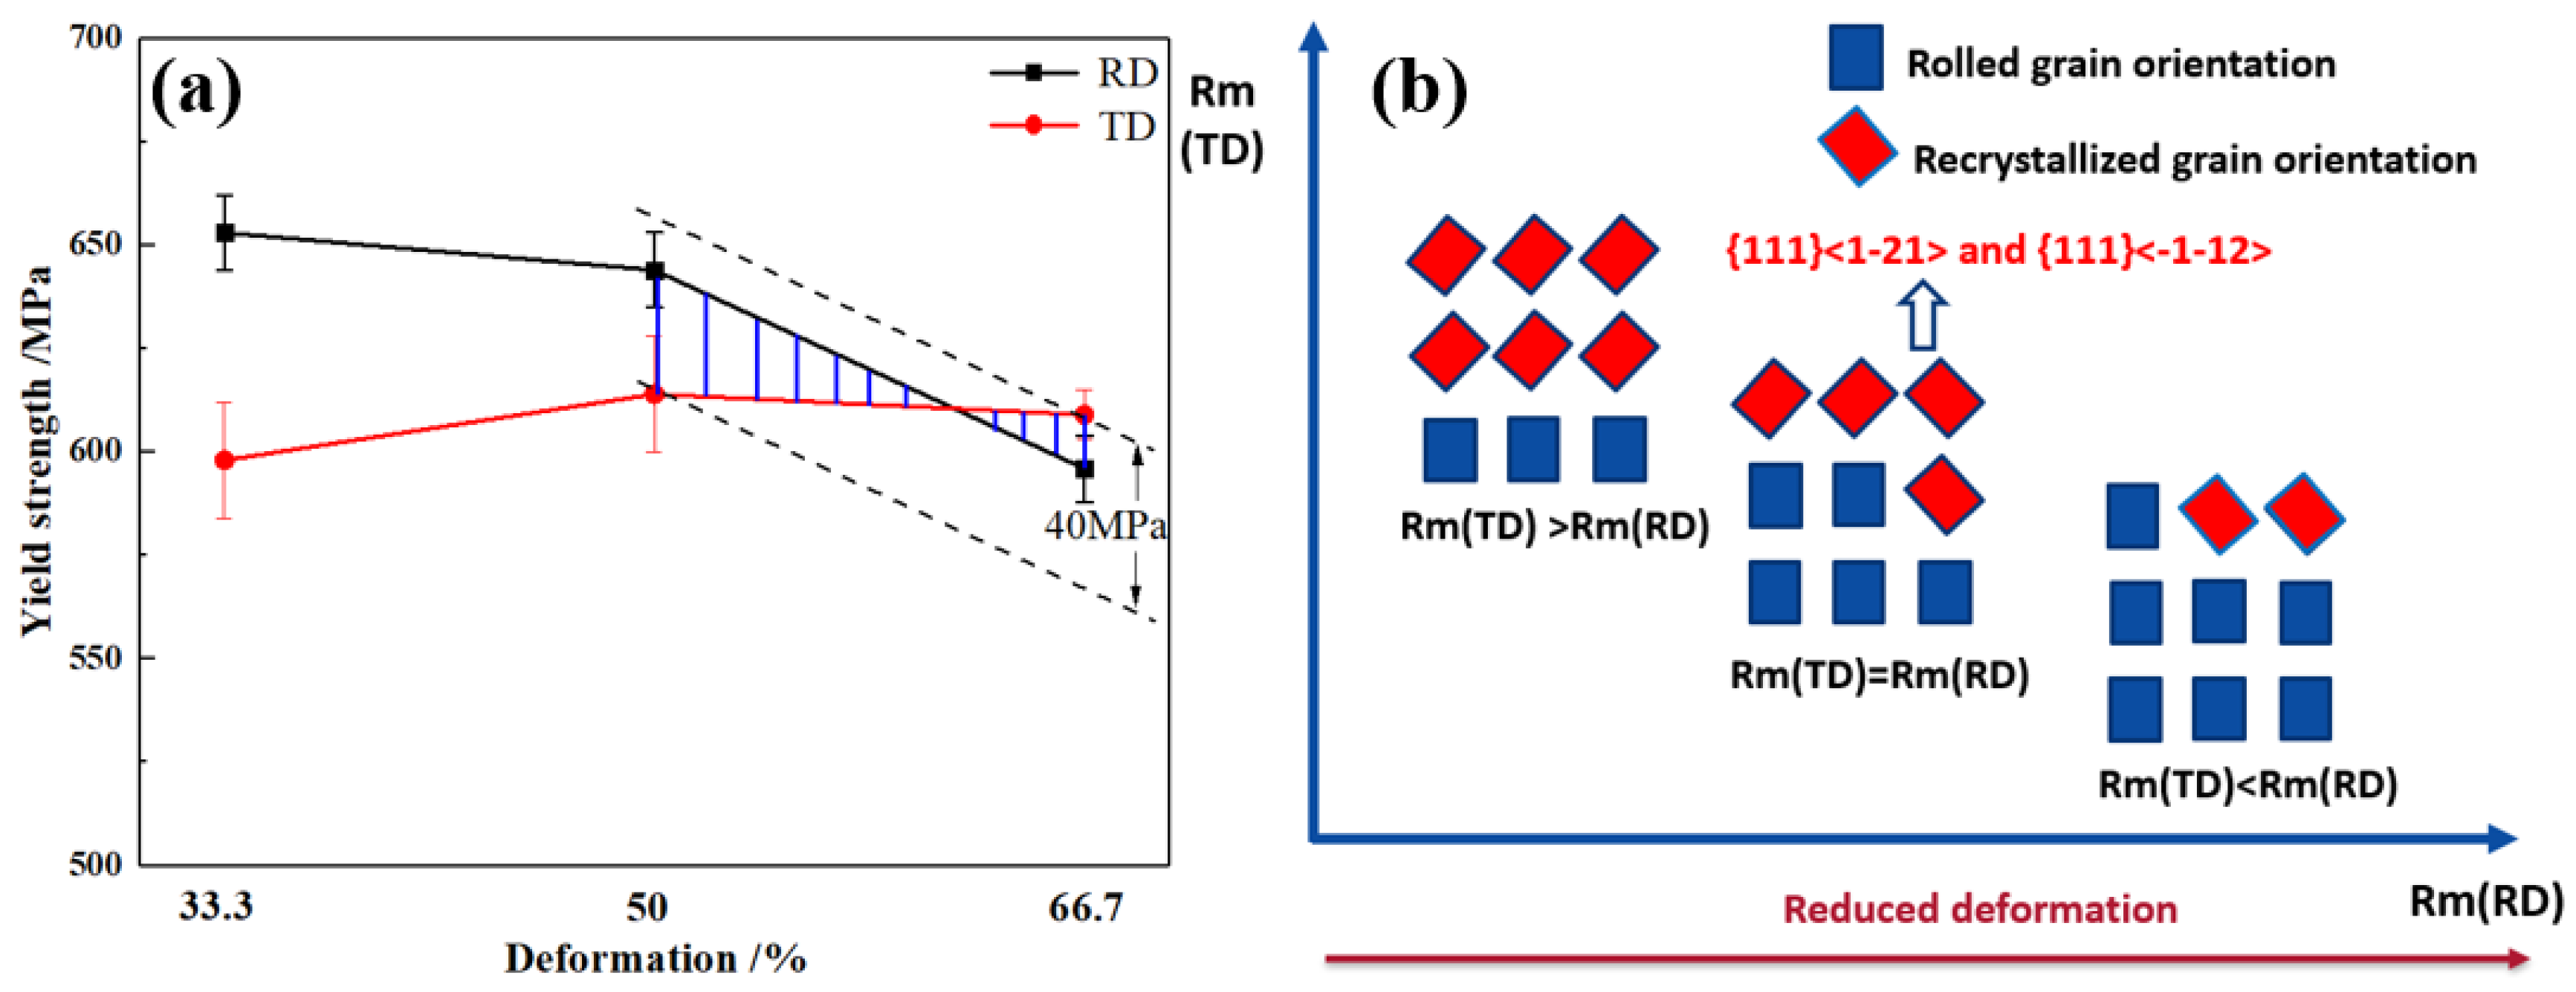
HSLA steel with a low cold rolling reduction rate has a low recrystallization ratio, cubic texture, γ-wire texture, rolled texture, and Z texture in the tissue. Moreover, it exhibits a large RD and TD strength difference. As the cold rolling reduction rate increased, the recrystallization ratio increased, the rolled and Z-textures gradually disappeared, and the RD and TD strength differences decreased. The rolled and Z-textures increased the strength anisotropy of the steel.
(3)
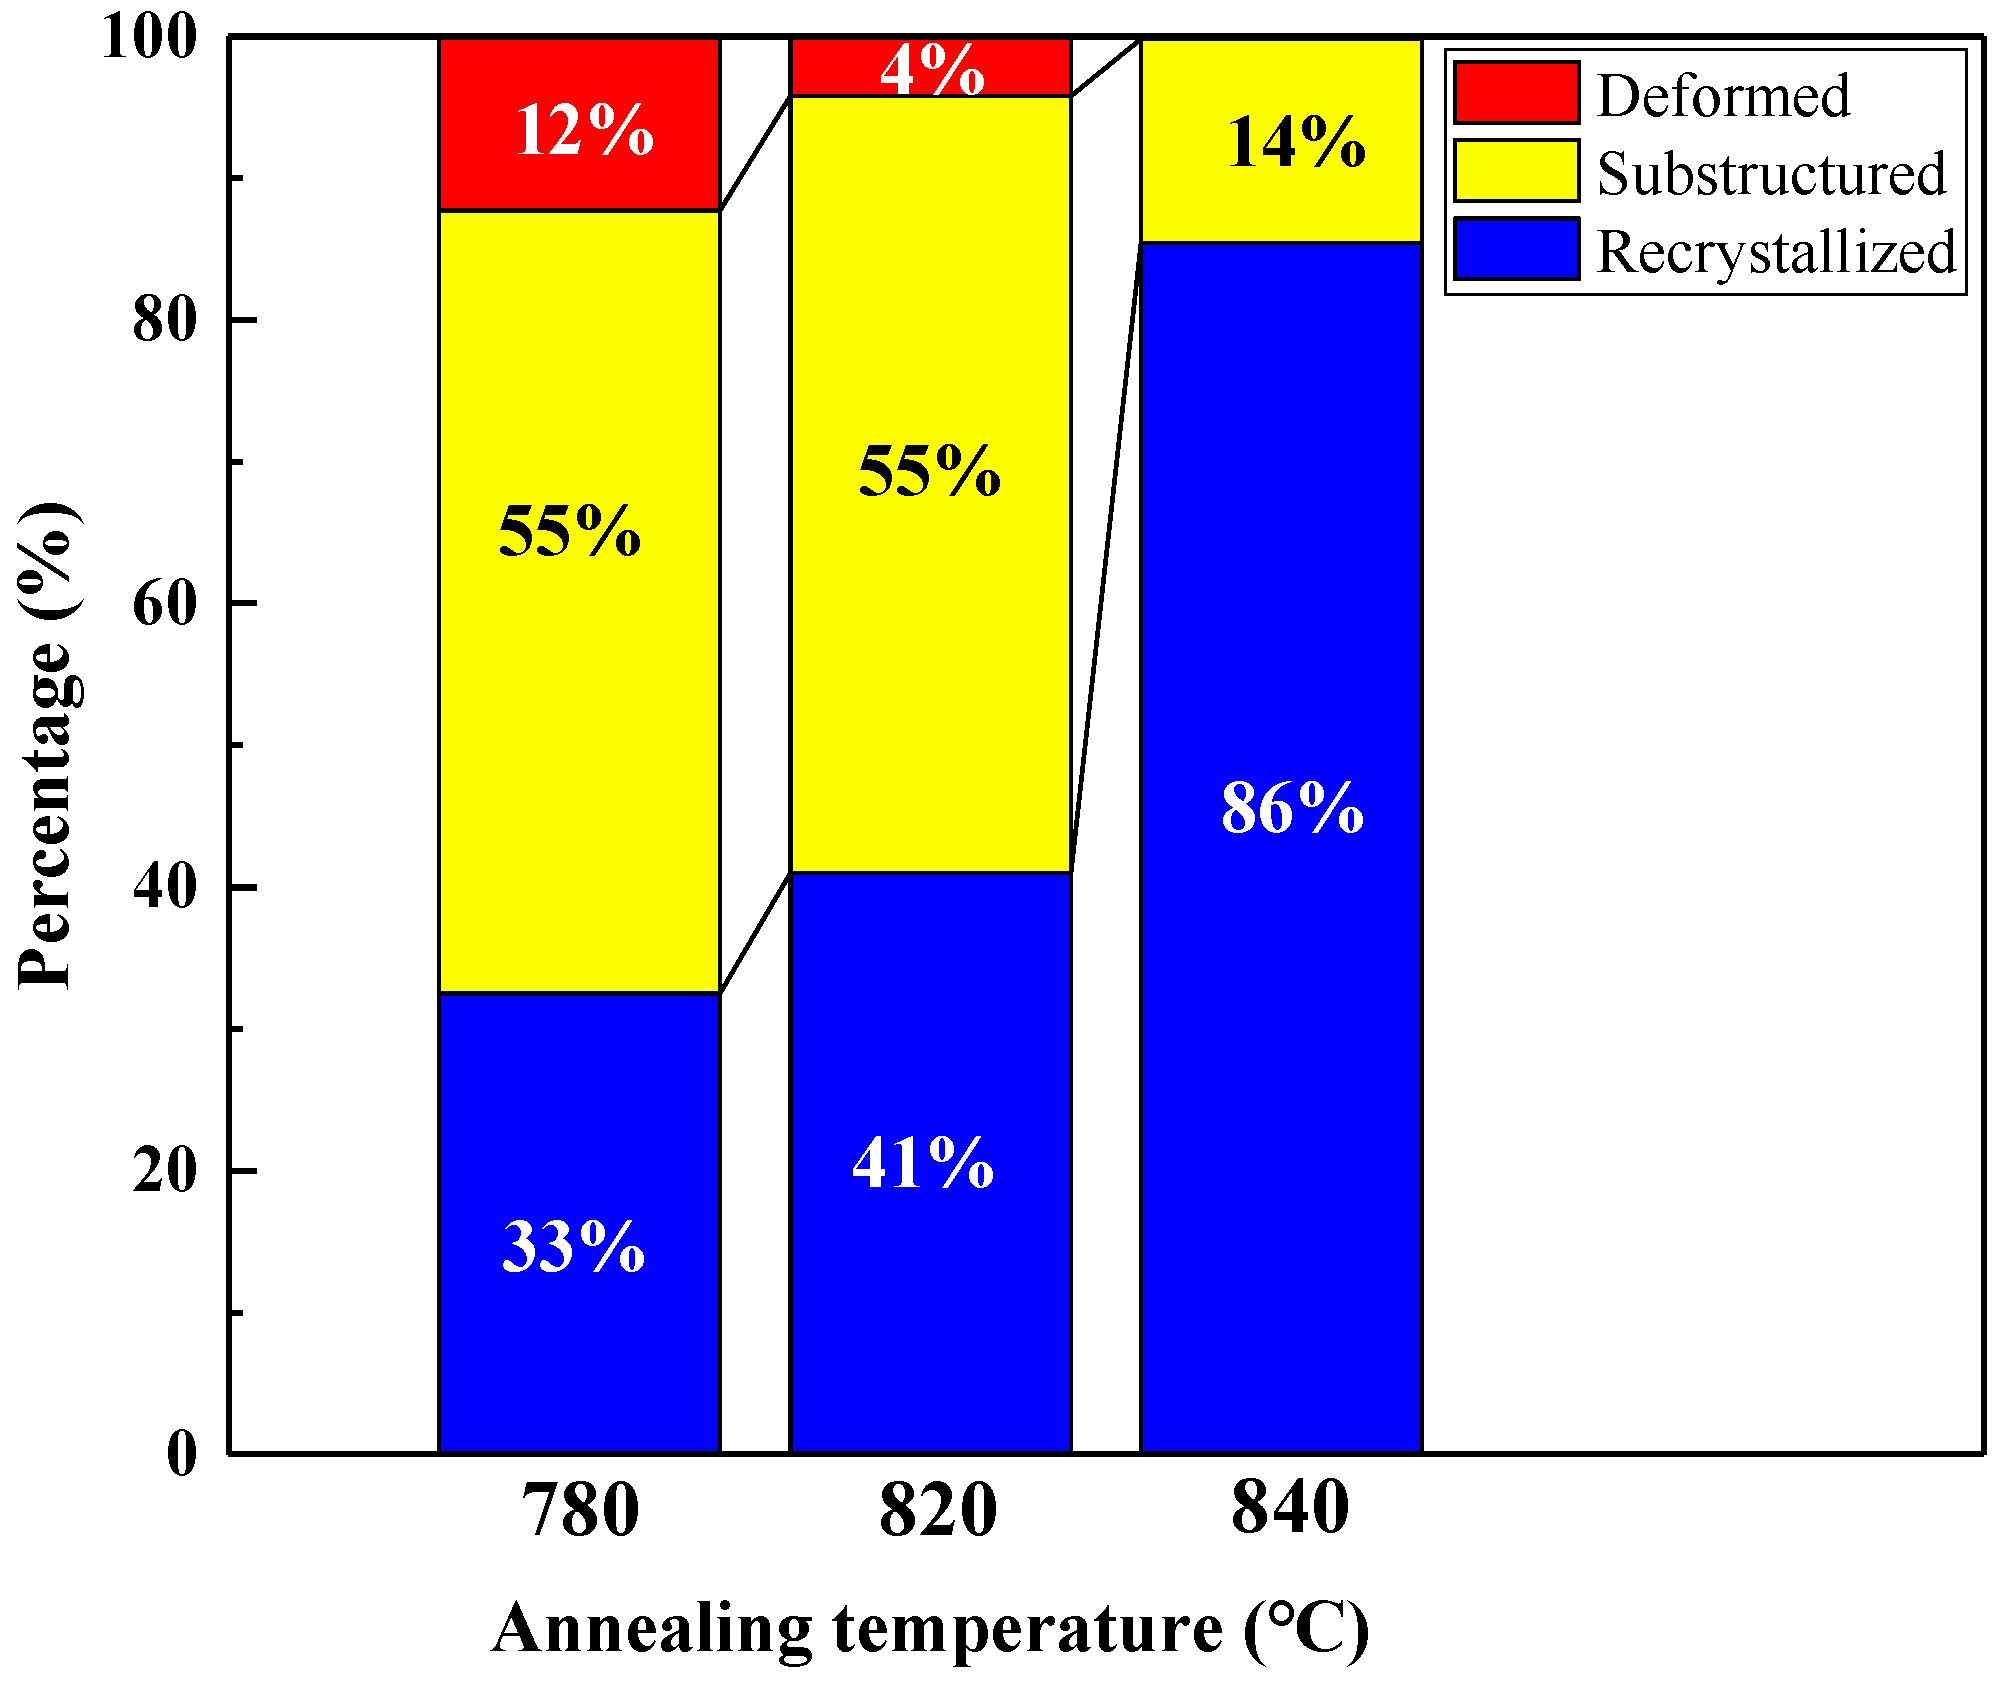
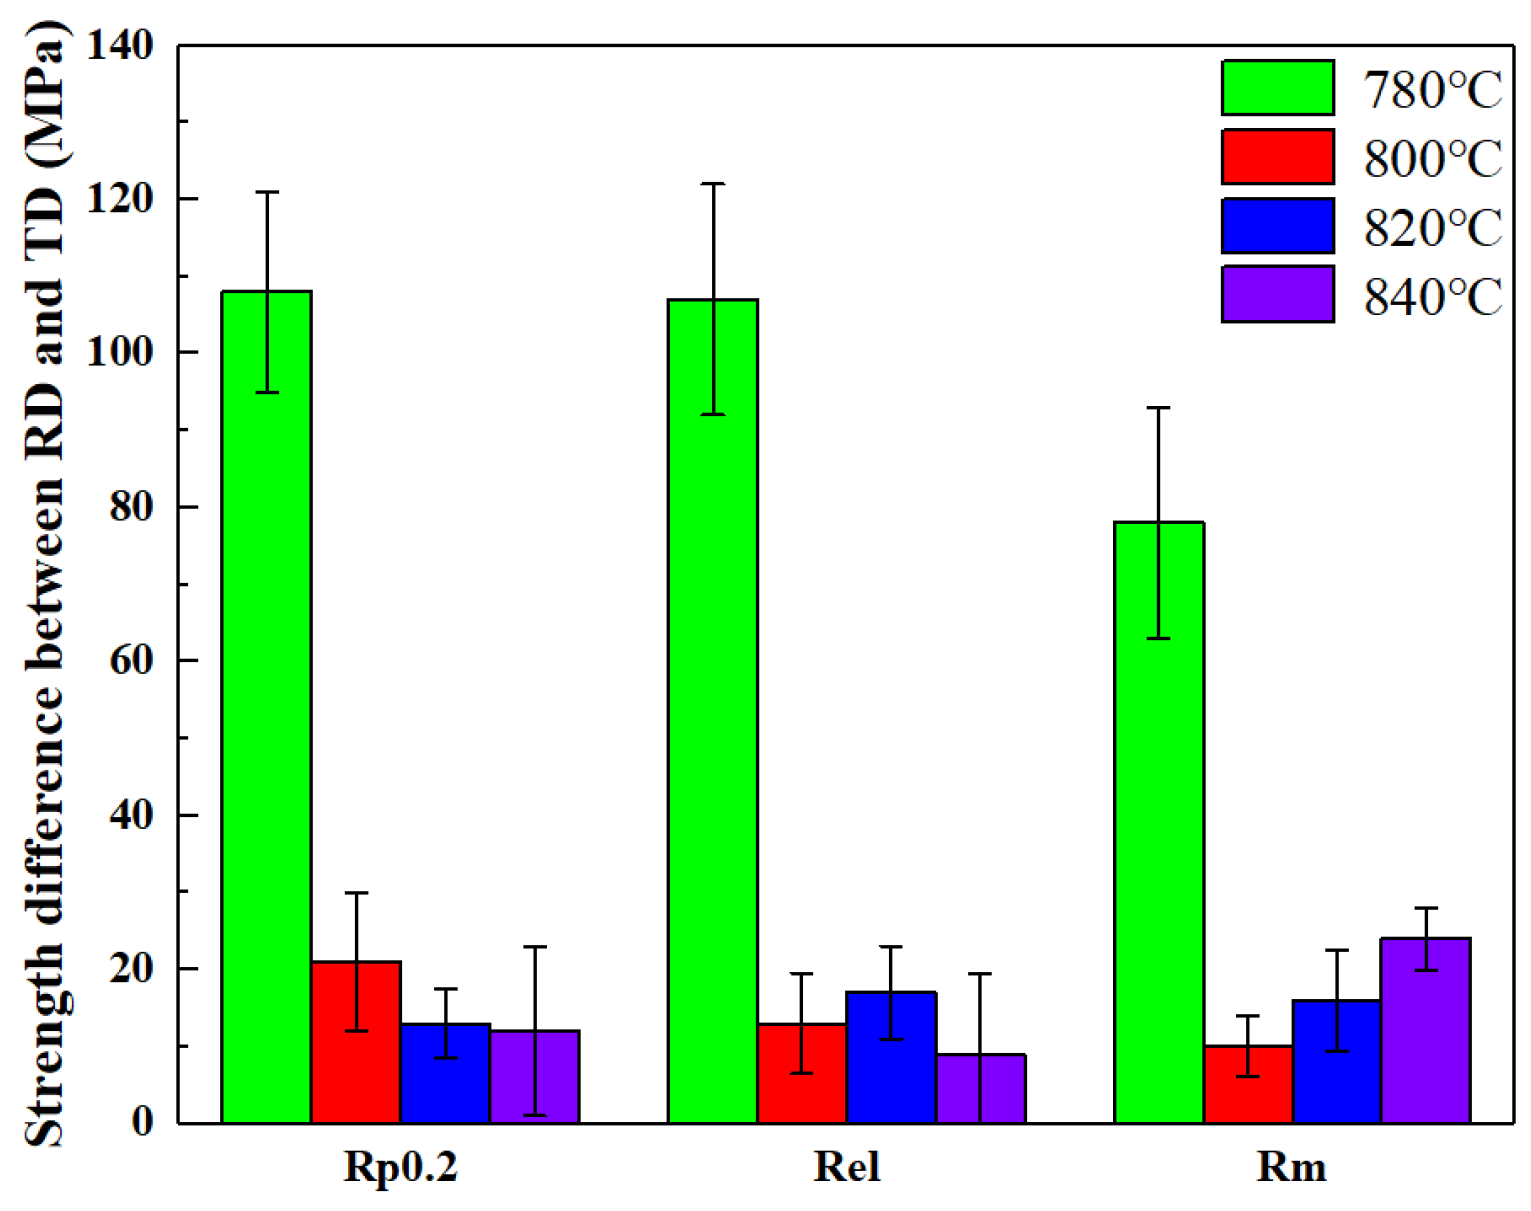
After annealing at 780 °C, most of the grains were deformed grains, and the grain orientation was concentrated in the rolled texture. The transverse–longitudinal strength difference of the steel was larger. When the annealing temperature increased, the proportion of recrystallized grains increased, and the organization of the rolling texture disappeared. Moreover, the grain orientation was gathered in the cubic and γ-line textures, resulting in low anisotropy of strength. At annealing temperatures ≥ 840 °C, the deformation of the grain disappeared, and a new texture was formed within the tissue. Moreover, the horizontal and vertical strength differences increased, increasing the anisotropy of the steel strength. The disappearance of the rolled texture is a key factor in reducing the RD and TD strength differences in steels.

Author Contributions

Conceptualization, Y.W. and C.H.; methodology, Y.W., C.H. and X.W.; software, Y.W.; validation, Y.W. and C.H.; formal analysis, X.G.; investigation, C.H.; resources, W.B. and X.L.; data curation, A.L.; writing—original draft preparation, Y.W.; writing—review and editing, X.G. and A.L.; supervision, Y.W. and W.B.; project administration, X.W.; funding acquisition, H.D. All authors have read and agreed to the published version of the manuscript.

Funding

The financial support from the National Natural Science Foundation of China (Key Program): 52031004 and Shanghai Education Commission 2019 Science and Technology Education 01-44 is acknowledged.

Institutional Review Board Statement

Not applicable.

Informed Consent Statement

Not applicable.

Data Availability Statement

The data used to support the findings of this study are available from the corresponding author upon request.

Acknowledgments

The authors acknowledge the financial support from the National Natural Science Foundation of China (Key Program): 52031004 and Shanghai Education Commission 2019 Science and Technology Education 01-44 is acknowledged. X.F. Guo acknowledges the Science and Technology Commission of Shanghai Municipality for the research grants 23ZR1421700.

Conflicts of Interest

The authors declare no conflict of interest.

References

  1. Vervynckt, S.; Verbeken, K.; Lopez, B.; Jonas, J.J. Modern HSLA steels and role of non-recrystallization temperature. Int. Mater. Rev. 2012, 57, 187–207. [Google Scholar] [CrossRef]
  2. Cuddy, L.J. Microstructures developed during thermomechanical treatment of HSLA steels. Met. Trans. A 1981, 12, 1313–1320. [Google Scholar] [CrossRef]
  3. Shao, Y.; Liu, C.; Yan, Z.; Li, H.; Liu, Y. Formation mechanism and control methods of acicular ferrite in HSLA steels: A review. J. Mater. Sci. Technol. 2018, 34, 737–744. [Google Scholar] [CrossRef]
  4. Mishra, S.K.; Das, S.; Ranganathan, S. Precipitation in high strength low alloy (HSLA) steel: A TEM study. Mater. Sci. Eng. A 2002, 323, 285–292. [Google Scholar] [CrossRef]
  5. Asim, K.; Lee, J.; Pan, J. Failure mode of laser welds in lap-shear specimens of high strength low alloy (HSLA) steel sheets. Fatigue Fract. Eng. Mater. Struct. 2012, 35, 219–237. [Google Scholar] [CrossRef]
  6. Narayanasamy, R.; Parthasarathi, N.L.; Sathiya Narayanan, C.S.; Venugopal, T.; Pradhan, H.T. A study on fracture behaviour of three different high strength low alloy steel sheets during formation with different strain ratios. Mater. Des. 2008, 29, 1868–1885. [Google Scholar] [CrossRef]
  7. Show, B.K.; Veerababu, R.; Balamuralikrishnan, R.; Malakondaiah, G. Effect of vanadium and titanium modification on the microstructure and mechanical properties of a microalloyed HSLA steel. Mater. Sci. Eng. A 2010, 527, 1595–1604. [Google Scholar] [CrossRef]
  8. Lee, W.B.; Hong, S.G.; Park, C.G.; Kim, K.H.; Park, S.H. Influence of Mo on precipitation hardening in hot rolled HSLA steels containing Nb. Scr. Mater. 2000, 43, 319–324. [Google Scholar] [CrossRef]
  9. Dutta, S.; Barat, K.; Das, A.; Das, S.K.; Shukla, A.K.; Roy, H. Characterization of micrographs and fractographs of Cu-strengthened HSLA steel using image texture analysis. Measurement 2014, 47, 130–144. [Google Scholar] [CrossRef]
  10. Krishnadev, M.R.; Galibois, A. Development of a high-strength low-alloy steel strengthened by transformation substructure and precipitation of copper and niobium. Met. Technol. 2013, 1, 300–302. [Google Scholar] [CrossRef]
  11. Iob, F.; Cortese, L.; Di Schino, A.; Coppola, T. Influence of mechanical anisotropy on micro-voids and ductile fracture onset and evolution in high-strength low alloyed steels. Metals 2019, 9, 224. [Google Scholar] [CrossRef]
  12. Kotrechko, S.; Stetsenko, N.; Shevchenko, S. Effect of texture smearing on the anisotropy of cleavage-stress of metals and alloys. Theor. Appl. Fract. Mech. 2004, 42, 89–98. [Google Scholar] [CrossRef]
  13. Ray, R.K.; Jonas, J.J.; Hook, R.E. Cold rolling and annealing textures in low carbon and extra low carbon steels. Int. Mater. Rev. 1994, 39, 129–172. [Google Scholar] [CrossRef]
  14. Baczynski, G.J.; Jonas, J.J.; Collins, L.E. The influence of rolling practice on notch toughness and texture development in high-strength linepipe. Met. Trans. A 1999, 30, 3045–3054. [Google Scholar] [CrossRef]
  15. Bruder, E. The effect of deformation texture on the thermal stability of UFG HSLA steel. J. Mater. Sci. 2012, 47, 7751–7758. [Google Scholar] [CrossRef]
  16. Eghlimi, A.; Shamanian, M.; Eskandarian, M.; Zabolian, A.; Nezakat, M.; Szpunar, J.A. Evaluation of microstructure and texture across the welded interface of super duplex stainless steel and high strength low alloy steel. Surf. Coat. Technol. 2015, 264, 150–162. [Google Scholar] [CrossRef]
  17. Gardiola, B.; Humbert, M.; Esling, C.; Flemming, G.; Hensger, K.E. Determination and prediction of the inherited ferrite texture in a HSLA steel produced by compact strip production. Mater. Sci. Eng. A 2001, 303, 60–69. [Google Scholar] [CrossRef]
  18. Joo, M.S.; Suh, D.W.; Bae, J.H.; Bhadeshia, H. Role of delamination and crystallography on anisotropy of Charpy toughness in API-X80 steel. Mater. Sci. Eng. A 2012, 546, 314–322. [Google Scholar] [CrossRef]
  19. Samajdar, I.; Verlinden, B.; Van Houtte, P.; Vanderschueren, D. γ-fibre recrystalisation texture in IF-steel: An investigation on the recrystalisation mechanisms. Mater. Sci. Eng. A 1997, 238, 343–350. [Google Scholar] [CrossRef]
  20. Samajdar, I.; Verlinden, B.; Kestens, L.; Van Houtte, P. Physical parameters related to the developments of recrystalisation textures in an ultra low carbon steel. Acta Mater. 1998, 47, 55–65. [Google Scholar] [CrossRef]
  21. Badji, R.; Bacroix, B.; Bouabdallah, M. Texture, microstructure and anisotropic properties in annealed 2205 duplex stainless steel welds. Mater. Charact. 2011, 62, 833–843. [Google Scholar] [CrossRef]
  22. Badji, R.; Bouabdallah, M.; Bacroix, B.; Kahloun, C.; Belkessa, B.; Maza, H. Phase transformation and mechanical behavior in annealed 2205 duplex stainless steel welds. Mater. Charact. 2008, 59, 447–453. [Google Scholar] [CrossRef]
  23. Kononov, A.A.; Zotov, O.G.; Shamshurin, A.I. Distribution of crystallographic orientations in an anisotropic electrical steel under rolling stages. Met. Sci. Heat Treat. 2014, 56, 449–453. [Google Scholar] [CrossRef]
  24. Santos, A.P.d.R.; Mota, M.; Segundo, H.V.G.; de Almeida, L.H.; Araújo, L.S.; Rocha, A.d.C. Texture, microstructure and anisotropic properties of IF-steels with different additions of titanium, niobium and phosphorus. J. Mater. Res. Technol. 2018, 7, 331–336. [Google Scholar] [CrossRef]
  25. Fu, J.; Cui, K.; Li, F.; Wang, J.; Wu, Y. Texture and anisotropic mechanical properties of ferritic stainless steel stabilized with Ti and Nb. Mater. Charact. 2020, 159, 110027. [Google Scholar] [CrossRef]
  26. Sun, L.; Jiang, F.; Huang, R.; Yuan, D.; Guo, C.; Wang, J. Anisotropic mechanical properties and deformation behavior of low-carbon high-strength steel component fabricated by wire and arc additive manufacturing. Mater. Sci. Eng. A 2020, 787, 139514. [Google Scholar] [CrossRef]
  27. Kisrane-Bouzidi, A.; Zidani, M.; Nebbar, M.C.; Abid, T.; Helbert, A.L.; Brisset, F.; Baudin, T. Mechanical properties and texture evolution of high-carbon steel wires during wire drawing: Strand manufacturing. Int. J. Eng. Res. Afr. 2020, 49, 130–138. [Google Scholar] [CrossRef]
  28. Jorge-Badiola, D.; Iza-Mendia, A.; Gutiérrez, I. Evaluation of intragranular misorientation parameters measured by EBSD in a hot worked austenitic stainless steel. J. Microsc. 2007, 228, 373–383. [Google Scholar] [CrossRef]
  29. De Abreu, H.F.G.; Bruno, A.D.S.; Tavares, S.S.M.; Santos, R.; Carvalho, S. Effect of high temperature annealing on texture and microstructure on an AISI-444 ferritic stainless steel. Mater. Charact. 2006, 57, 342–347. [Google Scholar] [CrossRef]
  30. Eloot, K.; Okuda, K.; Sakata, K.; Obara, T. Recrystallization and Related Phenomena. Texture evolution during cold rolling and recrystallization of IF steel with a strong {111} hot band texture. ISIJ Int. 1998, 38, 602–609. [Google Scholar] [CrossRef]
  31. Sun, G.; Du, L.; Hu, J.; Zhang, B.; Misra, R.D.K. On the influence of deformation mechanism during cold and warm rolling on annealing behavior of a 304 stainless steel. Mater. Sci. Eng. A 2019, 746, 341–355. [Google Scholar] [CrossRef]
  32. Sun, G.S.; Du, L.X.; Hu, J.; Misra, R.D.K. Microstructural evolution and recrystalisation behavior of cold rolled austenitic stainless steel with dual phase microstructure during isothermal annealing. Mater. Sci. Eng. A 2018, 709, 254–264. [Google Scholar] [CrossRef]
  33. Shirazi, H.; Miyamoto, G.; Hossein Nedjad, S.H.; Chiba, T.; Nili Ahmadabadi, M.; Furuhara, T. Microstructure evolution during austenite reversion in Fe-Ni martensitic alloys. Acta Mater. 2018, 144, 269–280. [Google Scholar] [CrossRef]
  34. Barnett, M.R.; Kestens, L.M.R.B.; Kestens, L. Formation of {111}<110> and {111}<112> textures in cold rolled and annealed IF sheet steel. ISIJ Int. 1999, 39, 923–929. [Google Scholar] [CrossRef]
  35. Hashimoto, N.; Yoshinaga, N.; Senuma, T. Recrystallization and Related Phenomena. Texture evolution of IF steel due to recrystalisation. ISIJ Int. 1998, 38, 617–624. [Google Scholar] [CrossRef]
  36. Bakshi, S.D.; Javed, N.; Sasidhar, K.N.; Dhande, T.; Sharma, V.; Mukherjee, M. Effect of microstructure and crystallographic texture on mechanical anisotropy of Ti-Nb microalloyed hot rolled 800 MPa HSLA steel. Mater. Charact. 2018, 136, 346–357. [Google Scholar] [CrossRef]
Figure 1. Microstructure, grain orientation, and strength differences in the hot-rolled state of HSLA. (a) RD-IPF of the ferrite phase. (b) Distribution of the ferrite grain structure. (c) Cross-sectional view of ODF at φ2 = 45°. (d) Difference between the strengths in the RD and TD.
Coatings 13 01442 g001
Figure 2. Three-dimensional reconstructed microstructure and grain orientations of specimens at different cold rolling reduction rates and subsequent recrystallization annealing at 820 °C for 4 min. (a,c,e) are 3D microstructures at cold-rolled reduction rates of 33.3%, 50%, and 66.7%, respectively. (b,d,f) are the corresponding RD-IPF maps.
Coatings 13 01442 g002
Figure 3. Compositions of recrystallized, subcrystallized, and deformed structures at different cold rolling reduction rates and recrystallization annealing at 820 °C for 4 min.
Coatings 13 01442 g003
Figure 4. Texture and anisotropic behaviors of specimens at different cold rolling reduction rates. (ac) are cross-sectional views of the ODF at φ2 = 45° for the cold-rolled specimens at reduction rates of 33.3%, 50%, and 66.7%. (d) Strength difference between RD and TD of 33.3%, 50%, and 66.7% cold-rolled deformation specimens.
Coatings 13 01442 g004
Figure 5. RD-IPF maps of the specimens at a cold rolling reduction rate of 66.7% and subsequent recrystallization annealing at (a) 780 °C, (b) 800 °C, (c) 820 °C, and (d) 840 °C for 4 min.
Coatings 13 01442 g005
Figure 6. Composition of the recrystallized, subcrystallized, and deformed structures of the sample at a cold-rolled reduction rate of 66.7% after annealing for 4 min at different annealing temperatures.
Coatings 13 01442 g006
Figure 7. Cross-sectional views of the ODF at φ2 = 45° for the specimens annealed at (a) 780 °C, (b) 800 °C, (c) 820 °C, and (d) 840 °C.
Coatings 13 01442 g007
Figure 8. Strength difference between RD and TD of the specimens annealed at 780, 800, 820, and 840 °C.
Coatings 13 01442 g008
Figure 9. (a) Relationship between TD and RD yield strengths and deformations. (b) Schematic illustrations of the proposed texture and anisotropic properties between TD and RD at different deformations.
Coatings 13 01442 g009
Figure 10. (a) Relationship between TD and RD yield strengths and annealing temperature. (b) Schematic illustrations of the proposed texture and anisotropic properties between TD and RD at different annealing temperatures.
Coatings 13 01442 g010
Disclaimer/Publisher’s Note: The statements, opinions and data contained in all publications are solely those of the individual author(s) and contributor(s) and not of MDPI and/or the editor(s). MDPI and/or the editor(s) disclaim responsibility for any injury to people or property resulting from any ideas, methods, instructions or products referred to in the content.

