Article

Non-Linear Evaluation of Coatings Performance: Evaluation of Polyester/Melamine Coil Coating Hydrolysis in NSS Test

by
Esteban M. García-Ochoa
1,*,
Xenia I. Suárez-Corrales
2,
Pablo J. Maldonado-Rivas
3,
William A. Talavera-Pech
1 and
Francisco Corvo
1
1
Centro de Investigación en Corrosión (CICORR), Universidad Autónoma de Campeche, Campeche 24039, Mexico
2
Laboratorio de Ensayos de Tropicalización, Carretera Del Morro, La Habana, Cuba
3
Facultad de Ciencias Químico Biológicas, Universidad Autónoma de Campeche, Campeche 24039, Mexico
*
Author to whom correspondence should be addressed.
Coatings 2023, 13(8), 1327; https://doi.org/10.3390/coatings13081327
Submission received: 9 June 2023 / Revised: 10 July 2023 / Accepted: 21 July 2023 / Published: 28 July 2023

Abstract

:
Coating is one of the most common and effective ways to protect metallic elements from corrosion. The evaluation of a coating’s performance is related to its quality and durability. Neutral salt spray (NSS) is a common accelerated test used for coatings. Commercial polyester/melamine coil coatings applied on aluminum specimens were exposed to NSS and recorded at 0, 200,400, 600 and 1000 h of exposure. Coating performance changed with time of exposure. The main degradation process is due to the hydrolysis of the coating. A decrease in corrosion rate was observed due to the sealing of the coating, probably due to the deposition of corrosion products, salts, or a mixture of both. EN (electrochemical noise) was a more sensitive technique comapred to EIS (electrochemical impedance spectroscopy). The first changes in the coating were detected after 400 h of exposure by EIS and after 200 h by EN. EIS and EN showed equivalent results in studying the corrosion evolution of coated aluminum. Non-linear analysis using recursive plots (RP) showed the chaotic dynamics occurring with time and the interaction of micro electrochemical cells that formed on the metallic surface; it offered information similar tothe traditional EIS technique and adds complementary data to understand the corrosion phenomenon.

1. Introduction

The use of coatings is one of the most common and effective ways to protect metallic elements from corrosion. For this reason, the evaluation and development of new coatings are essential and therefore a priority area. A series of standards and methodologies have been implemented to quickly determine the effectiveness of coatings, such as accelerated exposure tests.
A good quality coating takes a long time to show visible signs of aging or degradation in natural or exploited conditions. Accelerated coating tests are used to obtain results in a relatively short time. Various testing methods have been developed to simulate environmental conditions, such as the neutral salt spray (NSS) test, which involves continuous exposure to saltfog, and cyclic corrosion tests, such as Prohesion®, QUV®, or the combination of both–Prohesion®/QUV® (ASTM D 5894), which simulates weathering conditions and UV radiation [1].
The NSS test (NSS-ISO 9227-2014) [2] is a commonly used standard method that compares different coatings, including paint on metals. It is particularly applied to metals and alloys, metallic coatings (anodic and cathodic), conversion coatings, anodic oxide coatings and organic coatings on metallic materials. It does not represent, as with almost all accelerated tests, the conditions of natural marine-coastal environments and the results cannot be used to predict the behavior of materials in natural environments.
The evaluation of coatings after being subjected to accelerated or natural tests is usually carried out through ISO standards that are mainly based on visual observations with respect to patterns. These tests are very useful for quality control, as they can determine defects in the tested specimens [3]. This evaluation method takes into account different aspects of deterioration, such as the main types of defects (part 1), blistering (part 2), corrosion (part 3), cracking (part 4), flaking (part 5), chalking determined by adhesive tape (part 6), chalking by velvet (part 7), degree of delamination and corrosion (part 8), and filiform corrosion (part 10). To apply this type of evaluation, the defects must arise and develop so that they are clearly visible, which requires a relatively long test time. In fact, based on these standards, a comprehensive evaluation of the performance of coatings can be carried out.
The durability of coatings depends on different aspects. Many complex electrochemical processes occur at metal/coating interfaces. Coating properties are very important, particularly oxygen, water and ion movement through the coating. Permeability of the coating is very important in coating performance. Moisture strongly impacts on the durability of organic coatings by hydrolytic damage, etching, changes in stoichiometry and so on [4].
The effect of the polyester chemical structure on the degradation of polyester/melamine coatings in a weatherometer-accelerated test was studied by Marcos et al. [5]. The main degradation reactions determined were photo-oxidation and hydrolysis. The degradation of the polyester/melamine films occurred in a non-homogeneous manner. The changes in chemical structure during the degradation process resulted in surfaces with more roughness and a consequent loss of gloss. In the case of NSS, no radiation is applied, so the degradation process is generally limited to hydrolysis.
An NSS environment was simulated by Chen [6] through a model to estimate pitting corrosion inside the coating system. It was observed, by comparing the results of the model with empirical data, that it was possible to predict the pit growth rate of an aluminum alloy.
Electrochemical tests are very fast for paint coating evaluations. It is not necessary to wait for changes in appearance, as the evaluation can be made before significant changes are observed in the coating.
Lalic and Martínez stated that it is possible to quantify coating degradation and estimate the long-term performance of high-durability coatings using EIS from the first 100 h of exposure to NSS, in the absence of visual changes on the surface of the coating [7]. The assumption of these authors may have been useful for their conditions, but it is a significant risk to suppose that a coating’s quantification can be made using EIS after 100 h of testing in NSS. Some other authors have used EIS for similar systems [8,9].
This paper proposes a new and fast evaluation method for coating degradation caused by hydrolysis based on EIS and electrochemical noise (EN) measurements, and the application of non-linear dynamics. The information obtained is complementary to and sheds light on the corrosion phenomenon that occurs over time in the metal coating system. It is the first time that a non-linear analysis of the EN signal has been applied to a protective coating system on aluminum in the presence of salt spray.
An EN signal contains information about the corrosion process occurring on the metal surface, both in intensity and morphology [10,11,12,13,14]. Hence, there is great interest in processing the EN signal, which is nothing other than fluctuations in the potential and current when the electrochemical phenomenon of corrosion occurs.
EIS and EN have been recommended as evaluation methods for coatings on metallic substrates, but the interpretation of the results using non-linear dynamics has only been recently developed, especially if lagtime graphics and recurrence plots are applied. Commercial polyester/melamine coil coatings on aluminum were selected as the material for testing in NSS.
One of the most common and simple methodologies in EN is to observe the fluctuations of the signals over time. We first detected the moment in which a pitting corrosion process began, which corresponds to a series of very marked fluctuations in the noise signal [15]. It was simple, but it constituted a remarkable contribution since conventional electrochemical techniques in both direct current and impedance are not capable of expressing it so clearly. Subsequently, a simple statistical analysis led us to determine what we now know as noise resistance (Rn), which is nothing other than the standard deviation ratio of the EN signal in potential and in current, as shown below [16]:
R n = σ E σ I
It was determined that Rn was inversely proportional to the intensity of the corrosion phenomenon when it is generalized. On many occasions, several researchers associated it with polarization resistance (Rp) [17]. Another parameter defined by statistical analysis was the localization index (LI), which can be obtained from the current noise signal and is defined using the following equation [18]:
L I = σ I σ I 2 + I 2
This parameter can only acquire values between zero (0) and one (1), in which zero corresponds to totally generalized corrosion and one to highly localized corrosion. With just these two parameters, extremely difficult corrosion systems, such as atmospheric corrosion, can be evaluated electrochemically, since this technique is not intrusive [19].
Subsequently, the noise signal was transformed from the time domain to the frequency domain (f), and it was clearly seen that there was a 1/f relationship, which indicated that the signal was not random and therefore contained relevant information [20].
A group of researchers concluded that the EN signal demonstrates that corrosion is a non-linear or chaotic phenomenon [21,22,23]. This conclusion opened a new panorama to apply non-linear analysis, such as graphing the attractors in two and three dimensions by means of delays in the time series obtained [24,25,26]. This is an adequate representation of the dynamics of the corrosion process based on Takens’s theorem. It establishes the variation in time of a variable of a process that contains the dynamic information of the entire process.
Recursive graphics (RP) originated from the need to represent the dynamics of a multidimensional chaotic process. In 1987, Eckman [27] proposed a methodology to achieve this objective. RP is a two-dimensional binary diagram that encodes the time pattern of a single recorded time series of an observable. It occurs in a phase space of “m” dimensions and within a certain threshold “ε” at different times and can be represented by the following equation:
R i , j = θ ε x i x j i , j = 1 , N ,
where θ corresponds to the Heaviside function and ε is a predefined threshold that ensures a clearer understanding. It is recommended to consult the literature already published on the matter. This graphic representation of multidimensional dynamics is evaluated visually and, as expected, it is very subjective.
For this reason, Zbilut and Webber Jr. [28,29,30] proposed a series of parameters to evaluate RP more quantitatively and consequently, the non-linear dynamics of the phenomenon under study. These parameters are:
  • Percent of recurrence (%R): It is the percentage of points whose distance is equal to or less than the established threshold. It can be considered as the probability that the reconstructed path will revisit an area of the phase space determined by a threshold.
  • Percent of determinism (%D): It is the percentage of recurrence points that form diagonal lines. It is indicative of the deterministic behavior of the established system.
  • Maximum line (LM): It is the longest diagonal line segment, and is inversely proportional to the largest Lyapunov exponent and therefore an indicator of the sensitivity to initial conditions.
  • Shannon entropy (Ent): It indicates the probability of the distribution of diagonal lines. This reflects the complexity of the system.
The first report concerning RP application to a corrosion process was in 2005 [31], in the study of copper pitting corrosion in NaCl and Na2SO4 solutions. After this first report, RP has been applied to different corrosion phenomena, obtaining remarkable results for a better understanding of corrosion [32,33,34,35].

2. Materials and Methods

Coil coating is a highly automated and continuous process for coating long strips of thin metal prior to fabrication. Coil coating is a highly efficient and cost-effective production technique that allows metal coils to be painted very quickly. Products such as steel and aluminum strips are painted inline in the industrial plant, significantly reducing the production time and costs and maintaining high quality. The reproducibility of the manufacturing process, the relatively low cost and the reduced environmental impact have contributed to increasing the use of the coil coating process [36]. The polymeric paints are applied to unwound coils of steel or aluminum in a range of colors, cured in seconds, and recoiled for distribution and use. The metal, in the coil coating process, is cleaned and treated thoroughly. This is a unique quality of the coil coating operation and is a central reason why coil-coated products perform in such a superior manner [37]. Commercial lacquered aluminum specimens obtained by coil coating technology were exposed inside the NSS chamber and recorded at 200, 400, 600, 80, and 1000 h, following the ISO 9227: 2014 standard [2].

2.1. Thickness and Gloss Tests

Paint coating thickness was determined using a dry film thickness meter based on Eddy current and magnetic principles: POSITECTOR 6000 Series Coating Thickness Gauge (DeFelsko Corp., Ogdensburg, NY, USA). Five points were selected at a distance longer than 2 cm from the border on each sample (sizing 150 mm × 100 mm) and the average was calculated. Three samples were evaluated for every exposure time. Changes in average thickness with respect to the exposure time in NSS were determined.
Gloss was determined using REFO 3-D glossmeter using a three-angle geometry. All samples were measured at an angle of 60°. The instrument possesses an automatic calibration system according to ISO 7668 standard. Five points were selected on each sample at a distance longer than 2 cm from the border and the average was calculated. Three samples were evaluated for every exposure time. Changes in the average gloss of the specimen versus the time in the NSS chamber were determined.

2.2. FTIR Spectra

FTIR spectra of the surface of the specimens at 0, 200, 400, 600, 800, and 1000 h of exposure in NSS were obtained. For this, spectral (near-normal) directional/hemispherical reflectance R(λ) values were obtained with a commercial spectrophotometer equipped with an integrating sphere, in which the angle of incidence of the light is near-normal to the sample surface. R(λ) data in the range of 2 to 15 microns were obtained with an FTIR spectrophotometer (Frontier NIR/MIR, PerkinElmer, Waltham, MA, USA) equipped with an integrating sphere (IntegratIR, PerkinElmer, Waltham, MA, USA). The data obtained as R(λ) were converted to absorbance values according to the Beer–Lambert law [35], and the spectral interval was presented as wavenumber (cm−1).
Data obtained as R(λ) were transformed to absorbance according to the Beer–Lambert law [38] and plotted vs. wavenumber (cm−1).

2.3. Electrochemical Tests (EIS and EN)

Samples exposed at different times were cut and six 1.5 cm2 pieces were obtained for every exposure time. Three pieces were used for EIS measurements and the other three for EN measurements. Exposed area was 1 cm2. Calomel electrode was used as reference. Graphite was used as counter electrode for EIS. In the case of EN measurement, one working electrode was the coated specimen and the other was the aluminum alloy 6061. Under these conditions the aluminum alloy is covered by the coating. The coating is the dielectric isolating the metal from the aggressive environment. The intensity and morphology of the corrosion attack depends on the coating.
Test solution used was the same corresponding to NSS (NaCl 5%). A control sample was always used for comparison (not exposed).
EIS measurements were carried out in the rangeof 10,000 to 0.05 Hz. Two points per second were determined in the case of EN measurements for a total of 2048 points (frequency = 2 Hz). Data trend was removed to calculate Rn.

3. Results

3.1. Thickness and Gloss

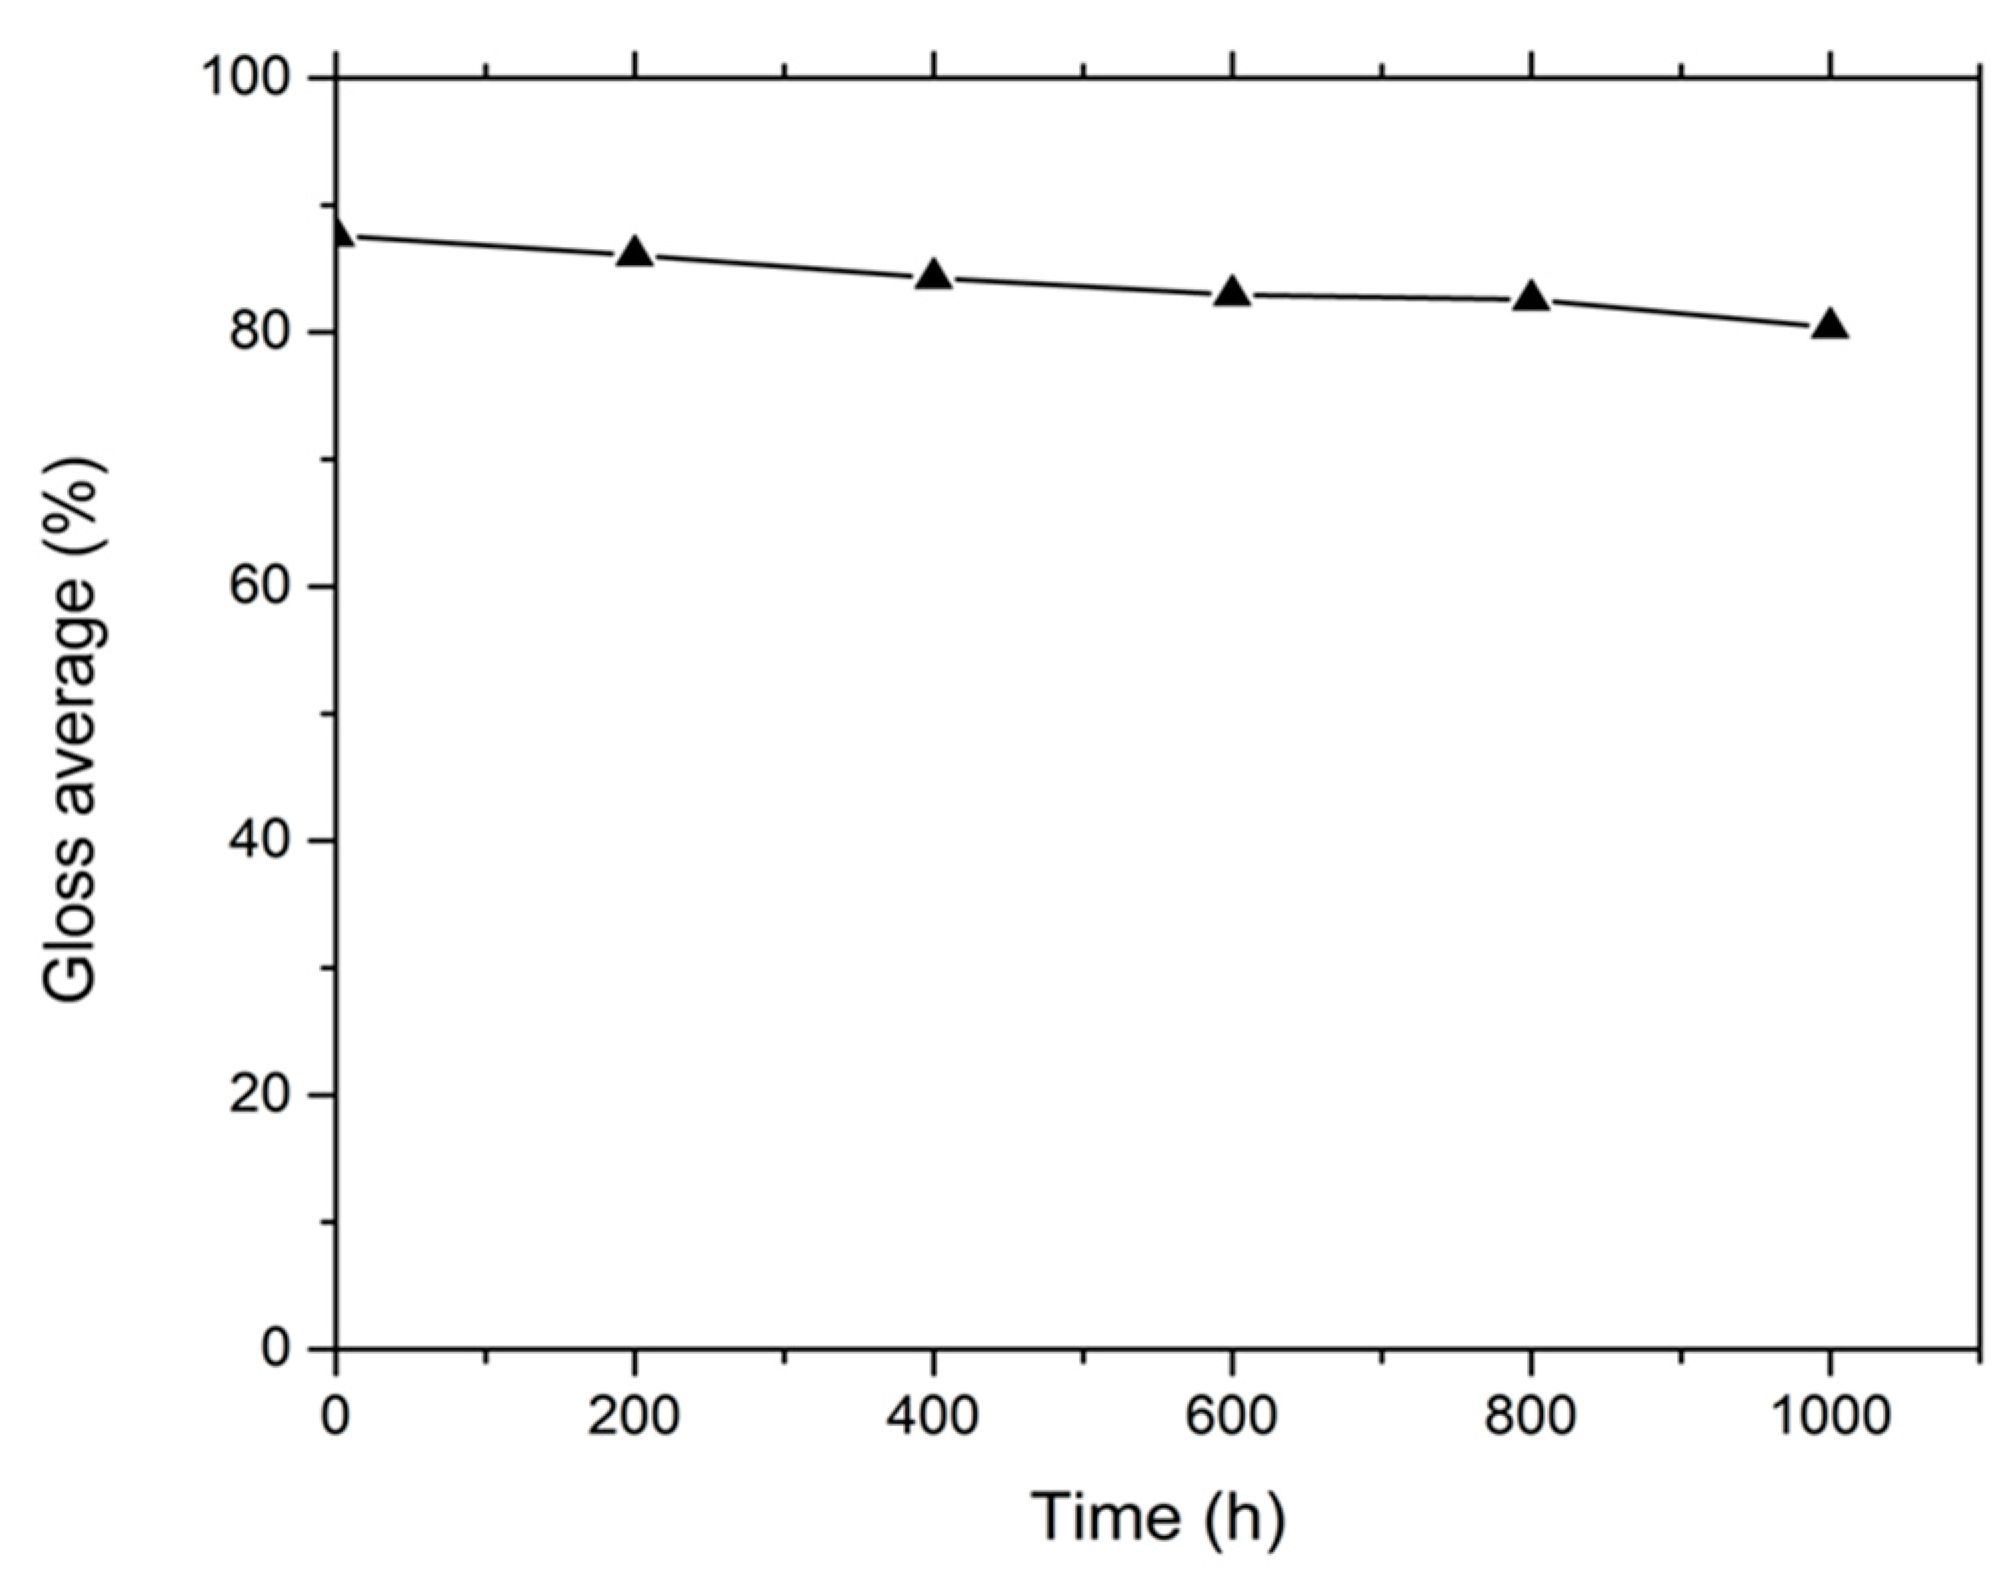
Changes in the thickness and gloss of the coated specimens were not very significant when exposed to NSS (Figure 1 and Figure 2). This means that the main degradation mechanism is potentially hydrolysis of the coating and aluminum corrosion.

3.2. Fourier Transformed Infra-Red Spectra

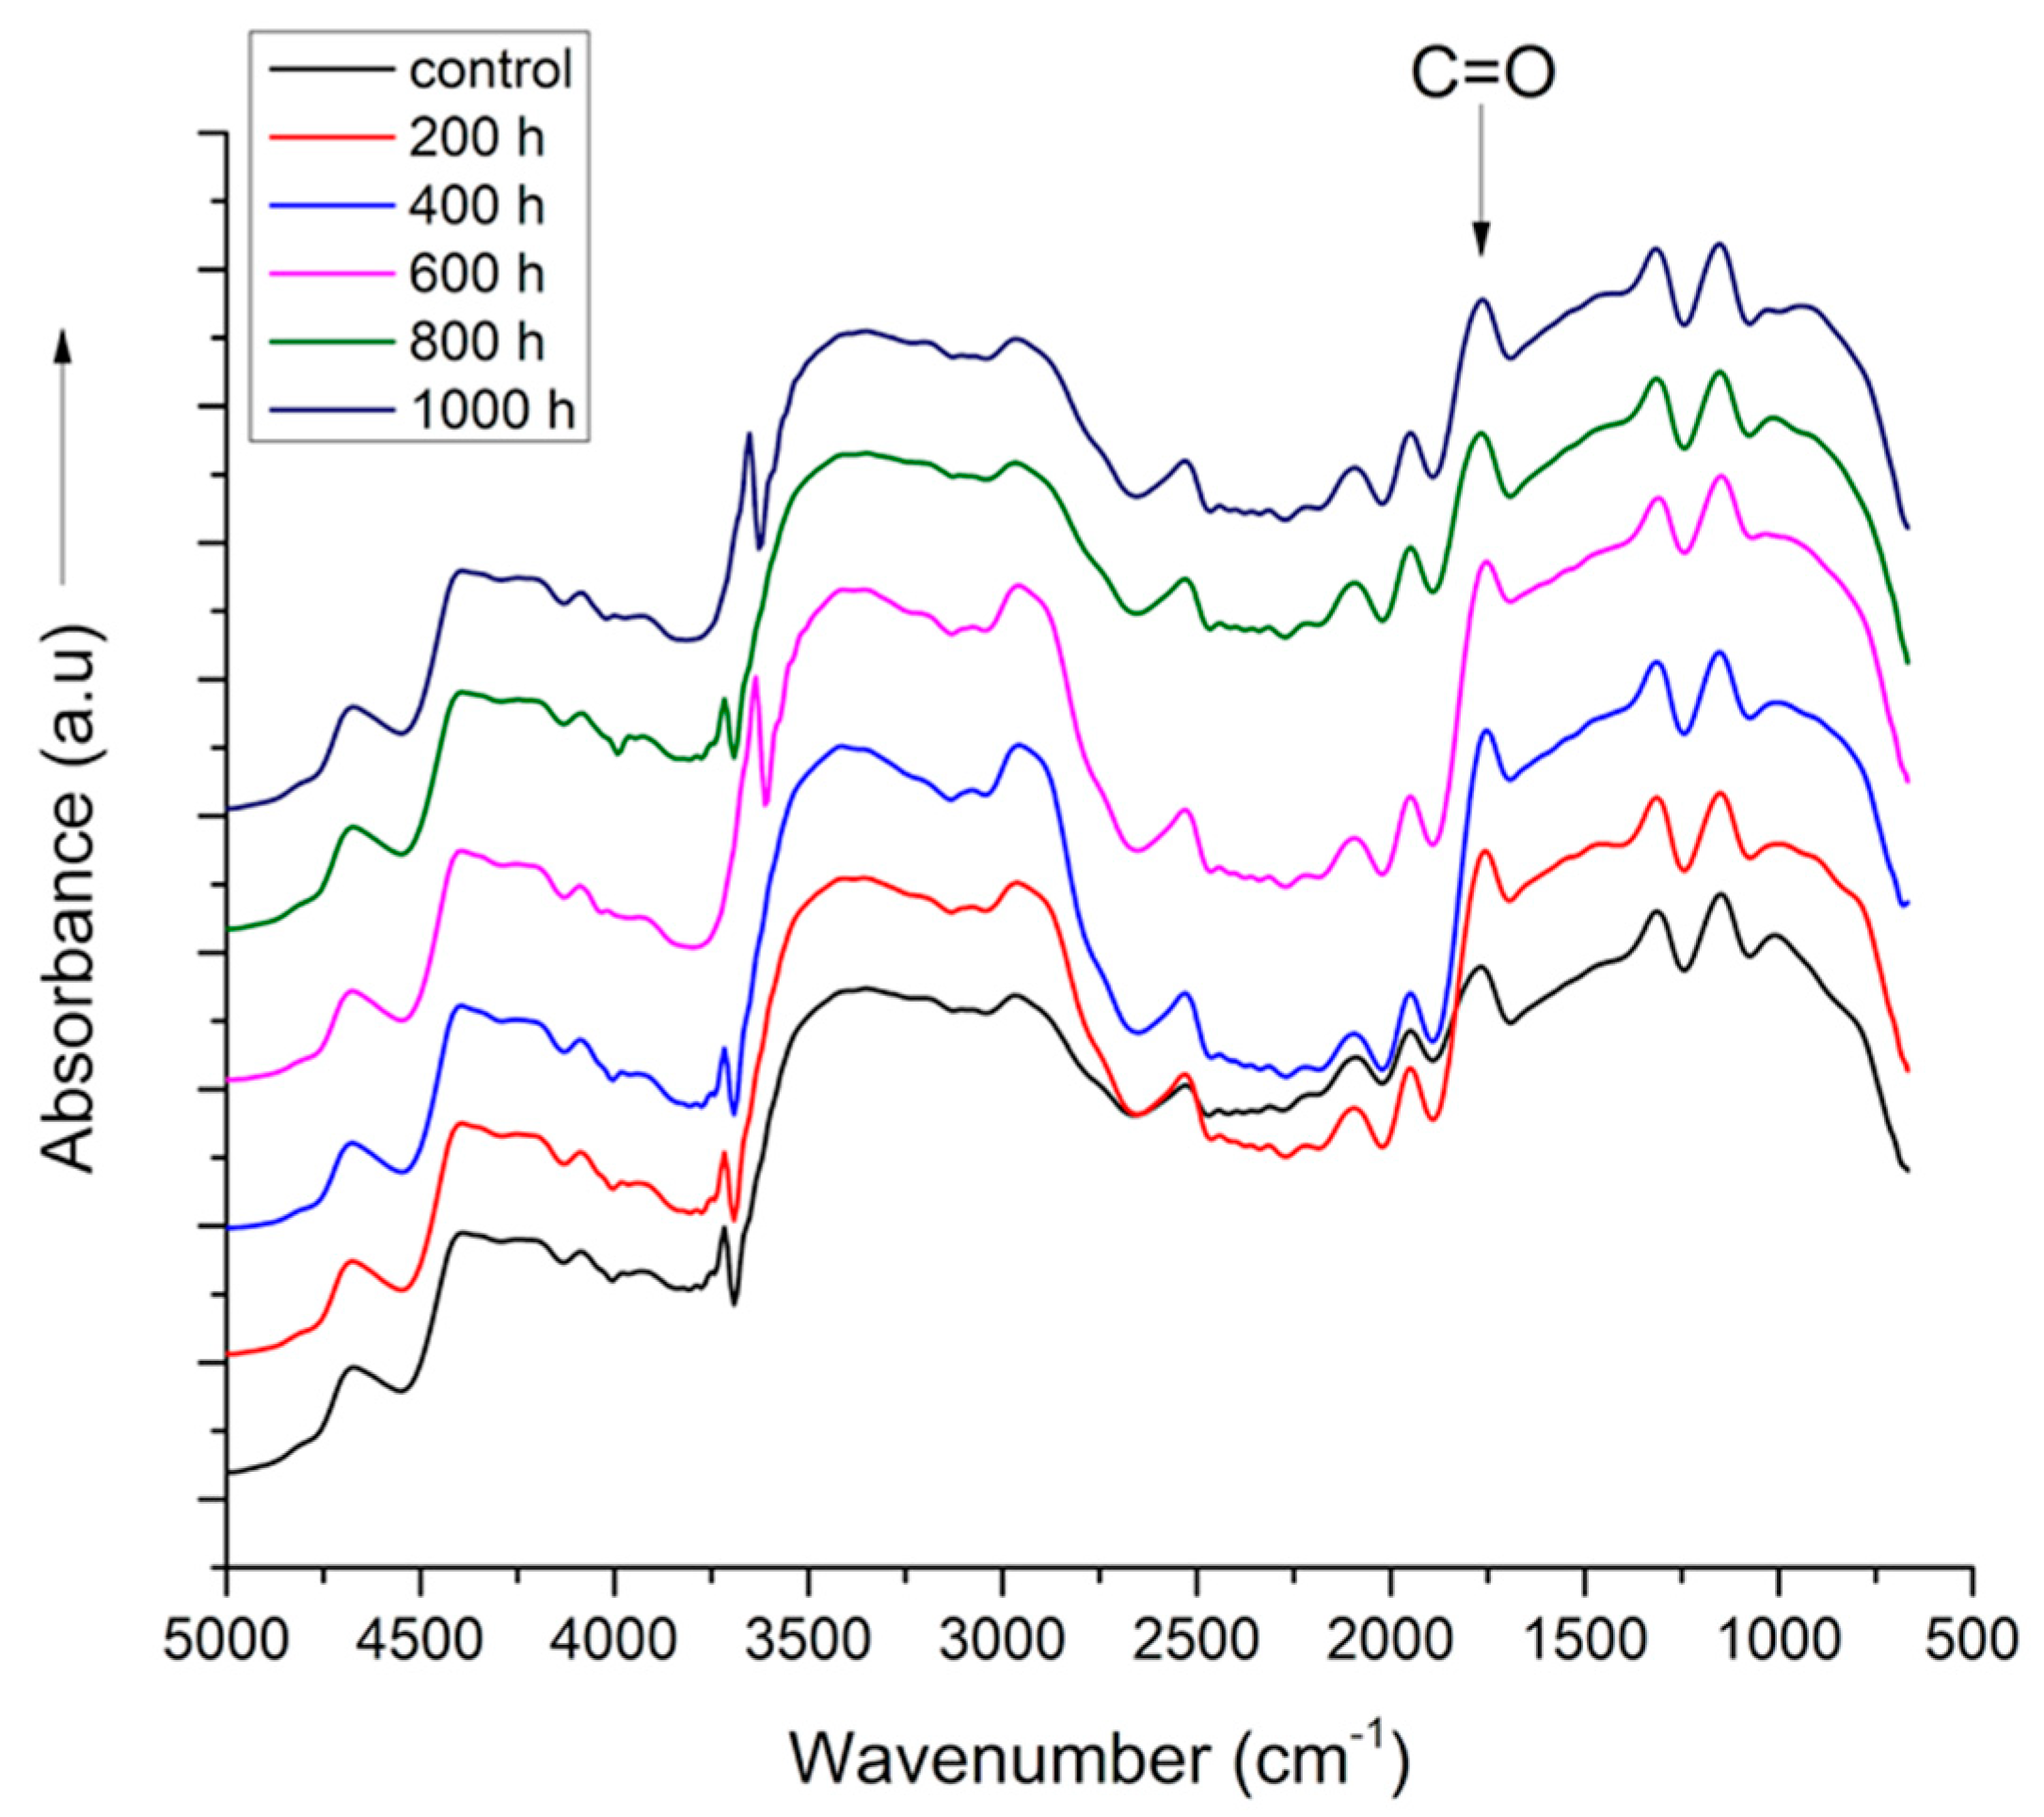
All sample spectra (Figure 3) show the characteristic peaks of a cross-linked polyester with a melamine coating as they present broad peaks at 3431 cm−1, which is assigned to the OH–NH group, and at 2965 cm−1, which corresponds to methyl and methylene groups [5]. Peaks were also recorded at 1760 cm−1, which relates to the stretching vibration of carbonyl groups (C=O) from esters in an electronegative ambient group [39], and at 1300 cm−1 and 1150 cm−1 from C-O-C asymmetric stretching vibration for aliphatic esters, confirming the polyester structure of the coating [40].
As mentioned above, the lack of changes in the chemical structure of the samples after 200, 400, 600, 800, and 1000 h of testing in NSS was expected, as this test does not involve UV radiation, which is the main cause of polyester/melamine coating degradation through a photo-oxidation mechanism. This mechanism causes an increase in the 3431 cm−1 region, which can also be caused by hydrolysis of the coatings, and a broadening of the 1760 cm−1 peak due to the photo-oxidation reactions leading to the formation of various photo-oxidized species such as aldehydes, ketones, or carboxylic acids, which also have carbonyl groups but absorb at different wavenumbers causing the band to widen [5,41]. FTIR spectra show no increase in the bands that correspond to the carbonyl group.

3.3. Electrochemical Tests (EIS and EN)

EIS diagrams are reported after 400 h of NSS tests because, at shorter times of exposure, the coating totally isolates the metallic surface and the results obtained are scattered and hold no meaning. It is important to consider the particular high performance of coil coatings due to the quality of cleaning and treating processes. The maximum impedance in the spectra is over 1070 hm/cm2, indicating a high protective property of the coating.
Bode and Nyquist diagrams obtained at different exposure times in NSS are presented in Figure 4. When we observe the Bode diagrams, a very flattened peak is present, which indicates the presence of two elements of time constants. This is to be expected as the same has been reported in multiple studies of metallic surfaces with organic coatings [42,43].
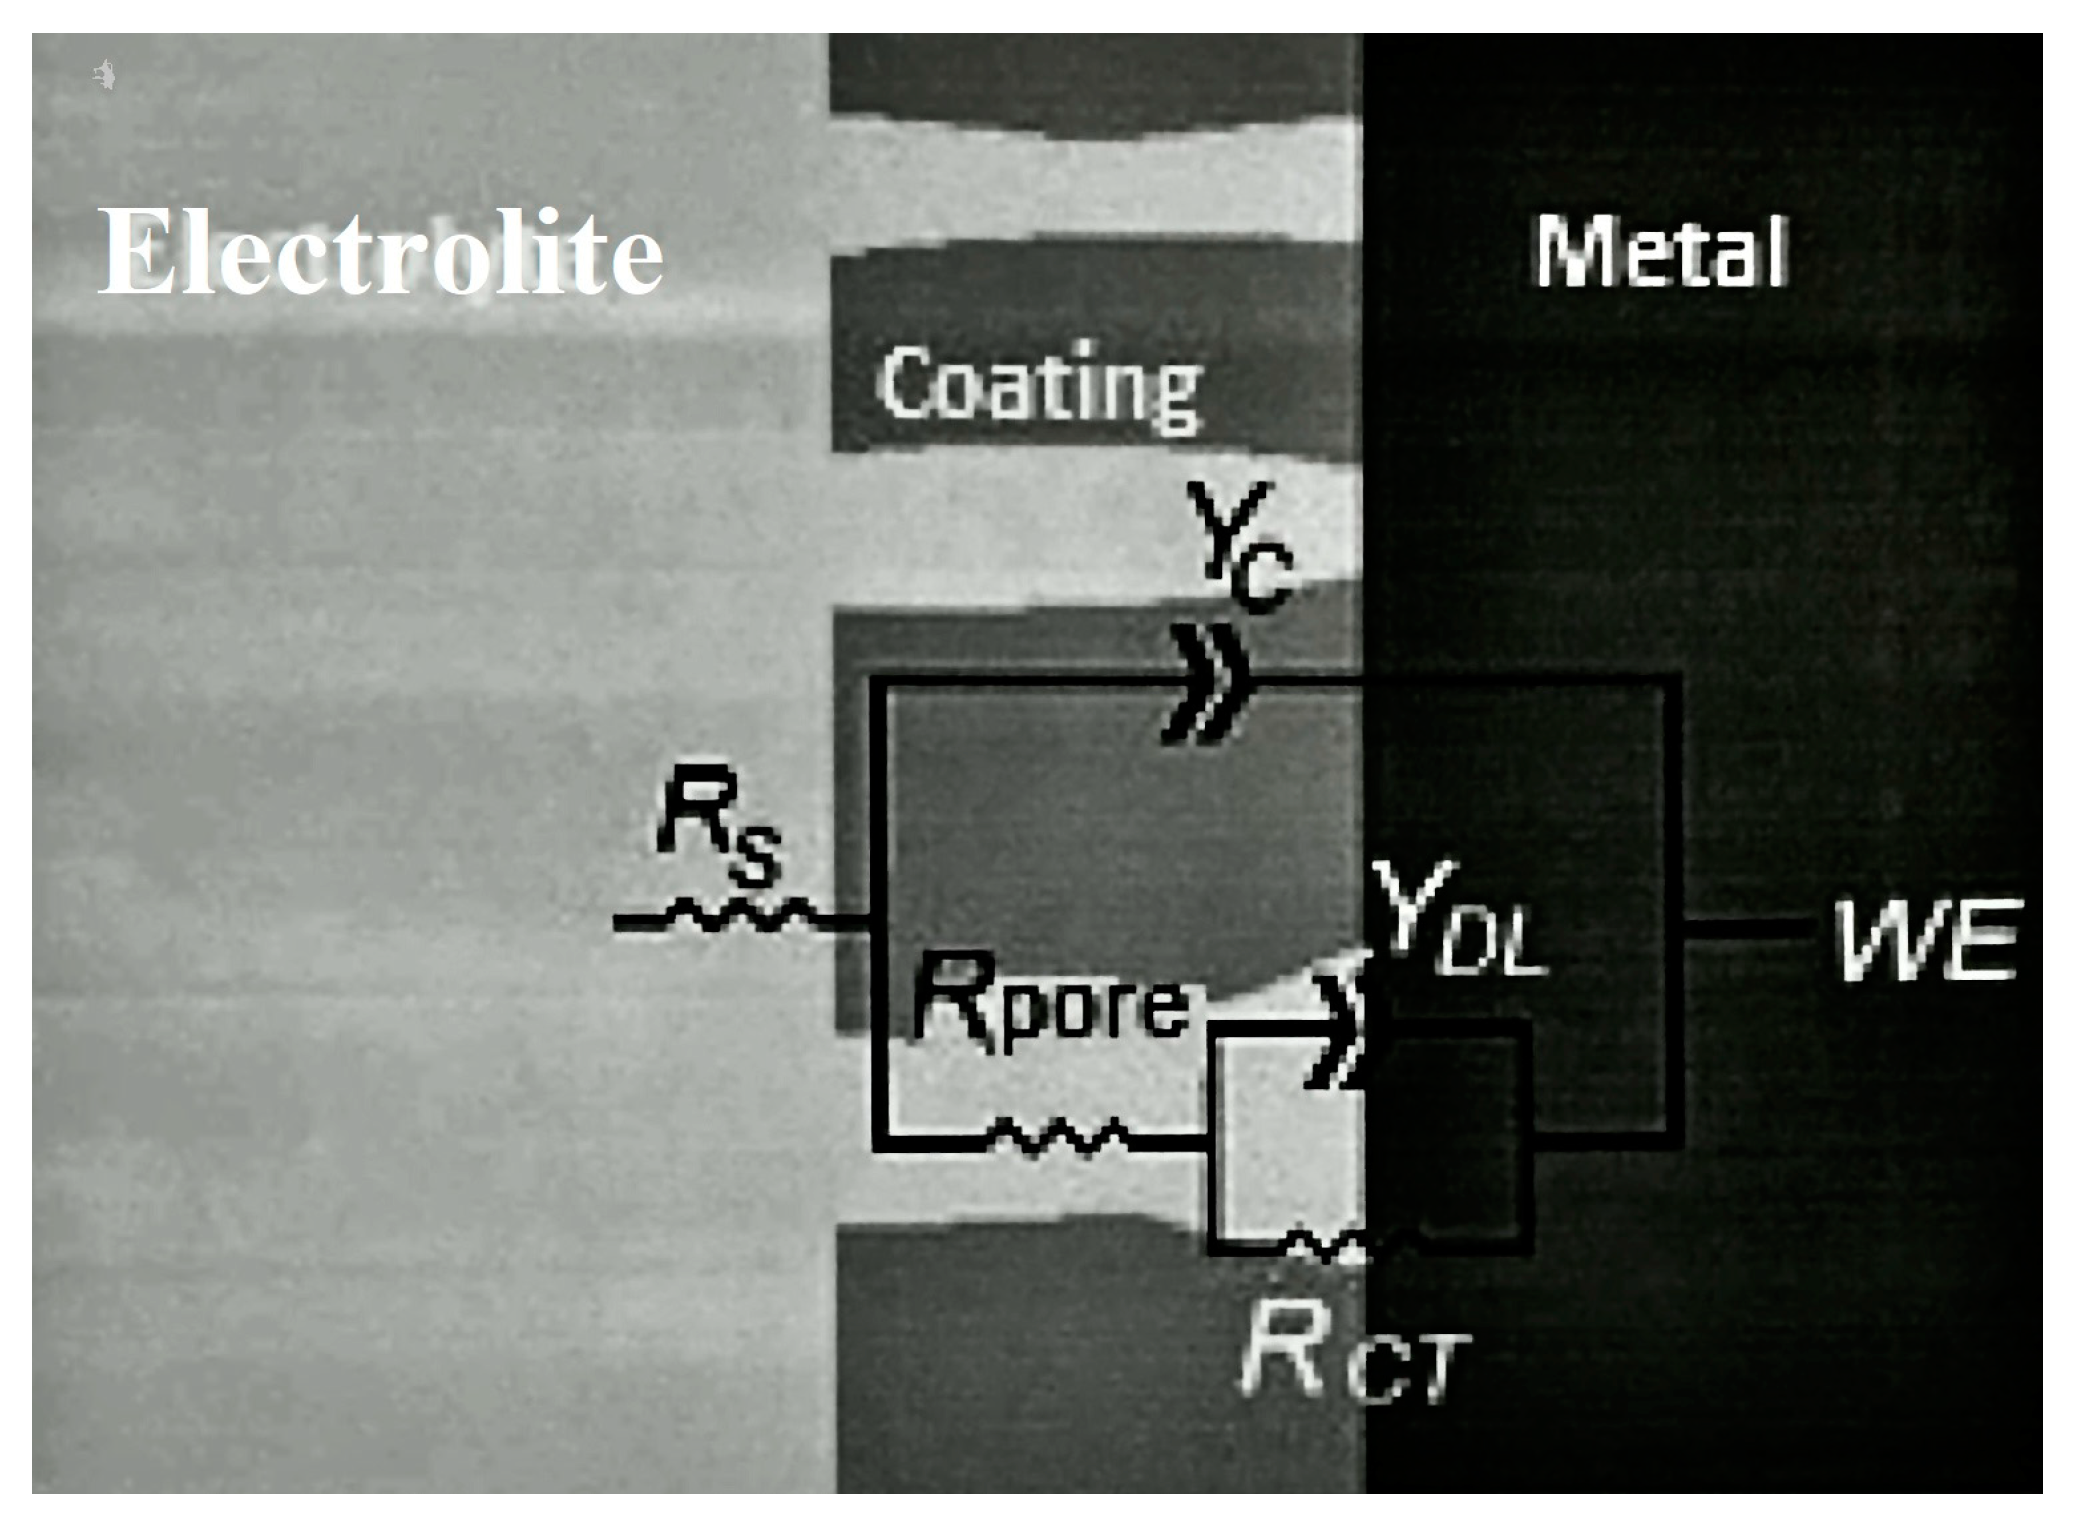
The impedance data were fitted to the equivalent electrical circuit in Figure 5, presenting two elements of constant phase: one representing the coating and the other, the metal surface. Based on this model, an explanation can be proposed for the deterioration of the coating and the metallic surface based on the variation of the different elements exposed to NSS over time. Our system did not allow us to reach lower frequencies since there was dispersion in the data.
Changes in double-layer capacitance (YDL) can also be observed (Table 1). Data increases between 400 and 600 h. But, when 800 h of exposure is reached, a totally different value is determined, which indicates that there is a change in the mechanism. This can be affirmed since the NDL coefficient is 0.47, indicating that the constant phase element (CPE) corresponds to the metal in contact with the electrolyte diffusion process. It should represent the Warburg impedance. The pore system is very sealed, showing high resistance. However, after 1000 h of exposure, the YDL magnitude is 8.8 × 10⁻⁷ and NDL is 0.96, corresponding to an irregular surface capacitor. It may suggest delamination of the coating to some extent. Results obtained by EN supported this proposal.
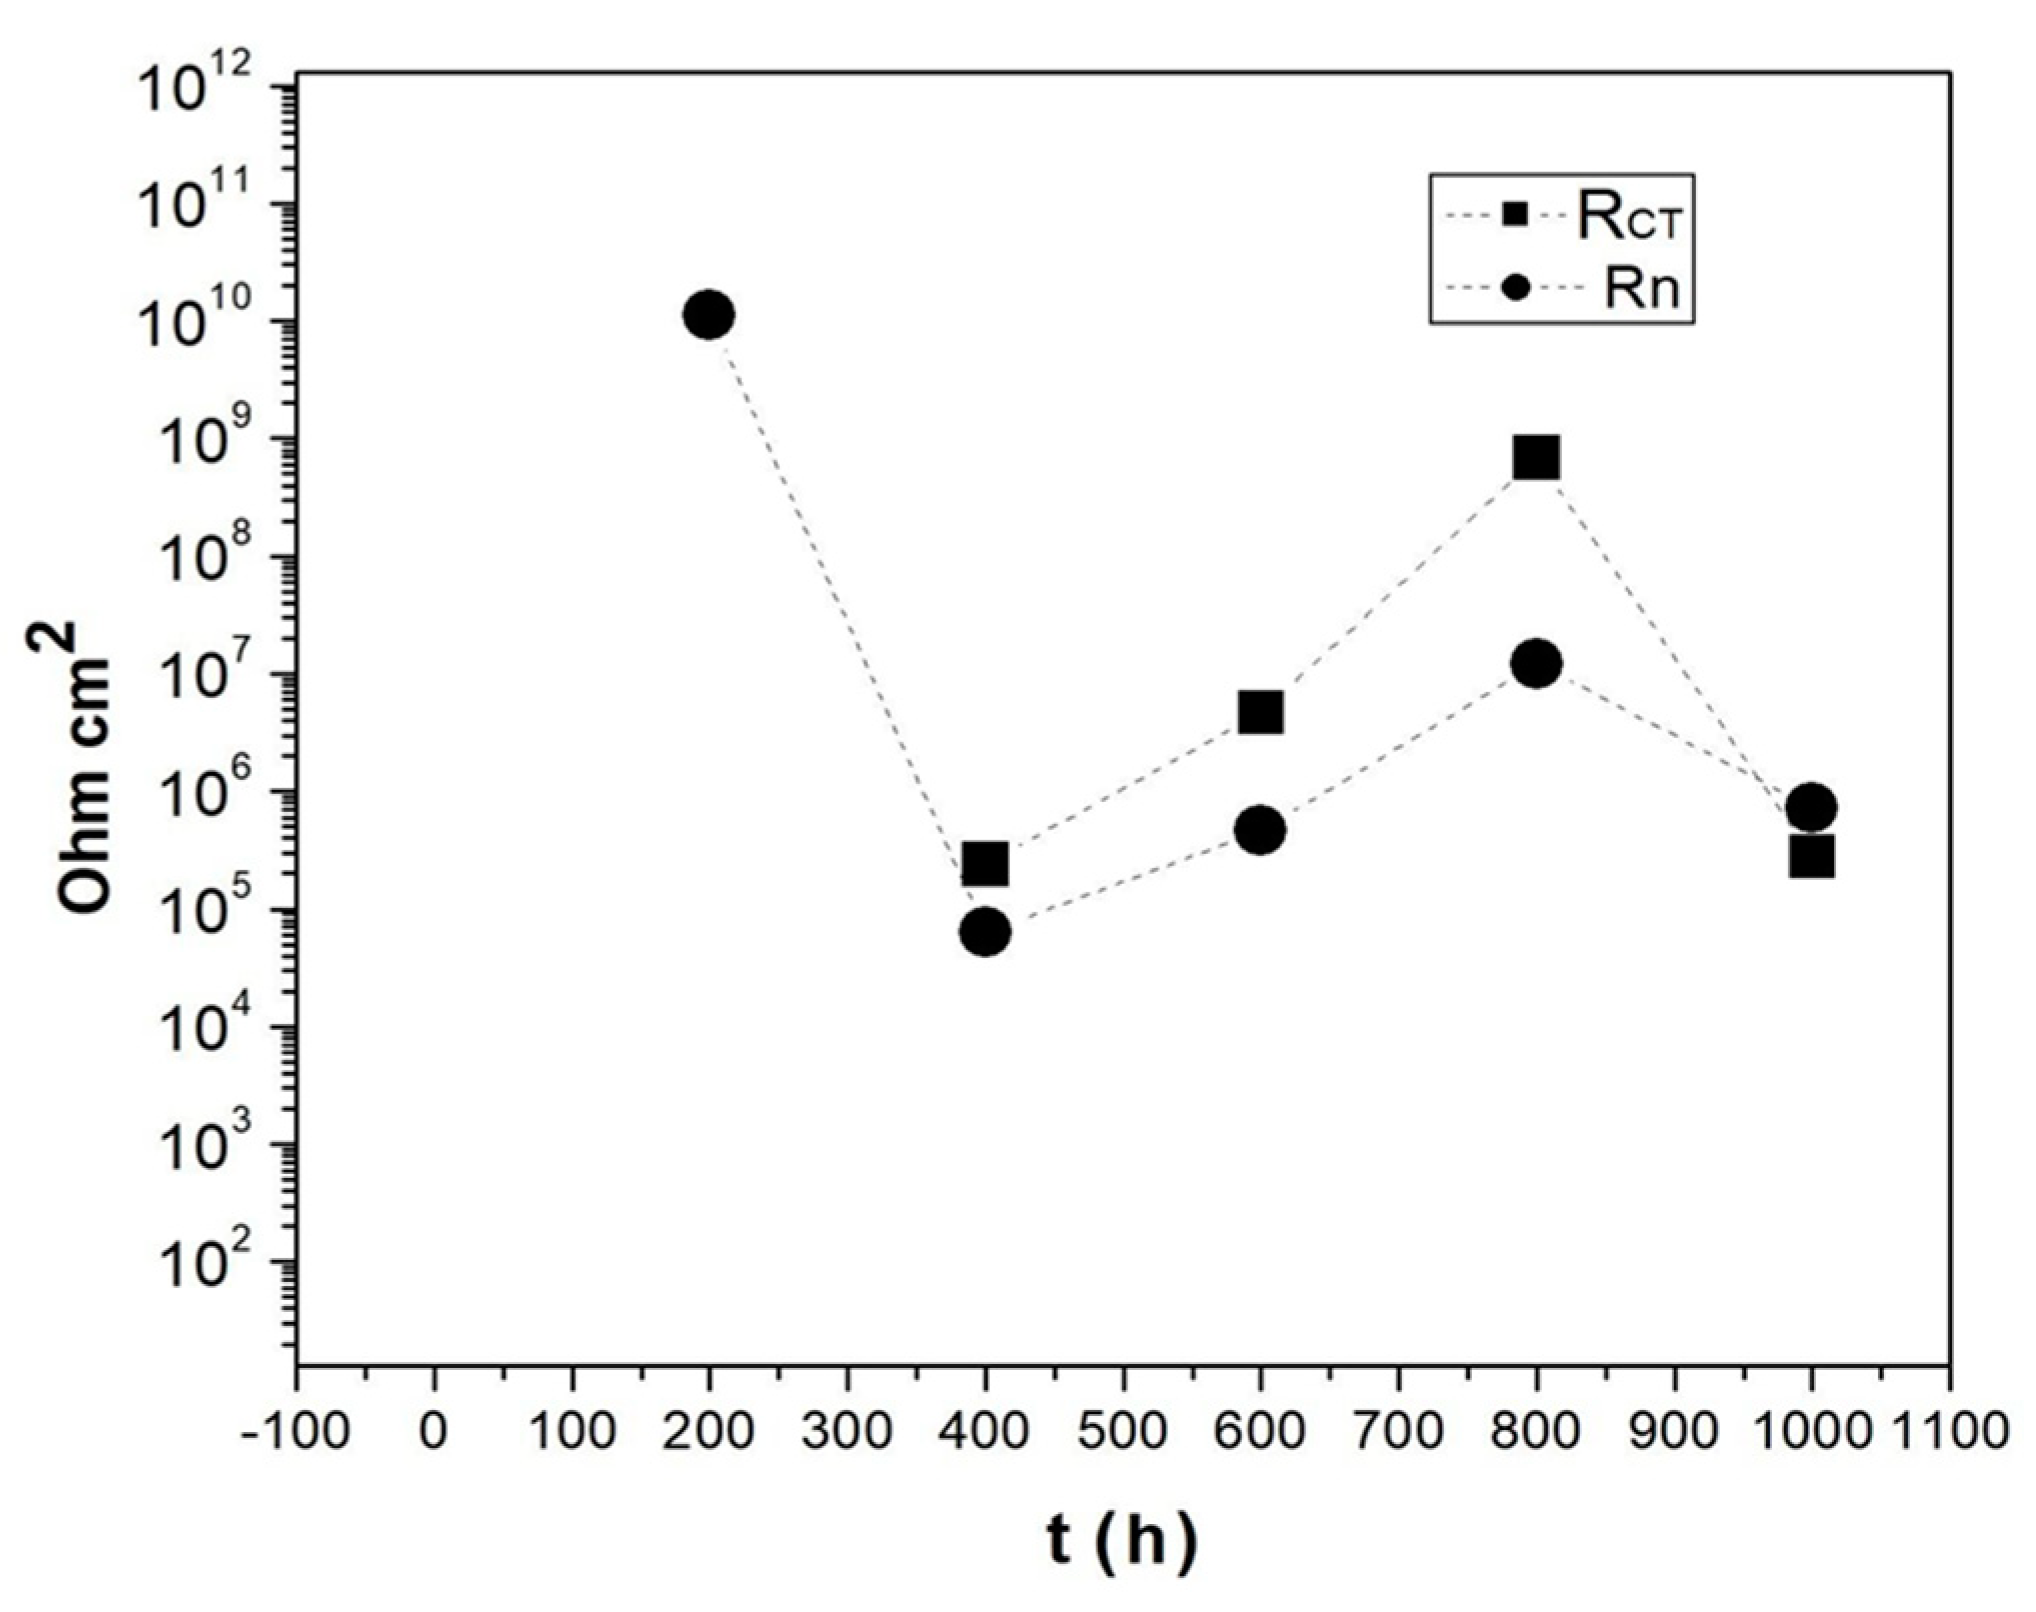
Changes in RCT vs. the time of exposure, as calculated by EIS, presented fluctuations due to the easy arrival of the aggressive agents contained in the electrolyte to the surface that can change the corrosion rate. It is relevant that both Rt and Rn (Figure 6) show the same behavior, as this confirms the EN technique offers the same information regarding the intensity of corrosion on the metal substrate, at least in this system.
After 200 h of exposure, the noise signal contained information about the intensity of corrosion. At this exposure time, using the impedance technique, an incorrect record was obtained. However, the noise technique did not detect corrosive processes in the control specimen (0 h of exposure), supporting this statement with the non-linear analysis of RP.
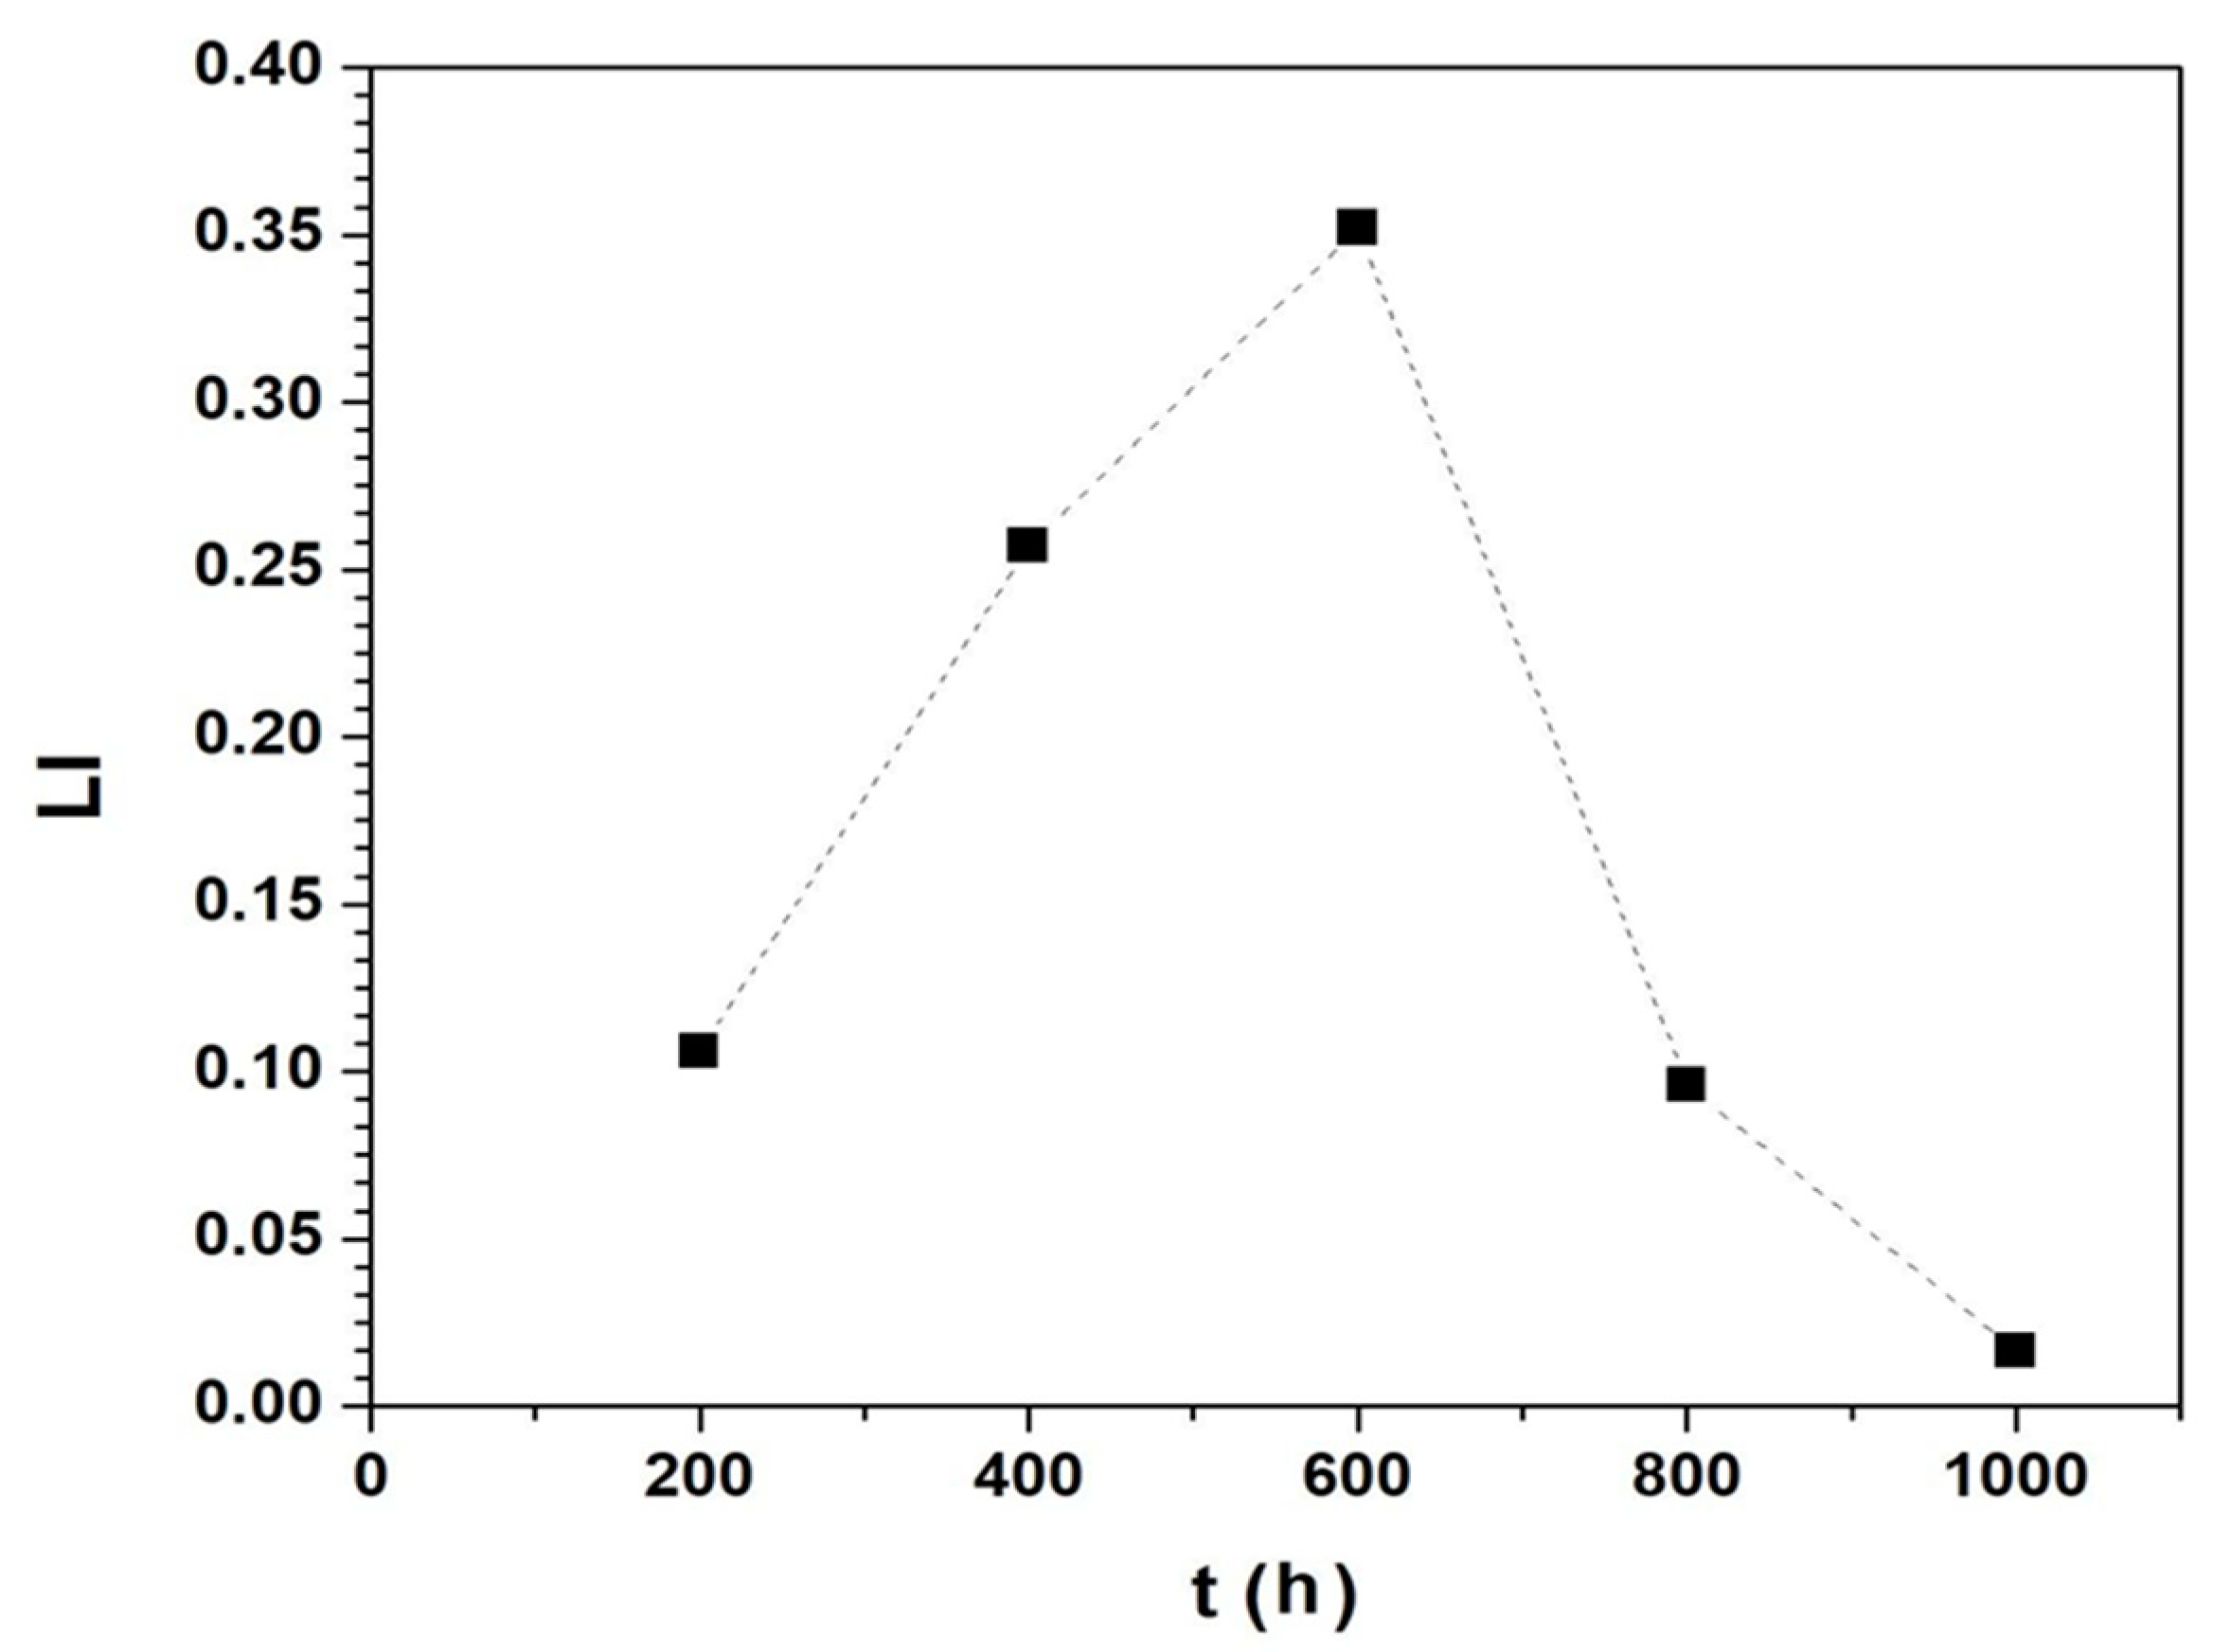
Figure 7 shows changes in LI at different exposure times. From 200 to 600 h, LI increases continuously until it reaches a maximum value of 600 h. Subsequently, it remarkably collapses at 800 h and continuously decreasing until LI = 0.01, which corresponds to the generalized corrosion at 1000 h of exposure. This could be due to partial delamination of the coating, as previously proposed.
It is observed (Table 1) that Yc does not show a significant change after exposure to NSS, which is around 3 × 10⁻⁶. Capacitance does not present significant changes, which could be interpreted as the coating not showing significant deterioration. The exponent (Nc) is over 0.8, which means that it would correspond to a capacitor with an irregular surface. It is important to mention that although the value is higher than 0.8, it changes over time from 0.882 to 0.812, indicating that the surface increases its irregularity due to exposure to salinity and humidity. In the samples evaluated no delamination is observed, it is only detected by changes in the electrochemical behavior. What is relevant about the methodology exposed in the article is its sensitivity, since a uniform corrosion phenomenon is observed at a given moment after 1000 h, which could only occur when the coating is completely separated from the metal surface.
There is a very interesting change in the magnitude of the pore resistance over time. It starts with a very small value of 200 Ω cm2 and significantly increases to values of 4 × 10⁴ Ω cm2. This important change could be attributed to the sealing of the pores, potentially due to saline precipitation or corrosion products. The maximum value is observed at 800 h of exposure (1.5 × 10⁷Ω cm2). This value corresponds, as we will see later, to a diffusion process.
Chaotic systems (Table 2) are typically characterized as modellable by a dynamic system that has an attractor. In dynamic systems, an attractor is a set of numerical values towards which a system tends to evolve, given a great variety of initial conditions in the system. Geometrically, an attractor can be a point, a curve, or even a complicated set of fractal structures.
Figure 8 shows the current time series and the attractors associated with them. The evolution of the dynamics of the corrosion process is clearly appreciated, both in the time series and in the attractors. Initially, at 200 h, a current time series of very notable but scarce current fluctuations are observed, responding to the low fraction of surface exposed through the pores over time. At 400 and 600 h, these fluctuations notably increase, defining in both cases very similar attractors, which indicate the same dynamics.
Although at first glance, these fluctuations appear to be random, they are in fact a reflection of the interaction of the different pores, and they present a process of self-organization that would be appreciated by Hutson [44] in his studies of discrete electrodes. Although Hutson was able to determine specific frequencies in his work by means of RP, the much more complex interaction that exists between the pores present in the coating will be shown in this case.
At 800 h, a change in dynamics is clearly observed, where the fluctuations of great amplitude disappear as if the pores suddenly disappeared. This is accentuated at 1000 h, which suggests the partial detachment of the coating.
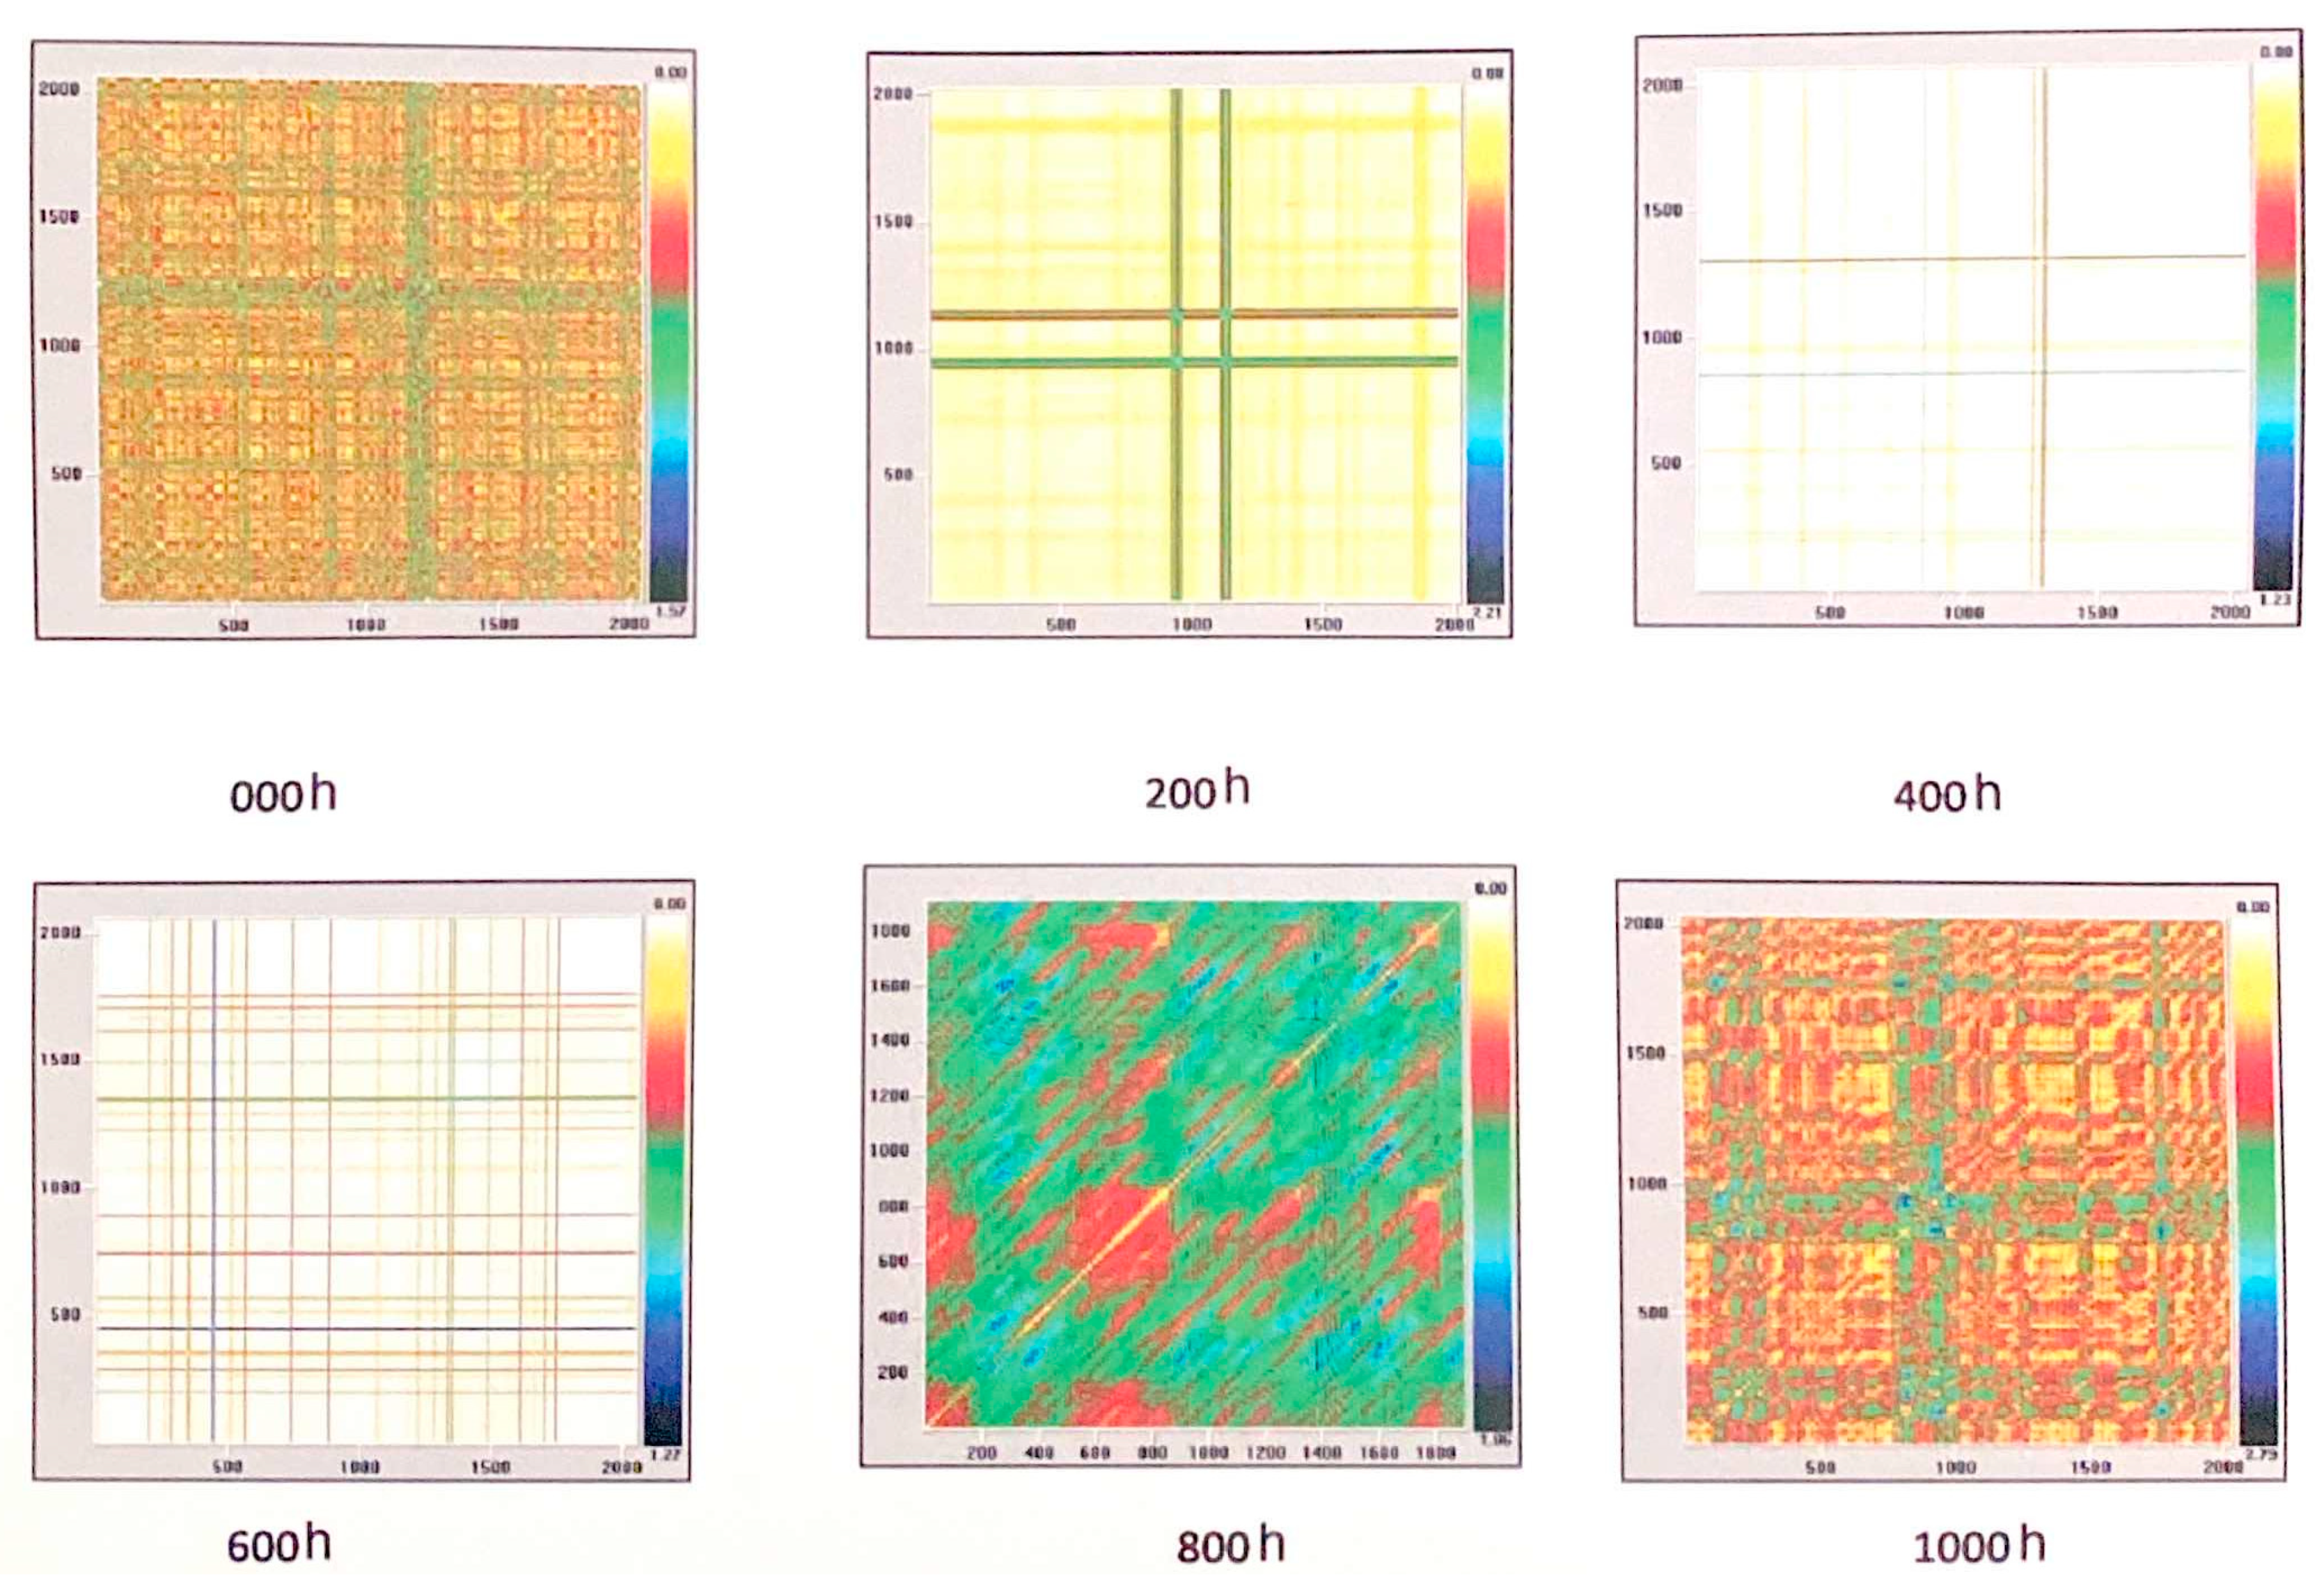
Figure 9 shows the RP obtained at the different exposure periods. As can be observed, it is a better representation of the dynamics of the process with respect to lag graphics. A very notable change in the mechanism at 800 h of exposure was determined with a series of parameters from the RP that help more accurately assess the dynamics of the occurring corrosion process.
At zero hours of exposure, both the % R and % D are extremely small, along with the LM. It is indicative of a totally random signal and this is confirmed by the entropy of information (value = 0). This means that there is perfect isolation of the metallic surface from the environment. That is the reason why EN and EIS information of control samples were not considered.
At 200 h of exposure, a very noticeable change is observed (Figure 9). A series of abrupt oscillations in the current appear, suggesting a random phenomenon; however, this is not the case. It is seen in the % R of 86 and % D of 95, that the values that increase at 400 h of exposure, decrease slightly at 600 h. The entropy of the information is around 6 bits on average, indicating the degree of complexity of the system. Upon reaching 800 h of exposure, a very important change in the corrosion mechanism occurs, and based on the impedance information, we propose a diffusive process due to the obstruction of the pores by the products that could be deposited inside them. Here, both% R and % D are at very low levels, and only the entropy of the information has a value of 2.9 bits. Finally, after 1000 h of exposure, the values fall dramatically to zero, telling us that the signal is totally random, which means that any point is equally likely to corrode, and therefore, for this reason, the homogeneous corrosion makes us think that a detachment of the coating has occurred (Section 3.1).

4. Discussion

Changes in the average thickness and gloss of the coatings were not very significant during the NSS test. No significant changes in FTIR spectra were determined; however, using electrochemical techniques, changes over time in the NSS test were determined. The main degradation process is due to the hydrolysis of the coating. A decrease in the corrosion rate was observed due to the sealing of the coating, probably caused by deposition of corrosion products, salts, or a mixture of both.
EN was a more sensible technique than EIS. First, changes in coatings were detected after 400 h of exposure by EIS and after 200 h by EN. Both techniques showed equivalent results in studying the corrosion evolution of the coated aluminum. Changes in visual appearance of samples after testing are negligible.
Non-linear analysis using RP showed the chaotic dynamics that occur with time and the interaction of micro electrochemical cells that formed on the metallic surface. It is valuable and complementary information. It also offers information that coincides with the traditional EIS technique and adds complementary data to understand the corrosion phenomenon.

Author Contributions

E.M.G.-O.—conceptualization, methodology, investigation, writing—original draft preparation, and writing—review and editing. X.I.S.-C.—methodology, formal analysis, data curation, and project administration. P.J.M.-R.—formal analysis, and data curation. W.A.T.-P.—methodology and data curation. F.C.—conceptualization, validation, and supervision. All authors have read and agreed to the published version of the manuscript.

Funding

This research received no external funding.

Institutional Review Board Statement

Not applicable.

Informed Consent Statement

Not applicable.

Data Availability Statement

Data can be obtained by a request to the corresponding author.

Conflicts of Interest

The authors declare no conflict of interest.

References

  1. Lopes, T.D.S.; Martins, D.; Carneiro, C.; Machado, J.; Mendes, A. Accelerated aging of anticorrosive coatings: Two-stage approach to the AC/DC/AC electrochemical method. Prog. Org. Coat. 2020, 138, 105365. [Google Scholar] [CrossRef]
  2. ISO 9227:2014; Corrosion Tests in Artificial Atmospheres—Salt Spray Tests. ISO: Geneva, Switzerland, 2014.
  3. ISO 4628; Paints and Varnishes—Evaluation of Degradation of Coatings—Part 1 to 10. ISO: Geneva, Switzerland, 2016.
  4. Ramdé, T.; Ecco, L.G.; Rossi, S. Visual appearance durability as function of natural and accelerated ageing of electrophoretic styrene-acrylic coatings: Influence of yellow pigment concentration. Prog. Org. Coat. 2017, 103, 23–32. [Google Scholar] [CrossRef]
  5. Batista, M.A.; Moraes, R.P.; Barbosa, J.C.; Oliveira, P.C.; Santos, A.M. Effect of the polyester chemical structure on the stability of polyester–melamine coatings when exposed to accelerated weathering. Prog. Org. Coat. 2011, 71, 265–273. [Google Scholar] [CrossRef]
  6. Chen, F.; Breedon, M.; Sapper, E.; Ganther, W.; Lau, D.; Cole, I. A microclimate model to simulate neutral salt spray testing for corrosion inhibitor evaluation and functional coating development. Prog. Org. Coat. 2017, 111, 327–335. [Google Scholar] [CrossRef]
  7. Lalic, M.M.; Martinez, S. A Novel Application of EIS for Quantitative Coating Quality Assessment During Neutral Salt Spray Testing of High-Durability Coatings. Acta Chim. Slov. 2019, 66, 513–522. [Google Scholar] [CrossRef]
  8. Wan, S.; Chen, H.; Cai, G.; Liao, B.; Guo, X. Functionalization of h-BN by the exfoliation and modification of carbon dots for enhancing corrosion resistance of waterborne epoxy coating. Prog. Org. Coat. 2022, 165, 106757. [Google Scholar] [CrossRef]
  9. Zeng, Q.; Min, X.; Luo, Z.; Dai, H.; Liao, B. In-situ preparation of superhydrophobic Zn-Al layered double hydroxide coatings for corrosion protection of aluminum alloy. Mater. Lett. 2022, 328, 133077. [Google Scholar] [CrossRef]
  10. Arellano-Pérez, J.; Escobar-Jiménez, R.; Granados-Lieberman, D.; Gómez-Aguilar, J.; Uruchurtu-Chavarín, J.; Alvarado-Martínez, V. Electrochemical noise signals evaluation to classify the type of corrosion using Synchrosqueezing transform. J. Electroanal. Chem. 2019, 848, 113249. [Google Scholar] [CrossRef]
  11. Haruna, T.; Morikawa, Y.; Fujimoto, S.; Shibata, T. Electrochemical noise analysis for estimation of corrosion rate of carbon steel in bicarbonate solution. Corros. Sci. 2003, 45, 2093–2104. [Google Scholar] [CrossRef]
  12. Al-Mazeedi, H.; Cottis, R. A practical evaluation of electrochemical noise parameters as indicators of corrosion type. Electrochim. Acta 2004, 49, 2787–2793. [Google Scholar] [CrossRef]
  13. Hou, Y.; Aldrich, C.; Lepkova, K.; Kinsella, B. Detection of under deposit corrosion in CO2 environment by electrochemical noise and recurrence quantification analysis. Electrochim. Acta 2018, 274, 160–169. [Google Scholar] [CrossRef]
  14. Xia, D.-H.; Song, S.-Z.; Behnamian, Y. Detection of corrosion degradation using electrochemical noise (EN): Review of signal processing methods for identifying corrosion forms. Corros. Eng. Sci. Technol. 2016, 51, 527–544. [Google Scholar] [CrossRef]
  15. Smulko, J.; Darowicki, K.; Zieliński, A. Pitting corrosion in steel and electrochemical noise intensity. Electrochem. Commun. 2002, 4, 388–391. [Google Scholar] [CrossRef]
  16. Zaveri, N.; Sun, R.; Zufelt, N.; Zhou, A.; Chen, Y. Evaluation of microbially influenced corrosion with electrochemical noise analysis and signal processing. Electrochim. Acta 2007, 52, 5795–5807. [Google Scholar] [CrossRef]
  17. Turcio-Ortega, D.; Pandiyan, T.; Cruz, J.; Garcia-Ochoa, E. Interaction of Imidazoline Compounds with Fen. (n = 1−4 Atoms) as a Model for Corrosion Inhibition: DFT and Electrochemical Studies. J. Phys. Chem. C 2007, 111, 9853–9866. [Google Scholar] [CrossRef]
  18. Cottis, R.; Turgoose, S. Electrochemical Impedance and Noise; NACE: Houston, TX, USA, 1999. [Google Scholar]
  19. Torres-Mendoza, V.; Rodríguez-Gómez, F.; García-Ochoa, E.; Genesca, J. The assessment of natural atmosphere corrosivity by the use of electrochemical noise analysis. Anti-Corros. Methods Mater. 2006, 53, 348–356. [Google Scholar] [CrossRef]
  20. Lee, C.; Mansfeld, F. Analysis of electrochemical noise data for a passive system in the frequency domain. Corros. Sci. 1987, 40, 959–962. [Google Scholar] [CrossRef]
  21. Sazou, D.; Pagitsas, M. Non-linear dynamics of the passivity breakdown of iron in acidic solutions. Chaos Solitons Fractals 2003, 17, 505–522. [Google Scholar] [CrossRef]
  22. Stringer, J.; Markworth, A. Applications of deterministic chaos theory to corrosion. Corros. Sci. 1993, 35, 751–760. [Google Scholar] [CrossRef]
  23. Chen, A.; Cao, F.; Liao, X.; Liu, W.; Zheng, L.; Zhang, J.; Cao, C. Study of pitting corrosion on mild steel during wet–dry cycles by electrochemical noise analysis based on chaos theory. Corros. Sci. 2013, 66, 183–195. [Google Scholar] [CrossRef]
  24. Aldrich, C.; Qi, B.; Botha, P. Analysis of electrochemical noise data with phase space methods. Miner. Eng. 2006, 19, 1402–1409. [Google Scholar] [CrossRef]
  25. Bahena, D.; Rosales, I.; Sarmiento, O.; Guardián, R.; Menchaca, C.; Uruchurtu, J. Electrochemical Noise Chaotic Analysis of NiCoAg Alloy in Hank Solution. Int. J. Corros. 2011, 2011, 491564. [Google Scholar] [CrossRef]
  26. Parkhutik, V.P. Oscillations of Open-Circuit Potential during Immersion Plating of Silicon in CuSO4/HF Solutions. Rus. J. Electrochem. 2006, 42, 512–522. [Google Scholar] [CrossRef]
  27. Eckmann, J.-P.; Kamphorst, S.O.; Ruelle, D. Recurrence Plots of Dynamical Systems. EPL Europhys. Lett. 1987, 4, 973–977. [Google Scholar] [CrossRef] [Green Version]
  28. Hou, Y.; Aldrich, C.; Lepkova, K.; Kinsella, B. Identifying corrosion of carbon steel buried in iron ore and coal cargoes based on recurrence quantification analysis of electrochemical noise. Electrochim. Acta 2018, 283, 212–220. [Google Scholar] [CrossRef]
  29. Zbilut, J.P.; Webber, C.L., Jr. Embeddings and delays as derived from quantification of recurrence plots. Phys. Lett. A 1992, 171, 199–203. [Google Scholar] [CrossRef]
  30. Zbilut, J.P.; Giuliani, A.; Webber, C.L. Recurrence quantification analysis and principal components in the detection of short complex signals. Phys. Lett. A 1998, 237, 131–135. [Google Scholar] [CrossRef] [Green Version]
  31. Cazares-Ibáñez, E.; Vázquez-Coutiño, G.; García-Ochoa, E. Application of recurrence plots as a new tool in the analysis of electrochemical oscillations of copper. J. Electroanal. Chem. 2005, 583, 17–33. [Google Scholar] [CrossRef]
  32. Zeidabadinejad, M.; Shahidi-Zandi, M.; Foroughi, M.M.; Asadollahzadeh, H. Advantages of asymmetrical over symmetrical cells for detection of under deposit CO2 corrosion using electrochemical noise. Mater. Corros. 2019, 70, 1999–2008. [Google Scholar] [CrossRef]
  33. Zhang, T.; Cong, Y.; Shao, Y.; Meng, G.; Wang, F. Electrochemical noise analysis on the crevice corrosion behavior of Ni–Cr–Mo–V high strength steel using recurrence plots. J. Appl. Electrochem. 2011, 41, 289–298. [Google Scholar] [CrossRef]
  34. Hou, Y.; Aldrich, C.; Lepkova, K.; Machuca, L.; Kinsella, B. Monitoring of carbon steel corrosion by use of electrochemical noise and recurrence quantification analysis. Corros. Sci. 2016, 112, 63–72. [Google Scholar] [CrossRef] [Green Version]
  35. Liu, W.; Wang, D.; Chen, X.; Wang, C.; Liu, H. Electrochemical noise monitoring of sulphur corrosion for nickel alloy 718. Corros. Eng. Sci. Technol. 2016, 51, 545–549. [Google Scholar] [CrossRef]
  36. Rossi, S.; Calovi, M.; Dalpiaz, D.; Fedel, M. The Influence of NIR Pigments on Coil Coatings’ Thermal Behaviors. Coatings 2020, 10, 514. [Google Scholar] [CrossRef]
  37. de Souza, M. Organic coil coating of metal. In High-Performance Organic Coatings; Khanna, K.S., Ed.; Woodhead Publishing on Materials: Boca Raton, FL, USA, 2008; Chapter 17. [Google Scholar]
  38. Murray, I. Forage Analysis by Near Infra-Red Reflectance Spectroscopy. In Sward Measurement Handbook, 2nd ed.; Davies, A., Baker, R.D., Grant, S.A., Laidlaw, A.S., Eds.; British Grassland Soc.: Gateshead, UK, 1993; pp. 285–312. [Google Scholar]
  39. Socrates, G. Infrared and Raman Characteristic Group Frequencies—Tables and Charts; Wiley: Hoboken, NJ, USA, 2001. [Google Scholar]
  40. Fockaert, L.; Pletincx, S.; Ganzinga-Jurg, D.; Boelen, B.; Hauffman, T.; Terryn, H.; Mol, J. Chemisorption of polyester coatings on zirconium-based conversion coated multi-metal substrates and their stability in aqueous environment. Appl. Surf. Sci. 2019, 508, 144771. [Google Scholar] [CrossRef]
  41. Stuart, B.H. Organic molecules. In Infrared Spectroscopy: Fundamentals and Applications; Ando, D.J., Ed.; John Wiley & Sons Ltd.: Chichester, UK, 2004; Volume 1, pp. 71–80, 83. [Google Scholar]
  42. Mahdavian, M.; Attar, M. Another approach in analysis of paint coatings with EIS measurement: Phase angle at high frequencies. Corros. Sci. 2006, 48, 4152–4157. [Google Scholar] [CrossRef]
  43. Hernández, M.; Genescá, J.; Uruchurtu, J.; Barba, A. Correlation between electrochemical impedance and noise measurements of waterborne coatings. Corros. Sci. 2009, 51, 499–510. [Google Scholar] [CrossRef]
  44. Fei, Z.; Hudson, J.L. Chaotic Oscillations on Arrays of Iron Electrodes. Ind. Eng. Chem. Res. 1998, 37, 2172–2179. [Google Scholar] [CrossRef]
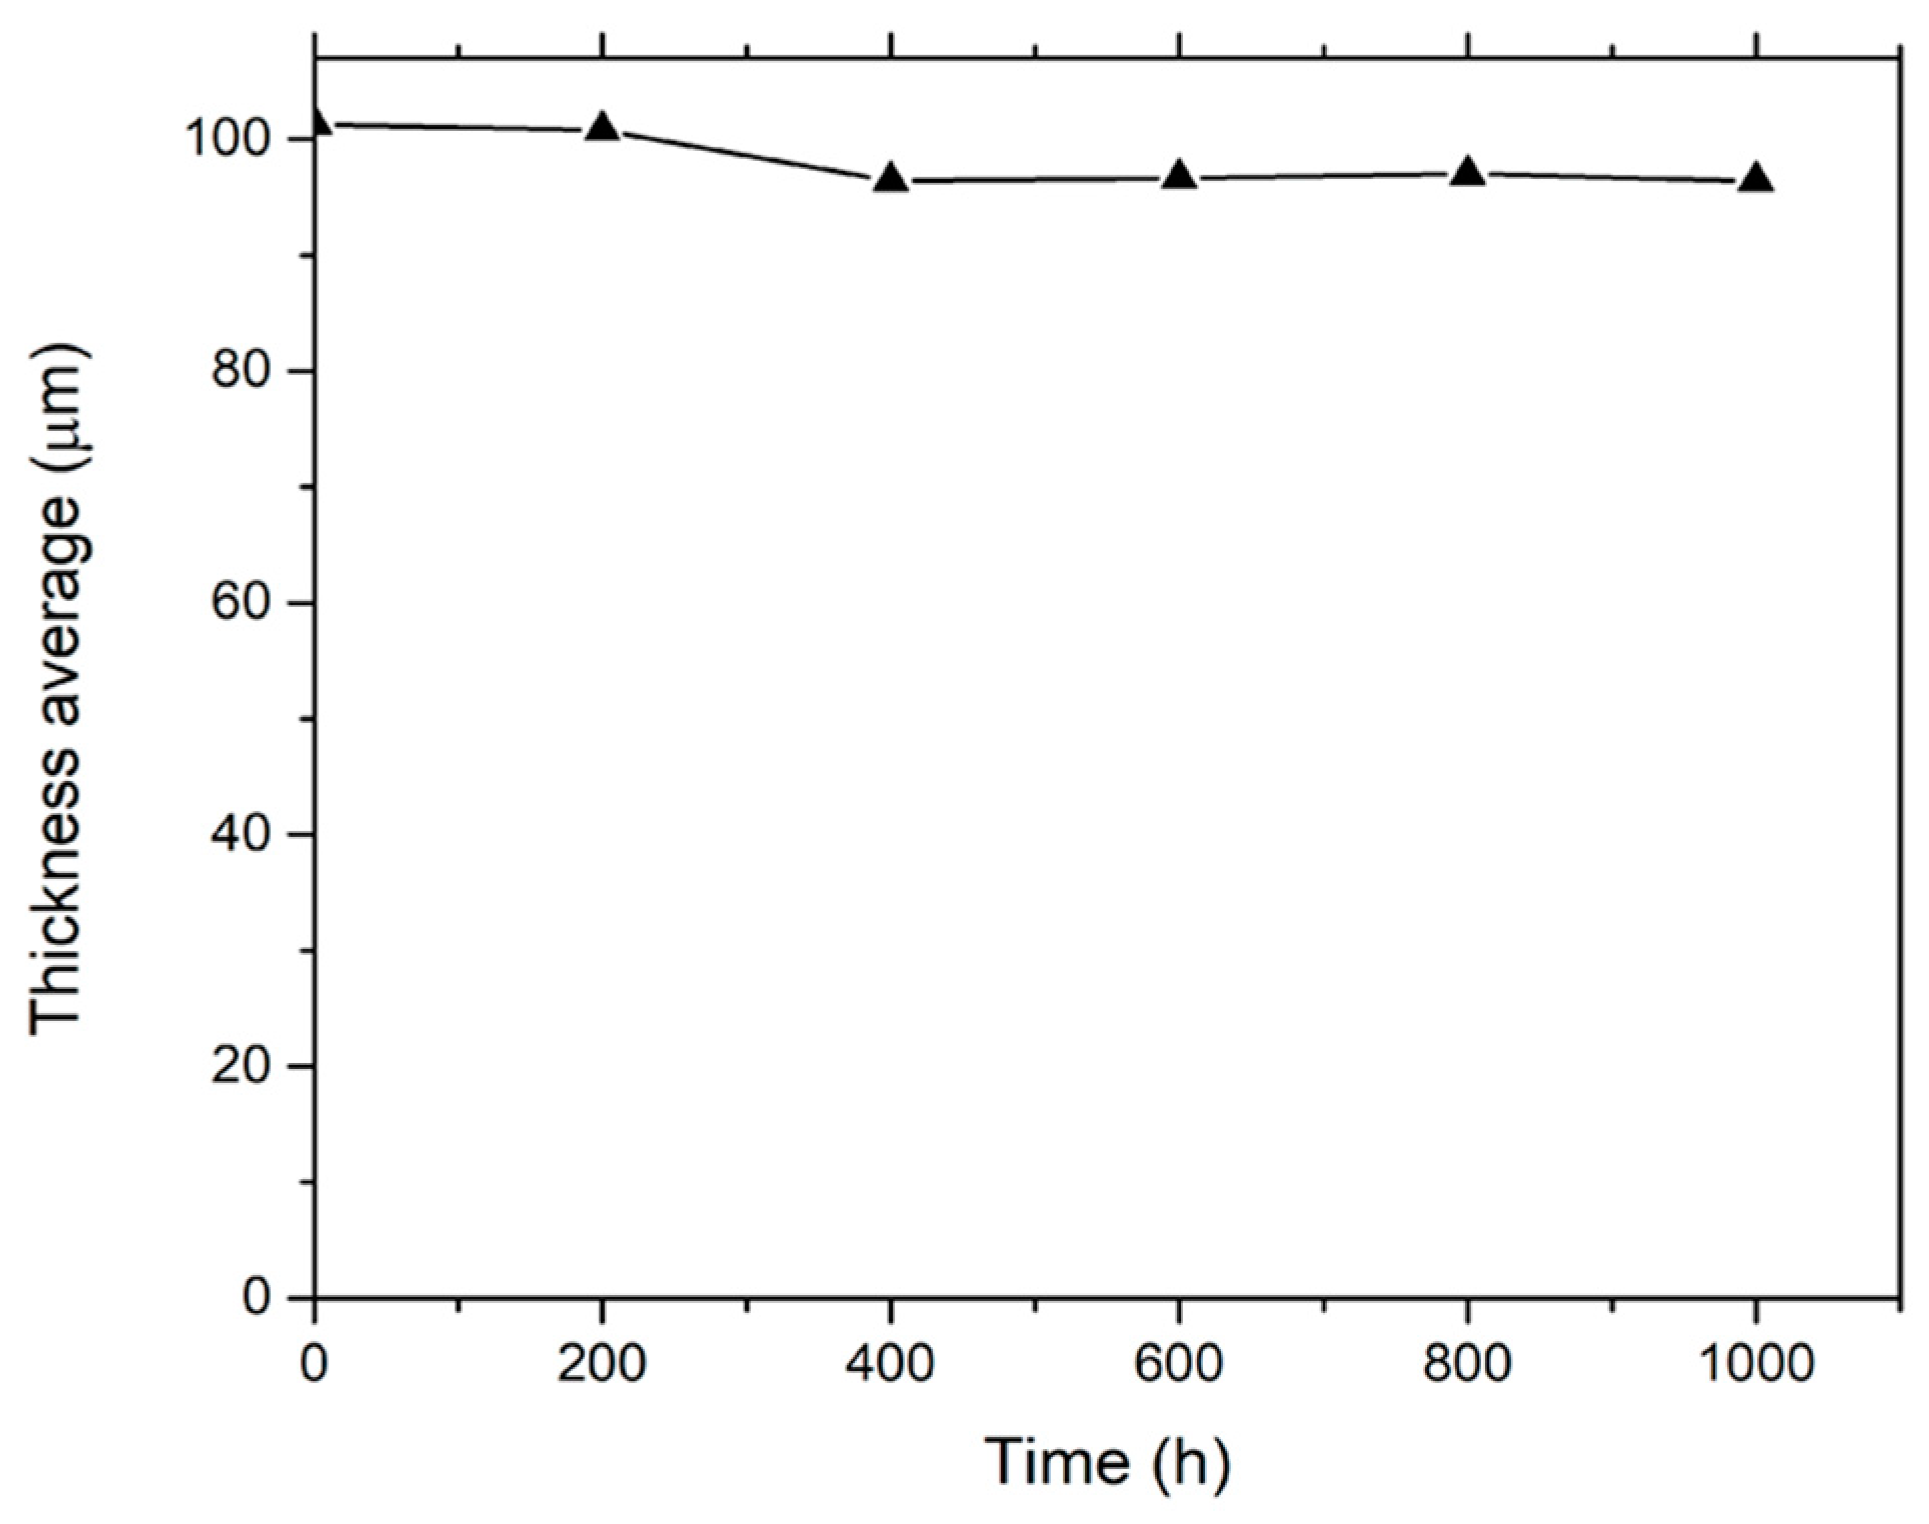
Figure 1. Changes in average thickness (μm) of coil coating specimens vs. time of exposure in NSS chamber.
Coatings 13 01327 g001
Figure 2. Changes in average gloss (%) vs. time in NSS chamber.
Coatings 13 01327 g002
Figure 3. FTIR spectra of polyester coating specimensexposed during 0 (control), 200, 400, 600, 800 and 1000 h in NSS chamber. The arrow signalized the band corresponding to Carbonyl group. No increase in absorbance is observed with respect to the control sample.
Coatings 13 01327 g003
Figure 4. Nyquist and Bode diagram for coated specimens after 400, 600, 800 and 1000 h of exposure in NSS.
Coatings 13 01327 g004
Figure 5. Electric equivalent circuit for a coated metallic surface; Rs = electrical resistance of the solution, Rpore = electrical resistance of the porous system, RCT = charge transfer resistance, Yc = CPE representing porous system, and YDL = CPE representing metallic surface structure.
Coatings 13 01327 g005
Figure 6. Charge transfer resistance calculated by EIS (RCT) and EN (Rn) vs. time (h).
Coatings 13 01327 g006
Figure 7. Localization index (LI) determined using EN technique at different exposure times.
Coatings 13 01327 g007
Figure 8. EN current time series and associated attractors.
Coatings 13 01327 g008
Figure 9. Recurrence plotsobtained at differentexposure times.
Coatings 13 01327 g009
Table 1. Parameters obtained after fitting experimental EIS data to the electrical equivalent circuit.
Exposure Time in NSS400 h600 h800 h1000 h
Rs Ωcm28810761450320
Yc Ω−1cm−2sNc3.439 × 10−62.486 × 10−63.057 × 10−72.973 × 10⁻⁶
Nc0.8820.8820.8720.812
Rpore Ωcm22094.03 × 1041.563 × 1071673
YDL Ω−1cm−2sNDL3.419 × 10−65.068 × 10−545.518.862 × 10−7
NDL0.8610.9990.4750.960
RCT Ωcm22.398 × 10547.346.860 × 1082.767 × 105
Chi-square0.00180.00130.00120.0031
Table 2. Parameters of the recurrence plot obtained at different times of exposure.
Time of Exposure in NSS0 h200 h400 h600 h800 h1000 h
%R13.6086.9694.5890.820.173.48
%D0.00495.3697.5892.6918.490.00
Ent(bit)0.07.425.935.572.930.00
ML11910370189220.00
Disclaimer/Publisher’s Note: The statements, opinions and data contained in all publications are solely those of the individual author(s) and contributor(s) and not of MDPI and/or the editor(s). MDPI and/or the editor(s) disclaim responsibility for any injury to people or property resulting from any ideas, methods, instructions or products referred to in the content.