Article

Experimental Study of Laser Cladding Ni-Based Coating Based on Response Surface Method

1
College of Mechanical Engineering, North China University of Science and Technology, 21 Bohai Road, Caofeidian Xincheng, Tangshan 063210, China
2
College of Metallurgy and Energy, North China University of Science and Technology, 21 Bohai Road, Caofeidian Xincheng, Tangshan 063210, China
*
Author to whom correspondence should be addressed.
Coatings 2023, 13(7), 1216; https://doi.org/10.3390/coatings13071216
Submission received: 29 May 2023 / Revised: 28 June 2023 / Accepted: 30 June 2023 / Published: 7 July 2023
(This article belongs to the Special Issue Advanced Anticorrosion Coatings and Coating Testing)

Abstract

:
In order to extend the service life of 45# steel and reduce production costs, coating NiCrBSi alloy powder on the surface of 45# steel can meet production requirements, avoid resource waste and achieve green manufacturing. Based on response surface method (RSM), the dilution rate, aspect ratio and contact angle were taken as the optimization goals, and the process parameters (laser power, scanning speed and powder feeding rate) were optimized and the optimal process parameters were determined. On this basis, the microstructure of Ni-based coating was characterized by the cladding experiment. The friction wear and corrosion resistance of the coating were tested, and the enhancement mechanism of the wear resistance and corrosion resistance of the coating was analyzed. The results show that the optimized coating has good corrosion resistance and wear resistance. It provides a reference for the optimization of process parameters in 45# steel repair work.

1. Introduction

At present, in order to improve the performance of parts, researchers mostly use traditional surface modification methods such as thermal spraying, surfacing welding and surface heat treatment. However, these methods have drawbacks such as low bonding strength, large heat input and thermal deformation [1]. As a new surface modification technology of metal materials, laser cladding is a surface modification technology that us-es laser as a heat source to irradiate alloy powder to melt at the same time with the mate-rial surface and form a low-dilution cladding layer after solidification. It has the advantages of low thermal effect, small workpiece deformation and high bonding strength [2,3,4], so it is widely used in various industries.
As a medium carbon tempering structural steel, 45# steel is widely used in various important parts due to its low price and good strength, cold and hot working properties [5]. However, 45# steel in long-term service under high load, wet environment, the surface is often subjected to serious wear and corrosion, thus reducing the service life. Laser clad-ding is an effective method to strengthen the surface properties of 45# steel. Ni-based alloy has the characteristics of corrosion resistance, wear resistance, high temperature creep re-sistance and thermal oxidation resistance. And it is one of the main materials of laser cladding alloy system [6]. Therefore, many scholars choose Ni-based powder as cladding material.
Liu et al. [7] prepared Ni60-Cu composite coatings with different Cu content on the surface of 45# steel, and studied the effects of Cu content on microhardness and tribologi-cal behavior. The results show that the Ni60-5%Cu coating shows the best friction resistance at 600 °C. Zhou et al. [8] prepared Ni60 coating on 45# steel surface with the assis-tance of magnetic, ultrasonic and electric field. The results show that the microstructure of the Ni-based coatings prepared under the influence of multiple physical fields is refined, the distribution of elements is uniform. And the friction and corrosion resistance of the coatings are improved. Cao et al. [9] prepared coatings with different TiC contents of Ni60-TiC on the surface of 45# steel. The results showed that adding TiC to the coatings could effectively improve the hardness, wear resistance and corrosion resistance of the coatings. When the TiC content is 20wt%~30wt%, the wear and corrosion resistance of the coating is the best. Chen et al. [10] successfully prepared Ni35 + 20%SiC + 20%Ni/MoS2 self-lubricating coating on the surface of 45# steel, and tested the microhardness, corrosion resistance and wear resistance. The results show that the average microhardness of the coating is about 700 HV. Compared with 45# steel, the corrosion resistance and wear resistance of the coating are greatly improved. Yu et al. [11] added Ta element to NiCrBSi alloy powder to improve the high-temperature wear resistance of carbon steel. The results showed that Ta significantly improved the wear resistance of NiCrBSi coatings at high temperatures. Similarly, Hulka et al. [12] studied the influence of Ti addition amount on WC-Co/NiCrBSi coating. The results show that the addition of pure titanium can reduce the cracking sensitivity and improve the hardness and corrosion resistance of the coating.
The above studies obtained high quality coatings by exploring new cladding pow-ders or with the assistance of multiple physical fields. But they did not consider the influ-ence of the combined action of process parameters on the quality of cladding layers. As is well known, the laser cladding process is extremely complex and involves many process parameters. The selection of cladding process parameters affects the forming quality of the coating [13]. The process parameters such as laser power, scanning speed and powder feed amount are the key factors affecting the quality of laser cladding layer. Adjusting the parameters of laser cladding can change the transfer process of energy, mass and momentum in the cladding layer, affect the formation and growth of the cladding layer grains, and then control its surface morphology and comprehensive properties. In the case of selecting high-performance cladding materials, reasonable adjustment of process parameters can further improve the comprehensive protection performance of industrial equipment. RSM integrates experimental design and mathematical modeling, and adopts multiple quadratic regression equation fitting to obtain the optimal combination of design variables and the optimal value of response target [14]. RSM has the advantages of few test times, short test period, high precision, good prediction performance, and can study the interaction between factors. Compared with orthogonal experimental design and uniform experimental design, the regression equation obtained by RSM has higher accuracy, and the interaction of multiple related factors can be obtained. Moreover, RSM can extend the optimization process to the surface area, and has more significant three-dimensional effect than other point-to-point optimization methods. At the same time, RSM can reduce the test deviation under the best conditions, and has obvious advantages.
Among many Ni-based alloys, NiCrBSi self-soluble alloy powder is a commonly used thermal spraying and laser cladding material. The prepared NiCrBSi coating has good corrosion resistance and wear resistance, and is often used for surface strengthening of parts. Therefore, in this experiment, NiCrBSi alloy powder was used as cladding material, and RSM method was selected to optimize the laser process parameters. And then NiCrBSi alloy coating is successfully prepared on the surface of 45# steel by laser cladding technology The microstructure, wear resistance and corrosion resistance of NiCrBSi alloy coating are systematically studied.

2. Materials and Methods

2.1. Materials and Optimization Methods

The test selected 45# steel as the substrate, the size of 100 mm × 100 mm × 10 mm. Its chemical composition is shown in Table 1. The cladding material is NiCrBSi alloy powder. The powder is prepared by gas atomization. The chemical composition of powder was determined by atomic absorption spectrometer (Z-2010). Its chemical composition is shown in Table 2. The micromorphology and particle size distribution of the cladding powder were measured by scanning electron microscope and laser particle size analyzer respectively. Figure 1 shows the microscopic morphology and particle size distribution of the Ni-based powder. It can be seen that the powder is basically spherical and has good fluidity. The particle size ranges from 50 μm to 130 μm, with an average particle size of 89.5 μm.
The NiCrBSi coating was prepared by fiber laser (TSR-2000-01, Ningbo Tusheng Laser Technology Co., Ltd., Ningbo, China). The laser wavelength is 915 nm, the maximum power is 2000 W, and the laser spot radius is 2 mm. Before the test, the substrate is polished with sandpaper to remove rust and oxides on the surface of the substrate, and cleaned with anhydrous ethanol to prevent oxidation. Before cladding, the powder is placed in a drying oven and dried at 100 °C for 24 h. Argon is used as a protective gas to avoid interference from other elements in the air during the cladding process. Box-Behnken Design (BBD) of Design-Expert software is used as the experimental scheme, with three factors and three levels, as shown in Table 3. Laser power, scanning speed and powder feeding rate are used as influencing factors. As shown in Figure 2, the dilution rate (h/(h + H)), aspect ratio (W/H) and contact angle (θ) are selected to characterize the morphology and quality of cladding layer. The width (W), height (H), depth (h) and contact angle (θ) of the coating are measured using Image-Pro software. In order to make the data representative, the measurements are repeated three times for each set of data and the average is taken. Therefore, 17 groups of composite tests of laser process parameters are designed, as shown in Table 4.

2.2. Microstructure and Performance Evaluation

After the cladding test, the metallographic samples are cut by electric spark cutting machine and polished by 100~3000 mesh sandpaper in turn until smooth. It is then mechanically polished with diamond polish. Aqua regia solution is used as caustic agent. After the corrosion, the coating is washed and dried with alcohol immediately. The microstructure of the cladding layer is observed by scanning electron microscope (Scios03040702). In the electrochemical experiment, electrochemical workstation (CHI660D) is used to test the corrosion resistance of the coating. The sample is the working electrode, the auxiliary electrode is platinum sheet, and the saturated calomel electrode is a three-electrode system composed of reference electrodes. The test environment temperature is 25 °C. The electrolyte is tested in 3.5% NaCl neutral solution after the open-circuit potential stabilized 3600 s. The electrochemical test is repeated three times for each sample, using the mean as the final data. The tribological behavior of the coating at room temperature was studied by using a Friction and wear testing machiner (MRH-1). The countergrinding disc is made of 2Cr13 stainless steel with a diameter of 40 mm. The wear test parameters are as follows: wear time is 30 min, load is 100 N, sliding speed is 0.209 m/s, and total sliding distance is 376.8 m. The worn morphology was detected by the 3D profilometer. Similarly, the experiment is repeated three times for each sample and its average value is taken. Before the test, the sample surface is polished, cleaned with acetone, and dried. Wear rate is estimated using the following formula:
ω = V F L
where ω is the wear rate per unit load and distance, mm3/Nm; V is the volume loss, mm3; F is normal load, N; L is the sliding distance, m.

3. Results and Discussion

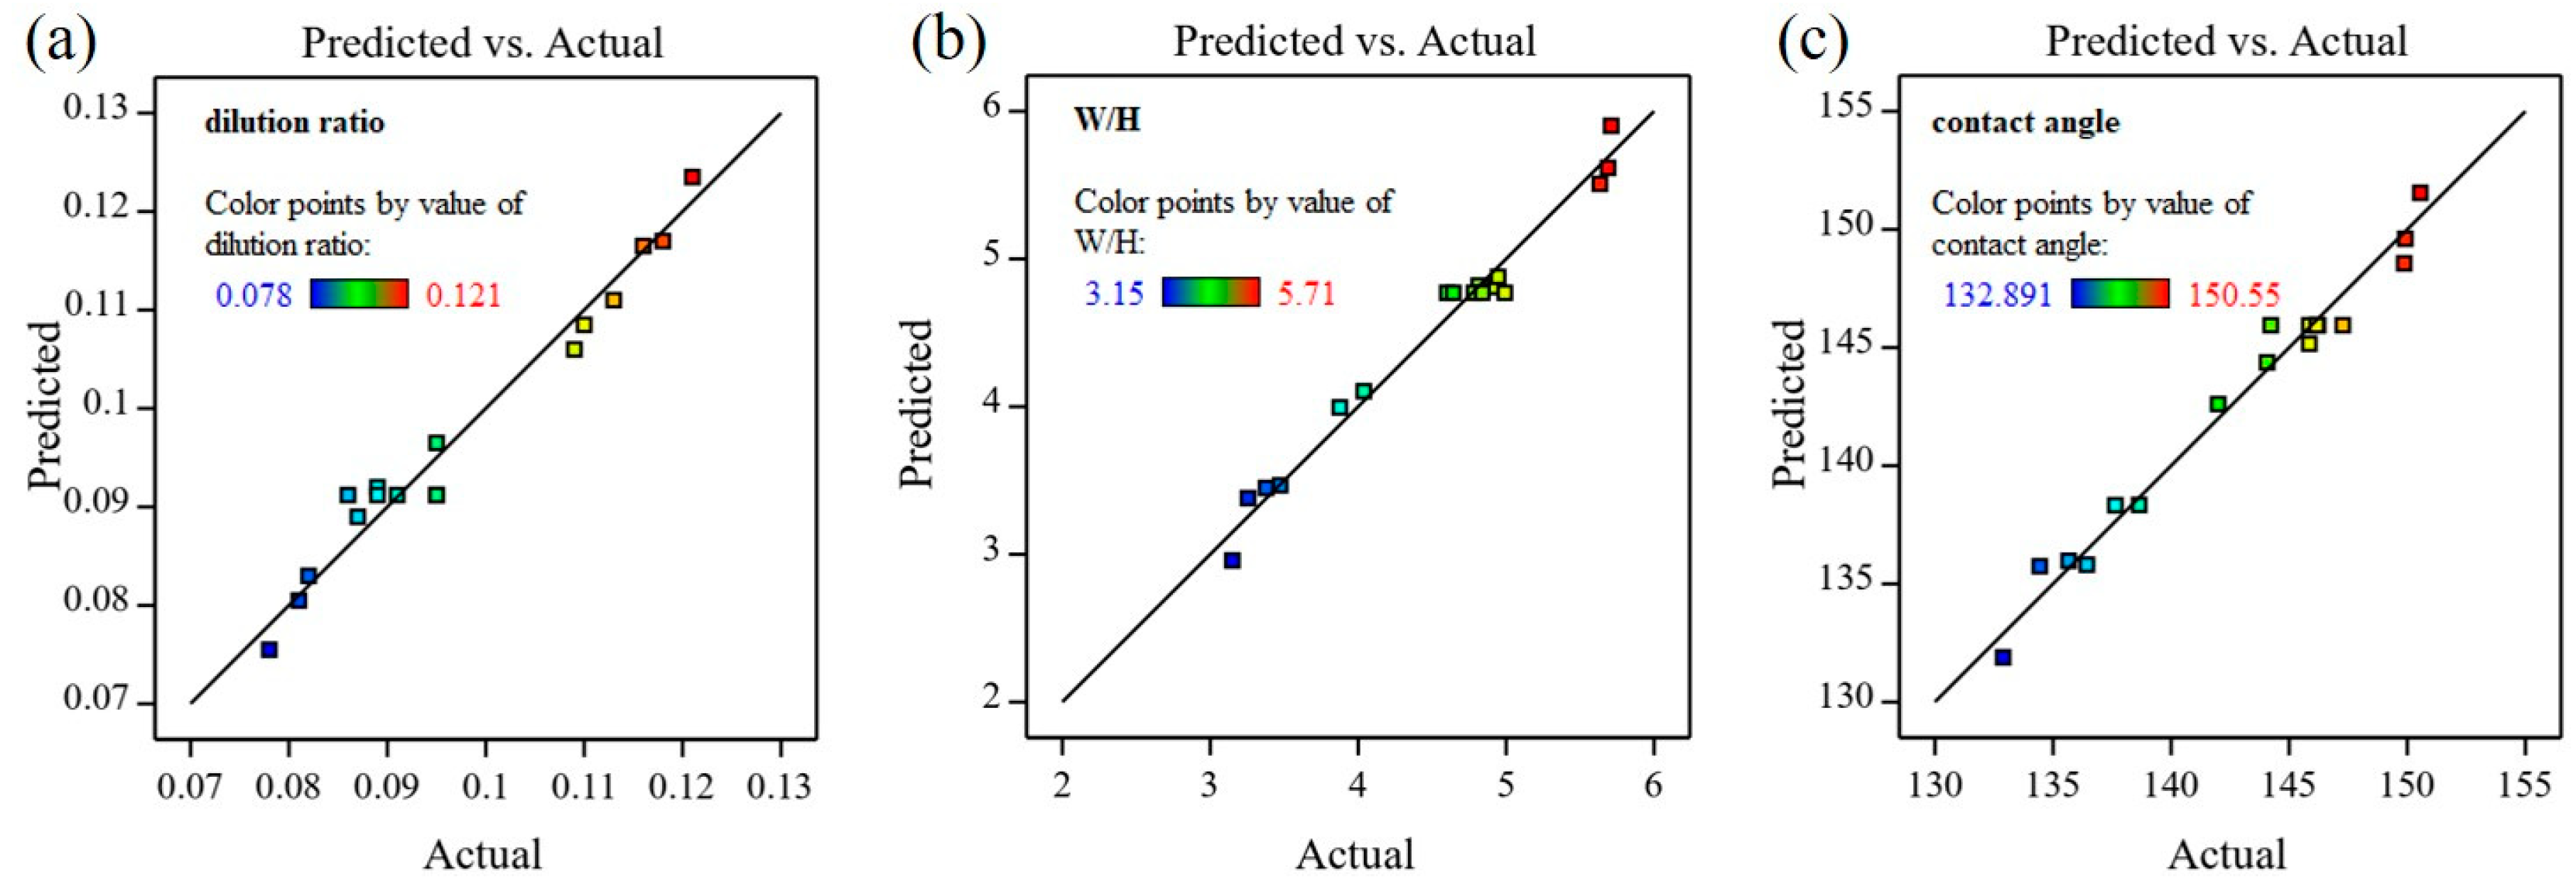
3.1. Optimization of Process Parameters

RSM is an advanced experimental design technique that helps to deeply understand and optimize the response, and can obtain clear functional relationships between influencing factors and response variables. By importing the experimental data into the Design Expert software, the relationship model between the topography of the cladding layer and the process parameters can be obtained after removing the non-significant items:
{ y 1 = 0.912 + 0.0175 x 1 0.0065 x 3 + 0.0033 x 1 x 3 + 0.0045 x 2 2 0.005 x 3 2 y 2 = 4.77 + 0.3975 x 1 + 1.07 x 3 0.2632 x 1 2 0.2214 x 3 2 y 3 = 145.95 + 3.22 x 1 + 6.61 x 3 3.2 x 1 2 2.28 x 3 2
where y 1 is the dilution rate; y2 is the aspect ratio; y 3 is the contact angle, °; x 1 is the laser power, W; x 2 is the powder feeding rate, mg/s; x 3 is the scanning speed, mm/s.
Figure 3 shows the predictive correlation of models of dilution rate, aspect ratio, and contact angle. It can be seen that all points in the figure are distributed near the straight line, indicating that the results obtained by the model are in good agreement with the test results [15]. Table 5 shows the values of the three models. R2 is a statistic that measures the goodness of fit of a regression model, and the closer R2 is to 1, the better the regression model fits the data. Adjusted R2 refers to the statistic obtained after correcting R2 in the multiple linear regression model. The closer the adjusted R2 value is to 1, the better the model fits the data. Predicted R2 is used to evaluate to evaluate the prediction ability of the model. Similarly, the closer it is to 1, the better the model can predict the data. The R2 values of the three models are 0.9666, 0.9780 and 0.9767 respectively, all of which are close to 1, indicating a high degree of fitting of the three models. The difference between the adjusted R2 and the predicted R2 of the three models is less than 0.2, indicating that the error of the response surface equation is very small [16]. The signal-to-noise ratio is defined as the ratio of the model variance to the residual, the signal-to-noise ratio of the three models is all greater than 4, indicating that the accuracy and recognition of three models are high [17].
Figure 4a–c show the contour plots of laser power and scanning speed with respect to dilution rate, aspect ratio and contact angle, respectively. Figure 4d–f respectively show the corresponding 3D response curves of Figure 4a–c. In order to obtain better cladding quality, the dilution rate can be reduced, and the aspect ratio and contact angle can be increased. It can be seen from the figure that decreasing the laser power while increasing the scanning speed can obtain a smaller dilution rate. Larger aspect ratio and contact angle can be obtained by increasing laser power and scanning speed.
Table 6 shows the optimization conditions and objectives. The weights of dilution rate, aspect ratio and contact angle are set to 5, 3, 4, respectively. In order to obtain a better performance of the cladding layer, the dilution rate optimization is the desired small characteristic response, whose satisfaction function is Formula (3), while the aspect ratio and contact angle optimization are both the desired large characteristic response, whose satisfaction function is Formula (4).
d j ( Y i ( X ) ) = { 1 Y i Y j min [ Y j max Y i ( X ) Y j max Y j min ] w t i Y j min Y i ( X ) Y j max 0 Y i ( X ) Y j max
d j ( Y i ( X ) ) = { 1 Y i > Y j max [ Y i ( X ) Y j min Y j max Y j min ] w t i Y j min < Y i ( X ) Y j max 0 Y i ( X ) Y j min
where Y j max and Y i max are the upper and lower bounds respectively.
Based on Design-Expert software, multi-objective optimization is carried out by using the satisfaction method, which transforms multiple targets to be optimized into a dimensionless overall satisfaction function (D). The overall satisfaction function is the geometric average of each response, and its expression is shown in Equation (5). The optimized process parameters are as follows: the laser power is 1477 W, the scanning speed is 5 mm/s, and the powder feeding rate is 17.5 mg/s.
D = ( i = 1 m d i ) 1 / m
where m is the number of responses and di is the satisfaction function.

3.2. Microstructure Characterization

Single-channel and multi-channel cladding experiments are carried out with optimized process parameters. And the overlap ratio was 50%. Figure 5a shows the cross section morphology of the optimized coating. It can be found that the optimized coating has a lower dilution rate, a larger aspect ratio and no porosity and cracks are found. Figure 5b,c show the low-magnification and high-magnification microstructure of the cross section of the cladding layer, respectively. It can be found that the cladding layer is mainly composed of eutectic structure, black phase, cellular and columnar crystals. According to the literature, the eutectic structure is Ni-B-Si eutectic [18]. The black phase is the hard phase containing chromium [19]. Cellular and columnar crystals are γ (Ni) solid solutions [20]. Figure 5d shows the microstructure of the binding zone. It can be clearly found that there is a bright band between the cladding layer and the substrate, which proves that the cladding layer and the substrate can form a good metallurgical bond.

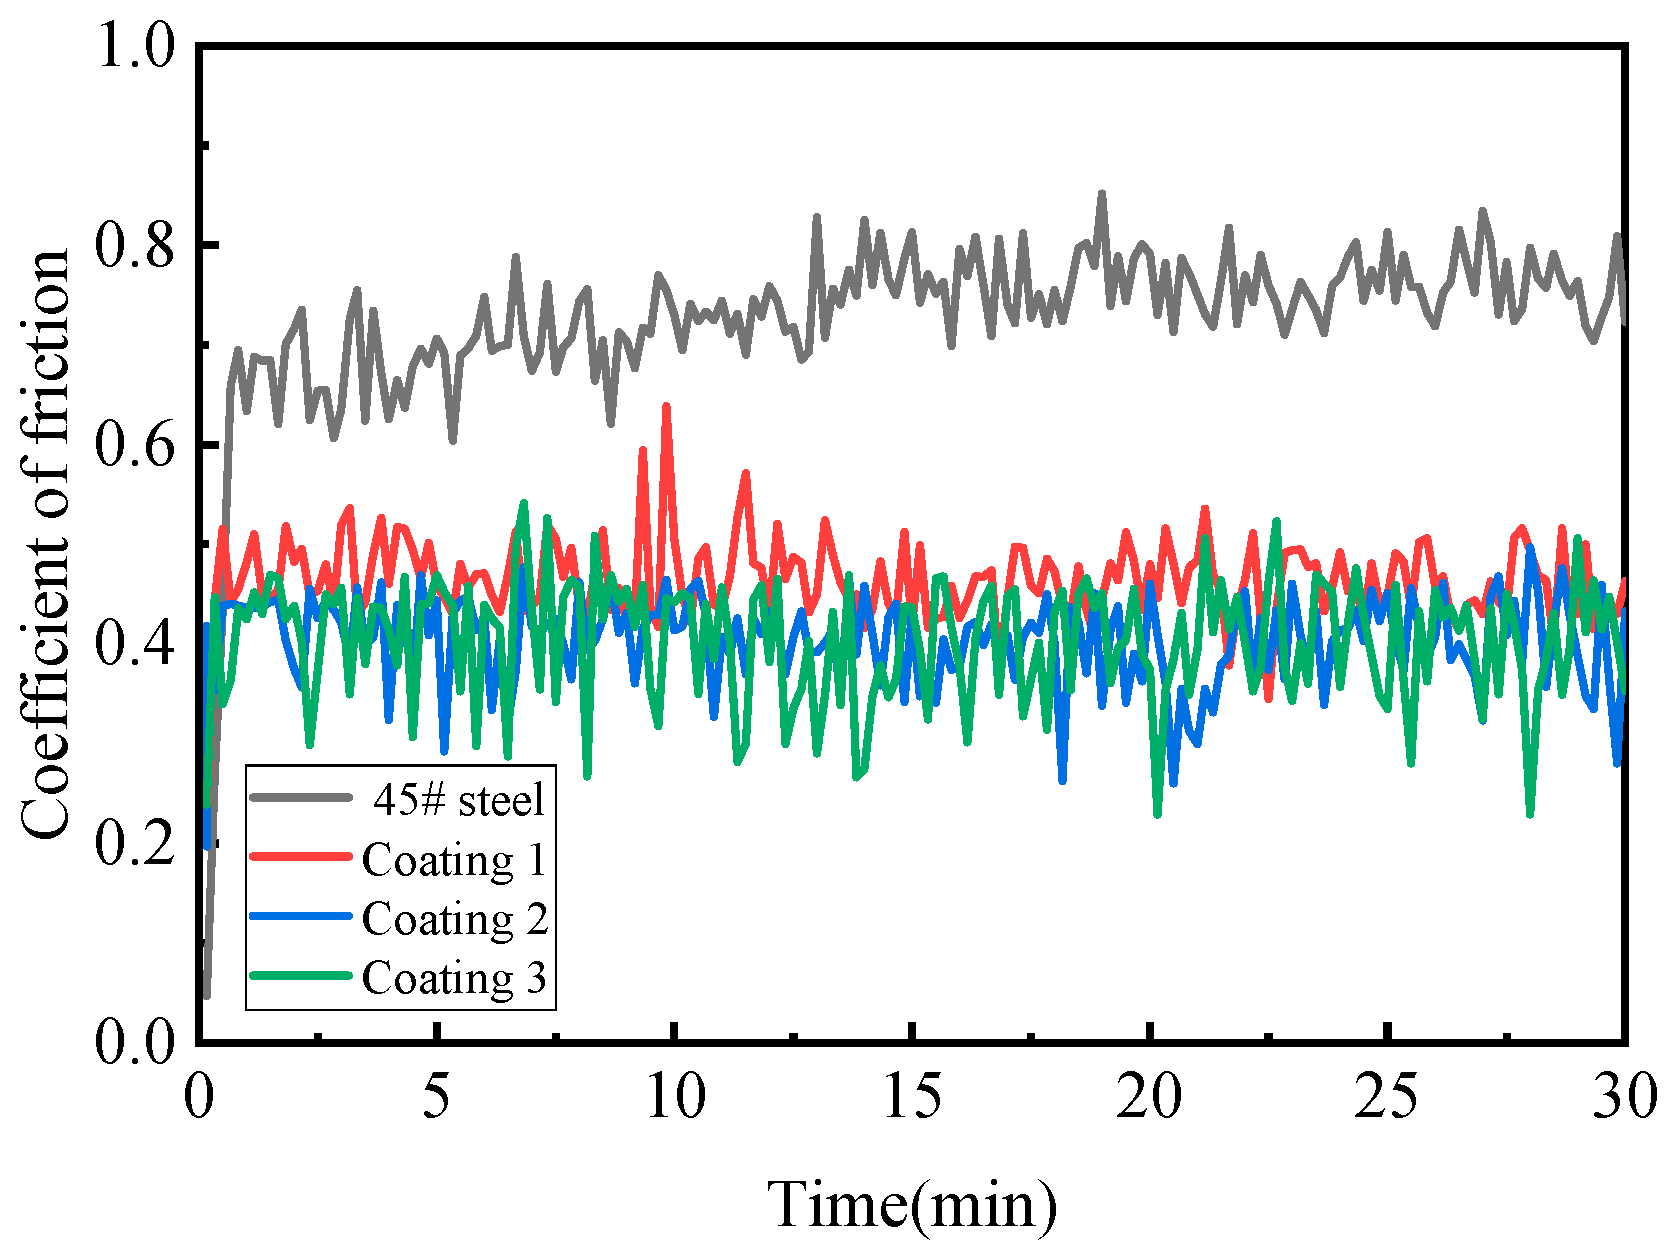
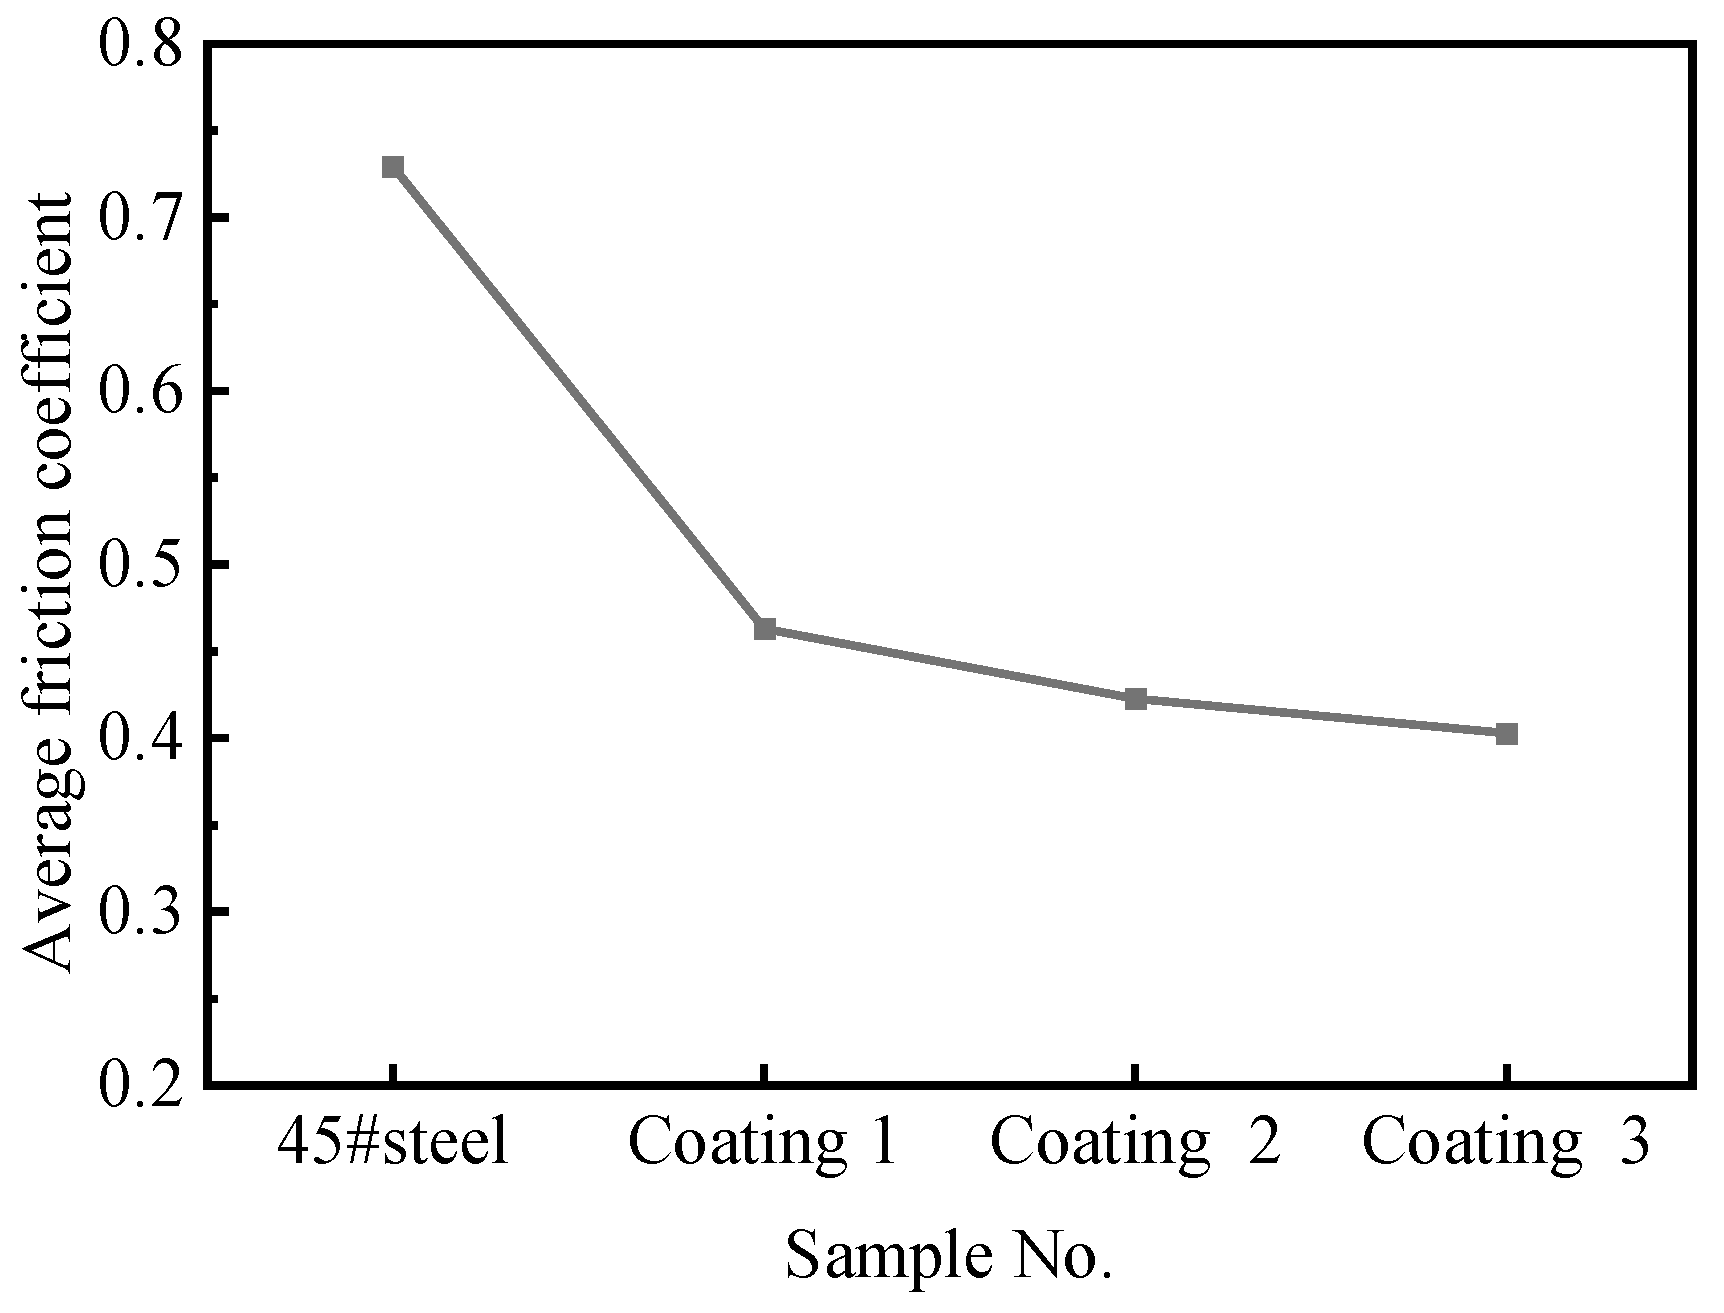
3.3. Friction and Wear Performance Test

In order to verify the good performance of the optimized coating, three coatings were selected, as shown in the Table 7. Coatings 1 and Coatings 2 are the unoptimized coatings, while coating 3 is the optimized coating. Figure 6 shows the friction coefficient curve of 45# steel and Ni-based coating. It can be found that when the friction process reaches the stable stage, the friction coefficient of Ni-based coating is significantly lower than that of 45# steel. Figure 7 shows the average friction coefficients of 45# steel and Ni-based coating. The average friction coefficients of 45# steel and the three Ni-based coatings are 0.72, 0.46, 0.42 and 0.4, respectively, indicating that Ni-based coating can significantly improve the wear resistance of 45# steel. And the optimized coating has the best wear resistance. Figure 8 shows the wear rate of 45# steel and Ni-based coating after friction. It can be seen that 45# steel has extremely poor wear resistance, and the wear rate reaches 4.53 × 10⁻⁵ mm3/Nm. While the weight loss of Ni-based coating is significantly reduced, and the optimized coating wear rate is reduced to 0.92 × 10⁻⁵ mm3/Nm. This indicates that the optimized Ni-based coating can significantly improve the wear resistance of the coating.
Figure 9 shows the worn surfaces of 45# steel and Ni-based coatings, respectively. It can be found that the surface wear of 45# steel has spalling pits of different shapes and deep grooves. Because 45# steel has low hardness, the friction pair extrudes 45# steel surface, causing material transfer and loss, and forming adhesive wear. At the same time, deep grooves are observed on the worn surface, indicating the occurrence of abrasive wear. The hardness of the Ni-based coating is significantly higher than that of the substrate [21]. And the friction pair can only consume the coating by means of scratching and micro-cutting, leaving only shallow furrow marks on the surface of the coating. So the wear mechanism is slight abrasive wear. The excellent wear resistance of the coating is mainly related to the microstructure, phase composition and wear process. A large number of carbide and chromium compounds are distributed in the interdendrite eutectic area. At the same time, the hard phase CrB inhibits the growth of grain, promotes heterogeneous nucleation, and makes the crystal finer and densier. The uniform tough phase of γ (Ni) solid solution in the coating also helps to reduce the influence of residual strain and shear stress on the hard phase during the wear process.
Figure 10 shows the 3D profile of wear of 45# steel and Ni-based coating. It can be observed that the wear surface of 45# steel presents a concave shape [22]. In the process of friction and wear, the friction force is most concentrated at the center of cross section of 45# steel, resulting in the first peeling of the central surface of 45# steel. So deep scars and grooves form easily. Due to the same principle, the worn surface of Ni-based coating also presents a concave shape, but the wear depth of Ni-based coating is greatly reduced compared to 45# steel. Figure 11 shows the wear width and depth of 45# steel and Ni-based coating. It can be observed that the wear width and depth of Ni-based coating decrease significantly along the cross section, due to the high hardness of Ni-based coating. In the process of friction and wear, the pitting degree of Ni-based coating surface is greatly reduced. In addition, it can be found that the width and depth of the optimized Ni-based coating wear is small, which proves that the optimized Ni-based coating has strong wear resistance.

3.4. Corrosion Resistance Test

Figure 12 shows the Tafel curve of 45# steel and Ni-based coatings. It can be observed that compared with 45# steel, the Ni-based coating has higher positive corrosion potential and lower corrosion current density, indicating that the Ni-based coating has better chemical stability and lower corrosion tendency. Table 8 shows the fitting results of the polarization curve of the coating. Compared with the non-optimized Ni-based coating, the optimized Ni-based coating has higher positive corrosion potential and lower corrosion current density, indicating that the optimized Ni-based coating has stronger corrosion resistance.
In order to further study the corrosion behavior of the Ni-based alloy coating and substrate, electrochemical impedance spectroscopy (EIS) test was carried out. The results were fitted with Zview software. The fitting parameters are shown in Table 9. Figure 13 shows the Nyquist curve of 45# steel and Ni-based coatings. The arc resistance in Nyquist curve represents the corrosion reaction occurring at the coating/electrolyte interface. The arc radius of bulk reactance can be used to evaluate the corrosion resistance of metal materials, and a larger arc radius of bulk reactance usually represents a better corrosion resistance. As can be seen from the figure, the arc of bulk reactance of all coatings presents a single arc resistance characteristic, indicating that the sample has only one time constant during the electrochemical corrosion process. In addition, it can be seen that the capacitance loop radius of Ni-based coating is much larger than that of 45# steel, which means that the corrosion resistance of Ni-based coating is much better than that of 45# steel. At the same time, the optimized coating has the largest radius, indicating that the optimized coating has the largest corrosion resistance improvement effect in 3.5%NaCl solution.
The Bode curve shown in Figure 14 consists of low, medium and high frequency regions. As shown in Figure 14a, in the high frequency region, |Z| curve tends to smooth, basic has nothing to do with the high frequency impedance. With the reduction of frequency |Z| curve slope is close to −1, the corresponding phase angle reaches maximum value. In low frequency range, the response impedance value of |Z|0.01Hz can intuitively evaluate the total corrosion resistance of the coating The optimized coating |Z|0.01Hz value is among the highest in the other coating, showing that the coating has good corrosion resistance. It can be seen from Figure 14b that in the intermediate frequency region, the maximum phase angle of the three coatings increases successively. This is consistent with the variation trend of impedance value, which indicates that the barrier property of Ni-based coating is obviously enhanced.
Figure 15 shows the established electrochemical equivalent circuit diagram. n represents the dispersion index (0 ≤ n ≤ 1), R1 is the solution resistance, R2 is the corrosion charge transfer resistance, and CPEdl is the non-ideal double layer capacitor. The larger the R2 value is, the stronger the corrosion resistance of the material is [23]. It can be seen from Table 9 that the R2 of the 45# steel substrate is the smallest (8.18 kΩ·cm2), while the R2 of the optimized Ni-based coating is the largest (78.39 kΩ·cm2), which indicates that the optimized Ni-based coating has the best corrosion resistance. Fe element has the effect of solid solution strengthening and grain refinement. Higher grain boundary density increases the number of priority attack sites and decreases the current density of a single attack site. The reduction of micro-inhomogeneity inhibits local corrosion of materials [24]. The increase of CrB content leads to the increase of corrosion resistance, and Cr element is conducive to improving the electrode potential of the coating and making the coating have good corrosion resistance [25].

4. Conclusions

45# steel parts in long-term service in high load, wet environment, there is serious surface wear and corrosion. In this paper, based on RSM, the laser power, scanning speed and powder feeding rate are optimized. The experimental results show that the wear resistance and corrosion resistance of the optimized coating are improved. It has laid a certain theoretical foundation for 45# steel parts repair technology. The main research results are as follows:
(1)
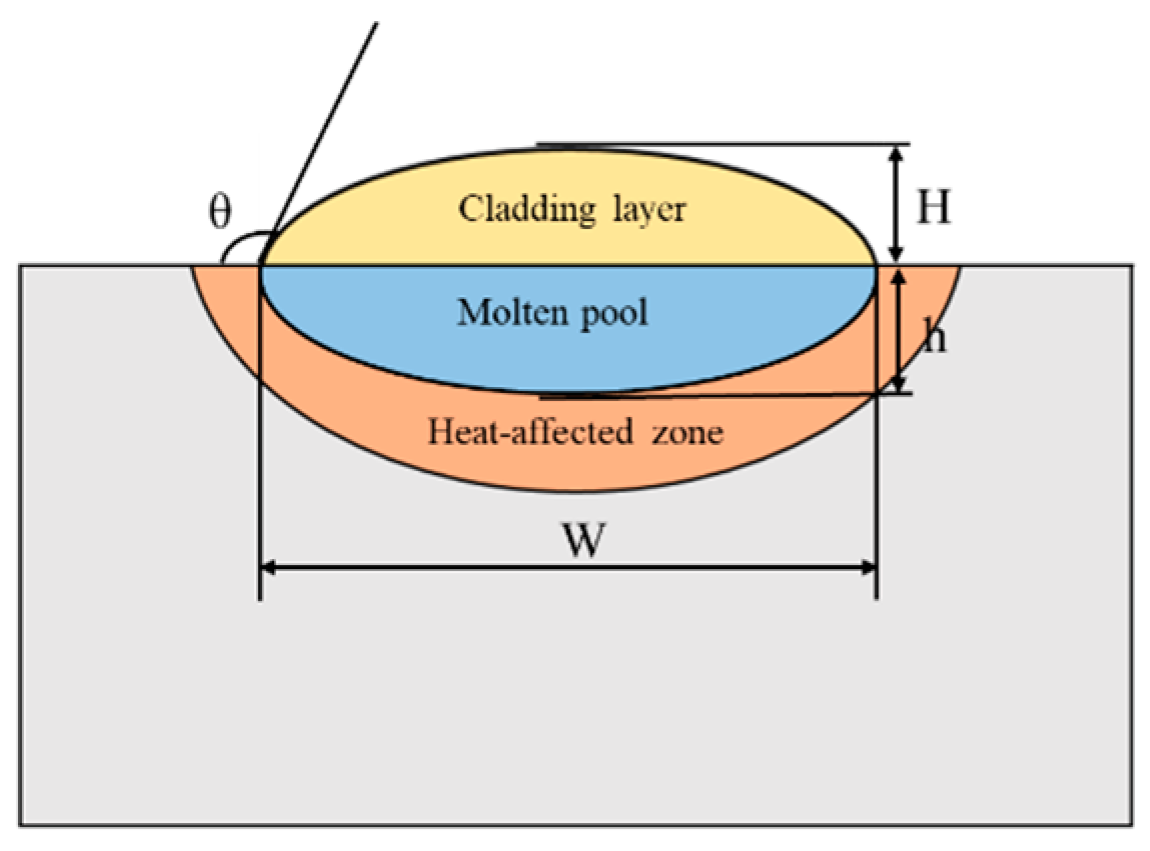
The interaction term shows that increasing the scanning speed and decreasing the laser power can obtain a smaller dilution rate. Increasing the laser power and scanning speed can obtain a larger aspect ratio and contact angle. The optimized process parameters are as follows: laser power 1477 W, powder feeding speed 17.5 mg/s, scanning speed 5 mm/s.
(2)
The cross section of the optimized coating has a good three-dimensional morphology, and the cladding layer and the substrate can form a good metallurgical bond. The Ni-based cladding layer is mainly composed of black chromium-hard phase, Ni-B-Si eutectic and γ (Ni) solid solution.
(3)
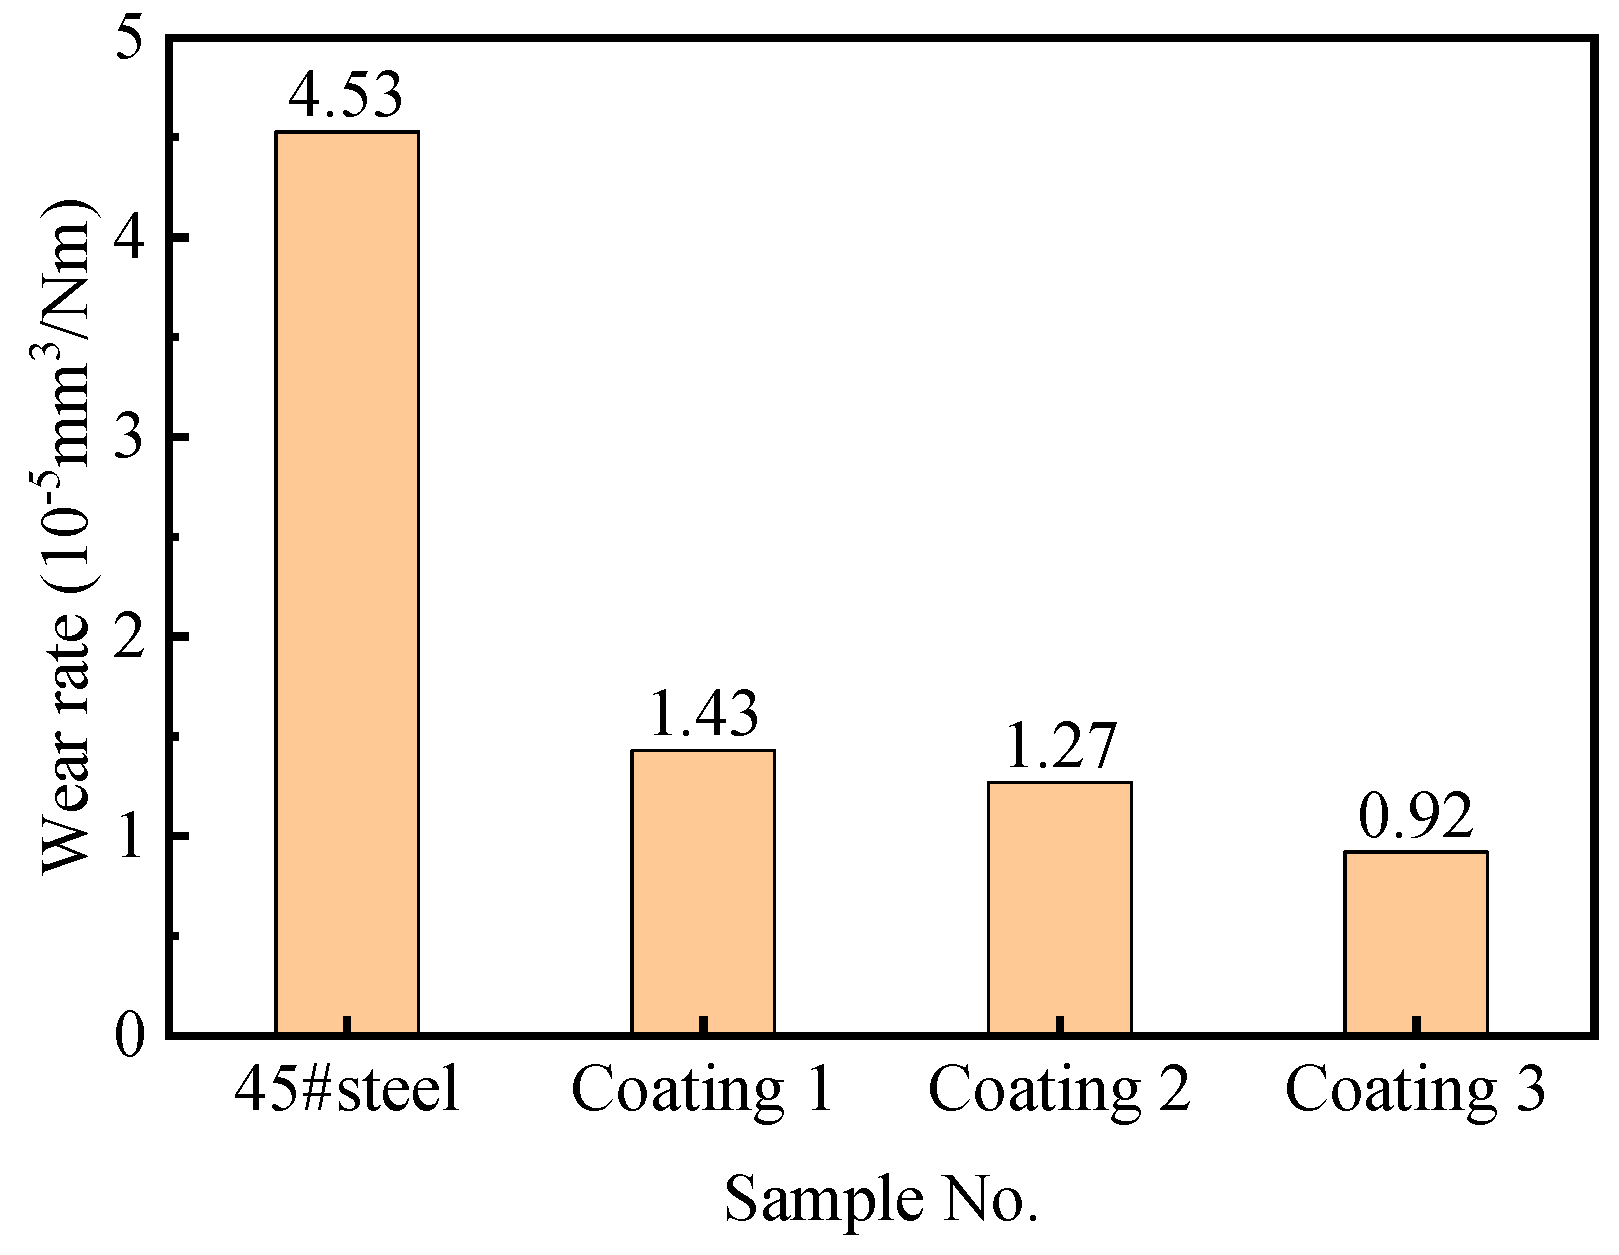
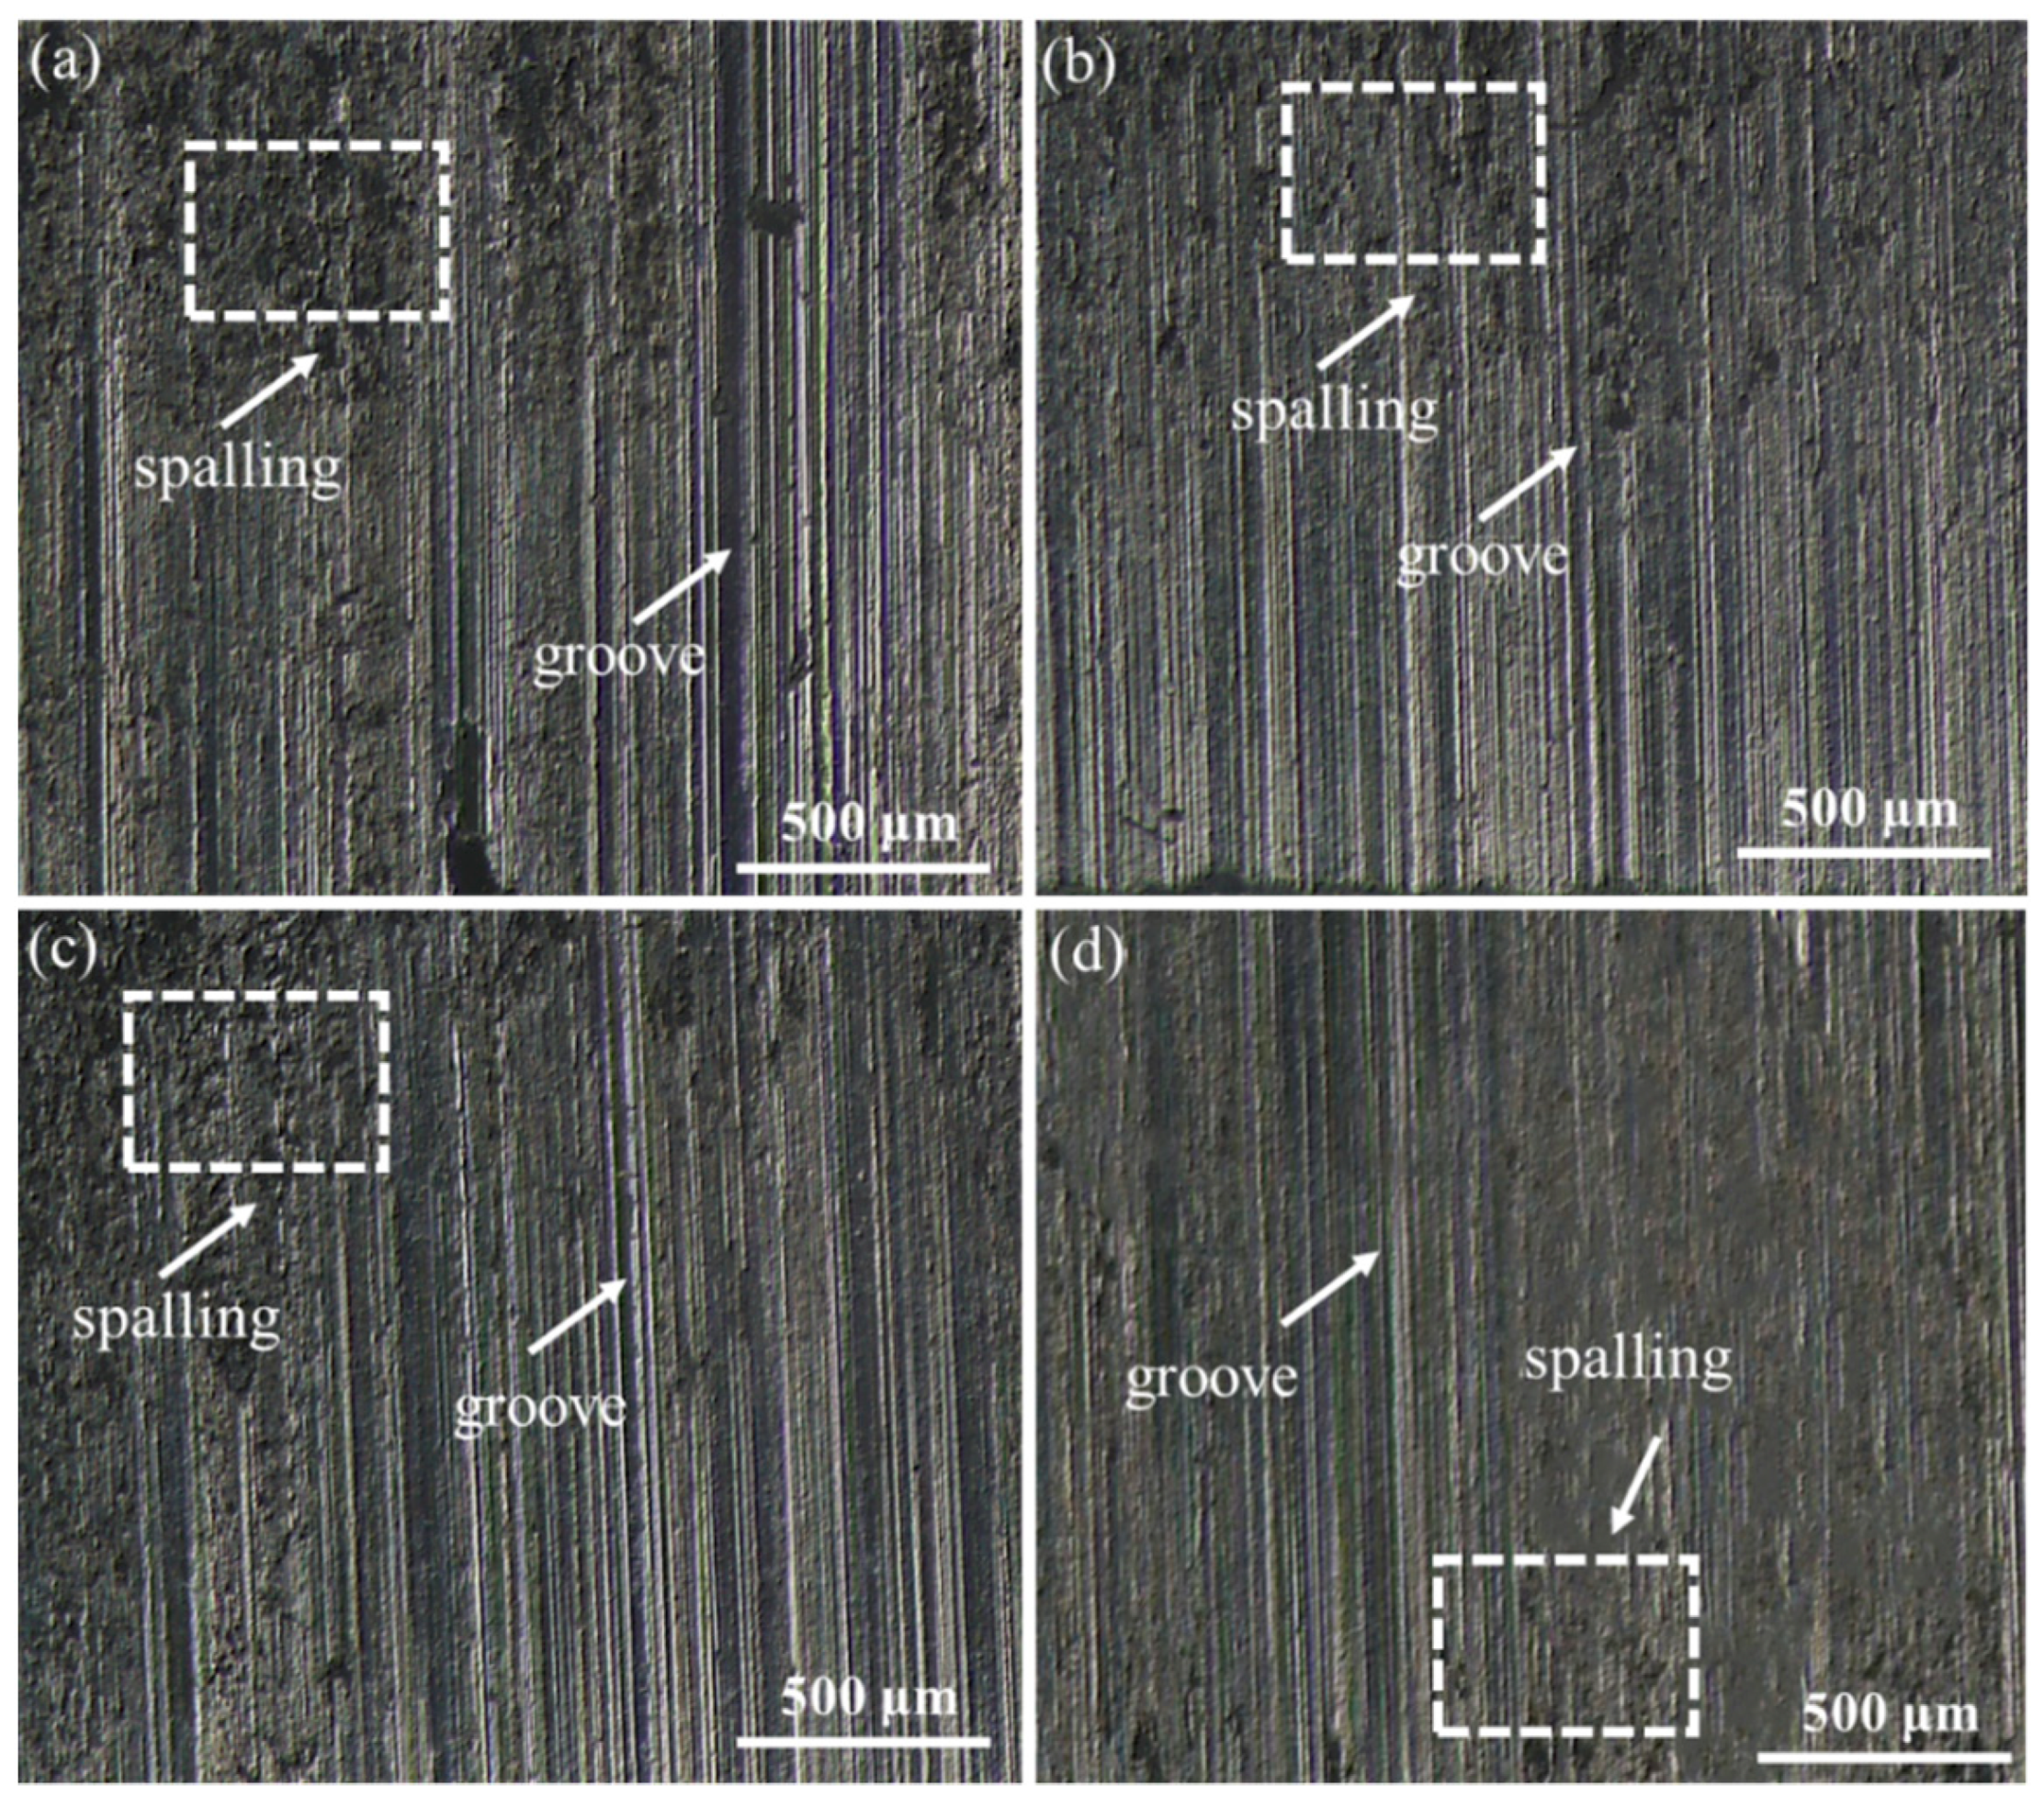
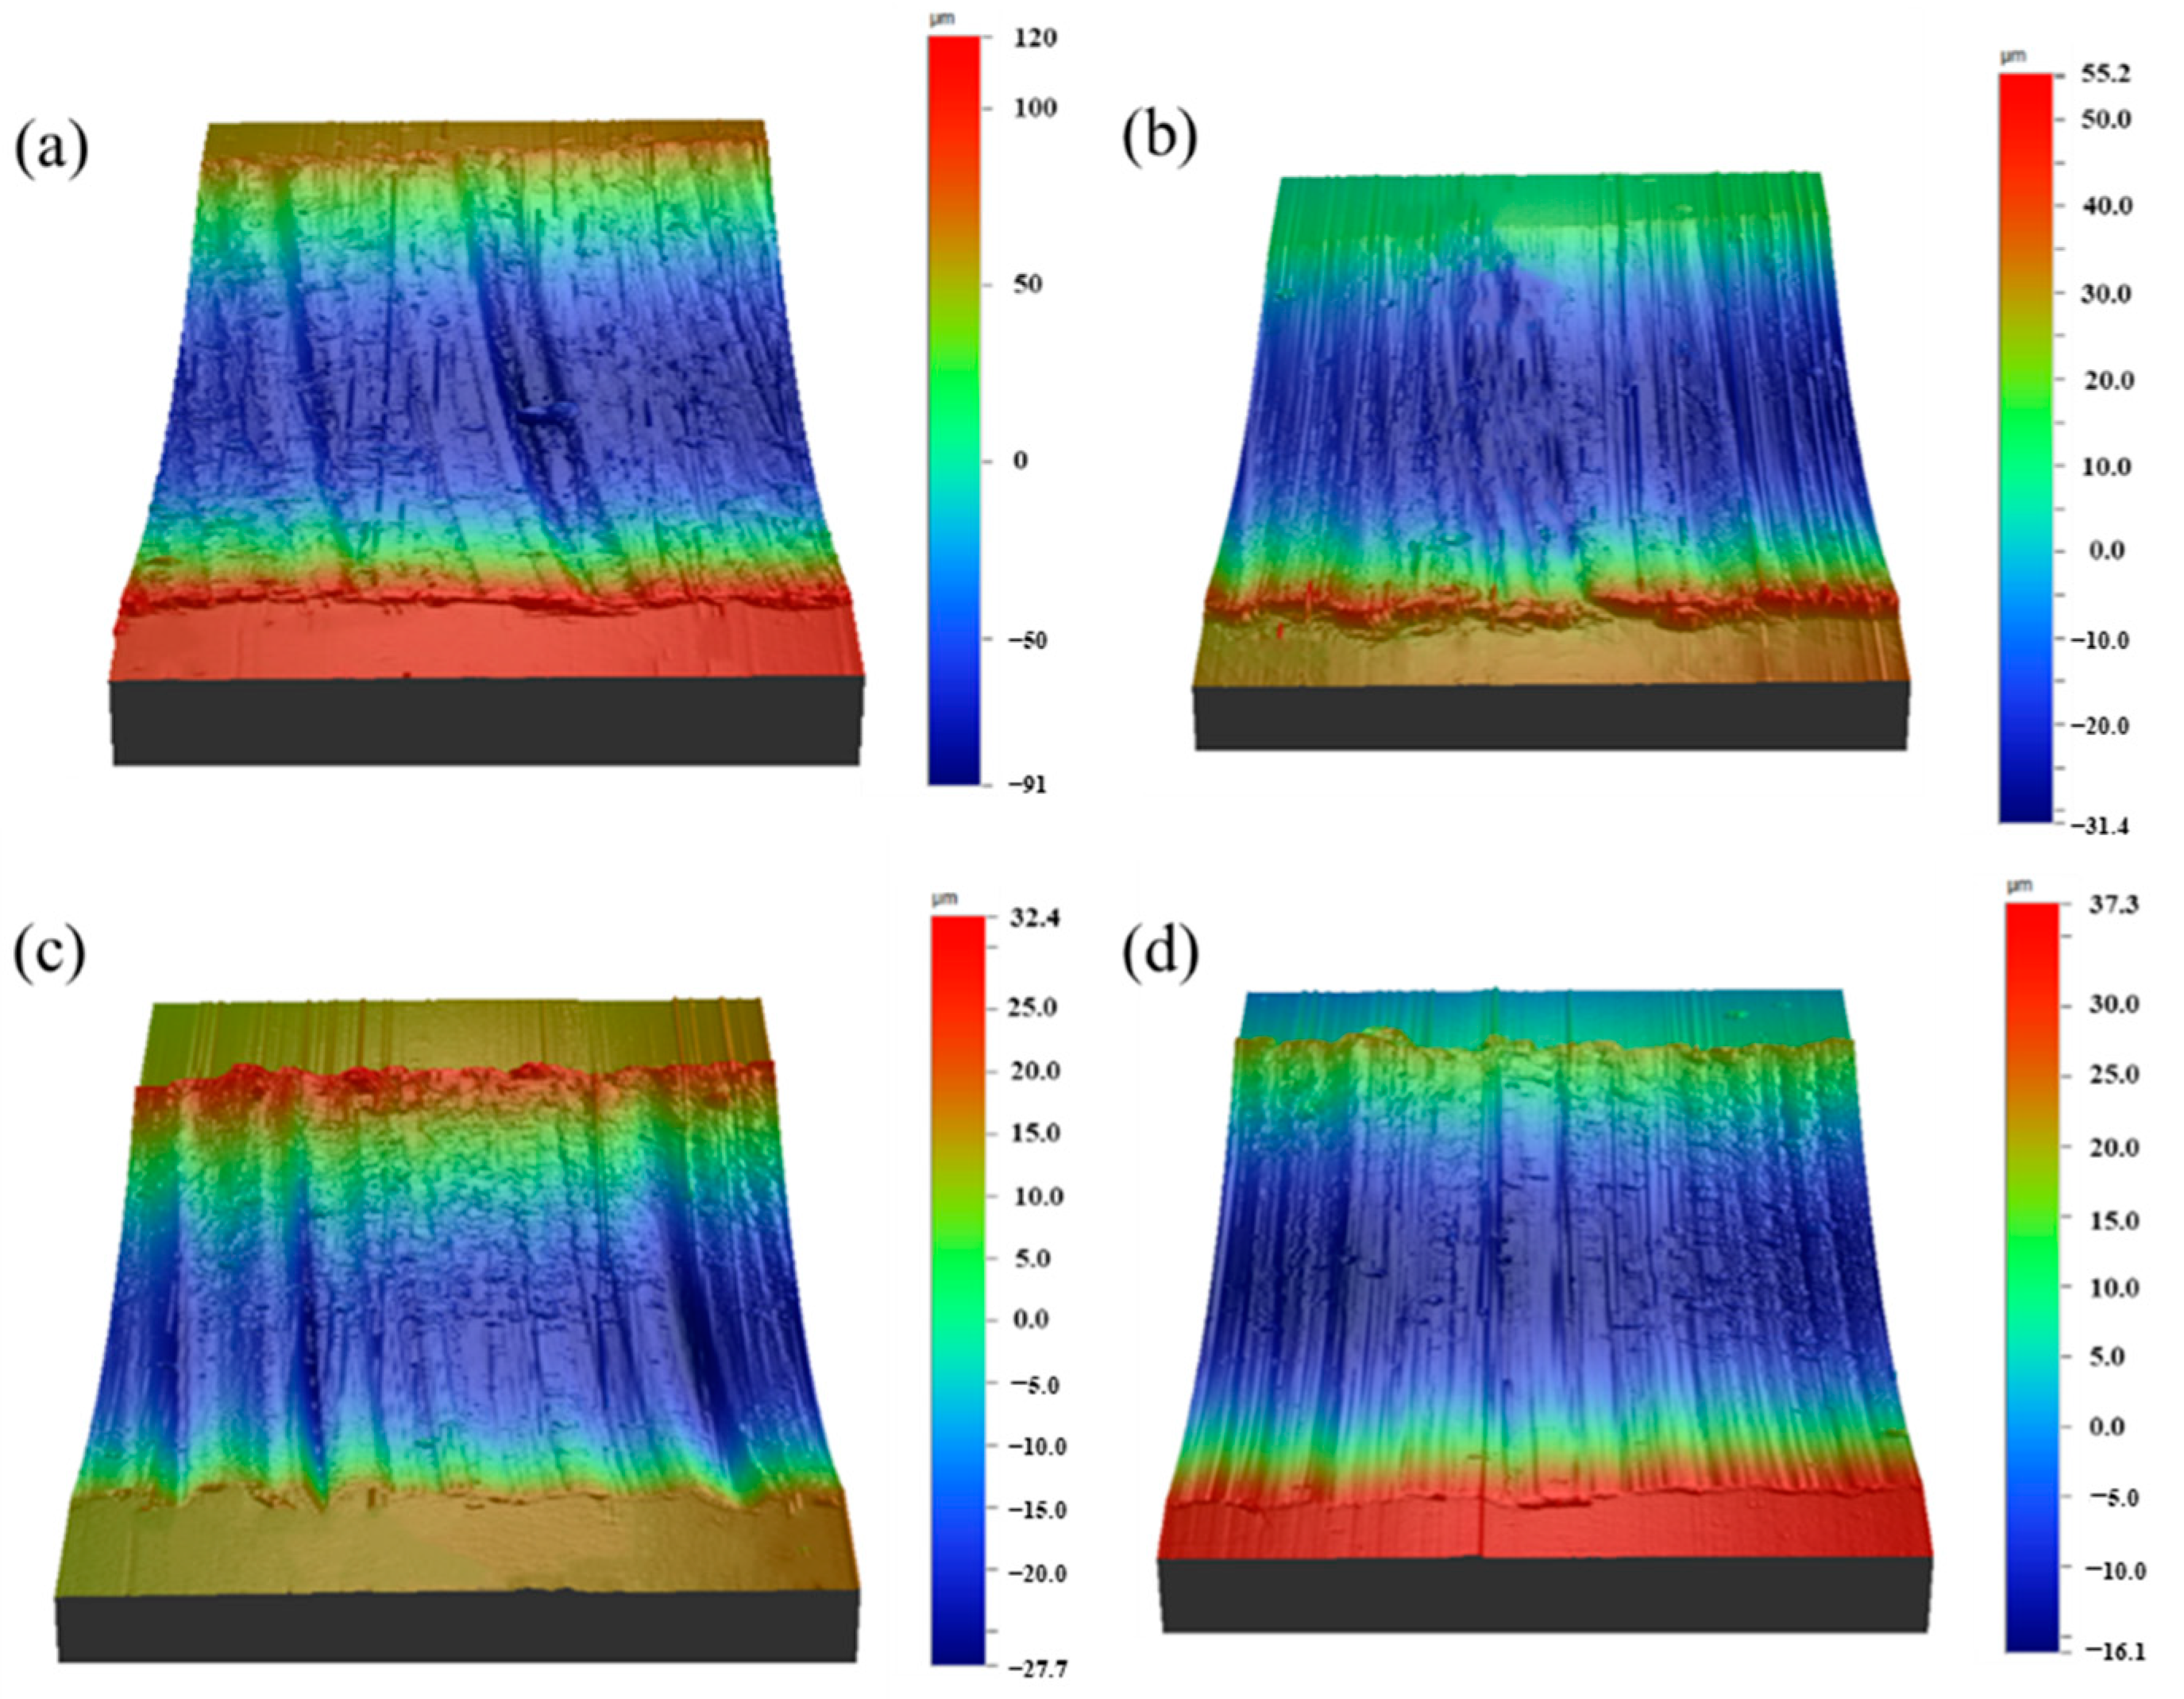
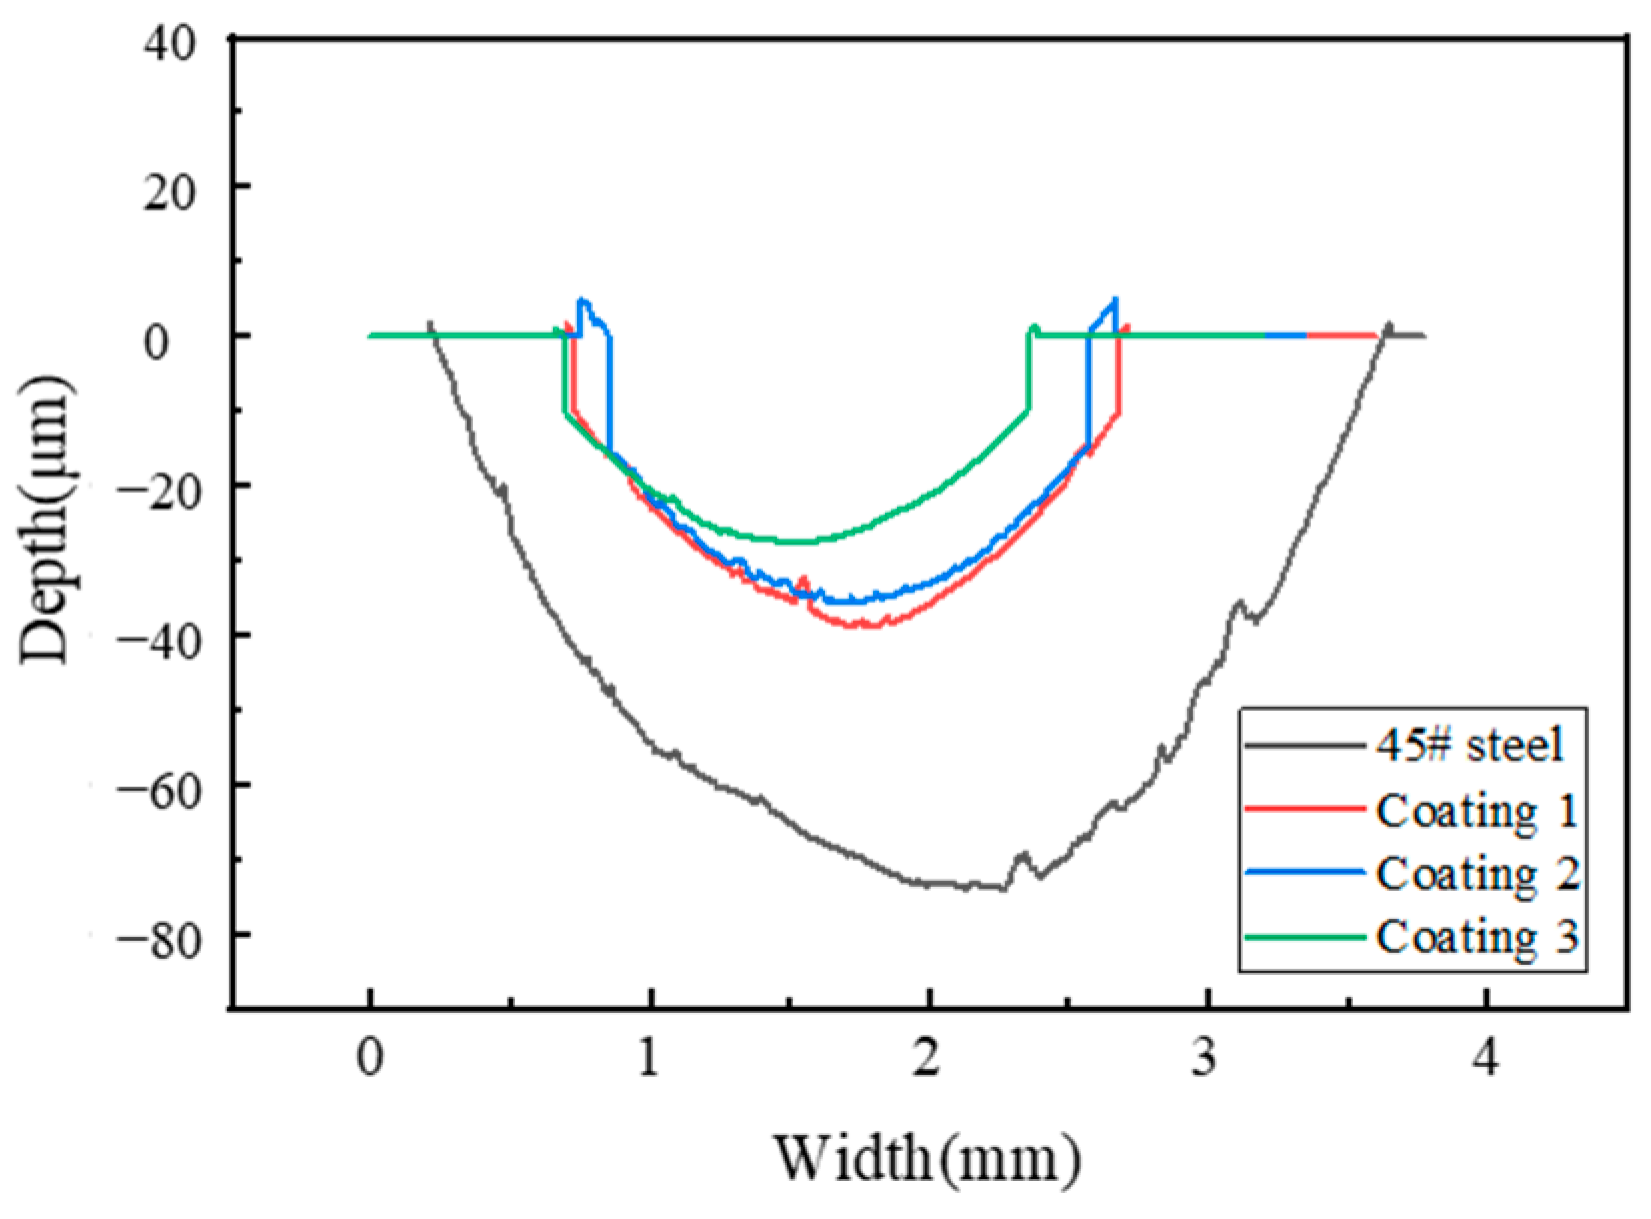
The friction and wear test results show that the wear resistance of Ni-based coating is much higher than that of 45# steel. The optimized coating has a smaller wear rate (0.92 × 10⁻⁵ mm3/Nm), shallower grooves and fewer spalling pits, as well as a smaller wear width and depth. The optimized coating has good wear resistance.
(4)
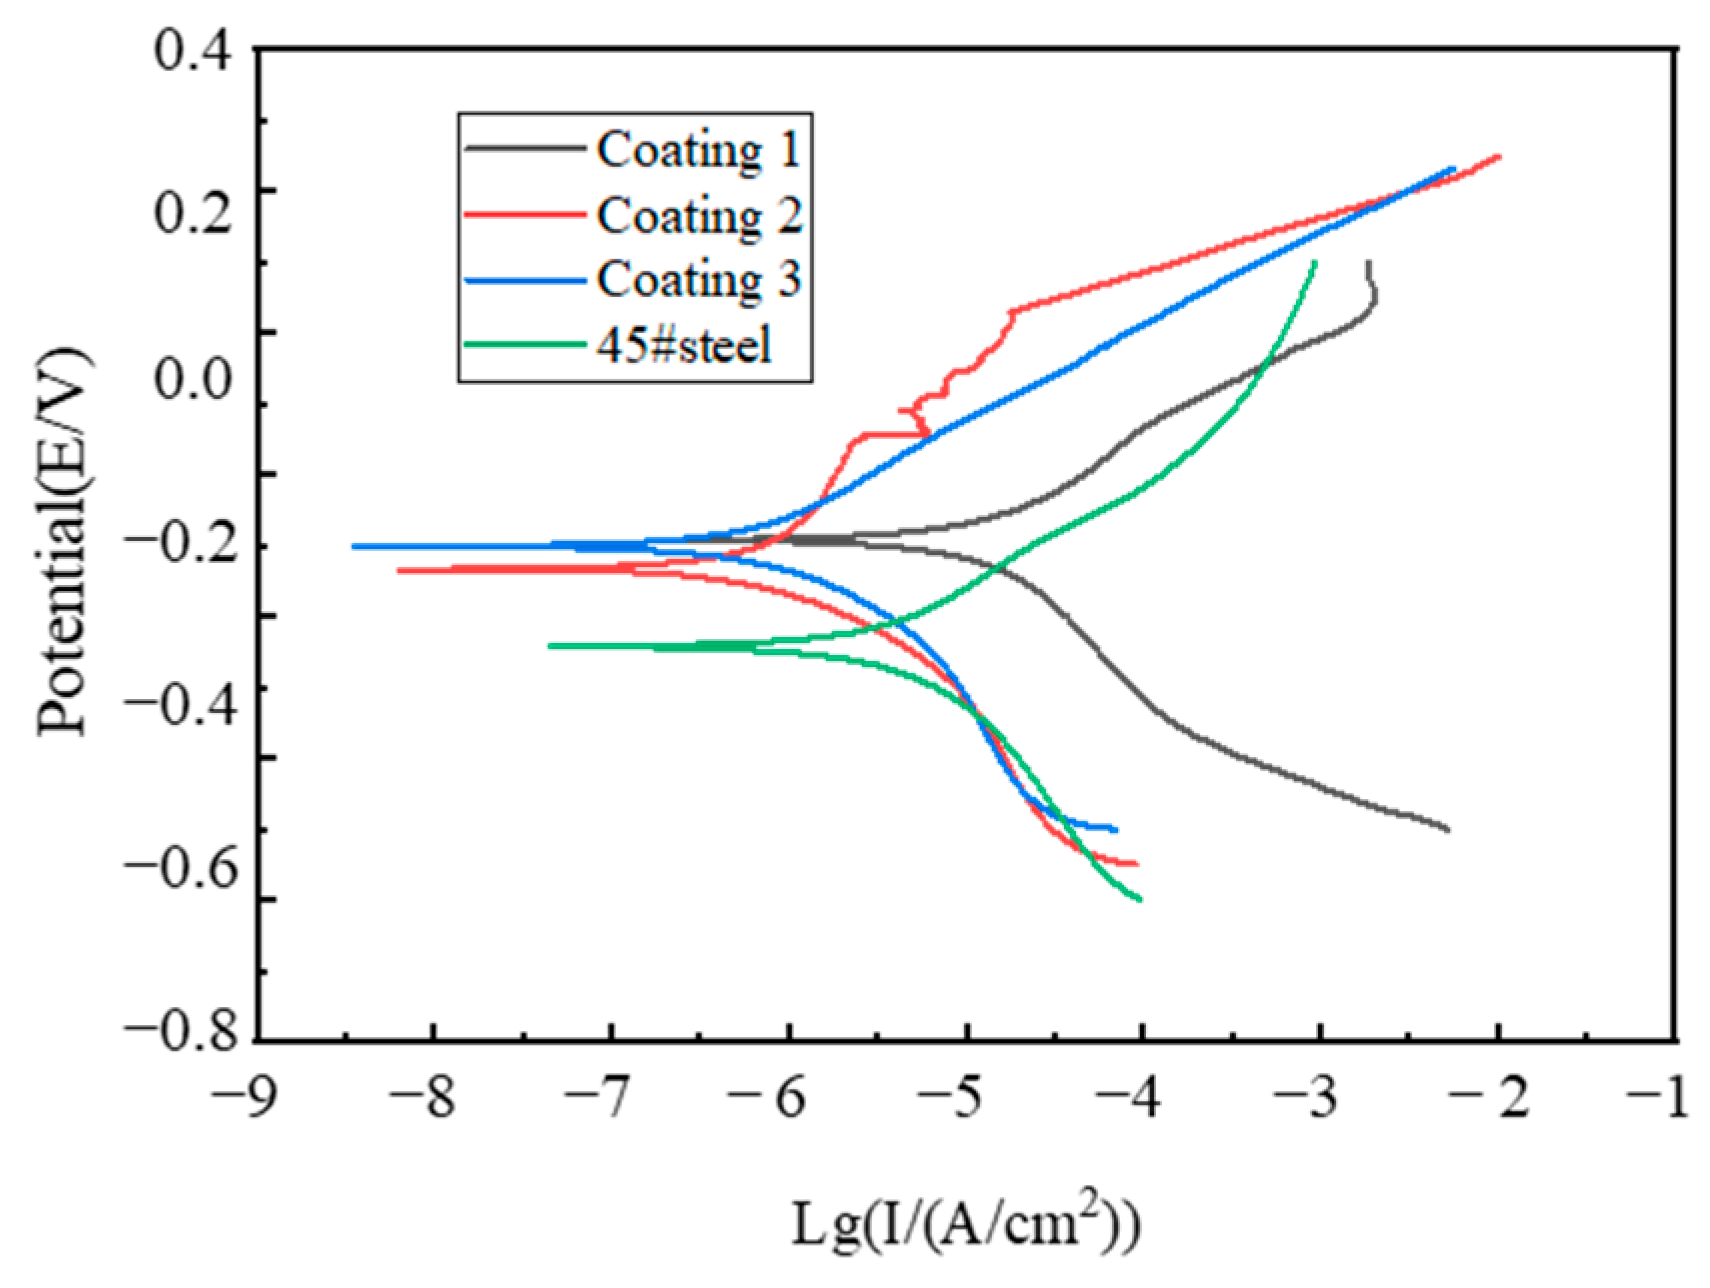
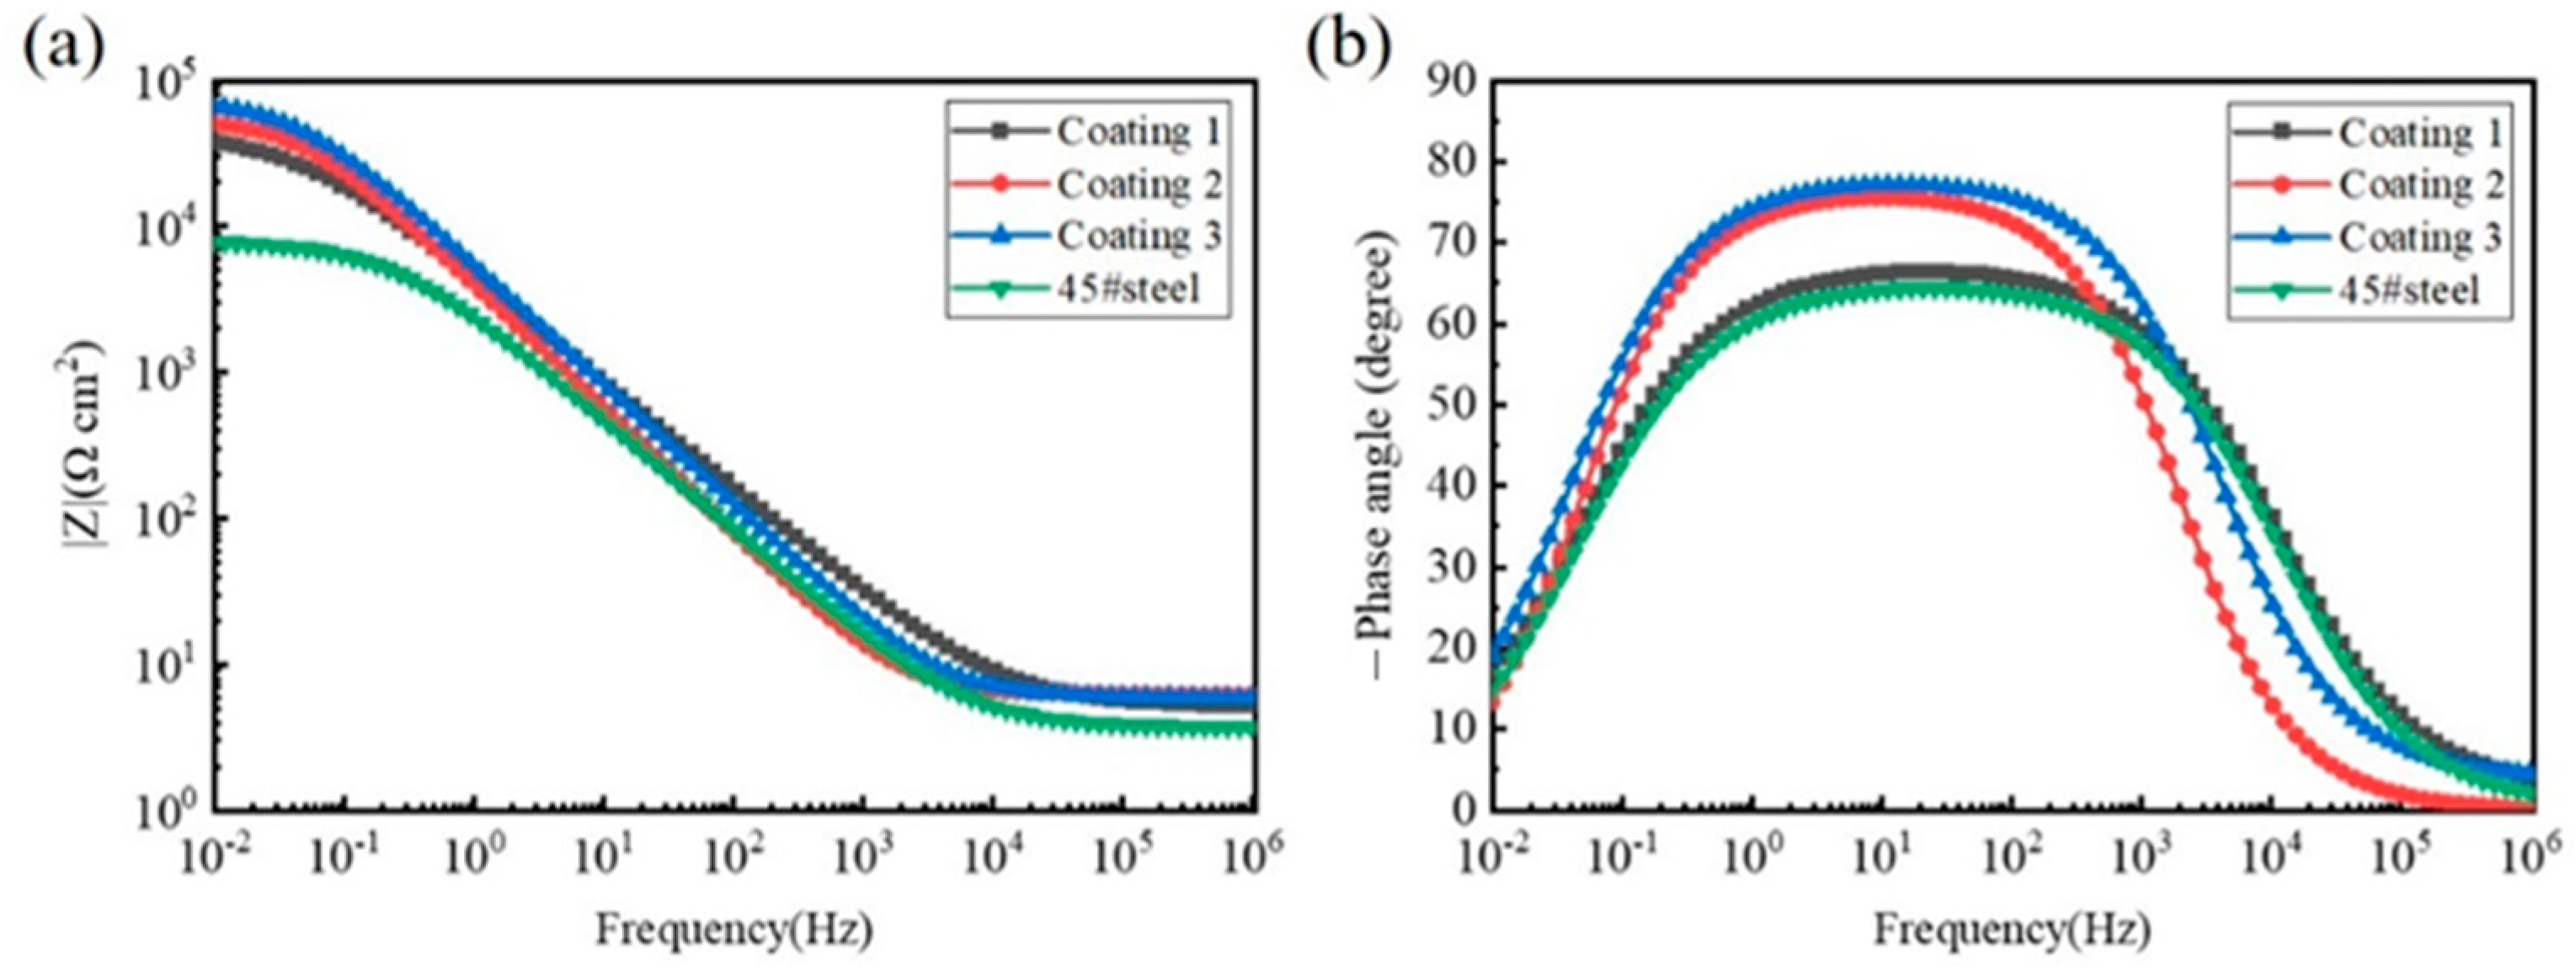
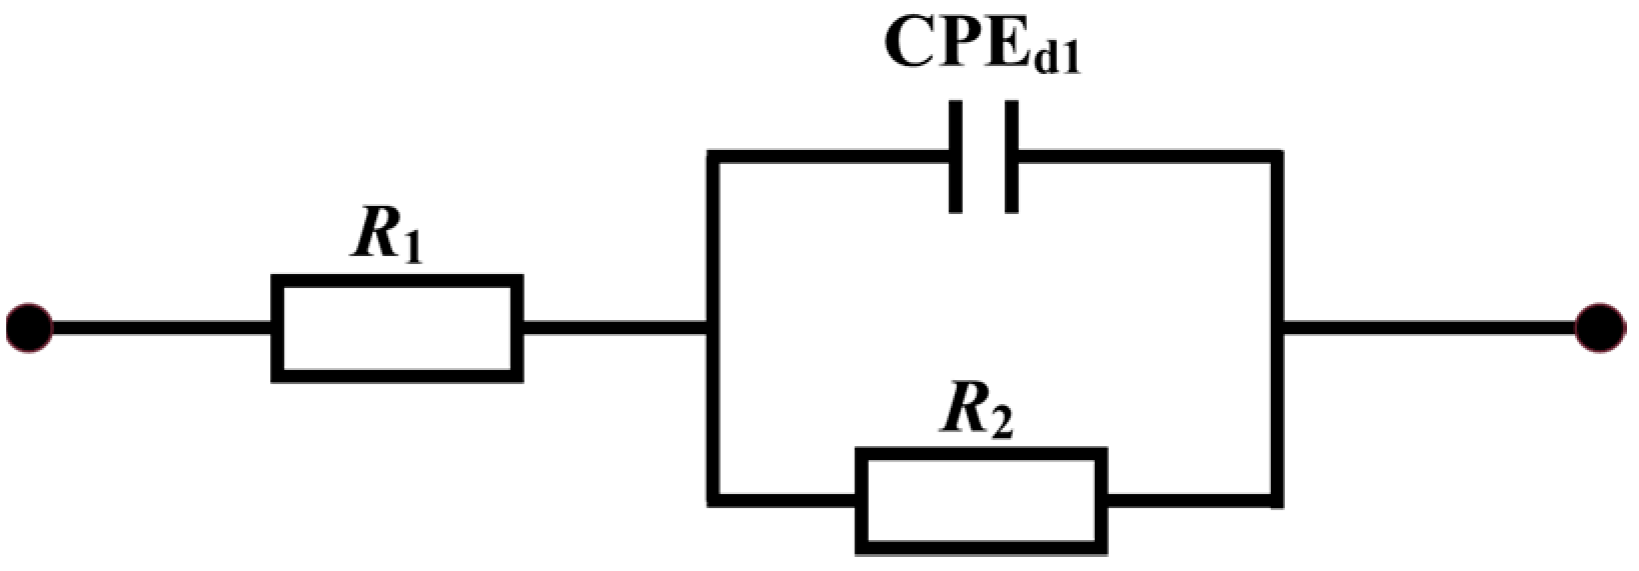
The electrochemical test results show that the corrosion resistance of the Ni-based coating is greatly improved due to the presence of Fe and Cr elements. And the optimized coating has a corrected self-corrosion potential, a smaller self-corrosion current density, a larger arc radius of capacitive reactance and a larger impedance modulus. The optimized coating has good corrosion resistance.
At present, laser cladding technology is widely used in all walks of life. However, the cladding parameters in the repair process are coupled with each other, and the repair quality and repair efficiency often cannot be both. Therefore, a multi-objective optimization method based on RSM is proposed in this paper, which can provide a certain basis for solving the multi-objective optimization problem of laser cladding.

Author Contributions

Conceptualization, T.L. and H.L.; methodology, T.L.; software, T.L., H.S. and H.L.; validation, H.S.; formal analysis, H.L., C.Q. and H.S.; investigation, T.L. and H.S.; resources, T.L., H.L. and Y.G.; data curation, H.S.; writing—original draft preparation, T.L.; writing—review and editing, H.L. and H.S.; visualization, H.L.; supervision, Y.G.; project administration, C.Q.; funding acquisition, H.L. and Y.G. All authors have read and agreed to the published version of the manuscript.

Funding

This work was supported by the Science Fund for Distinguished Young Scholars of Hebei Province (grant number. E2019209473); the Program for Top 100 Innovative Talents in Colleges and Universities of Hebei Province (grant number SLRC2019030).

Institutional Review Board Statement

Not applicable.

Informed Consent Statement

Not applicable.

Data Availability Statement

Not applicable.

Conflicts of Interest

The authors declare no conflict of interest.

References

  1. Li, G.S.; Wang, Z.Y.; Yao, L.G.; Xie, D.Z.; Chen, G. Concentration mixing and melt pool solidification behavior during the magnetic field assisted laser cladding of Fe-Cr-based alloy on 45 steel surface. Surf. Coat. Technol. 2022, 445, 128732. [Google Scholar] [CrossRef]
  2. Jiang, Y.X.; Xiao, L.R.; Zhai, P.Y.; Li, F.C.; Li, Y.M.; Zhang, Y.F.; Zhong, Q.; Cai, Z.Y.; Liu, S.N.; Zhao, X.J. Microstructure and properties of Cu-Cr-SiC in-situ composite coatings by laser cladding. Surf. Coat. Technol. 2023, 456, 129264. [Google Scholar] [CrossRef]
  3. Yuan, Q.; Chai, L.J.; Yang, T.; Wang, H.; Shen, J.; Guo, N.; Yin, X.; Xiao, J. Laser-clad FeCrAl/TiC composite coating on ferrite/martensitic steel: Significant grain refinement and wear resistance enhancement induced by adding TiC. Surf. Coat. Technol. 2023, 456, 129272. [Google Scholar] [CrossRef]
  4. Wang, H.Z.; Cheng, Y.H.; Yang, J.Y.; Liang, X.B. Microstructure and properties of Fe based amorphous coatings deposited by laser cladding under different preheating temperatures. J. Non-Cryst. Solids 2023, 602, 122081. [Google Scholar] [CrossRef]
  5. Wang, R.; Huang, Y.Y.; Wei, D.Q.; Luo, J.J.; Ren, X.L.; Li, X.K.; Lu, J.; Sui, X.M. Scanning electron beam surface strengthening of column-faced 45 steel. Mater. Lett. 2022, 324, 132497. [Google Scholar] [CrossRef]
  6. Huang, G.K.; Qu, L.D.; Lu, Y.Z.; Wang, Y.Z.; Li, H.G.; Qin, Z.X.; Lu, X. Corrosion resistance improvement of 45 steel by Fe-based amorphous coating. Vacuum 2018, 153, 39–42. [Google Scholar] [CrossRef]
  7. Liu, Q.S.; Liu, X.B.; Wang, G.; Liu, Y.F.; Meng, Y.; Zhang, S.H. Effect of Cu content on microstructure evolution and tribological behaviors of Ni60 composite coatings on 45# steel by laser cladding. Opt. Laser Technol. 2022, 156, 108549. [Google Scholar]
  8. Zhou, H.M.; Chen, Z.X.; Li, M.F.; Zhu, Y.X.; Xu, C.X.; Zhou, J.H. Effect of magnetic-electric-ultrasonic fields on microstructure and properties of Ni60A laser cladding coating. Mater. Lett. 2022, 14, 100132. [Google Scholar] [CrossRef]
  9. Cao, J.L.; Yang, X.F.; Wang, S.R.; Zhang, H.; Yang, L.Y.; Qiao, Y.; Li, C.C. Wear and corrosion resistance of laser cladding Ni60-TiC ceramic coating on 45 steel surface. Rare Metal. Mater. Eng. 2020, 49, 611–617. [Google Scholar]
  10. Chen, W.J.; Yang, X.C.; Li, X.M.; Chai, C.; Liu, W.B. Study on Microstructure and Properties of Nickel-Based Self-Lubricating Coating by Laser Cladding. Coatings 2022, 12, 753. [Google Scholar] [CrossRef]
  11. Yu, T.; Chen, J.; Wen, Y.M.; Deng, Q.L. High temperature phase stability and wear behavior of laser clad Ta reinforced NiCrBSi coating. Appl. Surf. Sci. 2021, 547, 149171. [Google Scholar] [CrossRef]
  12. Hulka, I.; Utu, D.; Serban, V.A.; Negrea, P.; Lukáč, F.; Chráska, T. Effect of Ti addition on microstructure and corrosion properties of laser cladded WC-Co/NiCrBSi(Ti) coatings. Appl. Surf. Sci. 2020, 504, 144349. [Google Scholar] [CrossRef]
  13. Deng, D.W.; Li, T.S.; Huang, Z.Y.; Jiang, H.; Yang, S.H.; Zhang, Y. Multi-response optimization of laser cladding for TiC particle reinforced Fe matrix composite based on Taguchi method and grey relational analysis. Opt. Laser Technol. 2022, 153, 108259. [Google Scholar] [CrossRef]
  14. Liu, Y.; Xu, T.H.; Li, G.H.; Li, Z.Y.; Du, F.M.; Chen, G.B. A multi-objective optimization of laser cladding process of Ni-based coating on the preheated copper alloy. Mater. Today Commun. 2023, 35, 105614. [Google Scholar] [CrossRef]
  15. Gao, Q.; Liu, H.; Chen, P.J.; Liu, X.H.; Yang, H.F.; Hao, J.B. Multi-objective optimization for laser cladding refractory MoNbTiZr high-entropy alloy coating on Ti6Al4V. Opt. Laser Technol. 2023, 161, 109220. [Google Scholar] [CrossRef]
  16. Guo, C.G.; He, S.Z.; Yue, H.T.; Li, Q.; Hao, G.B. Prediction modelling and process optimization for forming multi-layer cladding structures with laser directed energy deposition. Opt. Laser Technol. 2021, 134, 106607. [Google Scholar] [CrossRef]
  17. Yong, Z.; Chang, L.L.; Jiang, S.C.; Xie, D.Q.; Xing, F.; Shen, H.; Shen, L.D.; Tian, Z.Q. Parameter optimization of T800 coating fabricated by EHLA based on response surface methodology. Opt. Laser Technol. 2023, 158, 108837. [Google Scholar] [CrossRef]
  18. Wang, Q.; Zhai, L.L.; Zhang, L.; Zhang, J.W.; Ban, C.Y. Effect of steady magnetic field on microstructure and properties of laser cladding Ni-based alloy coating. J. Mater. Res. Technol. 2022, 17, 2145–2157. [Google Scholar] [CrossRef]
  19. Wang, Z.D.; Zhou, H.M.; Chen, Z.X.; Zhu, Y.X.; He, F.J.; Xiang, N.X.; Wang, Y.H. Study on the effect of electromagnetic field on the segregation and structural property of Ni60 cladding layer. Optik 2023, 272, 170279. [Google Scholar] [CrossRef]
  20. Cai, Y.C.; Luo, Z.; Feng, M.N.; Liu, Z.M.; Huang, Z.Y.; Zeng, Y.D. The effect of TiC/Al2O3 composite ceramic reinforcement on tribological behavior of laser cladding Ni60 alloys coatings. Surf. Coat. Technol. 2016, 291, 222–229. [Google Scholar] [CrossRef]
  21. Li, T.K.; Long, H.Y.; Qiu, C.M.; Wang, M.M.; Li, D.D.; Dong, Z.; Gui, Y.L. Multi-Objective Optimization of Process Parameters of 45 Steel Laser Cladding Ni60PTA Alloy Powder. Coatings 2022, 12, 939. [Google Scholar] [CrossRef]
  22. Han, B.Y.; Gao, X.H.; Chen, S.Y.; Cong, M.Q.; Li, R.X.; Liu, X.; Hang, W.X.; Cui, F.F. Microstructure and tribological behavior of plasma spray Ni60 alloy coating deposited on ZL109 aluminum alloy substrate. Tribol. Int. 2022, 175, 107859. [Google Scholar] [CrossRef]
  23. Karuppasamy, S.S.; Jeyaprakash, N.; Yang, C.H. Microstructure, nanoindentation and corrosion behavior of colmonoy-5 deposition on SS410 substrate using laser cladding process. Arab. J. Sci. Eng. 2022, 47, 8751–8767. [Google Scholar] [CrossRef]
  24. Dai, P.Q.; Xiang, Z.N.; Chen, W.Z. Improved corrosion resistance of brush plated nanocrystalline Ni-Fe alloy coatings in 3·5 wt-% NaCl solution. Surf. Eng. 2011, 27, 61–64. [Google Scholar] [CrossRef]
  25. Zhai, L.L.; Ban, C.Y.; Zhang, J.W. Microstructure, microhardness and corrosion resistance of NiCrBSi coatings under electromagnetic field auxiliary laser cladding. Surf. Coat. Technol. 2019, 358, 531–538. [Google Scholar] [CrossRef]
Figure 1. Morphology and particle size distribution of Ni-based alloy powder. (a) Microstructure; (b) Particle size distribution.
Coatings 13 01216 g001
Figure 2. Morphology of laser cladding layer.
Coatings 13 01216 g002
Figure 3. The graph comparing the predicted and tested values of the response target. (a) Dilution rate; (b) Aspect ratio; (c) Contact angle.
Coatings 13 01216 g003
Figure 4. Effects of interaction of process parameters on dilution rate, aspect ratio and contact angle. (ac) Contour plots of laser power and scanning speed with respect to dilution rate, aspect ratio and contact angle; (df) 3D response curves of laser power and scanning speed to dilution rate, aspect ratio and contact angle.
Coatings 13 01216 g004
Figure 5. Morphology of the optimized coating. (a) Cross section morphology; (b) Low-magnification morphology; (c) High-magnification microstructure; (d) Binding zone morphology.
Coatings 13 01216 g005
Figure 6. Friction coefficient curve of 45# steel and Ni-based coating.
Coatings 13 01216 g006
Figure 7. Average friction coefficient of 45# steel and Ni-based coating.
Coatings 13 01216 g007
Figure 8. Wear rate of 45# steel and Ni-based coatings.
Coatings 13 01216 g008
Figure 9. Worn surfaces of 45# steel and Ni-based coatings. (a) 45# steel; (b) Coating 1; (c) Coating 2; (d) Coating 3.
Coatings 13 01216 g009
Figure 10. 3D profile of wear of 45# steel and Ni-based coating. (a) 45# steel; (b) Coating 1; (c) Coating 2; (d) Coating 3.
Coatings 13 01216 g010
Figure 11. Width and depth of wear on 45# steel and Ni-based coatings.
Coatings 13 01216 g011
Figure 12. Tafel curves of 45# steel and Ni-based coatings.
Coatings 13 01216 g012
Figure 13. Nyquist curve of 45# steel and Ni-based coatings.
Coatings 13 01216 g013
Figure 14. Bode curve for 45# steel and Ni-based coatings. (a) Impedance frequency diagram; (b) Phase frequency diagram.
Coatings 13 01216 g014
Figure 15. Equivalent circuit.
Coatings 13 01216 g015
Table 1. Chemical composition of 45# steel (wt. %).
ElementCSiMnPSCrNiFe
45# steel0.420.20.70.0250.0240.230.14Bal.
Table 2. Chemical composition of NiCrBSi powder (wt. %).
ElementCSiCrFeBMoNi
NiCrBSi powder1.215.8320.174.132.790.21Bal.
Table 3. Laser process parameters and factor levels.
Level of Factor−10+1
Laser power (W)140015001600
Feeding rate (mg/s)161820
Scanning speed (mm/s)345
Table 4. BBD test scheme and results.
StdLaser Power
(W)
Powder Feeding Rate
(mg/s)
Scanning Speed
(mm/s)
Dilution RateAspect RatioContact Angle (°)
114001640.0814.04138.65
216001640.1184.93145.85
314002040.0823.88137.64
416002040.1164.95144.07
514001830.0873.15132.89
616001830.1213.47136.43
714001850.0784.82141.99
816001850.1135.71150.55
915001630.1103.26134.44
1015002030.1093.38135.67
1115001650.0895.69149.91
1215002050.0955.63149.87
1315001840.0954.78146.22
1415001840.0864.60144.22
1515001840.0894.83145.85
1615001840.0914.99147.27
1715001840.0954.64146.19
Table 5. Variables of three models.
Model VariableR2Adjusted R2Predicted R2Signal-to-Noise Ratio
Dilution rate0.96660.92370.741516.06
Aspect ratio0.97800.94980.772820.29
Contact angle0.97670.94670.759719.29
Table 6. Optimization conditions and objectives.
Variables or ResponsesGoalLower LimitUpper LimitImportance
Laser powerIn range140016003
Powder feeding rateIn range16203
Scanning speedIn range353
Dilution ratioMinimize0.0780.1215
Aspect ratioMaximize3.155.713
Contact angleMaximize132.89150.554
Table 7. Process parameters of the selected coating.
Sample No.Laser Power (W)Scanning Speed (mm/s)Powder Feeding Rate (mg/s)
Coating 11400416
Coating 21600518
Coating 31477517.5
Table 8. Fitting results of coating polarization curve.
SamplesEcorr/VIcorr/(A/cm2)
Coting 1−0.3011.794 × 10−5
Coting 2−0.3341.19 × 10−6
Coting 3−0.2927.623 × 10−7
45# steel−0.4414.125 × 10−6
Table 9. Electrochemical impedance fitting results of cladding layers and substrate.
SamplesR1/(Ω·cm2)R2/(kΩ·cm2)CPEd1/(μF·cm2)nd1
Coting 15.9278.393.94 × 10−40.83
Coting 26.1756.215.09 × 10−40.85
Coting 35.1344.055.66 × 10−40.73
45# steel5.508.1759.03 × 10−40.76
Disclaimer/Publisher’s Note: The statements, opinions and data contained in all publications are solely those of the individual author(s) and contributor(s) and not of MDPI and/or the editor(s). MDPI and/or the editor(s) disclaim responsibility for any injury to people or property resulting from any ideas, methods, instructions or products referred to in the content.

