1. Introduction
NiTi coating has been implemented on the surface of the samples for improving material properties. Different coating techniques were carried out via powder technology routes for this mechanism. The plasma spraying process has been widely used for the coating of materials in various forms, from gas welding to metal arc welding, and the spraying of molten metal or alloy powders on the surface of substrates [
1,
2,
3]. Thermal plasma technology opens the door to various branches of powder metallurgy for the improvement of material behavior [
4,
5]. This technique only solves the issue of surface protection, and may be able to recover metals from waste materials [
6]. Surface coating is performed at extremely high temperatures, excellent arc stability, low thermal distortion, and high coating speeds [
7]. In our previous works, we used plasma technology in spark plasma sintering to produce NiTi alloys under various conditions [
8]. The plasma spraying process was carried out for the investigation of the adhesion of the coating layer to the surface of substrates such as stainless steel [
9]. Modified techniques of the plasma spraying with cooler heads may play a role in controlling the proper microstructural of the alloy that is used in the present study to investigate its effect on the resulting coating properties. Argon gas is considered a central gas for creating plasma, as well as the carrier gas for powder particles feeding into the plasma arc. NiTi alloy is known as the most popular and practical shape memory alloy in engineering, medical, and orthopedic applications. NiTi coatings have also been used for wear resistance against corrosion and cavitation erosion in various applications [
10,
11,
12]. The cavitation erosion resistance of NiTi is much higher than that of the base material. So far, various coating methods such as laser, vacuum plasma spraying, high-velocity oxide fuel spraying, and plasma air spraying have emerged as potential methods of NiTi coating [
13,
14,
15].
In this study, NiTi was coated on the surface of graphite substrate (G280) with the aim of easy separation of the coating layer for microstructural study. Plasma spraying by radio frequency plasma is considered a heat source. NiTi coating was performed with different input power levels under Ar gas protection. Microstructural changes were observed and phase analysis was examined. The inner surface quality was examined as the subject of the graphite substrate, as well as possible contamination of the coating layers by the substrate. The hardness of the coating layer was examined as a function of the input power.
2. Materials and Methods
Graphite (G280, JAP Industries, Bystrice, Czech Republic) is considered the substrate for spraying NiTi powder using a plasma spraying process. Substrate dimensions of 60 × 20 × 3 mm were chosen. A thick coating of NiTi was deposited using a radio frequency inductively coupled plasma (RF-ICP, Tekna, Canada) facility from the Institute of Plasma Physics (IPP), Prague, Czech Republic.
Table 1 represents the various experimental parameters of the spraying process.
NiTi powder (50:50) with a purity of 99.5% was purchased from American Elements MERELEX Corporation (Los Angeles, CA, USA) for the coating. The elemental composition of the Ni:Ti powders was 50:50 (atom%). NiTi particles are spherical in shape and size.
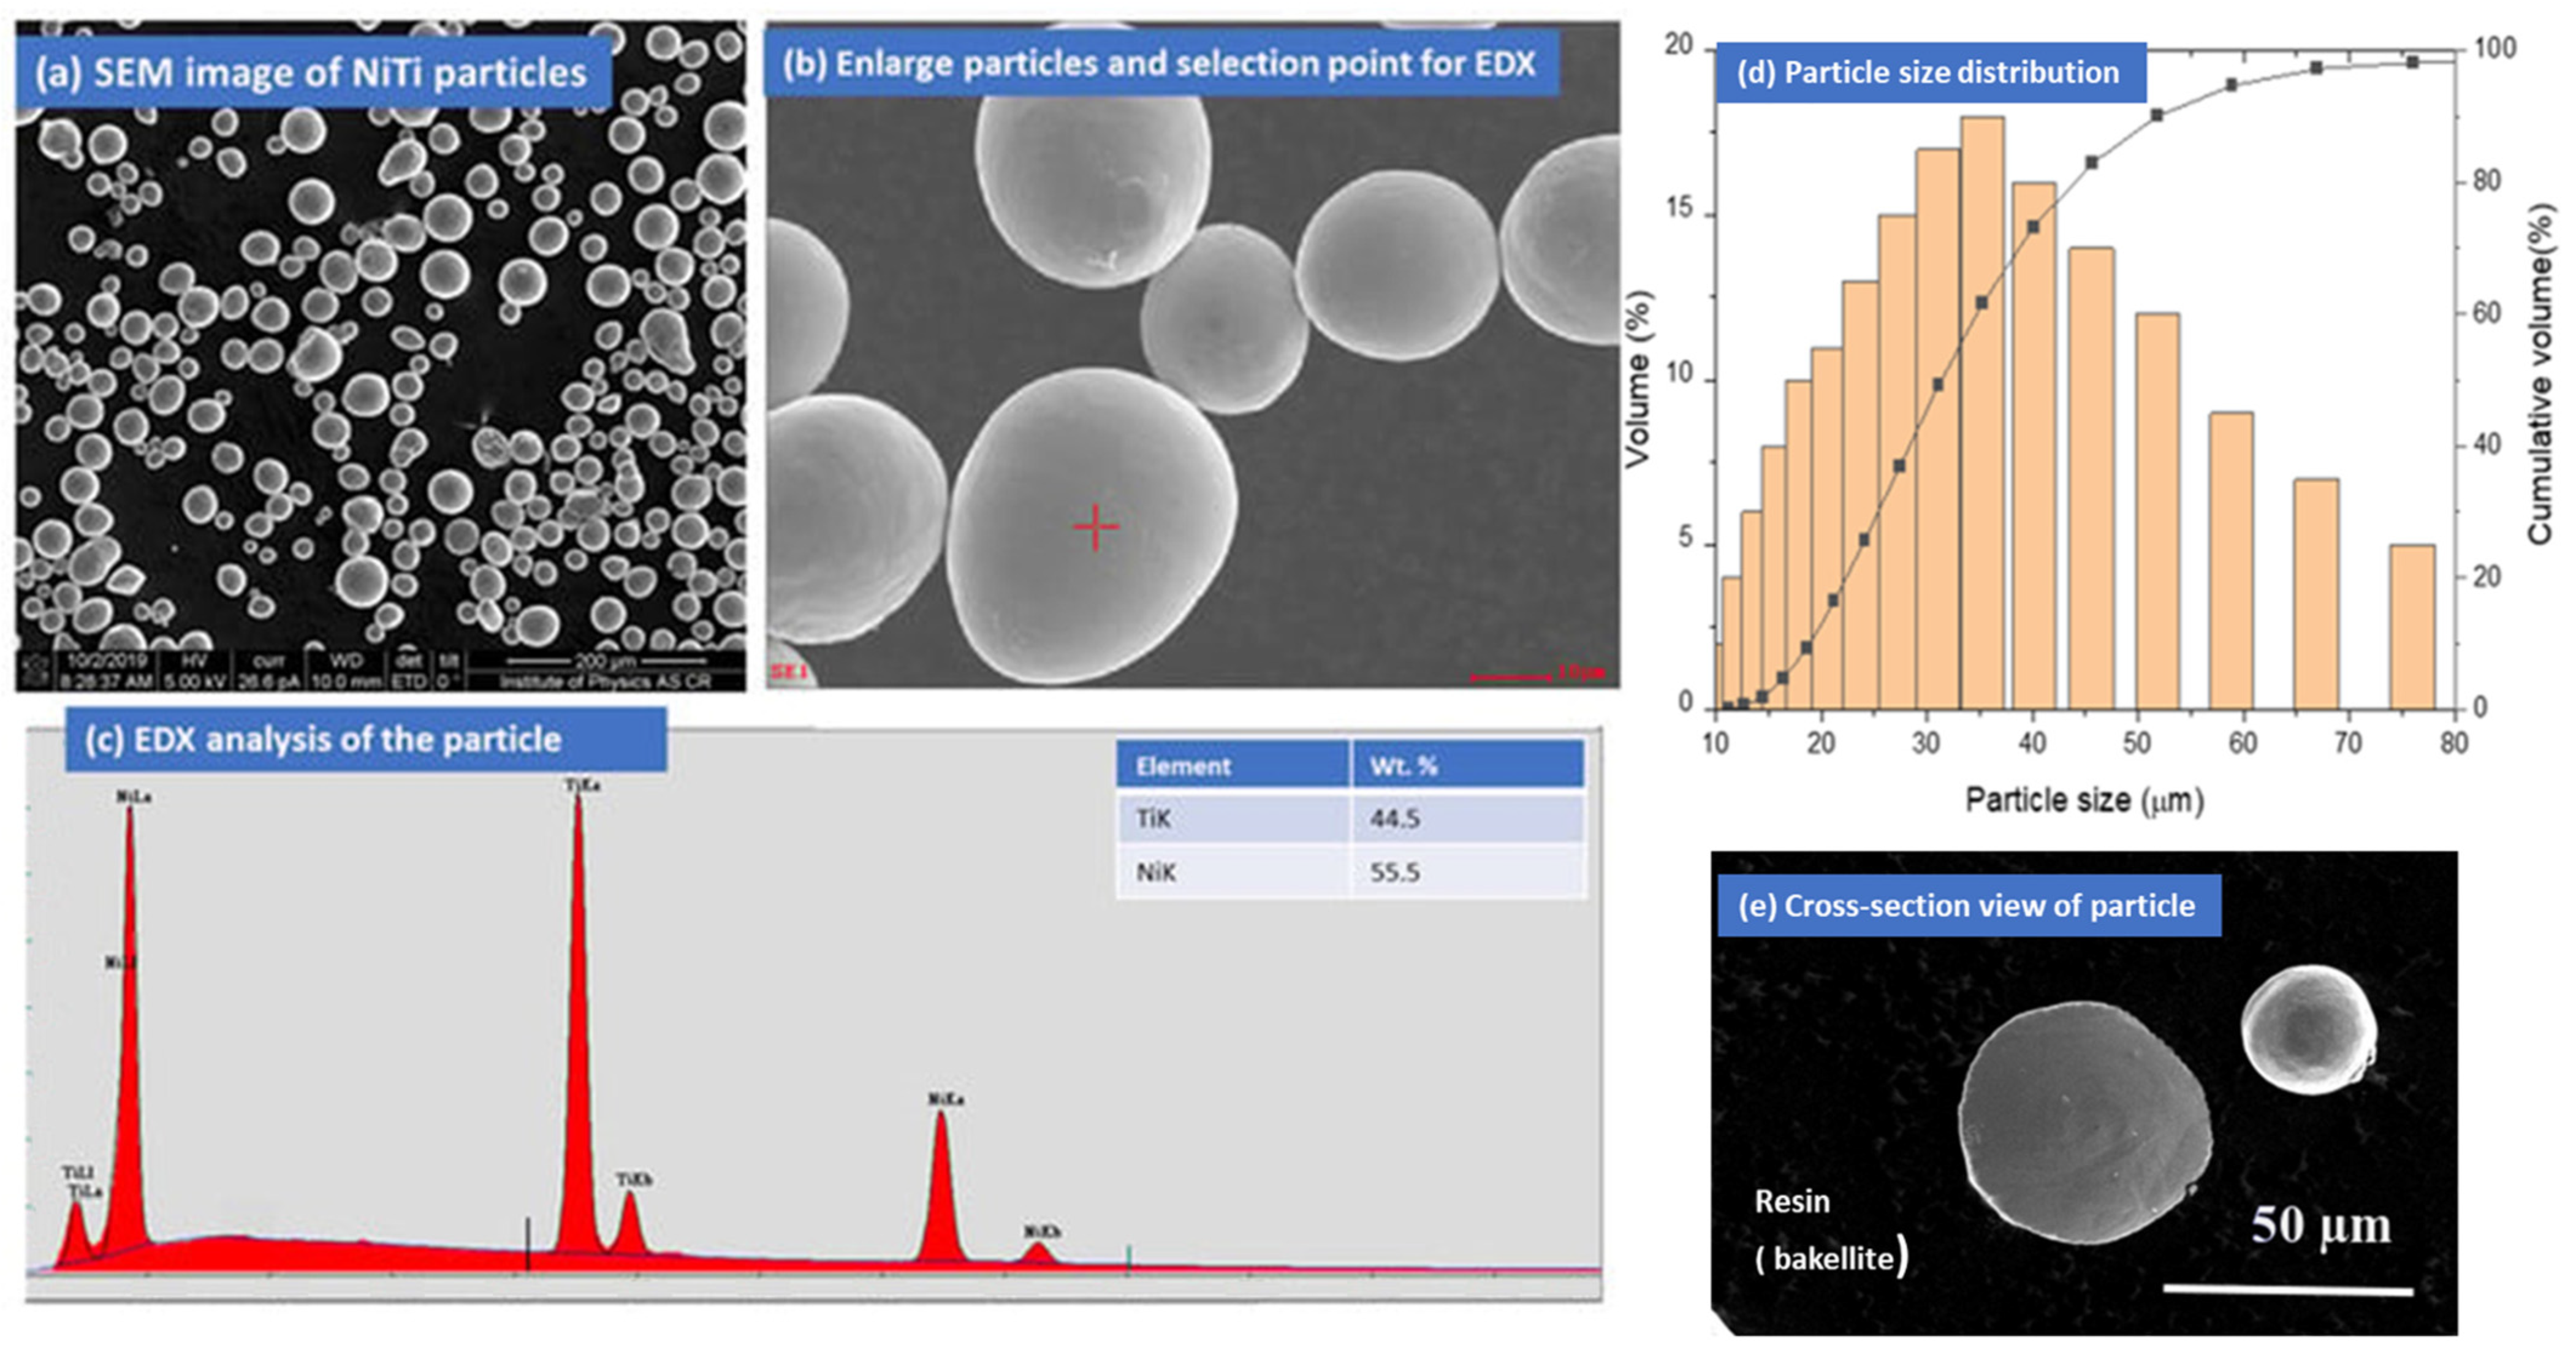
Figure 1a–c shows an image of the NiTi powder and its elemental composition. The purity of the powder is 99.9%, with particle size distribution of 20–63 µm. The chemical composition is provided by the manufacturer, with the following analysis of the minor elements: (%) Fe ≤ 0.01, Al ≤ 0.001, Cu ≤ 0.002, Si ≤ 0.001, Ca ≤ 0.001, C ≤ 0.004, O ≤ 0.07, N ≤ 0.005. (American Elements, MERELEX Corporation, Los Angeles, CA, USA). The particles are considered to be within good dispersion range for homogenous coating layers. The particle size distribution is shown in
Figure 1c. A cross-section of the particle is shown without any porosity or contamination (
Figure 1d).
NiTi powders were inserted into the plasma arc by the powder feeder using various feeding rates (2.1, 4.2 g/min) that allow the impact of molten particles on the graphite substrate to form the coatings. Spraying was performed in six steps that allow the formation of thick coating layers on the graphite substrate. The plasma power and feeding rate control the extent of melting into a fully or partially melted splat to impact the substrate. Metallographic examination of the coated layers was performed by initially grinding the substrate of graphite for separation, followed by grinding and polishing to a 1 µm diamond paste. The scanning electron microscope image was observed using a scanning electron microscope (SEM, Tescan FERA 3 (Tescan, Brno, Czech Republic). The images were investigated via both modes of observation, using secondary electrons and backscattered electrons. Energy-dispersive X-ray spectroscopy (EDS) was carried out using the EDAX system (EDAX, Ametek Inc., Mahwah, NJ, USA) with an Octane Super 60 mm2 detector to determine the chemical composition of the substrate and coating. The phase analysis of the coating layers was performed at room temperature with an X’Pert PRO θ-θ powder diffractometer, using Bragg–Brentano geometry, at 40 mA and 35 kV with CoKα radiation (average wavelength λ = 0.1790 nm), a focus–slit distance of 100 mm, and a goniometer radius of 240 mm. The data were measured in the 2θ range of 20–120°, using a step size of 0.013°, a scan step time of 1.4 s, and a fixed divergence slit size of 0.5°. The phase transformation temperatures of coating layers were carried out using differential scanning calorimetry (DSC 25, TA Instruments, New Castle, DE, USA) at a heating and cooling rate of 5 °C/min, in a temperature range of −50 to +150 °C, in a nitrogen environment inside the sample chamber. The shape memory behaviour of the coating was investigated via thermo-mechanical analysis in bending mode, with a static load of 100 mN, from −50 to +150 °C in a temperature cycle. The microhardness of the coating on the surface and cross-section was investigated using a Vickers hardness tester, for a force of 1.961 N for a duration of 10 s.
3. Results and Discussion
The characterization of coatings was investigated in terms of microstructural analysis, the thermal transformation of the phases in the materials, and mechanical deformation as a function of thermal cycles, in order to understand the behavior of shape memory as a functional property.
3.1. Microstructural Investigation of Coatings
The quality of the coating is investigated by observing a cross-section image of various layers and the surface of the samples. Samples were carefully ground and polished effectively to avoid any contamination from the substrate toward the coating layers. Coating layer thicknesses of 1.5 mm and 2 mm were obtained for 12- and 9-kW input power, respectively.
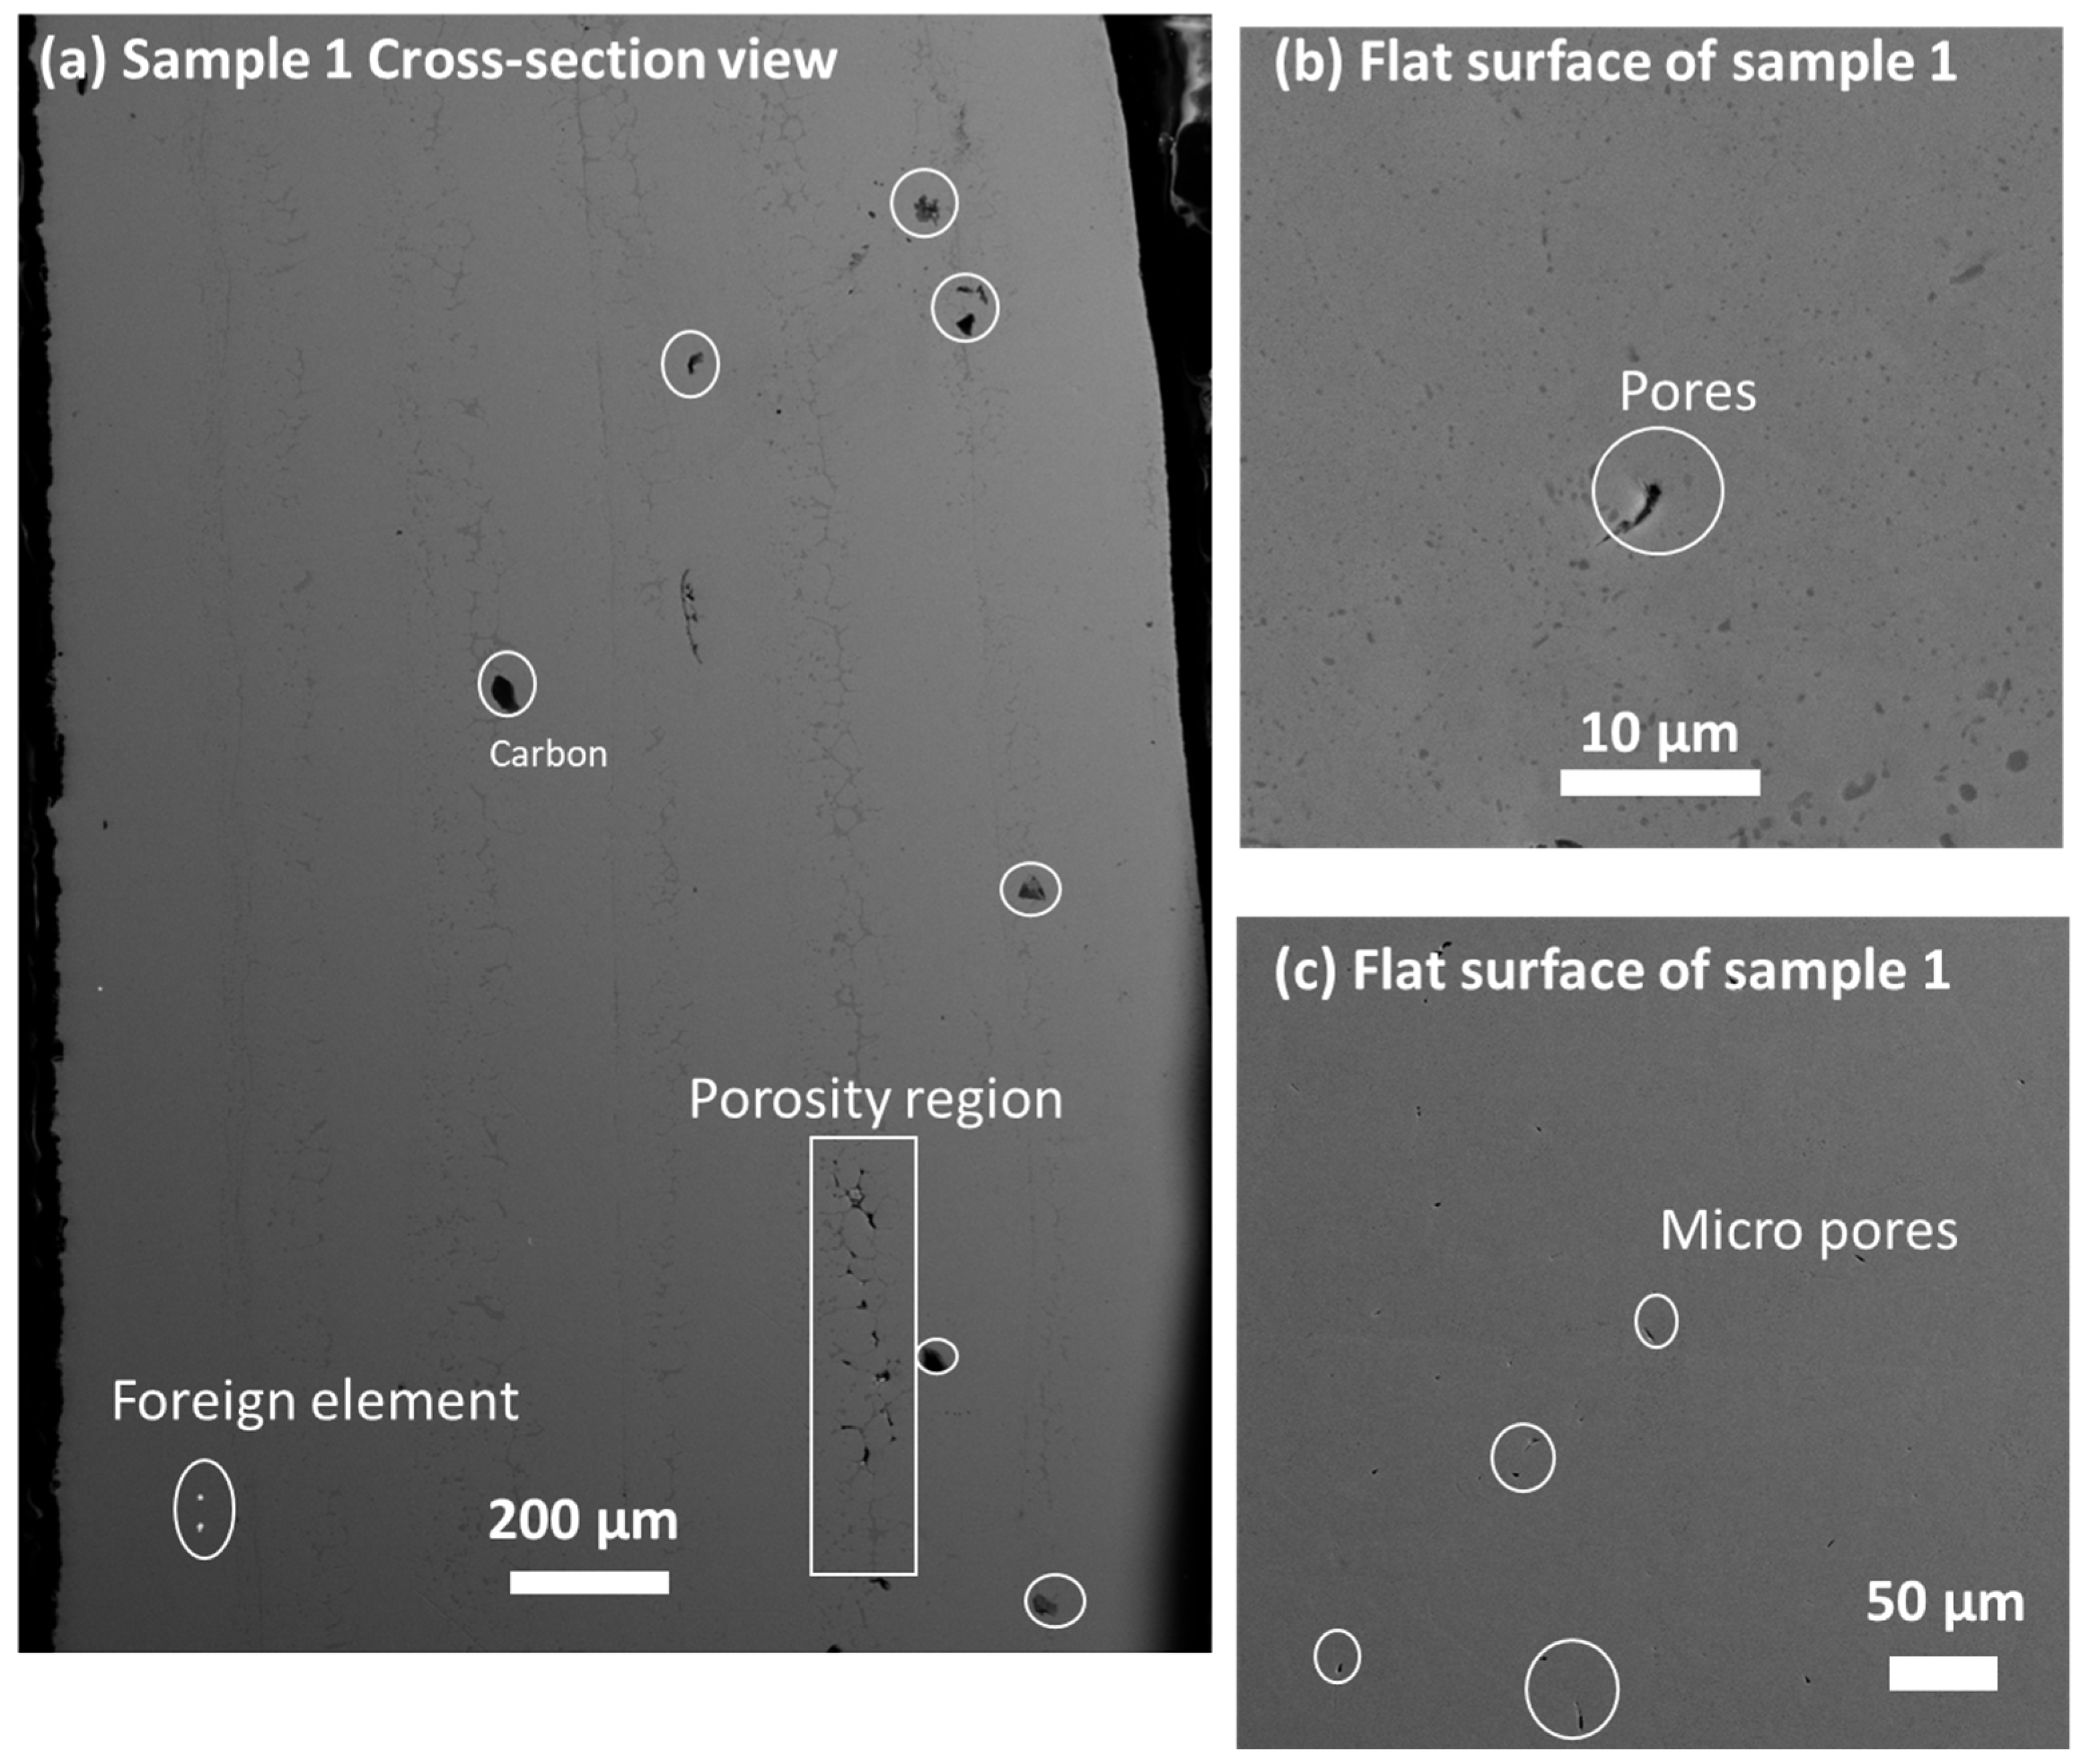
Figure 2a–c displays the sample 1 microstructure in a cross-section image and flat surface image. The cross-section view shows some areas of porosity and carbon particle contamination. The surface area shows the presence of micropores in the samples. The sample looks good, with minor contamination. However, sample 2 shows more contamination in comparison to sample 1.
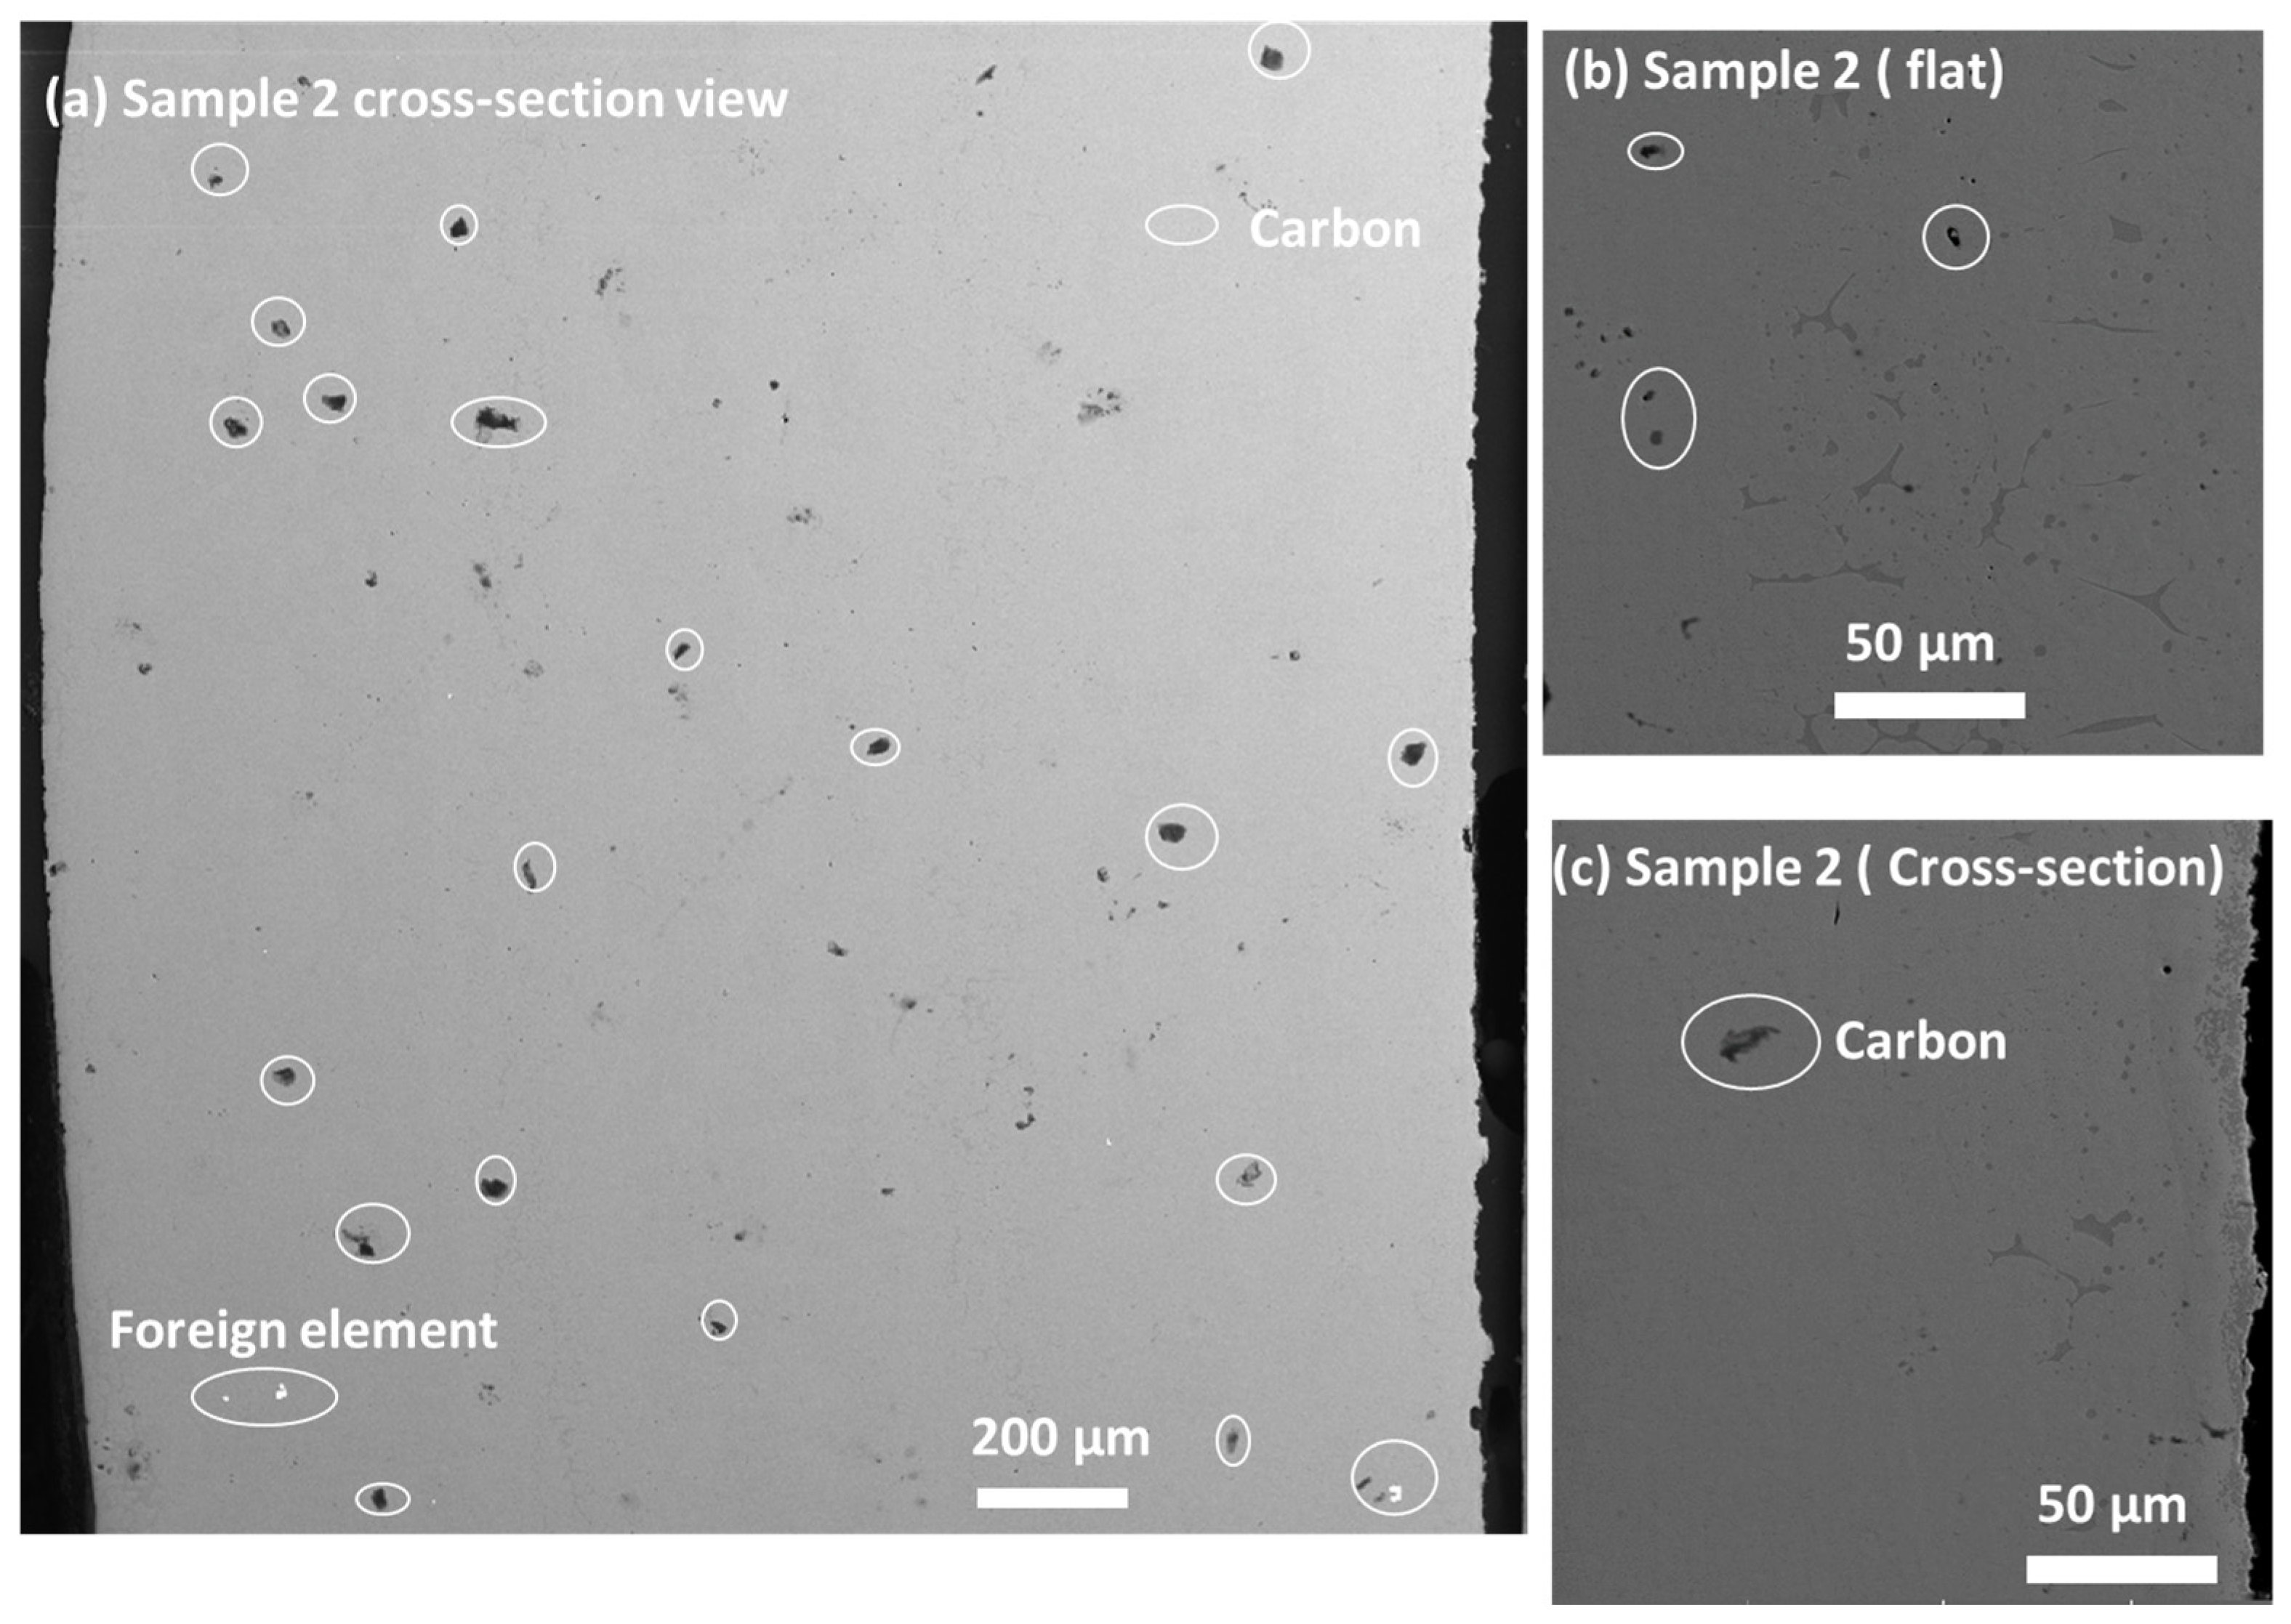
Figure 3a–c shows the cross-sectional and surface view of the sample. The presence of carbon particles is visible throughout the thickness. The surface of sample 2 looks fine, with some minor contamination with carbon particles.
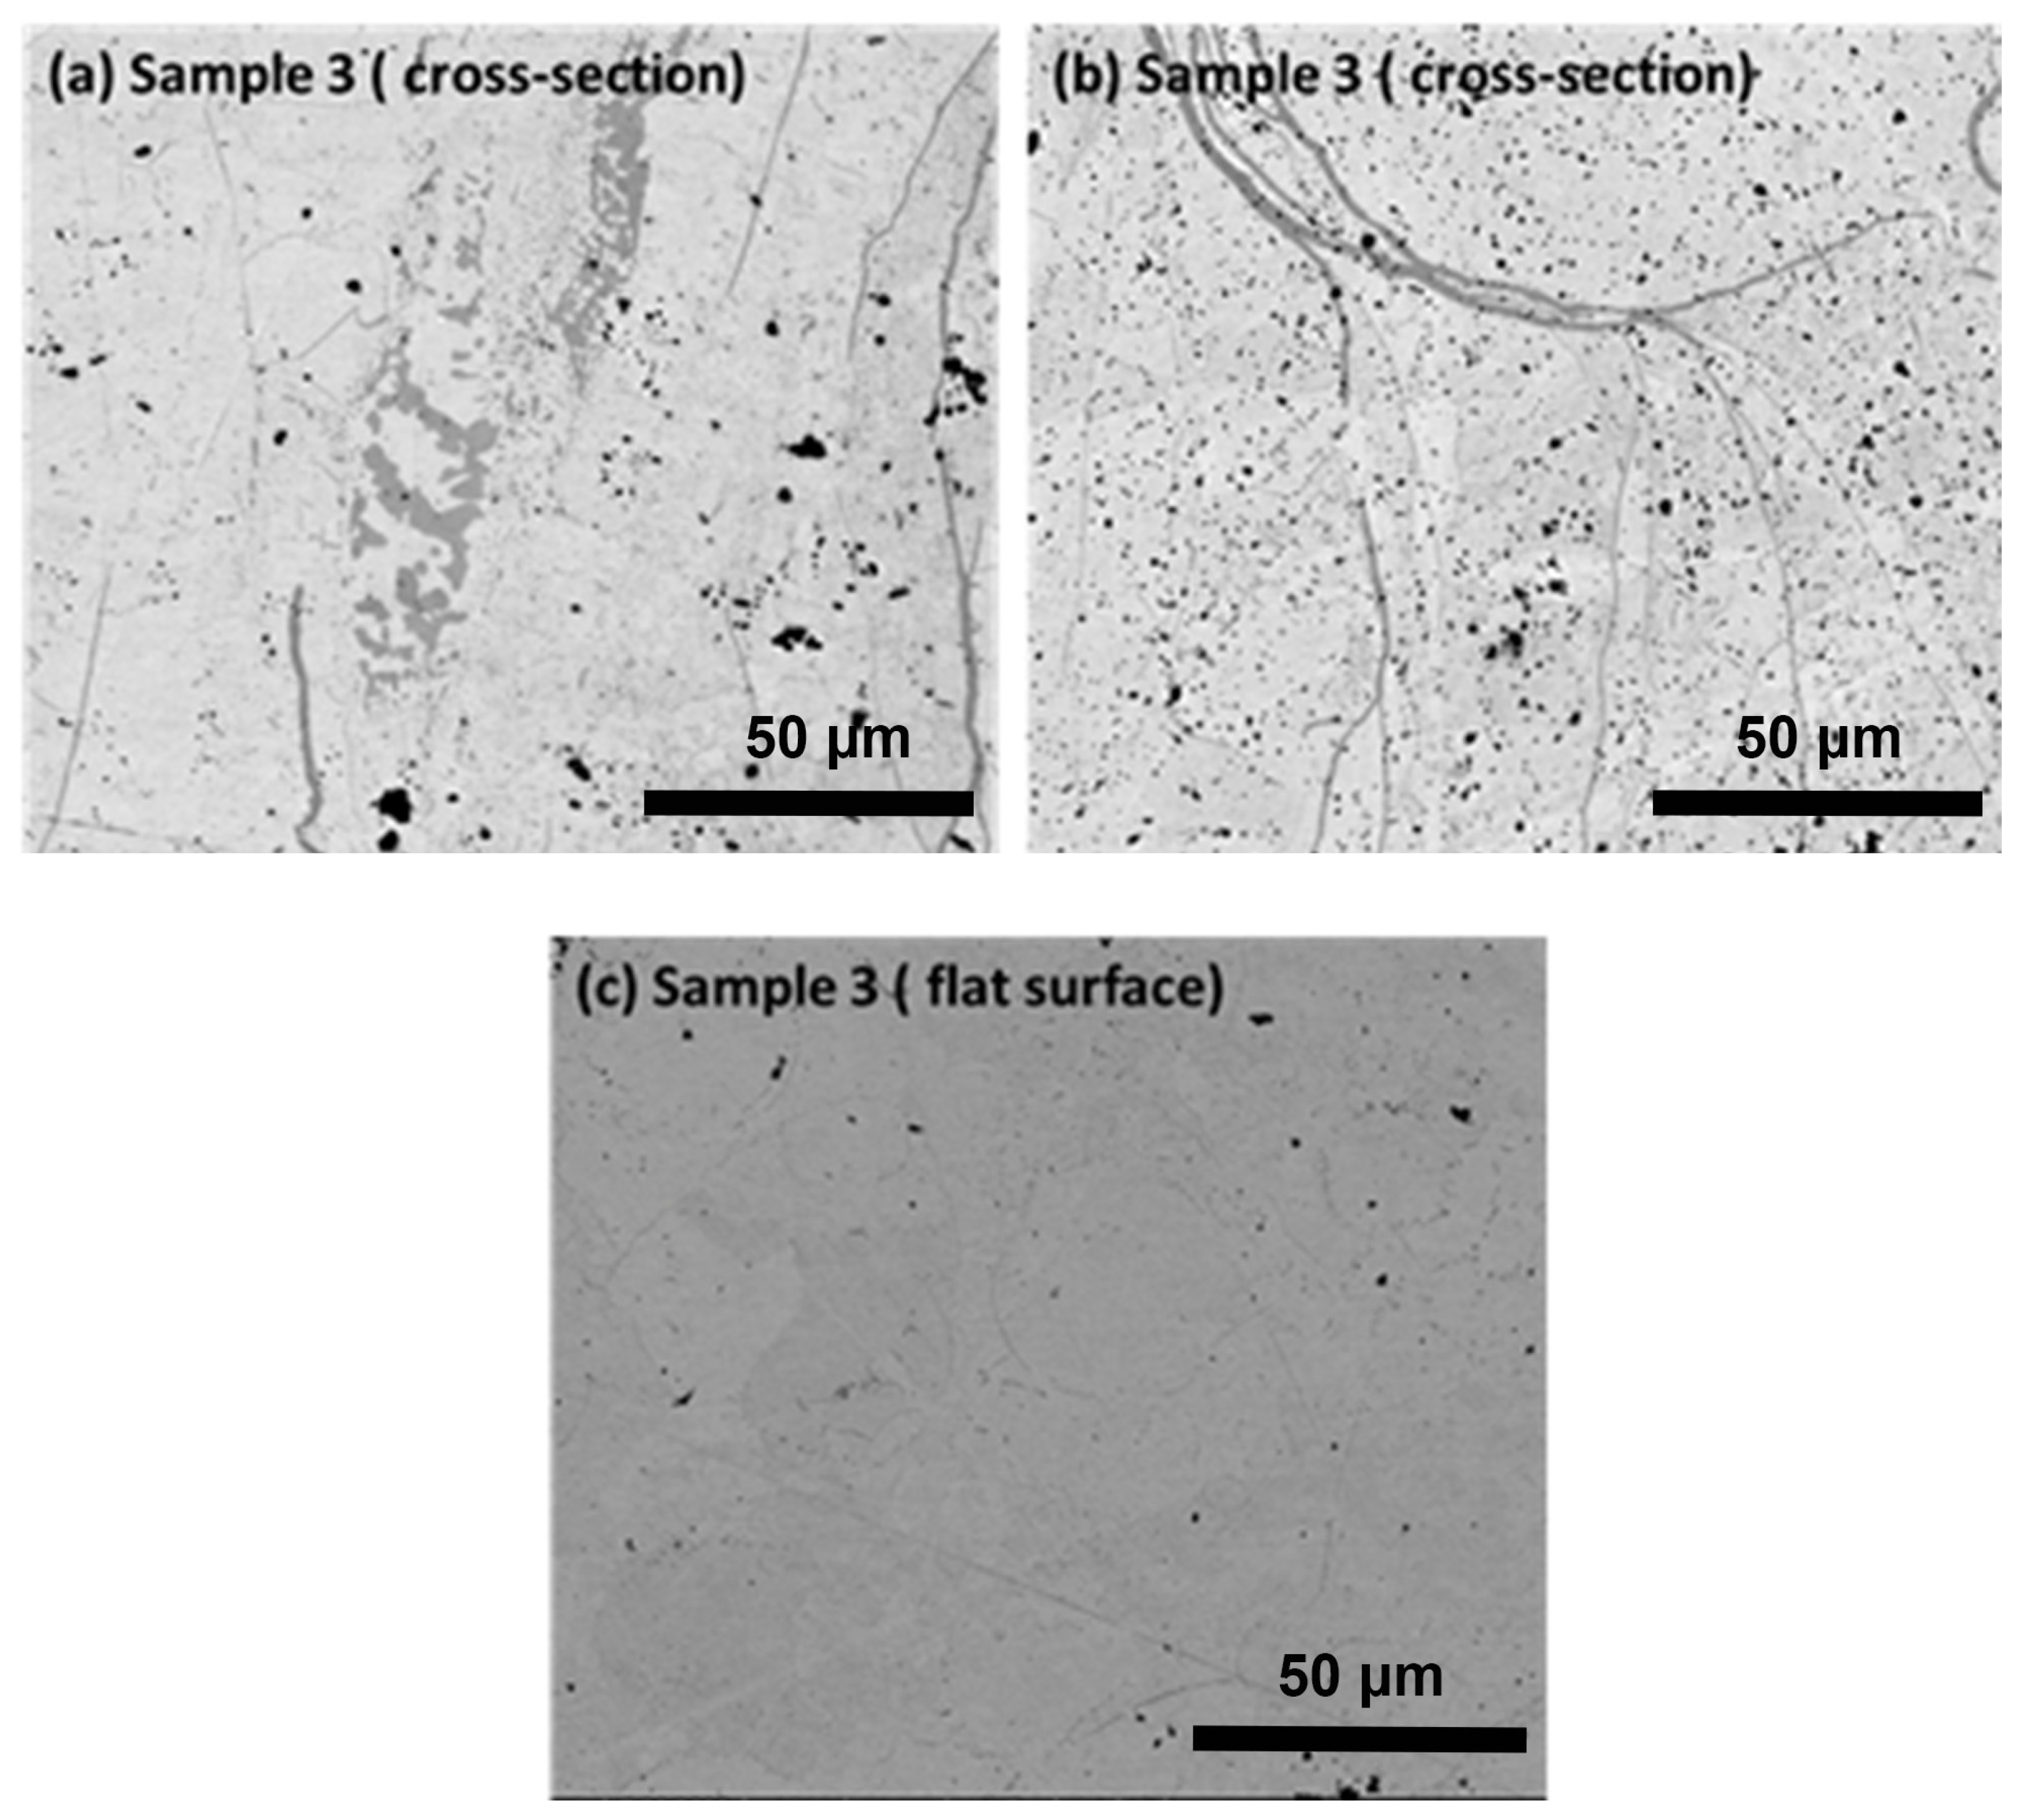
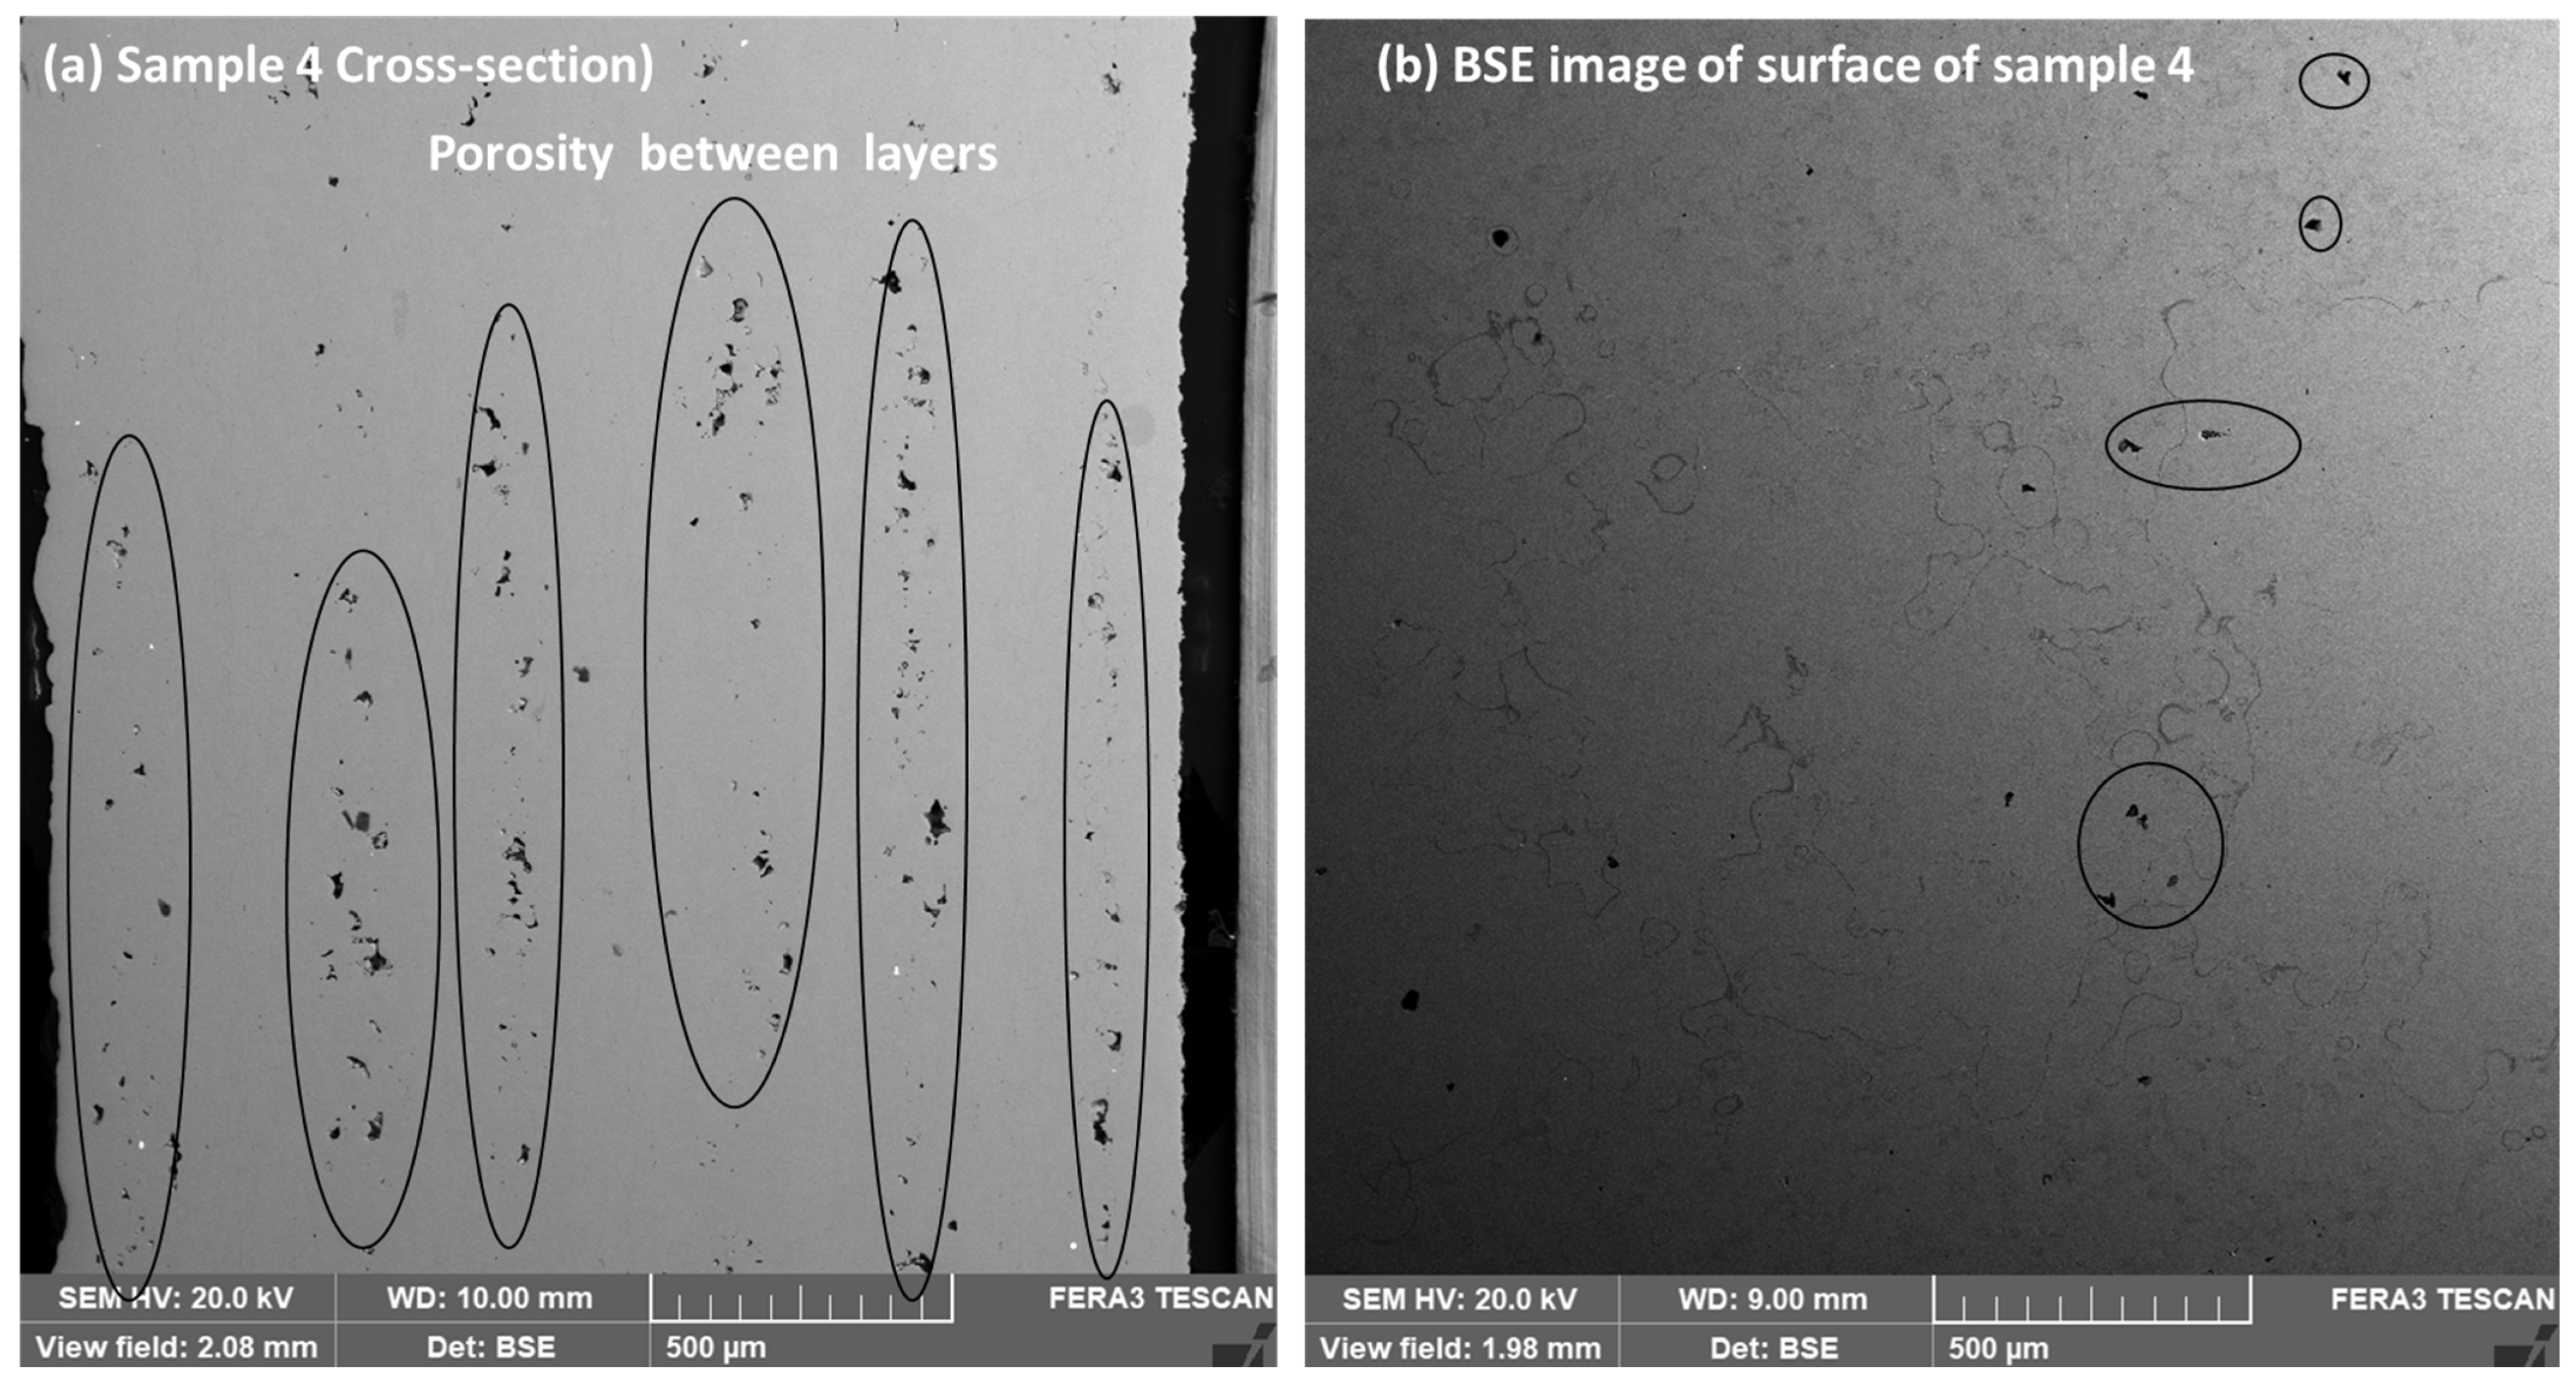
Figure 4 shows the microstructure image of sample 3, with both a cross-sectional and surface view. The cross-section and surface of the sample look extensively contaminated by carbon particles that migrate from the substrate toward the coating layers. The sample was prepared in the conditions of low input power and low feed rate, which may allow more interparticle space for the diffusion of carbon particles. Based on the severe contamination of the sample, it will not be considered for further study. The effect of an input power of 9 kW partially reflects molten particles in the plasma source, which is confirmed by the layer of porosity that is generated between the layers of the coating on sample 4 (
Figure 5). The porosity layer arises from the deadhesion of partially melted splat or unmelted particles within the coating layers. This sample is visible, similar to a net structure, which may be beneficial as a reference material for researchers, as the layers of porosity may have applications in the biomedical field. However, in this work, we are more concerned with the compact sample, which could demonstrate both thermal and thermo-mechanical behavior. The sample was prepared at a higher input power and lower feeding rate, showing very minor contamination and a high-quality microstructure.
3.2. Phase Identification
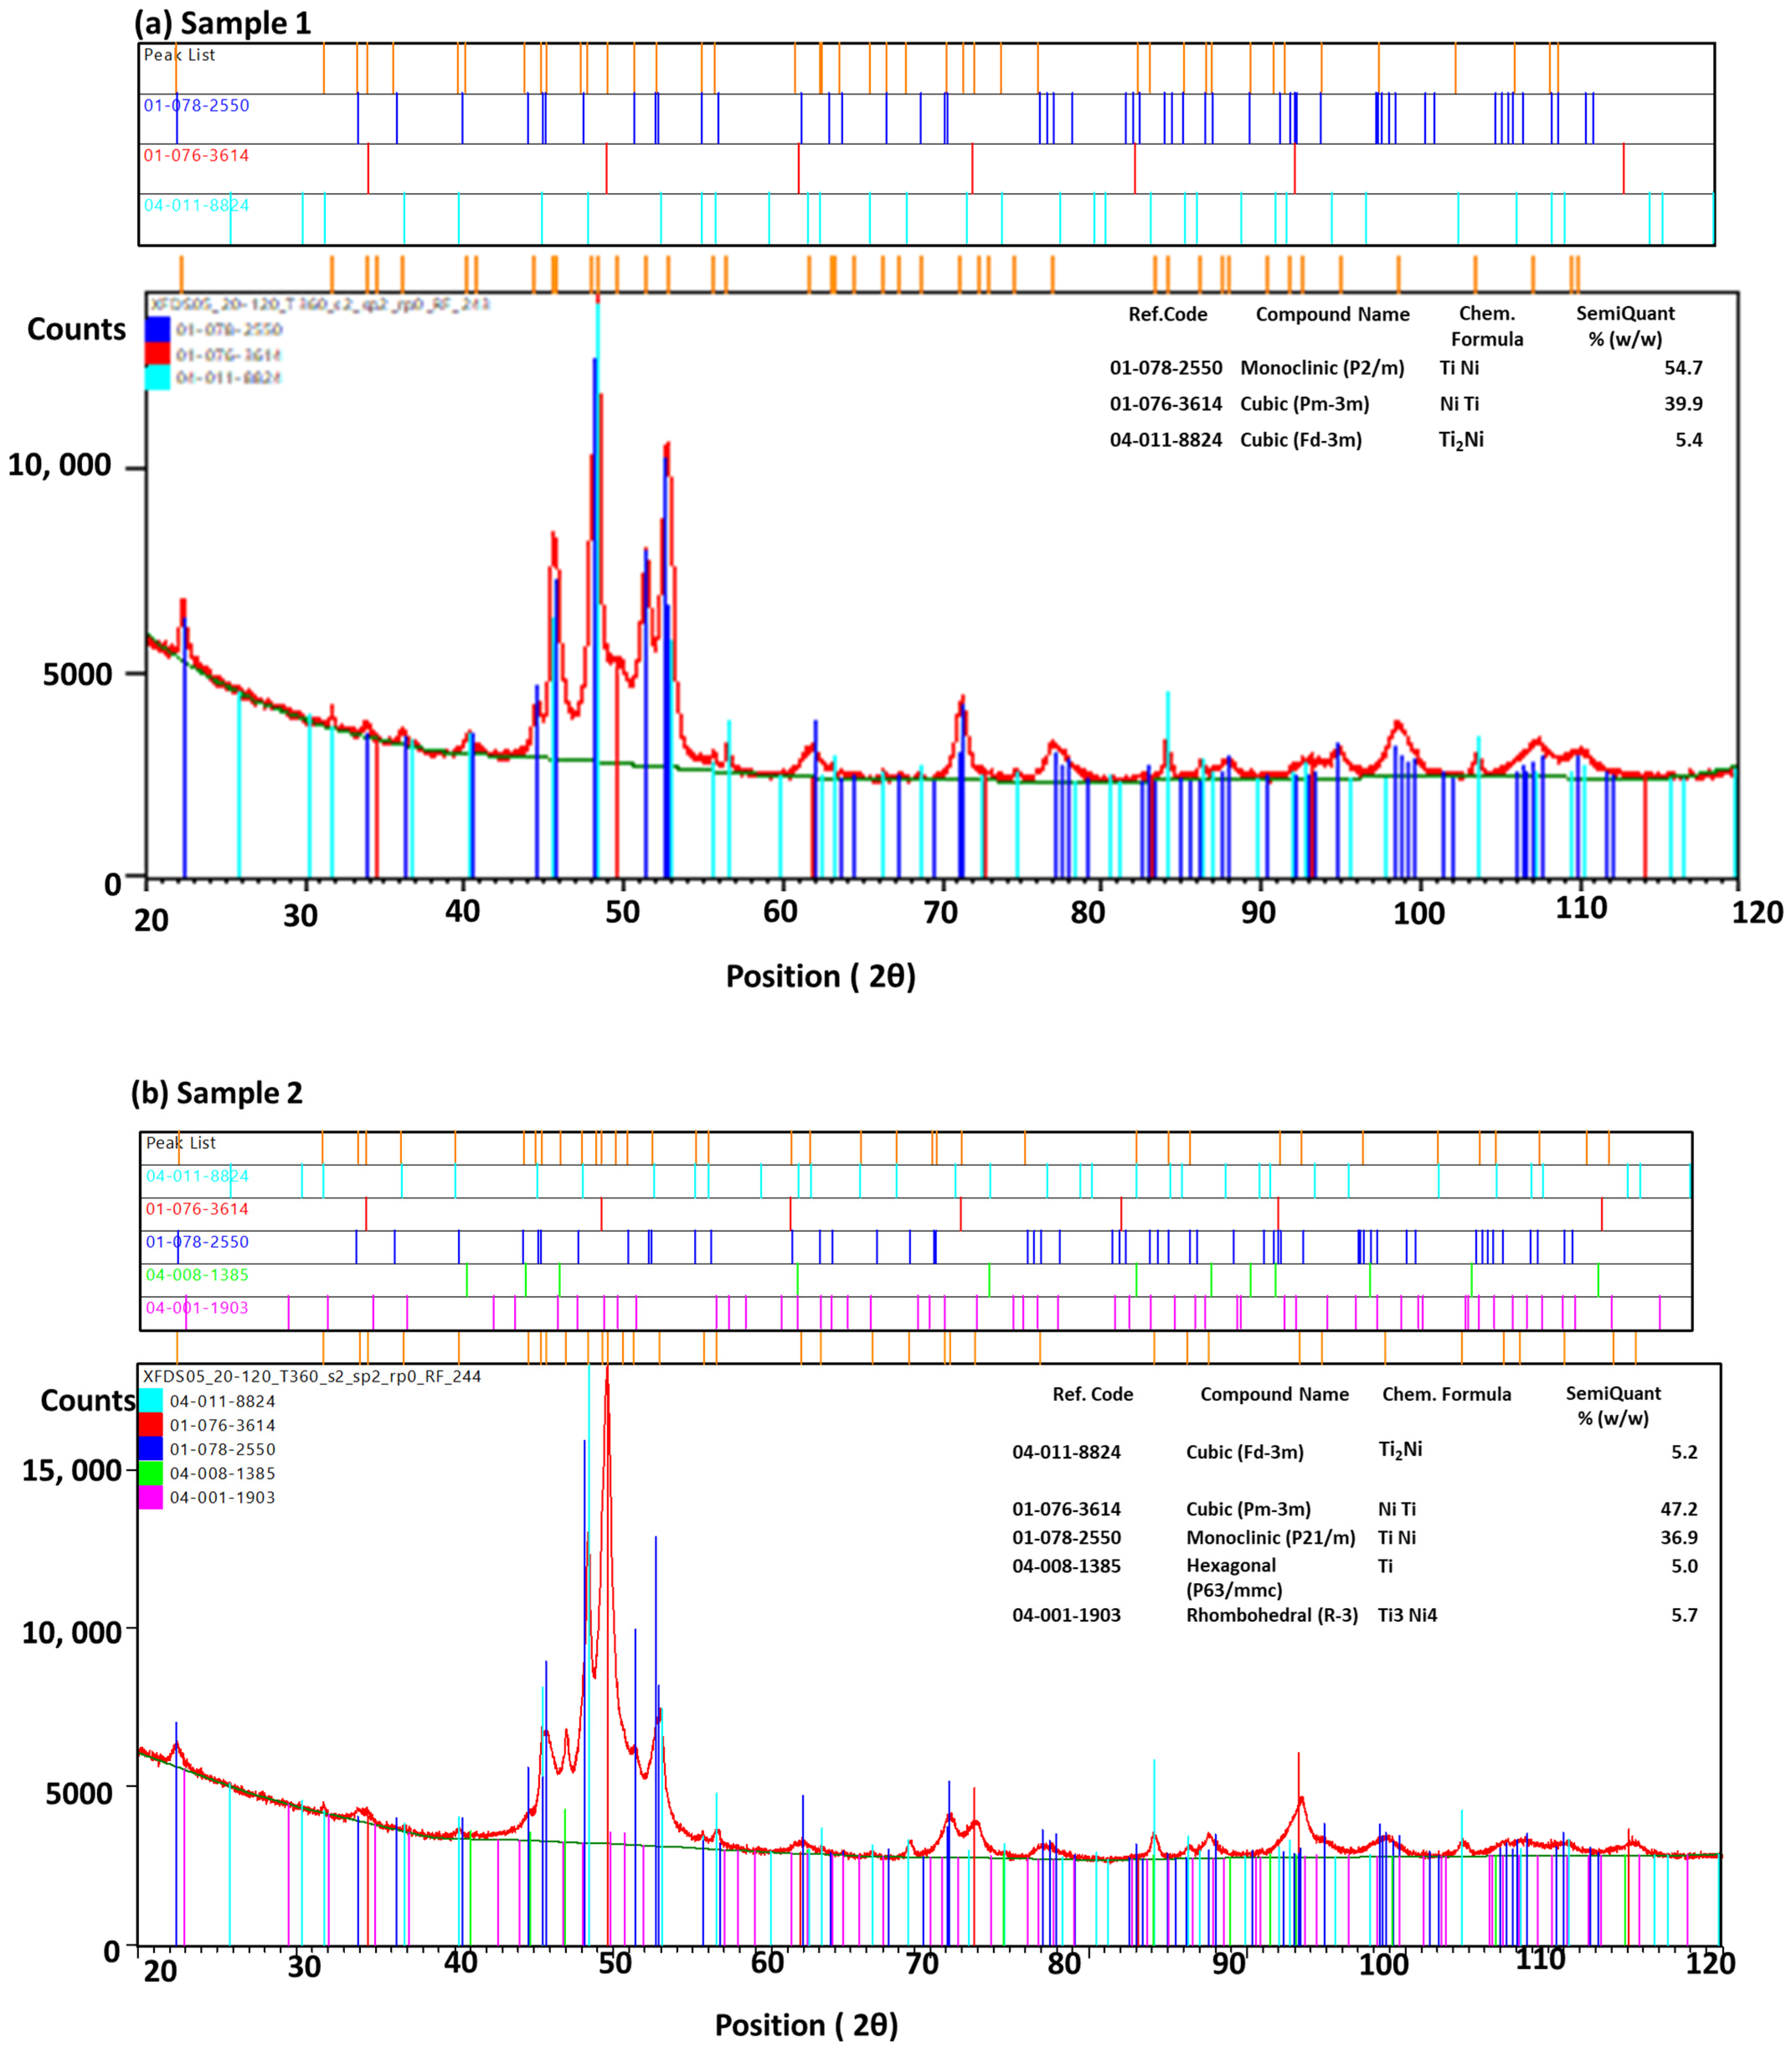
To understand the phase analysis in more depth, the XRD findings of samples 1 and 2 are summarized in
Figure 6a,b and
Table 2.
3.3. Thermal Characterization of Samples
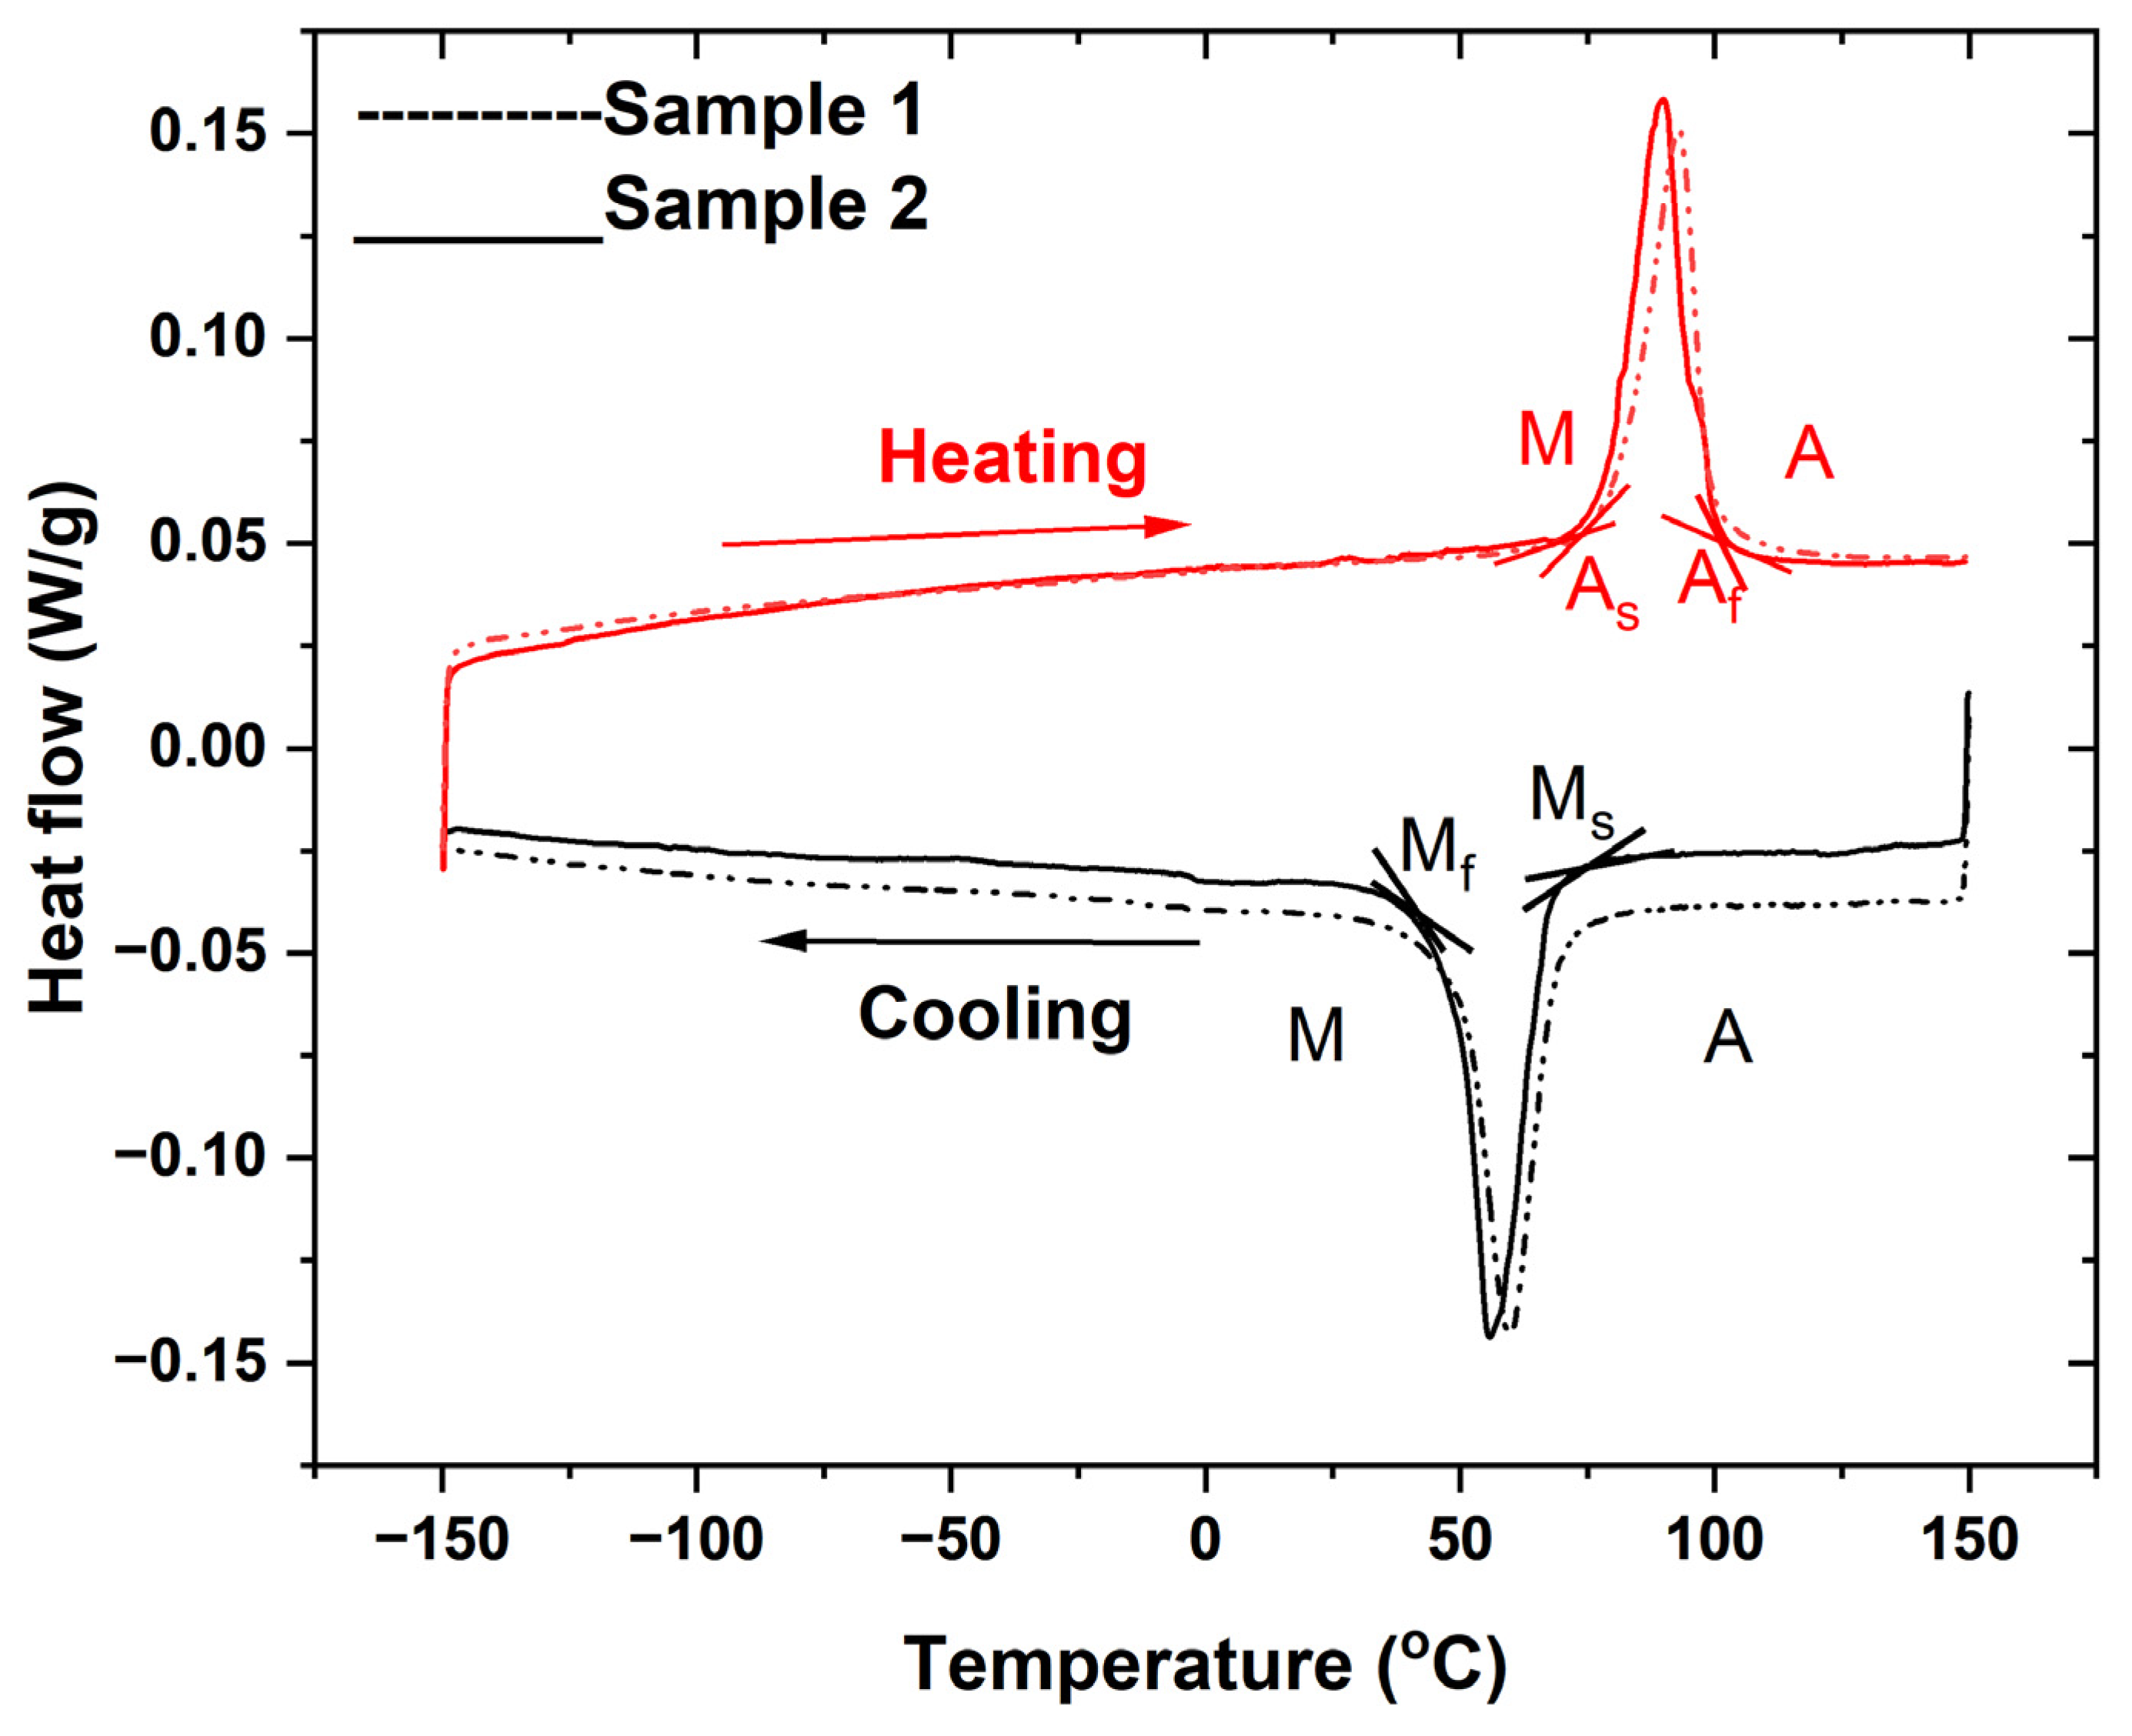
Thermal analysis of samples 1 and 2 reveals the transformation temperature of the NiTi phases in cooling and heating cycles is shown in
Figure 7. Both samples show strong peaks of martensite and austenite phases, with start and finish temperatures coinciding with each other. Sample 2 shows a shift in peak position for both phases in the thermal cycle. The austenite peak for sample 2 shows 89.21 °C, whereas sample 1 shows a peak position at 93.5 °C. Both the samples show an austenite start temperature (A
s) of 74.0 °C and an austenite finish temperature of 102.1 °C. Similarly, both samples show a martensite start temperature of 75.3 °C and a martensite finish temperature of 42.9 °C. However, sample 1 shows the martensite peak at 56.3 °C, and sample 2 shows a peak at 59.3 °C. The shift in transformation temperature strongly correlates with findings regarding the martensite phase detected by XRD. As the semiquantitative phases of martensite are greater in sample 1 compared to sample 2, in the cooling cycle, the martensite peak arises at a lower temperature. The same phenomena are applicable to sample 2 with the dominant austenite phase, showing an austenite peak earlier than sample 1. This may correspond to the presence of intermetallic phases in sample 2.
Table 3 shows the transformation temperatures in both samples.
3.4. Thermo-Mechanical Characterization of the Sample
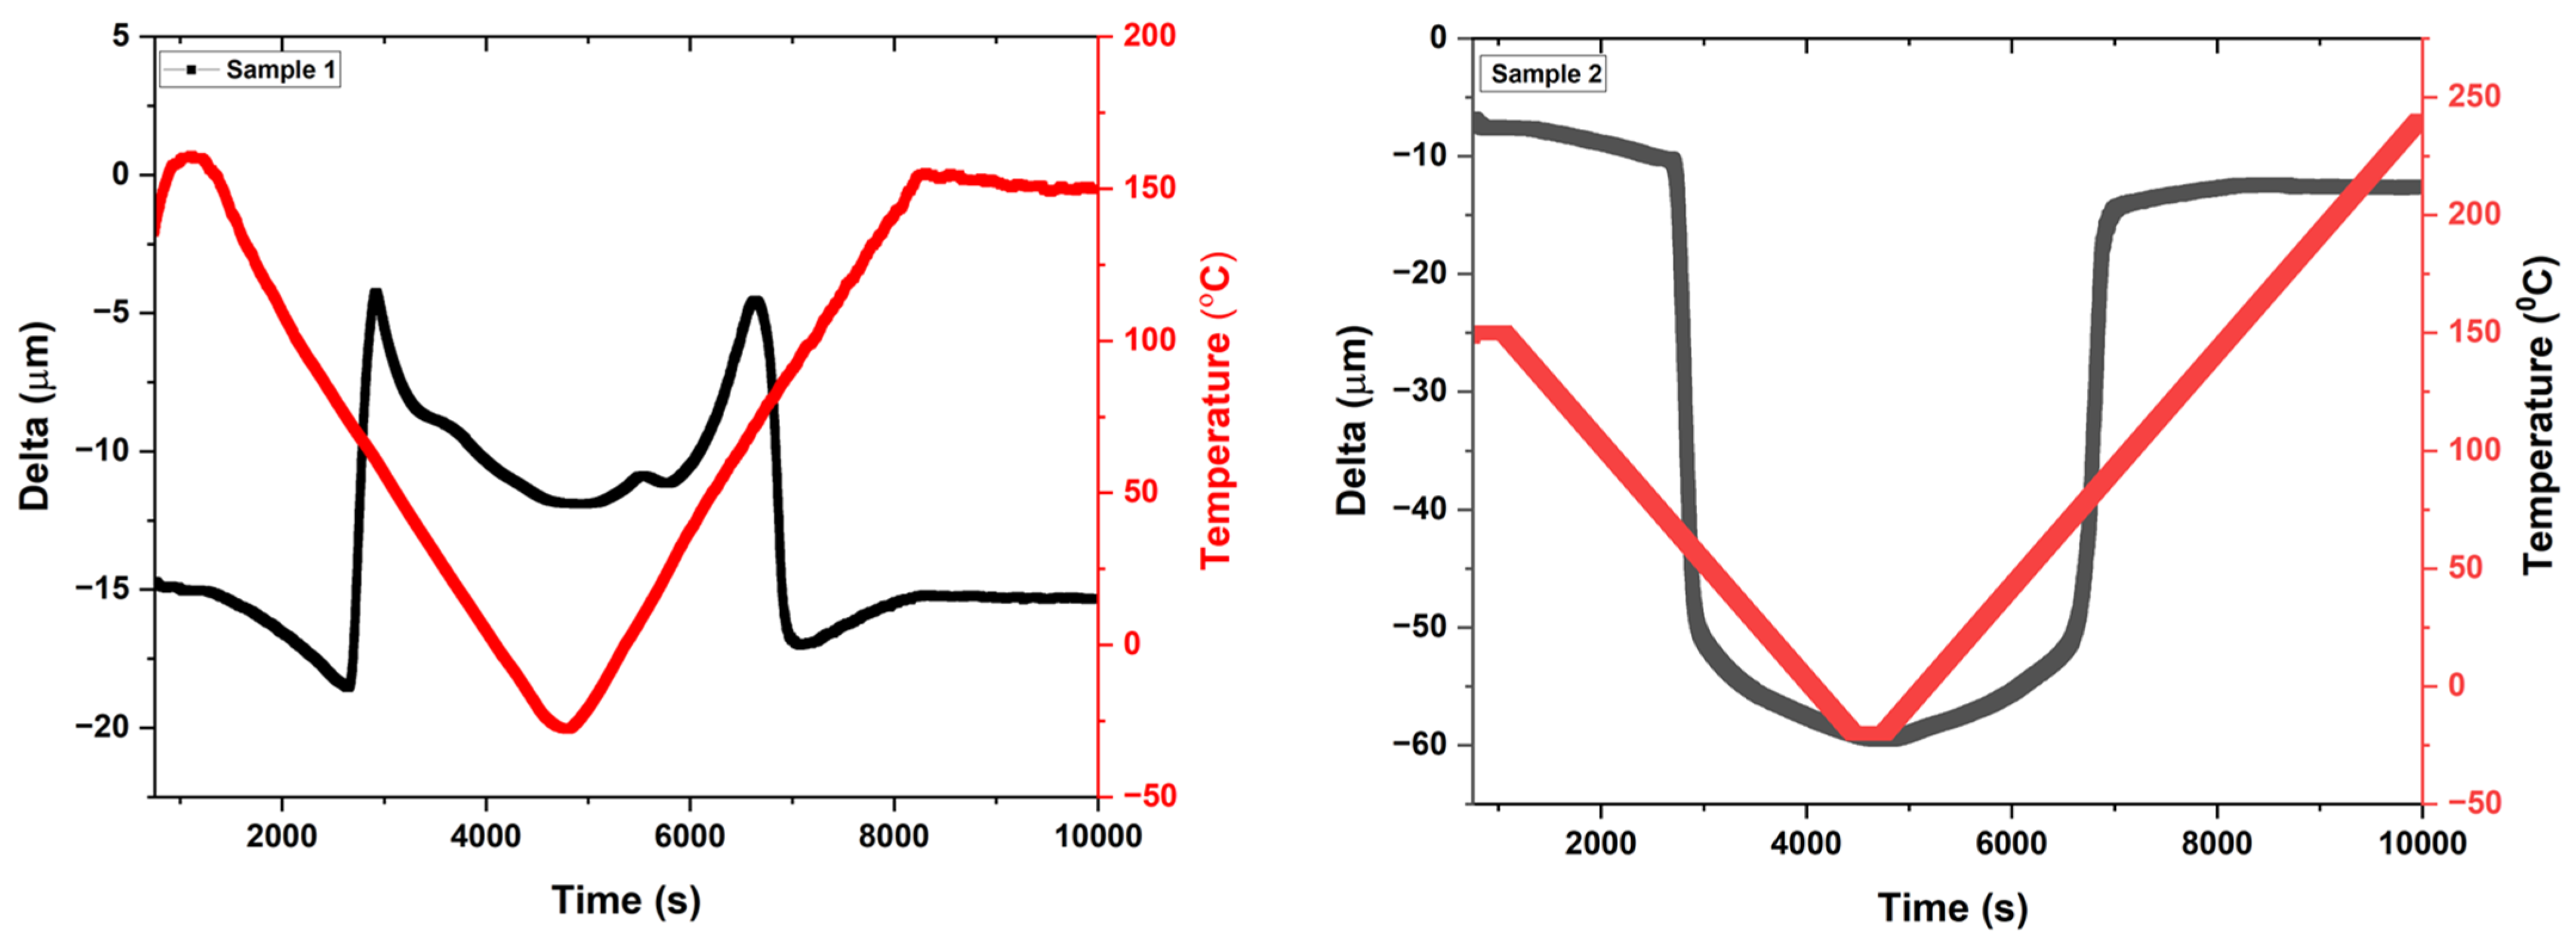
The mechanical response of the sample at a constant load of 100 mN is performed as the function of thermal cycles. The sample depicts deformation as the change in displacement from the horizontal position to the deformed bend position; the sample returns to the original position after heating.
Figure 8 represents the behavior of samples 1 and 2 as a function of time, displacement (delta), and temperature. Sample 2 shows more deformation of change in displacement (45 µm); however, sample 1 shows deformation in the range of—10 µm. Both samples return back to their original position after heating; however, sample 2 shows a slight deviation of 5 µm displacement from the original position. This deviation may arise due to the presence of contaminants such as carbon particles or other intermetallic phases.
3.5. Hardness Evaluation
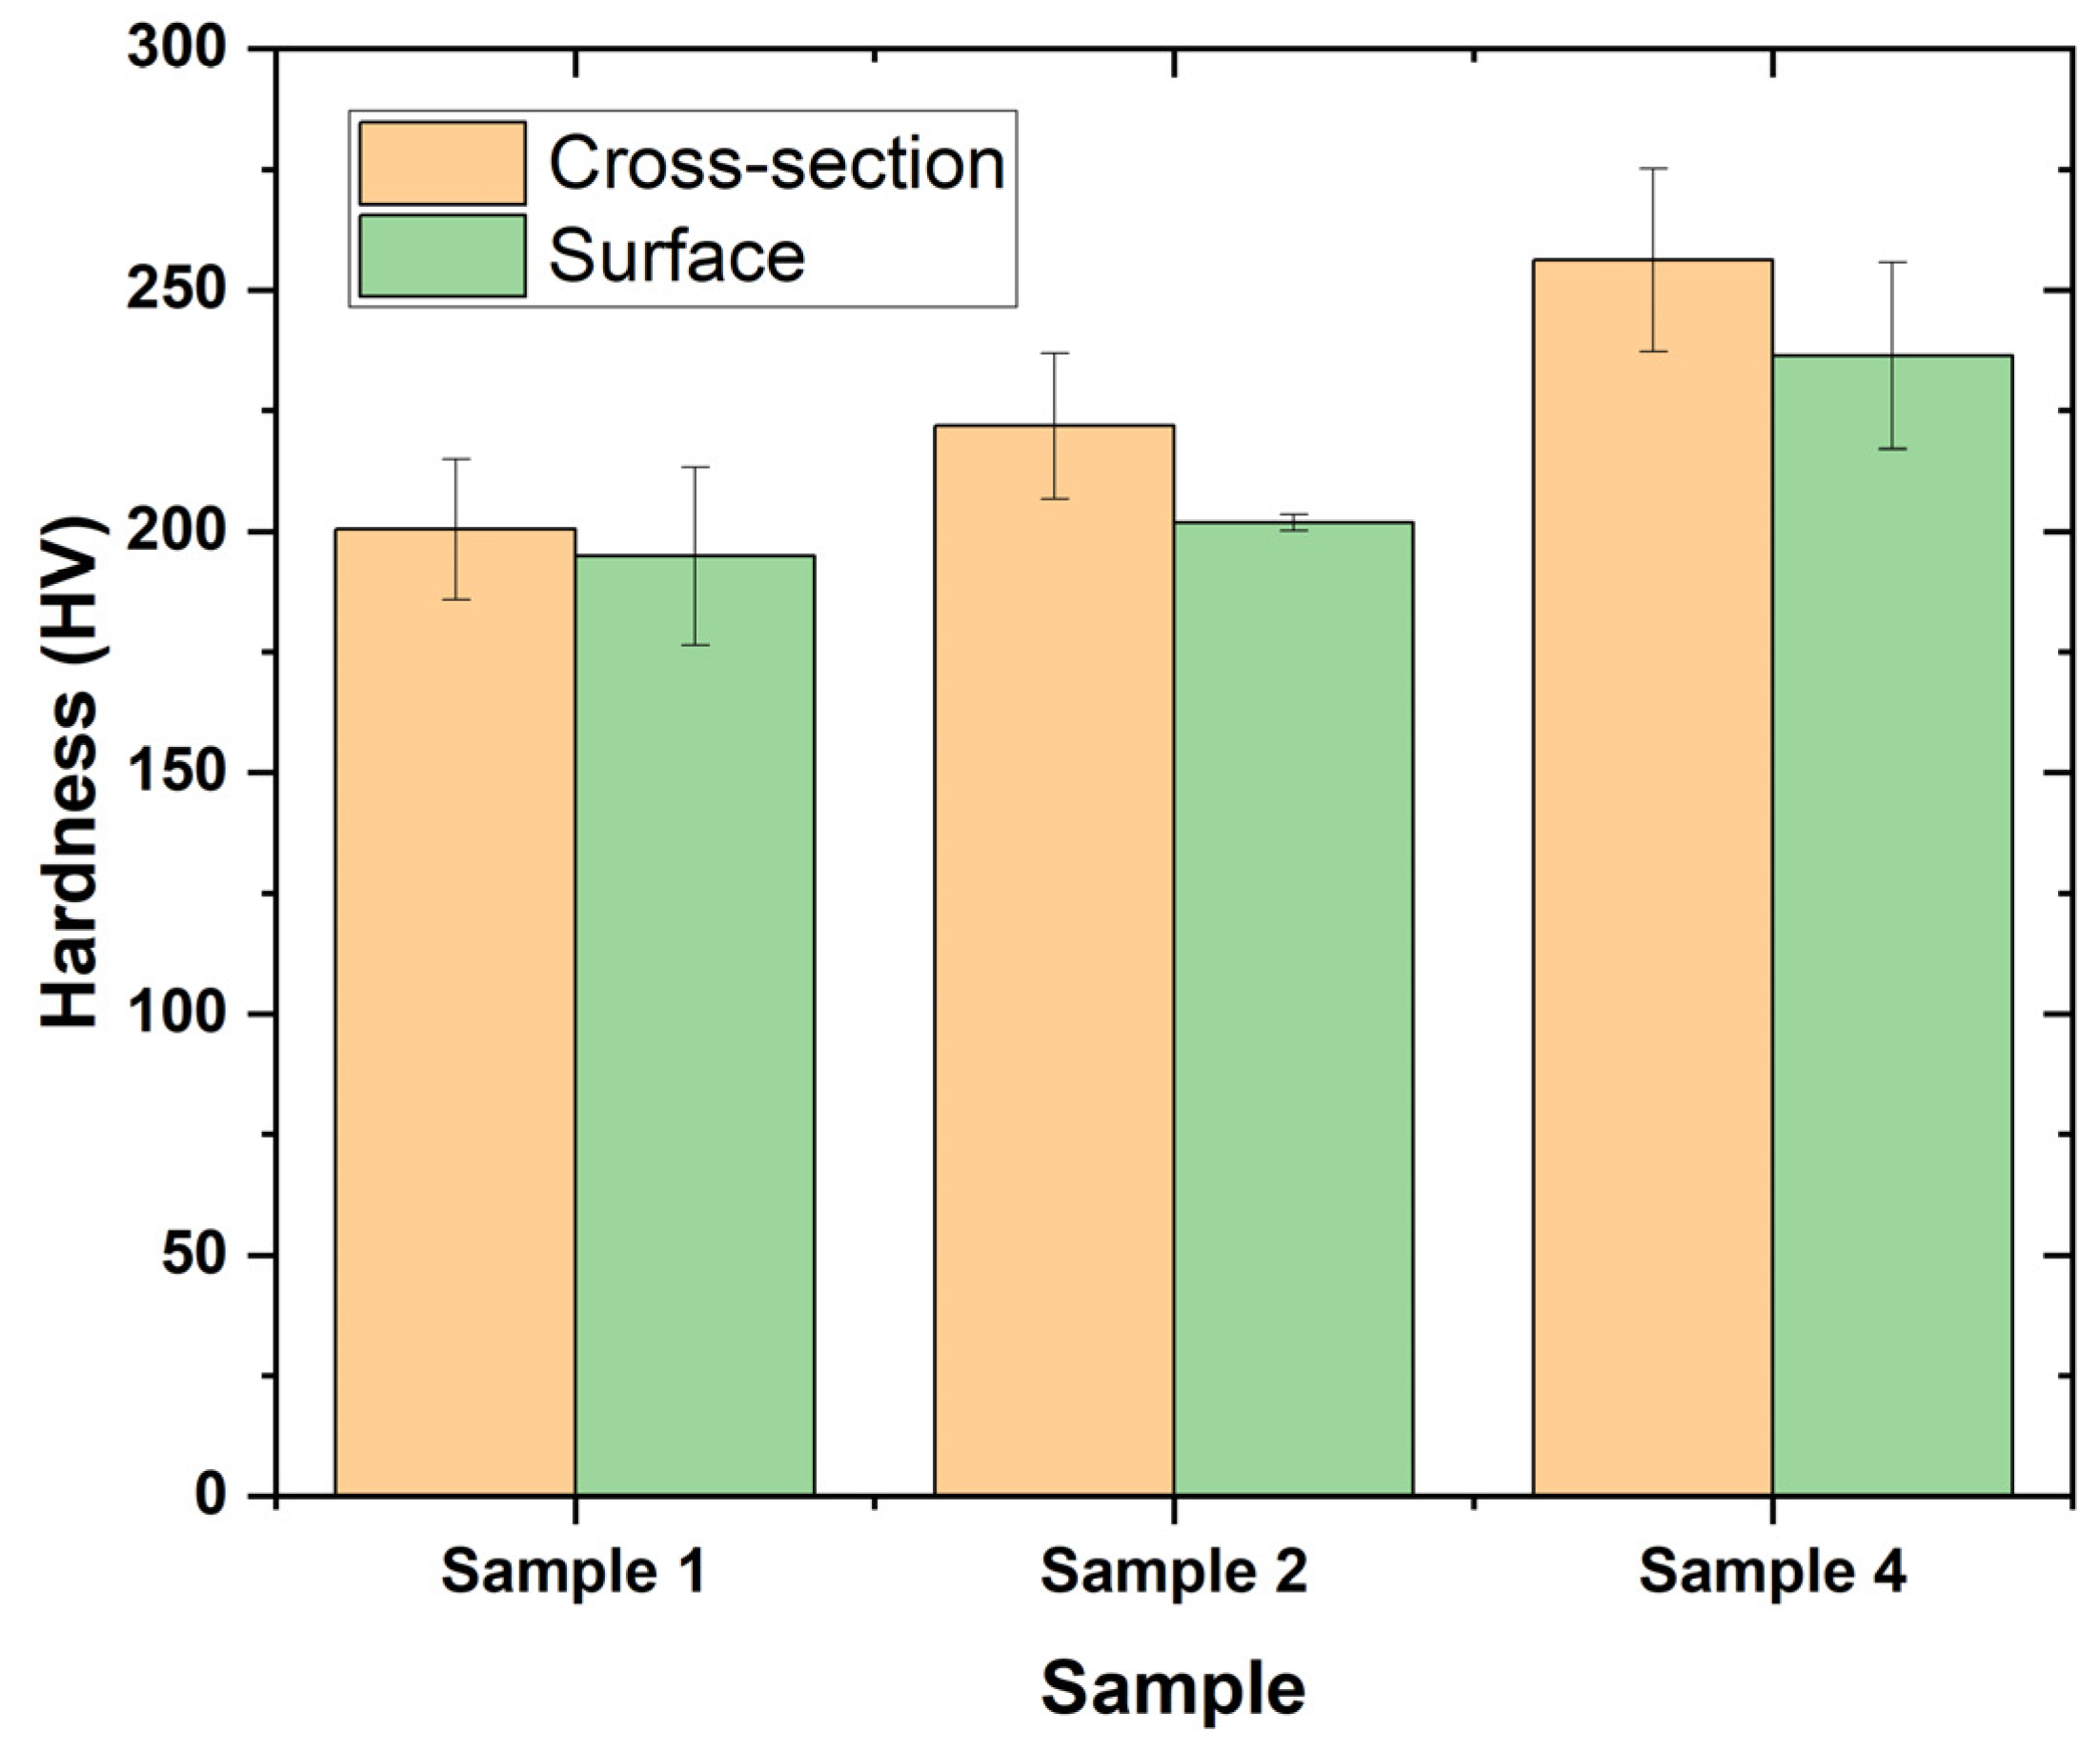
Three selected coatings, 1, 2, and 4, have been chosen for hardness testing at the cross-section and surface of the samples.
Figure 9 displays the hardness of the samples with the statistical distribution. Five indents were carried out at the cross section and the surface of the samples for calculation of the average and deviation of hardness.
Sample 1 shows lower hardness in comparison to the other two samples. This may be due to the better quality of coating in samples with very minor contamination from carbon particles. Sample 4 shows layers of porosity, an unmelted sample, and contamination within the structure that may lead to higher hardness.
4. Discussion
The alloy fabricated on the graphite substrate contains carbon on the surface and through the thickness. The key role of the substrate in the structure of the deposited NiTi sample is due to the diffusion of the substrate during the deposition of the first and subsequent layers. During the deposition of the second layer, some upper part of the first layer interfaces with second layer, allowing the carbon particle to diffuse into multilayers. Carbon as a coating on the surface of an alloy provides an advantage against corrosion, as it demonstrates effective corrosion resistance [
16,
17,
18]. However, carbon as particle inside the core of the material is considered a contaminant or foreign element. However, the addition of 0.03 wt.% of C in the form of a compound such as TiC could be used to the alloy’s advantage, through an increase in tensile strength and tensile fatigue life [
19]. However, if the content of carbon is increased from 0.03% to 0.05 wt.%, the material’s properties start to deteriorate. In this work, plasma spraying was used to prepare NiTi alloys, which are sensitive toward the composition because of the advantage of controlling the uniform composition with a multilayer structure. Meanwhile, graphite substrate was chosen because it is cheap and easy to separate using mechanical grinding [
20,
21]. However, the graphite substrate could serve as a source of C that reacts with Ti in the NiTi matrix to produce TiC, which affects the composition ratio of Ni/Ti and thus affects the alloy’s properties.
Figure 7 shows the estimated martensitic transformation peak in both samples has a slight variation that may arise due to compositional changes in both samples 1 and 2. The shifting of the martensite temperature corresponds to Ni concentration in the samples. Sample 1 is Ni-rich, as shown by the phase analysis in
Figure 6. Two potential sources of error can affect compositional changes. They may occur from the small error associated with the purity of raw materials or microstructural constituents that affects the Ni concentration in the Ni matrix. Oxygen and carbon emerged as impurities partly through raw materials and partly through fabrication processes (such as the cooling process of sample preparation) and from the graphite substrate, respectively. During the thermal plasma fabrication process, oxygen and carbon could precipitate in the matrix of the product as Ti
2NiO
x and TiC components.
Figure 6 shows that the Ni-rich NiTi alloys contain a small number of oxygens stabilized as Ti2Ni, which reduces the Ti concentration of the matrix. As a result, alloys with a higher oxygen content have lower phase transition temperatures.
4.1. The Purity of Powder NiTi as a Raw Material
In pure powders such as NiTi alloy, the Ni concentrations in weight percent are expressed as
where
i and
are the masses of Ni and Ti in the alloys. However, if the raw powder contains some impurities, it affects the final composition. The purity of Ni is P
Ni = 99.989 wt.%, and of Ti is P
Ti = 99. 927 wt.% [
22,
23]. Considering there is no weight loss during plasma spraying, these purities could be used in the Ni/Ti ratio in the alloy:
is the purity correction factor. The raw materials used in the present study have an Ni percentage of 50 at.%.
However, in plasma-sprayed samples, the purity of Ni changes from 50 at.% to a lower value, due to the presence of intermetallic and oxide components.
4.2. The Role of Oxygen and Carbon in NiTi Alloy
The ternary Ni-Ti-O system of the phase at 1173 K highlights various phases at 50 at.% Ni as NiTi phases, with variations in the concentration of 30 at.% Ni as a Ti
2Ni phase. It is particularly noteworthy that Ti2Ni can dissolve up to 15 at.% oxygen [
24]. The presence of various phases of TiO, Ti
2Ni, and TiNi
3 at 1173 K in the Ni-Ti-O system and the presence of intermetallic compounds originates from the lower quenching temperature in the sample with the substrate, which promotes the diffusion and formation of other phases besides NiTi. The cooling process may lead to the separation of the Ti and Ni phase from the matrix, and their combination with oxygen for the formation of phases However, the solubility of O in the Ti
2Ni phase is much lower in
Figure 6.
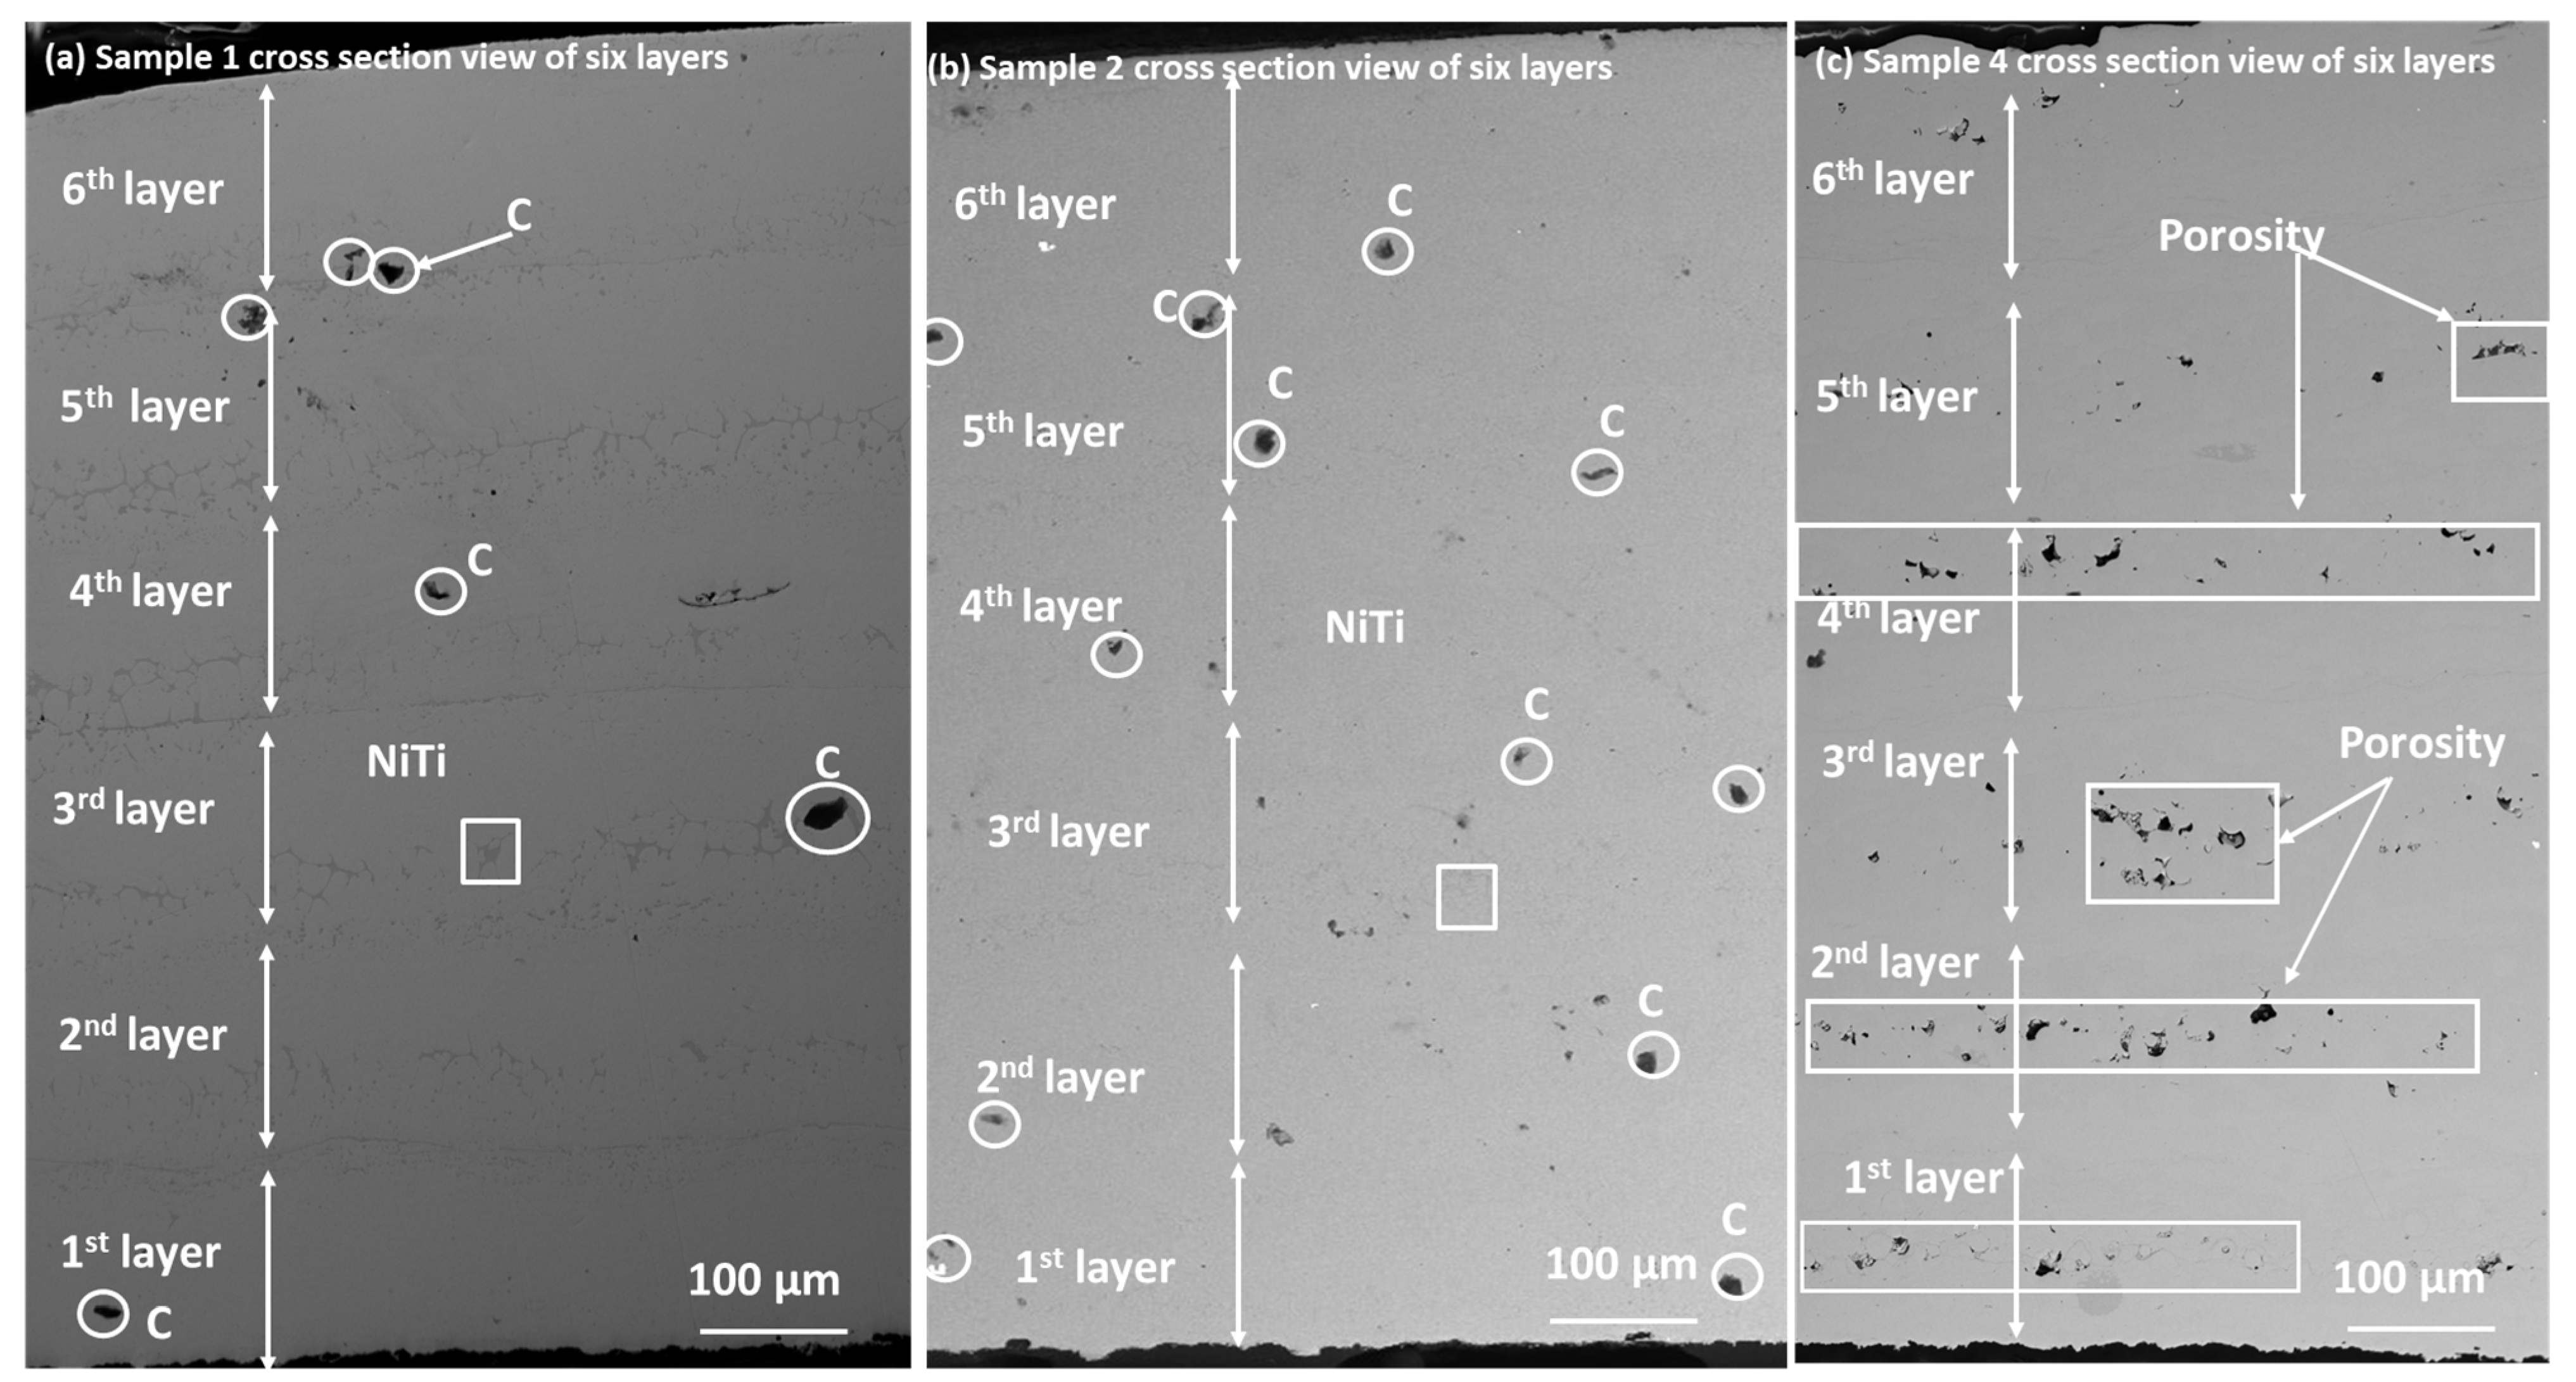
The various layers in sample 1, 2 and 4 are displayed in
Figure 10. It shows the distribution of carbon particles and the homogenity of the structutre of the coating within the various layers. Samples 1 and 2 show good dispersion of the NiTi phase, and more elements within the sample are examined through EDX analysis. The attached
supplementary file (Figure S1) shows the presence of C, O, Ni, and Ti within the sample. However, there are more carbon particles present in sample 2 than in sample 1. Sample 4 shows a layer of porosity within each deposition layer, which may arise due to partially melted particles within the coating, which themselves may arise due to insufficient power for particle melting during deposition.
RF_ICP plasma technology is one of the most efficient technologies in thermal plasma sector for producing a more purity and homogeneous compact structure. The magnetic coil in the technology holds the plasma arc in an efficient way. This technology stands ahead compared to other plasma processes such as transferred and non-transferred arc reactors. We initially chose graphite for three reasons: first, its low thermal conductivity, which means that the coating layers will not affect any heat-affected zone, as seen in our previous work [
9]. This is a very common effect of stainless-steel substrates. Second, there is lower cost from an economic point of view. Third, and the most important reason, it is easy to remove graphite as a substrate so that samples can act as free-standing, lone materials. However, the resulting porosity and contamination were outside the scope of the study from the start. However, we analyzed porosity and contamination, as shown in
Figure 10. From an industrial point of view, the main aim was to produce a free-standing material, without heat-affected zones, which could be used as a shape memory material. We may be able to produce free-standing materials by simply polishing a substrate and consider the thick coating the primary material of the SMA NiTi. This is one of several alternative ways to fabricate NiTi whilst controlling parameters to prevent contamination from the substrate.
5. Conclusions
A NiTi alloy was coated on a graphite substrate, to consider it as a standalone material, using the plasma spraying process. The following results were achieved.
Effective coating layers of 1.5 mm and 2 mm were obtained for 12- and 9-kW input power, respectively. The sample was prepared at a higher input power and lower feeding rate, showing very minor contamination with a high-quality microstructure. Although graphite is considered a convenient method as it is easily removed after spraying, it is a more likely source of contamination from the substrate to the coating via diffusion. As the carbon content increases, the hardness and porosity increase (sample 4). Additionally, controlling the spraying parameters at a high input power (12 kW) will allow the melting of particles with a lower feeding rate (2.1 g/min), in order to generate a better sample. The samples prepared at higher power display significant thermal and mechanical behavior that corresponds to the shape memory behavior of the NiTi alloy.
Supplementary Materials
The following supporting information can be downloaded at:
https://www.mdpi.com/article/10.3390/coatings13071174/s1, Figure S1. EDX analysis of Sample 1 at various locations. Figure S2. EDX peaks of various elements of spot 1. Figure S3. EDX peaks of various elements of spot 2. Figure S4. EDX peaks of various elements of Area 1. Figure S5. EDX peak of various elements of Area 2. Table S1. Elemental analysis for various spots and areas of sample 1. Figure S6. EDX analysis of Sample 2 at various locations. Figure S7. EDX peak of various elements of Area 1 in sample 2. Figure S8. EDX peak of various elements of Area 2 in sample 2. Table S2. Elemental analysis for various areas of sample 2. Figure S9. Selected area for image analysis in Sample 2. Figure S10. Various elements of C, O, Ti, Ni for the sample 2 as above Figure S9. Figure S11. EDX peak of various element in the selected area (Figure S9). Table S3. Elemental quantitative analysis of sample 2 in selected area Figure S9 with corresponding EDX Figure S11. Figure S12. Elemental mapping for Ti/Ni and C/Ti/O/ Ni. Figure S13. Elemental mapping of C in selcted area of Figure S9. Figure S14. Elemental mapping of C in selcted area of Figure S9. Figure S15. Elemental mapping of C in selcted area of Figure S9. Figure S16. Elemental mapping of C in selcted area of Figure S9.
Author Contributions
Conceptualization, S.S., J.Z. and J.K.; methodology, S.S., J.Z and J.K.; investigation, J.K.; resources, S.S.; writing—original draft preparation, S.S., P.Š. and J.K.; writing—review and editing. All authors have read and agreed to the published version of the manuscript.
Funding
We thank the Czech Science Foundation (CSF) projects 22-20181 S (P.Š.) and the Project Solid-21 for the support within the Institute of Physics, Prague, Czech Republic (SOLID21: CZ.02.1.01/0.0/0.0/16_019/0000760, SOLID21-Fyzika pevných látek pro 21. Století, Fyzikální ústav AV ČR, v. v. i. (2018–2023). CzechNanoLab project LM2023051 funded by MEYS CR.
Institutional Review Board Statement
Not applicable.
Informed Consent Statement
Not applicable.
Data Availability Statement
Data will be available at the reader’s request.
Acknowledgments
The first author would like to acknowledge the Institute of Plasma Physics (IPP) of the Czech Academy of Science for the plasma facilities used to prepare samples. The first author would thank Jana Cibulková, Central Laboratories, University of Chemistry and Technology, Prague (UCT Prague), 166 28 Prague, Czech Republic for XRD analysis.
Conflicts of Interest
The authors declare no conflict of interest.
References
- Appiah, A.N.S.; Bialas, O.; Czupryński, A.; Adamiak, M. Powder Plasma Transferred Arc Welding of Ni-Si-B+60 wt% WC and Ni-Cr-Si-B+45 wt%WC for Surface Cladding of Structural Steel. Materials 2022, 15, 4956. [Google Scholar] [CrossRef]
- Trinh, N.Q.; Tashiro, S.; Suga, T.; Kakizaki, T.; Yamazaki, K.; Lersvanichkool, A.; Bui, H.V.; Tanaka, M. Metal Transfer Behavior of Metal-Cored Arc Welding in Pure Argon Shielding Gas. Metals 2022, 12, 1577. [Google Scholar] [CrossRef]
- Heimann, R.B. The Nature of Plasma Spraying. Coatings 2023, 13, 622. [Google Scholar] [CrossRef]
- Samal, S. Thermal plasma technology: The prospective future in material processing. J. Clean. Prod. 2017, 142, 3131–3150. [Google Scholar]
- Samal, S. Thermal Plasma Processing of Materials: High-Temperature Applications; Elsevier: Amsterdam, The Netherlands, 2022; pp. 512–525. [Google Scholar]
- Samal, S.; Blanco, I. An Overview of Thermal Plasma Arc Systems for Treatment of Various Wastes in Recovery of Metals. Materials 2022, 15, 683. [Google Scholar]
- Samal, S.; Tyc, O.; Cizek, J.; Klecka, J.; Lukáč, F.; Molnárová, O.; de Prado, E.; Weiss, Z.; Kopeček, J.; Heller, L.; et al. Fabrication of Thermal Plasma Sprayed NiTi Coatings Possessing Functional Properties. Coatings 2021, 11, 610. [Google Scholar]
- Samal, S.; Molnárová, O.; Průša, F.; Kopeček, J.; Heller, L.; Šittner, P.; Škodová, M.; Abate, L.; Blanco, I. Net-Shape NiTi Shape Memory Alloy by Spark Plasma Sintering Method. Appl. Sci. 2021, 11, 1802. [Google Scholar]
- Samal, S.; Kopeček, J.; Šittner, P. Interfacial Adhesion of Thick NiTi Coating on Substrate Stainless Steel. Materials 2022, 15, 8598. [Google Scholar] [CrossRef]
- Samal, S.; Tomáštík, J.; Čtvrtlík, R.; Václavek, L.; Molnárová, O.; Šittner, P. Surface Deformation Recovery by Thermal Annealing of Thermal Plasma Sprayed Shape Memory NiTi Alloys. Coatings 2023, 13, 433. [Google Scholar] [CrossRef]
- Samal, S.; Cibulková, J.; Čtvrtlík, R.; Tomáštík, J.; Václavek, L.; Kopeček, J.; Šittner, P. Tribological Behavior of NiTi Alloy Produced by Spark Plasma Sintering Method. Coatings 2021, 11, 1246. [Google Scholar] [CrossRef]
- Arciniegas, A.; Casals, J.; Manero Pena, J.; Gil, F.J. Study of hardness and wear behavior of NiTi shape memory alloys. J. Alloy. Compo. 2008, 460, 213–219. [Google Scholar]
- Chiu, K.Y.; Cheng, F.T.; Man, H.C. Laser cladding of austenitic stainless steel using NiTi strips for resisting cavitation erosion. Mater. Sci. Eng. A Struct. Mater. Prop. Microstruct. Process. 2005, 402, 126–134. [Google Scholar]
- Bram, M.; Ahmad-Khanlou, A.; Buchkremer, H.P.; Stöver, D. Vacuum plasma spraying of NiTi protection layers. Mater. Lett. 2002, 57, 647–651. [Google Scholar]
- Ozel, S.; Kurt, B.; Somunkiran, I.; Orhan, N. Microstructural characteristic of NiTi coating on stainless steel by plasma transferred arc process. Surf. Coat. Technol. 2008, 202, 3633–3637. [Google Scholar] [CrossRef]
- Zou, J.; Wang, X.; Zhang, P.; Du, X. Ultrafast flame coating of carbon and chemical vapor deposition of graphene on NiTi alloy to enhance its corrosion resistance. Diam. Relat. Mater. 2022, 128, 109231. [Google Scholar] [CrossRef]
- Shanaghi, A.; Chu, P.K.; Sabour Rouhaghdam, A.R.; Xu, R.; Hu, T. Structure and corrosion resistance of Ti/TiC coatings fabricated by plasma immersion ion implantation and deposition on nickel–titanium. Surf. Coat. Technol. 2013, 229, 151–155. [Google Scholar]
- Pei, Y.-L.; Luan, Y. Surface modification of NiTi alloys using nitrogen doped diamond-like carbon coating fabricated by plasma immersion ion implantation and deposition. J. Alloy. Compd. 2013, 581, 873–876. [Google Scholar]
- Zhao, Y.; Yu, Z.; Wang, Q.; Zhang, B.; Ren, X.; Zhao, W.; Ren, S.; Qu, X. Effect of carbon addition on the microstructure and mechanical behavior of near equiatomic NiTi alloy wire. Mater. Des. 2023, 225, 111570. [Google Scholar] [CrossRef]
- Chen, F.; Tong, Y.X.; Lu, X.L.; Wang, X.; Tian, B.; Li, L. Effect of graphite addition on martensitic transformation and damping behavior of NiTi shape memory alloy. Mater. Lett. 2011, 65, 1073–1075. [Google Scholar]
- Zhang, Z.; Frenzel, J.; Neuking, K.; Eggeler, G. On the reaction between NiTi melts and crucible graphite during vacuum induction melting of NiTi shape memory alloys. Acta Mater. 2005, 53, 3971–3985. [Google Scholar]
- Zhang, Z.; Frenzel, J.; Somsen, C.; Pesicka, J.; Neuking, K.; Eggeler, G. Orientation relationship between TiC carbides and B2 phase in as-cast and heat-treated NiTi shape memory alloys. Mater. Sci. Eng. A 2006, 438, 879–882. [Google Scholar]
- Frenzel, J.; George, E.P.; Dlouhy, A.; Somsen, C.; Wagner, M.X.; Eggeler, G. Influence of Ni on martensitic phase transformations in NiTi shape memory alloys. Acta Mater. 2010, 58, 3444–3458. [Google Scholar]
- Qiu, A.T.; Liu, L.J.; Wei, P.; Lu, X.G.; Li, C.H. Calculation of phase diagram of Ti-Ni-O system and application to deoxidation of TiNi alloy. Trans. Nonferrous Met. Soc. China 2011, 21, 1808–1816. [Google Scholar] [CrossRef]
Figure 1.
(
a,
b) Surface image of NiTi particles. (
c) EDX analysis of the particle and element composition in wt.% (inset); (
d) particle size distribution; (
e) cross-section of the particle. The red cross in (
b) shows the EDX profile in (
c). Reprinted from Ref. [
7].
Figure 1.
(
a,
b) Surface image of NiTi particles. (
c) EDX analysis of the particle and element composition in wt.% (inset); (
d) particle size distribution; (
e) cross-section of the particle. The red cross in (
b) shows the EDX profile in (
c). Reprinted from Ref. [
7].
Figure 2.
(a–c) Microstructural image of sample 1: (a) cross-section area; (b,c) flat surfaces in BSE image mode, (white sircles shows carbon particles), square shows porosity region in the cross section area.
Figure 2.
(a–c) Microstructural image of sample 1: (a) cross-section area; (b,c) flat surfaces in BSE image mode, (white sircles shows carbon particles), square shows porosity region in the cross section area.
Figure 3.
Microstructural image of sample 2: (a) cross-section area; (b) flat surface in BSE image mode; (c) cross-section near edge. (white circle shows the carbon particles along the cross section surface and flat surfaces).
Figure 3.
Microstructural image of sample 2: (a) cross-section area; (b) flat surface in BSE image mode; (c) cross-section near edge. (white circle shows the carbon particles along the cross section surface and flat surfaces).
Figure 4.
Microstructural image of sample 3: (a) cross-section area; (b) cross-section area in BSE image mode; (c) flat surface, showing more contamination from carbon and phase separation.
Figure 4.
Microstructural image of sample 3: (a) cross-section area; (b) cross-section area in BSE image mode; (c) flat surface, showing more contamination from carbon and phase separation.
Figure 5.
(a) Cross-section image of sample 4 showing porosity at the joining layers throughout the cross-section; (b) surface image of sample 4 (all black circles in Figure (a) shows porosity and carbon particle in (b)).
Figure 5.
(a) Cross-section image of sample 4 showing porosity at the joining layers throughout the cross-section; (b) surface image of sample 4 (all black circles in Figure (a) shows porosity and carbon particle in (b)).
Figure 6.
(a,b) XRD peaks for phase detection for samples 1 and 2 showing the austenite, martensite, oxide, and intermetallic phases.
Figure 6.
(a,b) XRD peaks for phase detection for samples 1 and 2 showing the austenite, martensite, oxide, and intermetallic phases.
Figure 7.
DSC peaks of the martensite and austenite phases in samples 1 and 2, showing transformation temperatures in the cooling and heating cycles.
Figure 7.
DSC peaks of the martensite and austenite phases in samples 1 and 2, showing transformation temperatures in the cooling and heating cycles.
Figure 8.
Thermo-mechanical analysis of samples 1 and 2 as a function of time, temperature, and displacement (delta).
Figure 8.
Thermo-mechanical analysis of samples 1 and 2 as a function of time, temperature, and displacement (delta).
Figure 9.
The hardness of samples at the cross section and surface area, measured using a load of 1.961 N.
Figure 9.
The hardness of samples at the cross section and surface area, measured using a load of 1.961 N.
Figure 10.
(a–c) Cross section view of different layers of the coating, showing the presence of carbon particles distributed throughout the thickness.
Figure 10.
(a–c) Cross section view of different layers of the coating, showing the presence of carbon particles distributed throughout the thickness.
Table 1.
Spraying parameters for sample preparation on graphite substrate 1.
Table 1.
Spraying parameters for sample preparation on graphite substrate 1.
| Sample | Torch Power (kW) | Feeding Rate (g/min) | Preheat Time (s) | Spraying Set Up a Plan | Net Powder Spray Time (s) |
|---|
| 1 | 12 | 2.1 | 60 | 30 × 6 | 180 |
| 2 | 12 | 4.2 | 60 | 30 × 6 | 180 |
| 3 | 9 | 2.1 | 60 | 30 × 6 | 180 |
| 4 | 9 | 4.2 | 60 | 30 × 6 | 180 |
Table 2.
Phase analysis of the NiTi powder and samples by XRD (all in wt.%).
Table 2.
Phase analysis of the NiTi powder and samples by XRD (all in wt.%).
| Sample | Austenite | Martensite | Ti2Ni | Ni4Ti3 | Ti |
|---|
| Powder | 64 | 36 | - | - | - |
| Sample 1 | 39.9 | 54.7 | 5.4 | - | - |
| Sample 2 | 47.2 | 36.9 | 5.2 | 5.7 | 5.0 |
Table 3.
Transformation temperatures of the NiTi samples prepared by plasma spraying (all in °C).
Table 3.
Transformation temperatures of the NiTi samples prepared by plasma spraying (all in °C).
| Sample | Transformation Temperature (°C) |
|---|
| Martensite Start (Ms) | Martensite Finish (Mf) | Martensite Peak (Mp) | Austenite Start (As) | Austenite Finish (Af) | Austenite Peak
(Ap) |
|---|
| Sample 1 | 42.9 | 75.3 | 56.3 | 74.0 | 102.1 | 93.5 |
| Sample 2 | 42.9 | 75.3 | 59.3 | 74.0 | 102.1 | 89.21 |
| Disclaimer/Publisher’s Note: The statements, opinions and data contained in all publications are solely those of the individual author(s) and contributor(s) and not of MDPI and/or the editor(s). MDPI and/or the editor(s) disclaim responsibility for any injury to people or property resulting from any ideas, methods, instructions or products referred to in the content. |
© 2023 by the authors. Licensee MDPI, Basel, Switzerland. This article is an open access article distributed under the terms and conditions of the Creative Commons Attribution (CC BY) license (https://creativecommons.org/licenses/by/4.0/).


