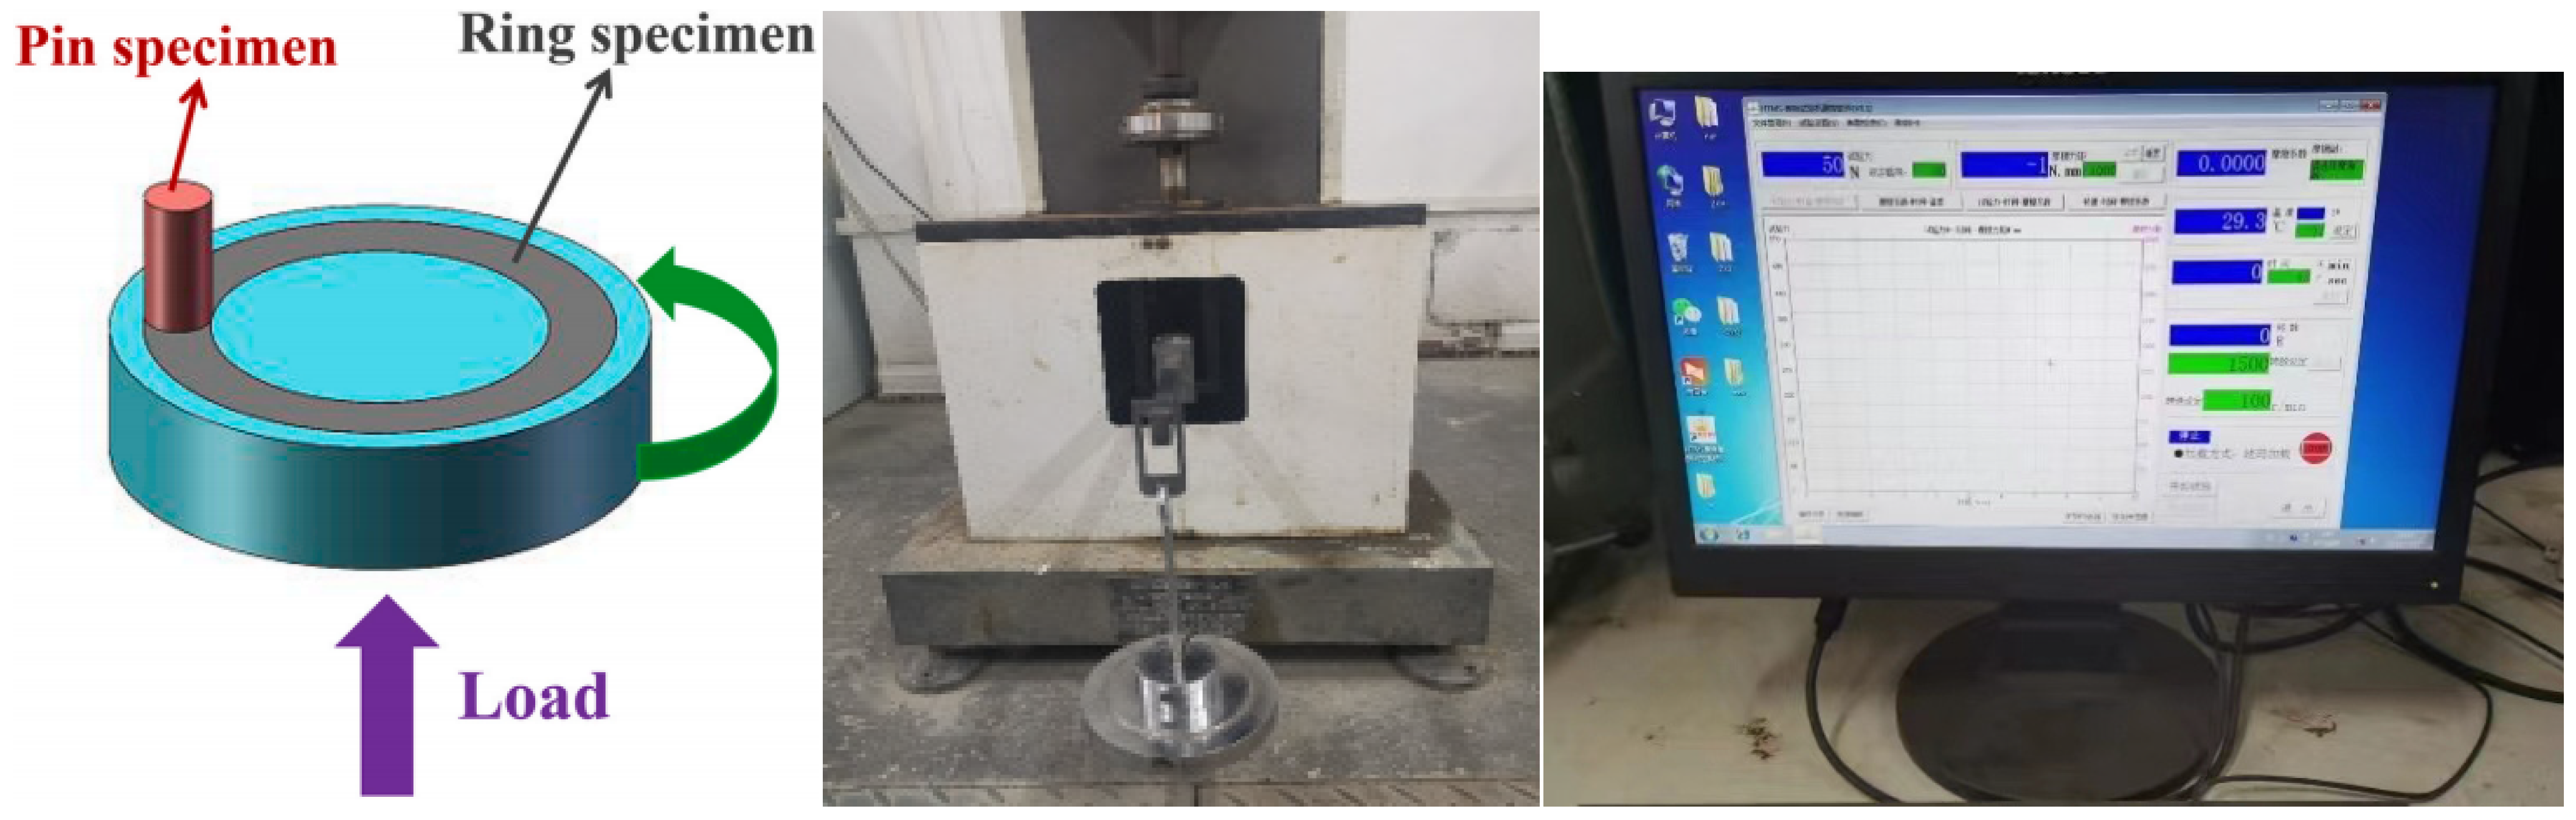
Figure 1.
Pin disc friction and wear experimental device.
Figure 1.
Pin disc friction and wear experimental device.
Figure 2.
Mineralization degree aqueous solution environmental device.
Figure 2.
Mineralization degree aqueous solution environmental device.
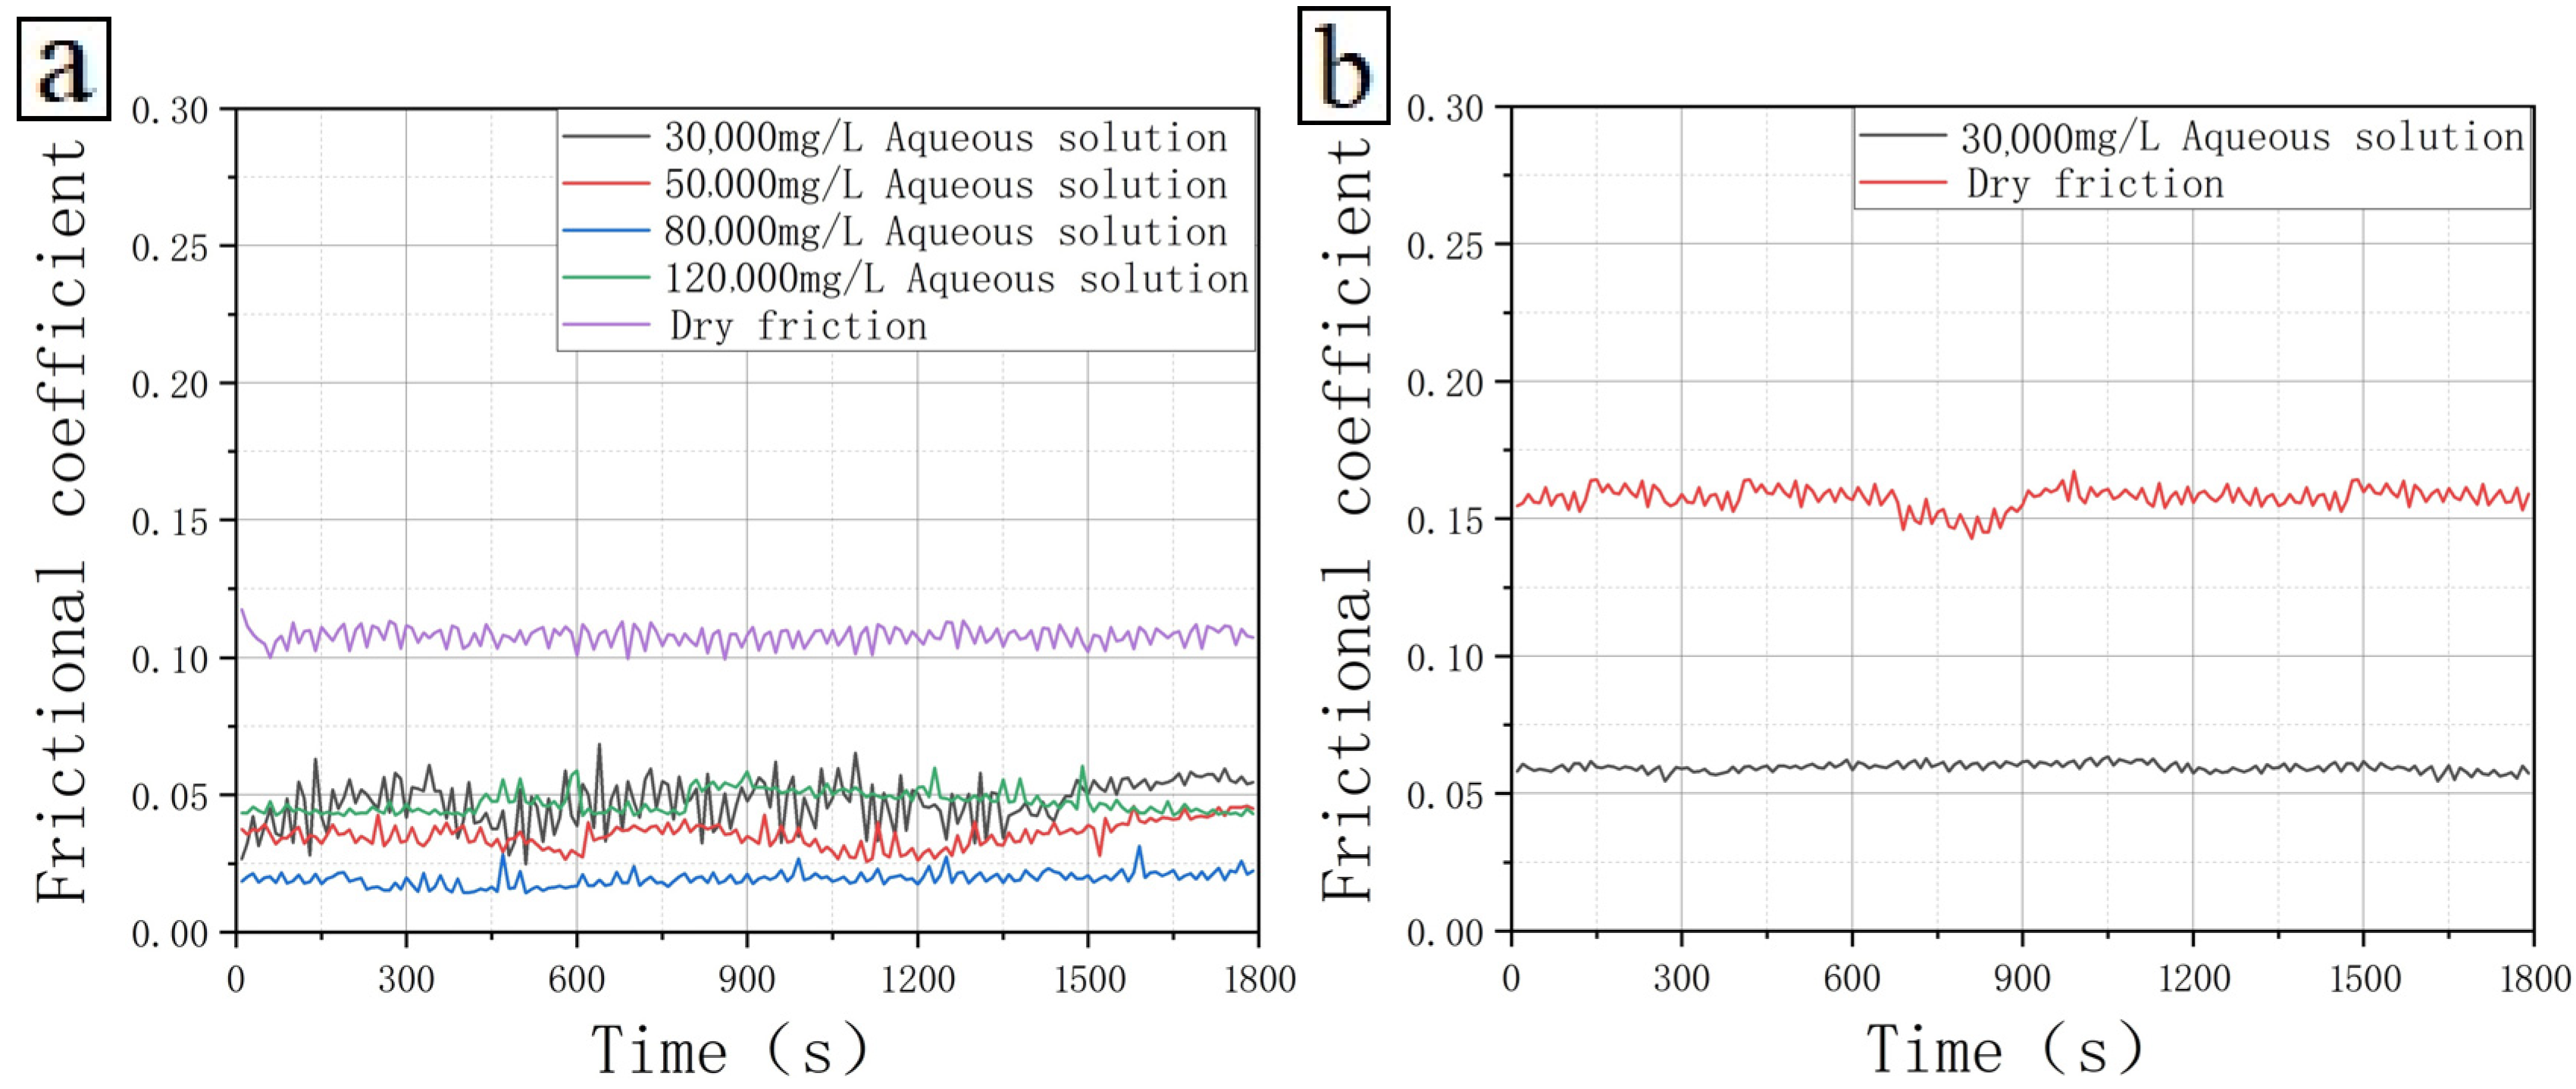
Figure 3.
Friction coefficient of polyethylene inner lining tubing material under different mineralization degrees: (a) Polyethylene inner lining pipe (disc)—45# steel (pin), (b) Polyethylene inner lining pipe (disc)—nylon (pin), (c) Polyethylene inner lining pipe (disc)—PTFE (pin), and (d) Polyethylene inner lining pipe (disc)—surface alloy coating (pin).
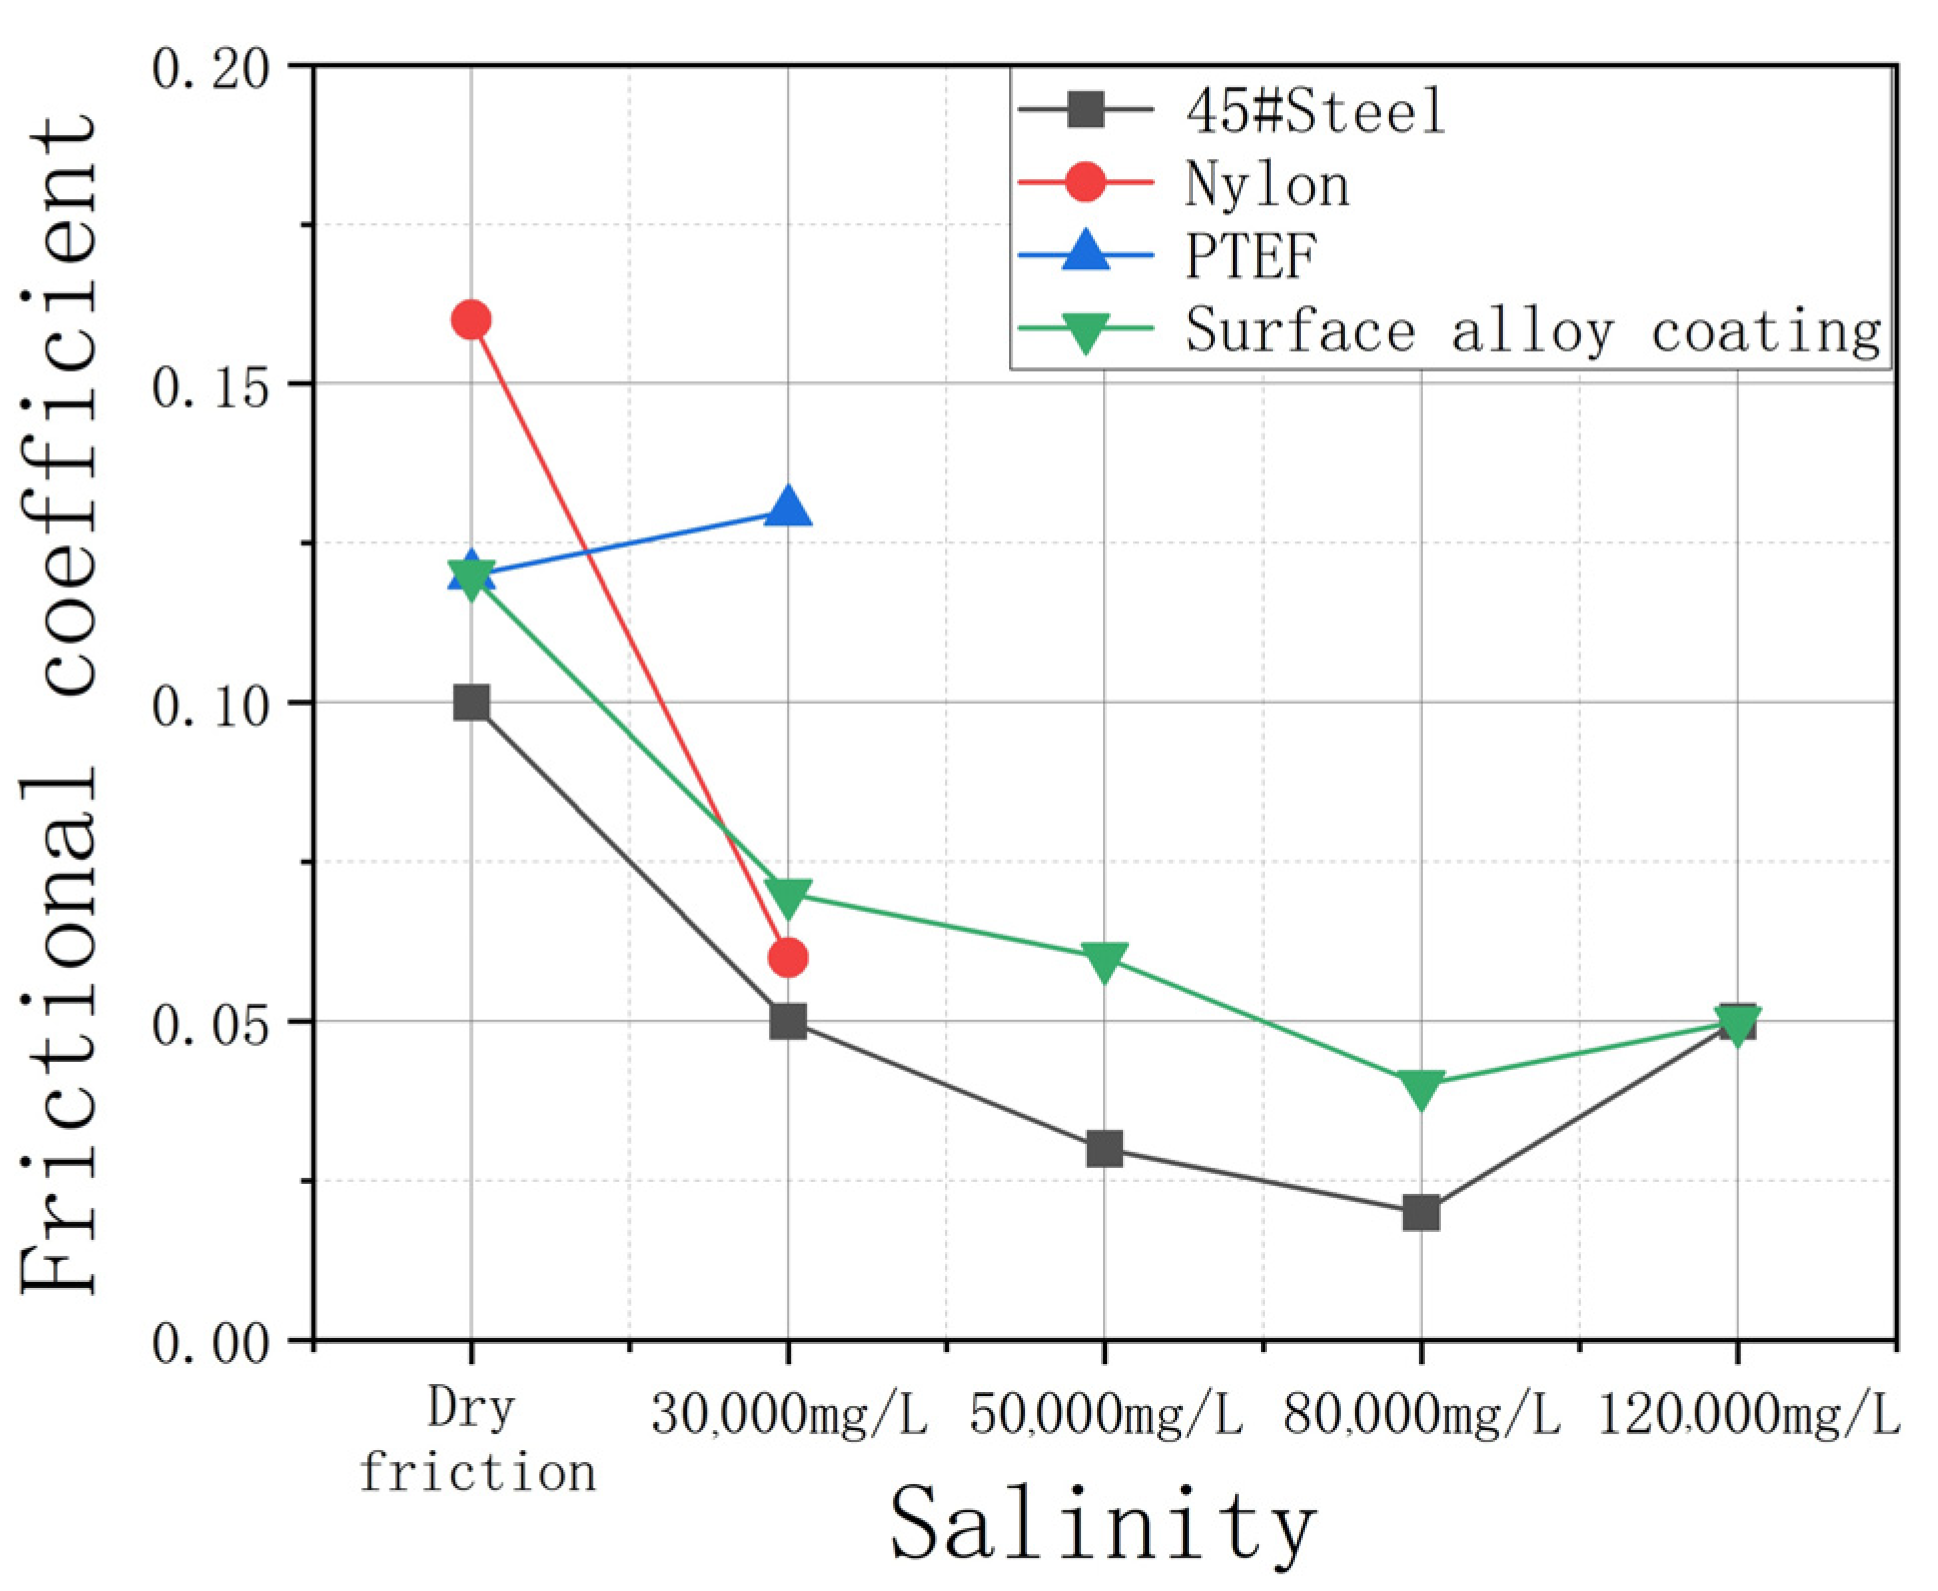
Figure 4.
Variation of friction coefficient of polyethylene inner lining pipe with mineralization degree.
Figure 4.
Variation of friction coefficient of polyethylene inner lining pipe with mineralization degree.
Figure 5.
Wear rates of the straightening material and the tubing material per hundred kilometers in aqueous solutions with different degrees of mineralization. (a) straightening material, (b) tubing material.
Figure 5.
Wear rates of the straightening material and the tubing material per hundred kilometers in aqueous solutions with different degrees of mineralization. (a) straightening material, (b) tubing material.
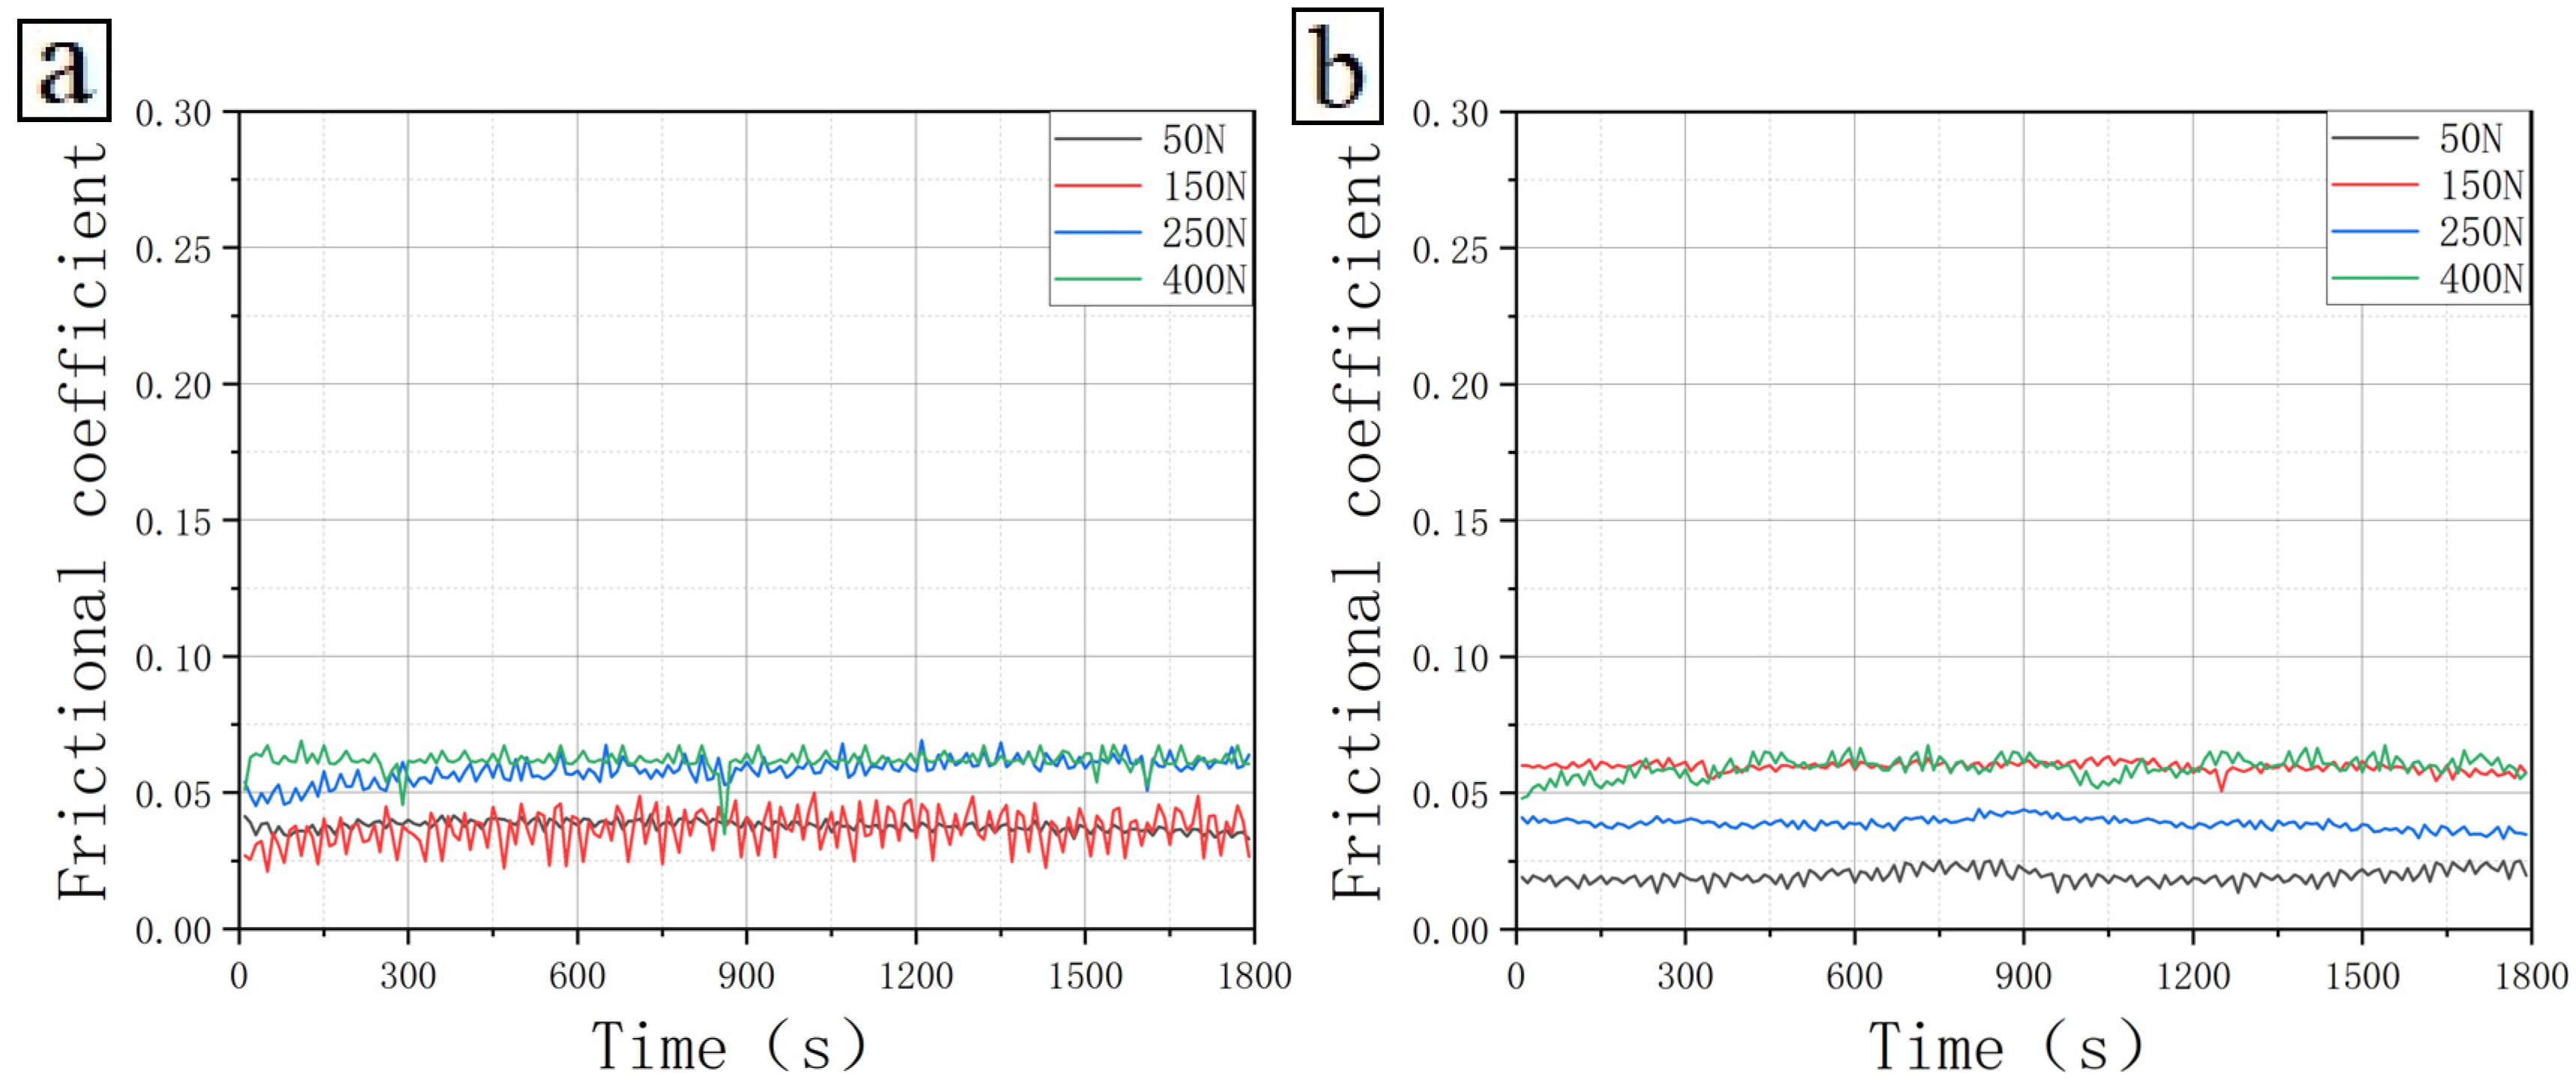
Figure 6.
Friction coefficient of polyethylene lined oil pipe material under different test loads (dry friction): (a) Polyethylene inner lining pipe (disc)—45# steel (pin), (b) Polyethylene inner lining pipe (disc)—nylon (pin), (c) Polyethylene inner lining pipe (disc)—PTFE (pin), and (d) Polyethylene inner lining pipe (disc)—surface alloy coating (pin).
Figure 7.
Variation of friction coefficient of polyethylene inner lining pipe with applied load (dry friction).
Figure 7.
Variation of friction coefficient of polyethylene inner lining pipe with applied load (dry friction).
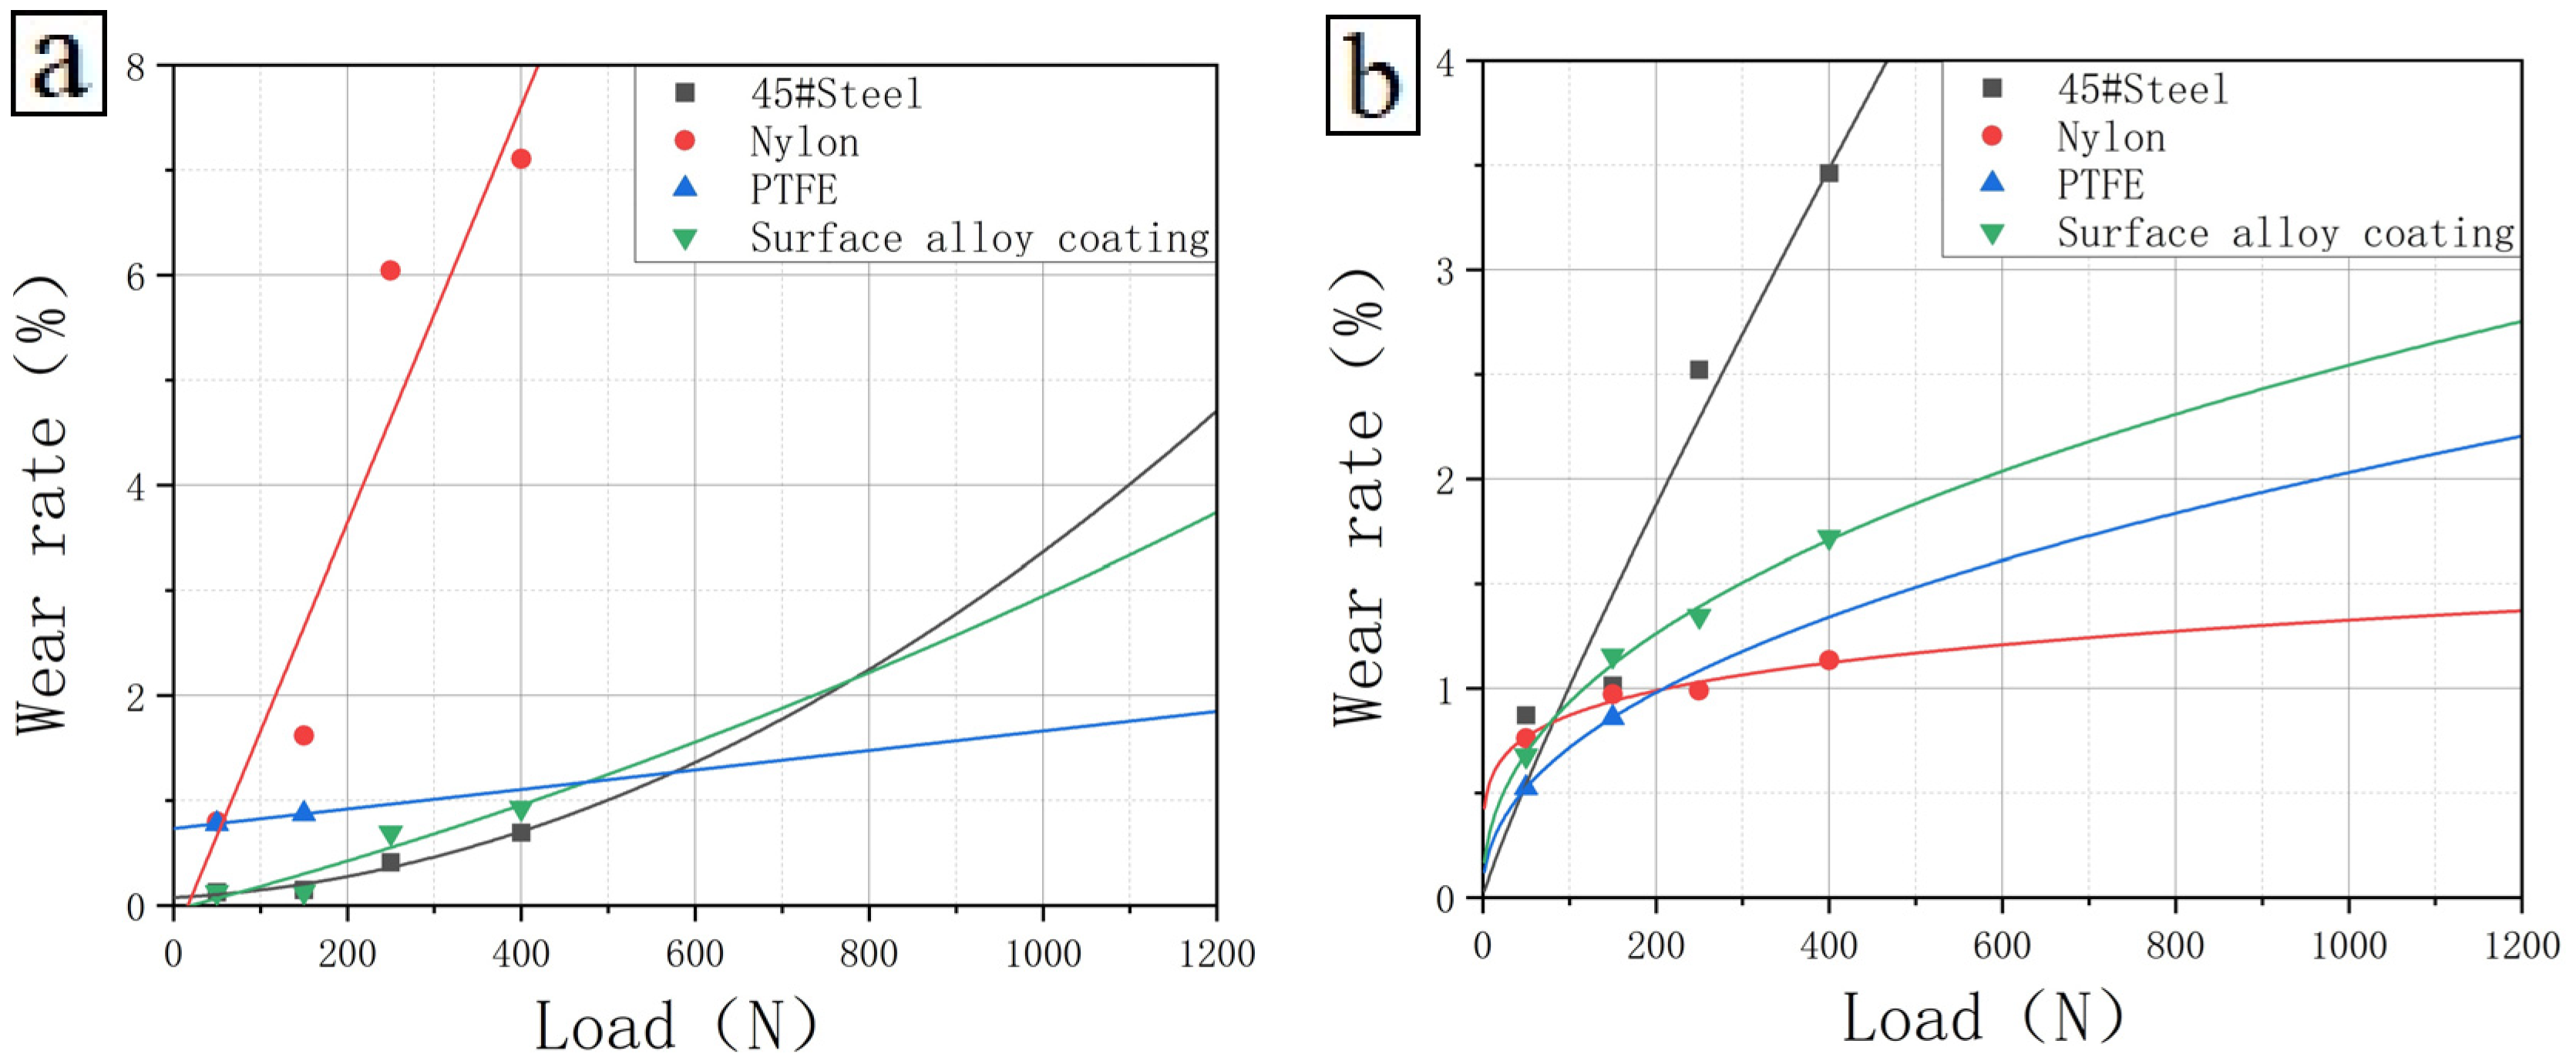
Figure 8.
Variation of wear rate with applied load (dry friction): (a) straightening material and (b) oil pipe material.
Figure 8.
Variation of wear rate with applied load (dry friction): (a) straightening material and (b) oil pipe material.
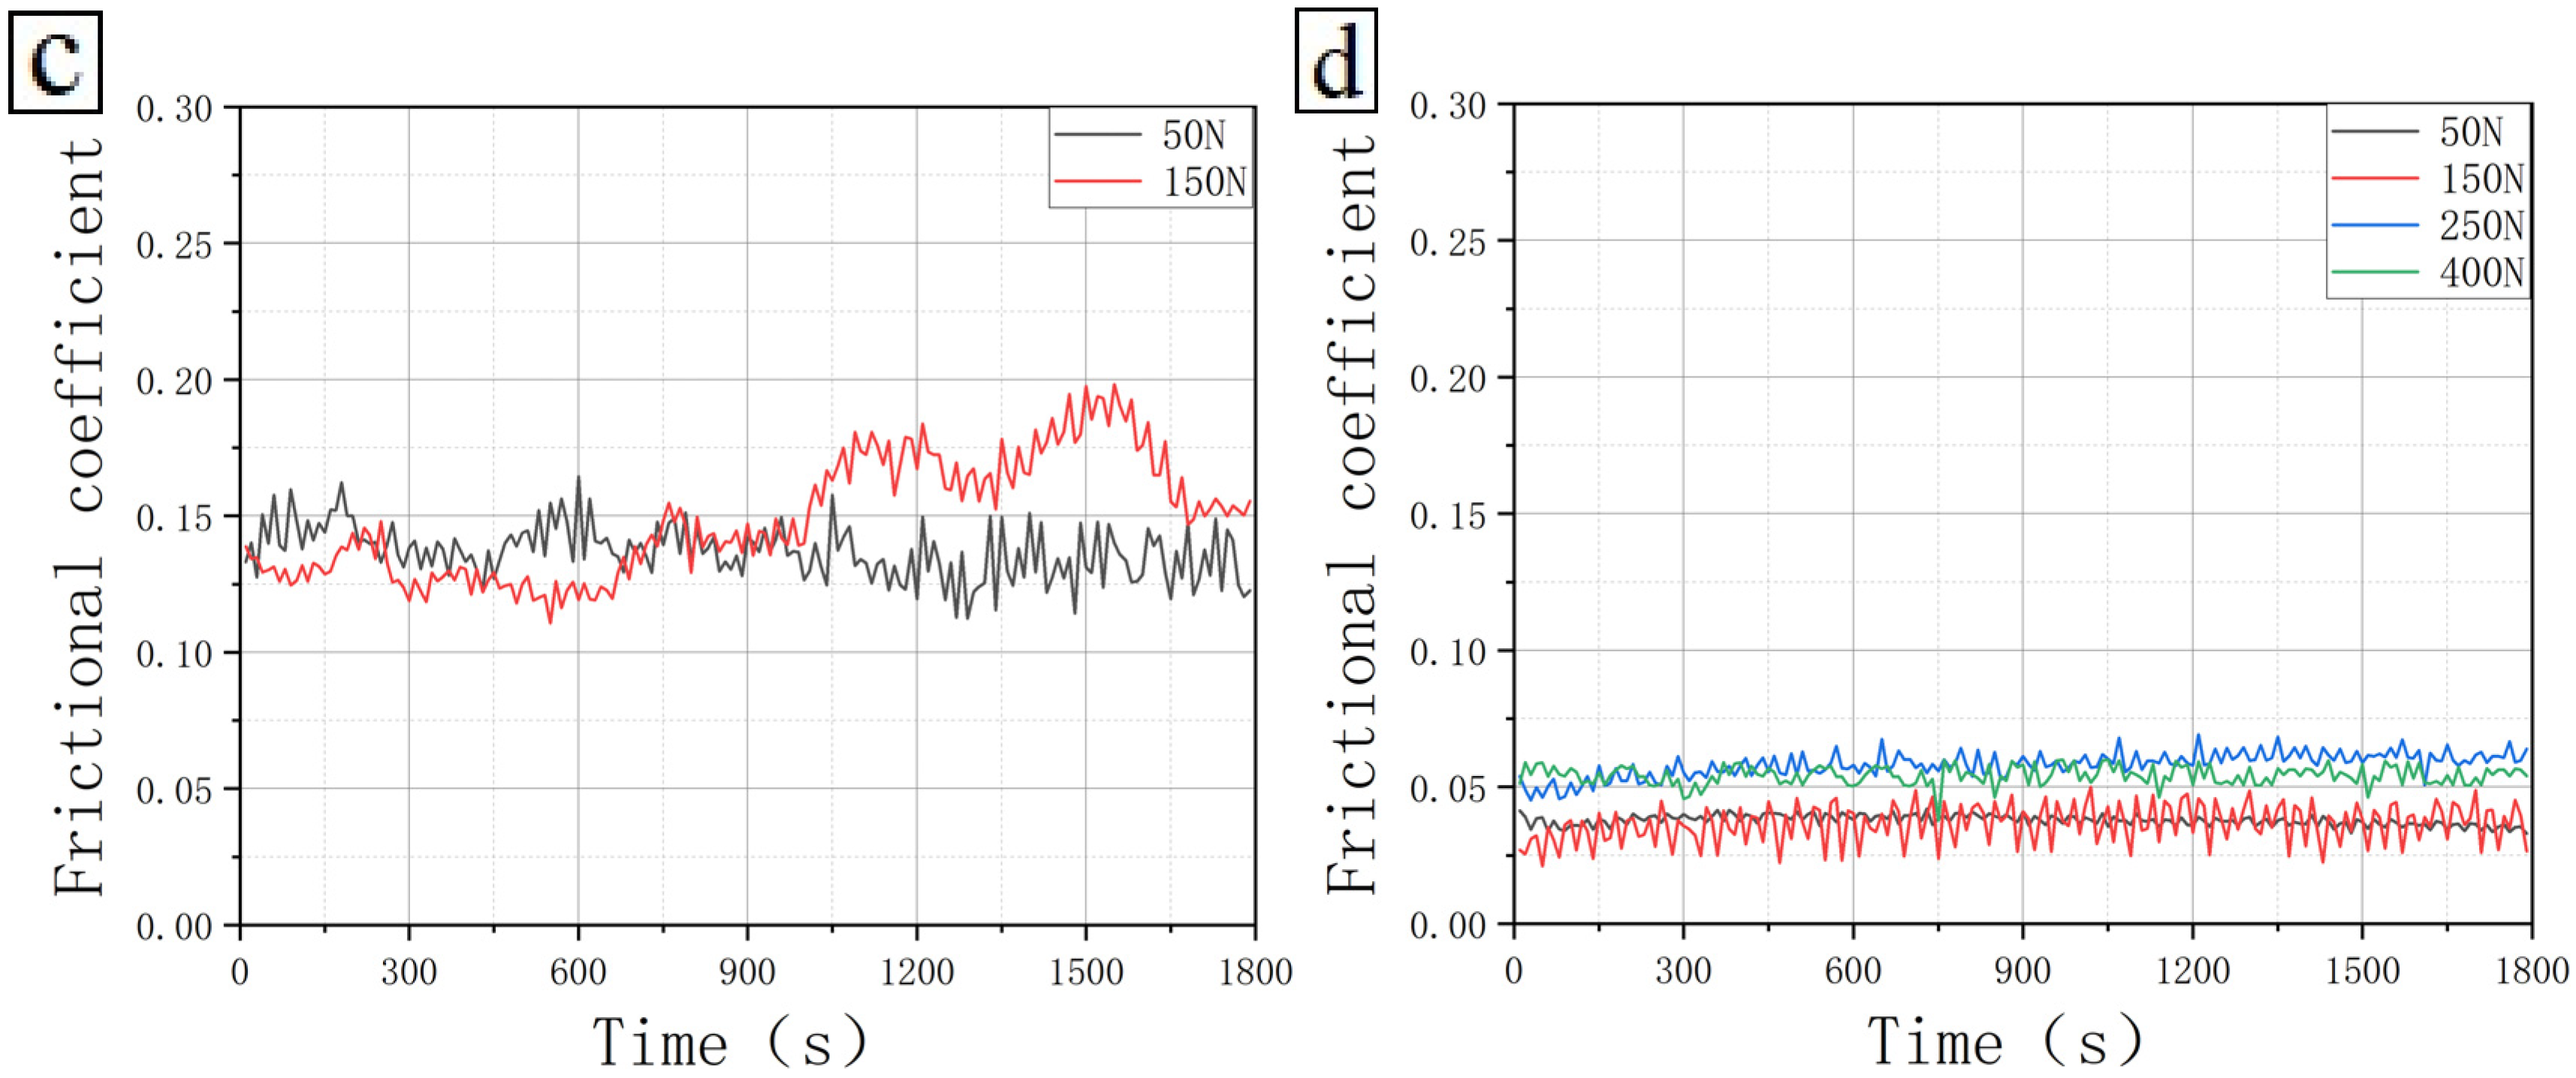
Figure 9.
Friction coefficient of polyethylene lined oil pipe material under different test loads (aqueous solution): (a) Polyethylene inner lining pipe (disc)—45# steel (pin), (b) Polyethylene inner lining pipe (disc)—nylon (pin), (c) Polyethylene inner lining pipe (disc)—PTFE (pin), and (d) Polyethylene inner lining pipe (disc)—surface alloy coating (pin).
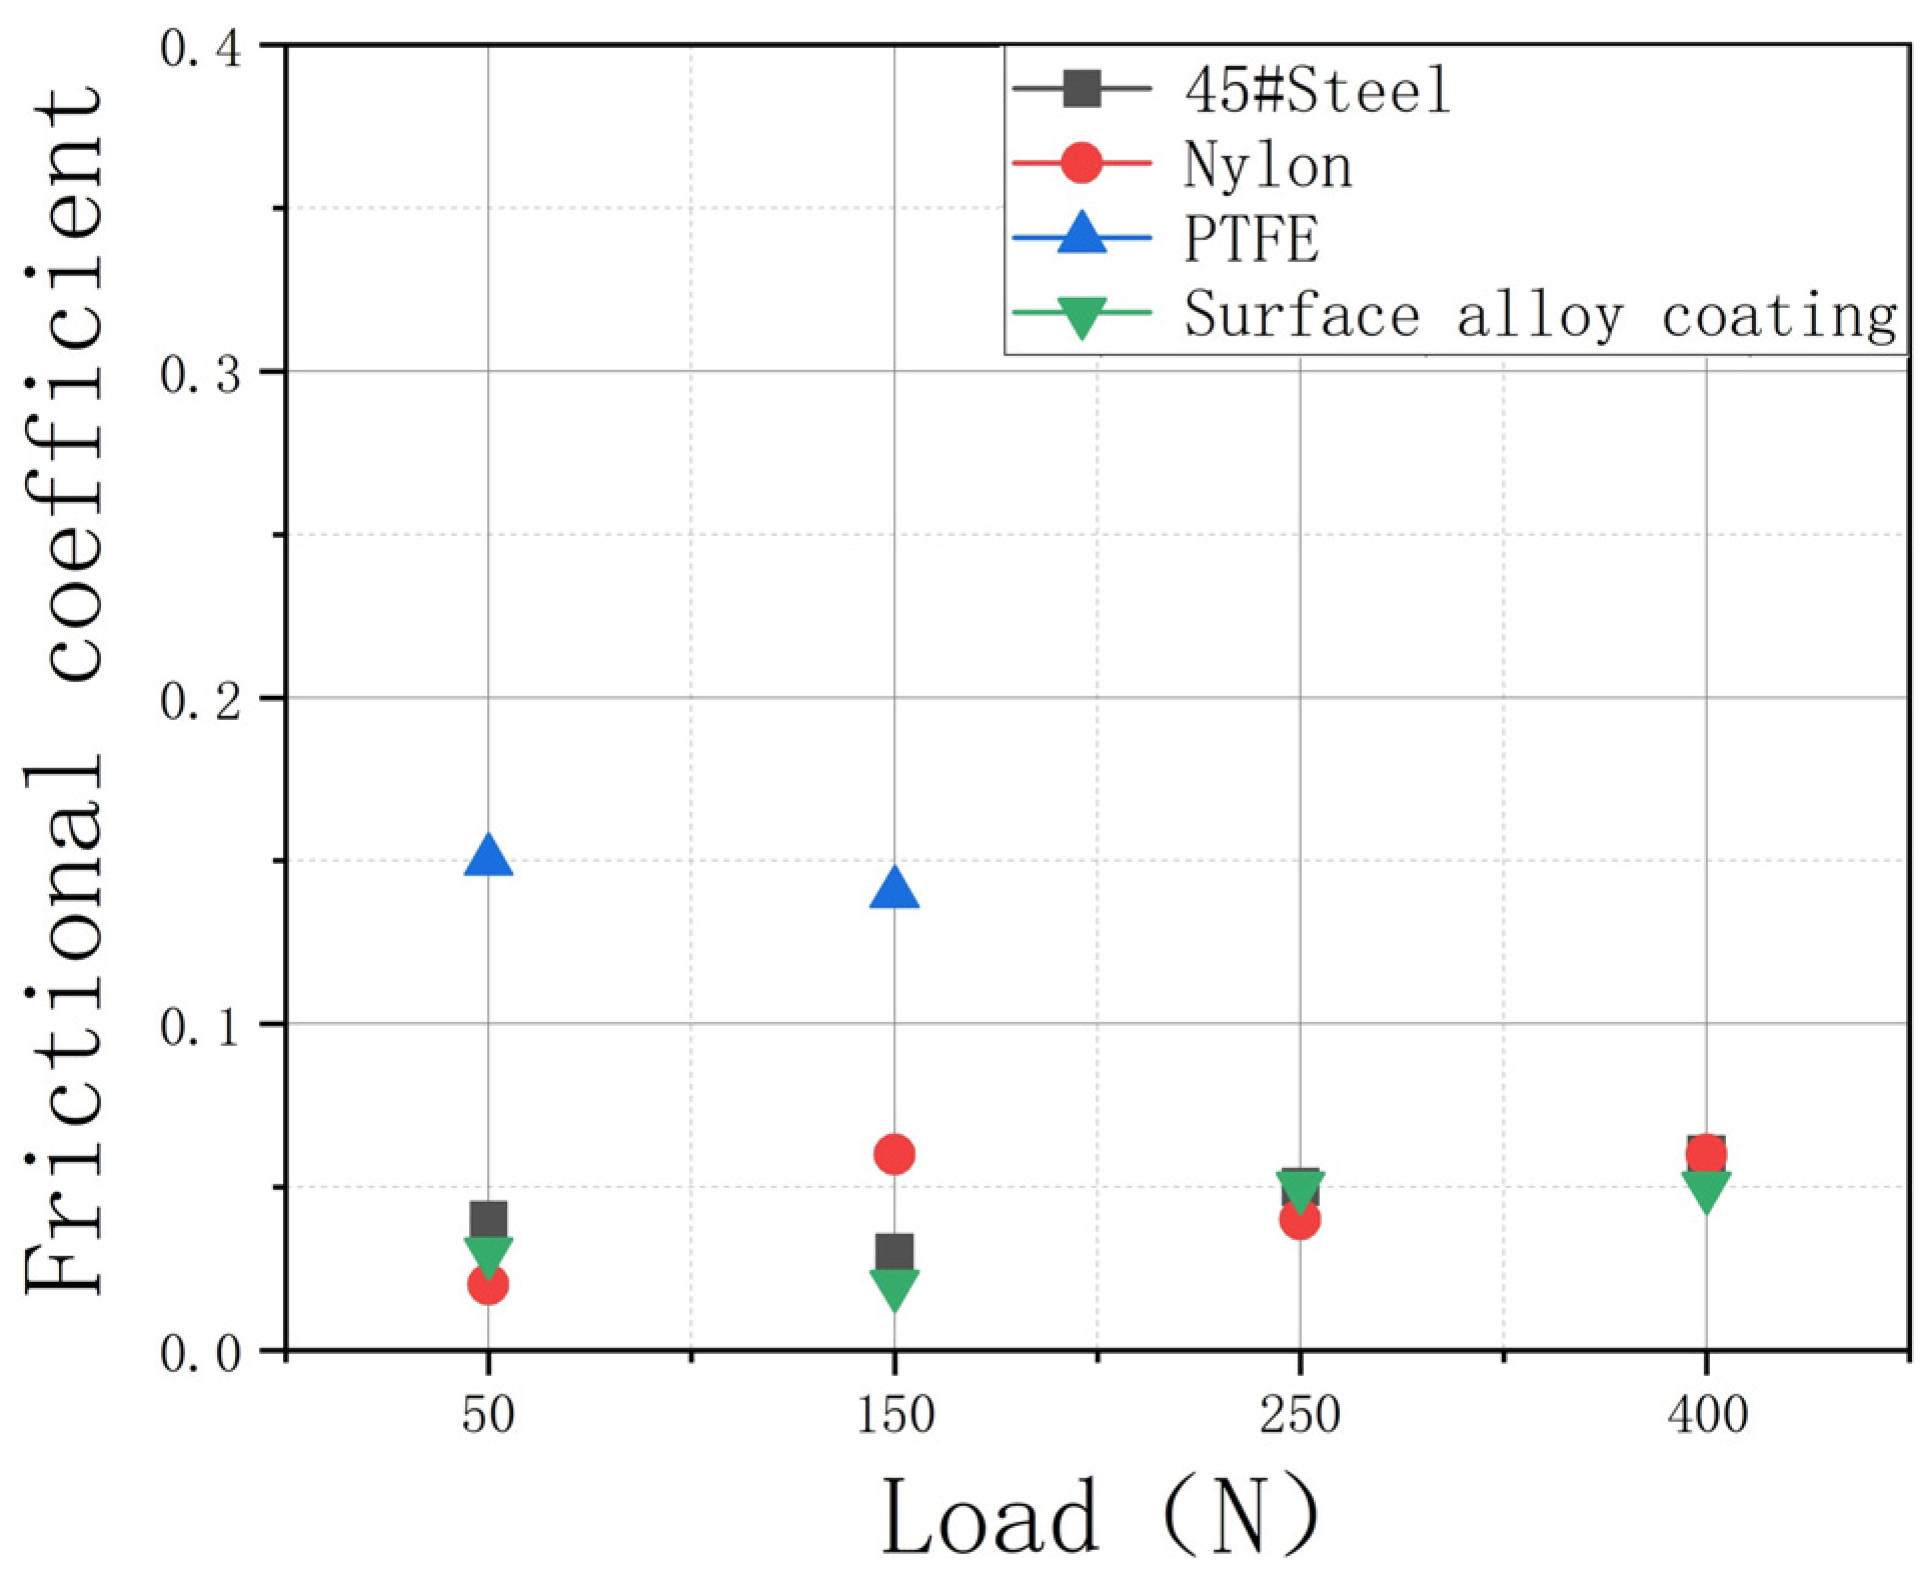
Figure 10.
Variation of friction coefficient of polyethylene inner lining pipe with applied load (30,000 mg/L mineralization degree aqueous solution).
Figure 10.
Variation of friction coefficient of polyethylene inner lining pipe with applied load (30,000 mg/L mineralization degree aqueous solution).
Figure 11.
Variation of wear rate with applied load (dry friction): (a) straightening material and (b) oil pipe material (30,000 mg/L mineralization degree aqueous solution).
Figure 11.
Variation of wear rate with applied load (dry friction): (a) straightening material and (b) oil pipe material (30,000 mg/L mineralization degree aqueous solution).
Figure 12.
SEM images of the worn surface of polyethylene inner lining pipe (disc)–surface alloy coating (pin) under different loading conditions in a 30,000 mg/L mineralization degree aqueous solution: (a) surface alloy coatings under 50 N, (b) polyethylene under 50 N, (c) surface alloy coatings under 150 N, (d) polyethylene under 150 N, (e) surface alloy coatings under 250 N, (f) polyethylene under 250 N, (g) surface alloy coatings under 400 N, and (h) polyethylene under 400 N.
Figure 13.
Three—Dimensional Confocal Microscopic Images and height contour of polyethylene inner lining pipe (disc)—surface alloy coating (pin) under different loading conditions in a 30,000 mg/L mineralization degree aqueous solution: (a) polyethylene under 50 N, (b) polyethylene under 150 N, (c) polyethylene under 250 N, and (d) polyethylene under 400 N.
Figure 14.
Three—Dimensional Confocal Microscopic Images and height contour of polyethylene inner lining pipe (disc)—surface alloy coating (pin) under different loading conditions in a 30,000 mg/L mineralization degree aqueous solution: (a) surface alloy coatings under 50 N, (b) surface alloy coatings under 150 N, (c) surface alloy coatings under 250 N, and (d) surface alloy coatings under 400 N.
Table 1.
Analysis results of polyethylene composition.
Table 1.
Analysis results of polyethylene composition.
| Type | Specifications | Compressive Strength (MPa) | Density
(g/cm3) | Tensile Strength
(MPa) | Elongation (%) | Molecular Formula | Molecular Mass |
|---|
| Polyethylene | HDPE | 24 | 0.95 | / | / | (C2H4)n | 100,000 |
| Polytetrafluoroethylene | 60MM | 4 | 2.2 | >15 | >150 | CF3(CF2CF2)nCF3 | 100.02 |
| Nylon | PA6 | >105 | 1.14 | >90 | 20–30 | [-NH-(CH2)5-CO]n | 20,000 |
Table 2.
Sample microhardness test results.
Table 2.
Sample microhardness test results.
| Material | Nylon | Polyethylene | Polytetrafluoroethylene | Paint-Coating |
|---|
| Shore hardness | 80 | 66 | 60 | 74 |
Table 3.
Friction coefficient of polyethylene inner lining tubing material under different mineralization degrees.
Table 3.
Friction coefficient of polyethylene inner lining tubing material under different mineralization degrees.
| Frictional Coefficient | 30,000 mg/L | 50,000 mg/L | 80,000 mg/L | 120,000 mg/L | Dry Friction |
|---|
| Polyethylene inner lining pipe (disc)—45# steel (pin) | 0.05 | 0.03 | 0.02 | 0.05 | 0.1 |
| Polyethylene inner lining pipe (disc)—nylon (pin) | 0.06 | / | / | / | 0.16 |
| Polyethylene inner lining pipe (disc)—PTFE (pin) | 0.13 | / | / | / | 0.12 |
| Polyethylene inner lining pipe (disc)—surface alloy coating (pin) | 0.07 | 0.06 | 0.04 | 0.05 | 0.12 |
Table 4.
Wear rate of straightening material per hundred kilometers under different mineralization degrees.
Table 4.
Wear rate of straightening material per hundred kilometers under different mineralization degrees.
| Wear Rate per Hundred Kilometers (Straightening Material) (Unit: %) | 30,000 mg/L | 50,000 mg/L | 80,000 mg/L | 120,000 mg/L | Dry Friction |
|---|
| Polyethylene inner lining pipe (disc)—45# steel (pin) | 2.131 | 2.496 | 2.643 | 2.504 | 0.259 |
| Polyethylene inner lining pipe (disc)—nylon (pin) | 1.596 | 1.479 | 1.634 | 1.527 | 1.787 |
| Polyethylene inner lining pipe (disc)—PTFE (pin) | 1.274 | 1.364 | 1.524 | 1.472 | 0.987 |
| Polyethylene inner lining pipe (disc)—surface alloy coating (pin) | 7.420 | 7.869 | 7.582 | 7.677 | 0.130 |
Table 5.
Wear rate of polyethylene lined oil pipe material per hundred kilometers.
Table 5.
Wear rate of polyethylene lined oil pipe material per hundred kilometers.
| Wear Rate per Hundred Kilometers (Oil Pipe Material) (Unit: %) | 30,000 mg/L | 50,000 mg/L | 80,000 mg/L | 120,000 mg/L | Dry Friction |
|---|
| Polyethylene inner lining pipe (disc)—45# steel (pin) | 14.133 | 14.826 | 14.867 | 14.853 | 1.176 |
| Polyethylene inner lining pipe (disc)—nylon (pin) | 9.428 | 9.996 | 9.783 | 10.054 | 1.079 |
| Polyethylene inner lining pipe (disc)—PTFE (pin) | 3.243 | 3.876 | 3.548 | 3.369 | 0.975 |
| Polyethylene inner lining pipe (disc)—surface alloy coating (pin) | 4.579 | 4.978 | 4.669 | 4.823 | 1.328 |
Table 6.
Friction coefficient of polyethylene lined oil pipe material under different test loads (dry friction).
Table 6.
Friction coefficient of polyethylene lined oil pipe material under different test loads (dry friction).
| Frictional Coefficient | 50 N | 150 N | 250 N | 400 N |
|---|
| Polyethylene inner lining pipe (disc)—45# steel (pin) | 0.21 | 0.1 | 0.15 | 0.15 |
| Polyethylene inner lining pipe (disc)—nylon (pin) | 0.02 | 0.15 | 0.07 | 0.08 |
| Polyethylene inner lining pipe (disc)—polytetrafluoroethylene (pin) | 0.16 | 0.14 | / | / |
| Polyethylene inner lining pipe (disc)—surface alloy coating (pin) | 0.05 | 0.11 | 0.08 | 0.06 |
Table 7.
Wear rate of straightening material per hundred kilometers under different test loads (dry friction).
Table 7.
Wear rate of straightening material per hundred kilometers under different test loads (dry friction).
| Wear Rate per Hundred Kilometers (Straightening Material) (Unit: %) | 50 N | 150 N | 250 N | 400 N |
|---|
| Polyethylene inner lining pipe (disc)—45# steel (pin) | 0.131 | 0.259 | 0.523 | 0.836 |
| Polyethylene inner lining pipe (disc)—nylon (pin) | 0.893 | 1.787 | 6.219 | 7.634 |
| Polyethylene inner lining pipe (disc)—polytetrafluoroethylene (pin) | 0.935 | 0.987 | / | / |
| Polyethylene inner lining pipe (disc)—surface alloy coating (pin) | 0.129 | 0.130 | 0.777 | 1.035 |
Table 8.
Wear rate of oil pipe material per hundred kilometers under different test loads (dry friction).
Table 8.
Wear rate of oil pipe material per hundred kilometers under different test loads (dry friction).
| Wear Rate per Hundred Kilometers (Oil Pipe Material) (Unit: %) | 50 N | 150 N | 250 N | 400 N |
|---|
| Polyethylene inner lining pipe (disc)—45# steel (pin) | 0.927 | 1.176 | 2.712 | 3.787 |
| Polyethylene inner lining pipe (disc)—nylon (pin) | 0.968 | 1.079 | 1.176 | 1.341 |
| Polyethylene inner lining pipe (disc)—polytetrafluoroethylene (pin) | 0.568 | 0.975 | / | / |
| Polyethylene inner lining pipe (disc)—surface alloy coating (pin) | 0.774 | 1.328 | 1.633 | 1.934 |
Table 9.
Friction coefficient of polyethylene lined oil pipe material under different test loads (aqueous solution).
Table 9.
Friction coefficient of polyethylene lined oil pipe material under different test loads (aqueous solution).
| Frictional Coefficient | 50 N | 150 N | 250 N | 400 N |
|---|
| Polyethylene inner lining pipe (disc)—45# steel (pin) | 0.04 | 0.03 | 0.05 | 0.06 |
| Polyethylene inner lining pipe (disc)—nylon (pin) | 0.02 | 0.06 | 0.04 | 0.06 |
| Polyethylene inner lining pipe (disc)—polytetrafluoroethylene (pin) | 0.15 | 0.14 | / | / |
| Polyethylene inner lining pipe (disc)—surface alloy coating (pin) | 0.03 | 0.02 | 0.05 | 0.05 |
Table 10.
Wear rate of straightening material per hundred kilometers under different test loads (30,000 mg/L mineralization degree aqueous solution).
Table 10.
Wear rate of straightening material per hundred kilometers under different test loads (30,000 mg/L mineralization degree aqueous solution).
| Wear Rate per Hundred Kilometers (Straightening Material) (Unit: %) | 50 N | 150 N | 250 N | 400 N |
|---|
| Polyethylene inner lining pipe (disc)—45# steel (pin) | 0.124 | 0.147 | 0.409 | 0.694 |
| Polyethylene inner lining pipe (disc)—nylon (pin) | 0.798 | 1.620 | 6.044 | 7.105 |
| Polyethylene inner lining pipe (disc)—polytetrafluoroethylene (pin) | 0.779 | 0.872 | / | / |
| Polyethylene inner lining pipe (disc)—surface alloy coating (pin) | 0.127 | 0.129 | 0.694 | 0.925 |
Table 11.
Wear rate of oil pipe material per hundred kilometers under different test loads (30,000 mg/L mineralization degree aqueous solution).
Table 11.
Wear rate of oil pipe material per hundred kilometers under different test loads (30,000 mg/L mineralization degree aqueous solution).
| Wear Rate per Hundred Kilometers (Oil Pipe Material) (Unit: %) | 50 N | 150 N | 250 N | 400 N |
|---|
| Polyethylene inner lining pipe (disc)—45# steel (pin) | 0.872 | 1.013 | 2.521 | 3.462 |
| Polyethylene inner lining pipe (disc)—nylon (pin) | 0.761 | 0.972 | 0.991 | 1.136 |
| Polyethylene inner lining pipe (disc)—polytetrafluoroethylene (pin) | 0.524 | 0.861 | / | / |
| Polyethylene inner lining pipe (disc)—surface alloy coating (pin) | 0.679 | 1.156 | 1.346 | 1.721 |


 ,
, 


