Abstract
The use of silver-based antimicrobial materials has been growing recently. Considering the threat of developing silver-resistant bacteria, it is essential to address the endurance of such materials and the amount of silver released into the environment. Here we report on a durable, antibacterial Ag/TiBx nanocomposite coating prepared by conventional magnetron sputtering. The coating consists of fine Ag clusters embedded in extremely hard, wear-resistant overstoichiometric TiBx, which serves as a protective matrix. The highest E. coli growth inhibition of 97% is observed for the coating containing 24 at.% of Ag. A strong antibacterial effect is also maintained after 45 days of immersion in the Luria–Bertani + 5% HNO3 solution. Despite a marked hardness decrease from 40 GPa for TiBx to 6.4 GPa for Ag/TiBx with 28 at.% of Ag, the coating maintains a good specific wear rate of 6 × 10⁻⁵ mm3/Nm. Moreover, the addition of Ag, which acts as a solid lubricant, decreases the coefficient of friction from 0.77 to 0.35, even at room temperature. Thanks to the combination of antibacterial properties and enhanced wear resistance, such material can find application as a protective coating for cutlery, door handles, water taps, and other daily-used objects in public areas.
1. Introduction
Silver is often used in material functionalization due to its strong antimicrobial effect. However, the commonly used wet process of immersing the substrate into a silver-containing solution, e.g., colloidal silver, has its drawbacks. The deposited Ag atoms have poor adhesion to the substrate, which results in a limited lifetime of the antibacterial product [1]. Moreover, it represents a significant environmental burden, which may eventually lead to the development of silver-resistant bacteria [2]. Therefore, a dry process with zero liquid waste capable of Ag deposition with strong adhesion is desired. These requirements can be met by the physical vapor deposition (PVD) process, which ensures strong adhesion between the substrate and the deposited material [3,4] and enables the preparation of an Ag-based coating with a longer and more stable antimicrobial effect compared to the wet process [5].
In order to increase the active surface, the Ag is often prepared in the form of nanoparticles (NPs) [6]. Due to the absence of chemical bonding to the substrate, the prepared NPs are usually embedded in a supportive matrix, which prevents their premature detachment. For example, Kuzminova et al. prepared a layered structure of Ag NPs and polymerized hexamethyldisiloxane [7]. However, the low wear resistance of the Ag/polymer composite would deteriorate the coating lifetime in applications with excess mechanical stress. Plain magnetron-sputtered Ag films with antibacterial properties were also reported [8,9]. Despite a strong inhibition effect on the airborne bacteria for the 50 nm thick Ag film, they share the same drawback of low wear resistance due to the mechanical properties of pure soft silver. Therefore, the development of wear-resistant, easily cleanable, and long-lasting antimicrobial coatings for surgical instruments or the food processing industry is of high interest.
Antimicrobial and tribological properties were examined in transition-metal (TM) nitrides such as Ag/TiN [10], Ag/NbN [11,12], and Ag/ZrN [13,14] or in diamond-like carbon films Ag/DLC [15,16]. Although TM diborides are promising candidates for robust matrix materials due to their mechanical and chemical properties [17], only a few works have been devoted to Ag/TMB2. Mechanical and tribological properties were reported for Ag/ZrB2 [18] and Ag/CrB2 [19], but the antimicrobial properties were not examined in these works. The potential of Ag-doped TMB2 thus remains unexplored.
Titanium diboride belongs to the hardest diborides [20,21] and has excellent chemical stability, even in harsh environments. Moreover, it has been reported as a biocompatible material [22]. Due to the insolubility of Ag in TMB2 [18], a formation of an Ag/TiB2 composite is expected instead of a solid solution in which the Ag atoms would be passivated by the surrounding TiB2. Therefore, TiB2 is a suitable candidate for the wear-resistant matrix.
The combination of Ag and TiB2 has been researched for electrical applications, where the Ag bulk reinforced by TiB2 is used as an arc-resistant contact material [23,24,25]. However, such research is limited to a low amount of TiB2 in the Ag matrix, and the antimicrobial effect of such composite is not examined. Sun et al. reported a laser-cladding prepared Cu/TiB2 composite with a hardness of 70 HRC and excellent abrasion resistance, although at the expense of decreasing the antibacterial effect after adding TiB2 [26].
In this paper, Ag-doped TiBx thin films were prepared by magnetron co-sputtering and examined by EDS, WDS, XPS, XRD, SEM, and STEM. Moreover, hardness, coefficient of friction, specific wear rate, and antibacterial activity were evaluated. A wide range of Ag content from 1.4 up to 28 at.% allows us to observe a transition from a columnar to nanocomposite structure with segregated Ag clusters of 2–40 nm with a strong impact on the film hardness. This work also aims to determine the minimum Ag concentration that ensures antibacterial activity while providing adequate mechanical resistance. To evaluate the ability of the TiBx matrix to prevent premature depletion of Ag from the film, the Ag release rate was monitored by means of ICP measurements for the as-deposited samples and for samples immersed for 45 days in the solution with 5% of HNO3.
Possible applications include protective coatings on cutlery, door handles, water taps, and other daily-used objects in public areas such as medical facilities, mass transport vehicles, shopping centers, etc. Thanks to its biocompatibility and decreased friction coefficient, the film can be utilized in food processing machines as a wear-resistant surface with antibacterial properties. To our best knowledge, this is the first work where the mechanical, tribological, and antibacterial properties of Ag-doped TiBx thin films are studied and quantified.
2. Materials and Methods
2.1. Preparation
The samples were prepared by magnetron co-sputtering from two 100 mm circular TiB2 (99.5%) and Ag (99.95%) targets on polished 5 × 8 mm silicon, sapphire wafers, and circular K100 steel substrates. Prior to the deposition, substrates were ultrasonically cleaned in acetone, isopropyl alcohol, and distilled water and in situ etched by Ar+ ions (800 V, 100 mA) for 5 min. Subsequently, a ~150 nm thick Cr buffer layer was deposited from the Cr target (99.95%). In the next step, the Ag/TiBx coatings were sputtered with the TiB2 target power fixed at 1000 W, while the Ag target power was adjusted to 0, 30, 50, 100, 150, and 200 W to control the Ag concentration in the coating. This resulted in six samples labeled according to the Ag target power. Before deposition, the chamber was evacuated to a base pressure of 1 × 10⁻³ Pa. The subsequent heating of the substrate holder to the temperature of 200 °C in combination with ion cleaning (800 V, 100 mA) was used to remove the residual impurities and moisture from the substrates. All depositions were carried out at a negative bias of −60 V, and the substrate temperature was kept at 200 °C. The magnetron configuration for co-sputtering at a 45° angle is depicted in the inset of Figure 1b. Due to the different angle distributions of Ti and B [20], the substrates’ positions on the holder were offset relative to the magnetron axes. The deposition time of 30–60 min was adjusted in order to obtain a film thickness of approximately 1.5 μm.
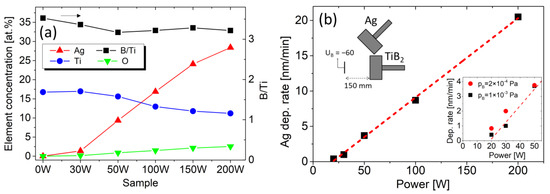
Figure 1.
(a) Left axis: concentration of Ag, Ti, and O in samples prepared with 0, 30, 50, 100, 150, and 200 W on the Ag target obtained by the EDS. Right axis: B/Ti ratio obtained by WDS. (b) Ag deposition rate as a function of the Ag sputtering power. The left inset shows the arrangement of magnetrons. The right inset shows variation for the different base pressures.
2.2. Analytical Methods
The elemental composition of the films was analyzed by energy-dispersive X-ray spectroscopy (EDS, INCA Oxford Instruments, Abingdon, UK). The stoichiometry of TiBx was determined by wave dispersive X-ray spectroscopy (WDS, INCA Oxford Instruments, Abingdon, UK) calibrated with a TiB2 standard. In both cases, the primary electron beam energy of 10 keV was used. The resulting content in atomic percentage (at.%) is an average from several sample regions with a typical standard deviation of ±1 at.%. Information related to the Ag chemical bonds was obtained by X-ray photoelectron spectroscopy (XPS, Omicron Nanotechnology, Taunusstein, Germany, photon energy of 1486.7 eV). The core level spectra were fitted using the Shirley background and Gaussian–Lorentzian (GL) peak shape using the CasaXPS software v2.3.25 [27].
The crystallographic structure was measured by X-ray diffraction (XRD, PANalytical X’Pert Pro, Malvern, UK) with Cu Kα radiation in the symmetrical θ/2θ setup. The surface and cross-section morphologies were examined by scanning electron microscope (SEM, Thermo Fisher Scientific Apreo 2, Waltham, MA, USA). The nanostructure of selected samples was analyzed by scanning transmission electron microscopy (STEM) and electron diffraction using FEI Titan TEM (FEI Company, Hillsboro, OR, USA) operated at 200 kV. The images were analyzed by the CrysTBox software v1.10 [28]. The nanoscale elemental maps were obtained by STEM energy dispersive X-ray spectroscopy (STEM-EDS, SuperX, FEI Company, Hillsboro, OR, USA). The cross-section TEM specimens were prepared by focused ion beam (FIB) at 30 kV and finalized at low current.
The antimicrobial effect was analyzed by the growth inhibition assay. Gram-negative bacteria Escherichia coli DH5αF’ [29] were cultivated at 37 °C in Luria–Bertani (LB) medium at 180 rpm in a rotary shaker overnight. The next day, the bacterial suspension was inoculated into new LB media and cultivated until the optical density (OD) reached the value of 0.08–0.12 (0.5 MFU (McFarland Unit)). The bacterial growth inhibition assay was performed in a 96-well microtiter plate with a final culture density of 1.5 × 10⁶ cells/mL per well in 300 µL of LB media with tested silver-coated material. A cleaned Si substrate was used as a reference. After 3 h of incubation at 37 °C at 180 rpm, E. coli growth was measured by an absorbance reading at 590 nm after 3 h. The test was repeated three times for two specimens of each sample, and the reported growth inhibition is calculated from the average values of these six OD readings.
An inductively coupled plasma analyzer (ICP, Thermo Fisher Scientific ICAP 7000, Waltham, MA, USA) was used to analyze the Ag concentration released from the film. The Ag/TiBx films on Si substrates with a total surface area of 80 mm2 were immersed in a 5 mL solution of LB medium + 5% HNO3 for 14 days. Two tests were performed, the first one with the as-deposited samples and the second one with samples that had rested for 45 days in the LB + 5% HNO3 solution. The released Ag concentrations were calculated based on the calibration curve obtained with Ag standard solutions (Sigma-Aldrich, St. Louis, MO, USA) with concentrations of 49.7, 4.97, 0.497, and 0.0497 mg/L.
Nanoindentation (Anton Paar NHT2, Graz, Austria) with a standard Berkovich diamond tip was used to determine the mechanical properties of the coatings. The reported hardness and Young’s modulus are the average values from 20 indentations calculated via Oliver and Pharr method [30]. The indentation depth did not exceed 10% of the coating thickness to minimize the substrate influence. We note that for the purpose of indentation, the Ag/TiBx coatings thickness was 1.35, 1.55, 1.7, 2.25, 2.45, and 3.15 µm for samples 0 W, 30 W, 50 W, 100 W, 150 W, and 200 W, respectively.
A tribometer (Bruker UMT 2, Billerica, MA, USA) in a ball-on-disk setup was used to evaluate the coefficient of friction (COF) and wear rate. The measurements were performed against a 100Cr6 bearing steel ball in ambient air at room temperature with a relative humidity of 30–40% and at a rotation speed of 200 rpm. The COF datasets were obtained for two loads of 2 N and 5 N for 15 min and 30 min and wear track diameters of 5 mm and 6 mm, respectively. The COF was determined as an average value during the 1000-cycle window after it had stabilized. The wear rate was evaluated for the load of 2 N as the volume removed from the wear track normalized to the normal force and total distance. The removed volume was measured by a confocal laser microscope (Keyence VK-X1000, Mechelen, Belgium).
3. Results and Discussion
3.1. Chemical Properties
The elemental EDS analysis confirms Ag concentrations of 0, 1.4, 9, 17, 24, and 28 at.% increasing with the Ag target power, as shown in Figure 1a. An increase in oxygen concentration with Ag content up to 2.5 at.% of O is observed. The WDS analysis shows an overstoichiometric composition of TiBx with x = 3.2–3.5, which slightly decreases with the sputtering power on the Ag target. The boron excess is expected, considering the different distribution angles of lighter boron compared to titanium atoms, which is typical for TiB2 sputtering [31]. To mitigate this effect, the substrates’ positions were offset relative to the magnetron axes. This reduced the WDS-determined B/Ti ratio from 4.5 to 3.5 for the reference TiBx film (0 W on the Ag target). We note that the WDS/EDS quantification of light elements such as boron has a higher degree of uncertainty compared to heavier elements such as Ti and Ag which can result in a systematic overestimation of the B/TM ratio [32]. Nevertheless, this possible deviation does not influence the trend of the B/Ti ratio in our work.
Assuming a direct proportion of deposition rate and sputtering power, the Ag atomic concentration for sample 30 W is rather low. The deviation for low Ag sputtering power is also confirmed by the deposition rate shown in Figure 1b and is observed in many other works [11,33,34,35]. Considering the low power density of 0.38 W/cm2 (30 W on target with a diameter of 100 mm), the processes on the target surface can play a role. Therefore, we prepared reference pure Ag films for the chamber evacuated to a lower base pressure of pB = 2 × 10⁻⁴ Pa. The thickness measurement shows an increased deposition rate for the lower base pressure, particularly at low sputtering power, as visible in the right inset in Figure 1b. Thus, one can assume that the decreased deposition rate is caused by the target poisoning by residual gases. Nevertheless, considering the low oxygen content (below the detection limit of EDS) in the reference Ag films and on the target surface, the target poisoning cannot be confirmed with certainty.
As the formation of Ag+ ions plays an important role in the antibacterial properties [7,8], we also examined the oxidation state of Ag on the surface of selected samples 0 W, 100 W, and 150 W by XPS, which provided information about the chemical bonding. Before measurement, the sample surface was etched for 20 min by argon ions with an energy of 2 keV to remove the surface contamination. The data for each sample were calibrated using the Fermi edge position, which was aligned with the binding energy (BE) of 0 eV. Table 1 shows the elemental composition of the sputter-etched surface. According to the XPS results, the samples 0 W, 100 W, and 150 W contain 6, 7, and 13 at.% of O, respectively. Thus, the O content increases with Ag concentration, as also observed by EDS analyses (Figure 1). The Ti/B ratio around 3.1 confirms the overstoichiometric character of TiBx. A slightly lower Ti/B value, in comparison to the WDS, can be caused by the preferential sputtering of the boron atoms.

Table 1.
Elemental compositions obtained from XPS.
The B 1s core level spectra in Figure 2a show the main Ti–B peak from the titanium diboride and a smaller peak at higher BE which we attribute to the Ti–B–O bond. The Ti 2p spectra in panel (b) confirm the presence of Ti-B bonding from the titanium diboride and also show the oxidation of Ti atoms manifested as peaks at higher BE attributed to the Ti–O and Ti–B–O bonds. The O 1s spectra in panel (c) are fitted by two peaks corresponding to the Ti–O and Ti–B–O bonds. We note that the additional Ag–O peak at lower BE of 528.9 ± 0.2 eV [36] was not observed for both samples 100 W and 150 W. Finally, panel (d) shows the Ag 3d spectrum fitted by a single doublet which corresponds to the metallic Ag–Ag bond. The metallic nature of Ag in our sample is corroborated by the asymmetric peak shape, which is typical for metallic samples [37]. Both peaks were fit with a Voigt function GL(70)T(1.7), which consists of 30% Gaussian, 70% Lorentzian, and an exponential tail to higher BE. We can thus conclude that in our coatings, oxygen prefers to react with titanium or boron rather than silver.
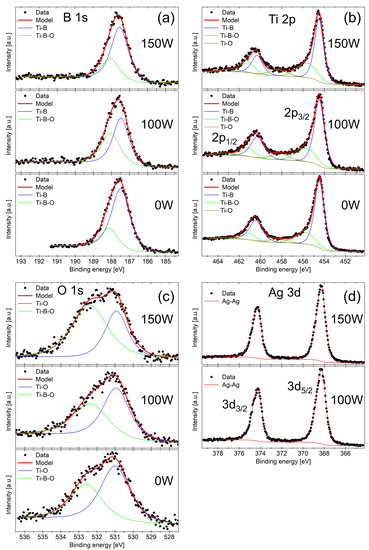
Figure 2.
XPS spectra of (a) B 1s, (b) Ti 2p, (c) O 1s, and (d) Ag 3d obtained from samples 0 W, 100 W, and 150 W after sputter-etching.
3.2. Structure Analysis
Since AgB2 is an unstable compound [18,38], instead of an AgyTi1−yB2 solid solution, an Ag/TiB2 composite with segregated Ag regions can be expected. This is confirmed by the XRD, which shows peaks corresponding only to the hexagonal TiB2 and cubic Ag phases, as visible in Figure 3. The reference TiBx film (0 W) contains diffraction maxima at 27.87°, 44.42°, and 57.5°, corresponding to (001), (101), and (002) diffractions, respectively. The low intensity and large width of the TiB2 peaks indicate a nanocrystalline structure with small grains. In samples containing Ag, additional peaks at 38.10° and 64.63° arise, which correspond to the (111) and (220) diffractions of cubic Ag, respectively. Moreover, the Ag (200) diffraction contributes to the peak at 44.42°, which overlaps with the TiB2 (101) diffraction. The broad intensity increase around 69° is due to the diffusive scattering from the Si substrate.
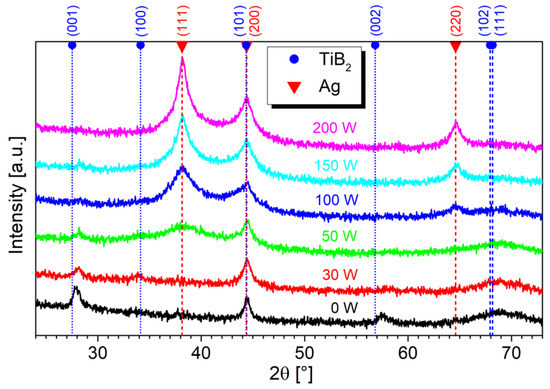
Figure 3.
Symmetrical XRD scans of Ag/TiBx thin films prepared on Si substrates. The broad intensity increase around 69° is due to the substrate.
For sample 30 W, which contains a very low amount of Ag, around 1.4 at.%, the Ag diffractions are not visible. This is caused by very fine Ag grains and an absence of larger regions of segregated Ag, as observed in HR-TEM analyses. Increasing the Ag concentration leads to a broad Ag (111) peak (sample 50 W), which becomes narrower and more intense with increasing Ag concentration (100 W, 150 W, 200 W). Its FWHM decreases from 3° to 0.92°, indicating the formation of coherent Ag domains in the (111) direction.
The presence of Ag also leads to the disappearance of TiB2 maxima at 27.87° and 57.5°. Even small Ag doping causes a suppression of the growth in the (001) direction which also has a significant impact on the mechanical properties, as will be seen in Section 3.3. This is consistent with the model of Barna–Adamik [39], in which adding the impurity (Ag in our case) leads to the growth suppression of crystalline TiB2 grains. However, we cannot exclude the presence of (101) orientation due to overlapping TiB2 (101) and Ag (200) peaks.
To view the structure and morphology, the thin films prepared on Si substrates were cleaved and examined by SEM. The cross-section scans in Figure 4 reveal columnar growth of the TiBx thin film with low Ag concentration (samples 0 W and 30 W). After adding Ag, the columnar growth is suppressed (50 W). A further increase in Ag concentration results in a heterogeneous structure with segregated Ag (100 W, 150 W, and 200 W). The formation of Ag-rich regions above 17 at.% Ag (100 W) agrees with the XRD (111) Ag peak, which becomes narrower, indicating an increase in the coherence domain (grain) size of the Ag phase.
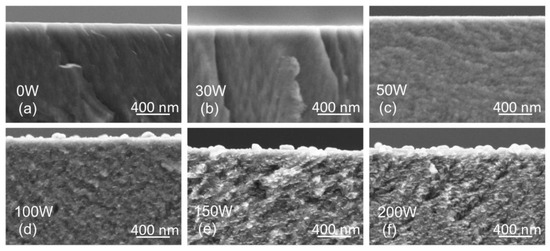
Figure 4.
Cross-section SEM scans revealing the morphology and structure of thin films on Si substrates prepared with the Ag target power of 0 W (a), 30 W (b), 50 W (c), 100 W (d), 150 W (e), 200 W (f).
The SEM surface topography of the films is depicted in Figure 5. For Ag concentrations below 9 at.% (samples 0 W, 30 W, and 50 W), a smooth, homogeneous surface is observed. On the other hand, a rough surface with sub-micrometer features is observed for samples with Ag concentrations above 9 at.% (100 W, 150 W, and 200 W). The spherical objects with sizes around 100 nm are most likely Ag macroparticles formed during the magnetron sputtering due to an arc randomly occurring on the Ag target surface.
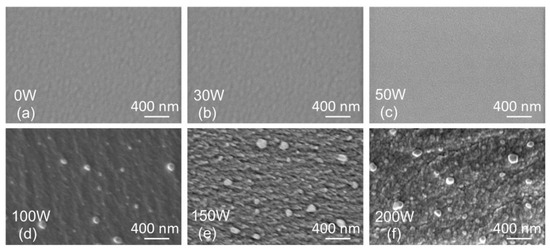
Figure 5.
Top view SEM scans of thin film surface topography prepared with the Ag target power of 0 W (a), 30 W (b), 50 W (c), 100 W (d), 150 W (e), 200 W (f).
The microscopic structure analysis is provided by the S/TEM of selected samples shown in Figure 6. For sample 30 W, a fine columnar structure is observed in panel (a) with a slight decline from the growth direction. The inset electron diffraction shows only Ag and TiB2 peaks. The TiB2 (002) diffraction indicates the presence of the (001) texture also observed in the XRD in Figure 3. The high-resolution STEM in panel (c) reveals Ag nanoclusters with a size of 2–3 nm in the sample 30 W. The segregated Ag nanoclusters are also visible in the STEM-EDS mapping in panel (e). The regions with a higher Ag signal coincide well with the bright spots in the HAADF image.
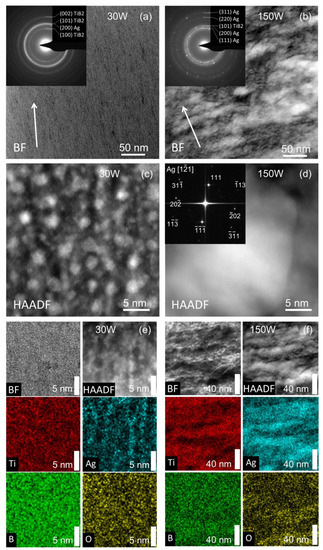
Figure 6.
Cross-section STEM BF images of samples 30 W (a) and 150 W (b). The growth direction is indicated by the arrow. The insets show electron diffraction with marked Ag and TiB2 positions. Panels (c,d) show the HR-STEM Z-contrast image of samples 30 W and 150 W. The inset of panel (d) shows FFT of an Ag cluster. Panels (e,f) show the STEM-EDS for sample 30 W with a scale bar of 5 nm and for sample 150 W with a scale bar of 40 nm.
On the other side, in sample 150 W, the Ag forms larger regions that are prolonged along the substrate and perpendicular to the growth direction, as visible in panel (b). The inset shows multiple diffraction rings and sharp spots of Ag clusters. The TiB2 (100) and (002) diffractions are not visible. Only the second smeared ring can be attributed to TiB2 (101) diffraction, which overlaps with the Ag (200). The absence of TiB2 (001) and (002) peaks in electron diffraction and XRD for sample 150 W indicate that doping by Ag changes the preferential orientation of TiB2. The fast Fourier transform (FFT) of the HR-STEM image in panel (d), in addition to the EDS mapping in panels (e) and (f), confirms that the bright regions in HAADF images can be attributed to the segregated Ag clusters. The STEM-EDS in panel (f) clearly shows the separation of Ag and TiB2 and also confirms that oxygen is preferentially located outside the silver regions in accordance with the XPS in Figure 2.
The structural analysis of the samples confirms that Ag does not create an AgyTi1-yB2 solid solution, but instead, Ag clusters are formed. This is due to the high insolubility of Ag in titanium diboride. Moreover, the HR-STEM reveals the formation of spherical-like Ag nanoclusters (see Figure 6c) in the case of low Ag content. The cross-section SEM and TEM images show a uniform distribution of these clusters across the thin film. We note that the samples were prepared by conventional magnetron sputtering without using any complex deposition techniques such as gas aggregation source [40]. The formation of Ag clusters has a significant influence on the antibacterial performance, as we see below.
3.3. Antibacterial Properties
Figure 7a depicts the results of growth inhibition tests for the as-deposited Ag/TiBx thin films and for the films immersed in the LB medium + 5% HNO3 solution for 45 days. Both tests confirm the antibacterial effect, which gets stronger with the increasing amount of Ag in the film. The first test reveals that sample 150 W with 24 at.% of Ag has the highest inhibition of 97 ± 2%. A further increase in Ag concentration does not enhance the antibacterial properties. The second test has proven that all samples maintain good antibacterial properties even after 45 days. Moreover, a similar trend of saturation for large Ag concentrations is observed. Surprisingly, the as-deposited pure TiBx film with Ag less than 0.1 at.% exhibits a significant inhibition effect of 48 ± 5% compared to the uncoated Si substrate.
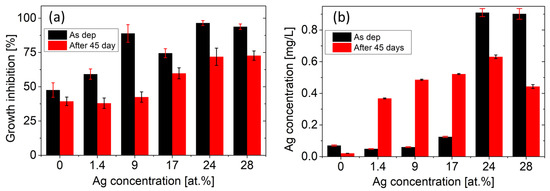
Figure 7.
(a) Antibacterial properties evaluated using E. coli growth inhibition. The reported values are averages from six repeated tests. (b) Amount of Ag released into the LB + 5% HNO3 solution during 14 days. Error bars depict the standard deviations from the repeated measurements.
In order to provide a deeper insight into the inhibition efficiency, the Ag release rate was examined by ICP measurements. Figure 7b shows the total amount of Ag released into the solution over the course of 14 days. The first measurement reveals that samples 150 W and 200 W have significantly higher Ag release, which can be attributed to the dissolution of Ag macroparticles on the surface of the samples (see Figure 5e,f). The second ICP measurement, performed after 45 days, reveals enhanced Ag release for samples 30 W, 50 W, and 100 W compared to the as-deposited films.
In both tests, the strongest inhibition effect is observed for sample 150 W, which is in accordance with the highest release rate of Ag. A further increase in Ag concentration (sample 200 W) does not lead to a stronger inhibition. The reason might stem from the surface-to-volume ratio of Ag clusters. According to the XRD, the FWHM of the Ag peaks decreases, and thus, the coherence domain size of Ag clusters increases with Ag concentration. STEM confirms this by showing large Ag regions with a size of more than 20 nm in the sample 150 W compared to the nanoclusters of 2–3 nm in the sample 30 W (see Figure 6). As a result, the surface-to-volume ratio of Ag clusters decreases. This fact limits the ability of Ag to be released into the environment, which reduces the antibacterial effect of the coatings. The saturation of the antibacterial effect also corresponds to the saturation of the released amount of Ag for samples 150 W and 200 W (see Figure 7).
The reason why the Ag release rate increased for samples 30 W, 50 W, and 100 W during the second test remains unclear. We can only speculate that during the 45-day immersion in the solution of LB + 5% HNO3 and subsequent inhibition test, the sample surface was eroded, and the silver–environment interface area increased. The discrepancy between the decreased inhibition effect and the higher amount of released Ag after 45 days can stem from the different time scales of the experiments (the inhibition test takes 3 h). Nevertheless, the ICP measurements show a very low Ag concentration for the reference TiBx, (sample 0 W), which excludes the contamination by Ag and strongly indicates that TiBx thin film also exhibits significant antibacterial properties.
3.4. Mechanical Properties
The presence of Ag has a significant impact on the mechanical properties, which were investigated using nanoindentation and tribological tests. Figure 8 depicts the decrease in hardness and elastic modulus with increasing Ag content. The pure TiBx film has a hardness of 40 ± 1.7 GPa and an elastic modulus of 487 ± 12 GPa. Increasing the Ag concentration to 28 at.% decreases the hardness to 6.4 ± 0.7 GPa and the elastic modulus to 189 ± 14 GPa.
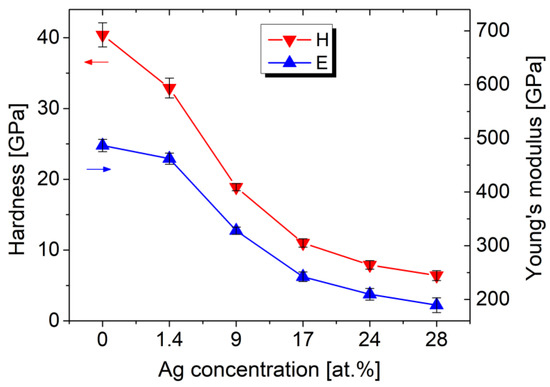
Figure 8.
Nanoindentation results of the Ag/TiBx thin films prepared on sapphire substrates.
The observed softening is expected because of the very low mechanical strength of pure Ag. However, the hardness drop is larger compared to Ag/TM-nitrides. For example, in Ag/TiN, the hardness decreases by 61% from 27.3 to 10.6 GPa for 16.7 at.% of Ag [10], and in the case of Ag/ZrN, only a slight decrease by 4% from 23 to 22 GPa is observed after alloying with 16 at.% of Ag [14]. In our case, the considerably larger decrease by 73% for similar Ag content (17 at.%) can be explained by the suppression of the columnar growth of TiB2, as explained below.
Two factors may be responsible for the observed decrease in hardness. Fuger et al. [41] reported that the extremely high hardness of TiB2 coatings is strongly associated with a preferential (001) texture. In the case of Ag-free sample 0 W, part of the crystalline TiB2 phase is preferentially oriented in the (001) direction, and the coating exhibits a hardness of 40 GPa. After alloying with Ag, only the (101) orientation of TiB2 is visible as a wide XRD peak in Figure 2 and blurred electron diffraction in the inset of Figure 6b. The growth in the (001) direction is suppressed, which contributes to the measured decrease in hardness.
The second factor represents the nanocomposite nature of Ag/TiBx coatings and the influence of interfaces on mechanical properties. According to Mayrhofer et al. [42], a very thin B-excess tissue phase surrounding stoichiometric TiB2 nanocolumns increases cohesive strength, and slightly overstoichiometric TiB2.4 coatings exhibit very high hardness. As shown by the STEM investigation of our coatings, Ag clusters segregate at the grain boundaries, suppress the growth of the nanocolumnar structure, and significantly reduce the cohesive strength of the nanocomposite. This means that although the TiB2 phase is inherently hard, the soft Ag phase reduces the resistance to nanoindentation-induced deformation, and therefore the coatings exhibit low hardness. Nevertheless, the sample 150 W, which has the strongest inhibition effect, has a reasonable hardness of 7.9 GPa when compared, for example, to 316 stainless steel.
On the other side, the dry sliding tribological tests show that the addition of Ag has a positive impact. Figure 9a clearly shows that alloying the TiBx with Ag decreases the friction force. The average COF for a load of 2 N decreases from 0.77 to 0.35 when the Ag concentration increases from 0 to 28 at.%. Even sample 100 W, which contains 17 at.% Ag, has a significantly lower COF of 0.45. Figure 9b shows the evaluated specific wear rate Ws after 15 min for the load of 2 N. The lowest values of 2.2–2.4 × 10⁻⁵ mm3/Nm are reached for the samples 50 W and 100 W. Further increase in Ag concentration leads to a higher wear rate.
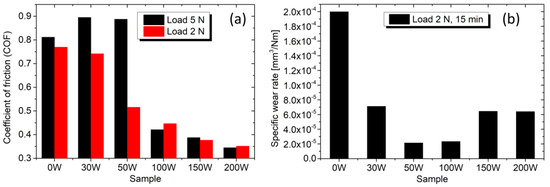
Figure 9.
(a) Average COF against the steel counterball for loads of 5 N and 2 N. (b) Specific wear rate for the load of 2 N and test duration of 15 min.
In the following discussion, we will focus on the data for 5 N, which contains more information and reveals the endurance of the films. Figure 10a depicts the evolution of the COF during 6000 cycles at room temperature. The film without Ag (0 W) shows a slightly decreasing COF, which saturates at ~0.8, as expected for a TiBx thin film/steel counterball tribosystem [43,44]. Adding a small amount of Ag (samples 30 W and 50 W) results in fluctuations of the friction force, and the COF stabilization running-in phase is prolonged. For samples 100 W, 150 W, and 200 W, the COF decreases with the Ag content, similar to the load 2 N, and reaches a value of 0.34 for 28 at.% Ag. The low COF remains stable for at least 3500 cycles, while only a little difference is observed between samples 100 W, 150 W, and 200 W. However, the COF evolution reveals that after 3500–4500 cycles, the friction force starts to increase. This effect has a steeper course and starts earlier for sample 100 W. With increasing Ag content, the growth starts later and takes a less steep course.
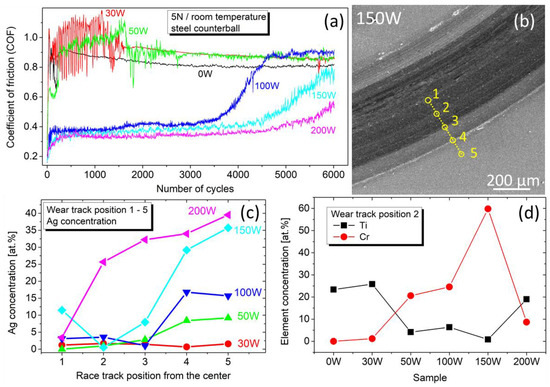
Figure 10.
(a) Evolution of the COF against a steel counterball at a normal force of 5 N and room temperature. (b) SEM scan of a wear track after 6000 cycles for a typical sample 150 W. Yellow circles denote the position of EDS-analyzed regions. (c) Concentration of Ag in the wear track profile depicted in panel (b). (d) Concentration of Ti and Cr in the wear track at position 2.
To elucidate the observed behavior, the wear tracks were EDS examined in five regions after 6000 cycles, as depicted in Figure 10b for a typical sample 150 W. The resulting Ag concentration in Figure 10c shows that the amount of Ag in the wear track center is nearly zero, indicating that the film has worn out. According to sample 200 W in Figure 10c, the wear-out begins in the wear track center and gradually progresses outwards, which is most likely the reason for the gradual increase in the COF visible in Figure 10a. Furthermore, this effect is faster for lower Ag content, as visible in Figure 10c for sample 100 W, where the Ag concentration drops to zero already on the edge of the wear track (position 3 in Figure 10b).
In addition to this, the concentration of Ti and Cr depicted in Figure 10d clearly shows that while for 0 W and 30 W, the films were still present in the wear track, in sample 150 W, the absence of Ti and the presence of Cr (from the buffer layer and K100 substrate) indicate that during the test the Ag/TiBx coating was removed completely. On the contrary, in sample 200 W, the presence of Ti and Ag in the wear track clearly shows that the film has been preserved after 6000 cycles. This explains the late increase in the COF evolution despite the lowest hardness for sample 200 W.
Although the COF decreases monotonically with Ag content, the specific wear rate exhibits a non-linear behavior with an apparent valley for samples 50 W and 100 W. Such behavior seems to result from two opposing effects: the reduction in the COF and the loss of hardness with increasing Ag content since hardness correlates with good wear resistance. For sample 50 W, containing 9 at.% Ag, the COF drops to 0.52 by about 32% compared to the Ag-free TiBx, but the coating remains relatively hard at 19 GPa. The reduction in the specific wear rate Ws observed here compared to the Ag-free TiBx coating is likely due to the formation of a sliding Ag tribofilm that reduces the adhesion-induced wear rate between the coating and the steel counterball. This assumption can also be supported by the sample 100 W containing 17 at.% Ag, which is still relatively hard (11 GPa) and has approximately the same COF of 0.47. However, at larger concentrations of Ag (samples 150 W and 200 W), a significant loss of hardness prevails (see Table 2). Although the COF is still slightly reduced, the specific wear rate Ws increases due to the formation of large and soft Ag clusters at the expense of the hard and fragmented TiB2 phase.
Table 2.
Overview of Ag/TiBx coating properties. The COF and specific wear rate Ws values are for the load 2 N.
4. Conclusions
Silver-doped titanium diboride films were prepared by a dry PVD process of magnetron co-sputtering. Based on the experimental results, the following conclusions can be drawn:
- For low silver content (1.4 at.%), spherical-like Ag nanoclusters with dimensions of 2–3 nm are formed in the overstoichiometric TiBx matrix.
- For higher silver content (24 at.%), Ag segregates into larger layered regions with typical dimensions of 40 nm.
- The strongest growth inhibition of E. coli is observed for films with 24 at.% Ag. In the case of higher doping, the antibacterial effect begins to saturate, which can be caused by the decrease in the surface-to-volume ratio of the Ag clusters.
- The antibacterial effect is maintained after 45 days of immersion in a solution of LB medium + 5% HNO3, which indicates the strong protective function of the chemically stable TiBx matrix.
- Alloying with Ag results in a rapid decrease in hardness from 40 to 6.4 GPa, which is faster compared to Ag/transition-metal nitrides and can be attributed to the suppression of the columnar (001) growth.
- The coefficient of friction decreases by 55% from 0.77 to 0.35. The lowest specific wear rate is observed for 9–17 at.% Ag. Higher silver doping increases the wear due to the loss of hardness.
Thanks to their persistent antibacterial properties and enhanced wear resistance (compared to silver films), the Ag/TiBx films can find applications as a protective coating for cutlery, door handles, water taps, and other daily-used objects in public areas. Nevertheless, further tests against other organisms, such as fungi or viruses, would be beneficial to confirm the antimicrobial activity of the coating. This is, however, beyond the scope of this work.
Author Contributions
Conceptualization, M.V. and M.T.; methodology, V.I.; investigation, M.T., M.R., T.R., L.S., Š.N. and V.T.; writing—original draft preparation, M.V.; writing—review and editing, T.R. and M.M.; visualization, T.F.; resources, V.I.; project administration, M.H. and M.M.; funding acquisition, M.M. All authors have read and agreed to the published version of the manuscript.
Funding
This research was funded by the Operational Program Integrated Infrastructure, Project No. ITMS 313011AUH4.
Institutional Review Board Statement
Not applicable.
Informed Consent Statement
Not applicable.
Data Availability Statement
The data presented in this study are available on request from the corresponding author.
Conflicts of Interest
The authors declare no conflict of interest.
References
- Wei, Q.; Xu, Y.; Wang, Y. Textile Surface Functionalization by Physical Vapor Deposition (PVD). In Surface Modification of Textiles; Wei, Q., Ed.; Woodhead Publishing: Sawston, UK, 2009; pp. 58–90. ISBN 9781845694197. [Google Scholar]
- Panáček, A.; Kvítek, L.; Smékalová, M.; Večeřová, R.; Kolář, M.; Röderová, M.; Dyčka, F.; Šebela, M.; Prucek, R.; Tomanec, O.; et al. Bacterial Resistance to Silver Nanoparticles and How to Overcome It. Nat. Nanotechnol. 2018, 13, 65–71. [Google Scholar] [CrossRef]
- Scholz, J.; Nocke, G.; Hollstein, F.; Weissbach, A. Investigations on Fabrics Coated with Precious Metals Using the Magnetron Sputter Technique with Regard to Their Anti-Microbial Properties. Surf. Coat. Technol. 2005, 192, 252–256. [Google Scholar] [CrossRef]
- Shahidi, S.; Moazzenchi, B.; Ghoranneviss, M. A Review-Application of Physical Vapor Deposition (PVD) and Related Methods in the Textile Industry. EPJ Appl. Phys. 2015, 71, 31302. [Google Scholar] [CrossRef]
- Chen, Y.H.; Hsu, C.C.; He, J.L. Antibacterial Silver Coating on Poly(Ethylene Terephthalate) Fabric by Using High Power Impulse Magnetron Sputtering. Surf. Coat. Technol. 2013, 232, 868–875. [Google Scholar] [CrossRef]
- Kratochvíl, J.; Kuzminova, A.; Kylián, O.; Biederman, H. Comparison of Magnetron Sputtering and Gas Aggregation Nanoparticle Source Used for Fabrication of Silver Nanoparticle Films. Surf. Coat. Technol. 2015, 275, 296–302. [Google Scholar] [CrossRef]
- Kuzminova, A.; Beranová, J.; Polonskyi, O.; Shelemin, A.; Kylián, O.; Choukourov, A.; Slavínská, D.; Biederman, H. Antibacterial Nanocomposite Coatings Produced by Means of Gas Aggregation Source of Silver Nanoparticles. Surf. Coat. Technol. 2016, 294, 225–230. [Google Scholar] [CrossRef]
- Sant, S.B.; Gill, K.S.; Burrell, R.E. Nanostructure, Dissolution and Morphology Characteristics of Microcidal Silver Films Deposited by Magnetron Sputtering. Acta Biomater. 2007, 3, 341–350. [Google Scholar] [CrossRef]
- Mejía, M.I.; Restrepo, G.; Marín, J.M.; Sanjines, R.; Pulgarín, C.; Mielczarski, E.; Mielczarski, J.; Kiwi, J. Magnetron-Sputtered Ag Surfaces. New Evidence for the Nature of the Ag Ions Intervening in Bacterial Inactivation. ACS Appl. Mater. Interfaces 2010, 2, 230–235. [Google Scholar] [CrossRef]
- Kelly, P.J.; Li, H.; Whitehead, K.A.; Verran, J.; Arnell, R.D.; Iordanova, I. A Study of the Antimicrobial and Tribological Properties of TiN/Ag Nanocomposite Coatings. Surf. Coat. Technol. 2009, 204, 1137–1140. [Google Scholar] [CrossRef]
- Ren, Y.; Jia, J.; Cao, X.; Zhang, G.; Ding, Q. Effect of Ag Contents on the Microstructure and Tribological Behaviors of NbN–Ag Coatings at Elevated Temperatures. Vacuum 2022, 204, 111330. [Google Scholar] [CrossRef]
- Ju, H.; Xu, J. Microstructure and Tribological Properties of NbN-Ag Composite Films by Reactive Magnetron Sputtering. Appl. Surf. Sci. 2015, 355, 878–883. [Google Scholar] [CrossRef]
- Baghriche, O.; Kiwi, J.; Pulgarin, C.; Sanjinés, R. Antibacterial Ag-ZrN Surfaces Promoted by Subnanometric ZrN-Clusters Deposited by Reactive Pulsed Magnetron Sputtering. J. Photochem. Photobiol. A Chem. 2012, 229, 39–45. [Google Scholar] [CrossRef]
- Kertzman, Z.; Marchal, J.; Suarez, M.; Staia, M.H.; Filip, P.; Kohli, P.; Aouadi, S.M. Mechanical, Tribological, and Biocompatibility Properties of ZrN-Ag Nanocomposite Films. J. Biomed. Mater. Res. Part A 2008, 84, 1061–1067. [Google Scholar] [CrossRef]
- Domínguez-Meister, S.; Rojas, T.C.; Frías, J.E.; Sánchez-López, J.C. Silver Effect on the Tribological and Antibacterial Properties of A-C:Ag Coatings. Tribol. Int. 2019, 140, 105837. [Google Scholar] [CrossRef]
- Zia, A.W.; Anestopoulos, I.; Panayiotidis, M.I.; Bowen, L.; Birkett, M. Biomechanical Characteristics of Silver Enriched Diamond-like Carbon Coatings for Medical Applications. J. Alloys Compd. 2023, 958, 170473. [Google Scholar] [CrossRef]
- Akopov, G.; Pangilinan, L.E.; Mohammadi, R.; Kaner, R.B. Perspective: Superhard Metal Borides: A Look Forward. APL Mater. 2018, 6, 070901. [Google Scholar] [CrossRef]
- Fiantok, T.; Truchlý, M.; Šroba, V.; Roch, T.; Izai, V.; Vidiš, M.; Haršáni, M.; Satrapinskyy, L.; Mikula, M. First Approach to ZrB2 Thin Films Alloyed with Silver Prepared by Magnetron Co-Sputtering. Coatings 2023, 13, 663. [Google Scholar] [CrossRef]
- Truchlý, M.; Haršáni, M.; Frkáň, A.; Fiantok, T.; Sahul, M.; Roch, T.; Kúš, P.; Mikula, M. First Approach to Doping Silver into CrB2 Thin Films Deposited by DC/HiPIMS Technology in Terms of Mechanical and Tribological Properties. Coatings 2023, 13, 824. [Google Scholar] [CrossRef]
- Glechner, T.; Oemer, H.G.; Wojcik, T.; Weiss, M.; Limbeck, A.; Ramm, J.; Polcik, P.; Riedl, H. Influence of Si on the Oxidation Behavior of TM-Si-B2 ± z Coatings (TM = Ti, Cr, Hf, Ta, W). Surf. Coat. Technol. 2022, 434, 128178. [Google Scholar] [CrossRef]
- Zhou, Y.; Xiang, H.; Feng, Z.; Li, Z. General Trends in Electronic Structure, Stability, Chemical Bonding and Mechanical Properties of Ultrahigh Temperature Ceramics TMB2 (TM = Transition Metal). J. Mater. Sci. Technol. 2015, 31, 285–294. [Google Scholar] [CrossRef]
- Makau, F.M.; Morsi, K.; Gude, N.; Alvarez, R.; Sussman, M.; May-Newman, K. Viability of Titanium-Titanium Boride Composite as a Biomaterial. ISRN Biomater. 2013, 2013, 970535. [Google Scholar] [CrossRef]
- Liu, Y.; Wang, X.; Li, H.; Lu, J.; Wang, Z.; Zhou, C. Enhancing Properties of AgTiB2 Contact Material by CuO Semi-Coated TiB2 Composite Particles. Mater. Lett. 2021, 293, 5–8. [Google Scholar] [CrossRef]
- Ciuman-Krzemień, A.; Burzyńska, L.; Galanty, M. Selection of Optimum Parameters to Obtain Ag-TiB2 Composite Electrical Contacts. Powder Metall. 2009, 52, 49–60. [Google Scholar] [CrossRef]
- Li, H.; Wang, X.; Xi, Y.; Liu, Y.; Guo, X. Influence of WO3 Addition on the Material Transfer Behavior of the AgTiB2 Contact Material. Mater. Des. 2017, 121, 85–91. [Google Scholar] [CrossRef]
- Sun, Y.; Tran, V.; Zhang, D.; Wang, W.; Yang, S. Technology and Antimicrobial Properties of Cu/TiB2 Composite Coating on 304 Steel Surface Prepared by Laser Cladding. Mater. Sci. Forum 2018, 944 MSF, 473–479. [Google Scholar] [CrossRef]
- Fairley, N.; Fernandez, V.; Richard-Plouet, M.; Guillot-Deudon, C.; Walton, J.; Smith, E.; Flahaut, D.; Greiner, M.; Biesinger, M.; Tougaard, S.; et al. Systematic and Collaborative Approach to Problem Solving Using X-Ray Photoelectron Spectroscopy. Appl. Surf. Sci. Adv. 2021, 5, 100112. [Google Scholar] [CrossRef]
- Klinger, M.; Jäger, A. Crystallographic Tool Box (CrysTBox): Automated Tools for Transmission Electron Microscopists and Crystallographers. J. Appl. Crystallogr. 2015, 48, 2012–2018. [Google Scholar] [CrossRef]
- Woodcock, D.M.; Crowther, P.J.; Doherty, J.; Jefferson, S.; DeCruz, E.; Noyer-Weidner, M.; Smith3, S.S.; Michael, M.Z.; Graham, M.W. Quantitative Evaluation of Escherichia Coli Host Strains for Tolerance to Cytosine Methylation in Plasmid and Phage Recombinants. Nucleic Acids Res. 1989, 17, 3469–3478. [Google Scholar] [CrossRef]
- Oliver, W.C.; Pharr, G.M. An Improved Technique for Determining Hardness and Elastic Modulus Using Load and Displacement Sensing Indentation Experiments. J. Mater. Res. 1992, 7, 1564–1583. [Google Scholar] [CrossRef]
- Neidhardt, J.; Mráz, S.; Schneider, J.M.; Strub, E.; Bohne, W.; Liedke, B.; Möller, W.; Mitterer, C. Experiment and Simulation of the Compositional Evolution of Ti–B Thin Films Deposited by Sputtering of a Compound Target. J. Appl. Phys. 2008, 104, 063304. [Google Scholar] [CrossRef]
- Bakhit, B.; Primetzhofer, D.; Pitthan, E.; Sortica, M.A.; Rosén, J.; Hultman, L.; Petrov, I.; Greczynski, G. Systematic Compositional Analysis of Sputter- Deposited Boron-Containing Thin Films. J. Vac. Sci. Technol. A 2021, 39, 063408. [Google Scholar] [CrossRef]
- Li, J.; Wang, J.; Kumar, A.; Li, H.; Xiong, D. High Temperatures Tribological Properties of Ta-Ag Films Deposited at Various Working Pressures and Sputtering Powers. Surf. Coat. Technol. 2018, 349, 186–197. [Google Scholar] [CrossRef]
- Zuo, J. Deposition of Ag Nanostructures on TiO2 Thin Films by RF Magnetron Sputtering. Appl. Surf. Sci. 2010, 256, 7096–7101. [Google Scholar] [CrossRef]
- Cinali, M.B.; Coşkun, Ö.D. Optimization of Physical Properties of Sputtered Silver Films by Change of Deposition Power for Low Emissivity Applications. J. Alloys Compd. 2021, 853, 157073. [Google Scholar] [CrossRef]
- Tjeng, L.H.; Meinders, M.B.J.; van Elp, J.; Ghijsen, J.; Sawatzky, G.A.; Johnson, R.L. Electronic Structure of Ag2O. Phys. Rev. B Condens. Matter Mater. Phys. 2000, 41, 3190–3199. [Google Scholar] [CrossRef] [PubMed]
- Greczynski, G.; Hultman, L. A Step-by-Step Guide to Perform X-ray Photoelectron Spectroscopy. J. Appl. Phys. 2022, 132, 011101. [Google Scholar] [CrossRef]
- Pelleg, J.; Rotman, M.; Sinder, M. Borides of Ag and Au Prepared by Magnetron Sputtering. Phys. C Supercond. Appl. 2007, 466, 61–64. [Google Scholar] [CrossRef]
- Barna, P.B.; Adamik, M. Fundamental Structure Forming Phenomena of Polycrystalline Films and the Structure Zone Models. Thin Solid Films 1998, 317, 27–33. [Google Scholar] [CrossRef]
- Drábik, M.; Choukourov, A.; Artemenko, A.; Kousal, J.; Polonskyi, O.; Solaå, P.; Kylián, O.; Matoušek, J.; Pešička, J.; Matolínová, I.; et al. Morphology of Titanium Nanocluster Films Prepared by Gas Aggregation Cluster Source. Plasma Process. Polym. 2011, 8, 640–650. [Google Scholar] [CrossRef]
- Fuger, C.; Hahn, R.; Hirle, A.; Kutrowatz, P.; Weiss, M.; Limbeck, A.; Hunold, O.; Polcik, P.; Riedl, H. Revisiting the Origins of Super-Hardness in TiB2+z Thin Films—Impact of Growth Conditions and Anisotropy. Surf. Coat. Technol. 2022, 446, 128806. [Google Scholar] [CrossRef]
- Mayrhofer, P.H.; Mitterer, C. Self-Organized Nanocolumnar Structure in Superhard TiB2 Thin Films. Appl. Phys. Lett. 2005, 86, 131909. [Google Scholar] [CrossRef]
- Lofaj, F.; Moskalewicz, T.; Cempura, G.; Mikula, M.; Dusza, J.; Czyrska-Filemonowicz, A. Nanohardness and Tribological Properties of Nc-TiB2 Coatings. J. Eur. Ceram. Soc. 2013, 33, 2347–2353. [Google Scholar] [CrossRef]
- Murthy, T.S.R.C.; Basu, B.; Srivastava, A.; Balasubramaniam, R.; Suri, A.K. Tribological Properties of TiB2 and TiB2-MoSi2 Ceramic Composites. J. Eur. Ceram. Soc. 2006, 26, 1293–1300. [Google Scholar] [CrossRef]


Disclaimer/Publisher’s Note: The statements, opinions and data contained in all publications are solely those of the individual author(s) and contributor(s) and not of MDPI and/or the editor(s). MDPI and/or the editor(s) disclaim responsibility for any injury to people or property resulting from any ideas, methods, instructions or products referred to in the content. |
© 2023 by the authors. Licensee MDPI, Basel, Switzerland. This article is an open access article distributed under the terms and conditions of the Creative Commons Attribution (CC BY) license (https://creativecommons.org/licenses/by/4.0/).