Abstract
The most economical way to move liquids and gaseous hydrocarbons is by using pipelines. According to several international organizations and oil companies, the use of fossil fuels will continue in the following decades. For this reason, it is important to continue studying different corrosion mechanisms and their origins. One of the mechanisms that provoke small leaks, affecting pipeline hermeticity, is pitting corrosion. It is well-known that non-metallic inclusion dissolution can trigger pit nucleation. As pitting corrosion is recognized to be random in nature, it is also interesting to study the random nature of the inclusions present in API 5L X60 steel. Probability distributions commonly used to describe pitting corrosion characteristics are appropriate for studying inclusion characteristics. The size of inclusions plays a key role in pit nucleation because small inclusions tend to generate more defects, especially when these inclusions are compounds of MnS, and the steel is immersed in a corrosive solution. The results of this research work show that there is a close relationship between the random nature of pitting corrosion and inclusions.
1. Introduction
The importance of oil and gas pipelines is indicated by an estimated increase in their construction in the future due to factors such as the discovery of reserves in remote and landlocked locations, depletion of reserves near established markets, far distances from oil refineries and big cities and improvements in technology related to exploration and reserve production [1]. The IEA forecasts that oil consumption will remain above 85 million barrels per day, and the amount of natural gas consumed will remain above 4 trillion cubic meters until 2050 [2]. This means that pipelines will remain relevant for at least the first half of the 21st century. Other issues important to mention when oil and gas pipelines are studied are their safety and reliability. For example, these structures typically suffer from third-party damage, corrosion and construction defects, natural hazards, operational errors and material imperfections [3,4]. At present, aging of pipeline infrastructure is one of the main problems confronting the oil and gas industry. According to a study presented by Mojtaba Mahmoodian and Chun Qing Li [5], 50% of the USA’s oil and gas pipeline network is over 40 years old. In Russia, 20% of the country’s oil and gas system is almost at the end of its design life, and it is expected that, at the beginning of the 2030s, half of their pipelines will be at the end of their design life. In these aged structures, different corrosion mechanisms threaten their mechanical integrity [3,6]. The strength of a pipeline can be impacted by corrosion-induced reductions in pipe wall thicknesses [7,8]. In the specific case of Mexican pipelines, the mechanism that causes the greatest threat to pipeline integrity is pitting corrosion, provoking a substantial number of leaks [9]. To estimate the damage provoked by this mechanism, pitting corrosion has been modeled using statistical techniques such as non-linear regression and Markov chains [10,11]. Likewise, the impact of the growth of these corrosion defects has been studied to determine pipeline reliability [12]. There are some theories regarding the origin of pitting corrosion: one is that pits occur when the oxygen adsorption point on the surface is replaced by halide ions (e.g., chloride ions); another theory is that the radius of chloride ions is small, and therefore, ions can travel through the passivation film. The generated ions provoke the membrane to maintain a current density at a specific point, causing the cations to move. When the electric field at the membrane–solution zone reaches a critical value, pitting corrosion can occur [13]. Another possible cause of the origin of corrosion defects caused by the pitting mechanism is the dissolution of non-metallic inclusions [13]. According to Smialowski et al. [13] sulfide inclusions are very effective in pit nucleation. Other works proposed the following mechanism of dissolution for MnS inclusions in steel [14,15,16]:
MnS + 3H2O → Mn2+ + HSO3− + 5H+ + 6e−
HSO3− + 5H+ + 4e− → S + 3H2O
The steel from which oil and gas pipelines are made has not only high yield strength values but also high ductility [17]. This is the result of its chemical composition and the manufacturing process. However, in pipeline steels, one can find many types of inclusions besides MnS, such as Al2O3, silicates and complex oxides [18,19]. The chemical composition of inclusions is strongly associated with the steelmaking process and demonstrates a key role in the localized corrosion process. Some research works indicated that pitting corrosion tends to start when non-metallic inclusions are dissolved [20,21]; others suggested that dissolution started on the base material matrix around the inclusions [22]. For example, Figure 5 from Reference [22] schematizes this process following studies involving EDX spectra and FEM. Other research works have studied the shape of inclusions because, in some cases, spherical inclusions tend to generate pits [23]. Another variable that exerts influence in inclusion dissolution to generate pits is the chemical composition of the environment [22,23,24,25].
After considering these observations from other research works, one can determine that the actual mechanism of pitting corrosion defects caused by inclusion dissolution is not totally well-understood. For this reason, in the present study, we studied the relationship between inclusion characteristics and pitting corrosion defect characteristics found in API 5L X60 steel (in the oil industry, the American Petroleum Institute designates the standard API 5L [17] for pipe steel specifications; particularly, X60 is designated to pipeline steel that exhibits at least 60 Ksi in yield strength) after being exposed to immersion tests. These characteristics were analyzed using statistical techniques in order to determine the predominant shape and type of inclusions. Likewise, we determined the probability density function that best fits both inclusion characteristics and pit characteristics after different immersion times.
2. Materials and Methods
2.1. Sample Preparation
The experimental procedure began with steel sample preparation. First of all, from a half-round steel pipe, cubic samples (1 cm × 1 cm × 1 cm = 1 cm3) were mechanically cut. After this process, samples were mounted in acrylic blocks. The samples were ground using 240, 320, 400 and 600 grit papers initially and then fine-polished using an Al2O3 suspension. Figure 1 schematizes this process:
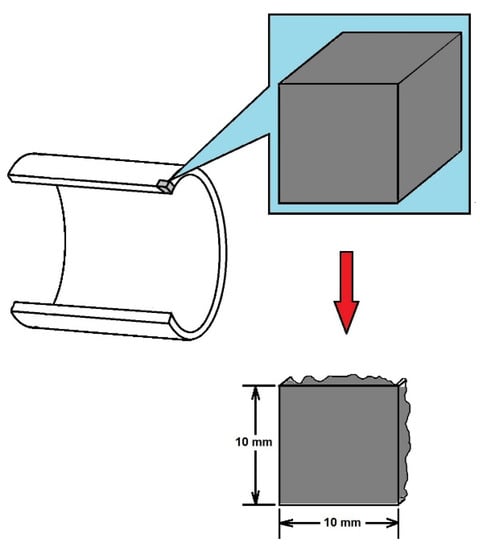
Figure 1.
Schematic sample extraction from API 5L X60 steel pipe.
2.2. Microstructural Characterization and Chemical Composition
Table 1 shows the chemical composition of the API 5L X60 steel used in this research work. The chemical composition of API 5L X60 steel was obtained through Spark Atomic Emission Spectroscopy (SPECTRO Analytical Instruments GmbH, Kleve, Germany).

Table 1.
API 5L X60 chemical composition.
The quantitative analysis of the microstructural characteristics of the API 5L X60 steel is presented in Table 2.
Table 2.
API 5L X60 microstructural characteristics.
Figure 2 shows optical micrographs to illustrate the grain size and the percentages of perlite and ferrite phases.
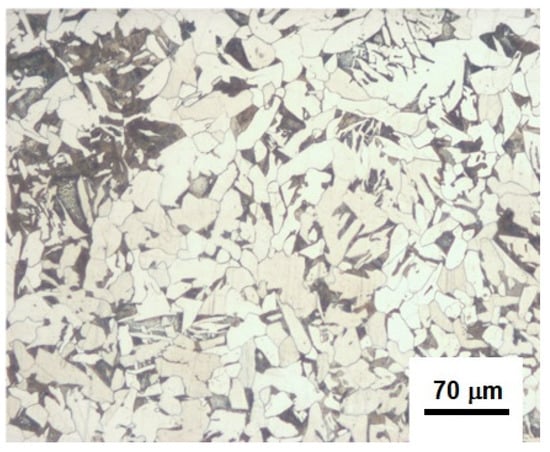
Figure 2.
Microstructure of an API 5L X60 sample.
2.3. Non-Metallic Inclusions Content in API 5L X60 Steel
Non-metallic inclusion content was determined according to ASTM E45 [27]. For the sake of illustration, Figure 3 shows non-metallic inclusions found in the API 5L X60 steel.
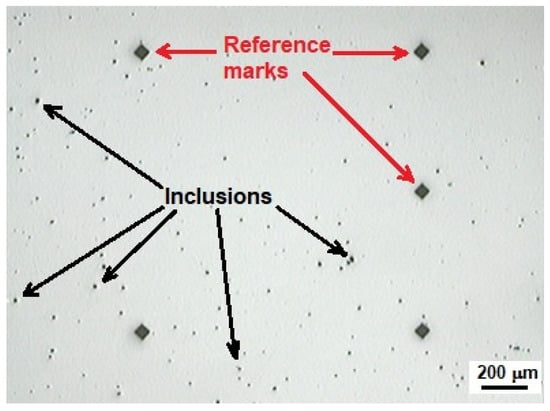
Figure 3.
Typical non-metallic inclusions found in API 5L X60.
In addition to determining the density of inclusions, we estimated the chemical composition of the inclusions found using EDS. Likewise, we also estimated the shape of inclusions (using optical microscopy) (Olympus, Center Valley, PA, USA) in order to determine if circular inclusions have a greater influence on pit generation than elongated inclusions.
2.4. Immersion Test
Immersion tests were carried out to study the relationship between non-metallic inclusions found in API 5L X60 steel and pit generation and growth. The chemical compositions of solutions used in the immersion tests were similar to those found in a soil corrosiveness study in Mexico [28]. The chemical content of the prepared chemical solution was 16.84 ppm SO4−2 and 289.5 ppm Cl−, and pH = 4.35 at room temperature. The immersion tests were carried out for two different periods of time. One battery of experiments was carried out over short periods of time (15, 30, 60, 180 and 360 min). In the other series of experiments, the immersion tests were accomplished after 1, 3 and 7 days. For illustration purposes, Figure 4 depicts the immersion test performed as part of the present work.
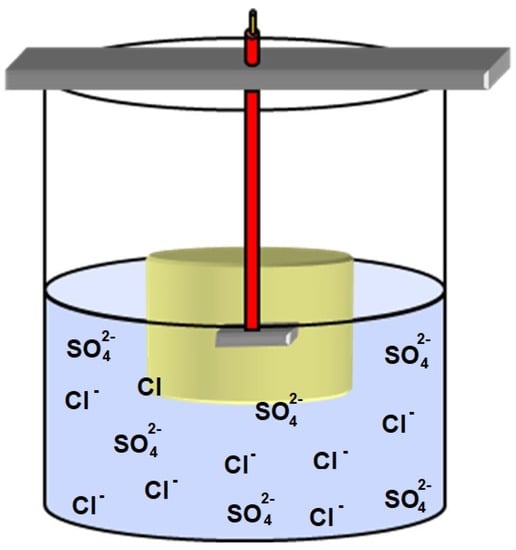
Figure 4.
Schematic representation of the immersion test carried out.
2.5. Non-Metallic Inclusion Locations, Morphological Analysis and Characterization of Inclusions in API 5L X60 Steel
Non-metallic inclusion locational and morphological analyses were carried out using optical microscopy (Olympus, Center Valley, PA, USA). Otherwise, the chemical composition of inclusions was obtained using the SEM–EDS method. For the sake of illustration, an SEM image (obtained with the JEOL JSM-6300 (JEOL, Peabody, MA, USA)) of a non-metallic inclusion and EDS analysis (Thermo Scientific, Madison, WI, USA) of the chemical composition are shown in Figure 5.
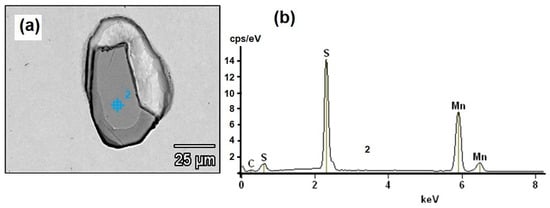
Figure 5.
(a) Non-metallic inclusion SEM image and (b) chemical composition of the non-metallic inclusion, EDS spectra.
2.6. Inclusions’ Statistical Characterization for Pit Generation
Non-metallic inclusions were characterized statistically by size (length and width), shape factor (width/length), chemical composition and area. Likewise, this information was related to data obtained through the characterization of pits generated after the immersion test over short periods of time (30, 60 and 180 min). The pit characteristics analyzed were depth and area. Additionally, we characterized pits by their depth generated during mid-term immersion tests (1, 3 and 7 days). All statistical analyses were performed using Wolfram Mathematica [29].
3. Results and Discussions
3.1. Statistical Analysis
The first step to characterize the non-metallic inclusions was to measure their length and width. With this information, one can calculate the shape factor (width/length). These data were obtained after analyzing one sample in three directions (rolling direction (RD), transverse direction (TD) and normal direction (ND)). Figure 6, Figure 7 and Figure 8 show the histograms of length, width and shape factor, respectively. These histograms were obtained after characterizing all inclusions longer than 1 µm found in the analyzed sample.
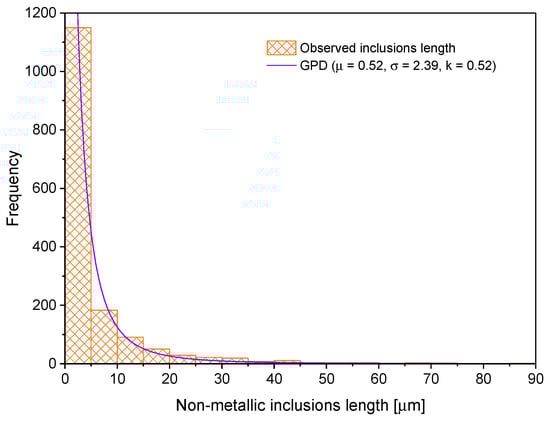
Figure 6.
Non-metallic inclusion length distribution.
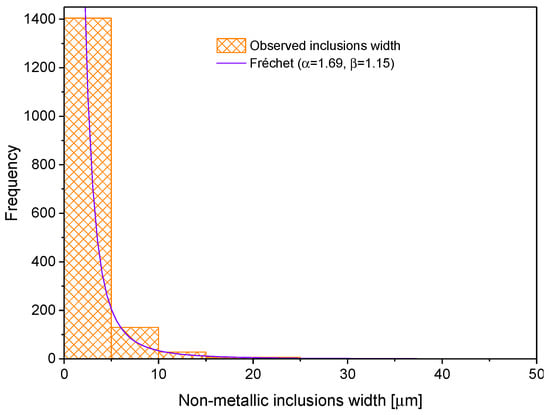
Figure 7.
Non-metallic inclusion width distribution.
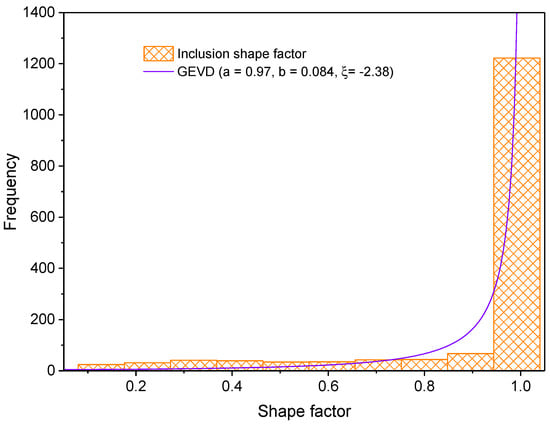
Figure 8.
Inclusion shape factor histogram.
Comparing the results with others obtained in the literature [30,31,32,33,34], it is confirmed that, in all cases, the tendency is that the most frequent size of the inclusions is attributed to those inclusions that measure less than 10 μm in length.
These three histograms (Figure 6, Figure 7 and Figure 8) were fitted to probability density functions (PDFs). The best choice was the PDF that satisfies the tests of Kolmogorov–Smirnov, Anderson–Darlin and chi-square. Regarding the random variable, inclusion length was fitted to a Generalized Pareto distribution (GPD). This function is represented by the mathematical expression indicated in Equation (3) [35].
where , and are the parameters of location, scale and shape, respectively. Concerning the inclusion width histogram, it was fitted to the Fréchet distribution, which is represented by Equation (4) [36].
where and are the shape and scale parameters, respectively. The shape factor histogram was fitted to the Generalized Extreme Value distribution (GEVD) expressed by Equation (5) [36].
where , is the location parameter, is the scale parameter and is the shape parameter.
After this analysis, it is feasible to affirm that inclusion shape characteristics in API steel can be studied as random variables. This could help to estimate inclusion shape characteristics in pipelines by using theories such as return period [37]. The average non-metallic inclusion density is 160.5 inclusions per cm2.
After EDS analysis of the studied non-metallic inclusions’ chemical composition, it was found that the vast majority of them were compounds of MnS (about 74%). Silicates were the second most frequent type of inclusions (mainly SiO2 and CaOSiO2), accounting for about 12% of the total. The remaining inclusions were compounds of Al2O3, 3CaO·Al2O3, CaO·Al2O3, CaO·2Al2O3, CaO·6Al2O3, FeSiC, FeSiO, AlCaO, AlMgCaO, etc. Figure 9 depicts the distributions of the non-metallic inclusions found.
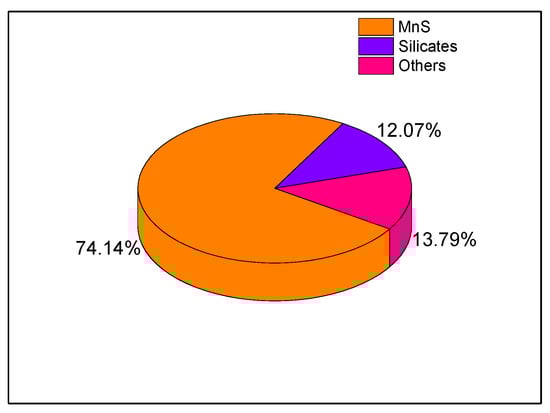
Figure 9.
Non-metallic inclusions found in the API 5L X60 steel studied.
3.2. Role of Non-Metallic Inclusions in Pitting Corrosion
To understand the relationship between inclusions and pitting corrosion, we carried out immersion tests in a chemical solution as described in the previous section. In the first set of experiments, the immersion tests were performed for 30, 60 and 180 min. Once the microstructure was revealed (using a Nital solution) in each of the specimens, we proceeded to take micrographic sequences of the entire metallic surface (exposure area) in order to produce micrographic backups of each of the samples before micro-testing corrosion and to document their state before the immersion test.
After taking all the micrographs for a corresponding state, the micrographs taken at 50× were stitched together in consecutive order to produce an image of the entire test area. The micrographs taken at 100× were used to carry out microstructure and inclusion analysis, and 200× images were used to learn more about the characteristics of the areas surrounding the micro-pits that were generated after the immersion test. Figure 10 illustrates the micrographic compositions corresponding to a test for a given exposure time. For the sake of exemplification, Table 3 shows the number of inclusions found after a certain immersion time.
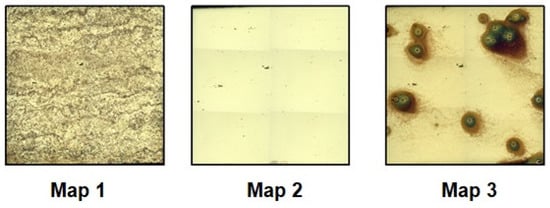
Figure 10.
Mapping process to analyze the relationship between inclusions and pit nucleation.
Table 3.
Summary of the relationship between total non-metallic inclusions and the place where the pits were nucleated.
For the sake of finding a relationship between inclusion area and pitting area, we plotted a scatter diagram as shown in Figure 11. One can notice a greater correlation between inclusion area and pit area when the inclusion area is smaller than 200 µm2 (Spearman’s rho (correlation coefficient) equal to 0.50). The smaller the inclusion area is, the greater the probability of provoking pitting corrosion is.
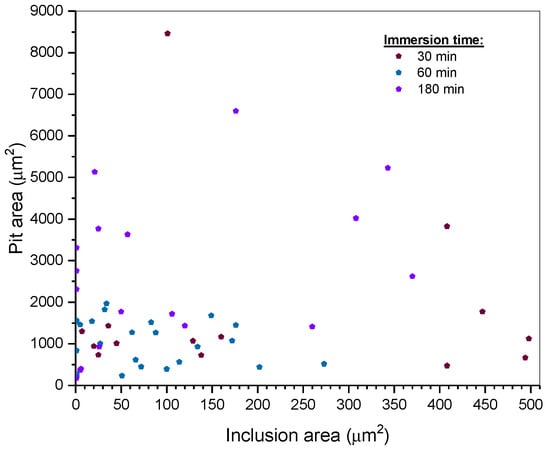
Figure 11.
Scatter plot of relationship between non-metallic inclusion area and pit area.
Inclusions that encouraged pit nucleation are named “active inclusions”. Figure 12 and Figure 13 show histograms for active inclusion area and their shape factor. The active inclusion area histogram was fitted to the Generalized Pareto distribution (see Equation (3)). The histogram for active inclusion shape factor was fitted to Gumbel’s minimum value distribution represented by Equation (6) [36,37].
where , and and are the location and scale parameters, respectively. In Figure 11, we notice that inclusions with smaller areas tend to be more likely to cause pitting corrosion than larger inclusions. Otherwise, inclusions with a shape factor close to one tend to be more likely to provoke pits. However, it seems that elongated inclusions are more active than circular inclusions because the ratio of active elongated inclusions is higher than that of circular ones.
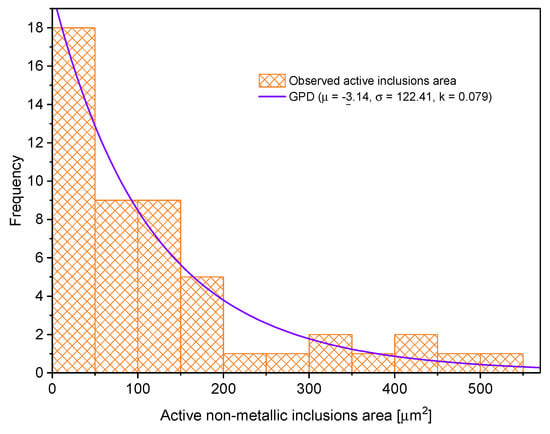
Figure 12.
Histogram for active non-metallic inclusion area.
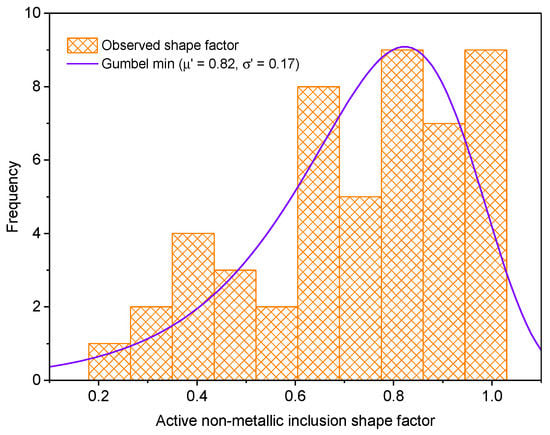
Figure 13.
Histogram for active non-metallic shape factor.
For illustration purposes, as evidence that inclusions tend to generate defects, Figure 14 shows the appearance of a polished API 5L Grade B steel surface (see the inclusions in Figure 14a) and the same steel surface after being subjected to immersion tests (see the holes provoked by the pitting corrosion defects after the immersion test in Figure 14b).
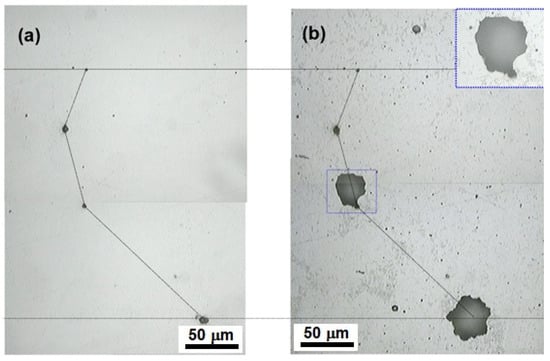
Figure 14.
(a) API 5L X60 surface before immersion test and (b) after being immersed for 180 min.
Figure 15 shows micrographs of pits generated after the 30 min immersion test using different magnifications in a chemically etched steel surface, where inclusions with a shape factor close to one caused pit nucleation. Figure 15a–c do not allow to determine the shape factor correctly until we increase the magnification (see Figure 15d).
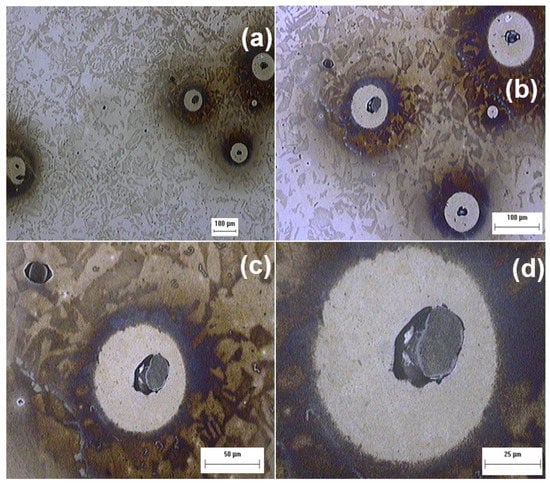
Figure 15.
Micrographs of pits generated after inclusion dissolution at different magnifications.
One characteristic that is typically studied when oil and gas pipelines are in service is the pitting depth [10,12,38,39]. The main reason is that defects generated by localized corrosion threaten the hermeticity of pipes that transport hydrocarbons because they form stress concentrators that do not allow them to operate at the required pressure conditions [7,8]. For example, F. Caleyo and coworkers [39,40] determined using Monte Carlo simulations that localized corrosion defect depth exerts more influence in pipeline failure pressure estimation. For this reason, a histogram of the pitting depths generated due to inclusion dissolution (after 30, 60 and 180 min immersion tests) was plotted and adjusted to the GEVD (see Equation (6)), observing a high probability of accepting the null hypothesis (p-value greater than 0.05 in the K–S, A–D and chi-square tests). Figure 16 reflects this statement.
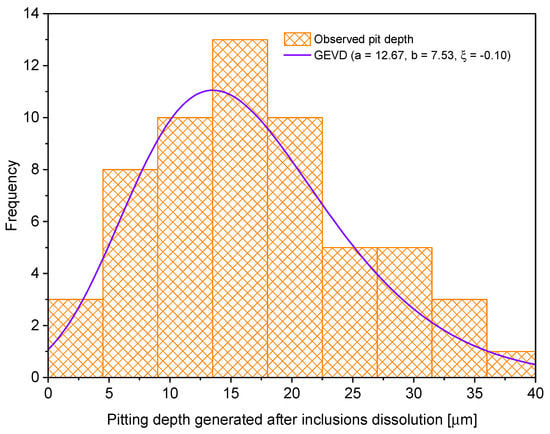
Figure 16.
Pitting depth caused by inclusion dissolution.
3.3. Mid-Term Immersion Test
For the sake of analyzing the behavior of pitting corrosion depth evolution, the observed data were fitted to the GEVD because this distribution has been used previously to represent this evolution in the literature [40,41]. After fitting, it is feasible to observe the evolution of the shape parameter towards less negative values (see Table 4). In Figure 17, we notice that the pitting corrosion depth obtained after the 7-day immersion test shows a more positive kurtosis (of the majority of observed values close to the mean). On the other hand, the depths obtained after the 7-day immersion test generate a right-skewed distribution. As an example of the pits generated after the 1-day immersion test, Figure 18 shows the appearance of corrosion pits after the dissolution of active inclusions.
Table 4.
GEVD parameters obtained after mid-term immersion tests.
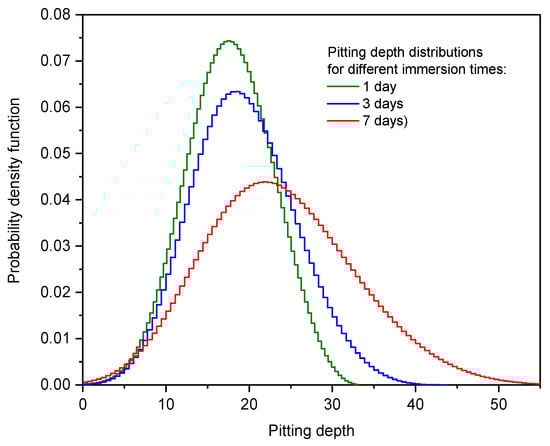
Figure 17.
Pitting depth distribution after immersion tests of varying duration.
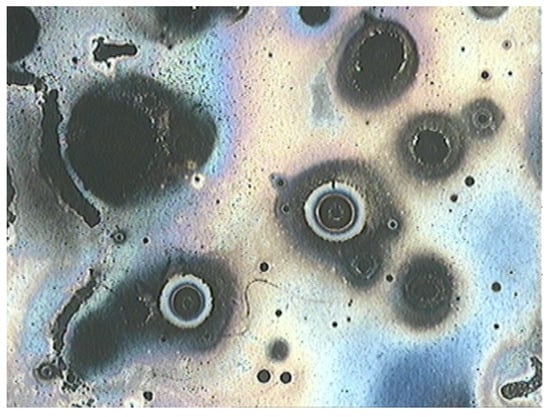
Figure 18.
Pitting corrosion damage after 1-day immersion test.
3.4. Overall Analysis
The stochastic nature of pitting corrosion has been recognized since the 1950s [37,42,43]. It seems that this random characteristic could be caused by the same random nature of non-metallic inclusion features (e.g., length, width and shape factor) studied in the present research work. The Generalized Pareto distribution (GPD), Generalized Extreme Value distribution (GEVD) and Gumbel distribution are functions typically used to study the pitting corrosion phenomenon [37] and, in this investigation, remained as the preferred distributions that fit several pit characteristics (e.g., area and depth). The GEVD properly represents the evolution of pitting corrosion depth undergone after 1, 3 and 7 days of immersion.
Most of the inclusions found and analyzed were compounds of MnS, and they tended to become active inclusions when they came in contact with a corrosive environment. From the total number of inclusions found (regardless of their chemical composition), only about two to three percent of them became active. It seems that non-metallic inclusions with smaller areas tend to generate pitting corrosion defects with greater probability than bigger ones.
By observing Figure 15 and Figure 18, we notice the darker aspect that can be attributed to a burn-like appearance due to the solution’s acidity (pH = 4.3). This is evidence of the inclusion dissolution that motivates pit nucleation with an autocatalytic nature because the corrosion products and subproducts encourage further corrosion reactions, especially in acidic environments [42,43].
4. Conclusions
After considering the results obtained and their corresponding analysis, we can state the following conclusions to emphasize the relationship between non-metallic inclusions and pitting corrosion defects:
- Probability distributions such as those of Generalized Extreme Value, Generalized Pareto and Gumbel can satisfactorily represent the random nature of non-metallic inclusion characteristics, namely length, width and shape factor;
- The Generalized Extreme Value distribution fits adequately for pit depth histograms across mid-term immersion tests (1, 3 and 7 days). The shape parameter of this distribution tends to capture the change in the skewness and kurtosis because of the evolutions of the depth and the emergence of new and shallow pits;
- Inclusions with smaller areas tend to generate pits. In fact, there is a moderate correlation between inclusion area and pit area;
- MnS inclusions are more frequent in API 5L X60 steel than other type of inclusions. Likewise, MnS inclusions tend to be more active and prone to dissolution than others.
Author Contributions
Conceptualization, J.C.V. and J.J.H.-H.; methodology; M.D.-C. and E.H.-S.; validation, J.C.V., E.H.-S. and J.J.H.-H.; formal analysis, J.C.V. and E.H.-S.; investigation, J.J.H.-H. and A.C.-T.; resources, J.C.V., E.H.-S. and R.C.-S.; data curation, J.J.H.-H. and S.I.C.-C.; writing—original draft preparation, J.C.V. and M.D.-C.; writing—review and editing, J.C.V. and E.H.-S.; visualization, A.C.-T. and S.I.C.-C.; supervision, J.C.V. and R.C.-S.; project administration, R.C.-S., J.C.V. and E.H.-S.; funding acquisition, M.D.-C. and A.C.-T. All authors have read and agreed to the published version of the manuscript.
Funding
This research received no external funding.
Institutional Review Board Statement
Not applicable.
Informed Consent Statement
Not applicable.
Data Availability Statement
Not applicable.
Acknowledgments
The comments provided by the reviewers are deeply appreciated.
Conflicts of Interest
The authors declare no conflict of interest.
References
- Omonbude, E.J. The Economics of Transit Oil and Gas Pipelines: A Review of the Fundamentals. OPEC Energy Rev. 2009, 33, 125–139. [Google Scholar] [CrossRef]
- IEA. Analysis and Forecast to 2026. Available online: https://www.iea.org/data-and-statistics/charts/fossil-fuel-use-by-scenario-2020-2030-and-2050 (accessed on 30 April 2023).
- Kraidi, L.; Shah, R.; Matipa, W.; Borthwick, F. An Investigation of Mitigating the Safety and Security Risks Allied with Oil and Gas Pipeline Projects. J. Pipeline Syst. Eng. 2021, 1, 349–359. [Google Scholar] [CrossRef]
- Wan, C.; Mita, A. Recognition of Potential Danger to Buried Pipelines Based on Sounds. Struct. Control. Health Monit. 2008, 17, 317–337. [Google Scholar] [CrossRef]
- Mahmoodian, M.; Li, C.Q. Failure Assessment and Safe Life Prediction of Corroded Oil and Gas Pipelines. J. Pet. Sci. Eng. 2017, 151, 434–438. [Google Scholar] [CrossRef]
- Ossai, C.I. Advances in Asset Management Techniques: An Overview of Corrosion Mechanisms and Mitigation Strategies for Oil and Gas Pipelines. ISRN Corros. 2012, 2012, 570143. [Google Scholar] [CrossRef]
- Velázquez, J.C.; González-Arévalo, N.E.; Díaz-Cruz, M.; Cervantes-Tobón, A.; Herrera-Hernández, H.; Hernández-Sánchez, E. Failure Pressure Estimation for an Aged and Corroded Oil and Gas Pipeline: A Finite Element Study. J. Nat. Gas. Sci. Eng. 2022, 101, 104532. [Google Scholar] [CrossRef]
- Velázquez, J.C.; Caleyo, F.; Hallen, J.M.; Romero-Mercado, O.; Herrera-Hernandez, H. Probabilistic Analysis of Different Methods Used to Compute the Failure Pressure of Corroded Steel Pipelines. Int. J. Electrochem. Sci. 2013, 2013, 11356–11370. [Google Scholar]
- Caleyo, F.; Alfonso, L.; Alcántara, J.; Hallen, J.M. On the Estimation of Failure Rates of Multiple Pipeline Systems. J. Press. Vessel. Technol. 2008, 130, 021704. [Google Scholar] [CrossRef]
- Velázquez, J.C.; Caleyo, F.; Valor, A.; Venegas, V.; Espina-Hernández, J.H.; Hallen, J.M.; López, M.R. Study Helps Model Buried Pipeline Pitting Corrosion. Oil Gas J. 2009, 107, 64–73. [Google Scholar]
- Velázquez, J.C.; Valor, A.; Caleyo, F.; Venegas, V.; Espina-Hernandez, J.H.; Hallen, J.M.; Lopez, M.R. Pitting Corrosion Models Improve Integrity Management, Reliability. Oil Gas J. 2009, 107, 52–62. [Google Scholar]
- Caleyo, F.; Valor, A.; Venegas, V.; Espina-Hernandez, J.H.; Velázquez, J.C.; Hallen, J.M. Accurate Corrosion Modeling Improves Reliability Estimations. Oil Gas J. 2012, 110, 122–129. [Google Scholar]
- Smialowski, M.; Szklarska-Smialowska, Z.; Rychcik, M.; Szummer, A. Effect of Sulphide Inclusions in a Commercial Stainless Steel on the Nucleation of Corrosion Pits. Corros. Sci. 1969, 9, 123–125. [Google Scholar] [CrossRef]
- Park, J.H.; Kang, Y. Inclusions in Stainless Steels—A Review. Steel Res. Int. 2017, 88, 1700130. [Google Scholar] [CrossRef]
- Li, D.; Huang, F.; Lei, X.; Jin, Y. Localized Corrosion of 304 Stainless Steel Triggered by Embedded MnS. Corros. Sci. 2023, 211, 110860. [Google Scholar] [CrossRef]
- Kovalov, D.; Taylor, C.D.; Heinrich, H.; Kelly, R.G. Operando Electrochemical TEM, Ex-Situ SEM and Atomistic Modeling Studies of MnS Dissolution and Its Role in Triggering Pitting Corrosion in 304L Stainless Steel. Corros. Sci. 2022, 199, 110184. [Google Scholar] [CrossRef]
- American Petroleum Institute. API 5L Specifications for Line Pipe; API: Houston, TX, USA, 2007. [Google Scholar]
- Wang, L.; Xin, J.; Cheng, L.; Zhao, K.; Sun, B.; Li, J.; Wang, X.; Cui, Z. Influence of Inclusions on Initiation of Pitting Corrosion and Stress Corrosion Cracking of X70 Steel in Near-Neutral PH Environment. Corros. Sci. 2019, 147, 108–127. [Google Scholar] [CrossRef]
- Liang, H.; Asselin, E. Ex Situ Examination of Matrix and Inclusions of API-X100 before and after Exposure to Bitumen at Elevated Temperature. Materials 2021, 14, 5007. [Google Scholar] [CrossRef] [PubMed]
- Krawiec, H.; Vignal, V.; Heintz, O.; Oltra, R.; Krawiec, H.; Chauveau, E. Dissolution of Chromium-Enriched Inclusions and Pitting Corrosion of Resulfurized Stainless Steels. Metall. Mater. Trans. A 2006, 37, 1541–1549. [Google Scholar] [CrossRef]
- Park, I.-J.; Lee, S.-M.; Kang, M.; Lee, S.; Lee, Y.-K. Pitting Corrosion Behavior in Advanced High Strength Steels. J. Alloys. Compd. 2015, 619, 205–210. [Google Scholar] [CrossRef]
- Avci, R.; Davis, B.H.; Wolfenden, M.L.; Beech, I.B.; Lucas, K.; Paul, D. Mechanism of MnS-Mediated Pit Initiation and Propagation in Carbon Steel in an Anaerobic Sulfidogenic Media. Corros. Sci. 2013, 76, 267–274. [Google Scholar] [CrossRef]
- Li, Y.; Liu, J.; Deng, Y.; Han, X.; Hu, W.; Zhong, C. Ex Situ Characterization of Metallurgical Inclusions in X100 Pipeline Steel before and after Immersion in a Neutral PH Bicarbonate Solution. J. Alloys. Compd. 2016, 673, 28–37. [Google Scholar] [CrossRef]
- Muto, I.; Ito, D.; Hara, N. Microelectrochemical Investigation on Pit Initiation at Sulfide and Oxide Inclusions in Type 304 Stainless Steel. J. Electrochem. Soc. 2009, 156, C55. [Google Scholar] [CrossRef]
- Xue, H.B.; Cheng, Y.F. Characterization of Inclusions of X80 Pipeline Steel and Its Correlation with Hydrogen-Induced Cracking. Corros. Sci. 2011, 53, 1201–1208. [Google Scholar] [CrossRef]
- ASTM International. ASTM E112-13 Standard Test Methods for Determining Average Grain Size; ASTM Internacional: West Conshohocken, PA, USA, 2018. [Google Scholar]
- ASTM International. ASTM E45-18a Standard Test Methods for Determining the Inclusion Content of Steel; ASTM Internacional: West Conshohocken, PA, USA, 2018. [Google Scholar]
- Velázquez, J.C.; Caleyo, F.; Valor, A.; Hallen, J.M. Field Study—Pitting Corrosion of Underground Pipelines Related to Local Soil and Pipe Characteristics. Corrosion 2010, 66, 016001–016005. [Google Scholar] [CrossRef]
- McMahon, D.; TOPA, D.M. A Beginner’s Guide to Mathematica; Chapman & Hall/CRC: New York, NY, USA, 2006. [Google Scholar]
- Coles, S. An Introduction to Statistical Modeling of Extreme Values; Springer: London, UK, 2001. [Google Scholar]
- Villavicencio, J.; Ulloa, N.; Lozada, L.; Moreno, M.; Castro, L. The role of non-metallic Al2O3 inclusions, heat treatments and microstructure on the corrosion resistance of an API 5L X42 steel. J. Mater. Res. Technol. 2020, 9, 5894–5911. [Google Scholar] [CrossRef]
- Beidokhti, B.; Koukabi, A.H.; Dolati, A. Effect of titanium addition on the microstructure and inclusion formation in submerged arc welded HSLA pipeline steel. J. Mater. Process. Technol. 2009, 209, 4027–4035. [Google Scholar] [CrossRef]
- Pourazizi, R.; Mohtadi-Bonab, M.A.; Szpunar, J.A. Role of texture and inclusions on the failure of an API X70 pipeline steel at different service environments. Mater. Charact. 2020, 164, 110330. [Google Scholar] [CrossRef]
- Mostafijur Rahman, K.M.; Mohtadi-Bonab, M.A.; Ouellet, R.; Szpunar, J.; Zhu, N. Effect of electrochemical hydrogen charging on an API X70 pipeline steel with focus on characterization of inclusions. Int. J. Press. Vessels Pip. 2019, 173, 147–155. [Google Scholar] [CrossRef]
- Zhang, J.M.; Zhang, J.F.; Yang, Z.G.; Hui, W.J.; Weng, Y.Q. Estimation of maximum inclusion size and fatigue strength in high-strength ADF1 steel. Mater. Sci. Eng. A 2005, 394, 126–131. [Google Scholar] [CrossRef]
- Castillo, E. Extreme Value Theory in Engineering, First Edition; Academic Press: New York, NY, USA, 1988. [Google Scholar]
- Castillo, E.; Hadi, A.S.; Balakrishnan, N.; Sarabia, J.M. Extreme Value and Related Models with Applications in Engineering and Science; John Wiley & Sons: Hoboken, NJ, USA, 2005. [Google Scholar]
- Velázquez, J.C.; Hernández-Sánchez, E.; Terán, G.; Capula-Colindres, S.; Diaz-Cruz, M.; Cervantes-Tobón, A. Probabilistic and Statistical Techniques to Study the Impact of Localized Corrosion Defects in Oil and Gas Pipelines: A Review. Metals 2022, 12, 576. [Google Scholar] [CrossRef]
- Velázquez, J.C.; Cruz-Ramirez, J.C.; Valor, A.; Venegas, V.; Caleyo, F.; Hallen, J.M. Modeling Localized Corrosion of Pipeline Steels in Oilfield Produced Water Environments. Eng. Fail. Anal. 2017, 79, 216–231. [Google Scholar] [CrossRef]
- Caleyo, F.; González, J.L.; Hallen, J.M. A Study on the Reliability Assessment Methodology for Pipelines with Active Corrosion Defects. Int. J. Press. Vessel. Pip. 2002, 79, 77–86. [Google Scholar] [CrossRef]
- Caleyo, F.; Velázquez, J.C.; Valor, A.; Hallen, J.M. Probability Distribution of Pitting Corrosion Depth and Rate in Underground Pipelines: A Monte Carlo Study. Corros. Sci. 2009, 51, 1925–1934. [Google Scholar] [CrossRef]
- Rivas, D.; Caleyo, F.; Valor, A.; Hallen, J.M. Extreme Value Analysis Applied to Pitting Corrosion Experiments in Low Carbon Steel: Comparison of Block Maxima and Peak over Threshold Approaches. Corros. Sci. 2008, 50, 3193–3204. [Google Scholar] [CrossRef]
- Fontana, M. Corrosion Engineering, 3rd ed.; Mc Graw-Hill: New York, NY, USA, 1986. [Google Scholar]
Disclaimer/Publisher’s Note: The statements, opinions and data contained in all publications are solely those of the individual author(s) and contributor(s) and not of MDPI and/or the editor(s). MDPI and/or the editor(s) disclaim responsibility for any injury to people or property resulting from any ideas, methods, instructions or products referred to in the content. |
© 2023 by the authors. Licensee MDPI, Basel, Switzerland. This article is an open access article distributed under the terms and conditions of the Creative Commons Attribution (CC BY) license (https://creativecommons.org/licenses/by/4.0/).