Abstract
Low-pressure cold spray (LPCS) coating deposition requires the consideration of multiple parameters to define spraying conditions. The use of a parameter window provides an integral approach to achieving this goal. In this work, an LPCS deposition window for zinc powders was obtained through the development of a one-dimensional analytical model of fluid and particle interaction. The model considers powder particle injection downstream of the nozzle and follows the particle from injection to impact. The model equations relate the particle velocity to the process parameters, such as the gas pressure and temperature , particle size and stand-off distance . The values of the particle velocity at the nozzle exit and during the “free-jet”, as well as the drag coefficient , were calculated using experimental spraying conditions for Cu and Al that have previously been documented in LPCS studies. The model’s accuracy and applicability to other materials were confirmed upon comparing the results with those in the aforementioned studies. Moreover, the definition of the model equations allowed for the identification of three new parameters: the maximum ideal particle velocity, the capacity to accelerate the powder particle inside the nozzle and the deceleration of the particle in the free-jet zone. These parameters have not previously been published and allow for comparative evaluation between LPCS processes.
1. Introduction
Cold spray (CS) is a technique that uses kinetic energy to accelerate microparticle materials onto a substrate to achieve bonding between them. It can be used to produce coatings and additive manufacturing (AM) parts. Figure 1 shows a schematic representation of a CS process. In this process, the process gas and the material particles go through a converging–diverging nozzle when the desired pressure and temperature are reached, which accelerates them to high speeds. Particles in CS can reach velocities between 200 and 1200 m/s [1], depending on the equipment and the spraying parameters used. Moreover, the particle temperature is always kept below the particle material’s melting point. This results in a solid-state deposition process [2]. The bonding of the particles to the substrate and to other particles depends almost entirely on the particle velocity reaching or exceeding the critical velocity . For metals, the critical velocity is the minimum value that the particle velocity must reach upon impact with the substrate so that an extreme deformation of both materials and metallurgical bonding can occur [3]. When these two conditions are met, coatings with adequate properties of adhesion, morphology, microstructure, etc., can be expected. This makes the combination of CS equipment and process parameter selection key to obtaining the proper particle velocity for a successful coating deposition. Cold spray systems are mainly divided into high-pressure (HPCS) and low-pressure (LPCS). Modern HPCS equipment can reach up to 70 bar [4] of working pressure, while most traditional LPCS systems can reach a maximum of 9 bar [5]. Another relevant difference is the location at which the powder particles are fed. In HPCS equipment, the particles are usually fed upstream of the nozzle (on the converging or subsonic side), which means they travel through the entire nozzle together with the process gas, accumulating energy (see Figure 1). However, in LPCS the powders are usually added downstream (on the diverging or supersonic side) of the nozzle, which, in turn, results in lower particle velocities compared to HPCS.
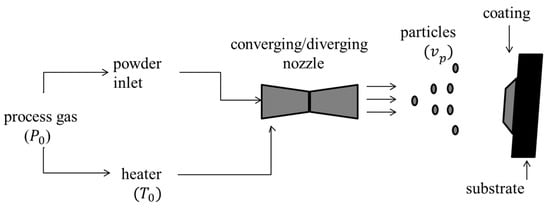
Figure 1.
Schematic representation of a high-pressure cold spray (HPCS) process. Adapted from [2].
Considering these features, it is evident that HPCS would be more suitable for spraying materials that can reach a broader range of critical velocity values. Nevertheless, the LPCS system is more economical and portable, making it more convenient.
In the past, cold spray process parameters were selected based on systematic testing to achieve a particle velocity that reached or exceeded the powder material’s critical velocity . Whether or not this was attained, the effect of the parameters was evaluated after the experimental spraying procedure through the characterization of the resulting coating. It is worth mentioning that measuring the particle velocity during the process requires specialized and costly equipment that is not readily available in all CS facilities, hence the need for mathematical models to obtain a calculated value. Most of the available experimentally measured data are obtained through the use of HPCS systems. In [6], a set of documented experimental values of particle velocities and their associated process parameters were used as a reference to optimize the spraying parameters. Although the referenced values of gas pressure were within the range of those defined for LPCS (below 9 bar [5]), the system used in the documented source had an upstream powder inlet. If the referenced data were to be used in an LPCS system, it would have to consider the powder inlet’s location.
In recent years, some studies have developed analytical and computational models (i.e., Finite Element Analyses) to predict particle velocity values based on a specific combination of process parameters. Most of these studies have been conducted for HPCS, with fewer similar studies published for LPCS. Because of the working differences previously mentioned, the mathematical models developed to predict the particle velocity values for HPCS do not necessarily apply to LPCS. One example is the analytical method described in [7] to build a deposition window for HPCS processes. The model allows for the particle velocity to be obtained in terms of powder characteristics, as well as process parameters, such as gas pressure and temperature . However, the authors considered the powder inlet upstream of the nozzle and highlighted that there are differences between modeling the powder injection at the converging and diverging sides. Furthermore, the authors of [8] studied the compressive residual stress of a multilayered material composed of aluminum and zinc alloys sprayed over a magnesium alloy substrate. LPCS equipment with a downstream powder inlet was used. The authors of [8] reported using the analytical method described in [7] to obtain the particle velocity , which contributed to parameter selection. The mentioned work emphasizes the need for studies such as those performed in [7] to obtain process parameters for the LPCS system, i.e., considering a downstream powder inlet.
Although there are few, some studies describe methods of calculating the particle velocity for LPCS. In [9], a computational model was used to study how the particle diameter and impact temperature affect the deposition of aluminum particles on a steel substrate. In one of the experiments, the particle inlet was located on the diverging side of the nozzle. The in-flight particle velocity was experimentally measured at the center of the nozzle, and the average value was reported. The authors of [10] described an improvement in deposition efficiency in CS upon optimizing the particle size and nozzle diameter. Experimental tests on Cu particles sprayed onto Cu substrates were performed using an LPCS system known to have a downstream powder inlet. A computational model was used to determine the particle velocity at the nozzle exit. In this case, the study reported the measured particle velocity values. The authors of [11] studied the impact of powder particle morphology and size on the in-flight particle velocity and deposition efficiency (DE) in an LPCS system. The in-flight particle velocity was measured experimentally. The equipment used to measure the particle velocity was placed 10 mm from the nozzle exit. Although a mathematical model was not presented in this study, the experimental results are relevant since the distance at which they were measured is commonly used in CS processes. This makes the documentation of these data highly useful for the development of LPCS mathematical models.
Models or equations to estimate the particle velocity for LPCS systems are not abundant in the literature, and the majority of those available employ complex computational methods [9,10]. These methods have the capacity to simulate conditions (bow shock, variable drag coefficients, different particle morphologies, etc.) that are more complex or sometimes impossible to simulate through analytical methods. However, to develop a computational model, even when the basis is one previously published, it is necessary to invest in hardware and software and undertake many hours of programming. This is justified once there is a level of certainty regarding the materials, equipment and purpose of the desired CS. Still, these methods would not be convenient for the initial evaluation of the required conditions, materials or systems. In such cases, an analytical model fulfills this purpose since it does not require specialized equipment or software, enables faster implementation of modifications and, under the correct mathematical approach and assumptions, it provides accurate results. Moreover, the need for a simplified method to support the design of experiments (DOE), Monte Carlo simulations, optimization techniques and process parameter comparison is still not completely fulfilled. The present study proposes a simplified analytical model that can contribute to the calculation of the particle velocity for LPCS (See symbols in Table 1). The particle velocity is derived mainly from the process gas and particle characteristics while considering the powder inlet on the diverging side of the nozzle. Using this model, particle velocities were calculated using spraying conditions that have previously been documented in LPCS studies. The analytical results were then compared with the reported experimental measurements. Finally, the model was used to obtain a deposition window for zinc powder using LPCS equipment.

Table 1.
Symbols.
2. Materials and Methods
2.1. Analytical Model
The particle velocity analytical model considers a system composed of two sections (see Figure 2). The first section starts with the acceleration of a particle inside the diverging side of the nozzle and ends when it exits the nozzle ). The second section takes place in the free-jet zone, starting immediately after the particle leaves the nozzle at the and ending when it reaches the substrate at its impact velocity .
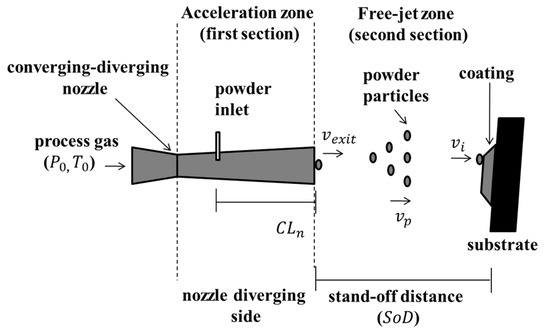
Figure 2.
Schematic representation of an LPCS process showing the two sections of the system defined for the analytical model. The powder inlet is located on the diverging side of the nozzle. The dotted lines divide the two sections: acceleration zone (inside the diverging side of the nozzle) and “free-jet” (outside of the nozzle). Adapted from [3].
2.2. Particle Velocity Estimation at the Exit of the Nozzle ()
To calculate the particle velocity inside the nozzle, the first section of the model, the following assumptions are made: the particle is spherical, the process gas has the properties of an ideal gas, the gas flow is one dimensional and isentropic, and the nozzle has a linear profile (there is no interaction of the gas with the nozzle walls). As a result of these considerations, the only forces acting on the particle are the force of the process gas due to its velocity and the drag force. The resulting governing first-order non-linear differential equation for particle velocity () is detailed in Equation (1) which depends on the gas density and velocity , and particle size ( and density ( as well as the drag coefficient (.
Equation (1) can be analytically solved under the assumption of a constant average drag coefficient throughout the process. The selection of the value for the will be further explained in Section 3. By solving differential Equation (1) for an initial condition of a particle at rest (), it is possible to obtain the equation for particle velocity inside the nozzle (Equation (2)).
The model parameter (gamma) is a function of the process gas velocity inside the nozzle and the average drag coefficient , as defined in Equation (3).
Having set the average drag coefficient as constant, becomes the maximum ideal particle velocity that can be achieved inside the nozzle and depends mainly on the process driving force . It is important to note that is an ideal value because, in reality, the particle cannot reach it. This is because of the effect that the powder particle and process gas characteristics have on the actual particle velocity . The model parameter (beta) accounts for this effect. It is a function of the ratio of the process gas velocity and density to powder material density and size. The equation defining this parameter is detailed below:
The factor relates the process driving force () to the particle characteristics (). Note that the density of the process gas contributes to a higher driving force. The factor is a measure of the resistance of the particle to be accelerated. Larger values of this factor would lead to larger values of and, in turn, larger particle velocities . Under the same spraying conditions ( and ), materials with higher values would be easier to accelerate than those with lower values. This is because is a measure of the capacity of the overall process to accelerate the powder particle inside the nozzle.
It is important to note that small spherical particles with low densities would seem to be the best candidates for the objective of attaining higher particle velocities at the nozzle exit [12]. Equations (2) and (4) corroborate this idea. This is generally true when using nozzles that have been designed to eliminate or lessen the bow shock effect that usually takes place at the nozzle exit. Such nozzles have been developed to ensure optimum and homogeneous acceleration [13]. If these nozzles are not used, it is advisable to consider the results of [14]. The study states that small particles are more affected by bow shock than large particles of the same density and will reach lower particle velocities upon impact with the substrate. The study concludes that, in general, if the particle material has a low density, then large particles (9–40 µm) will reach higher velocities; for materials with high densities, small particles (within 5–8 µm) will reach higher velocities [14]. Although bow shock effects are outside of the scope of the analytical model presented in this work, it is advisable to consider the conclusions reached in [14] as guidelines when selecting the size and density of powder particles.
Process gas velocity () can be estimated using the selected pressure () and temperature () of the LPCS process. The is calculated for a converging/diverging nozzle using the published Equation (5) [15].
where and are the stagnation pressure and temperature, respectively, is the gas molecular mass, is the isentropic expansion factor, is the working gas constant and is the absolute pressure at the exit of the nozzle. The values for these parameters, which are used throughout this work, are listed in Table 2.
Table 2.
Parameters used in the model for numerical calculations.
It can be seen that gas velocity will mainly be influenced by the process parameters and , together with the type of process gas used. The stagnation values and refer to the temperature and pressure conditions of the process gas before entering the nozzle. It is known that the gas pressure and temperature drop significantly when the process gas travels through the nozzle and reaches the diverging side, which increases the gas velocity in turn [3]. This is why it is necessary to select appropriate values for and that maximize the gas velocity that can be reached in the diverging section of the nozzle. Larger values of gas pressure will increase the density of the process gas, which, in turn, will increase the process driving force, leading to higher gas velocities on the diverging side of the nozzle. An increase in will increase the particle and gas temperature. The latter will increase the local speed of sound throughout the nozzle, which will increase the gas velocity and particle velocity [3]. The characteristic parameters and are affected by and through the magnitude of the gas velocity (see Equations (3) and (4)). In general, and will increase as the temperature and pressure increase. It is also evident that is the limit of the maximum particle velocity that can be reached because it mainly depends on the gas velocity that the initial and can produce. There are limits to the benefits of increasing and , which are usually defined by the type of equipment and nozzle used, the properties of the material sprayed, the gas used, etc. Regarding the type of gas, a compressible one with a low molecular mass and high isentropic expansion factor ) is usually preferred since it allows for higher gas velocities (see Equation (5)). This is why helium is considered ideal for cold spray processes, although its use is limited due to its high cost. Air and nitrogen are usually the next best options, particularly for LPCS processes.
The velocity at the exit of the nozzle is obtained by solving the system of equations that results from Equation (2) and the position equation, which is the integral of Equation (2). The solution is applicable to conditions in which the particle reaches the end of the nozzle at the calculated nozzle length . The calculated nozzle length is the total length of the diverging side of the nozzle from the point at which the powder particles are fed to the nozzle exit (see Figure 2). A large calculated nozzle length will lead to higher particle exit velocities . The limitation is that if the calculated length is too large, then higher values of (and, in turn, and ) are required to obtain the full benefit. Equation (6) for the depends on the previously defined characteristic parameters and , as well as the calculated nozzle length ().
Figure 3 shows three plots depicting the value of the particle velocity at the exit of the nozzle for different values of at three different values of . All three plots exhibit the same behavior. As is increased, the value of rapidly increases. This is initially true, but the velocity at the end of the nozzle presents asymptotic behavior past a certain value of . As was explained before, represents the maximum ideal particle velocity inside the nozzle. This is confirmed by the data shown in Figure 3. For = 503, 596 and 671 m/s, the approximate maximum values of are 480, 575 and 650 m/s, respectively. Once the value of is defined, a limit to the maximum value for is also set and it will never reach the value of . The plots also show that the maximum value of can be raised by selecting a larger value of .
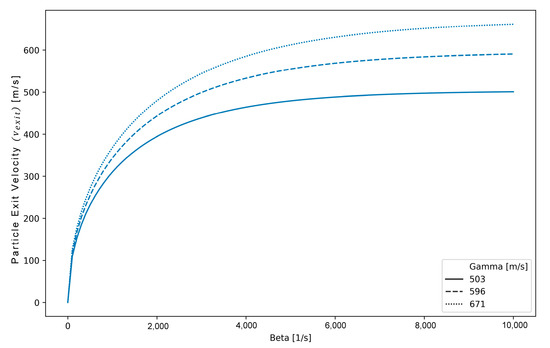
Figure 3.
Particle velocity at the exit of the nozzle for different values of particle acceleration capacity at three different values of : 503, 596 and 671 m/s.
2.3. Impact Particle Velocity Estimation ()
The second part of the model begins when the particle leaves the nozzle at an initial velocity equal to the (see Figure 2, free-jet zone). Along this section, it is considered that the only force acting on the particle is air drag, which reduces the particle velocity until it reaches the substrate at the impact velocity (). Under the same assumptions of a one-dimensional fluid acting on a spherical particle analysis, the differential equation has the following form:
Upon solving the differential equation with an initial particle velocity of , the expression for particle velocity ( is:
The parameter (alpha) is a function of the ratio of air density to powder material density , the estimated drag coefficient and the particle diameter . The equation defining this parameter is detailed in Equation (9).
For , as for (see Equation (4)), the factor represents the resistance of the particle to be accelerated, but in the case of the driving force of the process gas and its density is no longer present. represents the deceleration of the particle in the free-jet zone. Larger values of would result in lower values of particle impact velocity . This is because the only force pushing the particle forward is due to the velocity attained by the particle during acceleration inside the diverging side of the nozzle (see Equation (8)). This is why reaching the highest possible during the first section is so important.
In a similar way to the first section of the model, the impact velocity is obtained by solving the system of equations that results from Equation (8) and the position equation, which is the integral of Equation (8). The solution is calculated for the conditions in which the particle reaches the substrate located at the stand-off distance , which is the distance from the end of the nozzle to the substrate surface. The equation for the impact velocity depends on the previously defined model parameter , the and the desired stand-off distance .
Upon replacing Equation (6) for in the equation for impact velocity (Equation (10)), it is possible to define an expression for impact velocity as a function of the aforementioned process parameters, , as well as the calculated length of the nozzle and the stand-off distance .
Figure 4 shows plots of the particle impact velocity for different s at different values of . It can be concluded that larger will lead to lower impact velocities . This is because, according to Equation (11), the particle will only decelerate once it enters the free-jet zone; thus, the longer it has to travel to impact the substrate, the lower the particle impact velocity will be.
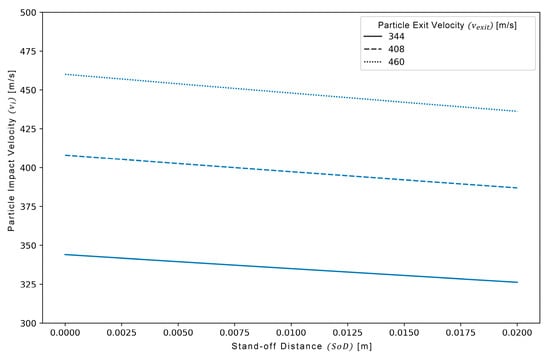
Figure 4.
Particle impact velocities for different stand-off distances at different particle exit velocities of 344, 408 and 460 m/s.
These plots show that the analytical model can help determine the particle impact velocity at any given once the is known, or it can help determine the required for any given values of and impact velocity . The latter will be studied in Section 5 of this work when the deposition window for zinc powder is developed. There is a second factor that can potentially reduce the particle impact velocity: the bow shock effect, which is reported to take place near the surface of the substrate due to the process gas flow in the free-jet zone [7,14,16,17]. We have already mentioned that bow shock effects are outside of the scope of this analytical model, but it will be briefly discussed here because the correct selection of powder particle characteristics and/or can potentially diminish its effects. The study described in [16] reports spraying small (5 µm) and large (22 µm) aluminum and copper spherical particles. The authors were able to measure the bow shock and particle impact velocities while varying the . They concluded that as the value of increased the effect of the bow shock decreased to the point where its effects no longer affected the particle impact velocity [16]. This means that there is a value for stand-off distance where the bow shock will have a minimal impact on the particle velocity. Additionally, according to the data reported in [16], small dense particles and large less dense particles (Cu particle size of 5 µm and Al particle size of 22 µm l, respectively) were less affected by the bow shock (only a 0.5% reduction in in both cases), and the largest reduction in particle impact velocity was of approximately 4% for the small less dense particles (Al, 5 µm). This correlates well with the conclusions from [14], which were previously discussed in Section 2.2 of this work. It is also of interest to consider the results obtained by the authors of [17] regarding the for LPCS applications. In [17], LPCS equipment was used to spray Cu particles with an average size of 11.1 µm, while the and were varied. The authors conclude that a stand-off distance range of 5 to 12.5 mm would allow for the highest particle impact velocities under the described spraying conditions [17].
With the definition of Equation (11), the analytical model is complete. As an example, the following parameters are considered: two sets of values for pressure and temperature ( = 200 °C and = 7 bar, and = 450 °C and = 8 bar), air as the process gas, a zinc particle with a of 40 µm, an average drag coefficient of 1.5 and a calculated nozzle length of 0.12 m. Using these values, the characteristic parameters of the maximum ideal particle velocity , particle acceleration capacity and deceleration of the particle in the free-jet zone can be obtained. Since two sets of pressure and temperature values are used, there are two values of , resulting in two different plots. Figure 5 shows the plots depicting the values of the particle velocity along the nozzle and the free-jet zone.
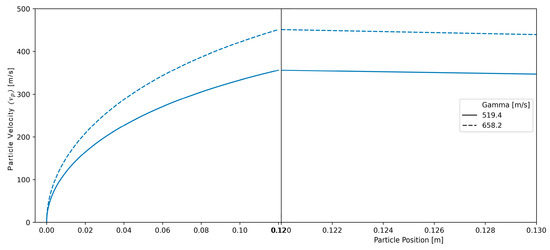
Figure 5.
Results obtained using the analytical model developed in this section. The figure depicts the values of particle velocity as it travels along the two sections that comprise the system: left: acceleration inside the nozzle (particle position: 0–0.120 m) and right: free-jet zone (particle position: 0.120–0.130 m). Two values of were considered: 519.4 and 658.2 m/s.
Using the value reported in [2] regarding the critical velocity for zinc ( = 339 m/s), the desired minimum impact velocity is set as . Lastly, if the = 0.01 m (approximately 0.130 m in the particle position), we can now determine whether any of the processes shown in Figure 5 can achieve the desired particle impact velocity. At the selected value of , the plots for = 519.4 and 658.2 m/s show impact velocities of about 350 and 450 m/s, respectively. Both processes could fulfill the condition required as long as the equipment is capable of providing the required pressure and temperature values. More information on the use of the analytical model will be provided in Section 5 when a deposition window is defined for zinc particles.
3. Average Drag Coefficient
To obtain an analytical solution for the non-linear differential Equation (1), the present analysis assumed a constant average drag coefficient (). Studies report that the drag coefficient for the ranges of the Mach and Reynolds numbers in LPCS processes varies from approximately 0.5 to 2.5 [7,18]. To select the average drag coefficient value for the analysis and process parameter selection in this work, a set of impact particle velocities () at different average drag coefficients () were calculated using the analytical model from Section 2 and the LPCS process parameters reported in [19]: air as the process gas at = 6 bar and 375 °C, a calculated nozzle length of = 0.14 m and aluminum particles with three different particle diameters of 17, 25 and 33 µm. Figure 6 shows the calculated using the analytical model compared with the experimental impact velocities measured in [19].
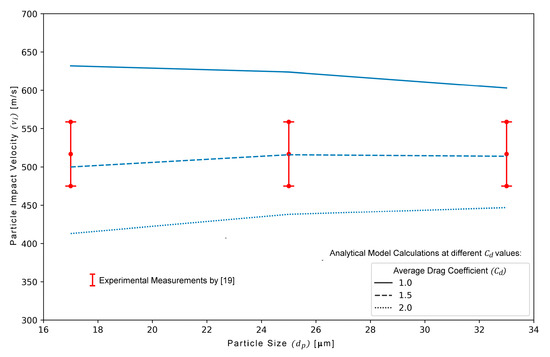
Figure 6.
Particle impact velocity () as a function of particle size. Aluminum particles sprayed at = 6 [bar] and = 375 [°C]. The lines show the results obtained from the mathematical model at different drag coefficients. The points with bars represent the experimental measurements of impact velocities (mean with standard deviation) reported in [19].
It is evident that the results from the analysis using a drag coefficient of 1.5 better fit the values obtained in [19]. The results using values of 1 and 2 overestimate and underestimate (respectively) the measured values or particle impact velocity , all of which fall outside of the experimental data range.
Through the use of the experimentally measured data, it was possible to estimate an average drag coefficient () of 1.5 for the LPCS process. This value will be used for further model validation and process parameter selection in the next sections.
4. Comparison of Model Results with Published Experimental Data
4.1. Particle Velocity at the Exit of the Nozzle ()
An assessment of the accuracy of the proposed model regarding the particle velocity at the exit of the nozzle (see Section 2.2, Equation (6)) was performed by comparison with the measured values reported in [10]. In this study, the particle velocity for copper particles (d50 = 29.8 μm and d90 = 54.6 µm) at two different temperatures (430 and 630 °C) and with gas pressures in the range of 5 to 9 bar were measured at the exit of the nozzle using DPV2000 optical equipment (Tecnar Automation Ltd., St-Bruno, QC, Canada) and a nozzle with = 0.13 m [10]. The results from the analytical model and the experimentally measured values are shown in Figure 7.
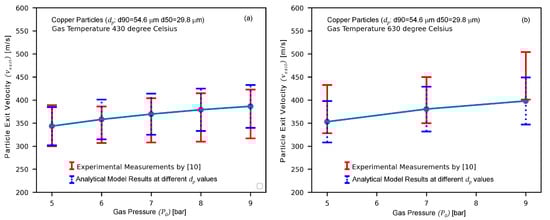
Figure 7.
Analytical model results for particle velocities at the nozzle exit () compared with experimental measurements reported in [10] at gas temperatures of 430 °C (a) and 630 °C (b) and with different gas pressure and particle size () values.
As discussed in Section 2, with a constant drag coefficient , the driving force, represented by the model parameter , will increase with a rising process temperature and pressure , making the velocity at the exit of the nozzle rise as well. The analytical model results follow the experimental measurements and confirm this trend. Under the condition of = 430 °C, the total increase in the average value of (for = 5 and 9 bar) is approximately 30 m/s for the experimental results and about 40 m/s for the analytical model results. At = 630 °C, the total increase in the average value of for the same pressure values is about 70 m/s for the experimental results and 50 m/s for the analytical model results. The greater difference between the results of the analytical model and the experimental data at = 630 °C may be due to the fact that, as mentioned in Section 2, pressure and temperature have a great influence on the process gas conditions and velocity throughout the nozzle. As the temperature and pressure increase, their influence becomes more significant. The analytical model with the assumed conditions may not be able to reflect this effect in its entirety. However, the model results are still accurate since the average results of the analytical model are within the experimental measurement range in all cases.
The results in Figure 7 also demonstrate variation in the particle velocity due to the effect of the particle size when considering single points at the constant pressure , temperature and particle density . In the analytical model (Section 2.2), the effect of the particle size is accounted for in the model parameter , which represents the capacity of the process to accelerate the particles inside the nozzle. is inversely proportional to the particle size . Low values of result from particles that are harder to accelerate, leading to lower velocities at the exit of the nozzle . The experimental and analytical results confirm this behavior. For each pressure and temperature condition, small particles (d50 = 29.8 μm, corresponding to the upper bar limits) have higher particle velocities, while larger particles (d90 = 54.6 µm, corresponding to the lower bar limits) have lower particle velocities. Furthermore, for each point at a constant pressure and temperature, the range of particle velocities (values within the upper and lower bar limits) calculated using the model aligns with those obtained experimentally. The average velocity range for the experimental measurements at 430 °C is 95 m/s, while the result for the model is 93 m/s. At 630 °C, the average velocity range for the experimental data and for the model results is the same: 103 m/s.
The analytical model was able to reflect the effect of the main process parameters on the velocity of the particle at the exit of the nozzle (.
4.2. Particle Impact Velocity ()
To evaluate the accuracy of the analytical model in predicting particle impact velocity , the study results in Ref. [11] were used for comparison. In Ref. [11], average experimental impact velocities were measured for copper particles of different sizes ( = 20 to 60 µm). The process conditions were as follows: nitrogen as the process gas, = 7 bar, = 300 °C, = 0.13 m and = 0.01 m. The analytical predictions from the model (using Equations (10) and (11)), together with the experimental values reported in [11], are shown in Figure 8. The model variation lines were obtained by considering the d50 and d90 values for each particle size, which are also reported in Ref. [11].
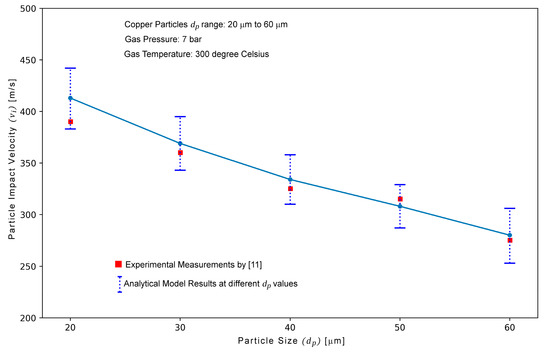
Figure 8.
Calculated particle impact velocities () compared with experimental measurements reported in Ref. [11] for different particle sizes ().
The results show that the experimental average impact velocities are within the range of the analytical results obtained using the proposed model. Both sets of results show a tendency toward a reduction in the particle velocity with an increase in the particle size . This is expected. As discussed in Section 2 and Section 4.1, large particles contribute to a lower (lower acceleration capacity), lower and, in turn, lower . The effect of the particle size in the free-jet zone is accounted for in the model parameter , which, as explained in Section 2.3, is a measure of the deceleration of the particle. The particle size will then affect model parameters and . The first affects the capacity of the particle to accelerate within the nozzle, and the later affects the capacity of the particle to keep its velocity in the free-jet zone. The experimental results show a 50 m/s reduction in the particle impact velocity when the particle size increases from 20 to 60 µm, while the analytical model predicts a reduction of 54 m/s. Of all the results, those at = 20 µm are the only ones that show a greater difference between the average calculated and experimental values. This could be due to normal variation in the measurement of experimental results or the effect that the bow shock next to the substrate has on smaller particles (as already discussed in Section 2.2 and Section 2.3. If the latter were true, it would still not contradict the conclusions from [14,17] since the average experimental value is still within the analytical model prediction. That is, the particle velocity would be affected, but not enough to significantly lower the impact velocity.
The exit and impact velocities obtained with the analytical model developed in this work are in agreement with the experimental results measured in [10,11]. This comparison also helped make recommendations on the use of the model. Based on the above sections and the discussion in Section 2.2 and Section 2.3, it is advised to use this analytical model with reservation when calculating for particle sizes outside of a 20 to 60 µm range, stagnation temperatures higher than 650 °C and stand-off distances lower than 0.01 m.
4.3. Deposition Window Definition for LPCS Process with Zinc
The values in Table 3 were considered the starting point for the definition of the LPCS deposition window.
Table 3.
Values for different parameters used in the deposition window definition.
The particle size () and density () were fixed according to commercially available zinc powders. A required minimum impact velocity of 390 m/s was chosen from the values reported in [20]. The drag coefficient was selected according to the results obtained in Section 3 of this work, and a calculated nozzle length of 0.12 was taken from a commercially available nozzle. Once the particle material and drag coefficient were selected, the value of the model parameter α (see Equation (9)) was completely defined. By selecting the desired stand-off distance , it was possible to establish a set of minimum velocities at the exit of the nozzle () that would meet the desired impact velocity (). The was selected based on the results obtained in [20]. Figure 9 shows the calculated particle impact velocity () as a function of the stand-off distance for three different conditions of (344, 408 and 460 m/s). Considering the selected stand-off distance of 0.01 m and the critical velocity of zinc, it can be seen that values of 408 and 460 m/s achieved the desired critical velocity when the particle impacted the substrate. Moreover, Equation (10) can be solved to find the exact minimum value that will meet the desired at the selected . Solving Equation (10) with the proposed values will result in a minimum of 400 m/s, which is congruent with the results from the graphical analysis.
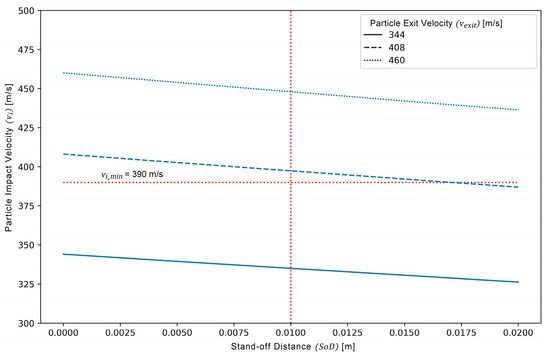
Figure 9.
Particle impact velocity () as a function of stand-off distance (SoD) for three particle exit velocities ().
Once the minimum was obtained, the next step was to find the model parameter that could later be used to define the process parameters and . Using Equations (4) and (6), it was possible to obtain a plot that relates the particle characteristics ( and ) to the at different values of (see Figure 10).
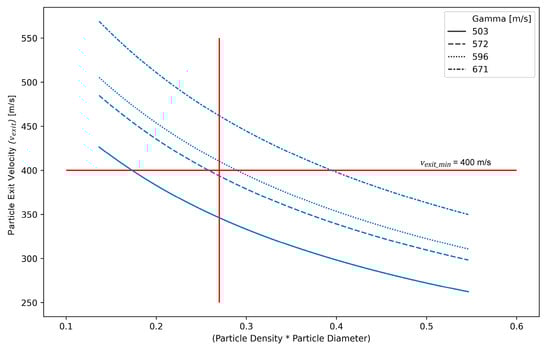
Figure 10.
Particle exit velocity () as a function of particle size and density for values of 503, 572, 596 and 671 m/s.
The size and density of the zinc particles had already been selected; therefore, the horizontal axis value was fixed at 0.273 . As shown in Figure 10, values of 596 and 671 m/s will produce values of 410 and 460 m/s, respectively, both of which are above the desired minimum exit velocity (400 m/s). Hence, a value of 596 m/s can be considered the minimum required value to achieve the desired and . In addition, Equations (4) and (6) can be solved together to obtain the exact desired minimum value of (Equation (12)).
Considering the values used for this deposition window, the minimum value calculated using Equation (12) is 584 m/s. This value is congruent with the value obtained from the graphical approach.
Once the minimum value of was obtained, it could be used to define the deposition window, the values of and that will meet the desired value of and, consequently, the desired and values. The particle size, particle material, process gas and estimated drag coefficient were fixed at this point. Figure 11 shows the variation in γ as a function of the carrier gas temperature at different pressures.
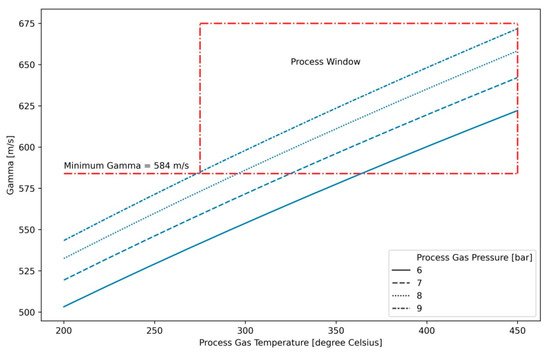
Figure 11.
Gamma () values as a function of process gas temperature () under different gas pressure () conditions: 6, 7, 8 and 9 (bar). The deposition window for process gas pressure and temperature is defined for the LPCS of zinc under the conditions defined in this section.
Different combinations of process gas temperature and pressure will allow for the achievement of the minimum required γ value to obtain the minimum required impact velocity (). With higher process gas temperatures, the process can be performed at lower pressures. In the case of zinc, its melting temperature () of 420 °C [21] limits the process gas temperature. Considering the latter, two potential conditions for the deposition of zinc, obtained using this method, are shown in Table 4.
Table 4.
Potential parameters for zinc deposition with a downstream powder inlet LPCS.
5. Conclusions
A simplified one-dimensional analytical model was developed to aid in the initial definition of LPCS processes. The model enables the assessment of the relationship between the process parameters and impact velocity without the need for time-consuming computational work.
Through the development of the model, it was possible to define three never-before-published LPCS model characteristic parameters: (gamma), which represents the maximum ideal particle velocity of the process; (beta), which depicts the capacity of the overall process to accelerate the powder particle inside the nozzle; and (alpha), which represents the deceleration of the particle in the free-jet zone. All of these characteristic parameters are completely defined in terms of gas conditions, as well as particle and equipment characteristics. By obtaining the values for these characteristic parameters, a complete definition of the process is attained as well as a means of comparison between LPCS deposition processes.
The calculated results aligned with the experimental measurements documented in indexed sources. This comparison confirmed the accuracy of the model and its capability to reflect the effects of different process parameters (pressure, temperature and particle size) on the particle velocity. Furthermore, the comparison also helped establish recommendations for the use of the model.
The model is versatile, as it enables calculations to be made depending on the known conditions of the process, based either on the process parameters (e.g., pressure and temperature) or on the target velocity (e.g., critical velocity, equipment and material). The parameter window obtained for the deposition of zinc is an example of the latter being the most common situation when starting a cold spray process. Furthermore, the equations defined in this work allow for the required values of and to be immediately obtained based on fixed process parameters.
Future work could explore the potential applicability of the model to high-strength metals or alloys. Recently, CS systems with a downstream powder feed capable of providing the required gas pressure levels for such materials have become available. It is expected that the experimental data necessary to calibrate this analytical model to those velocities, pressures and temperatures will become available in the near future.
Author Contributions
M.M.-F.: conceptualization, methodology, validation, formal analysis, investigation, writing—original draft. J.J.C.-C.: writing—review and editing. A.B.-P.: writing—review and editing, supervision, project administration, funding acquisition. All authors have read and agreed to the published version of the manuscript.
Funding
We gratefully acknowledge financial support from the National Council of Science and Technology (CONACYT) through its Doctoral Student Grant Program and from the Support Program for Research and Technological Innovation Projects (PAPIIT) (Grant Number: IT101221) of the General Direction of Academic Staff Affairs (DGAPA), National University of Mexico (UNAM).
Institutional Review Board Statement
Not applicable.
Informed Consent Statement
Not applicable.
Data Availability Statement
Not applicable.
Conflicts of Interest
The authors declare no conflict of interest.
References
- Koivuluoto, H.; Coleman, A.; Murray, K.; Kearns, M.; Vuoristo, P. High pressure cold sprayed (HPCS) and low pressure cold sprayed (LPCS) coatings prepared from OFHC cu feedstock: Overview from powdercharacteristics to coating properties. J. Therm. Spray Technol. 2012, 21, 1065–1075. [Google Scholar] [CrossRef]
- Assadi, H.; Kreye, H.; Gärtner, F.; Klassen, T. Cold spraying—A materials perspective. Acta Mater. 2016, 116, 382–407. [Google Scholar] [CrossRef]
- King, P.; Yandouzi, M.; Jodoin, B. The physics of cold spray. In Modern Cold Spray; Villafuerte, J., Ed.; Springer: Berlin/Heidelberg, Germany, 2015. [Google Scholar] [CrossRef]
- Villafuerte, J. Commercial Cold Spray Equipment. In Cold Spray in the Realm of Additive Manufacturing. Materials Forming, Machining and Tribology; Pathak, S., Saha, G., Eds.; Springer: Berlin/Heidelberg, Germany, 2020. [Google Scholar] [CrossRef]
- Maev, R.; Leshchynsky, V. Low-pressure cold spray (LPCS). In Cold-Spray Coatings; Cavaliere, P., Ed.; Springer: Berlin/Heidelberg, Germany, 2018. [Google Scholar] [CrossRef]
- Maledi, N.B.; Oladijo, O.P.; Botef, I.; Ntsoane, T.P.; Madiseng, A.; Moloisane, L. Influence of cold spray parameters on the microstructures and residual stress of Zn coatings sprayed on mild Steel. Surf. Coat. Technol. 2017, 318, 106–113. [Google Scholar] [CrossRef]
- Assadi, H.; Schmidt, T.; Richter, H.; Kliemann, J.O.; Binder, K.; Gärtner, F.; Klassen, T.; Kreye, H. On Parameter selection in cold spraying. J. Therm. Spray Technol. 2011, 20, 1161–1176. [Google Scholar] [CrossRef]
- Marzbanrad, B.; Toyserkani, R.; Jahed, H. Characterization of single-and multilayer cold-spray coating of Zn on AZ31B. Surf. Coat. Technol. 2021, 416, 127–155. [Google Scholar] [CrossRef]
- Nastic, A.; Jodoin, B.; Poirier, D.; Legoux, J.G. Particle temperature effect in cold spray: A study of soft particle deposition on hard substrate. Surf. Coat. Technol. 2021, 406, 126735. [Google Scholar] [CrossRef]
- Raoelison, R.N.; Aubignat, E.; Planche, M.P.; Costil, S.; Langlade, C.; Liao, H. Low pressure cold spraying under 6 bar pressure deposition: Exploration of high deposition efficiency solutions using a mathematical modelling. Surf. Coat. Technol. 2016, 302, 47–55. [Google Scholar] [CrossRef]
- Ning, J.X.; Jang, J.H.; Kim, H.J. The effects of powder properties on in-flight particle velocity and deposition process during low pressure cold spray process. Appl. Surf. Sci. 2007, 253, 7449–7455. [Google Scholar] [CrossRef]
- Hussain, T.; Yue, S.; Li, C.J. Characteristics of feedstock materials. In Modern Cold Spray; Villafuerte, J., Ed.; Springer: Berlin/Heidelberg, Germany, 2015. [Google Scholar] [CrossRef]
- Schmidt, T.; Assadi, H.; Gärtner, F.; Richter, H.; Stoltenhoff, T.; Kreye, H.; Klassen, T. From particle acceleration to impact and bonding in cold spraying. J. Therm. Spray Technol. 2009, 18, 794–808. [Google Scholar] [CrossRef]
- Helfritch, D.; Champagne, V. A Model Study of Powder Particle Size Effects in Cold Spray Deposition; Army Research Lab, Aberdeen Proving Ground: Adelphi, MD, USA, 2008. [Google Scholar]
- Sutton, G.P.; Biblarz, O. Rocket Propulsion Elements, 7th ed.; John Wiley & Sons, Inc.: Hoboken, NJ, USA, 2016; ISBN 978-1-11-875365-1. [Google Scholar]
- Pattison, J.; Celotto, S.; Khan, A.; O’neill, W. Standoff distance and bow shock phenomena in the Cold Spray process. Surf. Coat. Technol. 2008, 202, 1443–1454. [Google Scholar] [CrossRef]
- Moreno-Murguia, B.; Mora-Garcia, A.G.; Canales-Siller, H.; Giraldo-Betancur, A.L.; Espinosa-Arbelaez, D.G.; Muñoz-Saldaña, J. Influence of stand-off distance and pressure in copper coatings deposition efficiency and particle velocity. Surf. Coat. Technol. 2022, 430, 127986. [Google Scholar] [CrossRef]
- Loth, E.; Daspit, J.T.; Jeong, M.; Nagata, T.; Nonomura, T. Supersonic and hypersonic drag coefficients for a sphere. AIAA J. 2021, 59, 3261–3274. [Google Scholar] [CrossRef]
- Dewar, M.P.; McDonald, A.G.; Gerlich, A.P. Interfacial heating during low-pressure cold-gas dynamic spraying of aluminum coatings. J. Mater. Sci. 2012, 47, 184–198. [Google Scholar] [CrossRef]
- Schmidt, T.; Gärtner, F.; Assadi, H.; Kreye, H. Development of a generalized parameter window for cold spray deposition. Acta Mater. 2006, 54, 729–742. [Google Scholar] [CrossRef]
- Martienssen, W. The Elements. In Springer Handbook of Condensed Matter and Materials Data; Martienssen, W., Warlimont, H., Eds.; Springer: Berlin/Heidelberg, Germany, 2005. [Google Scholar] [CrossRef]


Disclaimer/Publisher’s Note: The statements, opinions and data contained in all publications are solely those of the individual author(s) and contributor(s) and not of MDPI and/or the editor(s). MDPI and/or the editor(s) disclaim responsibility for any injury to people or property resulting from any ideas, methods, instructions or products referred to in the content. |
© 2023 by the authors. Licensee MDPI, Basel, Switzerland. This article is an open access article distributed under the terms and conditions of the Creative Commons Attribution (CC BY) license (https://creativecommons.org/licenses/by/4.0/).