Article

Simulation of Turbulent Flow Structure and Particle Deposition in a Three-Dimensional Heat Transfer Duct with Convex Dimples

1
School of Electrical Engineering, Xinjiang University, Urumqi 830047, China
2
Center of New Energy Research, School of Future Technology, Xinjiang University, Urumqi 830047, China
3
Engineering Research Center of Northwest Energy Carbon Neutrality, Ministry of Education, Urumqi 830047, China
4
State Grid Xinjiang Electric Power Corporation, Urumqi 838099, China
5
Urumqi Electric Power Construction Debugging Institute, Xinjiang Xinneng Group Co., Ltd., Urumqi 830092, China
6
Electric Power Research Institute of State Grid Xinjiang Electric Power Co., Ltd., Urumqi 830011, China
*
Author to whom correspondence should be addressed.
Coatings 2023, 13(5), 900; https://doi.org/10.3390/coatings13050900
Submission received: 20 March 2023 / Revised: 6 April 2023 / Accepted: 11 April 2023 / Published: 10 May 2023

Abstract

:
In engineering applications, dust deposition on the heat transfer channel greatly reduces the efficiency of heat transfer. Therefore, it is very significant to study the characteristics of particle deposition for thermal energy engineering applications. In this study, the Reynolds stress model (RSM) and the discrete phrase model (DPM) were used to simulate particle deposition in a 3D convex-dimpled rough channel. A discrete random walk model (DRW) was used for the turbulent diffusion of particles, and user-defined functions were developed for collisions between particles and walls. An improved deposition model of rebound between particles was developed. The flow structure, secondary flow, temperature distribution, Q criterion, and particle deposition distribution in the convex-dimpled rough channel were analyzed after a study of the grid independence and a numerical validation. The results showed that these mechanisms affected the flow structure in the flow field. For tiny particles (dp ≤ 10 μm), the presence of convex dimples promoted their deposition. The rates of particle deposition in the presence of convex dimples were 535, 768, 269, and 2 times higher than in smooth channels (particle sizes of 1, 3, 5, and 10 μm, respectively). However, for large particles (dp > 10 μm), although the presence of convex dimples had a certain effect on the location distribution of particle deposition, it had little effect on the deposition rates of large particles, which were 0.99, 0.98, 0.97 and 0.96 times those in the smooth channel, respectively.

1. Introduction

Heat exchangers are often employed in thermal engineering and energy utilization applications. Heat transfer is a common phenomenon between the airflow and the heat exchanger surface that occurs in numerous machines’ operations, including heating and cooling systems and flue gas waste heat recovery systems [1,2]. After long-term use, ashes or duct particles transported by turbulent flow ultimately settles on the surface of the heat exchanger [3]. Consequently, the efficiency of heat transfer drastically diminishes, and the pressure drop across the heat exchanger increases [4,5]. Therefore, it is crucial to understand how particles adhere to the surface of the heat exchanger.
The structure of a heat exchanger affects its heat transfer performance. Studies have shown that heat exchanger optimization can be achieved by optimizing and improving the heat exchanger structure [6,7]. Mario et al. [8] obtained locally optimized fin patterns by considering the topology optimization of plate-fin heat exchangers. The number of transfer unit procedures is recommended to be altered to assess the performance of the heat exchanger and address the unique topology gained via optimization. The findings indicated that an optimized design was superior outside of optimization flow parameters [9]. Ryms et al. [10] investigated the effect of vertical plate spacing on the intensity of free convection heat transfer and experimentally corroborated the accuracy of the simulations. The optimum width of a single channel in the heat exchanger was derived. Shi et al. [11] developed a novel model to improve the heat transfer in latent heat systems, that was a vertical three-tube heat exchanger with fractal fins. They analyzed the heat transfer performance with fractal fins and compared it with the performance of conventional rectangular fins. The findings indicated that the vertical three-temperature exchanger with spiral fins may achieve increased heat transfer rates by expanding the number of heat flow channels and heat transfer zones in the flow field of the heat transfer. Akbarnataj et al. [12] studied a heat exchanger with porous longitudinal fins and counterflow double tubes by numerical simulation methods and analyzed the heat transfer problems in it. A k-ω model was used to predict the turbulent structure. It was found that its heat transfer was significantly improved when the porosity was reduced. For instance, the design of a heat exchanger with 40 porous fins and a constant ratio of porous volume to total volume yielded the highest heat transfer efficiency. The heat transfer effect of a unidirectional flow in a circular tube with different angles of the spoiler fins was studied by Firat et al. [13]. Their heat transfer effects were analyzed by comparing the installation angles of different fins. The results showed that the fins installed at an angle of 20° had the best heat transfer effect. Han et al. [14] studied the heat transfer efficiency of saw-shaped microchannels to boost convective heat transfer by enhancing spatial fluid blending and significantly disrupting the boundary condition. Beginning with a comparison of the forward and reverse pressure drop and Nusselt number (Nu), the performance of the diode was investigated. A parametric study examined how the channel width and bifurcation angle affected fluid flow and condensation. The convective heat transfer in both directions was greatly enhanced in the case of an increased spatial fluid mixing in this sawtooth microchannel. Wang et al. [15] used a numerical analysis to analyze the effect of flow direction grooves on the flow structure and overall thermal performance. The results of the study showed that the flow direction grooves disrupted the turbulent self-sustainability, resulting in drag reduction rates ranging from 11.7% to 16.78%.
Research methods are very important in the study of numerical simulation, and different research methods often have a certain impact on the results of the study. Xu et al. [16] compared the effectiveness of Lagrangian and Eulerian approaches in predicting particle deposition under similar operating conditions in turbulent flows. The results indicated that the computation time for the Euler approach was less than that for the Lagrangian method. The experimental curve was better matched with the projected total fouling mass based on the Euler method. Li et al. [17] simulated the particle deposition in a ribbed U-shaped curved channel by using the Euler–Lagrange method. The Reynolds averaged Navier–Stokes method was used for the calculation of the gas phase. It was finally concluded that the front row of ribs could protect the back row of ribs. The factors affecting the deposition of particles on the wall were the Reynolds number and particle diameter. Chang et al. [18] developed a program with an Euler–Lagrange model in Ansys Fluent using a two-body collision model to observe how the flow and temperature fields of a TiO2–water nanofluid in a horizontal circular canal were affected during nanoparticle deposition. Han et al. [19] used a numerical model to study the deposition of particles on the heating surface inside a three-dimensional rectangular heat transfer duct as the gas with particles flowed through the duct. The results showed that there were two reasons affecting the effect of the particle deposition at different places along the channel, including the bottom, sides, and top, which were different particle diameters and flow rates. Awais et al. [20] described in great depth how multiple system operating parameters could be used to regulate fouling and particle deposition. The results showed that faster flow rates generated large shear forces that acted on the heat transfer surface to remove deposits and reduce fouling resistance but had the disadvantage of generating larger pressure drops. A novel model was developed by Zhan et al. [21]. That model could simulate the deposition of dust particles on the wet fin surface during the actual operation. Based on the validation results, the predicted mass of deposited particles matched 91% of the experimental data within a 20% range with an average variation of 11.8%. Sajjadi et al. [22] studied the turbulent structure of many flow fields using the lattice Boltzmann method (LBM) in combination with the Reynolds averaging method (RANS) for comparison and also studied the transport and deposition of particles in different channels. The results showed that the new LBM-RANS model could provide more realistic predictions of turbulence as well as particle motion using a lesser computational cost. Kim et al. [23] proposed the flow acceleration using corona wind as a solution to simultaneously solve the pressure drop problem and improve the heat transfer performance in heat exchangers. It was found that corona wind could be used to cross-cut the fin arrays to greatly improve their heat transfer performance [24].
Some other scholars have conducted more detailed studies on certain factors affecting particles. Lu et al. [25] simulated particle deposition in a 3D heat-exchange duct with surface ribs using a particle deposition model with a user-defined function (UDF). The findings indicated that particle deposition was affected by the turbulence pattern created by the ribs, secondary flow, interception on the windward side of the ribs, particle rebound, and gravity settling. Yan et al. [26] performed numerical simulations of the flow of circulating cooling water in straight and U-shaped heat exchange tubes. The results showed that whether the surface of the heat exchange tube was magnetic or not had a significant effect on its fouling resistance. Lu et al. [27] investigated particle deposition at different flow states. The results showed that for particles with small particle sizes ( d p < 20   μ m ), the thermal network deposition led to a sharp increase in the particle deposition rate, but for particles with larger particle sizes ( d p > 20   μ m ), it remained constant. The literature [28,29,30,31] reports on the effect of parameters such as dimple depth, dimple diameter, dimple spacing, and dimple arrangement on the heat transfer and pressure loss characteristics within the dimple roughened channel. Dimple structures are also commonly used in various engineering applications for enhanced heat transfer, such as heat exchangers [32,33] and cooling devices for electronic components [34]. Kim et al. [35] improved cooling ducts with staggered oval dimples. Their optimization of the flow structure improved the overall heat transfer efficiency by at least 33%.
Four different parameters (vortex width ratio p/h and vortex height ratio h/D) were used for the convex-dimple channel used in this study. The heat transfer performance in the channel and the deposition characteristics of the particles were investigated and discussed.
  • The presence or absence of convex dimples in the channel affected the flow field structure and particle deposition.
  • The effect of different inlet airflow velocities on flow and particle deposition in the channel.
  • The effect of different particle sizes on the deposition of particles in the channel.
  • The effect of convex dimples with different parameters (vortex width ratio p/h and vortex height ratio h/D) on the flow field in the channel as well as on the particle deposition.
Figure 1 shows the computational fluid dynamics (CFD) simulation process of this study.

2. Materials and Methods

2.1. Turbulent Airflow Model

The Reynolds stress model (RSM), which considers turbulence anisotropy, was used to forecast the three-dimensional turbulent flow [36,37]. In this simulation, the RSM equation was used to fit the RANS. The governing equations for flow continuity, momentum, and energy are as follows:
ρ u i ¯ x i = 0
u i ¯ t + u j ¯ u i ¯ x j = 1 ρ p ¯ x j + 1 ρ x j μ u i ¯ x j ρ u i u j ¯
T t + x i u i ¯ T = x i λ ρ c p T x i
where u i ¯ represents the mean speed, p ¯ represents the mean pressure, and μ represents the dynamic viscosity.
Near the wall surface, complicated turbulent formations emerge due to the presence of rough features. The RSM model was used to correctly simulate turbulent flow in a rough channel by simulating the gas phase. Compared to the k-ε and k-ω models, the RSM model accounts for the anisotropy of turbulent vortex viscosity more thoroughly and increases calculation accuracy significantly.
The turbulent Reynolds stress model (RSM) equation is as follows:
t u i u j ¯ + u k ¯ x k u i u j ¯ = x k v t σ k u i u j ¯ x k D T , i j = T u r b u l e n t   D i f f u s i o n u i u k ¯ u i ¯ x k + u j u k ¯ u i ¯ x k P i j = S t r e s s   P r o d u c t i o n C 1 ε k u i u j ¯ 2 3 δ i j k C 2 P i j 2 3 δ i j P ϕ i j = P r e s s u r e   S t r a i n 2 3 δ i j ε ε i j = D i s s i p a t i o n
where σk, C1, and C2 are empirical constants with corresponding values of 1.0, 1.8, and 0.6.
Here, is the equation for calculating the turbulent dissipation rate:
ε t + u j ¯ ε x j = x j v + v t σ ε ε x j C ε 1 ε k u i u j ¯ u i ¯ x j C ε 2 ε 2 k
To make the fluid flow velocity in the channel more realistic, a user-defined function was applied at the inlet of the channel to set the inlet velocity boundary condition. Prandtl’s one-seventh power law was used to describe the fully developed channel custom profile.
U = U f r e e y D / 2 1 / 7   f o r   y D / 2
U = U f r e e h y D / 2 1 / 7   f o r   y > D / 2
U f r e e = 8 7 U m e a n

2.2. Discrete Phase Model

There are three main states of particles in the flow field: “trap” or “reflect” after contact with rough walls, and “escape” at the exit of the flow field [38]. When particles flow in a flow field, they are primarily influenced by contact force (collision force and contact adhesion force), noncontact force (noncontact adhesion force), fluid force on particles (buoyancy force in vortex area, Brownian force, Saffman’s lift force, and thermophoresis force), and the gravity of the particles themselves. Due to the fact that the ratio of the air density to the particle density is very tiny (0.0008 in this study), the pressure gradient force and the spurious mass force are negligible in comparison to the external force on the particle, hence their influence on the particle was disregarded [39].
The particle motion equation was solved using the Lagrange orbit tracking method to determine its motion trajectory. The following is a description of the equation for particle motion that is based on Newton’s law:
m p d u p d t = F D + F G + F B + F S + F T
where particle mass and velocity are denoted by mp and up, respectively. On the right-hand side of the particle’s equation are the forces of drag, gravity, and buoyancy, the Brownian force, the Saffman lift force, and the thermophoresis force.

2.2.1. Drag Force FD

The relative velocity of the fluid and the solid object produces a force known as drag. This force works against the speed at which a solid is moving with a fluid. Therefore, the principal force imposed by the fluid on the motion of particles is the drag force [40]. Its formula is:
F D = 1 τ p C D Re p 24 u g u p
The relaxation time of the particle τ p is calculated as:
τ p = S d p 2 u * 2 18 v 2
where S is the particle-to-air density ratio, DP is the particle size, and v is the kinematic viscosity.
The dimensionless relaxation time of the particle τ p + is:
τ p + = C C S d p 2 u * 2 18 v 2
Cunningham’s slip correction coefficient CC is [30]:
C C = 1 + 2 λ d p 1.257 + 0.4 e 1.1 d p / 2 λ

2.2.2. Gravity and Buoyancy FG

When traveling through the flow field, particles are impacted by gravity, which causes them to sink until they are deposited on the wall. Due to the tiny size and mass of particles, buoyancy also plays a significant role in particle motion. The calculation formula is as follows:
F G = g ρ p ρ g ρ p

2.2.3. Brownian FB

Brownian force [41,42] is formed by the random diffusion of nanoparticles, where the Gaussian random function is incorporated into the calculation expression of the Brownian force FB, and the formula for its computation is as follows:
F B = ζ π S 0 Δ t
where S0 is a random function of white Gaussian noise [38].

2.2.4. Saffman Lift FS

Particles in the flow field movement, when the particle and its surrounding fluid have a velocity gradient in the direction of motion perpendicular to the particle on both sides of the fluid velocity difference, create from the low-speed to the high-speed direction of lift a force called the Saffman lift force [43]. The impact is most pronounced in the velocity boundary layer and the calculation formula is:
F S = 2 ρ K c v 0.5 ρ p d p S l k S k l S i j u u p

2.2.5. Thermophoresis Force FT

When there is a temperature gradient in a gas, the thermophoresis force causes suspended tiny particles to migrate from the high-temperature area to the low-temperature area [44]. The calculation formula is as follows:
F T = D T , p 1 m p T d T d x
where DT,p is the thermophoresis coefficient.

2.3. Turbulent Dispersion of Particles

Particles must be dispersed turbulently to correctly simulate deposition properties [36]. In the RANS model, the discrete random walk model (DRW) accounts for the interaction between discrete vortices of particles and fluids, allowing it to better forecast the turbulent diffusion of particles. In this research, the Reynolds stress model (RSM) was used, whose pulsation velocity accounts for the anisotropic properties of the Reynolds stress:
u = ζ u r m s
v = ζ v r m s
w = ζ w r m s
In the turbulent vortex cluster, the fluid pulsation velocities u′, v′, and w′ satisfy the Gaussian probability density distribution function, and ζ is a normally distributed random number. To conform to the normal distribution of random numbers, the RSM model can forecast the deposition state of particles more precisely than other isotropic turbulence models. The RSM model was thus employed in this research. The discrete random walk model (DRW) is believed to improve the accuracy of simulations.
It was discovered that a straight application of the DRW and RSM models would result in an overestimation of the particle deposition rate [36,45]. The DNS data of Kim et al. [46] may properly forecast particle deposition velocity by correcting wall-normal turbulence fluctuation in the near-wall area. The calculation formula is:
v r m s u * = C y + 2 , y + < 4
where u* represents the friction velocity, which can be calculated using the formula below:
u * = τ w ρ g
with a constant C = 0.008, and the dimensionless distance y+ from the wall defined as follows:
y + = y u * v
After contact with the channel wall, the particles are in two states, adhering or rebounding. It is important to determine the final state of the particles. Brach and Dunn [47] developed a critical deposition velocity model based on the Johnson–Kendall–Roberts (JKR) model [48] as a way to determine whether the particles were depositing or rebounding. When the normal velocity of a particle was greater than the critical deposition velocity, the particle bounced back; otherwise, it was deposited on the wall [49]. Such UDF code was also used in this study for the simulation study of particle deposition in a convex-dimple channel. The critical deposition velocity was calculated as follows:
u c r = [ 2 K / d p R 2 ] 10 / 7
In the above equation, ucr is the critical deposition velocity. K and R are the effective stiffness parameter and the motion recovery coefficient, respectively. where K can be calculated according to the following equation:
K = 0.51 [ 5 π 2 ( k s + k p ) 4 ρ p 1.5 ] 0.4
The ks and kp in the above equation can be calculated as:
k s = ( 1 v s 2 ) / π E s
k p = ( 1 v p 2 ) / π E p
where vs and vp are Poisson’s ratios and vs = 0.28 and vp = 0.13 [2]. Es and Ep are Young’s moduli and Es = 215 Gpa and Ep = 192 Gpa [2]. In addition, R was calculated by the empirical formula in the following equation:
R = 45.3 / ( 45.3 + u i n 0.718 )
The particles’ deposition velocity V d may be calculated using the following formula:
V d = J C 0 = N d / t d / A N 0 / V = N d / t max N 0 / h
where J is the number of deposited particles, C 0 is the average particle concentration, and the dimensionless deposition velocity of m particles [50] is:
V d + = V d u *
The technique for calculating the particle deposition rate is as follows:
η = N d N 0
where Nd and N0 represent the number of particles deposited and the number of particles released from the channel entrance.

3. Case Description and Solution Method

3.1. Case Description

The schematic diagram of particle deposition in a convex-dimple channel is shown in Figure 2. The width D of the channel was 20 mm, and the length L of the channel was 400 mm. The lower surface of the channel was arranged with periodic convex dimples. The number of convex dimples on the lower surface of the channel was 6, 8, 12, and 13. The inlet zone (Lf = 200 mm) extended at the front of the channel to ensure a uniform flow near the dimples, while the outlet zone (Lr = 80 mm), as illustrated in Figure 2, was located at the rear of the channel and extended at the rear of the channel to avoid air backflow. According to Table 1, a total of 48 instances were simulated in the research. The simulation analyzed eight particle sizes.

3.2. Boundary Conditions

The inlet wind speed was set to 4 m/s or 6 m/s, the outlet under pressure condition was adopted, the wall surface and convex dimples surface of the channel were both set to the no-slip condition, the temperature of the wall surface and dimple surface of the channel was set to constant temperature conditions with a temperature of 300 K, and the temperature of the hot air at the inlet was 373 K.
For the particle phase, after convergence of the flow field calculation in the channel, a total of 50,000 particles were released into the flow field in a conical way. The mass flow rate of the particles was 1 × 10⁻¹⁰ kg/s, the flow velocity was 4 m/s or 6 m/s, the particle sizes were 1, 3, 5, 10, 20, 30, 40, and 50 μm, and the Reynolds number based on the average flow rate and channel height was 8298 or 5500.
After the release of particles, all particles were tracked until they were trapped in the channel. To focus on the effect of the presence of convex dimples on the deposition of particles in the channel, the upper and side surfaces of the channel were set to “reflect”. The boundary conditions of the walls of the convex dimple and the lower surface were set to “trap”, which meant that once the particle touched the above two walls, it was considered as “trapped”. The channel’s outlet was the “escape” boundary condition [51].

3.3. Solution Method

To solve the equations that describe turbulent flow, a finite volume method (FVM) was used. The convection term was discretized by a second-order upwind scheme and the diffusion terms were discretized by a second-order central difference scheme. The coupled algorithm was used for processing pressure and velocity coupling. The coupled approach differed from the simple algorithm, which concurrently solves whole Navier–Stokes equations. It was decided to use ANSYS FLUENT because it is a stable and reliable solver for turbulent flow [52,53]. For the space discretization, the flux difference splitting technique was utilized, while the multistep Runge–Kutta scheme was used for the time discretization [54].

3.4. Structured Grid and Grid Independence Analysis

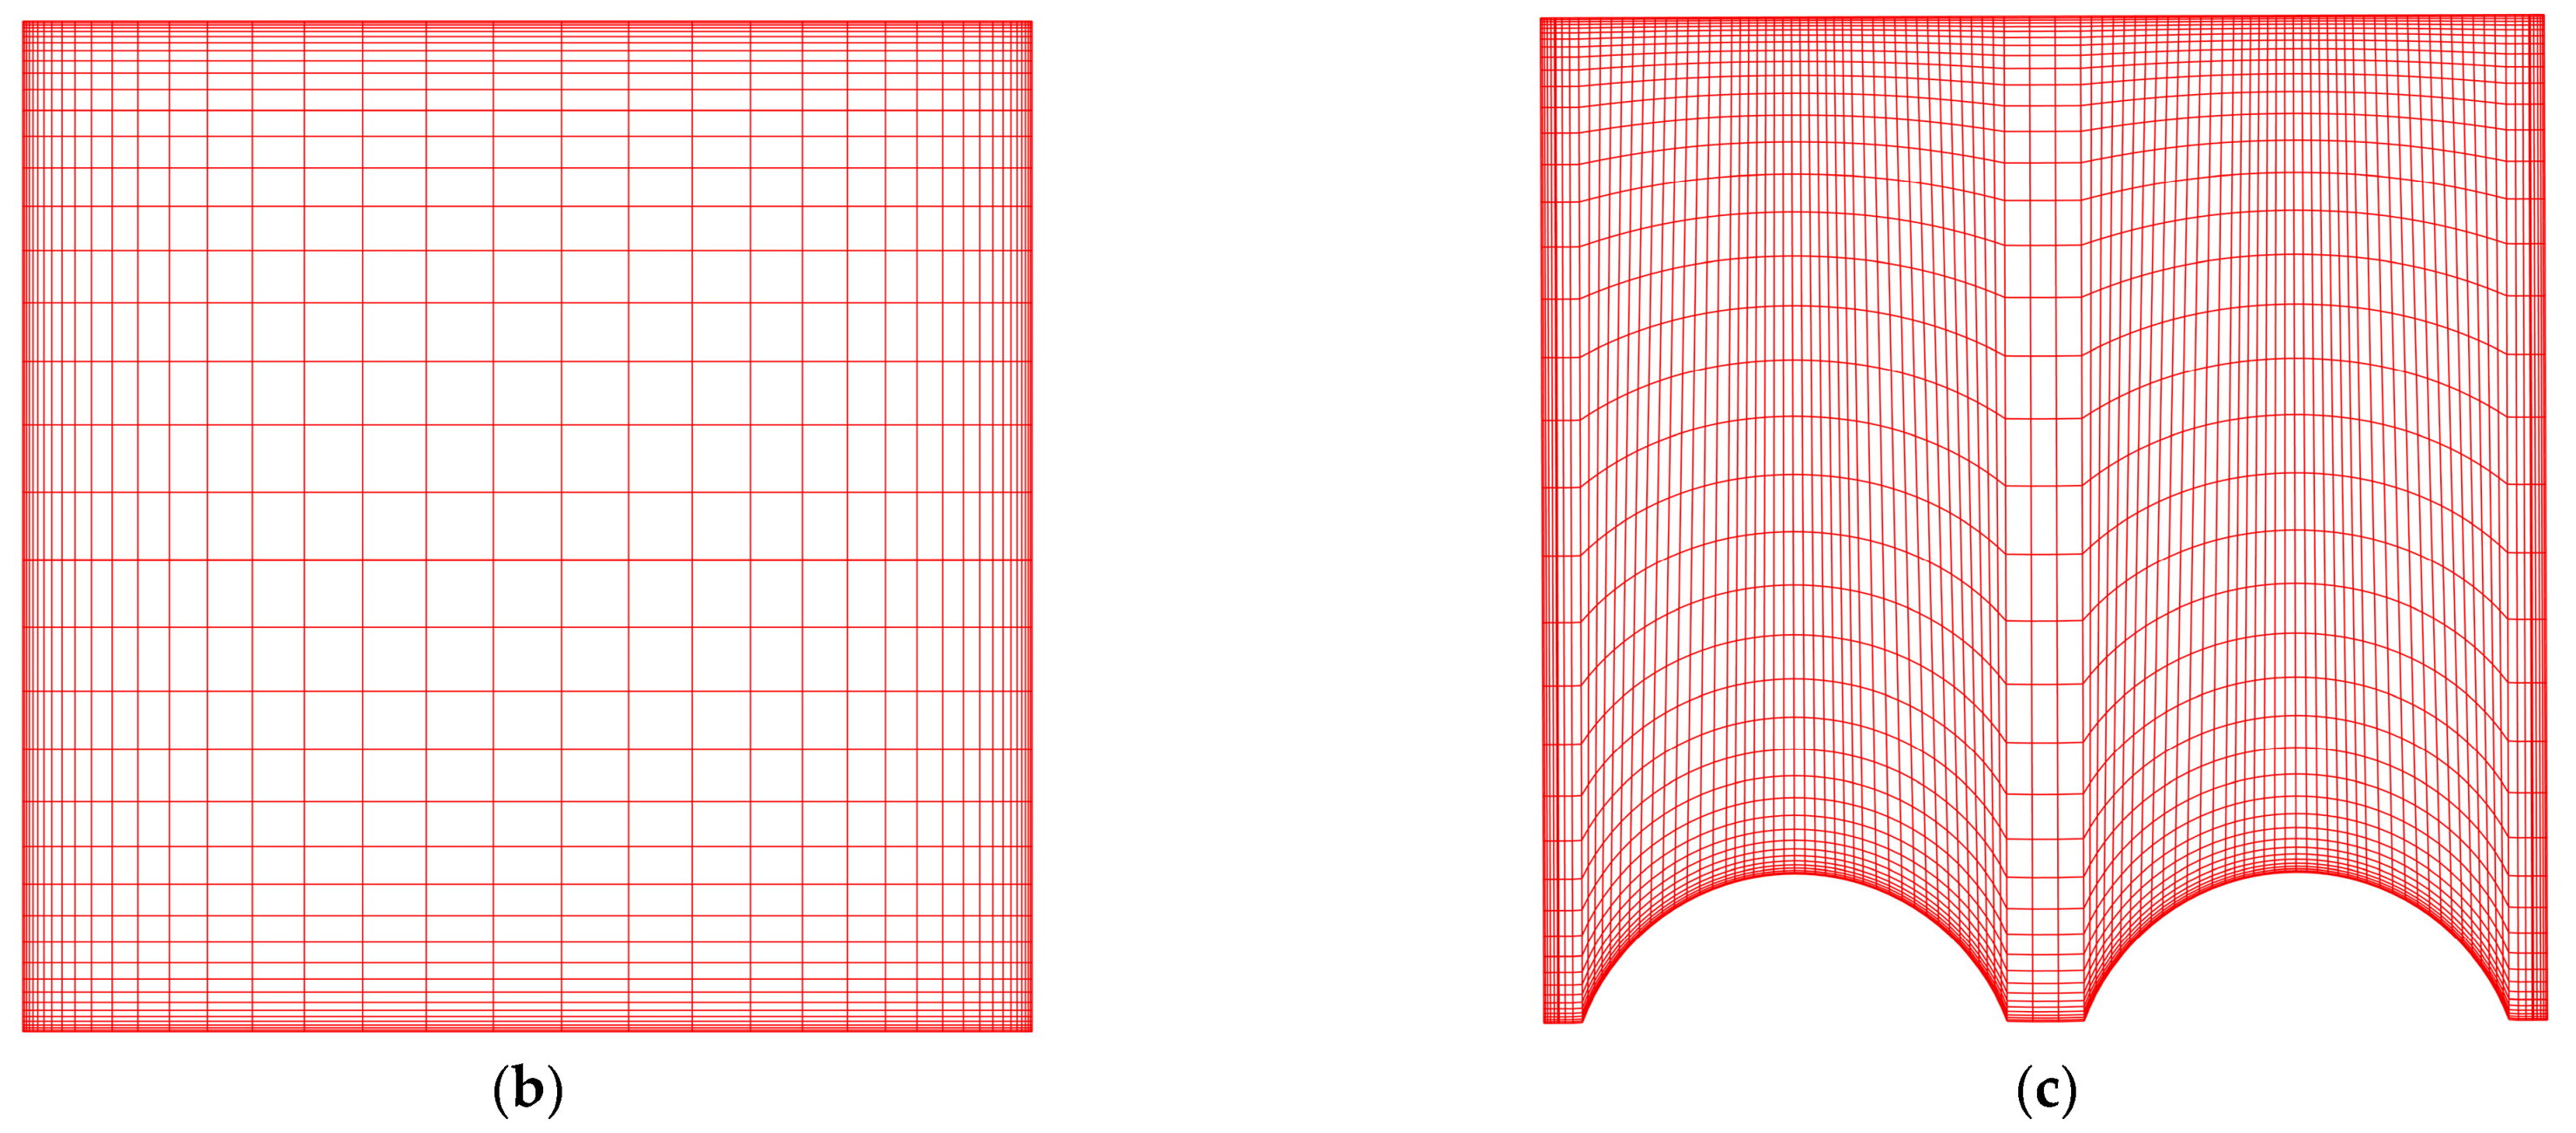
According to studies on structured mesh and grid independence, the structured hexahedral mesh has a better mesh quality and can make simulations more accurate and stable. Thus, this simulation used a structured grid, and as seen in Figure 3, the grid was refined and encrypted in the area close to the wall.
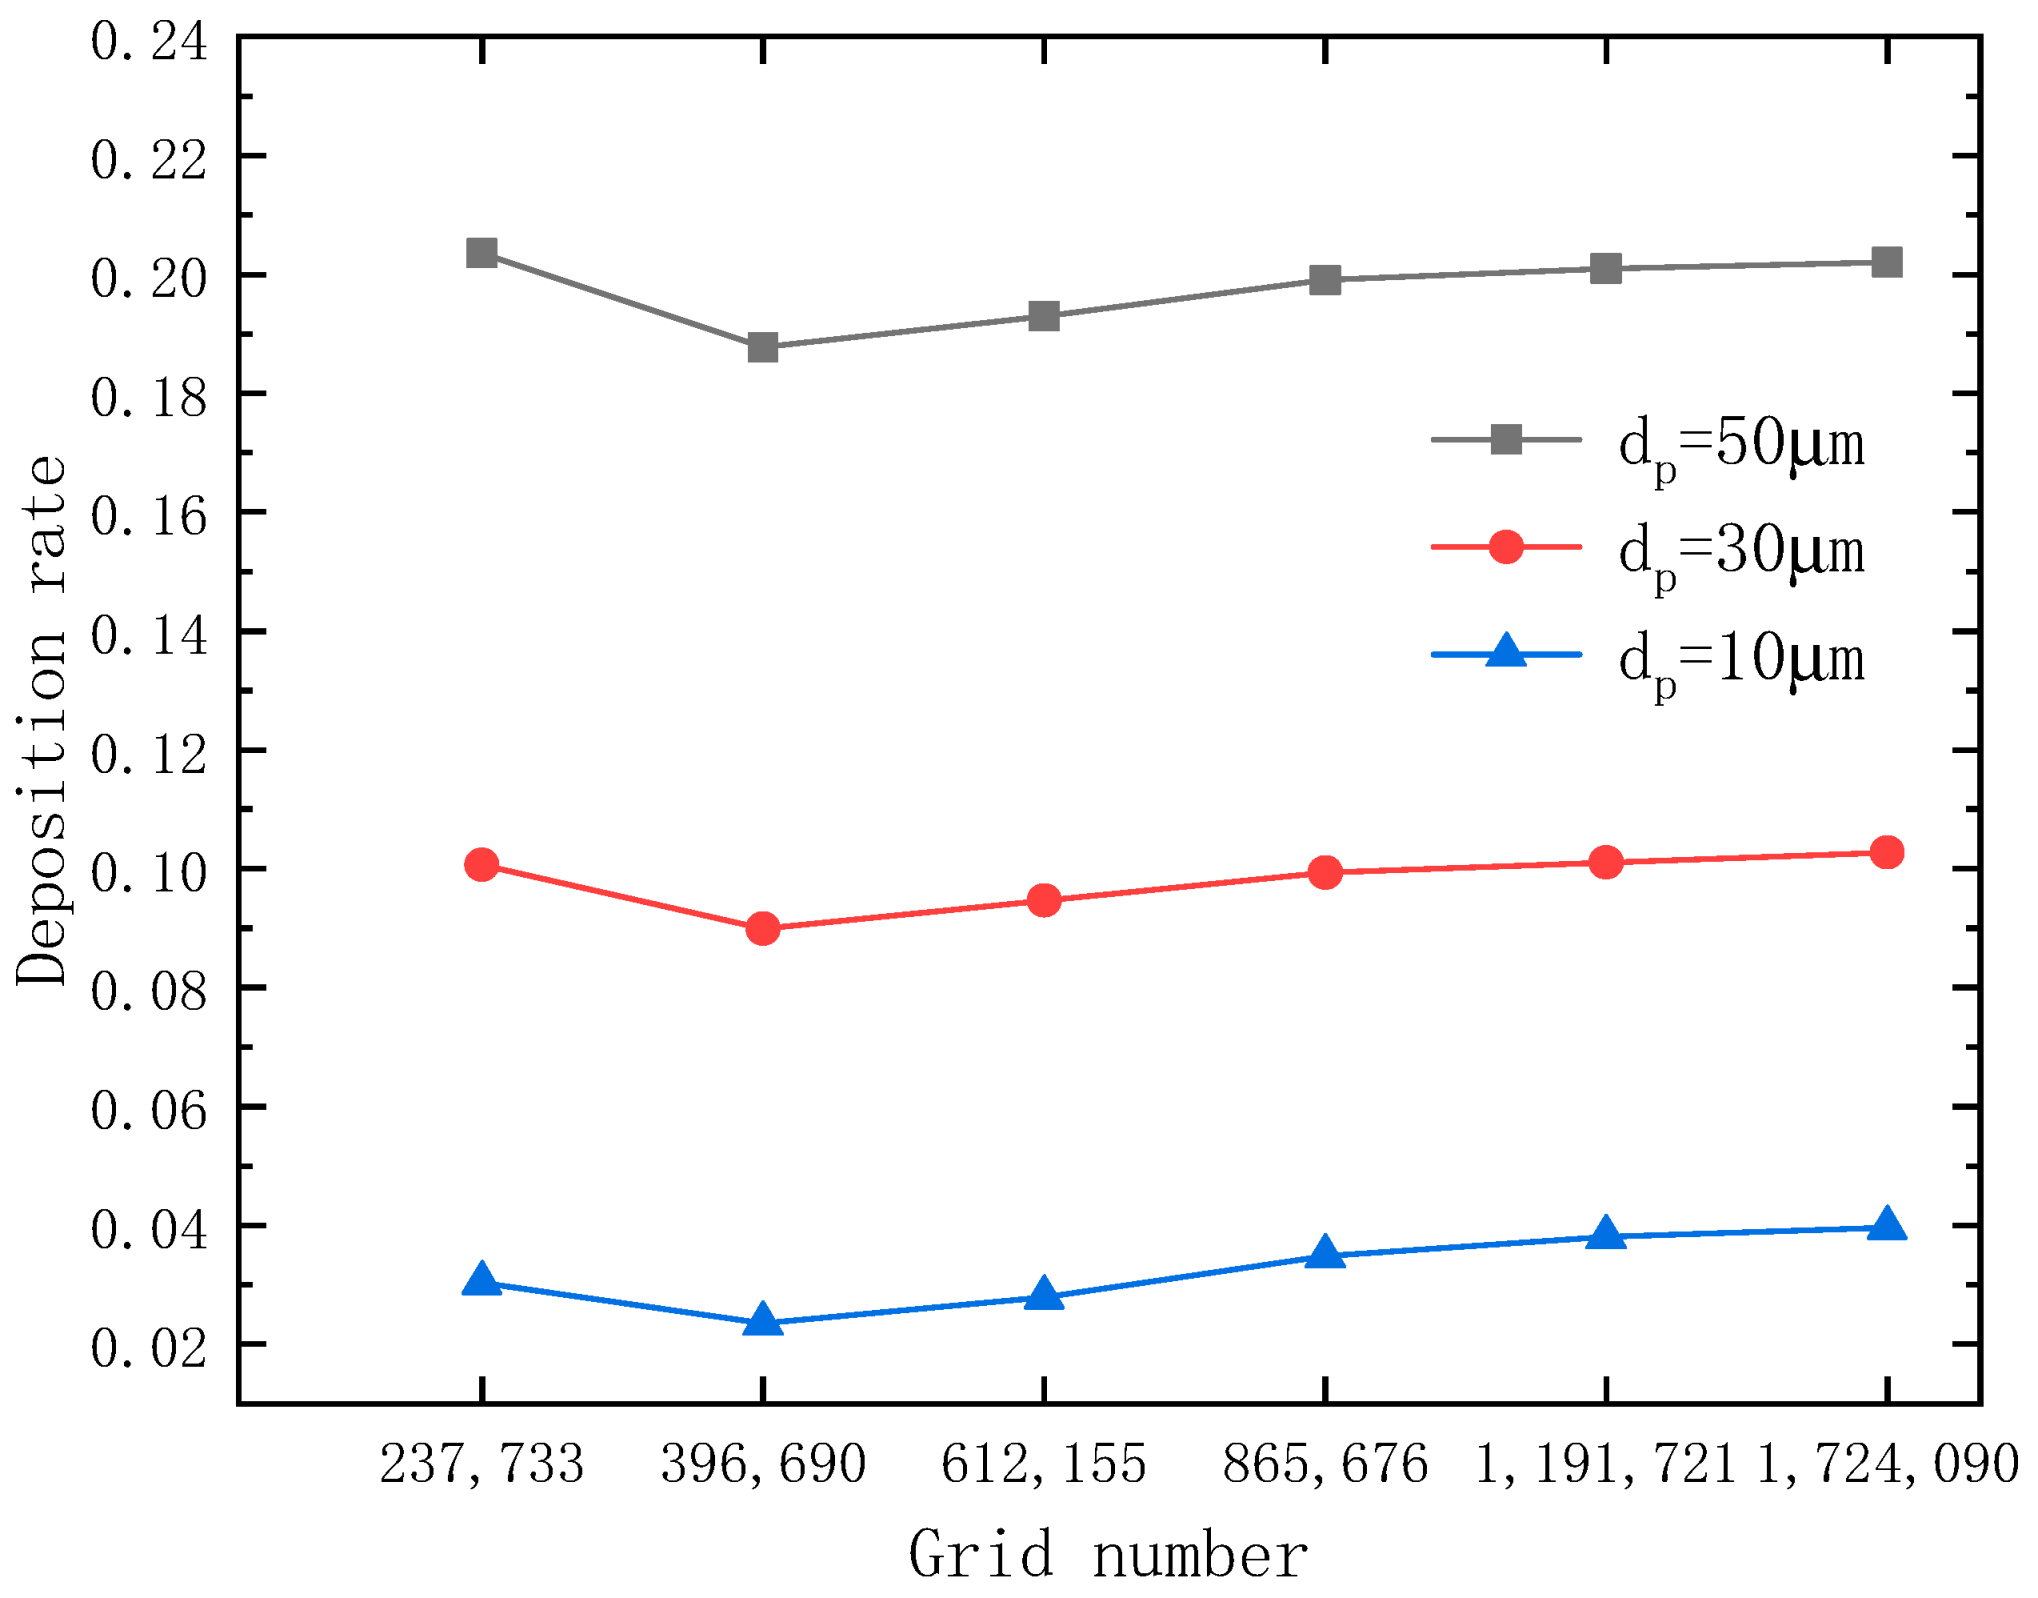
As illustrated in Figure 4, a grid independence study was undertaken to determine the impact of various grid numbers on the computation results of the same model. Six distinct grid numbers were utilized to verify grid independence. The number of grids was determined to be between 237,773 and 1,724,090, and the verification model had convex dimples with h/D = 0.1 and p/h = 5. According to the study of the deposition rate, when the number of grids exceeded 1,191,721 (grid 5), the deposition efficiency remained almost stable, as seen in Figure 4. The average absolute errors of grids 5 and 6 at various particle sizes were, respectively, 0.072% at 10 μm, 0.083% at 30 μm, and 0.055% at 50 μm. A mesh size of 1,191,721 was used for the simulation in which the model had convex dimples with h/D = 0.1 and p/h = 5. To address the complex turbulence in the boundary layer with more precision, the mesh was encrypted near the convex dimples and wall surface. According to the y+ wall distance assessment, the distance between the first grid and the convex dimples was 0.033 mm. The first grid was about one unit away from the wall and convex dimples. To create the expansion layer, the grid spacing from the wall and convex dimples to the center region was increased by a factor of 1.2.
In ICEM CFD, the minimum angle of hexahedral mesh was greater than 28, and practically all meshes’ qualities were greater than 0.58. Therefore, the structured mesh developed in this study was of excellent quality [55].

4. Results

4.1. Numerical Validation

4.1.1. Verification of Turbulent Air Flow

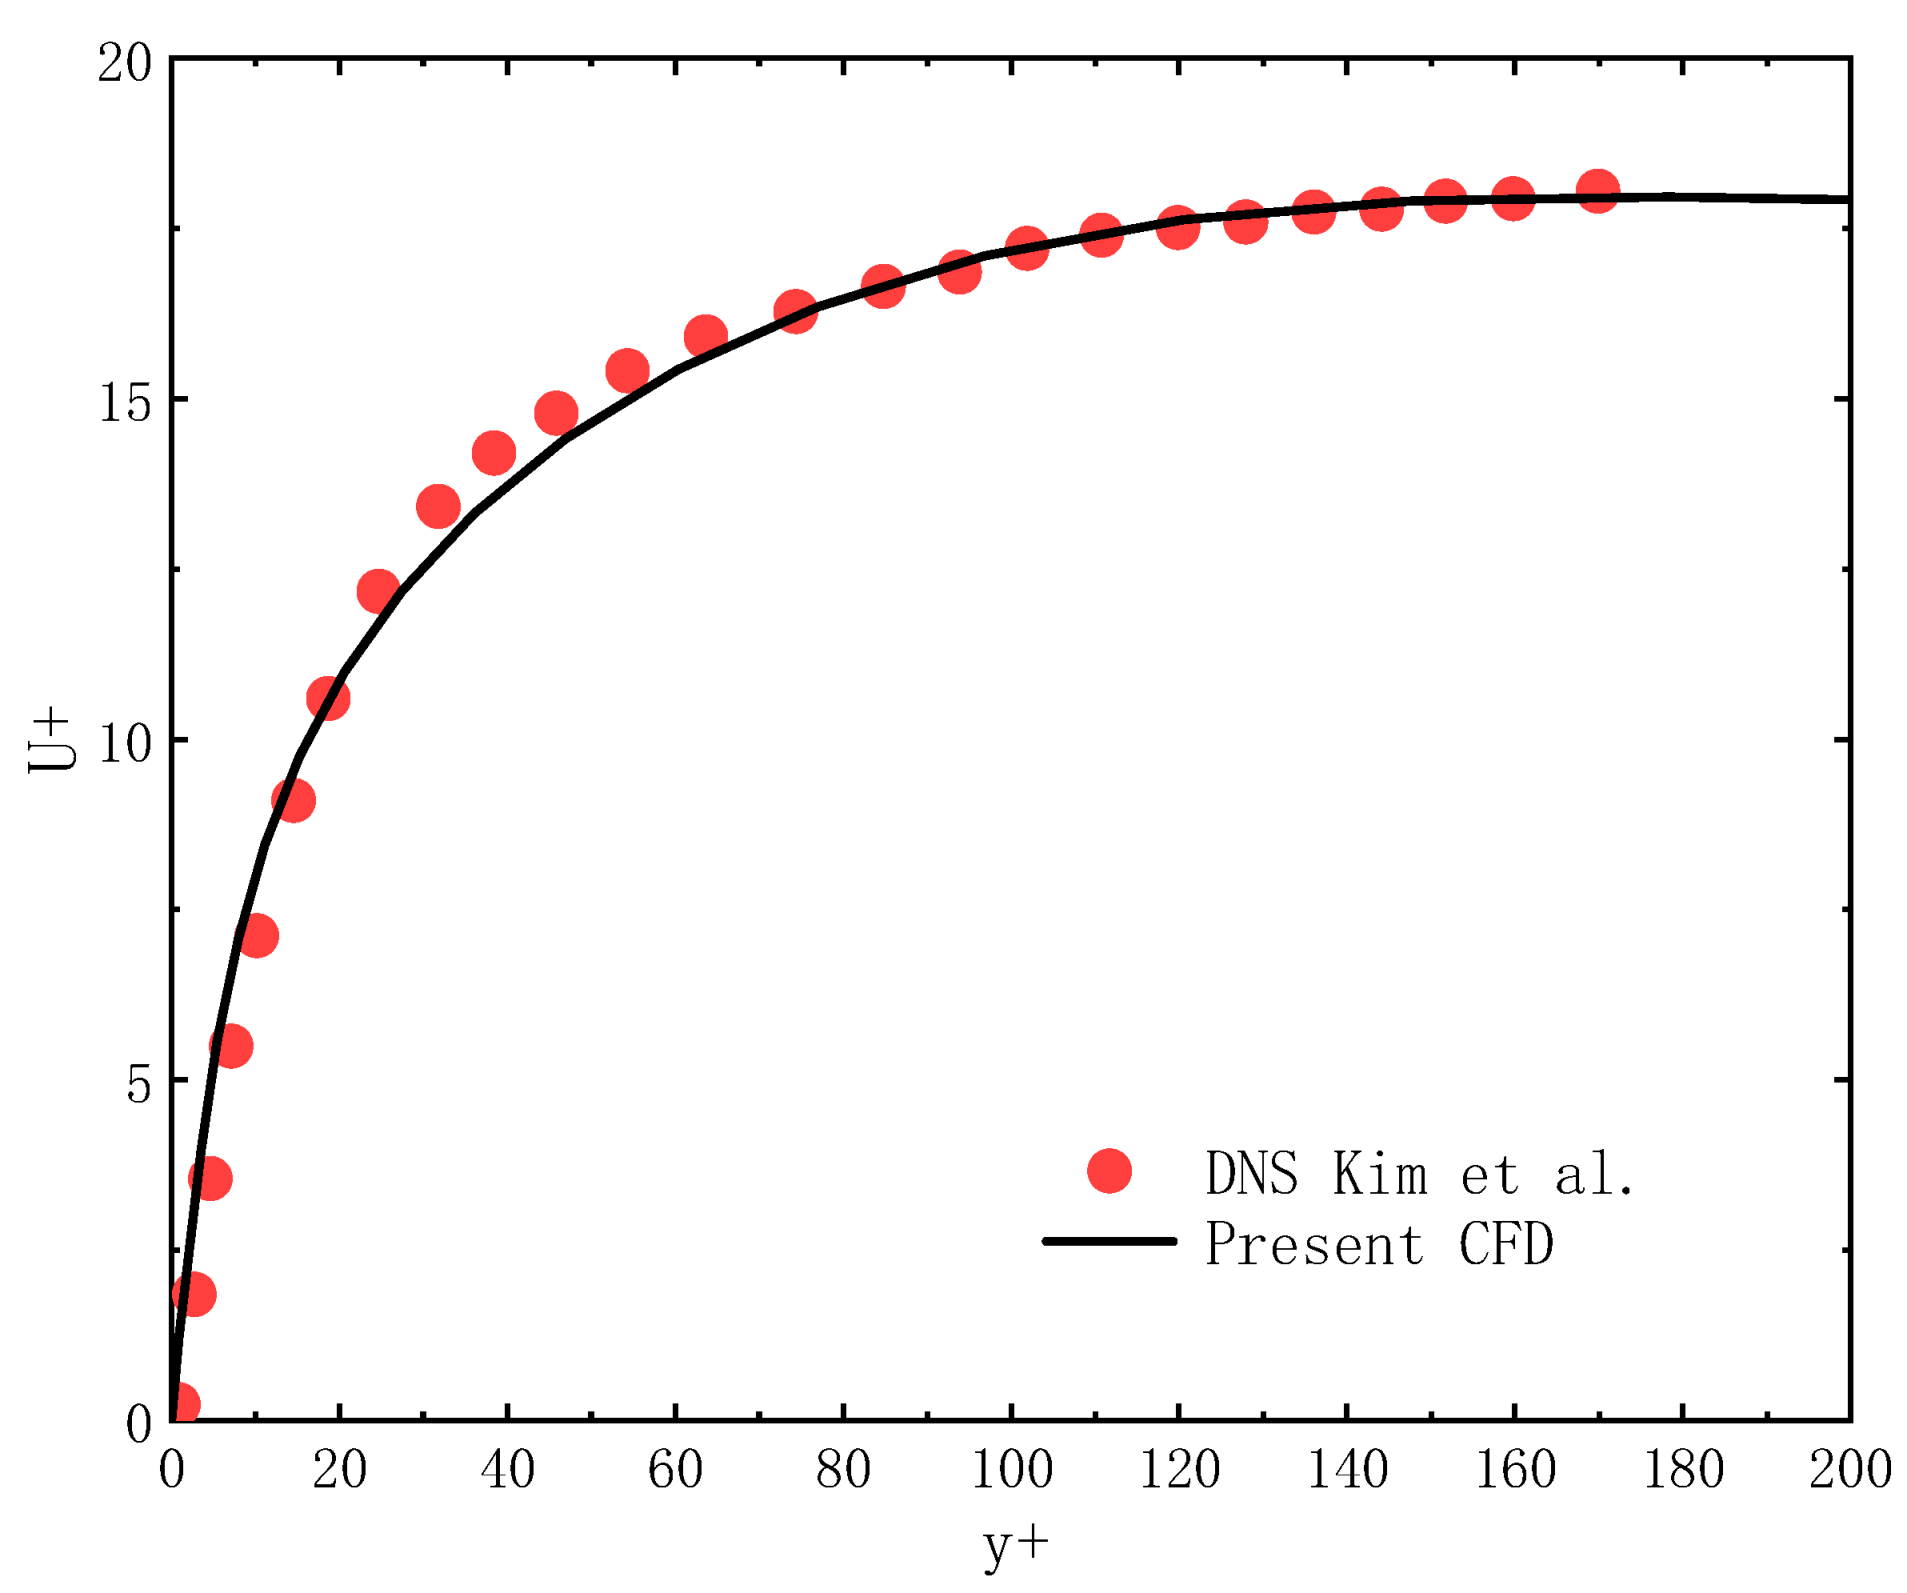
The turbulent flow velocity profile at X = 0.1 m in the smooth channel was chosen since the flow had completely evolved at that point [53]. As demonstrated in Figure 5, the calculation results of this paper’s RSM model were in excellent agreement with the direct numerical simulation (DNS) findings of Kim et al. [46]. The maximum deviation of the velocity field was calculated from the data to be about 0.66%. This also showed that the simulation model and method used in this work could be trusted.

4.1.2. Verification of Particle Deposition

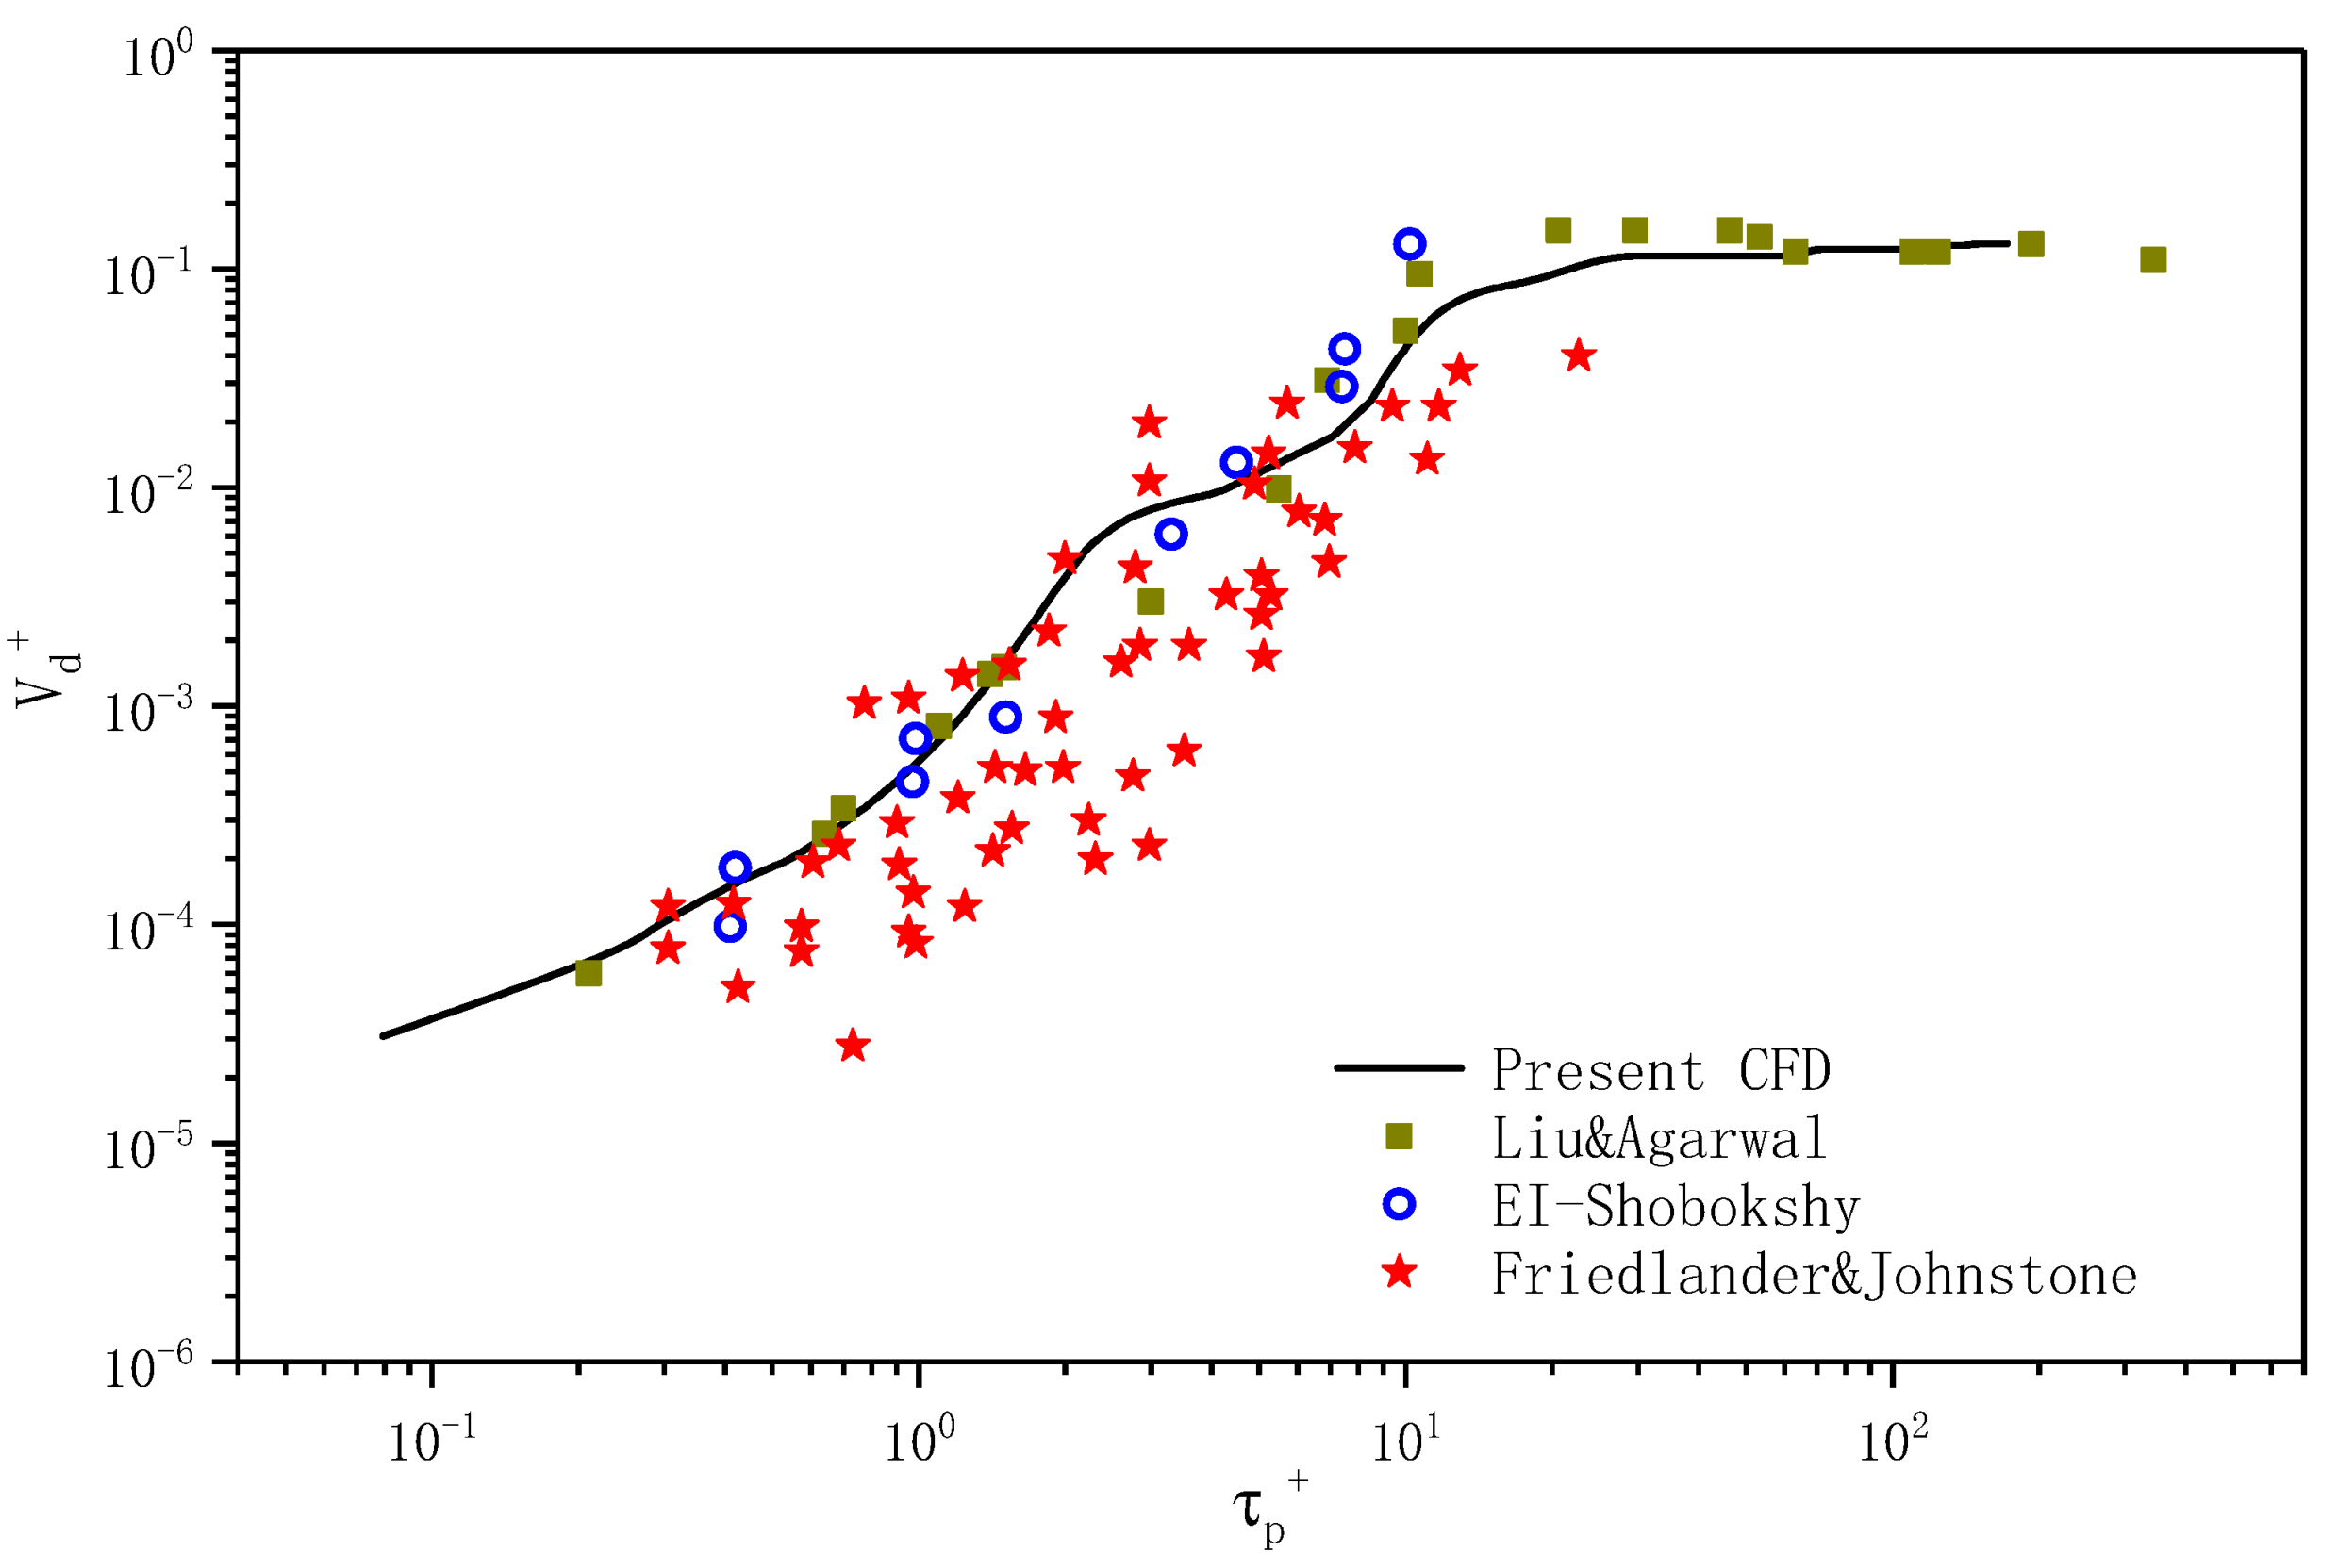
Figure 6 depicts the link between the dimensionless deposition velocity distribution of particles in the smooth channel and the dimensionless relaxation time, which was compared to experimental observations and numerical simulations from the past [50,56,57]. As the dimensionless relaxation period grew, the dimensionless deposition rate initially increased and then tended to stabilize. Figure 6 demonstrates that the dimensionless critical relaxation period of particles was around 20. When τ p + < 20, the features of deposition were mostly governed by the turbulent eddy motion of the fluid, but when τ p + > 20, the inertia of particles was predominant. The dimensionless deposition rate was consistent with prior experimental findings. The maximum deviation of the deposition rate in the channel was calculated from the data to be about 2.48%. Therefore, this numerical technique may be utilized to forecast the features of particle deposition.

4.2. Analysis of Turbulent Flow Field

4.2.1. The Vorticity Field

The Q-criterion is typically employed to make up for a shortcoming of the definite criterion and analyze causes of the development of rotating behaviors which are generally viewed as turbulent structures in detail. The Q-criterion [58] may also show places of rotation that might be interpreted as eddy-like flow behavior. Identifying the locations of vortices and measuring their intensity and form over a range of flow speeds is crucial for gaining insight into the flow’s unique properties. To research vortices, the Q-criterion [59] was used.
Hunt et al. referred to the area where the second matrix invariant Q > 0 as a vortex tube, where Q is defined as follows:
Q = 1 2 A F 2 S F 2
where S and A are the symmetrized and a symmetrized velocity-gradient tensor components, respectively, representing the flow-field deformation and rotation; they are correspondingly written as follows:
A = 0.5 Δ V Δ V T
S = 0.5 Δ V + Δ V T
and the velocity tensor ΔV is defined as follows:
Δ V = U x U y U z V x V y V z W x W y W z
Traditionally, the behaviors of a vortex that may be represented equivalently by rotational movements are considered turbulence structures, and the quantitative size of the rotation may be computed using the Q-criterion [58] and the above-mentioned Equations (32)–(35). Using the Q-criterion and a suitable threshold Q value, the vortex core areas were identified and described. Since the threshold value affected the results of the vortex scoping, the same value of Q was employed throughout all operating conditions to study the correlation between the two. In this study, we set Q = 1/1000 of the highest value we observed over the whole flow range.
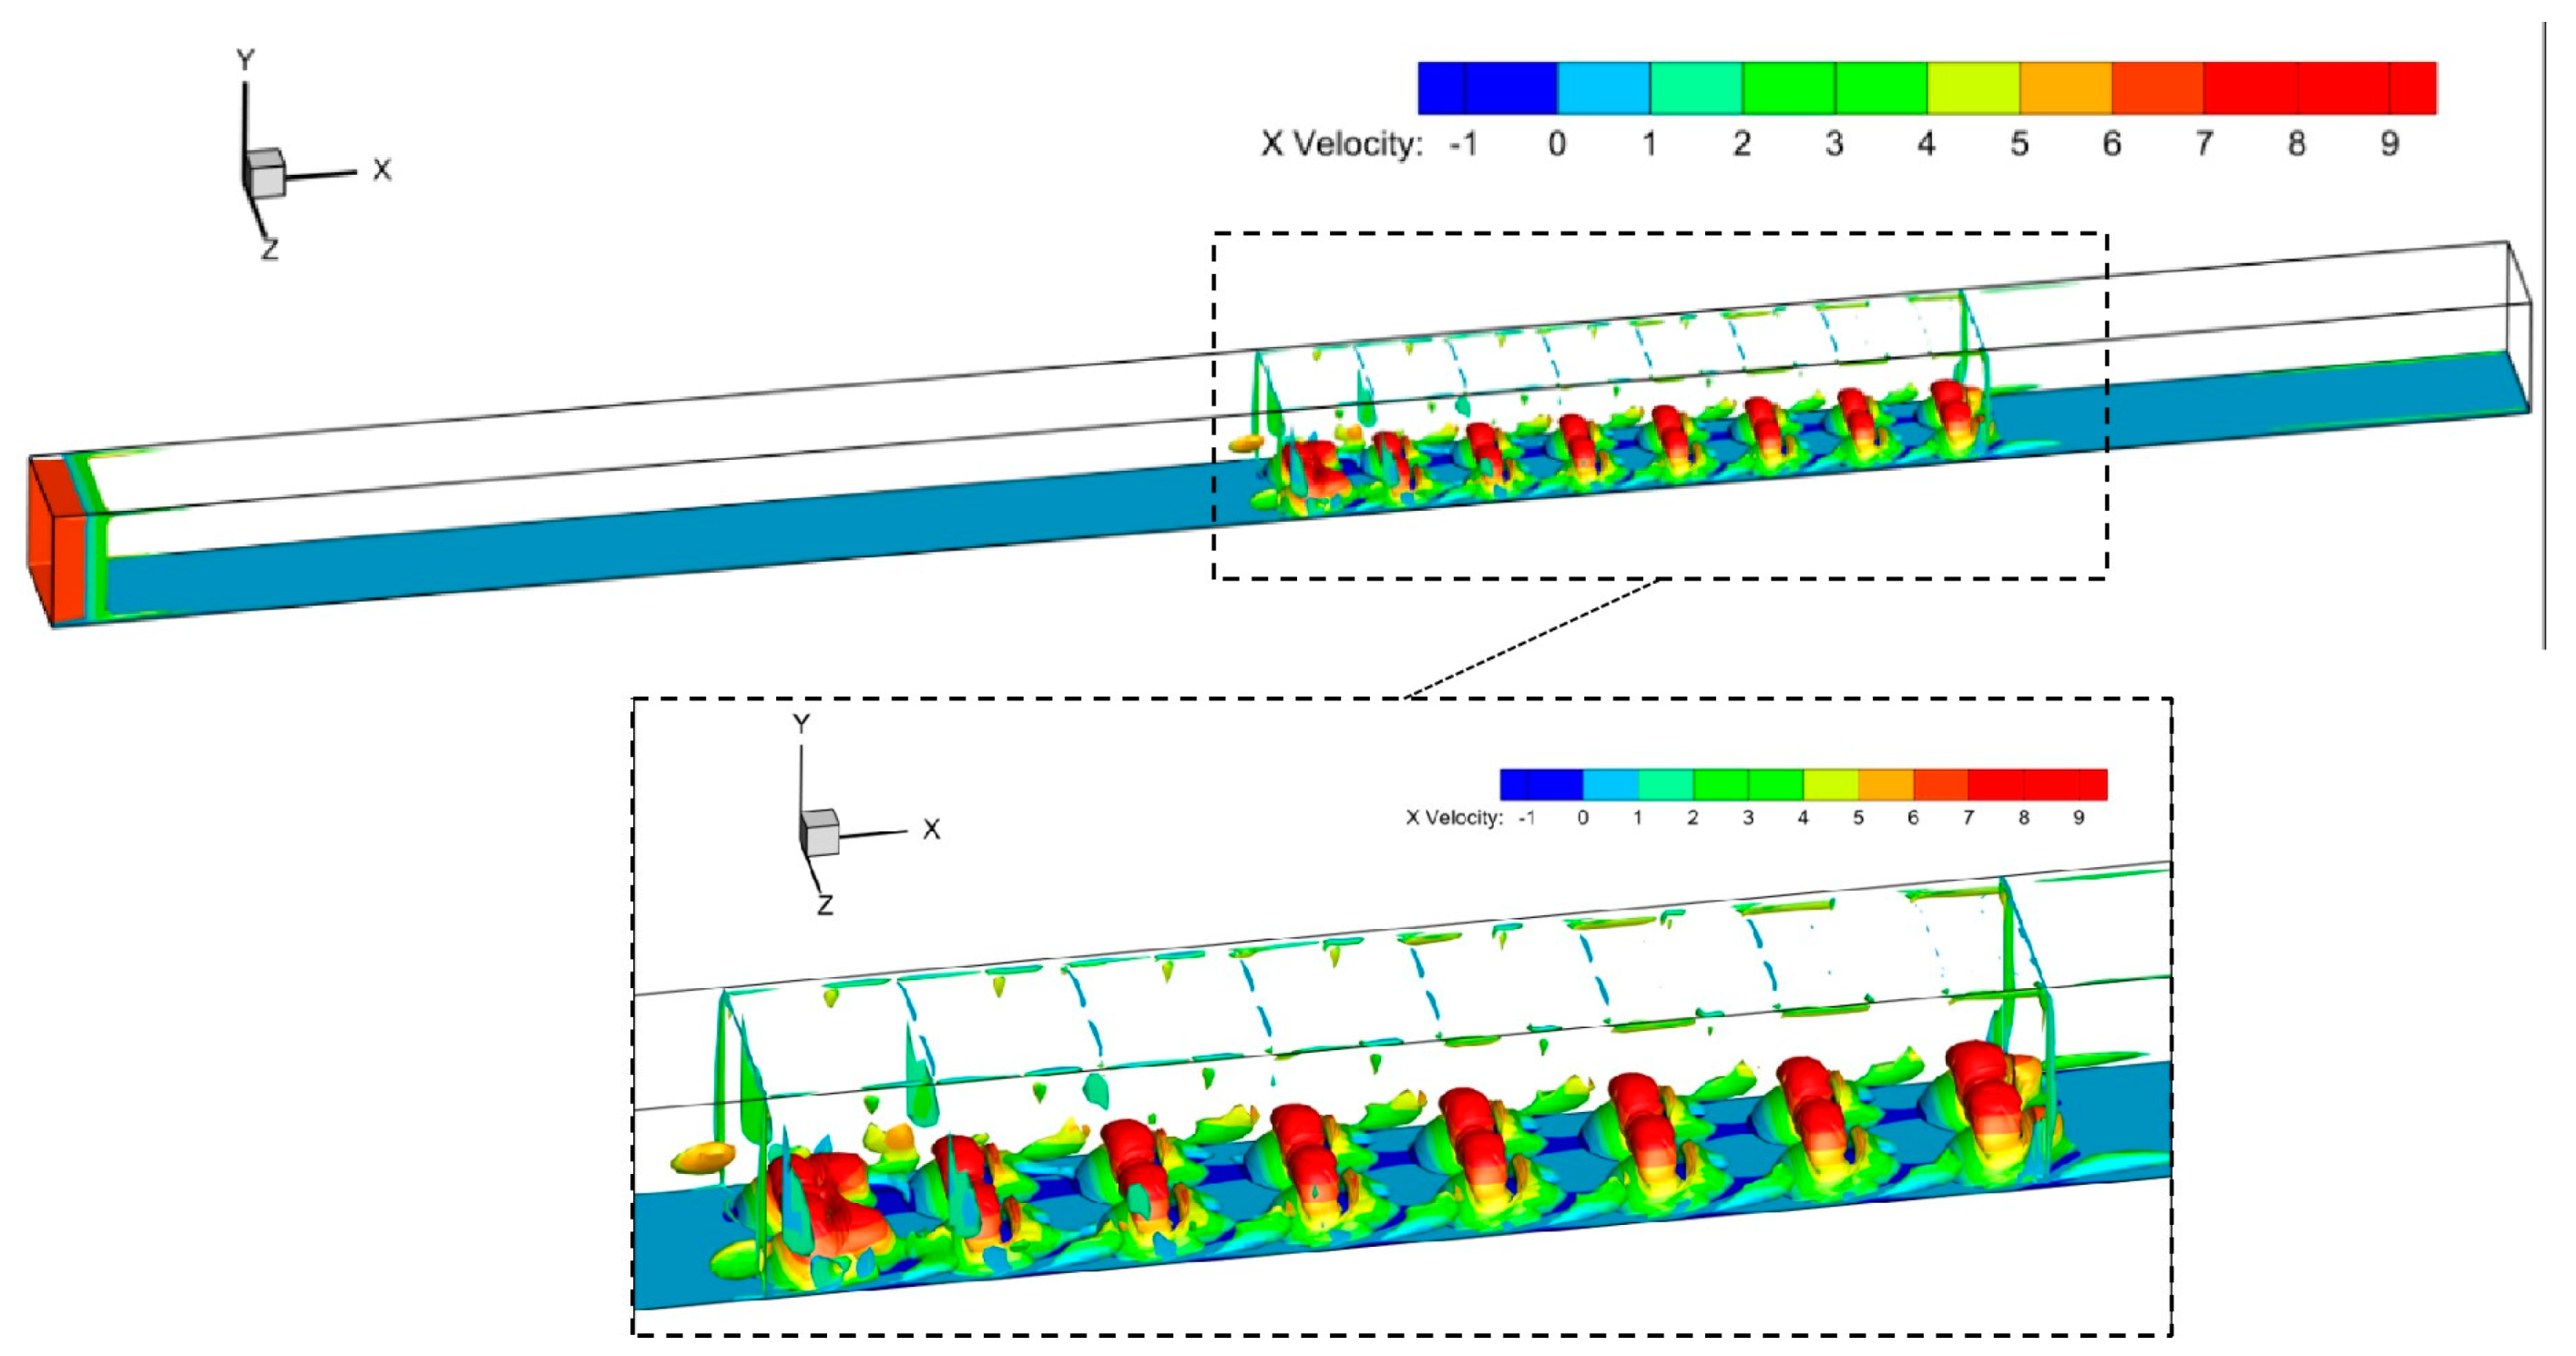
Figure 7 shows the vortex cores at Q = 100,000, colored with a ribbon of air velocity. A convex-dimple channel with h/D = 0.15 and p/h = 5 was used as an example for the analysis. As shown in Figure 7, the vortex cores in the channel were mainly distributed at the surface of the convex dimple, as well as between two convex dimples in the Z-axis direction and between two convex dimples in the X-axis direction. It was the presence of these convex dimples in the channel that caused the vortex cores to appear at the surface of the convex dimples and between the two convex dimples, thus changing the flow field structure. Observing Figure 16 below, it can be concluded that the particles were more aggregated where the Q-standard blocks were concentrated. Observing Figure 16 in conjunction with Figure 7, it is easy to see that more particles were deposited in the regions with more Q-standard blocks and higher velocities. This was because the presence of convex dimples changed the original flow field of the channel and generated vortices, which affected the deposition of particles in the channel. To conclude, in terms of analyzing the Q-criterion, the presence of convex dimples promoted the deposition of particles in the convex-dimple channel.

4.2.2. Flow Structures and Secondary Flow for Different h/D’s and p/h’s

The flow structure and secondary flow in the convex-dimple channel with different h/D’s and p/h’s changed the flow velocity and temperature fields in the convex-dimple channel. Figure 8 shows the XY plane air velocity field at 5 mm in the Z-axis direction for different h/D’s and p/h’s in the convex-dimple channel. At that time, the inlet air velocity was 6 m/s, and the temperatures of the inlet hot air and cold wall were 373 K and 300 K. The velocity boundary layer with periodic development along the convex-dimple channel can be observed in Figure 8, and it can be found that the thickness of the velocity boundary layer in the convex-dimple channel increased with an increasing h/D and decreased with an increasing p/h. In addition, the boundary layer fluctuated periodically for models with different h/D’s and p/h’s in the convex-dimple channel. This suggested that, for the convex-dimple channel, the presence of the convex dimple in the channel resulted in an intensification of the momentum transfer between the cavity flow and the main flow.
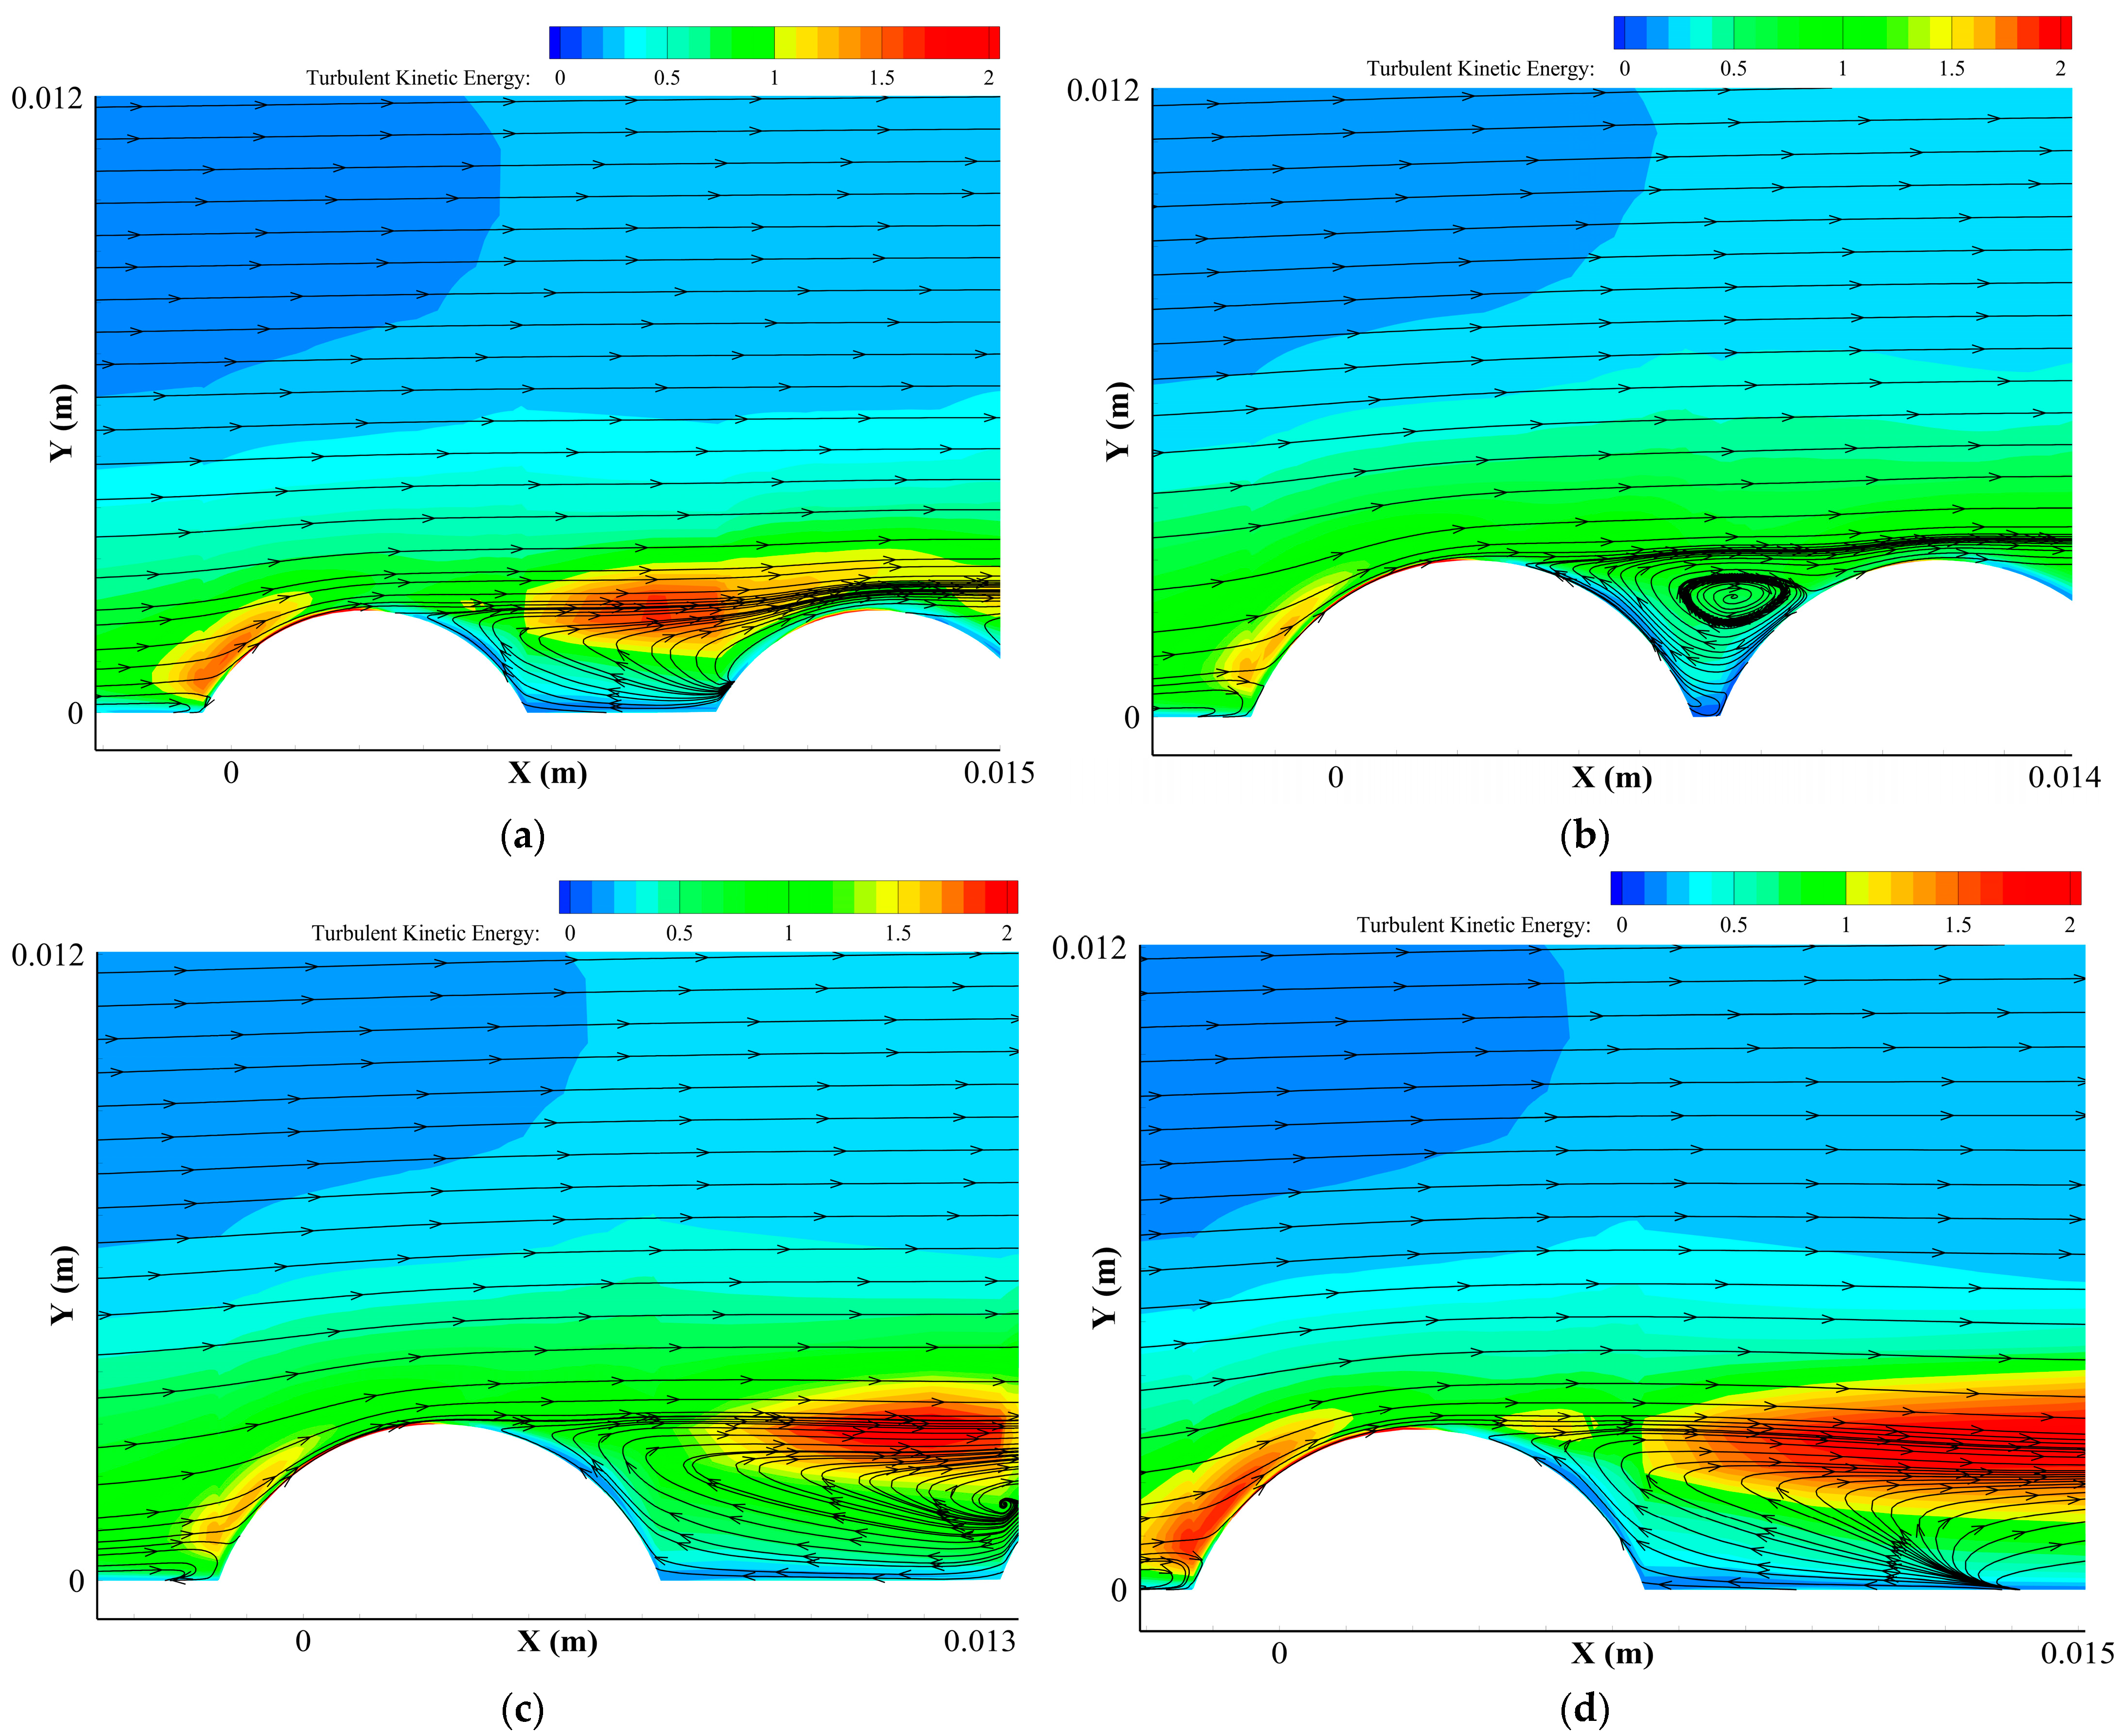
The TKE distributions of the different convex-dimple channels with local enlargement and the flow lines near the wall are shown in Figure 9. The TKE values in the convex-dimple channel were higher in the upper left part of the convex dimple, and the maximum value of TKE occurred in the upper left part of the convex dimple, which led to a large number of particles deposited near the upper left part of the convex dimple. In addition, for the convex-dimple channel, the TKE value was smaller, and the turbulence was less intense when p/h was the same and h/D was smaller, while the TKE value was larger, and the turbulence was less intense when h/D was the same and p/h was larger. For different p/h’s in the convex-dimple channel, the internal flow structure was very different, especially at p/h = 3, where small turbulent vortices appeared in the cavity between the two convex dimples, as shown in Figure 9b.
Taking the red dashed line in Figure 9 as a reference to cut out one face of the YZ plane, the temperature field and velocity vector map obtained in the YZ plane was between the two convex dimples, as shown in Figure 10. Observing the temperature field distribution in Figure 10, its temperature gradient generated a thermophoretic force [60], and its generated thermophoretic force pushed the particles from the high temperature to the cold wall. When p/h and h/D were different, the temperature field distribution was almost the same, as shown in Figure 10a–d. Furthermore, it can be concluded from Figure 10 that the variation of h/D and p/h affected the secondary flow structure in the convex-dimple channel. At the same p/h, the larger the h/D, the more intense the secondary flow at its bottom was; at the same h/D, the larger the p/h, the more chaotic and more intense the secondary flow at its bottom was. In these four models, the secondary flow occurred in the upper two corners and the bottom of the model, especially at the bottom. In that case, the secondary flow drove the movement of the particles, which was important for the settling of the particles.

4.2.3. Effect of Different Positions of Dimples on Heat Transfer

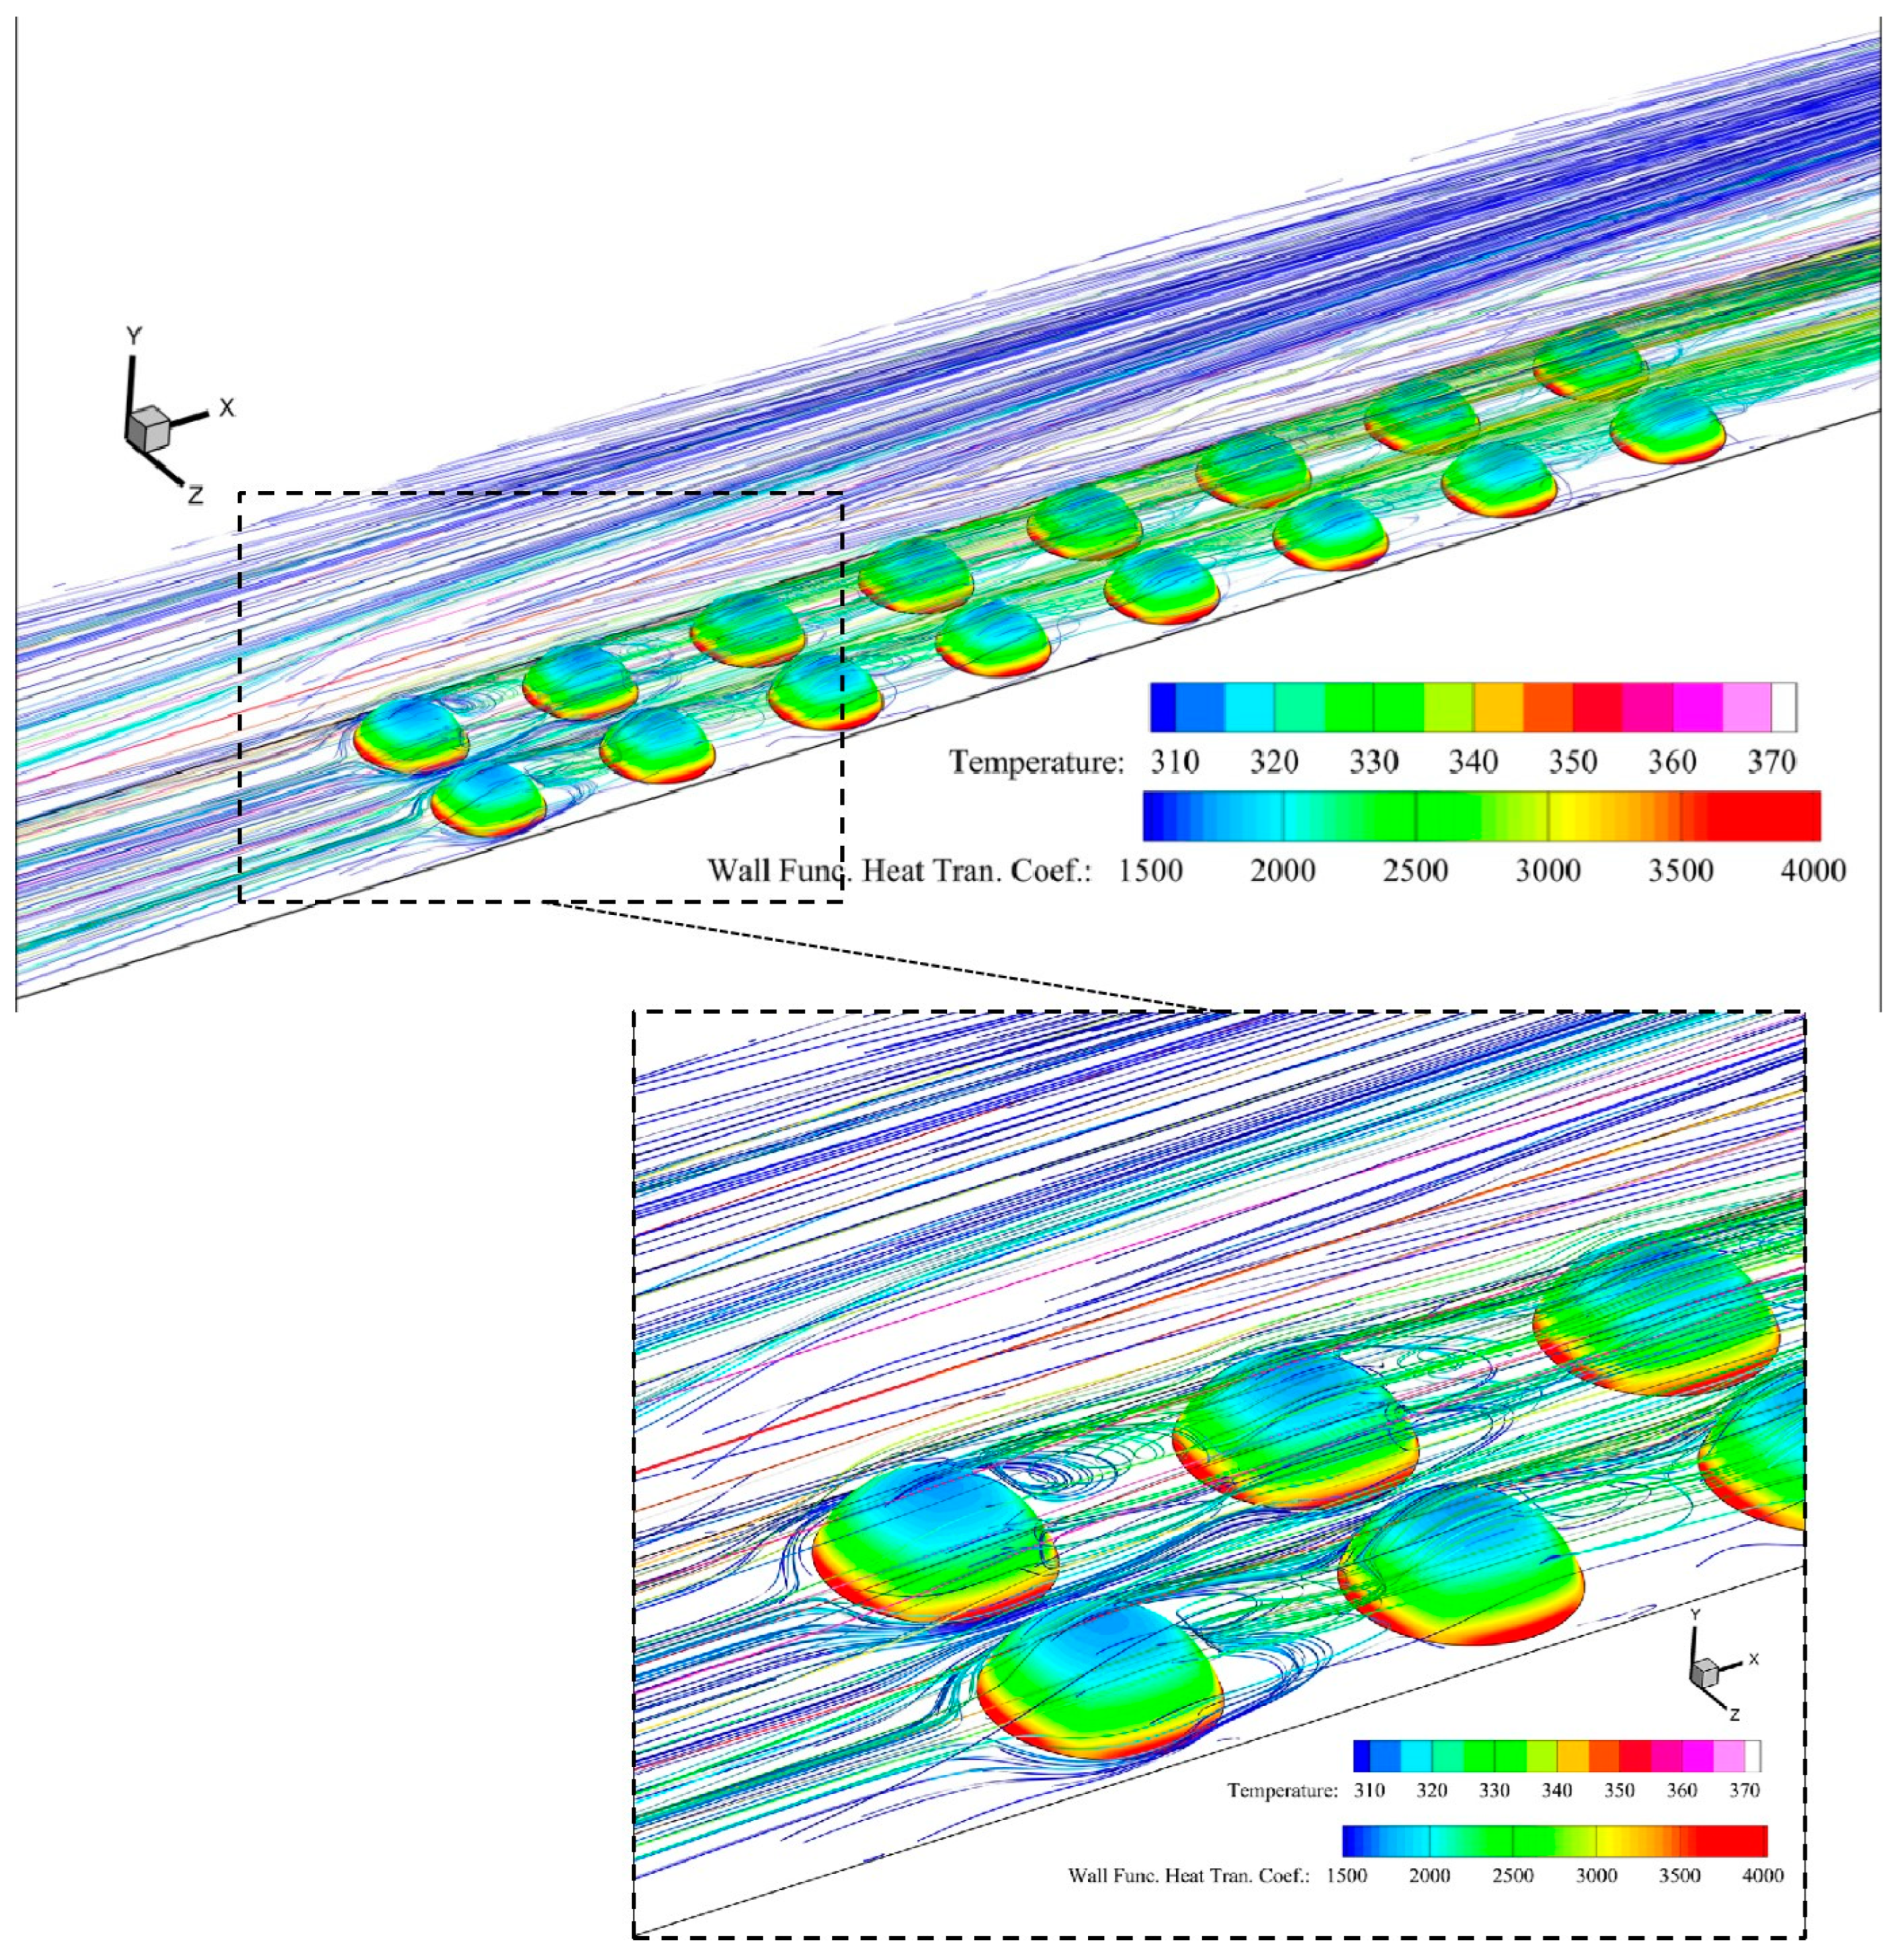
The distribution pattern of the wall function heat transfer coefficient in the convex dimple channel is shown in Figure 11, and a flow line plot colored by temperature is added to the wall function heat transfer coefficient plot. The values of the convective heat transfer coefficients of the single convex-dimple wall decreased from the bottom of the dimple to the top of the dimple. The maximum value of the coefficient occurred at the position around the bottom of the dimple. This resulted in an enhanced local heat transfer. Figure 11 also shows the flow lines in the channel, which reveal the flow in the channel, with a more pronounced bypass near the first row of convex dimples and with backflow and vortex clusters behind the dimples.

4.2.4. Influence of Airflow Velocity

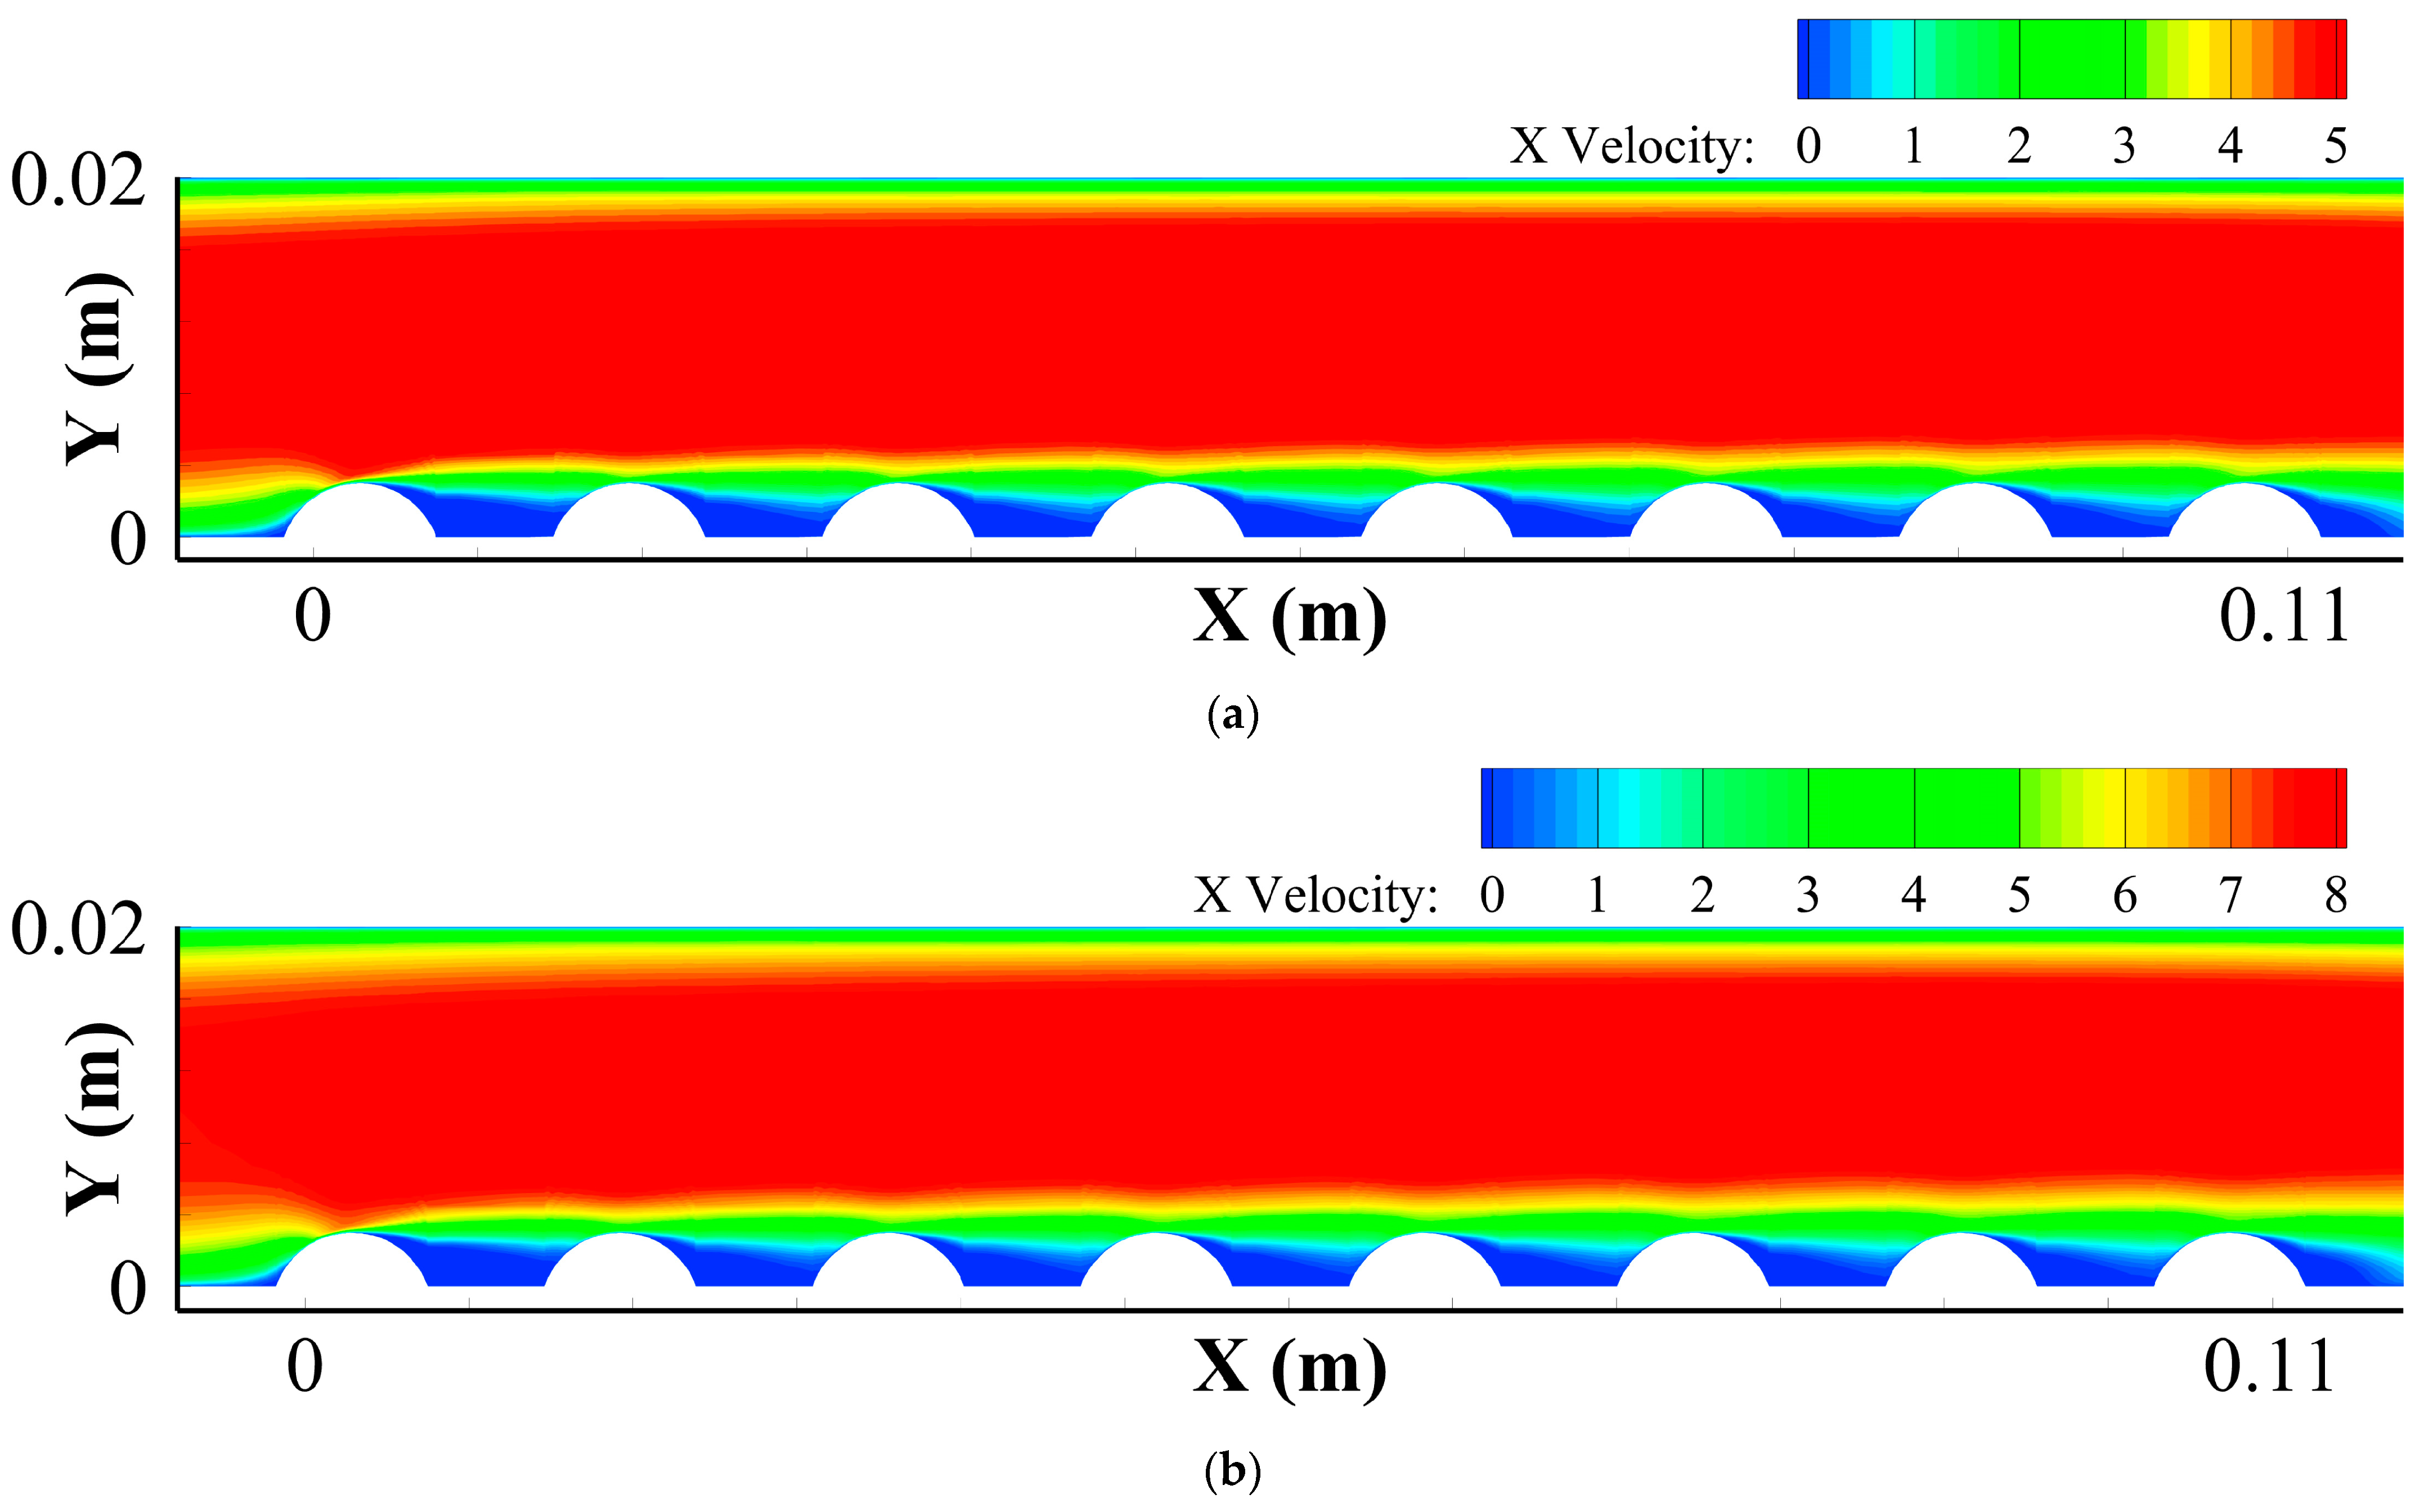
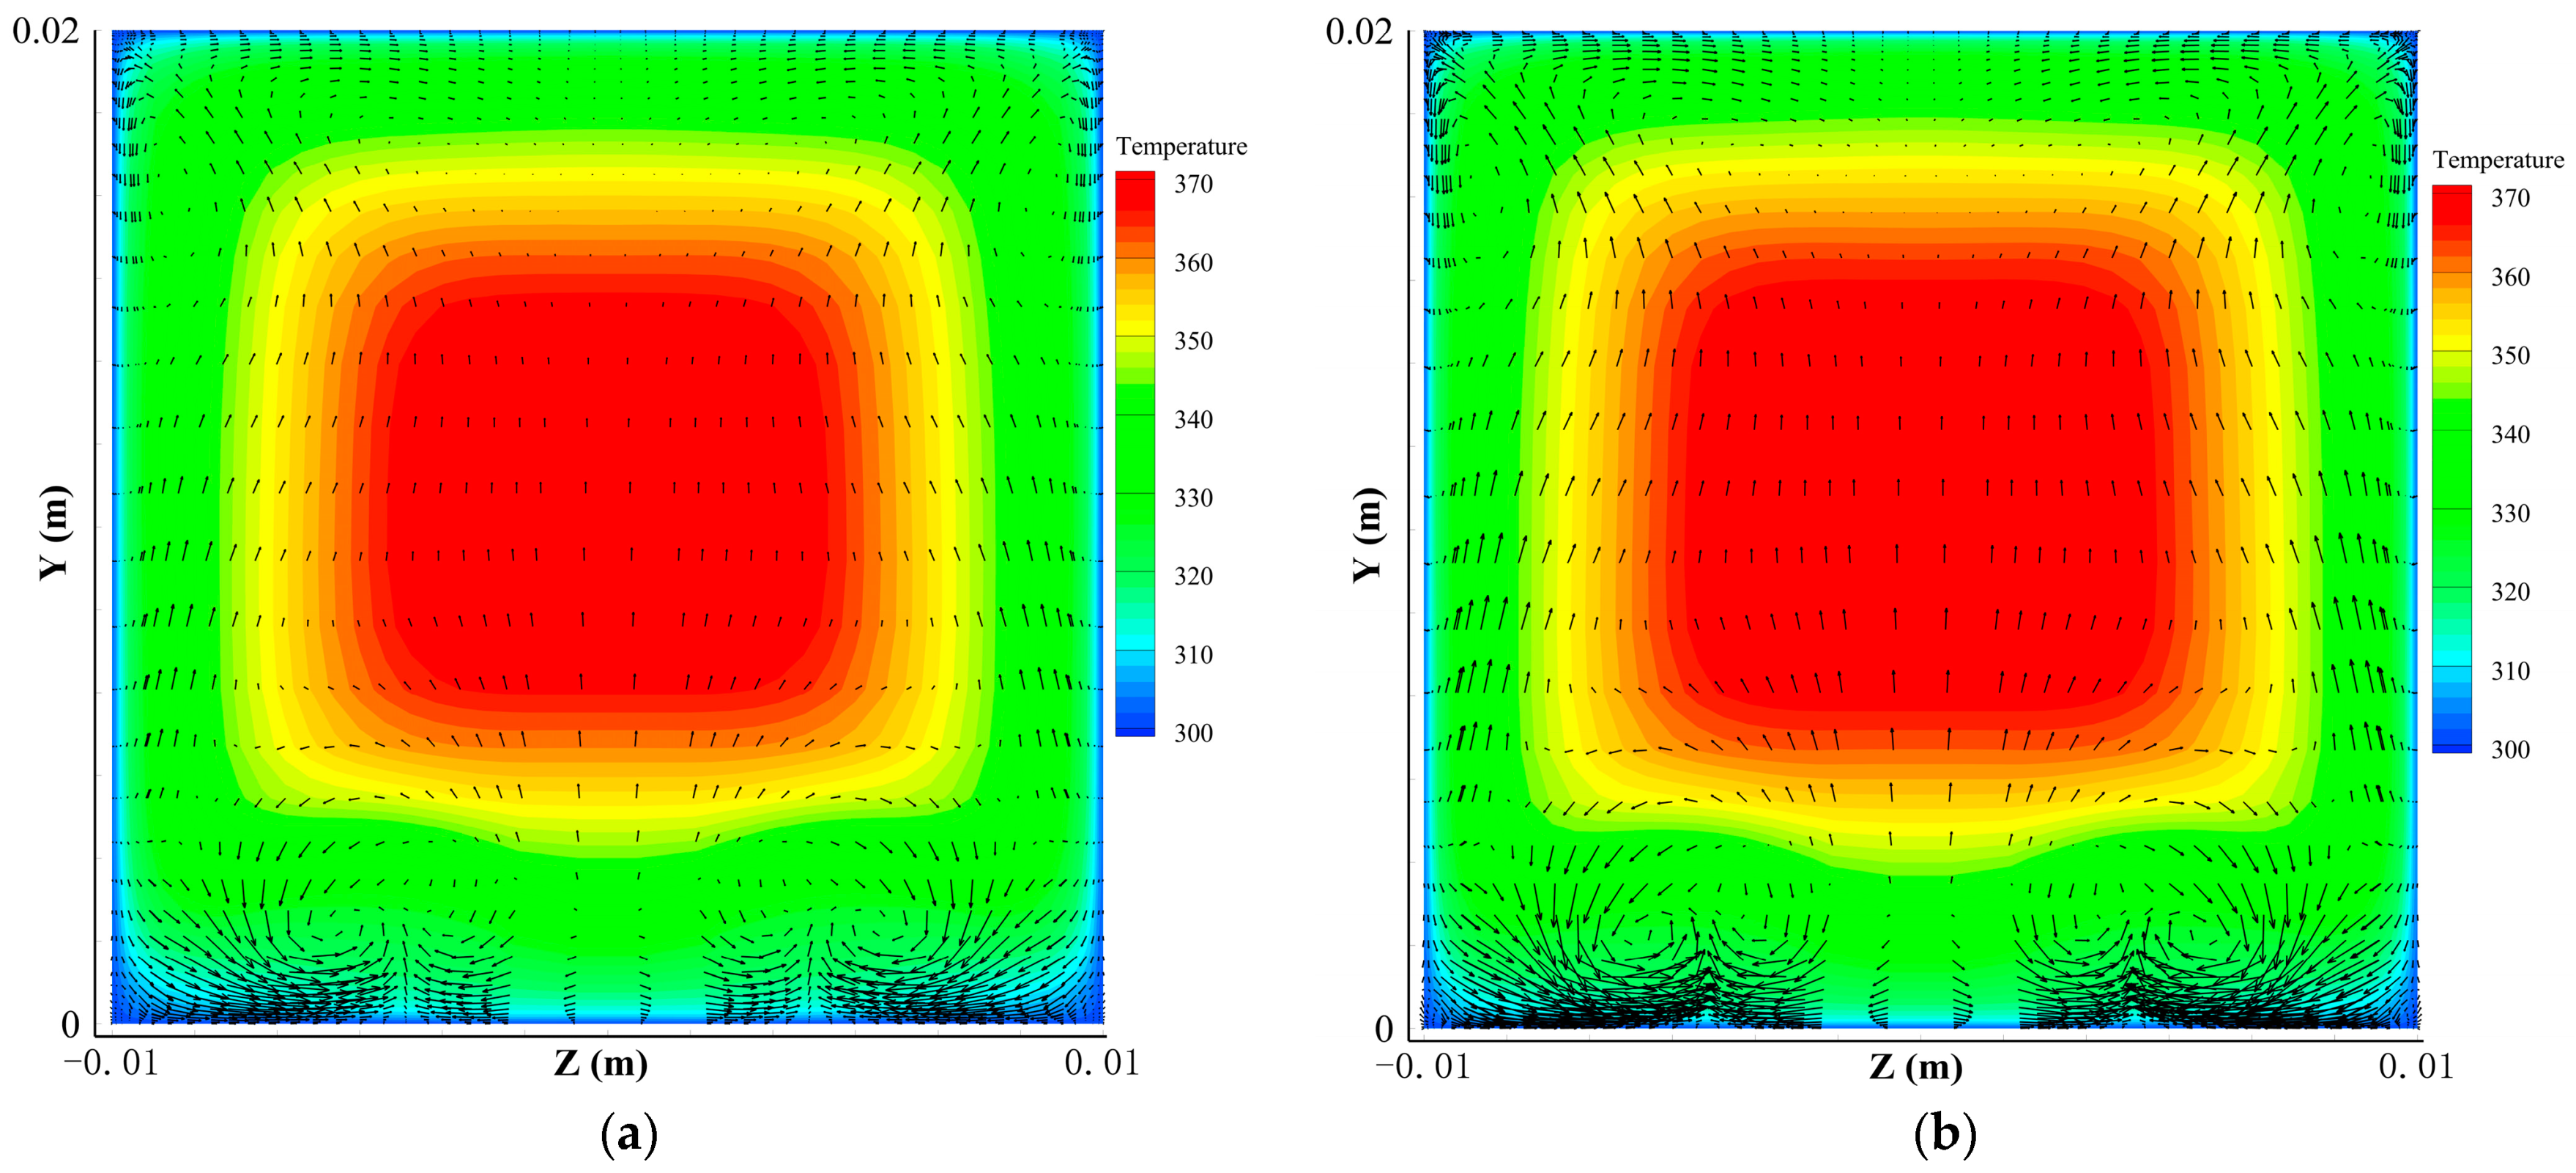
The inflow air velocity is also an important factor affecting the flow field distribution characteristics in the channel. Figure 12 depicts the velocity field at different air velocities in the XY plane at Z = 0.005 m. The velocity distribution pattern and velocity boundary layer are almost the same at different air velocities. Figure 13 depicts the temperature distribution and velocity vector in the YZ plane between the two convex dimples in the X direction for different wind speeds. It can be seen that with the increase in wind speed, the secondary flow between the two convex dimples was more obvious and intense, especially near Z = 0.005 m. The secondary flow was more intense. The flow shapes were all the same, independent of the wind speed. The temperature field showed that there was little difference between the temperature distribution at U = 4 m/s and U = 6 m/s, except that the high-temperature region at U = 6 m/s was larger than that at a lower speed, when the thermal swimming force in the channel at the two flow rates did not change much.

4.3. Particle Deposition Patterns

4.3.1. Influence of Convex Dimples on Particle Trajectories

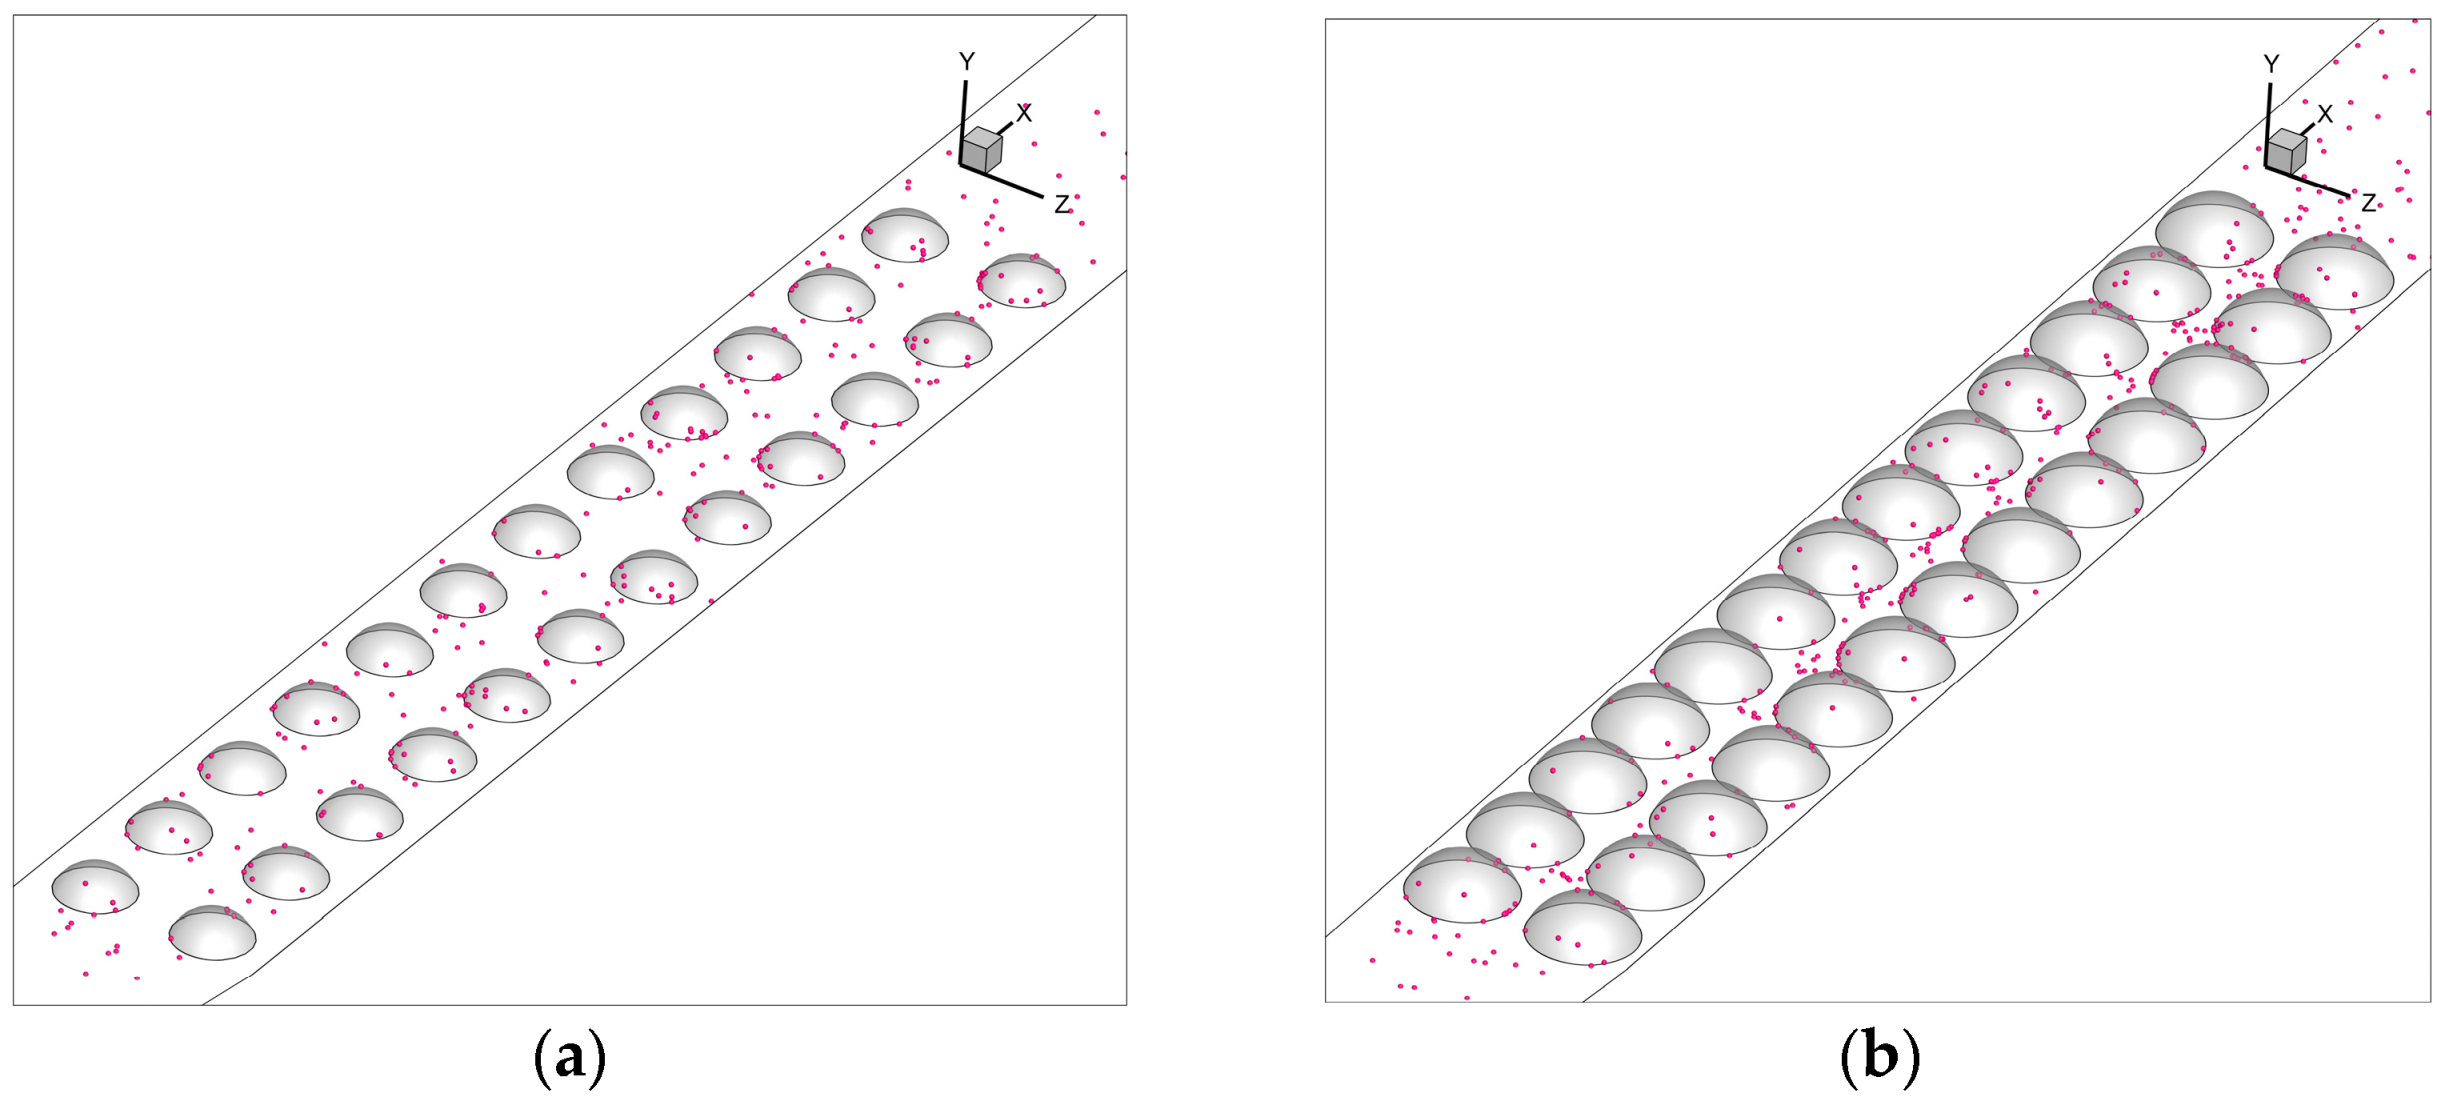
Figure 14 depicts the dp = 30 μm particle dispersion routes in tubes with and without convex dimples. The trajectory of particulate matter dispersion in the air duct was quite uniform, as shown in Figure 14a. Due to the high wind speed in the center and the distance from the edge, particulate matter was dispersed more intensively in the center of the model than elsewhere. Due to the existence of convex dimples, vortex clusters and secondary flows were created within the convex dimples, resulting in a higher particle dispersion under the same circumstances.

4.3.2. Effects of h/D and p/h on Particulate Deposition

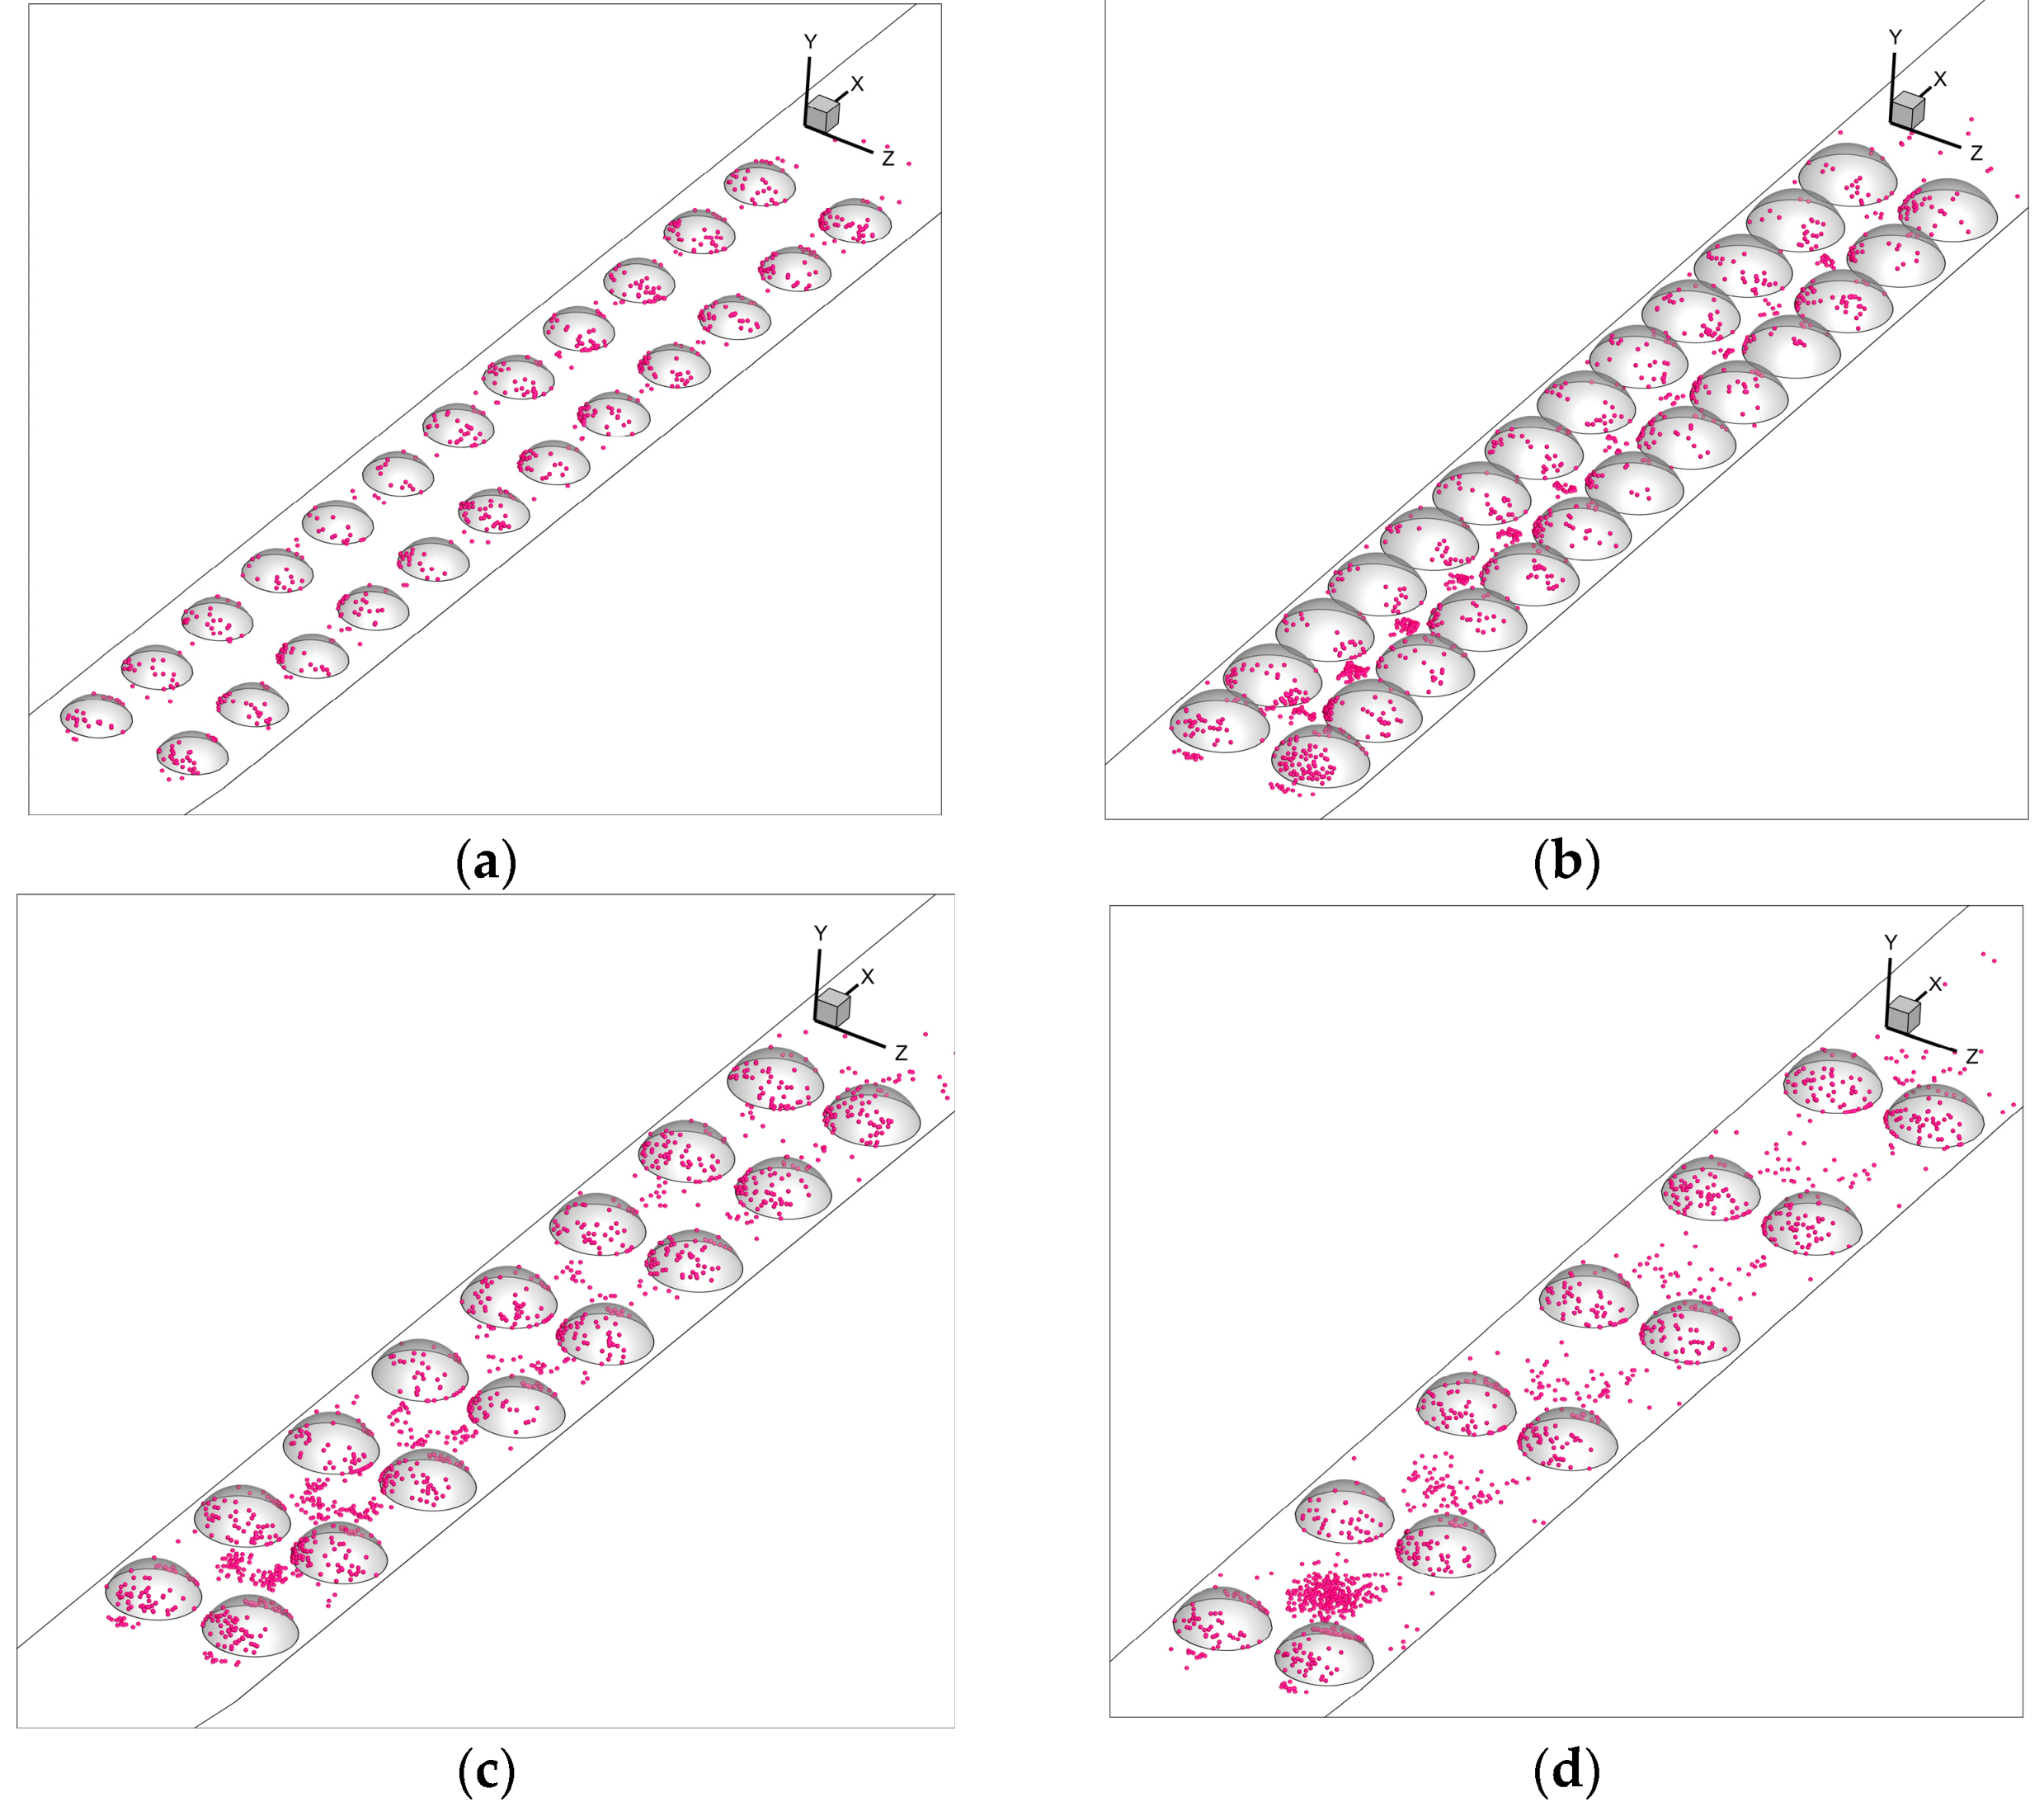
Figure 15 depicts the deposition conditions of 1 μm particles in the convex-dimple channel at different h/D’s and p/h’s. First, the variations of h/D and p/h in the convex-dimple channel did not significantly change the main deposition locations of the particles, which were deposited scattered on the surface of the channel. However, it can be seen from Figure 15b–d that there was a small change in the deposition position of the particles as p/h increased. For smaller p/h’s, the particles were mostly deposited on the smooth surface, while the particles were more deposited on the convex dimple surface when p/h increased. This was also related to the number of convex dimples in the channel, where 1 μm particles were more deposited on the convex dimple surface when the number of convex dimples in the channel was small.
Figure 16 depicts the deposition condition of 5 μm particles in the convex-dimple channel at different h/D’s and p/h’s. As shown in the figure, particles with a particle size of 5 μm were more deposited than those with a particle size of 1 μm. This was because the particles with a size of 5 μm had a little more mass and their inertia was also larger, so these particles were more likely to be deposited in the channel and did not move easily with the airflow. When p/h was constant, as h/D increased, more particles were deposited in the convex-dimple channel and more particles were deposited between the two convex dimples, in addition to the significant secondary flow and temperature gradient between the two dimples, which would also lead to more particles deposited there, as shown in Figure 10. When h/D was kept constant, the effect on the particles deposited in the convex-dimple channel was not significant with an increasing p/h.
Figure 17 depicts the deposition of particles with a particle size of 30 μm in the convex-dimple channel at different h/D’s and p/h’s. Firstly, most of the particles were deposited on the smooth surface and the windward side of the convex dimple, because the particles of size 30 μm had more gravity and inertia, so a large number of particles were deposited in those two places. In particular, more particles were deposited on the windward side of the first row of convex dimples. A small number of particles were deposited between the two convex dimples because there was a significant secondary flow and temperature gradient between the two dimples, which led to the deposition of particles there, as shown in Figure 10. In addition, the change in h/D also affected the particle deposition distribution; as h/D increased, fewer particles were deposited between the two convex dimples in the z-direction.

4.3.3. Effect of Air Velocity on Particulate Deposition

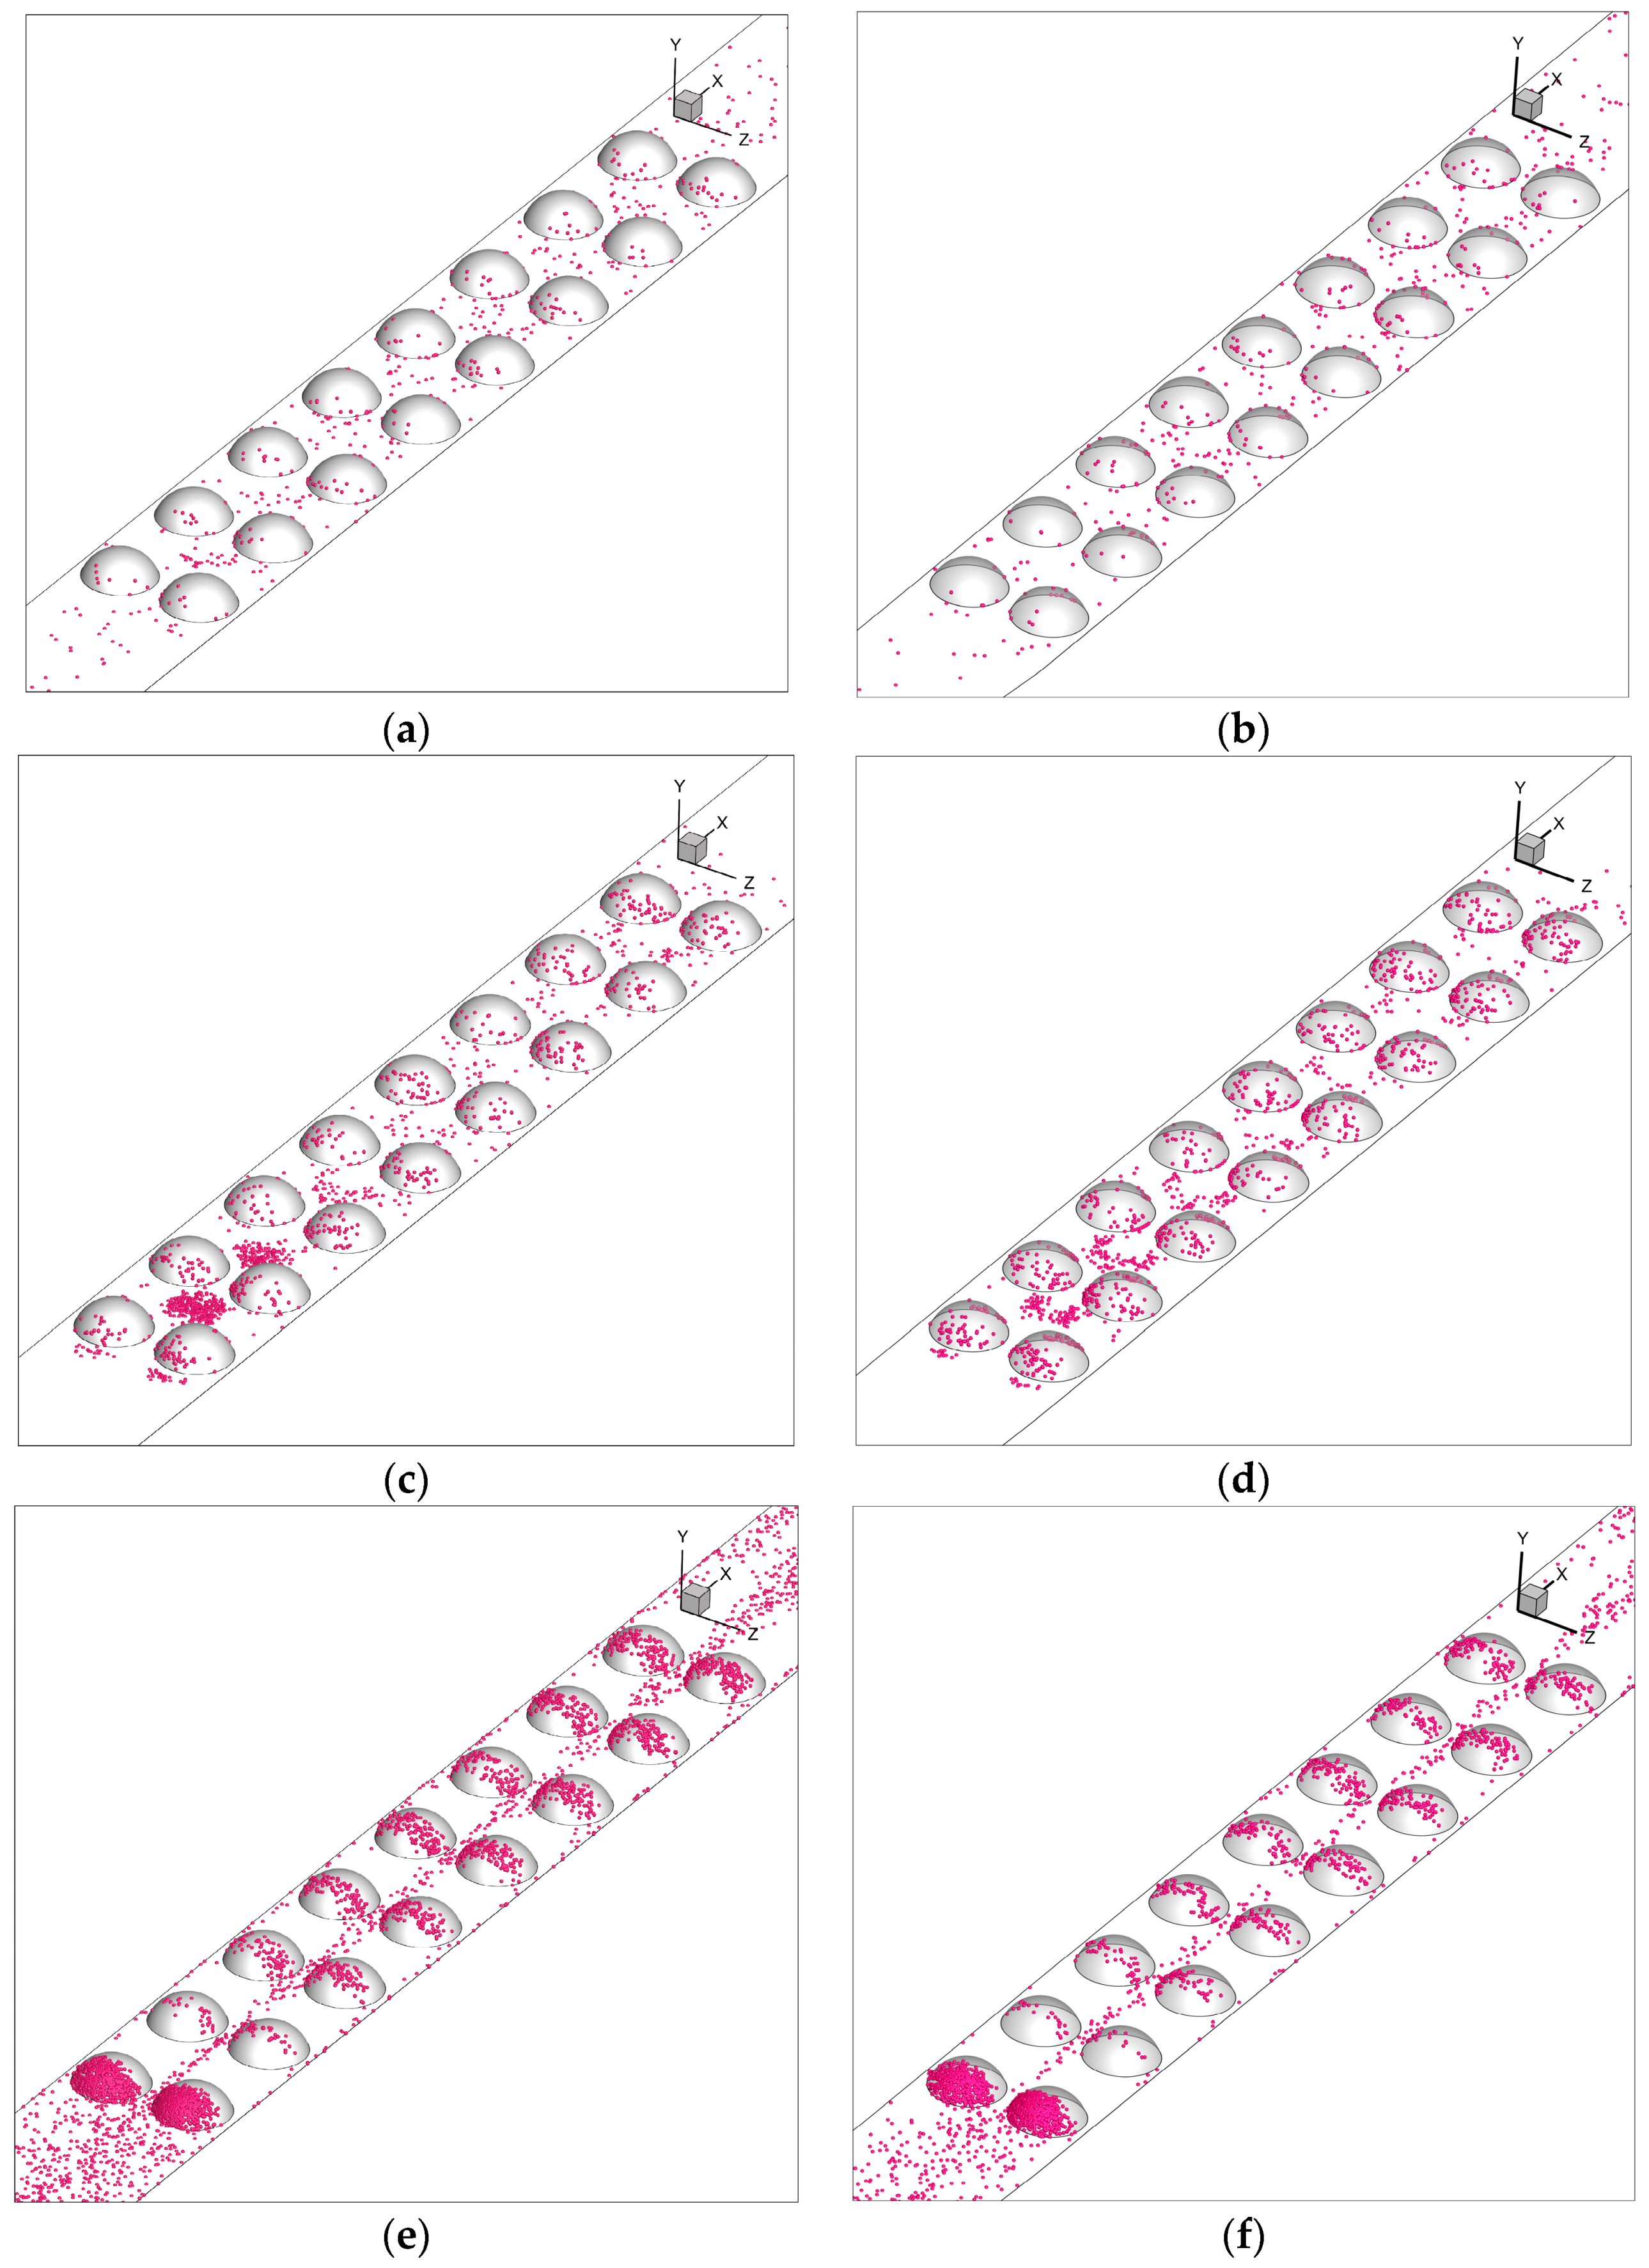
Figure 18a–d depict the deposition of particles with particle sizes of 1 μm and 5 μm at different air velocities. The following figures show that the increase in air velocity at the air inlet did not have a very significant effect on the number and location of the tiny particles deposited (dp = 1 μm and 5 μm). Nevertheless, the comparison showed that the number of deposited tiny particles decreased at higher velocities. The particle distribution pattern could be closely related to the channel flow field analyzed above, and the particle deposition between the two convex dimples in the X-direction was influenced by the distribution of the secondary flow in the channel. In addition, the higher the wind speed, the more pronounced the secondary flow, which enhanced particle deposition; and when the wind speed was low, the large temperature gradient led to a stronger thermophoretic force, which promoted particle deposition; under the neutralizing influence of these two cases, the number of small particles deposited at different wind speeds became little different.
Figure 18e,f illustrate the deposition of large particles (dp = 30 μm) at different wind speeds. It can be seen from the figures that different air velocities had a large effect on the deposition of large particles. When the air velocity at the inlet increased, the number of deposited particles decreased significantly. The reason for the latter was that when the particle size was large, gravity became the main mechanism for particle deposition, and when the particles were flowing in the channel at low and medium air velocities, the time for the particles to pass through the channel was longer than when they were flowing at high air velocities. Therefore, as the inlet airflow velocity rose, the time for the particles to move in the channel and the time affected by gravity was shortened, resulting in a large decrease in the number of deposited particles.

4.4. Analysis of Particle Deposition Efficiency

4.4.1. Effect of Convex Dimples’ Existence and Particle Size on Deposition Efficiency

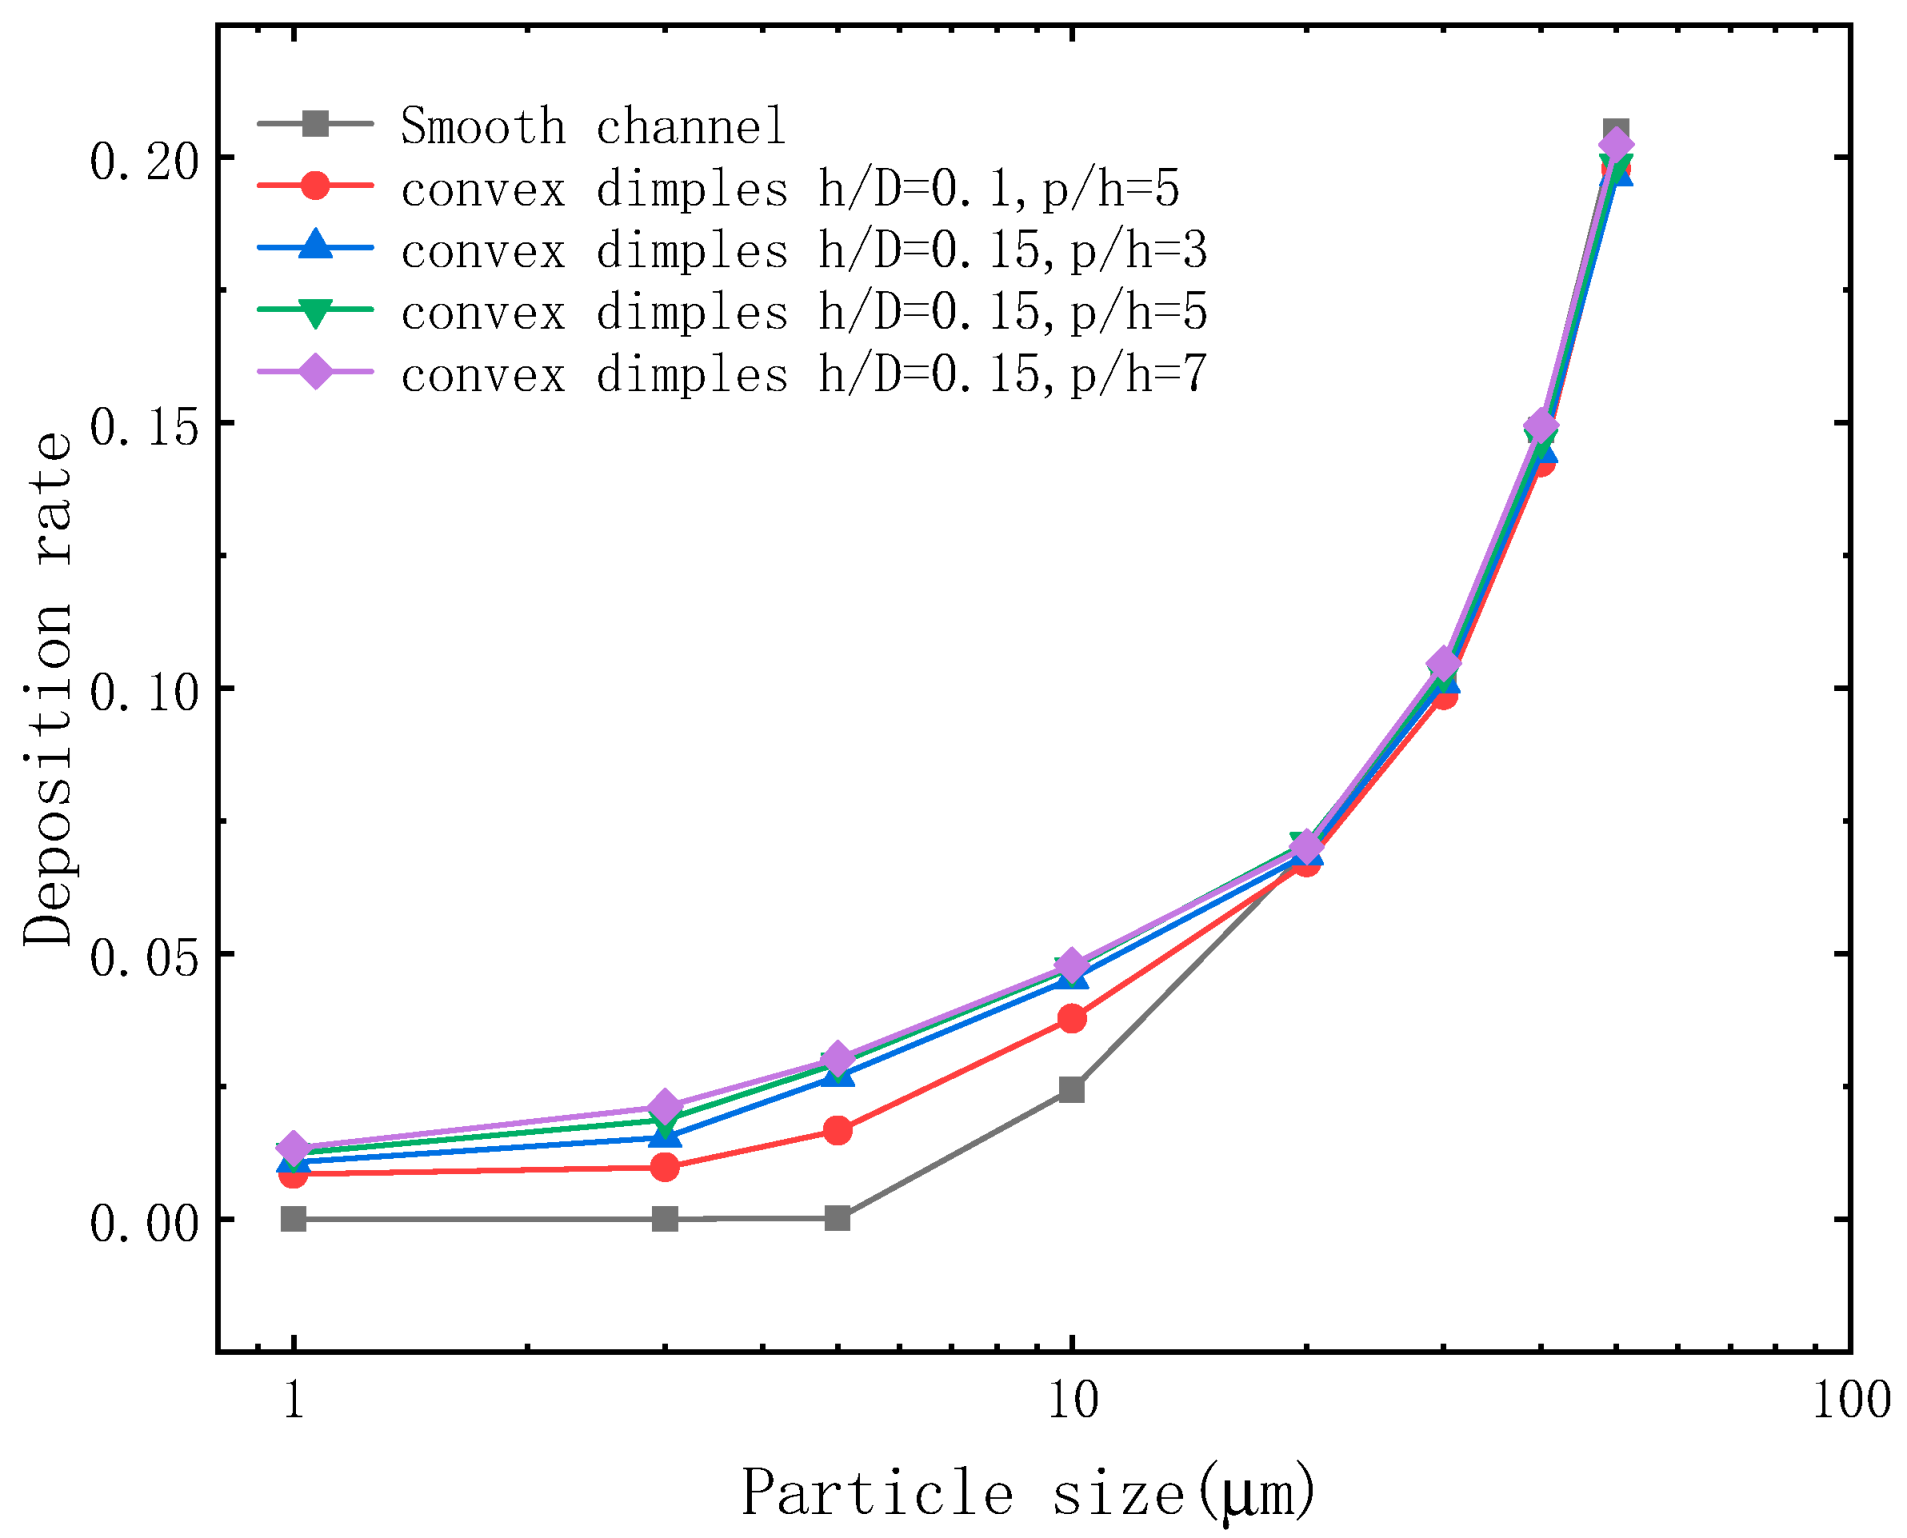
It can be seen from Figure 19 that the presence of convex-dimple channels had a large effect on the deposition rate of particles, especially on the deposition effect of tiny particles (dp < 20 μm) but had almost no effect on large particles (dp ≥ 20 μm) due to their relatively large gravity and inertia. Because gravity was one of the main factors affecting particle deposition, and large particles (dp ≥ 20 μm) were less affected by secondary flow, turbulent eddies, TKE values, and thermophoretic forces in the channel, the deposition rate in the convex-dimple channel was similar to that in the smooth channel. Therefore, for large particles (dp ≥ 20 μm), the deposition rates of the models in the convex-dimple channel and the smooth channel were almost the same. However, for tiny particles (dp < 20 μm), the deposition rate in the convex-dimple channel was significantly larger than that in the smooth channel. Taking the convex-dimple channel model with h/D = 0.15 and p/h = 5 as an example, the number of particles deposited in the convex-dimple channel was 442, 488, 167, and 1.6 times higher than that in the smooth channel when the particle sizes were 1 μm, 3 μm, 5 μm, and 10 μm, respectively. It can be seen from Figure 19 that the particle deposition efficiency of the four-dimple channels was significantly greater than that of the empty tube when the particle size was small. Therefore, it is concluded that the convex-dimple channels significantly enhanced the deposition of tiny particles (dp < 20 μm) within the channels.

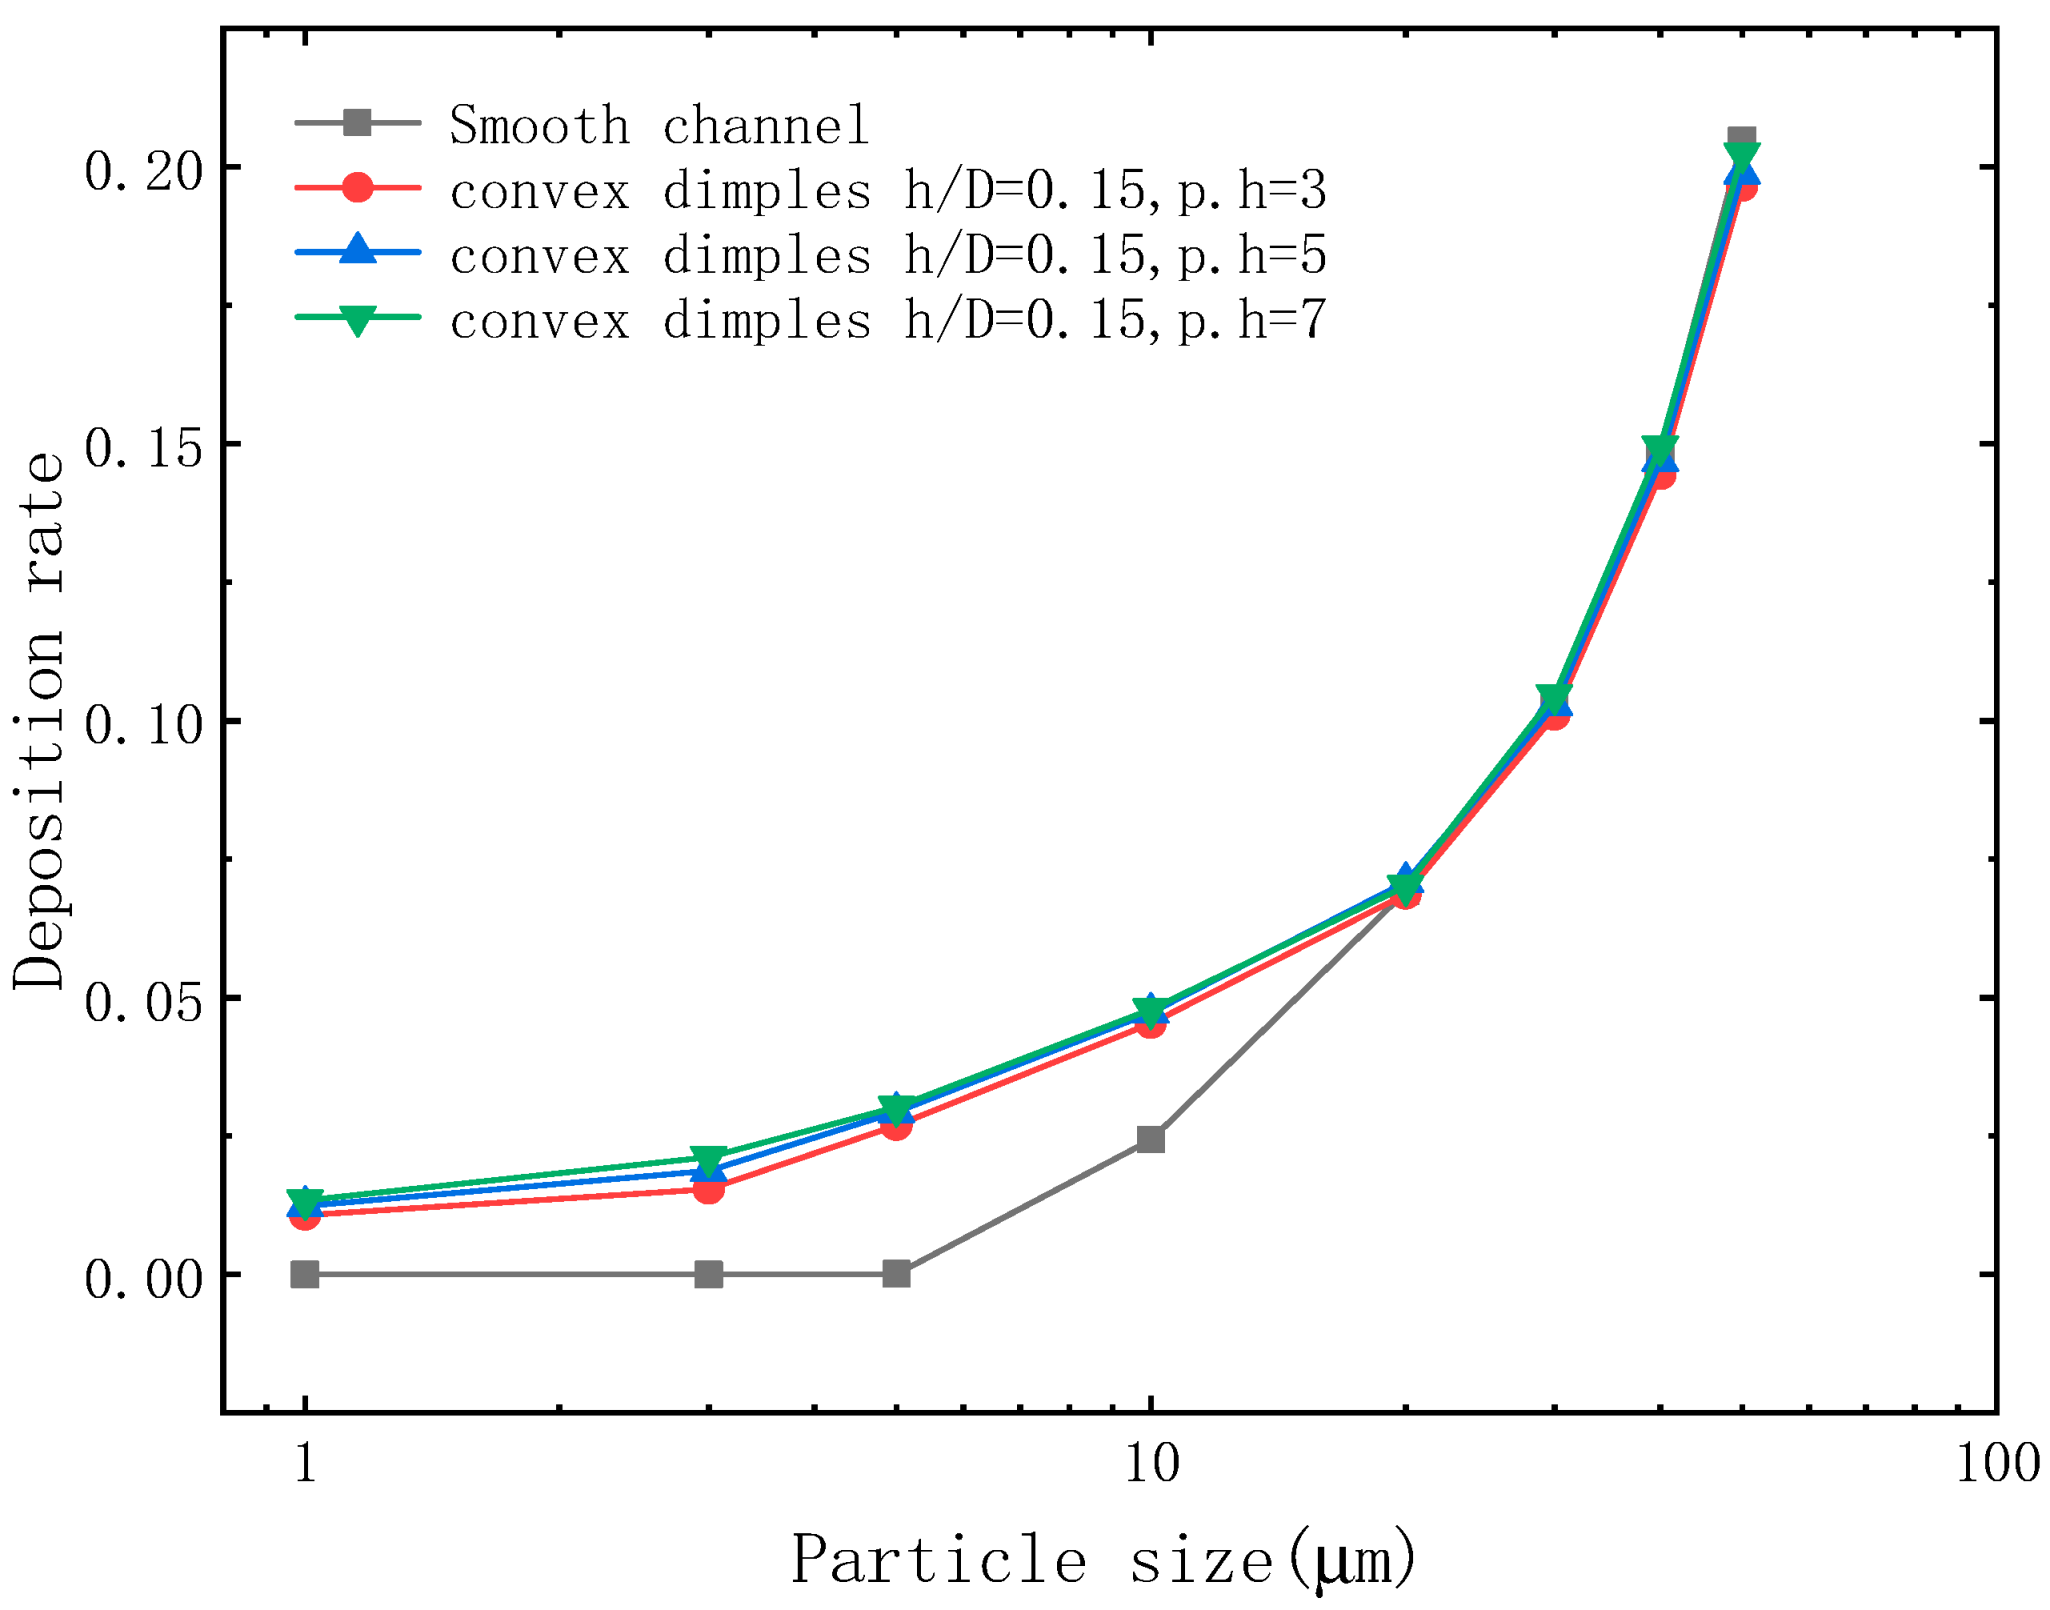
4.4.2. Influence of p/h

Different p/h’s hardly affected the deposition of particles in the convex-dimple channel, as shown in Figure 20. It can be seen that for particles with particle size dp = 1–50 μm, the deposition rates of particles in the convex-dimple channel at three different p/h’s almost overlapped, which indicated that p/h had almost no effect on the deposition of particles in the convex-dimple channel.

4.4.3. Influence of h/D

As shown in Figure 21, the deposition rate of particles increased with a larger convex-dimple channel’s h/D. In particular, the effect of the change of h/D of the convex-dimple channel on the particle deposition rate was most obvious when the particle size was dp < 20 μm. On the one hand, this was because the larger the h/D, the larger the area of the convex dimple in the convex-dimple channel occupied the flow field, which was conducive to intercepting particles; on the other hand, it can be seen from Figure 10a,c that the larger the h/D, the stronger the secondary flow. In addition, the temperature distribution in the channel was almost the same at that time, so the effect of the thermophoretic force on particle deposition was not significant at that time, and the effect of h/D on the deposition rate of particles in the convex-dimple channel was larger.

4.4.4. Influence of Wind Speed

Figure 22 depicts the effect of wind speed on deposition efficiency. The inlet wind speeds were 4 and 6 m/s, and the model was a convex-dimple channel with h/D = 0.15 and p/h = 5. Figure 22 shows that wind speed had a significant effect on the deposition efficiency of large particles (dp > 10 μm) in the convex-dimple channel. However, when the particle size was less than 5 μm, the effect of wind speed on the deposition efficiency was small, although the secondary flow near the convex dimple in the channel was more intense at a higher wind speed, which was favorable to particle deposition, but the greater the wind speed, the shorter the residence time of particles in the channel, which was not favorable to particle deposition. The combined effect of multiple factors led us to conclude that wind speed had little effect on the deposition of small particles (dp < 5 μm). However, when the particle size was larger than 10 μm, the deposition efficiency of the particles decreased significantly with the increasing air velocity. This was because the gravitational effect became one of the main reasons for particle deposition in the convex-dimple channel as the particle size increased. In addition, when the wind speed increased, the velocity of the particle movement also increased, and its residence time in the channel was greatly reduced, which was not conducive to the deposition of larger particles on the convex-dimple channel under the effect of gravity. When the flow velocity was low, the particles stayed on the channel length, which made it easier for large particles to settle to the bottom.

5. Conclusions

In this study, CFD technology was used to simulate the flow field in a three-dimensional convex-dimple heat-transfer channel, and the turbulence and particle deposition in the channel were summarized and analyzed. The meshing was performed with a structured grid, using a Reynolds stress model for the fluid phase and a discrete particle model for the particle phase. The effects of the vortex height ratio (h/D), intervortex ratio (p/h), particle size, and airflow velocity on the vortex clusters and particle deposition characteristics of the flow field were analyzed. The following conclusions are presented:
(1) The presence of convex dimples affected the flow field structure in the channel, with the formation of vortex clusters between the two convex dimples and the presence of fluctuating disturbances above the dimples. Its presence also significantly affected the particle motion and deposition in the channel. Especially for small particle sizes (dp < 10 μm), the deposition rate in the convex-dimple channel was about 535, 768, 269, and 2 times higher than in the smooth duct (for particle sizes f of 1, 3, 5, and 10 μm, respectively).
(2) Different p/h’s and h/D’s in the convex-dimple channel changed the turbulent kinetic energy and secondary flow field in the channel, which in turn affected the particle deposition. The deposition rate in the convex-dimple channel with a constant p/h and h/D = 0.15 was 1.2 times higher than that with h/D = 0.1. The deposition rates were 0.045%, 0.047%, and 0.048% for the same h/D and p/h = 3, 5, and 7, respectively.
(3) The inlet air velocity affected the intensity of the secondary flow in the channel; the greater the velocity, the more intense the secondary flow. It also affected the heat transfer in the channel, the higher the speed the greater the high-temperature area in the channel. The inlet air velocity affected the deposition of particles, and the deposition rate of large-size (dp > 10 μm) particles was particularly significant. The deposition rate at U = 4 m/s was 2.5 times higher than that at U = 6 m/s for a particle size of 50 μm and 1.74 times higher for a size of 30 μm.

Author Contributions

Conceptualization, Z.H. and H.L. (Hao Lu); methodology, Z.H.; software, Z.H.; validation, Z.H., H.L. (Hao Lu) and H.L. (Hongchang Li); formal analysis, Z.H.; investigation, X.C. and M.F.; resources, H.L. (Hao Lu); data curation, D.K., X.J. and M.F.; writing—original draft preparation, Z.H.; writing—review and editing, H.L. (Hongchang Li); visualization, L.D.; supervision, H.L. (Hao Lu); project administration, H.L. (Hao Lu); funding acquisition, H.L. (Hao Lu) and H.L. (Hongchang Li). All authors have read and agreed to the published version of the manuscript.

Funding

This research was funded by National Oversea High-level Talents Program of China, National Natural Science Foundation of China (no. 52266017) and the Major Project of the National Social Science Foundation of China (no. 21&ZD133). This research was also supported by the Xinjiang Natural Science Fund for Distinguished Young Scholars (no. 2021D01E08), the Xinjiang Regional Coordination Special Project-International Science and Technology Cooperation Program (no. 2022E01026), the Xinjiang Major Science and Technology Special Project (nos. 2022401002-2, 2022A01007-1, 2022A01007-4), the Xinjiang Key Research and development Project (no. 2022B03028-2, no. 2022B01033-2, no. 2022B01022-1), the Central Guidance on Local Science and Technology Development Project (no. ZYYD2022C16), the Innovation Team Project of Xinjiang University (500122006021) and High-level Talents Project of Xinjiang University (no. 100521001).

Institutional Review Board Statement

Not applicable.

Informed Consent Statement

Not applicable.

Data Availability Statement

No new data were created.

Conflicts of Interest

The authors declare no conflict of interest.

Nomenclature

C C Cunningham correction factor
C D drag coefficient of particle
d p diameter of dust particle (μm)
D h hydraulic diameter (m)
D T , p thermophoretic coefficient
F B Brownian force (N)
F G gravitation and buoyancy (N)
F S Saffman’s lift (N)
F T thermophoretic force (N)
fFanning friction factor
ggravitational acceleration (m/s2)
kturbulent kinetic energy (m2/s2)
k d average roughness height (mm)
K c Saffman’s lift force coefficient
p ¯ time-averaged pressure (cm)
Re Reynolds number
Re p particle Reynolds number
S the ratio of particle-to-fluid density
S 0 spectral intensity of a Gaussian white noise random process
U mean   air inlet velocity (m/s)
u * friction velocity
u i ¯ time-averaged velocity (m/s)
V d particle deposition velocity
V d + dimensionless particle deposition velocity
u rms streamwise fluctuating velocity of air
v r m s   wall-normal fluctuating velocity of air
w r m s spanwise fluctuating velocity of air
Rkinematic restitution coefficient
y + dimensionless distance from the wall
ε dissipation rate of turbulent kinetic energy
ρ p density of particle (kg/m3)
ρ g density of fluid (kg/m3)
v kinetic viscosity of air
ζ normal distributed random number
vsPoisson’s ratios of the channel wall
vpPoisson’s ratios of the particle
τparticle relaxation time
τ p particle relaxation time (s)
τ p + dimensionless particle relaxation time

References

  1. Tao, W.Q. Numerical Heat Transfer; Xi’an Jiao Tong University Press: Xi’an, China, 2003. [Google Scholar]
  2. He, Y.L.; Han, H.; Tao, W.Q.; Zhang, Y.W. Numerical study of heat-transfer enhancement by punched winglet-type vortex generator arrays in fin-and-tube heat exchangers. Int. J. Heat Mass Transf. 2012, 55, 5449–5458. [Google Scholar] [CrossRef]
  3. Wang, Y.; Liu, Z.; Feng, W.; Zhang, T.; Xing, W. Study of Particulate Fouling Inhibition Characteristics on a Novel Composite Coating. Coatings 2023, 13, 274. [Google Scholar] [CrossRef]
  4. Zhan, F.; Zhuang, D.; Ding, G.; Tang, J. Numerical model of particle deposition on fin surface of heat exchanger. Int. J. Refrig. 2016, 72, 27–40. [Google Scholar] [CrossRef]
  5. Lu, H.; Lu, L.; Jiang, Y. Numerical study of monodispersed particle deposition rates in variable-section ducts with different expanding or contracting ratios. Appl. Therm. Eng. 2017, 110, 150–161. [Google Scholar] [CrossRef]
  6. Ma, J.; Sun, Y.; Li, S. Element Differential Method for Non-Fourier Heat Conduction in the Convective-Radiative Fin with Mixed Boundary Conditions. Coatings 2022, 12, 1862. [Google Scholar] [CrossRef]
  7. Lai, X.; Wang, C.; Peng, D.; Yang, H.; Wei, Z. Analysis of heat transfer characteristics of a heat exchanger based on a lattice filling. Coatings 2021, 11, 1089. [Google Scholar] [CrossRef]
  8. Petrovic, M.; Fukui, K.; Kominami, K. Numerical and experimental performance investigation of a heat exchanger designed using topologically optimized fins. Appl. Therm. Eng. 2023, 218, 119232. [Google Scholar] [CrossRef]
  9. Selvan, M.; Abdul Aziz, M.S.; Salleh, M.A.A.M.; Sharif, N.M.; Khor, C.Y.; Ong, H.P.; Zainol, M.R.R.M.A.; Vizureanu, P.; Burduhos-Nergis, D.-P.; Sandu, A.V. Influence of Fin Thickness on the Thermal Performance and Selection of Coating Method for a Bus Duct Conductor. Coatings 2023, 13, 12. [Google Scholar] [CrossRef]
  10. Ryms, M.; Tesch, K.; Lewandowski, W.M. Optimization of the distance between the vertical plates in the convective air heat exchanger. Int. J. Therm. Sci. 2023, 185, 108064. [Google Scholar] [CrossRef]
  11. Shi, S.; Niu, J.; Wu, Z.; Luo, S.; Gao, X.; Fang, Y.; Zhang, Z. Experimental and numerical investigation on heat transfer enhancement of vertical triplex tube heat exchanger with fractal fins for latent thermal energy storage. Int. J. Heat Mass Transf. 2022, 198, 123386. [Google Scholar] [CrossRef]
  12. Akbarnataj, K.; Hamidpour, M.R.; Shirani, E.; Salimpour, M.R. Optimization of porous finned heat exchanger configuration using the comprehensive performance methodology. Int. Commun. Heat Mass Transf. 2022, 138, 106318. [Google Scholar] [CrossRef]
  13. Firat, I.; Karagoz, S.; Yildirim, O.; Sonmez, F. Experimental investigation of the thermal performance effects of turbulators with different fin angles in a circular pipe. Int. J. Therm. Sci. 2023, 184, 107969. [Google Scholar] [CrossRef]
  14. Han, Q.; Liu, Z.; Li, W. Enhanced thermal performance by spatial chaotic mixing in a saw-like microchannel. Int. J. Therm. Sci. 2023, 186, 108148. [Google Scholar] [CrossRef]
  15. Wang, J.; Fan, Y.; Ge, J.; Liu, X. Effect of streamwise vortex induced by streamwise grooves on drag reduction and heat transfer performance. Int. J. Therm. Sci. 2023, 186, 108117. [Google Scholar] [CrossRef]
  16. Xu, Z.; Han, Z.; Qu, H. Comparison between Lagrangian and Eulerian approaches for prediction of particle deposition in turbulent flows. Powder Technol. 2020, 360, 141–150. [Google Scholar] [CrossRef]
  17. Li, L.; Liu, C.-L.; Li, B.-R.; Zhu, H.-R.; Wu, Z.; Chen, W.-B. Numerical study on particles deposition in the U-bend ribbed passage. J. Heat Transf. 2021, 143, 023002. [Google Scholar] [CrossRef]
  18. Shengnan, C.; Jizu, L.; Peng, W.; Chengzhi, H.; Minli, B. Numerical investigation on the influence of particle deposition on nanofluid turbulent flow and heat transfer characteristics. Int. Commun. Heat Mass Transf. 2021, 126, 105466. [Google Scholar] [CrossRef]
  19. Han, Z.; Xu, Z.; Yu, X.; Sun, A.; Li, Y. Numerical simulation of ash particles deposition in rectangular heat exchange channel. Int. J. Heat Mass Transf. 2019, 136, 767–776. [Google Scholar] [CrossRef]
  20. Awais, M.; Bhuiyan, A.A. Recent advancements in impedance of fouling resistance and particulate depositions in heat exchangers. Int. J. Heat Mass Transf. 2019, 141, 580–603. [Google Scholar] [CrossRef]
  21. Zhan, F.; Ding, G.; Zhuang, D. Numerical model of particle deposition on wet fin surfaces of heat exchanger under dehumidifying conditions. Int. J. Heat Mass Transf. 2020, 149, 119258. [Google Scholar] [CrossRef]
  22. Sajjadi, H.; Salmanzadeh, M.; Ahmadi, G.; Jafari, S. Lattice Boltzmann method and RANS approach for simulation of turbulent flows and particle transport and deposition. Particuology 2017, 30, 62–72. [Google Scholar] [CrossRef]
  23. Kim, S.; Ko, H.S.; Shin, D.H. Fluid flow and heat transfer characteristics of corona wind in cross-cut finned channel. Int. J. Therm. Sci. 2023, 184, 107962. [Google Scholar] [CrossRef]
  24. He, M.-J.; Sun, Y.-S.; Wang, Z.-L.; Wang, B.-X. Micro/Nanomaterials for Heat Transfer, Energy Storage and Conversion. Coatings 2022, 13, 11. [Google Scholar] [CrossRef]
  25. Lu, H.; Quan, Y. A CFD study of particle deposition in three-dimensional heat exchange channel based on an improved deposition model. Int. J. Heat Mass Transf. 2021, 178, 121633. [Google Scholar] [CrossRef]
  26. Yan, L.; Qi, X.; Han, X.; Wang, J.; He, F. Study on the Flow State of Circulating Cooling Water for the Industrial Heat Exchange Tube in the Electromagnetic Anti-Fouling Process. ACS Omega 2021, 6, 28515–28527. [Google Scholar] [CrossRef]
  27. Khizhov, M.; Mironova, L. Evaluation of the Ratio of Heat Exchanging Tube Finning on Heat Exchanger Efficiency. In Proceedings of the MATEC Web of Conferences, Sibiu, Romania, 2–4 June 2021; p. 03028. [Google Scholar]
  28. Won, S.Y.; Ligrani, P. Numerical predictions of flow structure and local Nusselt number ratios along and above dimpled surfaces with different dimple depths in a channel. Numer. Heat Transf. Part A Appl. 2004, 46, 549–570. [Google Scholar] [CrossRef]
  29. Burgess, N.; Ligrani, P. Effects of dimple depth on channel Nusselt numbers and friction factors. J. Heat Transfer. 2005, 127, 839–847. [Google Scholar] [CrossRef]
  30. Kim, K.-Y.; Choi, J.-Y. Shape optimization of a dimpled channel to enhance turbulent heat transfer. Numer. Heat Transf. Part A Appl. 2005, 48, 901–915. [Google Scholar] [CrossRef]
  31. Kim, S.; Lee, Y.J.; Choi, E.Y.; Kwak, J.S. Effect of dimple configuration on heat transfer coefficient in a rotating channel. J. Thermophys. Heat Transf. 2011, 25, 165–172. [Google Scholar] [CrossRef]
  32. Elyyan, M.A.; Rozati, A.; Tafti, D.K. Investigation of dimpled fins for heat transfer enhancement in compact heat exchangers. Int. J. Heat Mass Transf. 2008, 51, 2950–2966. [Google Scholar] [CrossRef]
  33. Lotfi, B.; Sundén, B. Thermo-hydraulic performance enhancement of finned elliptical tube heat exchangers by utilizing innovative dimple turbulators. Heat Transf. Eng. 2020, 41, 1117–1142. [Google Scholar] [CrossRef]
  34. Chang, S.W.; Chiou, S.F.; Chang, S.F. Heat transfer of impinging jet array over concave-dimpled surface with applications to cooling of electronic chipsets. Exp. Therm. Fluid Sci. 2007, 31, 625–640. [Google Scholar] [CrossRef]
  35. Kim, H.-M.; Moon, M.-A.; Kim, K.-Y. Multi-objective optimization of a cooling channel with staggered elliptic dimples. Energy 2011, 36, 3419–3428. [Google Scholar] [CrossRef]
  36. Tian, L.; Ahmadi, G. Particle deposition in turbulent duct flows—Comparisons of different model predictions. J. Aerosol Sci. 2007, 38, 377–397. [Google Scholar] [CrossRef]
  37. Gao, N.; Niu, J.; He, Q.; Zhu, T.; Wu, J. Using RANS turbulence models and Lagrangian approach to predict particle deposition in turbulent channel flows. Build. Environ. 2012, 48, 206–214. [Google Scholar] [CrossRef]
  38. FLUENT Incorporation FLUENT User’s Guide; FLUENT Incorporated: Lebanon, NH, USA, 2021.
  39. Zhao, B.; Wu, J. Modeling particle deposition onto rough walls in ventilation duct. Atmos. Environ. 2006, 40, 6918–6927. [Google Scholar] [CrossRef]
  40. Huang, Z.; Wang, H.; Zhou, Q.; Li, T. Effects of granular temperature on inter-phase drag in gas-solid flows. Powder Technol. 2017, 321, 435–443. [Google Scholar] [CrossRef]
  41. Ueda, Y.; Nakajima, T.; Iguchi, M. Random Walk of a Particle Due to Brownian Force by a Two-Dimensional Vortex Particle Method (Implementation of a PSE Method). J. Jpn. Soc. Exp. Mech. 2012, 12, 213–219. [Google Scholar]
  42. AlQdah, K.S.; Khan, N.M.; Bacha, H.B.; Chung, J.-D.; Shah, N.A. Marangoni convection of dust particles in the boundary layer of Maxwell nanofluids with varying surface tension and viscosity. Coatings 2021, 11, 1072. [Google Scholar] [CrossRef]
  43. Zhang, S.; Bogy, D.B. Effects of lift on the motion of particles in the recessed regions of a slider. Phys. Fluids 1997, 9, 1265–1272. [Google Scholar] [CrossRef]
  44. Montassier, N.; Boulaud, D.; Renoux, A. Thermophoretic effect of particle deposition in laminar tube flow. J. Aerosol Sci. 1991, 22, S207–S210. [Google Scholar] [CrossRef]
  45. Zhang, Z.; Chen, Q. Prediction of particle deposition onto indoor surfaces by CFD with a modified Lagrangian method. Atmos. Environ. 2009, 43, 319–328. [Google Scholar] [CrossRef]
  46. Kim, J.; Moin, P.; Moser, R. Turbulence statistics in fully developed channel flow at low Reynolds number. J. Fluid Mech. 1987, 177, 133–166. [Google Scholar] [CrossRef]
  47. Brach, R.M.; Dunn, P.F. A mathematical model of the impact and adhesion of microsphers. Aerosol Sci. Technol. 1992, 16, 51–64. [Google Scholar] [CrossRef]
  48. Johnson, K.L.; Kendall, K.; Roberts, A. Surface energy and the contact of elastic solids. Proc. R. Soc. Lond. A Math. Phys. Sci. 1971, 324, 301–313. [Google Scholar]
  49. Han, Z.; Xu, Z.; Sun, A.; Yu, X. The deposition characteristics of micron particles in heat exchange pipelines. Appl. Therm. Eng. 2019, 158, 113732. [Google Scholar] [CrossRef]
  50. El-Shobokshy, M. Experimental measurements of aerosol deposition to smooth and rough surfaces. Atmos. Environ. 1983, 17, 639–644. [Google Scholar] [CrossRef]
  51. Lu, H.; Zhao, W. Numerical study of particle deposition in turbulent duct flow with a forward-or backward-facing step. Fuel 2018, 234, 189–198. [Google Scholar] [CrossRef]
  52. Lu, H.; Lu, L.; Jiang, Y. Numerical simulation of particle deposition in duct air flows with uniform, expanding or contracting cross-section. Energy Build. 2016, 128, 867–875. [Google Scholar] [CrossRef]
  53. Lu, H.; Lu, L. Numerical investigation on particle deposition enhancement in duct air flow by ribbed wall. Build. Environ. 2015, 85, 61–72. [Google Scholar] [CrossRef]
  54. Wang, M.; Liu, J.; Wang, X.; Yan, X.; Yao, L.; Yue, Q. Automatic determination of coupling time step and region in unresolved DEM-CFD. Powder Technol. 2022, 400, 117267. [Google Scholar] [CrossRef]
  55. Yerry, M.A.; Shephard, M.S. Automatic three-dimensional mesh generation by the modified-octree technique. Int. J. Numer. Methods Eng. 1984, 20, 1965–1990. [Google Scholar] [CrossRef]
  56. Liu, B.Y.; Agarwal, J.K. Experimental observation of aerosol deposition in turbulent flow. J. Aerosol Sci. 1974, 5, 145–155. [Google Scholar] [CrossRef]
  57. Friedlander, S.; Johnstone, H. Deposition of suspended particles from turbulent gas streams. Ind. Eng. Chem. 1957, 49, 1151–1156. [Google Scholar] [CrossRef]
  58. Hunt, J.C.; Wray, A.A.; Moin, P. Eddies, streams, and convergence zones in turbulent flows. In Studying Turbulence Using Numerical Simulation Databases, 2. In Proceedings of the 1988 Summer Program, Seoul, Republic of Korea, 17 September–2 October 1988. [Google Scholar]
  59. Lu, J.; Qian, Z.; Lee, Y.-H. Numerical investigation of unsteady characteristics of a pump turbine under runaway condition. Renew. Energy 2021, 169, 905–924. [Google Scholar] [CrossRef]
  60. Koulali, A.; Abderrahmane, A.; Jamshed, W.; Hussain, S.M.; Nisar, K.S.; Abdel-Aty, A.-H.; Yahia, I.S.; Eid, M.R. Comparative study on effects of thermal gradient direction on heat exchange between a pure fluid and a nanofluid: Employing finite volume method. Coatings 2021, 11, 1481. [Google Scholar] [CrossRef]
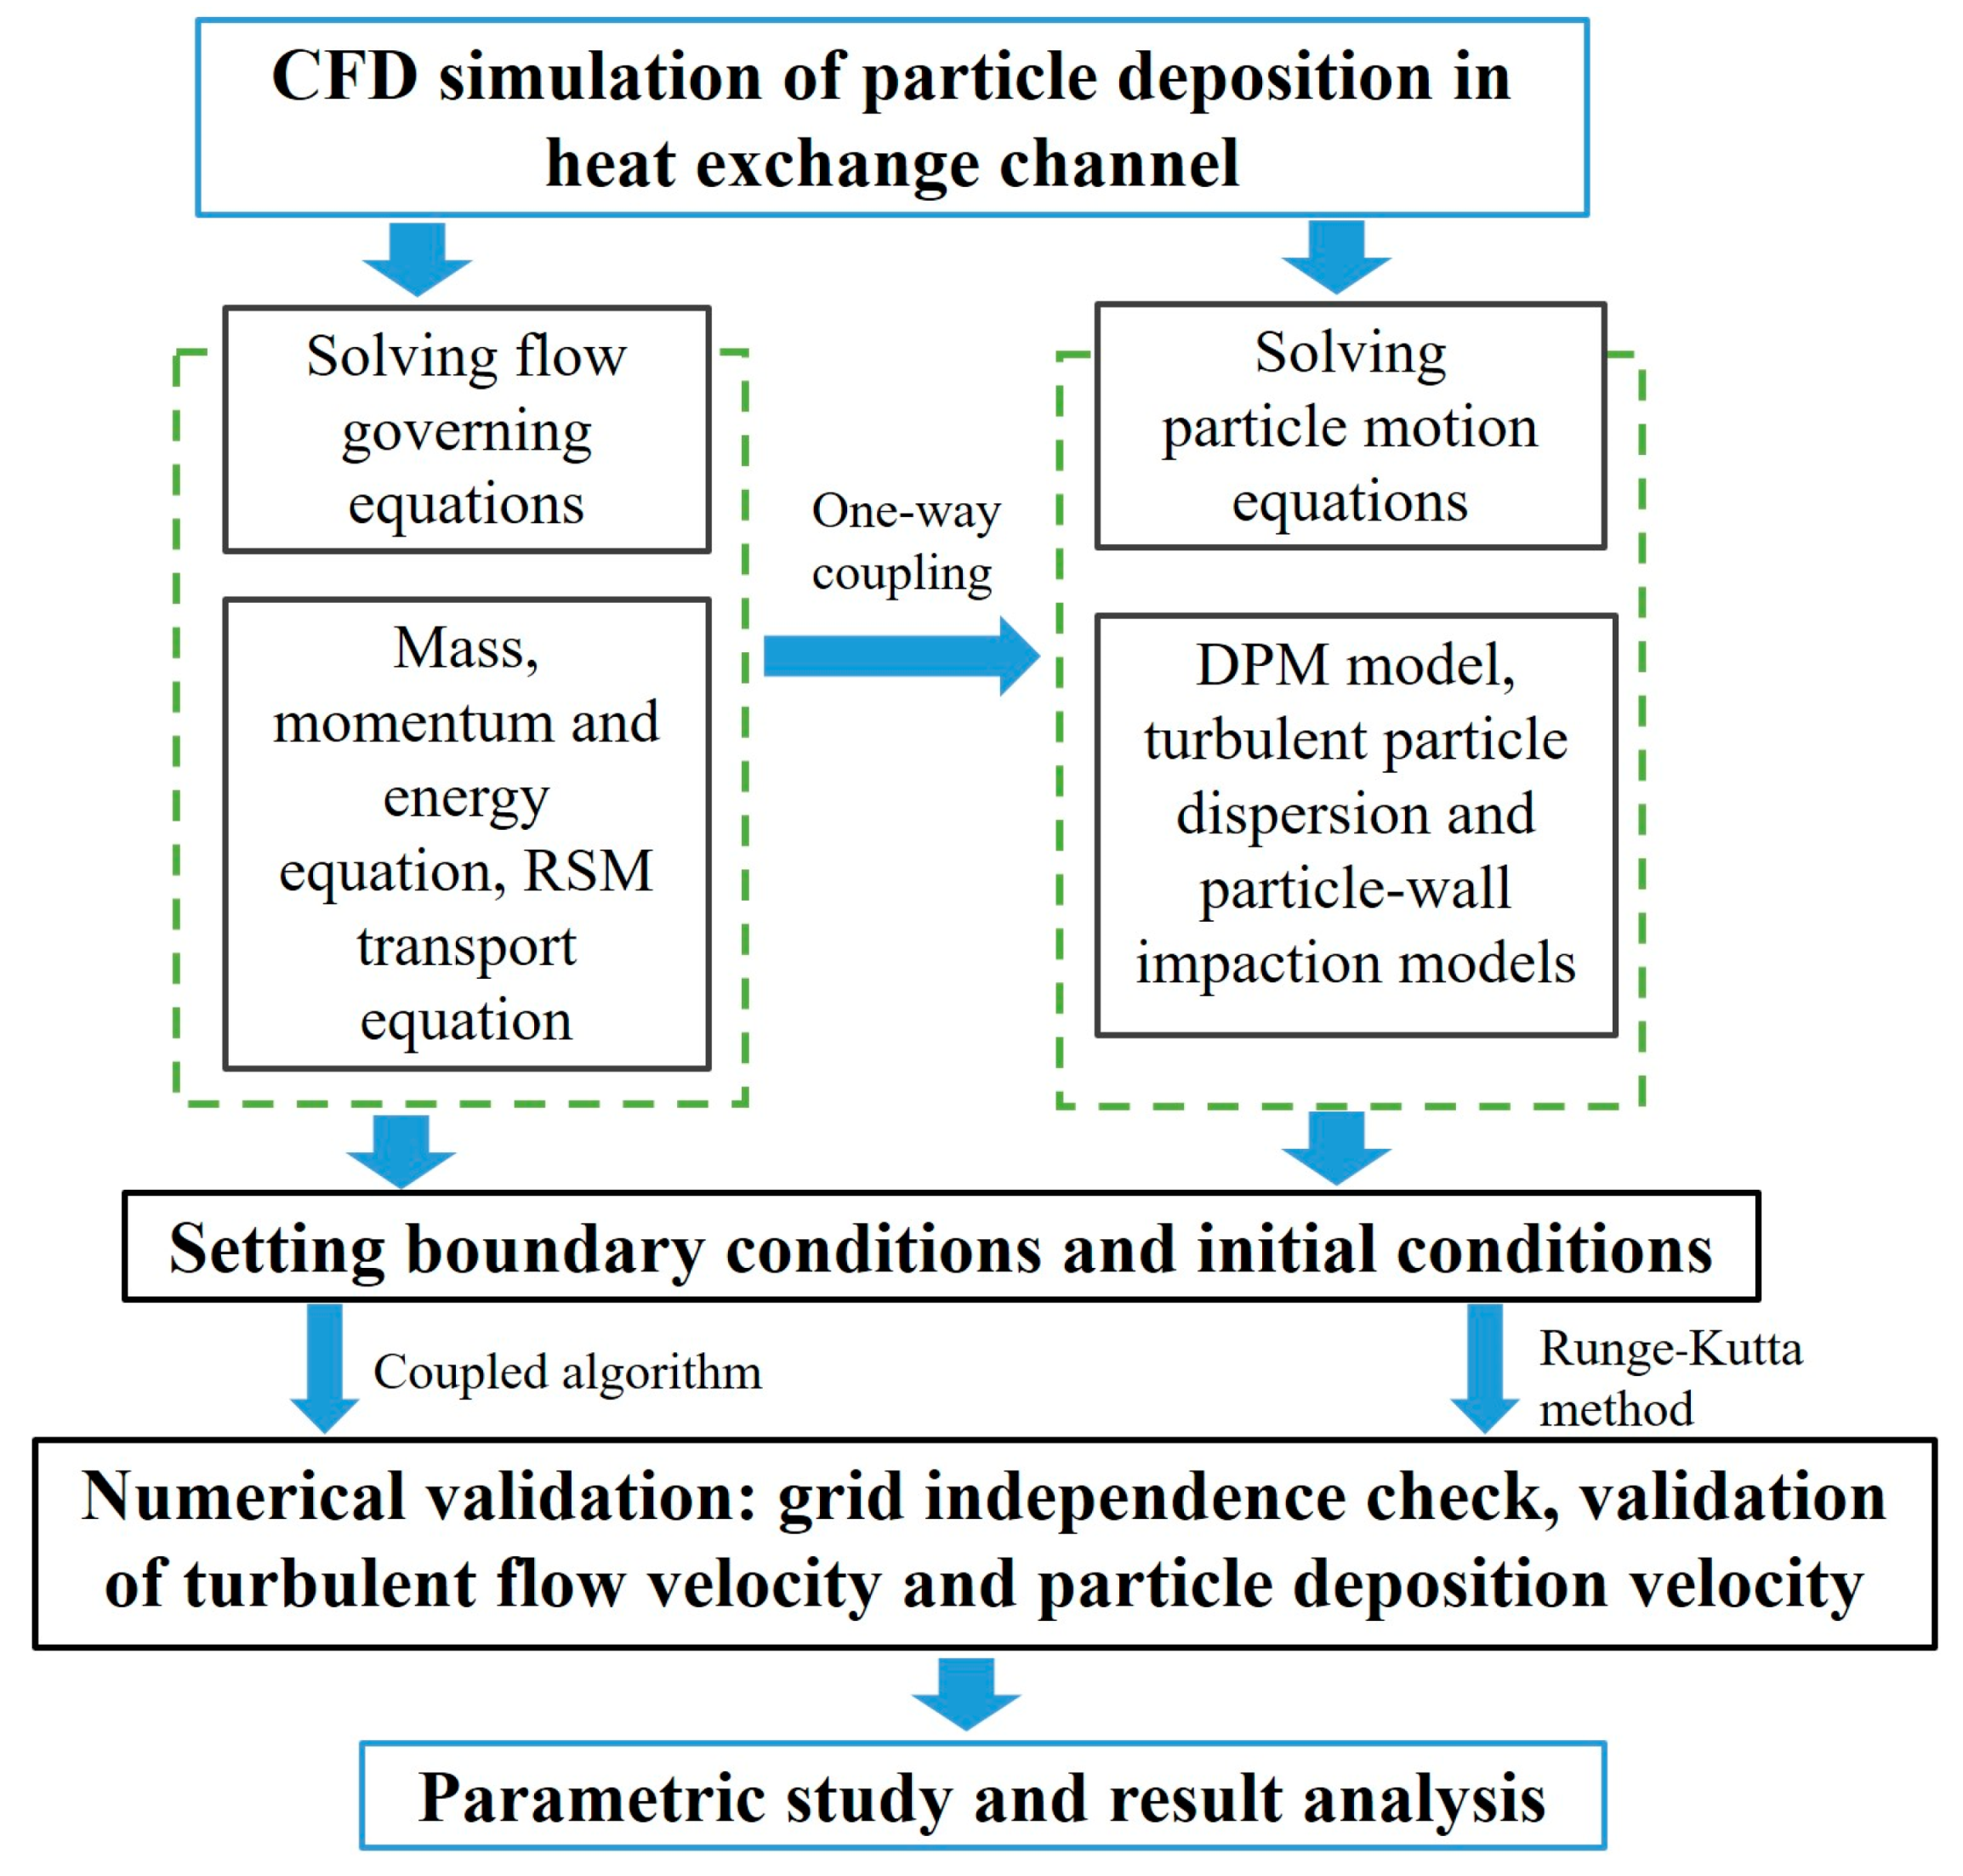
Figure 1. CFD simulation process.
Coatings 13 00900 g001
Figure 2. Three-dimensional diagram of a convex-dimple channel’s particle deposition.
Coatings 13 00900 g002
Figure 3. Structural mesh of three-dimensional ribbed channels with convex dimples: (a) structural mesh of convex-dimple channel, (b) entrance structure grid, and (c) convex dimples’ structure grid.
Coatings 13 00900 g003aCoatings 13 00900 g003b
Figure 4. Grid-independence verification diagram.
Coatings 13 00900 g004
Figure 5. Verification of flow velocity in smooth channel [46].
Coatings 13 00900 g005
Figure 6. Verification of dimensionless deposition velocity and relaxation time of particles in smooth channels [50,56,57].
Coatings 13 00900 g006
Figure 7. Distributions of lumps of the iso-surface of the Q-criterion, Q = 100,000.
Coatings 13 00900 g007
Figure 8. Contour fluctuation velocity plots in the XY plane at Z = 0.005 m for different h/D and p/h conditions, (a) Convex dimples h/D = 0.1, p/h = 5, (b) Convex dimples h/D = 0.15, p/h = 3, (c) Convex dimples h/D = 0.15, p/h = 5, (d) Convex dimples h/D = 0.15, p/h = 7.
Coatings 13 00900 g008aCoatings 13 00900 g008b
Figure 9. Turbulence structure and TKE distribution in convex dimples at different h/D’s and p/h’s: (a) convex dimples with h/D = 0.1, p/h = 5; (b) convex dimples with h/D = 0.15, p/h = 3; (c) convex dimples with h/D = 0.15, p/h = 5; (d) convex dimples h/D = 0.15, p/h = 7.
Coatings 13 00900 g009
Figure 10. Temperature field and velocity vector in YZ plane of convex dimples at different h/D’s: (a) convex dimples h/D = 0.1, p/h = 5; (b) convex dimples with h/D = 0.15, p/h = 3; (c) convex dimples with h/D = 0.15, p/h = 5; (d) convex dimples with h/D = 0.15, p/h = 7.
Coatings 13 00900 g010
Figure 11. Wall function heat transfer coefficient and three-dimensional flow line diagram.
Coatings 13 00900 g011
Figure 12. Velocity field in the XY plane at Z = 0.005 m in a channel with convex dimples with h/D = 0.15 and p/h = 5 at different airflow velocities (a) U = 4 m/s and (b) U = 6 m/s.
Coatings 13 00900 g012
Figure 13. YZ plane temperature field and velocity vector at different air velocities (a) U = 4 m/s and (b) U = 6 m/s, for a channel with convex dimples with h/D = 0.15, p/h = 5.
Coatings 13 00900 g013
Figure 14. Convex dimples and smooth channel particle trajectory distribution map: (a) smooth empty channel, (b) convex-dimple channel.
Coatings 13 00900 g014
Figure 15. Deposition of 1 μm particles in convex-dimple channels at different h/D’s and p/h’s: (a) convex dimples with h/D = 0.1, p/h = 5; (b) convex dimples with h/D = 0.15, p/h = 3; (c) convex dimples with h/D = 0.15, p/h = 5; (d) convex dimples with h/D = 0.15, p/h = 7.
Coatings 13 00900 g015aCoatings 13 00900 g015b
Figure 16. Deposition of 5 μm particles in convex-dimple channels at different h/D’s and p/h’s: (a) convex dimples with h/D = 0.1, p/h = 5; (b) convex dimples with h/D = 0.15, p/h = 3; (c) convex dimples with h/D = 0.15, p/h = 5; (d) convex dimples with h/D = 0.15, p/h = 7.
Coatings 13 00900 g016
Figure 17. Deposition of 30 μm particles in convex-dimple channels at different h/D’s and p/h’s: (a) convex dimples with h/D = 0.1, p/h = 5; (b) convex dimples with h/D = 0.15, p/h = 3; (c) convex dimples with h/D = 0.15, p/h = 5; (d) convex dimples with h/D = 0.15, p/h = 7.
Coatings 13 00900 g017
Figure 18. Deposition of particles with different particle sizes at different speeds in convex-dimple channels with h/D = 0.15, p/h = 5: (a) U = 4 m/s, dp = 1 μm, (b) U = 6 m/s, dp = 1 μm, (c) U = 4 m/s, dp = 5 μm, (d) U = 6 m/s, dp = 5 μm, (e) U = 4 m/s, dp = 30 μm, (f) U = 6 m/s, dp = 30 μm.
Coatings 13 00900 g018
Figure 19. Comparison of the deposition rate in a channel with and without convex dimples.
Coatings 13 00900 g019
Figure 20. Comparison of deposition rates of convex dimples with different vortex depth ratios.
Coatings 13 00900 g020
Figure 21. Comparison of deposition rates of convex dimples with different depth–width ratios.
Coatings 13 00900 g021
Figure 22. Comparison of the deposition rate of convex dimples at different air velocities.
Coatings 13 00900 g022
Table 1. Simulation cases.
Case no.Air Velocity (m/s)Particle Diameter (μm)Vortex Height RatioVortex Width Ratio
A. smooth6 m/s1, 3, 5, 10, 20, 30, 40, 50
B. rough4 or 6 m/s1, 3, 5, 10, 20, 30, 40, 503, 5, 70.1, 0.15
Disclaimer/Publisher’s Note: The statements, opinions and data contained in all publications are solely those of the individual author(s) and contributor(s) and not of MDPI and/or the editor(s). MDPI and/or the editor(s) disclaim responsibility for any injury to people or property resulting from any ideas, methods, instructions or products referred to in the content.