Abstract
The present work attempted to produce thick zirconia coatings formed by micro-arc oxidation as a hydrogen permeation barrier on zirconium hydride alloy. A novel multiphase zirconia coating was achieved, exhibiting superior hydrogen permeation barrier performance. The growth dynamics, formation mechanism, and phase evolution behavior of thick zirconia coatings were explored, and the hydrogen permeation barrier performance was evaluated by means of vacuum dehydrogenation experiment. The hydrogen desorption quantity was monitored by analyzing pressure changes with a quadruple mass spectrometer (QMS). Experimental results show that the multiphase coatings were composed of monoclinic ZrO2 (m-ZrO2), tetragonal ZrO2 (t-ZrO2), and a trace of cubic ZrO2 (c-ZrO2). The coatings were generally divided into a dense and uniform inner, intermediate layer, and a porous top layer. The quantitative analysis indicates an increased amount of m-ZrO2 toward the coating surface and an increased amount of t-ZrO2 toward the oxide/metal interface. This novel multiphase thick zirconia coating can noticeably improve hydrogen permeation resistance, and the permeation reduction factor (PRF) value is improved by nearly 13 times compared with bare zirconium hydride. It is demonstrated that hydrogen desorption is retarded to some extent in the presence of thick zirconia coating. Hydrogen desorption of the sample with ceramic coating started at 660 °C, which was apparently higher than that of the sample without coating.
1. Introduction
Zirconium hydride alloys are considered to be prominent candidate materials as neutron moderators for application to nuclear reactors, because of their high hydrogen storage capacity ((H/Zr) at. > 1.5), relatively low thermal neutron absorption cross-section, and highly negative moderator temperature coefficient (MTC) of reactivity [1,2,3]. However, the thermal induced hydrogen loss of zirconium hydride alloys at the service temperature (~650 °C) is one of the major obstacles that hinder their further operating efficiency and service life [4,5]. Consequently, it is imperative to produce protective coatings on the surface of zirconium hydride as a hydrogen permeation barrier. Ceramic-based permeation barriers, such as oxide [4,5,6,7], carbide [8], nitride [9,10], etc., have been extensively researched to suppress tritium or hydrogen permeation in fusion reactor systems due to their economic advantages and promising barrier effects. Among these materials, zirconia-based ceramics appear to be the most promising candidates for the application of a hydrogen permeation barrier of zirconium hydride alloys, due to their impressive intrinsic properties of low neutron absorption coefficient [11], high chemical stability [12], low thermal conductivity, high thermal resistance [13], etc. Moreover, it is well established that the thermal expansion coefficient of zirconia closely matches that of the zirconium hydride substrate, which renders it a preferable substance for protective coating applications in harsh environments including aggressive media, high temperatures, and radiation exposure.
To the best of the authors’ knowledge, previous research on the generation of hydrogen permeation barrier of zirconium hydride has focused mainly on the sol-gel method, slurry coating, and direct oxidation in oxygen and/or carbon dioxide [10,14,15]. However, it is difficult to generate a compact and intact coating by these methods due to the volatilization of solvent during drying processes and cracking caused by different thermal expansion between coating materials and substrate metals during subsequent heat treatments. Therefore, it is essential to explore alternative methods for the fabrication of hydrogen permeation barriers. Micro-arc oxidation (MAO) has been regarded as an expeditious process for the fabrication of zirconia coating on the surface of zirconium alloy, and is characterized by high productivity, cost-effectiveness, room-temperature operation, environmental friendliness, and high geometric adaptability [16,17,18]. Furthermore, the MAO process essentially combines electrochemical oxidation with a high-voltage spark discharge treatment, and thus it is able to deposit coatings exhibiting superb adhesion and a wide range of thicknesses [19,20]. In this study, thick zirconia coatings as a hydrogen permeation barrier were produced by MAO on zirconium hydride alloy. The growth dynamics, formation mechanisms and phase evolution behavior of thick zirconia coatings were comprehensively investigated to provide fundamental information for developing hydrogen barrier coatings with designed properties. Especially, the hydrogen permeation barrier property was experimentally evaluated and the hydrogen permeation behavior was detected. This provides a better understanding of thick zirconia coating produced by the MAO method and its feasibility for application as a hydrogen permeation barrier.
2. Materials and Methods
Disc-shaped (2 mm-thick and 10 mm-dia.) zirconium hydride alloy discs were used in this study. Prior to the MAO process treatment, all samples were ground and polished using 400, 600, 1200, and 1500 grit SiC abrasive papers serially for 120 s under running water, then cleaned in acetone, agitated ultrasonically, and rinsed in deionized water. The zirconia coatings were fabricated by employing a pulsed bi-polar electrical source (WHD-30). The zirconium hydride alloy discs were used as working electrodes and the counter-electrode was a stainless-steel cube-shaped container. The electric-motor-driven stirring and water-cooling systems were equipped to maintain the electrolyte temperature below 40 °C during the MAO process. Following up on our previous work [21], based on the optimization of electrolyte composition, the present work selected a phosphate-based electrolyte composed of 16 gL−1 Na5P3O10, 1.5 gL−1 NaOH, and 2 gL−1 Na2EDTA, which was prepared from deionized water and analytical grade reagent. Based on comprehensively optimized experimental conditions employing an L16(44) orthogonal array described in our earlier work [22], in the experiments, both electrodes were connected to a pulsed AC power supply, operating under a constant voltage control function at a frequency of 200 Hz, 25 min treatment time, 150 V negative voltage, and 380 V positive voltage, respectively. In particular, the duty cycle of the pulse was 40%. I positive and negative output current pulses are presented as a typical differential wave shape, and the positive and negative voltage waveforms are rectangular shapes, as shown in Figure 1.
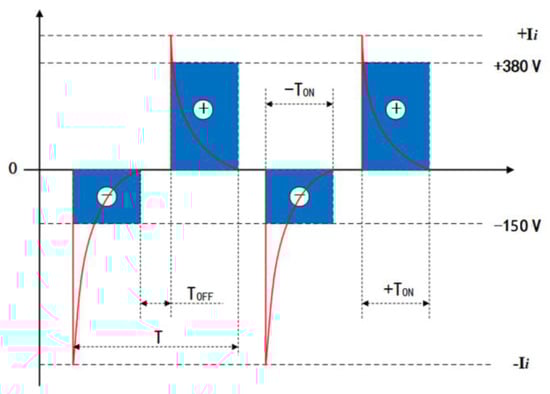
Figure 1.
Typical bipolar voltage and current vs. time waveform diagrams of the MAO power source. T, TON and TOFF are the pulse period, pulse on time and pulse off time, respectively.
The coating morphology was examined by secondary electron-gun scanning electron microscopy (SEM) with a 10 μm defocused beam at a current of 5 nA and an accelerating voltage of 10–15 kV, using a HITACHI-S3400 instrument equipped with energy spectrometry (EDS) analysis facilities. The measurement of coating thickness was approached by using an HCC-25 eddy current thickness gauge and was further confirmed by SEM imaging with cross-section analysis. The phase composition was investigated by X-ray diffraction (XRD) with Cu Kα radiation (λ = 1.5418 Å) for 2θ between 20° and 80°, using APD-10 automatic powder diffraction by PHILIPS (parameters: current: 35 mA, voltage: 40 kV, step-scan speed: 0.02°). In order to obtain the phase compositions of the intermediate and bottom layers of the MAO coating, the surface/top layer was removed layer-by layer using silicon carbide abrasive paper, and the layer thickness was controlled with the aid of an optical microscope. The relative volume fractions of t-ZrO2 and m-ZrO2 were calculated according to the following equation [23]:
where Xt is the integrated intensity ratio for a monoclinic peak given by:
where It (101) refers to the integral intensity of the tetragonal diffraction peak, Im (11) and Im (111) to the integral intensity of monoclinic diffraction peaks. Vm and Vt refer to the volume fractions of m-ZrO2 and t-ZrO2 phases, respectively.
The hydrogen desorption properties were assessed in a vacuum furnace by means of vacuum dehydrogenation experiment. The specimens were heated to dehydrogenation temperature of 600 °C under vacuum (1.0 × 10⁻⁴ Pa) for 10 h. More details on the dehydrogenation permeation apparatus and the experimental procedure can be found in our previous work [24]. The ability of ceramic coatings to reduce hydrogen permeation was evaluated by the parameter of permeation reduction factor, PRF value, which can be roughly calculated according to the following equation:
where Q0 is the ratio of hydrogen loss of bare zirconium hydride to total hydrogen mass and Qi is the ratio of hydrogen loss of ZrO2-coated zirconium hydride to total hydrogen mass of specimens during the vacuum dehydrogenation experiment. The desorption quantity of hydrogen was monitored by quadruple mass spectrometer (QMS). Electrochemical impedance spectra (EIS) were recorded using an electrochemical workstation (IM6E, ZAHNER, Kronach, Germany) with a three-electrode system by applying a sinusoidal potential of 5 mV and frequency range between 100 kHz and 100 mHz.
3. Results and Discussion
3.1. Growth Kinetics of the Thick Zirconia Coating
It is vital to investigate the growth kinetics of thick zirconia coating on zirconium hydride deposited by the MAO process, and the parabolic regularity of the growth process was established with the aim of predicting the growth behavior of the MAO coating. The experimental data of the real-time response of the coating thickness to the treating time are presented in Figure 2. From a mathematical point of view, the multi-stage regression–estimation model is formulated as: (i) Stage I: , (ii) Stage II: , and (iii) Stage III: . Generally, the growth process of MAO coating can be divided into three stages based on the fitted curve: (Stage I: 0–15 min) an initial period of relatively rapid linear thickness rise, (Stage II: 15–25 min) followed by a more extensive region in which the coating thickness increases following a quadratic parabola trend until (Stage III: 25–30 min) the treatment termination.

Figure 2.
The responses of coating thickness to treating time during the MAO process under the constant voltage mode in Na5P3O10 electrolyte.
In electrochemical terms, the deposition mechanism of zirconia coating growth can be described as follows:
During stage I, the coating thickness increases linearly at a constant rate. At the initial stage, the zirconium hydride alloy substrate dissolves at first and loses its metal brightness due to the process described in Equation (5). Subsequently, a thin barrier coating is formed on the alloy surface through the traditional anodizing stage, which is essentially the prerequisite for MAO being able to proceed in consideration of the electrical aspect [25]. Subsequently, the micro-arcs are induced by the dielectric breakdown of the ZrO2 coating on the surface of the zirconium hydride alloys. Figure 3 presents the current–time responses of anodic and cathodic current during the MAO process under the constant voltage mode.
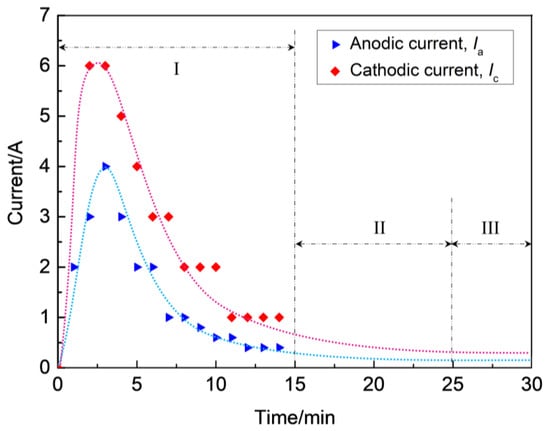
Figure 3.
Current–time responses of anodic and cathodic current during MAO process under the constant voltage mode.
As soon as the applied voltage exceeded the dielectric breakdown voltage of the oxide under constant voltage mode, discharge breakdown sequentially occured at the thinner or weaker spots on the substrate, where the maximum feedback currents of anodic (Ia) and cathodic (Ic) reached up to 4 A and 6 A, respectively. However, with the increase of coating thickness, the electric field between anode and cathode became weaker where the Ia and Ic decreased from maximums of 4 A and 6 A to about 0.5 A and 1.0 A, respectively, and the process subsequently entered into stage II, as shown in Figure 3. As a result, the occurrence of dielectric breakdown was hindered, which resulted in the decrease of coating growth rate (~0.3 μm/min), as observed in stage II (see Figure 2). As the breakdown voltage asymptotically approached the applied voltage level, the anodic and cathodic feedback currents approached the zero level, the process entered stage III, and the slope of the curve δ = f(t) was found to be smaller than in stage II (see Figure 2). In this stage, a coating growth mode with dynamic equilibrium of oxide dissolution and oxygen evolution was spontaneously established, causing a characteristic limiting thickness. According to the above analysis, the discharges have a profound effect on the growth process of ZrO2 coating, hence they affect the compactness and thickness of the coatings on zirconium hydride alloys. In Refs. [26,27], it has been proposed that variations in the shape of the bipolar voltage or current waveform, namely its amplitude and/or frequency, largely govern the occurrence of discharges. Consequently, coating growth occurs mainly at stages I and II, and the micro discharge channels are sealed due to the discharge or spark energy of stage III. Thus, stage III is the dominant stage for the improvement of coating compactness favorable for promoting the ability to reduce hydrogen permeation.
3.2. Microstructure of the Thick Zirconia Coating
Figure 4 illustrates the surface and cross-section morphology of the zirconia thick coating. The micron-sized mic-pores and stripe-shaped granulated molten oxides were randomly distributed on the surface of coated samples (marked by arrows 1 and 2 in Figure 4a). As observed in Figure 4b, the coating exhibited a relatively low pore density and there was almost an absence of flaws such as micro-cracks, coating peel-off, etc.
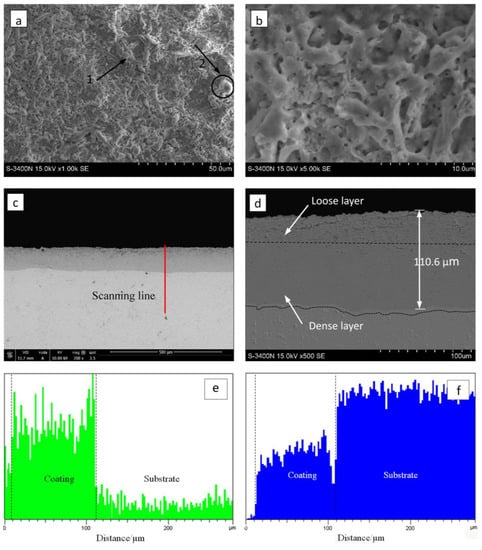
Figure 4.
Surface and cross-section morphology of the optimized MAO coating formed in the Na5P3O10 electrolyte on the surface of zirconium hydride: (a) surface morphology; (b) magnified image of (a); (c) cross-section morphology; (d) magnified image of (c). Cross-sectional element distributions I (e) O and (f) Zr.
It is worth noting that the MAO coating characteristics depended strongly on the discharging nature involved in the MAO mechanism [28]. As the strong discharges take place, the local temperature and pressure inside the discharge channels can reach up to 103–104 K and 102–103 MPa, respectively [29]. In this case, the molten mass produced by electric avalanches erupted from the discharge channel, then it rapidly solidified around the discharge channels, thus contributing to the appearance of stripe-shaped and granulated features and the randomly arranged discharge pores on the coating surface. Figure 4c,d shows the cross-section SEM micrographs of the zirconia thick coating. As shown in Figure 4c, the coating has a homogeneous thickness of approximately 110 µm, and there is no evidence of any discontinuity at the coating–substrate interface. As shown in Figure 4c,d, the oxide coating with no local detachment indicates good adherence of the coating to the substrate. The coating–substrate interface has a wavy-jagged appearance, which may be due to the dissolution of the substrate during the treatment time. Generally, the coating is composed of an inner, intermediate layer and a porous top layer. It can be clearly observed that the inner layer is compact and tightly connected with the substrate, the top layer is lightly porous, and there is no obvious borderline between the inner, intermediate, and top layers.
3.3. Phase Evolution Behavior of the Thick Zirconia Coating
Combining the results from XRD of coating synthesized under constant voltage mode (Figure 5) and EDS on coating cross-sections (Figure 4e,f) afforded a semi-quantitative evaluation of the coating’s phase constitutions. The curves of (a)–(c) presented in Figure 5 show the XRD patterns of the top layer, intermediate layer, and bottom layer, respectively. As can be seen, the coating formed on the zirconium hydride alloys consisted of a mixture of m-ZrO2, t-ZrO2, and a trace of c-ZrO2. The curve (a) in Figure 5 shows the XRD patterns of the top layer, where the predominant phase is related to m-ZrO2 (69.3 vol%) followed by t-ZrO2 (30.7 vol%) and a trace of c-ZrO2. In this curve, the strongest (101) peak of t-ZrO2 is located at 2θ = 30.259. The curves (b) and (c) in Figure 5 present the XRD patterns of the intermediate and bottom layers, where the relative intensity of the (101) peak (2θ = 30.248) of t-ZrO2 dramatically decreases compared with the top layer. The curve (c) in Figure 5 shows the XRD patterns of the bottom layer, where the predominant phase is m-ZrO2, exhibiting a strong (101) peak (2θ =32.470) corresponding to zirconium hydride substrate. Note that a larger quantity of m-ZrO2 (~91.0 vol%) and a smaller amount of t-ZrO2 (~9.0 vol%) are present in the intermediate and bottom layers compared with the top layer. In addition, the surface of the coating presents a stronger background noise when compared with the intermediate and bottom layers, due to the reduced crystallinity and grain-size effects of surface ZrO2 induced by the electrolyte quenching.
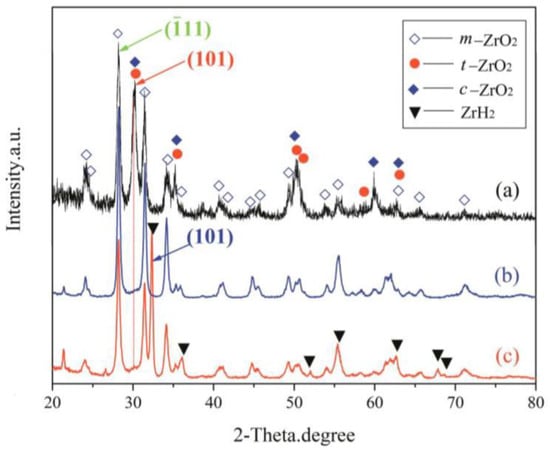
Figure 5.
XRD patterns of different layers of the optimized MAO coating formed in the Na5P3O10 electrolyte on the surface of zirconium hydride: (a) top layer; (b) intermediate layer; (c) bottom layer.
The patterns reveal that no other element was detected other than O and Zr, which supports the conclusion that the coating consisted of a zirconia mixture. The EDS analysis indicates that the Zr and O elements almost exhibited a graded distribution within the coating. The concentration of O content decreased from the surface to the substrate. However, the Zr element distribution displayed an opposite trend compared with the O element, as presented in Figure 4e,f. Here, note that no P-containing phases were detected in the XRD patterns and EDS analysis. The possible underlying reasons for the absence of P-containing phases can be ascribed to the following aspects: (1) the triphosphate P3O105− can hardly enter into the dense layer though micro-arc discharge channels, (2) the zirconium phosphate is formed as an intermediate product that is unstable and easy to decompose at high temperatures during the micro-arc discharge process. These results are similar to those found in previous studies by Durdu [30] and Ji [31]. Nevertheless, we have demonstrated in previous work that the coating fabricated in phosphate electrolyte is more compact and has smaller pore size than that of silicate electrolyte [21]. The average nano-grain size (D) and lattice strain (ε) of zirconia crystal formed by MAO were estimated by employing the Williamson–Hall (W-H) equation [32]:
where k = 1.0, λ is the X-ray wavelength, and λ(CuKα2) = 1.541 Å, β is the full width half maximum of the diffracted peaks, and θ is the diffraction angle. As a result, by plotting the βcosθ versus 4sinθ and obtaining the optimal line equation, accordingly, the slope and y-intersect of the fitted line represent strain and particle size, respectively, as presented in Figure 6. For comparI, the average grain size was calculated from the full-width at half-maximum (FWHM) of the diffraction peaks using the Debye–Scherrer’s formula [32]:
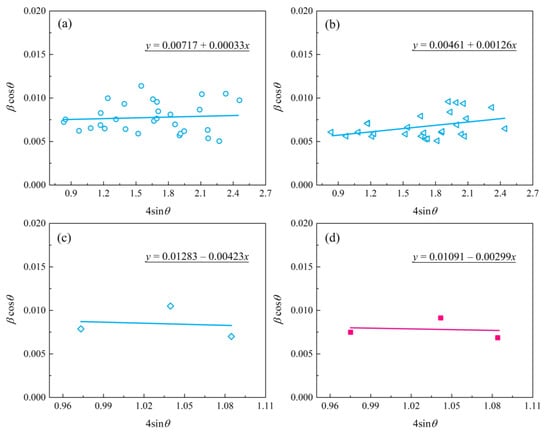
Figure 6.
The plot of βcosƟ versus 4sinƟ for zirconia nano-grain MAO coatings: (a) bottom layer; (b) intermediate layer; (c) top layer; (d) top layer of coated sample treated with post-vacuum dehydrogenation.
Table 1 summarizes the grain size (D) and lattice strain (ε) of zirconia crystal from the top, intermediate, and bottom layers of the MAO coating. In general, the grain size parameters calculated using the Debye–Scherrer method were in agreement with the results obtained by the W-H method. In regard to Figure 6c,d, the deviation was mainly due to the limited data obtained from the XRD patterns with stronger background noise, as shown in Figure 5a. The data in Table 1 indicate that both the top and near-bottom layers appear to possess a smaller grain size (~20 nm) compared with the intermediate layer (~30 nm). In addition, the slopes of the fitted trendlines in Figure 2c,d are negative, indicating the existence of compressive strain in the lattice of the top layer of MAO coating. Instead, tensile stresses were present in both the bottom and intermediate layers. Especially, the bottom layer had the lowest lattice strain, implying a low-stress interface between the MAO coating and the zirconium hydride. The compressive strain in the lattice of the top layer is mainly ascribed to the volumetric expansion effect induced by the porous structure and t→m phase transformation of zirconia in the top layer.

Table 1.
The grain size (D) and lattice strain (ε) of zirconia crystal of MAO coatings.
In the foregoing results, we have clearly established that the almost 100-μm-thick dense ceramic coating consists of a zirconia mixture and exhibits a variable phase composition and grain size in the through-thickness direction. As discussed above, the trends suggest an increased amount of m-ZrO2 toward the coating surface and an increased amount of t-ZrO2 toward the inner parts of the relatively thick coating. A similar phase distribution has been proposed for an MAO-coated zircaloy-4 alloy [33]. It is well known that m-ZrO2 is a stable phase of zirconia, and t-ZrO2 is one of the metastable phases. During the MAO process, the temperature inside the pores elevates to ~104 K due to the high-energy electron avalanches, and this temperature is high enough to sinter the growing coating, which results in the formation of molten zirconia. The distribution of temperature field in the coating plays a key role in the transformation of phases. As described in Ref. [34], the transition temperature of tetragonal zirconia is affected by the electrolyte cooling rate. The obtained results in Ref. [35] indicate that inward growth plays a predominant role in the growth of the coatings. Thus, a continuously increasing negative temperature gradient is formed from the oxide/metal interface to the aqueous electrolyte due to the intrinsic low thermal conductivity of zirconia (~8.2 W/mK) [36] and the effect of the high cooling rate (~108 K/s) [37] of aqueous electrolyte. As a result, an increasing amount of t-ZrO2 is formed from the inner- to the top-oriented coating owing to the quenching effect. Here, we elucidate the formation mechanism of the parabolically distributed grain size of the zirconia coating, based on classical nucleation and growth restriction, and the steady-state equation of the nucleation rate is given as [38]:
where I0 is the pre-exponential factor, k is the Boltzmann constant, ΔG* is critical activation energy, and Q is the activation energy of diffusion. Apparently, the overall nucleation rate is governed by both the rate of cluster formation and the rate of atom transport to the nucleus. Due to the quenching effect of the MAO process, the energy barrier for nucleus formation is very low and the nucleation rate is high. After nucleation, noting that the grain growth rate (V) is strongly dependent on undercooling (ΔT), it can be expressed as [38]:
where Kr and Kc are Jackson–Hunt constants. Obviously, increasing the ΔT has the effect of markedly increasing the growth rate , which is the essential formation mechanism of the finer grain sizes of the top layer surface. For the grains of the inner layer surface, however, the substrate plays a crucial role in grain refinement due to the growth restriction effect.
3.4. Hydrogen Permeation Barrier Property of the Thick Zirconia Coating
The hydrogen desorption rate curves of the bare zirconium hydride and multiphase ZrO2-coated zirconium hydride at different temperatures are shown in Figure 7. The initial dehydrogenation temperature of zirconium hydride with ceramic coating obviously lagged behind that of the sample without ceramic coating. Hydrogen desorption of the ZrO2-coated zirconium hydride started at 660 °C while for the bare zirconium hydride it started at 500 °C. The hydrogen desorption rate rose as the temperature increased, but the slope of the curve is small, indicating that the ceramic coating played a certain role in hindering the hydrogen desorption. When the temperature increased to nearly 900 °C, the curves showed inflection points and the partial pressure of the hydrogen increased sharply. This demonstrates that the ceramic coating was invalid at this temperature, resulting in a sharp increase in the amount of dehydrogenation. It is feasible to evaluate hydrogen permeation resisting the effect of ZrO2 coating by analyzing hydrogen reduction after the dehydrogenation experiment.
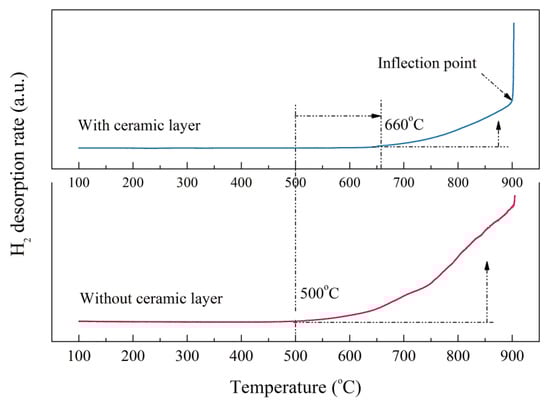
Figure 7.
Hydrogen desorption rate of the bare zirconium hydride and ZrO2-coated zirconium hydride at various temperatures.
The PRF values of MAO coatings produced under constant voltage mode are shown in Figure 8. The hydrogen permeation resisting the effect of the MAO coating was about 13 times higher than that of the substrate, which was nearly 4–8 times higher than the oxide coatings fabricated by in situ reaction or sol-gel processes, and is comparable to nitride coating, as summarized in Table 2. In addition, the hydrogen permeation resisting the effect of the MAO coating was further ascertained by the XRD technique. The XRD analysis of the samples subjected to the pre-and-post vacuum dehydrogenation experiment was conducted in order to determine the phase structure changes, as shown in Figure 9. Comparing the phase structure of pre-and-post vacuum dehydrogenation treatment, it can be seen that the main phase structure did not change obviously, and it exhibited excellent high-temperature performance. In addition, the grain size (D) and lattice strain (ε) of zirconia crystal of the top layers of MAO coatings before and after hydrogen desorption were generally the same, as shown in Table 1 and Figure 6c,d. Figure 10 depicts the Nyquist plots obtained for ZrO2-coated zirconium hydride before and after vacuum dehydrogenation. It is clear that the impedance spectra behavior of the post-vacuum dehydrogenated sample was nearly consistent with the pre-vacuum dehydrogenated sample, and both of the impedance spectra were composed of a semicircle at high frequencies and a linear tail at low frequency range. These results indicate the significant performance of zirconia thick coatings fabricated by MAO in terms of hindering hydrogen permeation and improving coating integrity as well as achieving longer lifetime.
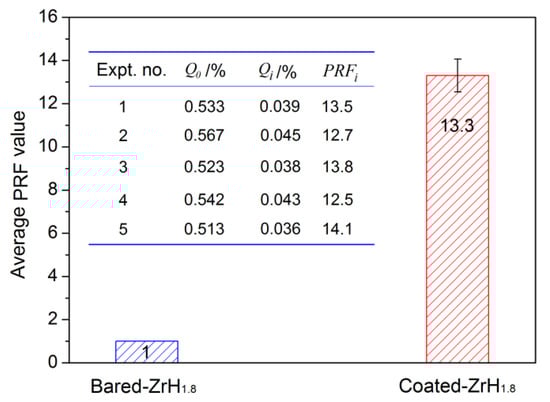
Figure 8.
The contrasted result of PRF value between bare zirconium hydride and ZrO2-coated zirconium hydride.
Table 2.
PRF values of zirconium hydride samples with different films.
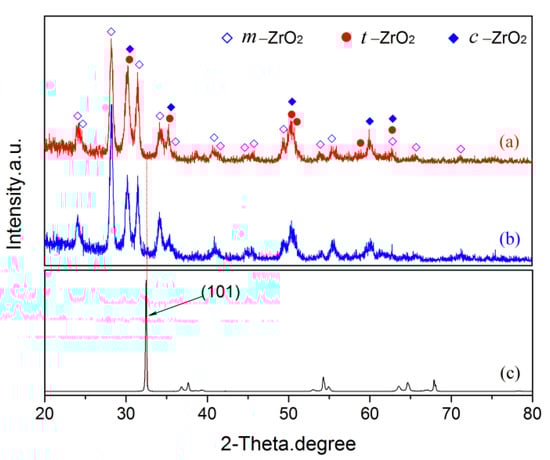
Figure 9.
The XRD patterns of pre- and post-vacuum dehydrogenation experiment: (a) pre-vacuum dehydrogenation; (b) post-vacuum dehydrogenation; (c) zirconium hydride substrate.
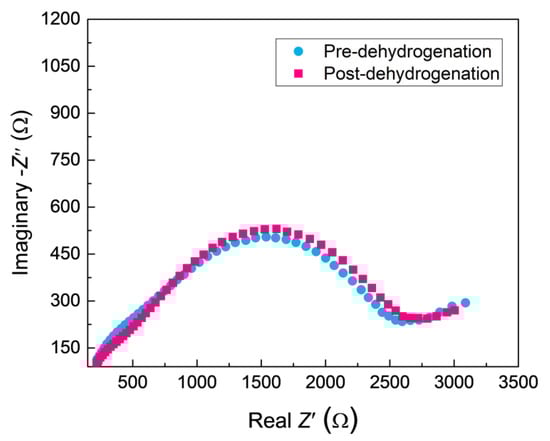
Figure 10.
The Nyquist plots for ZrO2-coated zirconium hydride before and after vacuum dehydrogenation.
From a microscopic point of view, hydrogen atoms decomposed by molecules are chemically absorbed by oxygen ions in the oxide film lattice, hence the O-H bonds are formed and the hydrogen atoms are subsequently reserved in the oxide film [24]. In this regard, the pre-existing oxygen vacancies trapped in tetragonal ZrO2 possess an intrinsic potential for hindering hydrogen permeation. Previous related research has also reported dense oxide coating composed of a mixture of monoclinic ZrO2 and tetragonal ZrO2, which exhibited excellent hydrogen permeation resistance effects [41,42]. From a mesoscopic point of view, the transfer of hydrogen atoms is more likely to occur with the cracking or local delamination of coatings, hence both the integrity and the lower permeability of hydrogen in the oxide film are in favor of the oxide layer as the hydrogen permeation barrier. Apparently, the zirconia thick coatings directly formed by MAO consisted of a mixture of monoclinic and tetragonal ZrO2 and exhibited a dense inner layer. From the obtained results, it can be concluded that it is indeed a pioneering effort to grow in situ a multiphase zirconia thick coating on zirconium hydride, providing superior hydrogen permeation barrier properties.
4. Conclusions
In the present work, we have provided a novel paradigm for in situ formation of multiphase zirconia coatings as a novel hydrogen permeation barrier on zirconium hydride. The MAO process is divided into three stages according to the coating’s thickness–time relationship. The surface of the ZrO2 coating with few flaws exhibited a relatively low pore density. The coating thickness was approximately 110 µm and the inner layer was compact and tightly connected with the substrate. The XRD results show that the ZrO2 coating consisted of a mixture of m-ZrO2, t-ZrO2, and a trace of c-ZrO2, among which the predominant phase was m-ZrO2. The quantitative analysis indicated an increased amount of m-ZrO2 toward the coating surface and an increased amount of t-ZrO2 toward the oxide/metal interface. Hydrogen desorption of the sample with ceramic coating started at 660 °C, which was much higher than the bare sample. The ZrO2 coating significantly improved the hydrogen permeation resistance effects, and the PRF value was enhanced by approximately 13 times compared with bare zirconium hydride. The main phase structure did not change obviously after vacuum dehydrogenation treatment and exhibited excellent high-temperature (600–650 °C) performance.
Author Contributions
Conceptualization, W.-D.C. and Z.-G.W.; methodology, Z.-G.W., W.M. and S.-F.Y.; software, X.-W.S. and W.M.; validation, Z.-G.W., X.-W.S. and X.-K.Z.; formal analysis, Z.-G.W. and S.-F.Y.; investigation, Z.-G.W.; resources, W.-D.C. and Z.-G.W.; data curation, W.-D.C. and Z.-G.W.; writing—original draft preparation, Z.-G.W. and W.-D.C.; writing—review and editing, W.-D.C. and Z.-G.W.; visualization, J.-H.O. and X.-K.Z.; supervision, W.-D.C.; project administration, W.-D.C., S.-F.Y., X.-W.S., J.-H.O. and Y.-M.W.; funding acquisition, W.-D.C. All authors have read and agreed to the published version of the manuscript.
Funding
This research was funded by the financial support from the National Natural Science Foundation of China (Nos. 51964035 and 52204316), Natural Science Foundation of Inner Mongolia (No. 2021BS05007), Inner Mongolia Science & Technology Project Plan (2021GG0262), Program for Young Talents of Science and Technology in Universities of Inner Mongolia Autonomous Region (No. NJYT23006).
Institutional Review Board Statement
Not applicable.
Informed Consent Statement
Not applicable.
Data Availability Statement
Not applicable.
Conflicts of Interest
The authors declare no conflict of interest. The funders had no role in the design of the study; in the collection, analyses, or interpretation of data; in the writing of the manuscript; or in the decision to publish the results.
References
- Fei, W.; Gong, H.R. First principles study of various Zr-H phases with low H concentrations. Int. J. Hydrogen Energy 2012, 37, 12393. [Google Scholar]
- Tunes, M.A.; Silva, C.M.; Edmondson, P.D. Site specific dependencies of hydrogen concentrations in zirconium hydrides. Scr. Mater. 2019, 158, 136. [Google Scholar] [CrossRef]
- Ma, M.; Wang, L.; Wang, Y.; Xiang, W.; Tang, B.; Lyu, P.; Tan, X. Oxidation behaviour of zirconium hydride and its influence on the thermal desorption kinetics. Corros. Sci. 2018, 134, 199. [Google Scholar] [CrossRef]
- Chen, W.D.; Yan, S.F.; Zhong, X.K. Properties of oxide film on the surface of ZrHx (x = 0~2). Mater. Sci. Forum 2011, 686, 609–612. [Google Scholar] [CrossRef]
- Wang, L.J.; Chen, B.D.; Yao, D. Reactivity temperature coefficient evaluation of uranium zirconium hydride fuel element in power reactor. Nucl. Eng. Des. 2013, 257, 61–66. [Google Scholar] [CrossRef]
- Zhang, G.K.; Wang, X.L.; Yang, F.L.; Shi, Y.; Song, J.F.; Lai, X.C. Energetics and diffusion of hydrogen in hydrogen permeation barrier of α-Al2O3/FeAl with two different interfaces. Int. J. Hydrogen Energy 2013, 38, 7550–7560. [Google Scholar] [CrossRef]
- He, D.; Li, S.; Liu, X.; Zhang, C.; Yu, Q.; Wang, S.; Jiang, L. Preparation of Cr2O3 film by MOCVD as hydrogen permeation barrier. Fusion Eng. Des. 2014, 89, 35–39. [Google Scholar] [CrossRef]
- Katoh, Y.; Vasudevamurthy, G.; Nozawa, T.; Snead, L.L. Properties of zirconium carbide for nuclear fuel applications. J. Nucl. Mater. 2013, 441, 718–742. [Google Scholar] [CrossRef]
- Nemanic, V.; McGuiness, P.J.; Daneu, N.; Zajec, B.; Siketic, Z.; Waldhauser, W. Hydrogen permeation through silicon nitride films. J. Alloys Compd. 2012, 539, 184–189. [Google Scholar] [CrossRef]
- Wang, W.K.; Yan, G.Q.; Ma, Z.H.; Zhang, J.D.; Wang, L.J.; Guo, Z.C. Mechanisms of Growth and Hydrogen Permeation of Zirconium Nitride Film on Zirconium Hydride. Coatings 2023, 16, 349. [Google Scholar] [CrossRef] [PubMed]
- Cheng, Y.; Cao, J.; Peng, Z.; Wang, Q.; Matykina, E.; Skeldon, P.; Thompson, G.E. Wear-resistant coatings formed on Zircaloy-2 by plasma electrolytic oxidation in sodium aluminate electrolytes. Electrochim. Acta 2014, 116, 453–466. [Google Scholar] [CrossRef]
- Kulyk, V.; Duriagina, Z.; Vasyliv, B.; Vavrukh, V.; Kovbasiuk, T.; Lyutyy, P.; Vira, V. The Effect of Sintering Temperature on the Phase Composition, Microstructure, and Mechanical Properties of Yttria-Stabilized Zirconia. Materials 2022, 15, 2707. [Google Scholar] [CrossRef] [PubMed]
- Boissonnet, G.; Chalk, C.; Nicholls, J.R.; Bonnet, G.; Pedraza, F. Thermal Insulation of YSZ and Erbia-Doped Yttria-Stabilised Zirconia EB-PVD Thermal Barrier Coating Systems after CMAS Attack. Materials 2020, 13, 4382. [Google Scholar] [CrossRef]
- Adraider, Y.; Pang, Y.X.; Nabhani, F.; Hodgson, S.N.; Sharp, M.C.; Al-Waidh, A. Fabrication of zirconium oxide coatings on stainless steel by a combined laser/sol-gel technique. Ceram. Int. 2013, 39, 9665–9670. [Google Scholar] [CrossRef]
- Peng, J.Q.; Chen, Y.; Wu, M.; Yan, G.Q.; Wang, L.J.; Li, J.S.; Guo, G.C. Hydrogen desorption behavior of the hydrides of Zr-Y alloys under Ar and CO2 atmosphere. J. Alloys Compd. 2017, 693, 103–109. [Google Scholar] [CrossRef]
- Kaseem, M.; Fatimah, S.; Nashrah, N.; Ko, Y.G. Recent progress in surface modification of metals coated by plasma electrolytic oxidation: Principle, structure, and performance. Prog. Mater. Sci. 2020, 117, 100735. [Google Scholar] [CrossRef]
- Narayanan, T.S.; Park, I.S.; Lee, M.H. Strategies to improve the corrosion resistance of microarc oxidation (MAO) coated magnesium alloys for degradable implants: Prospects and challenges. Prog. Mater. Sci. 2014, 60, 1–71. [Google Scholar] [CrossRef]
- Fattah-Alhosseini, A.; Chaharmahali, R.; Keshavarz, M.K.; Babaei, K. Surface characterization of bioceramic coatings on Zr and its alloys using plasma electrolytic oxidation (PEO): A review. Surf. Interfaces 2021, 25, 101283. [Google Scholar] [CrossRef]
- Kung, K.C.; Lee, T.M.; Chen, J.L.; Lui, T.S. Characteristics and biological responses of novel coatings containing strontium by micro-arc oxidation. Surf. Coat. Technol. 2010, 205, 1714–1722. [Google Scholar] [CrossRef]
- Lin, X.; Tan, L.; Zhang, Q.; Yang, K.; Hu, Z.; Qiu, J.; Cai, Y. The in vitro degradation process and biocompatibility of a ZK60 magnesium alloy with a forsterite-containing micro-arc oxidation coating. Acta Biomater. 2013, 9, 8631–8642. [Google Scholar] [CrossRef]
- Wang, Z.G.; Chen, W.D.; Yan, S.F.; Fan, X.J.; Xu, Z.G. Characterization of ZrO2 ceramic coatings on ZrH1.8 prepared in different electrolytes by micro-arc oxidation. Rare Met. 2022, 41, 1043–1050. [Google Scholar] [CrossRef]
- Wang, Z.G.; Chen, W.D.; Yan, S.F.; Fan, X.J.; Xu, Z.G. Optimization of the electrical parameters for micro-arc oxidation of ZrH1.8 alloy. Rare Met. 2022, 41, 2324–2330. [Google Scholar] [CrossRef]
- Sharma, A.; Witz, G.; Howell, P.C.; Hitchman, N. Interplay of the phase and the chemical composition of the powder feedstock on the properties of porous 8YSZ thermal barrier coatings. J. Eur. Ceram. Soc. 2021, 41, 3706. [Google Scholar] [CrossRef]
- Chen, W.; Wang, L.; Han, L.; Chen, S. Properties of hydrogen permeation barrier on the surface of zirconium hydride. Rare Met. 2008, 27, 473–478. [Google Scholar] [CrossRef]
- Wang, Y.; Lei, T.; Jiang, B.; Guo, L. Growth, microstructure and mechanical properties of microarc oxidation coatings on titanium alloy in phosphate-containing solution. Appl. Surf. Sci. 2004, 233, 258–267. [Google Scholar] [CrossRef]
- Khan, R.H.U.; Yerokhin, A.L.; Matthews, A. Structural characteristics and residual stresses in oxide films produced on Ti by pulsed unipolar plasma electrolytic oxidation. Philos. Mag. 2008, 88, 795–807. [Google Scholar] [CrossRef]
- Hussein, R.O.; Zhang, P.; Nie, X.; Xia, Y.; Northwood, D.O. The effect of current mode and discharge type on the corrosion resistance of plasma electrolytic oxidation (PEO) coated magnesium alloy AJ62. Surf. Coat. Technol. 2011, 206, 1990–1997. [Google Scholar] [CrossRef]
- Zou, Y.C.; Wang, Y.M.; Sun, Z.D.; Cui, Y.; Jin, T.; Wei, D.Q.; Ouyang, J.H.; Jia, D.C.; Zhou, Y. Plasma electrolytic oxidation induced ‘local over-growth’ characteristic across substrate/coating interface: Effects and tailoring strategy of individual pulse energy. Surf. Coat. Technol. 2018, 342, 198–208. [Google Scholar] [CrossRef]
- Xu, J.L.; Zhong, Z.C.; Yu, D.Z.; Liu, F.; Luo, J.M. Effect of micro-arc oxidation surface modification on the properties of the NiTi shape memory alloy. J. Mater. Sci. Mater. Med. 2012, 23, 2839–2846. [Google Scholar] [CrossRef] [PubMed]
- Durdu, S. Characterization, Bioactivity and Antibacterial Properties of Copper-Based TiO2 Bioceramic Coatings Fabricated on Titanium. Coatings 2019, 9, 1. [Google Scholar] [CrossRef]
- Ji, P.; Lü, K.; Chen, W.; Wang, M. Study on Preparation of Micro-Arc Oxidation Film on TC4 Alloy with Titanium Dioxide Colloid in Electrolyte. Coatings 2022, 12, 1093. [Google Scholar] [CrossRef]
- Wang, W.-K.; Liu, K.-F.; Tsai, P.-C.; Xu, Y.-J.; Huang, S.-Y. Influence of Annealing Temperature on the Properties of ZnGa2O4 Thin Films by Magnetron Sputtering. Coatings 2019, 9, 859. [Google Scholar] [CrossRef]
- Cheng, Y.; Matykina, E.; Skeldon, P.; Thompson, G. Characterization of plasma electrolytic oxidation coatings on Zircaloy-4 formed in different electrolytes with AC current regime. Electrochim. Acta 2011, 56, 8467–8476. [Google Scholar] [CrossRef]
- Xue, W.B.; Deng, Z.W.; Lai, Y.C.; Chen, R.Y. Analysis of Phase distribution for ceramic coatings formed by microarc oxidation on aluminum alloy. J. Am. Ceram. Soc. 1998, 81, 1365–1368. [Google Scholar] [CrossRef]
- Wang, C.; Wang, F.; Han, Y. Structural characteristics and outward-inward growth behavior of tantalum oxide coatings on tantalum by micro-arc oxidation. Surf. Coat. Technol. 2013, 214, 110–116. [Google Scholar] [CrossRef]
- Bisson, J.F.; Fournier, D.; Poulain, M.; Lavigne, O.; Mévrel, R. Thermal conductivity of yttria-zirconia single crystals, determined with spatially resolved infrared thermography. J. Am. Ceram. Soc. 2000, 83, 1993–1998. [Google Scholar] [CrossRef]
- Yerokhin, A.L.; Nie, X.; Leyland, A.; Matthews, A.; Dowey, S.J. Plasma electrolysis for surface engineering. Surf. Coat. Technol. 1999, 122, 73–93. [Google Scholar] [CrossRef]
- Wang, Z.G.; Ouyang, J.H.; Ma, Y.H.; Wang, Y.J.; Xie, L.Y.; Hennichea, A.; Liu, Z.G. Enhanced nucleation undercooling and surface self-nanocrystallization of Al2O3-ZrO2(Y2O3) eutectic ceramics. J. Eur. Ceram. Soc. 2019, 39, 1707. [Google Scholar] [CrossRef]
- Wang, W.; Yan, G.; Zhang, J.; Ma, Z.; Wang, L.; Guo, Z.; Zhang, S.; Wu, Y. Hydrogen Permeation Behavior of Zirconium Nitride Film on Zirconium Hydride. Materials 2022, 15, 550. [Google Scholar] [CrossRef]
- Wu, M.; Peng, J.; Yan, G.; Chen, Y.; He, Z.; Xu, Z.; Wang, L. Preparation and properties of composite hydrogen permeation barrier on ZrH1.8 by sol–gel technique. Surf. Coat. Technol. 2018, 352, 159–165. [Google Scholar] [CrossRef]
- Moya, J.S.; Diaz, M.; Bartolomé, J.F.; Roman, E.; Sacedon, J.L.; Izquierdo, J. Zirconium oxide film formation on zircaloy by water corrosion. Acta Mater. 2000, 48, 4749–4754. [Google Scholar] [CrossRef]
- Haurat, E.; Crocombette, J.P.; Tupin, M. Interactions of hydrogen with zirconium alloying elements and oxygen vacancies in monoclinic zirconia. Acta Mater. 2022, 225, 117547. [Google Scholar] [CrossRef]


Disclaimer/Publisher’s Note: The statements, opinions and data contained in all publications are solely those of the individual author(s) and contributor(s) and not of MDPI and/or the editor(s). MDPI and/or the editor(s) disclaim responsibility for any injury to people or property resulting from any ideas, methods, instructions or products referred to in the content. |
© 2023 by the authors. Licensee MDPI, Basel, Switzerland. This article is an open access article distributed under the terms and conditions of the Creative Commons Attribution (CC BY) license (https://creativecommons.org/licenses/by/4.0/).