Abstract
UV-visible spectroscopic ellipsometry was used to study the thickness and composition of the oxidized zone in Fe- and Ni-based alloys as a function of oxygen partial pressure. In the case of AISI 304 stainless steel, the weathered thickness increases with oxygen partial pressure, whereas in the case of Inconel 600, it appears to be independent of oxygen pressure. This trend is confirmed by the AFM measurements. For both materials studied, the oxygen-modified zone consists of two layers as confirmed by glow discharge optical emission spectrometry (GDOES) measurements. The thicknesses of these two layers vary differently on either side of an oxygen partial pressure of 0.1 Torr. In the case of AISI 304 stainless steel, the thickness of the Fe-rich outer layer decreases in favor of the Cr-rich inner layer. In the case of Inconel 600, the trend is reversed. The Ni-rich outer layer increases significantly above this critical pressure, while the Cr-rich inner layer decreases slightly. The composition of each layer in the oxidized zone is discussed in terms of its dielectric function in relation to reference material. The use of UV-visible ellipsometry as a non-destructive tool to study the structure and composition of the oxide bilayer of absorbing systems such as the alloys under investigation is a first.
1. Introduction
Both iron-based stainless steels and nickel-based alloys are materials specifically designed to resist corrosion in aggressive environments where conventional materials fail. Corrosion resistance depends mainly on the chemical composition of the material and its microstructure. It results from the passivation of the alloy by the formation of a protective layer on its surface. The very complex process of passivation can be influenced by several factors such as the composition of the alloy, the characteristics of the environment, and the formation conditions. The properties of the protective layer that imparts “passivity” to stainless steels and nickel-based alloys continue to be of great interest to materials scientists and corrosion technologists and are the subject of much research. The various parameters that influence the properties of the passive layer, such as the alloy composition, its environment, the thickness of the layer, its structure, its stoichiometry, etc., are the focus of these studies. Indeed, understanding the effects of each parameter on the properties of the passive film and the passivity of the alloy becomes a key factor in protecting these alloys against corrosion attack and reducing failures in the various applications using these materials.
In the case of stainless steels, many works converge on the fact that the protective oxide films have a bilayer structure. The inner layer (in direct contact with the alloy) which is composed mainly of chromium oxide, Cr2O3, behaves as a p-type semiconductor, while the outer layer composed mainly of iron oxide Fe2O3 behaves as an n-type semiconductor [1,2]. The electronic structure of the oxide films is thus similar to a p-n heterostructure, where the space charge regions formed by the two oxides limit the electronic and ionic transfers and thus increase the effective corrosion protection. In the case of nickel-based alloys, the outer layer is mainly based on NiO while the inner layer is rich in Cr [3]. The various semiconductors (Fe2O3, Cr2O3, NiO) contained in the passivation layer of these alloys are transparent conductive oxides that grow spontaneously or when the alloy is subjected to thermal and/or chemical stress. The advantage of these materials is that they are low cost, can be made from cheap and abundant materials, and are also easily reusable. In addition to their role in corrosion protection, their properties are of interest for various applications [4,5,6,7,8,9,10,11,12,13,14,15] such as electronic components, solar cells, or photocatalysis.
In previous work, we have used electrical and near-field measurements to study the oxides formed on the surface of these alloys as a function of temperature and as a function of oxidation time [16,17,18,19,20,21]. In this study, we propose to investigate the influence of the oxygen partial pressure on the thickness and chemical composition of oxide layers formed at a temperature of 350 °C, using optical and near-field microscopy measurements.
2. Experimental Section
2.1. Sample Preparation and Oxygen Oxidation Conditions
The composition of the austenitic stainless steel AISI 304 and the alloy Inconel 600 used in this study is given in Table 1. The samples were cut into pieces of 1 cm2, polished, and then cleaned in an ultrasonic bath with acetone, ethanol, and distilled water, in succession, and dried in air. The samples were then annealed under vacuum, for 30 min, at a temperature of 1050 °C for AISI 304 steel and 1100 °C for Inconel 600. This heat treatment is used to eliminate the effects of work hardening due to the mechanical preparation of the surface. Immediately after annealing, the temperature is reduced to 350 °C. When the pressure reaches 10−7 mbar, oxygen is introduced at various pressures ranging from 0.01 Torr to 700 Torr. At each oxygen pressure, the exposure time of the sample is 2 h.

Table 1.
Composition of AISI 304 and Inconel 600 alloys.
2.2. Spectroscopic Ellipsometry Characterization
The changes in optical properties, induced by O2 oxidation, were monitored using a Jobin-Yvon Uvisel UV-visible spectroscopic ellipsometer (SE, Horiba, Palaiseau, France), operating in the wavelength range of 210–830 nm. Ellipsometry is an optical technique based on the measurement of the changes in the polarization state of light after reflection from a surface [22]. It is, therefore, a non-destructive and very sensitive technique well-suited to the study of surface phenomena. Ellipsometry measures the ratio ρ between the reflection coefficients rp and rs for a linearly polarized light whose polarization is parallel (p) or perpendicular (s), to the plane of incidence:
The experimental ellipsometry angles Ψ and Δ are converted to the pseudo-dielectric function <ε> using Equation (2) for a single interface, where Φ = 70° is the incidence angle [23]:
<ε> is the pseudo-dielectric function of the whole system (bulk substrate + oxide film) reflecting the light. It reduces to the dielectric function ε = n + i k of the material when the reflecting sample has an infinite thickness and a smooth surface. The dielectric function is related to the refractive index and the extinction coefficient of the material: ε(E) = ε1(E)+ ε2(E) = [n(E) + i k(E)]2, where E is the photon energy. More quantitative information can be derived from the SE measurements using appropriate optical models and the Bruggeman effective medium approximation (BEMA) theory [24]. According to this theory, if a film consists of a mixture of several phases, each one having a dielectric function εk(E) and a volume fraction ƒk, its dielectric function ε(E) is given by:
The quantitative analysis of the ellipsometriy measurements was carried out using the DeltaPsi2 software from Jobin Yvon.
2.3. Glow Discharge Optical Emission Spectrometry (GDOES) Measurements
GDOES measurements were carried out on some samples, using a GD Profiler 2 (Horiba, Palaiseau, France) equipped with a high resolution, wide spectral range optical emission spectrometer, and a differential interferometry profiler. The latter is based on an interferometric method that consists of measuring the relative phase shift between two laser beams, one reflected at the surface of the sample (the reference beam) and the other reflected inside the glow discharge crater (the depth sensing beam). The phase shift between the two is proportional to the depth of the crater.
A radio-frequency discharge is generated in low-pressure argon between an anode and the sample which acts as a cathode. The resulting ion bombardment of the sample surface by argon ions causes its erosion. The ejected atoms, excited in the Ar plasma, emit a characteristic wavelength λ when they return to the ground state. The intensity Ijλ of each wavelength, characteristic of an element j, is a function of the concentration Cj of this element j in the sample.
where kjλ is an instrumental factor characterizing the collection efficiency of photons of wavelength λ, Yjλ is the emission efficiency of element j at wavelength λ, S is the sputtering efficiency of the sample and I is the discharge current. Rigorous quantification of the measurements would require the use of standard samples under the same plasma conditions to eliminate the contribution of the erosion rate and thus to access the concentration of element j. However, since the main aim of the measurements is to determine the thickness of the oxidation-modified layers, the profiles of the species of interest j (Fe, Cr, Ni and O) are followed by their relative intensities Ijr, determined as follows:
where and α = 1 for O and 0 in all other cases.
2.4. Atomic Force Microscopy (AFM) Measurements
The AFM measurements were performed in air with a commercial multimode microscope from Brucker (Brucker, Wissembourg, France) controlled by a commercial AFM multimode design and nanoscope V electronic that simultaneously measures the surface topography and potential distribution on a line-by-line basis using a commercial electrically conductive Pt-Ir coated silicon cantilevers (reference SCM PIT-V2 from Brucker designed for Scanning Kelvin Probe Microscopy). The topographic imaging was performed in the air using the classical semi-contact method called tapping mode by Brucker. The cantilever frequency is around 75 kHz and the spring constant is equal to 3 N/m.
3. Results and Discussion
3.1. Ellipsometry Measurements
Figure 1 shows the real (<ε1(E)>) and imaginary (<ε2(E)>) parts of the pseudo-dielectric function spectra of AISI 304 and Inconel 600 samples before and after oxidation at different oxygen pressures. The spectra of the polished samples show a typical metallic behavior with a monotonous decrease of the absolute value of <ε1>, as the photon energy E increases, accompanied by a monotonous increase in <ε2>. The dielectric function ε(E) of the polished samples was therefore parameterized using the Drude-Lorentz dispersion model [25]:
where ε∞ is the high-frequency dielectric constant, εs (εs > ε∞) the static dielectric function, Et the resonant energy of the Lorentz oscillator and Γ0 (in eV) its damping factor, EP the plasma energy, ΓD (in eV) the collision frequency, fj (j = 1, 2) the strength of an additional Lorentzian oscillator with a resonant energy E0j and a broadening γj.
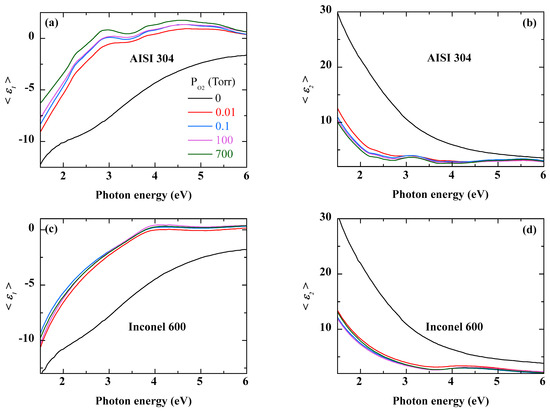
Figure 1.
Real (<ε1(E)>) and imaginary (<ε2(E)>) parts of the pseudo-dielectric spectra of AISI 304 (a,b) and Inconel 600 alloy (c,d), before and after oxidation at different O2 pressures. The color of the curve corresponds to the O2 pressure displayed.
A two-layer optical model was used to determine the dielectric function of the bare alloy. Surface roughness is expressed as a mixture of 50% of the same material as the bulk layer and 50% void.
The oxidation of AISI 304 strongly affects its optical response as shown by the pseudo-dielectric function spectra of Figure 1a,b. Roughly speaking, oxidation gives the sample a less metallic character. Compared to the polished sample, the absolute values of both <ε1> and <ε2> decrease strongly throughout the spectral energy range. In addition, some structures appear in the spectra, especially around 3 eV. These become more pronounced as the O2 pressure increases. The oxidation of Inconel 600 shows a different evolution with respect to oxygen pressure. Contrary to AISI 304, there is no significant variation as a function of oxygen pressure. Indeed, from the lowest value of O2 pressure, the pseudo dielectric function spectra evolve slightly and tend to overlap almost over the whole energy range. On the other hand, all the spectra show a small bump, more visible on the imaginary part of the dielectric function, between 4 eV and 5 eV. Thus, Figure 1 shows that the changes in the spectra of the pseudo-dielectric function are due to the growth of an oxidized layer, the effects of which are amplified by the oxygen pressure.
Figure 2 displays the GDOES depth profile of AISI 304, oxidized at the lowest oxygen partial pressure (0.01 Torr). The relative intensity of the most abundant elements (Fe, Cr, and Ni) and that of oxygen confirm the bilayer structure of the modified zone with an inner Cr-rich layer and an outer Fe-rich layer. Many works have reported such double layers [1,2] after the oxidation of stainless steel. The composition of each of these two layers depends on the oxidation conditions. First, the quantitative exploitation of the SE of AISI 304 after oxidation is discussed in detail. Then the same method is strictly applied to the case of Inconel 600.
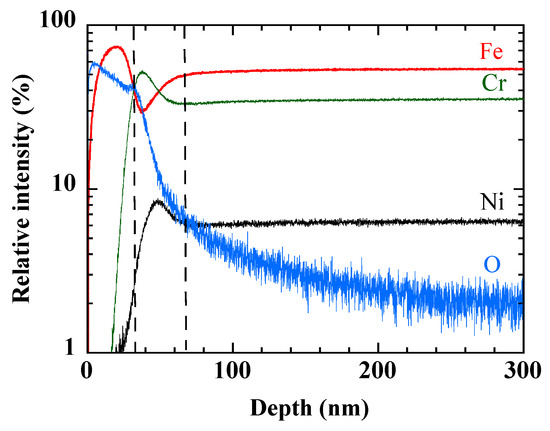
Figure 2.
GDOES depth profile of the main elements of AISI 304 sample oxidized at 0.01 Torr of O2.
3.2. Simulation Study
A simulation analysis may help the reader to better understand the influence of the structural parameters of the oxidized zone on the optical response of a polished AISA 304 substrate. We assume an internal Cr2O3 layer with the dielectric function measured by Hones et al. [26] and an external Fe2O3 layer with the dielectric function given by Querry [27].
Figure 3 shows the calculated pseudo-dielectric function spectra of an AISI 304 substrate coated with an inner Cr2O3 layer of thickness 5 nm (Figure 3a) and 10 nm (Figure 3b), respectively, and an outer Fe2O3 layer of a thickness varying from 0 to 20 nm in 5 nm steps. The following conclusions can be drawn:
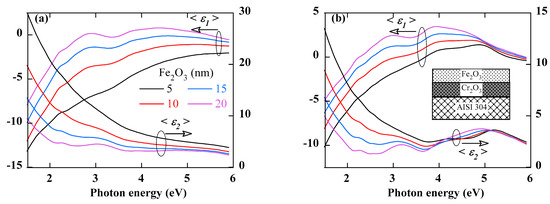
Figure 3.
Calculated spectra of real (<ε1>) and imaginary (<ε2>) parts of the pseudo-dielectric spectra of AISI 304 covered with an inner Cr2O3 layer of a thickness 5 nm (a) and 10 nm (b), respectively, and an outer Fe2O3 layer of a thickness varying from 5 nm to 20 nm. The insert in (b) shows the optical model that was used to perform these simulations.
- −
- Since the penetration depth of the photon depends on its energy, the low-energy part of the spectrum is more sensitive to any change in the overall thickness (growth of the oxide layer), while the high-energy part will be more affected by changes that may occur in the Fe-rich outer layer (e.g., porosity or roughness).
- −
- The presence of the oxide layer leads to a decrease in the absolute value of both <ε1> and <ε2>. This decrease, which is more pronounced in the low-energy part of the spectrum, increases with the thickness of the oxide layer. The semiconducting nature of the oxide layer is certainly responsible for this decrease in the metallic character of the dielectric pseudo-function.
- −
- The growth of the oxide layer reveals structures in the spectrum of the pseudo-dielectric function and in particular its imaginary part. Their amplitude increases with the increase of the thickness of either the inner or the outer layer oxide layer. In general, the structures below 5 eV seem to be mainly due to the Fe2O3 layer while those above 5 eV seem to be more related to the presence of the Cr2O3 layer.
Figure 4 illustrates the effects of a porous outer oxide layer. This porosity is simulated by an increasing void volume fraction fV up to 50%. According to effective media theory [24], the effective dielectric function of the outer layer will be a mixture of the dielectric functions of Fe2O3 and void, weighted by the volume fractions of these two constituents. A porosity fV ≥ 50% would correspond to a surface roughness layer. The spectra in Figure 4 correspond to a 10 nm inner Cr2O3 layer and a 20 nm thick porous outer Fe2O3 layer. In addition, we note that increasing the porosity decreases both <ε1> and <ε2> and attenuates the structures beyond 3 eV.
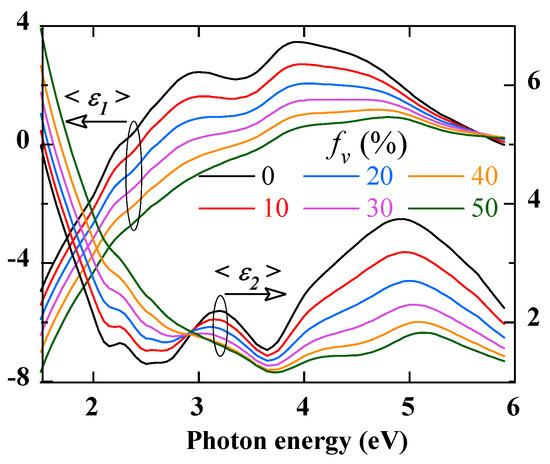
Figure 4.
Calculated real (<ε1>) and imaginary (<ε2>) parts of the pseudo-dielectric spectra of AISI 304 coated with a 10 nm-thick Cr2O3 and a 20 nm-thick Fe2O3 porous layer with a volume fraction fV of voids increasing up to 50%.
3.3. Quantitative Fits of the SE Spectra
The optical model shown in the inset of Figure 5 was used to fit the experimental SE spectra according to the depth profile in Figure 3. However, the exact composition of both the Fe-rich outer layer and the Cr-rich inner layer remains unknown. It is, therefore, necessary to describe the dielectric function of each of these two layers by a dispersion law. The choice of the dispersion relation depends on the type of material involved. For example, the Tauc-Lorentz relation [28] was most appropriate for the Fe-rich outer layer in the case of AISI stainless steel or the Ni-rich layer in the case of Inconel 600 alloy:
where ε∞ is the high-frequency dielectric constant and Aj Cj and Ej are, respectively, the strength, the broadening and the peak central energy of the jth oscillator. P stands for the Cauchy principal part of the integral and Eg is the energy at which the absorption of the material begins.
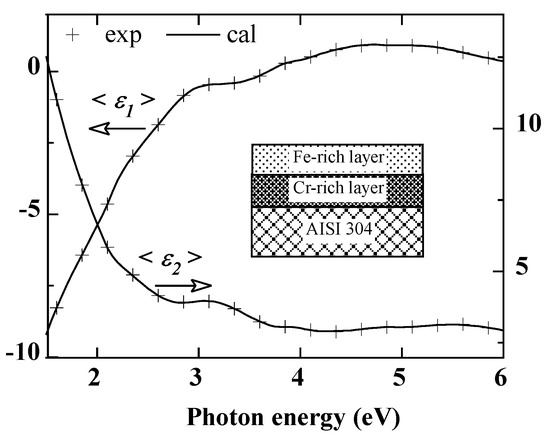
Figure 5.
Experimental (symbols) and calculated (curves) real (<ε1>) and imaginary (<ε2>) parts of the pseudo-dielectric spectra of AISI 304 after oxidation at 0.01 Torr of O2 pressure. The insert is the optical model used to fit the SE measurements.
In the case of the Cr-rich inner layer, the most appropriate parameterization of its dielectric function was the model derived from the Forouhi and Bloomer formulation [29]. The refractive index and the extinction coefficient are given by:
with n∞ the high energy refractive index, Ej, fj and Γj, the energy of maximum absorption the oscillator strength and the broadening factor of the jth oscillator, and Eg the energy at which the absorption of the material starts. As shown in Figure 5, the optical model allows us to obtain an excellent fit quality over the whole measured energy range.
3.4. Composition of the Oxidized Layer
Figure 6 and Figure 7 show the dielectric functions of the Fe-rich outer and Cr-rich inner layers, respectively. For comparison, the dielectric functions of Fe2O3 and Cr2O3 used in the previous simulations (Figure 3 and Figure 4) are also shown. regarding the Fe-rich layer, the dielectric functions of Figure 6 show a high similarity with that of Fe2O3 of Ref. [27], suggesting the prevailing presence of this type of oxide in this layer. According to the results in Figure 4, the increase in the amplitude of the dielectric function, as the O2 pressure is increased, indicates a more compact oxide layer. Regarding the Cr-rich layer, the differences between the dielectric functions in Figure 7 and those of Cr2O3 in Ref. [26] may be due to several factors:
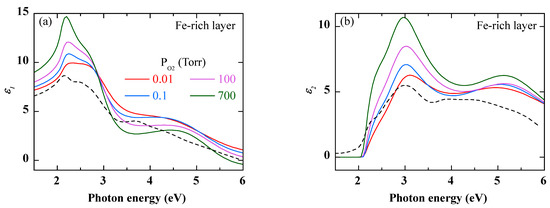
Figure 6.
Real (a) and imaginary (b) parts of the dielectric function of the Fe-rich outer layer after oxidation of AISI 304 at different O2 pressures. For comparison, the dashed curve represents the dielectric function of Fe2O3 from Ref. [27].
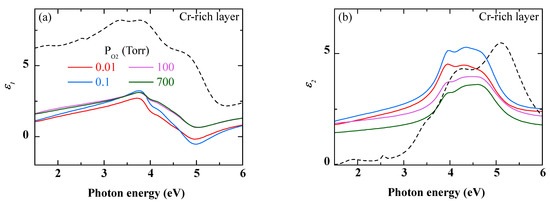
Figure 7.
Real (a) and imaginary (b) parts of the dielectric function of the Cr-rich outer layer after oxidation of AISI 304 at different O2 pressures. For comparison, the dashed curve represents the dielectric function of Cr2O3 from Ref [26].
- −
- An abundance of oxygen beyond the stoichiometry of Cr2O3;
- −
- A porosity of the layer that would make its dielectric function lower than that of the Cr2O3 of Ref. [26];
- −
- The presence of Ni oxide and metallic Cr in addition to Cr2O3.
Studies conducted on the oxidation of Inconel 600 emphasize the presence of an outer layer of NiO [30,31]. The GDOES profile in Figure 8 confirms the presence on the surface of a zone of about ten nanometers, which is rich in Ni and O. This NiO layer covers a zone extending over a few tens of nanometers, where the concentration of Cr is higher than in the bulk of the material. It would correspond to a NiCr alloy [31].
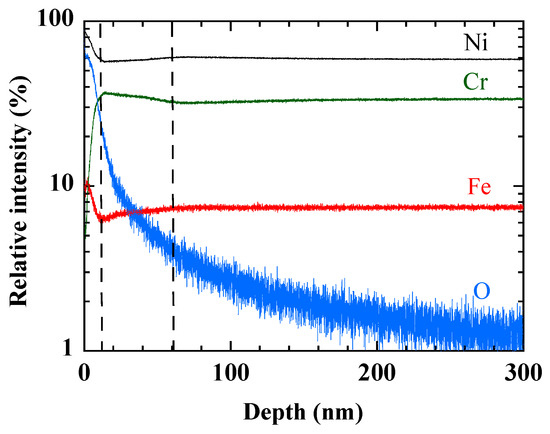
Figure 8.
GDOES depth profile of the main elements of Inconel 600 sample oxidized at 0.01 Torr of O2.
Figure 9 and Figure 10 show the dielectric functions of the Ni-rich outer and Cr-rich inner layers, respectively. For comparison, the dielectric functions of NiO by Powel et al. [32] and NiCr by Erkan et al. [33] are also given.
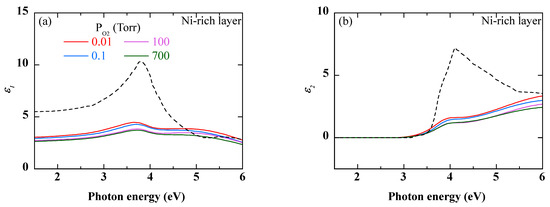
Figure 9.
Real (a) and imaginary (b) parts of the dielectric function of the Ni-rich outer layer after oxidation of Inconel 600 at different O2 pressures. For comparison, the dashed curve represents the dielectric function of NiO from Ref. [32].
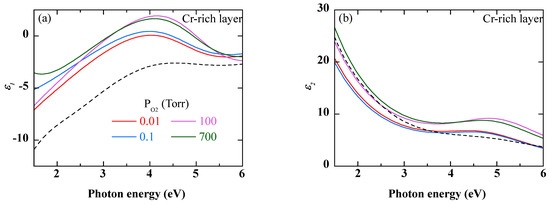
Figure 10.
Real (a) and imaginary (b) parts of the dielectric function of the Cr-rich outer layer after oxidation of Inconel 600 at different O2 pressures. For comparison, the dashed curve represents the dielectric function of NiCr from Ref. [33].
Figure 11 summarizes the evolution of the thickness (a) and the bandgap (b) of the outer layer and the thickness of the inner layer (c) as derived from the fits of the SE measurements, as well as the thickness of the oxygen-modified layer (d). The following conclusions can be drawn:
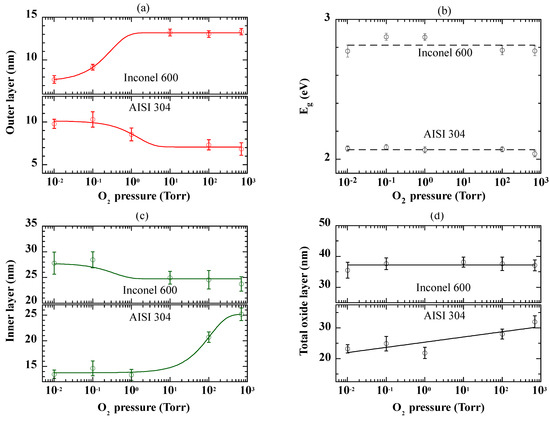
Figure 11.
Evolution of the thickness of the outer layer (a), its bandgap Eg (b), the thickness of the inner layer (c) and the total oxide layer (d) after oxidation of AISI 304 and Inconel 600. The curves and lines are provided as guides for the eye.
- −
- The thickness of both inner and outer layers varies differently on either side of an oxygen partial pressure of 0.1 Torr.
- −
- In the case of AISI 304 stainless steel, the thickness of the Fe-rich outer layer decreases in favor of the Cr-rich inner layer. As a result, the whole modified layer linearly increases with oxygen pressure, which is consistent with the gradual changes in the SE spectra in Figure 1a,b.
- −
- In the case of Inconel 600 alloy, the Ni-rich outer layer increases significantly above this critical pressure while the Cr-rich inner layer shows a slight decrease. Consequently, except for the lowest oxygen pressure, the thickness of the modified layer remains almost constant in agreement with the overlapping of the SE spectra observed in Figure 1c,d.
- −
- The bandgap Eg of Equation (7) represents the energy at which the absorption is different from zero. It is therefore different from the Tauc gap usually reported [34]. Its value of around 2.1 eV, in the case of the Fe-rich AISI 304 outer layer, and 2.8 eV for the Ni-rich Inconel 600 outer layer differs from the Tauc gap which is around 2.35 eV for Fe2O3 [35] and 3.7 eV for NiO [36].
3.5. AFM Test for Oxide Thickness Determination
The AFM images in Figure 12 and Figure 13 show a different surface topography of the two types of alloys after oxidation. In the case of the AISI 304 samples (Figure 12), the oxide layer appears fractured and some trenches are observed, due to oxidation and probably heat treatment. If these “trenches” only affect the oxide layer, they can be used to estimate the total thickness of the oxide layer (see Figure 14). The topography of the Inconel 600 surface is completely different and no trenches are observed (Figure 13). Small grains nucleate to form interconnected rings with holes in the center. As the O2 pressure is increased, the grains and thus the rings grow and progressively cover the entire surface.
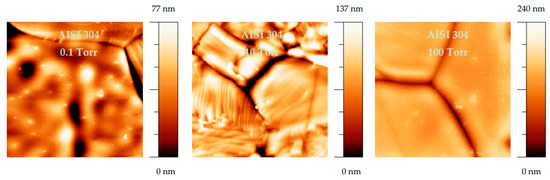
Figure 12.
AFM image (10 µm × 10 µm) of AISI 304 samples oxidized at different oxygen pressure.
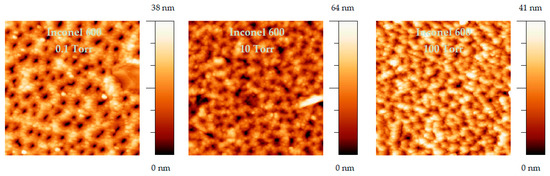
Figure 13.
AFM image (2 µm × 2 µm) of Inconel 600 samples oxidized at different oxygen pressure.
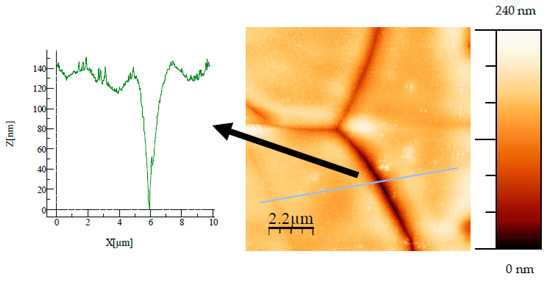
Figure 14.
AFM image (11 µm × 11 µm) of AISI 304 oxidized at 100 Torr. A cross-sectional profile of a trench, along the line shown in the figure, is used to determine the thickness of the oxide film.
Depending on the topography of the alloy surface, one of the following two methods was used to attempt to access the total thickness of the oxidized layer using the AFM images as input data:
- −
- For AISI 304, as shown in Figure 14, a cross-sectional profile of a trench was used to determine the thickness of the total oxide layer. Such a method was possible on the AISI 304 samples thanks to an optical camera that allows the AFM tip to be aimed at a trench.
- −
- For Inconel 600 samples, the substrate remains visible in the center of each ring, making the flooding technique more suitable for determining the oxide thickness (Figure 15). Once the AFM height has been measured, the holes between the rings (shown in blue) are isolated and their volume is estimated. The remaining volume, corresponding to the amount of material that has grown on the substrate, is estimated and then divided by the image area (2 µm × 2 µm in the case of Figure 15). This gives the average thickness of the oxide layer for a sample of Inconel 600.
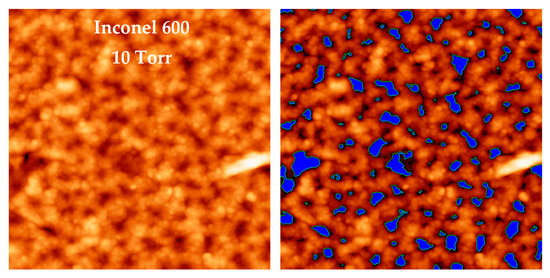 Figure 15. An example of the use of the flooding technique in the case of an Inconel 600 sample oxidized at 10 Torr. Once the AFM height is determined and the holes between the rings (in blue) are isolated, the volume corresponding to the amount of oxide is calculated and then divided by the image area (2 µm × 2 µm) to obtain the average thickness of the oxide layer.
The oxide layer thicknesses derived from the AFM measurements are plotted in Figure 16. In the case of Inconel 600, the values are very close to the total thickness obtained by ellipsometry. Furthermore, the same variation is obtained as a function of oxygen pressure. In the case of AISI 304, although the linear variation with oxygen pressure is similar to that in Figure 11, the values are almost 10 times higher. This suggests that the cracks are not restricted to the oxide layer.
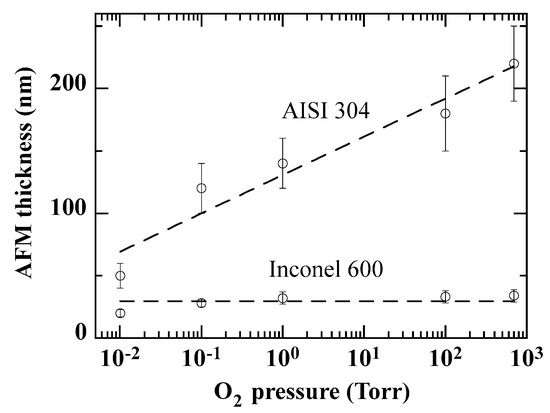
Figure 16.
Variation of oxide layer thickness variation as a function of O2 pressure, as derived from AFM measurements. The curves are provided as guides for the eye.
4. Conclusions
The effects of oxidation at different oxygen partial pressures on AISI 304 and Inconel 600 were investigated. UV-visible spectroscopic ellipsometry was used to analyze the structure and composition of the oxide layer formed. The latter is a superposition of two layers. The thicknesses deduced from the fits of the ellipsometry measurements agree with those of the GDOES measurements.
In the case of AISI 304, the optical properties of the Fe-rich outer layer are similar to those of the Fe2O3 oxide. Those of the Cr-rich outer layer differ slightly from those of Cr2O3 due to possible porosity and/or the presence of metallic Cr and Ni oxide in this layer.
In the case of Inconel 600, the optical properties of the Ni-rich outer layer are similar to those of a low-density NiO oxide. The metallic appearance of the chromium-rich inner layer suggests a NiCr alloy.
The low oxidation temperature used in this study corresponds to the operating temperature of the primary circuit of a nuclear power plant, where oxygen remains at a level of a few ppm. The results of this study can be used to predict the effects of oxidation on the different types of stainless steel used in the construction of these circuits.
In conclusion, this study illustrates the power of a non-destructive diagnostic tool such as ellipsometry to analyze the different layers of the surface of these alloys affected by the interaction with oxygen.
Author Contributions
Conceptualization and methodology, N.B., J.-L.B. and M.G.; validation, J.-L.B. and A.H.; investigation, N.B. and F.S.L.; writing—original draft preparation, N.B.; writing—review and editing, J.-L.B. and A.H. All authors have read and agreed to the published version of the manuscript.
Funding
This research received no external funding.
Institutional Review Board Statement
Not applicable.
Informed Consent Statement
Not applicable.
Data Availability Statement
The data presented in this study are available on request from the corresponding author.
Conflicts of Interest
The authors declare no conflict of interest.
References
- Su, M.; Zhao, J.; Tian, Z.; Gu, C. Short-term oxidation behavior of 304 stainless steel in N2-21 vol% O2 environment between 900 and 1200 °C. Corros. Sci. 2022, 208, 110612. [Google Scholar] [CrossRef]
- Huang, X.; Li, X.; Zhan, Z.; Xiao, K.; Fang, X.; Li, Z. Effect of Long-Term Pre-oxidation on the Corrosion Rate of 316L Stainless Steel in a High-Temperature Water Environment. J. Mater. Eng. Perform. 2022, 31, 7935–7944. [Google Scholar] [CrossRef]
- Merwin, A.; Rodriguez, D.; Chidambaram, D. Oxidation of superalloys in supercritical water. ECS Trans. 2013, 58, 15–24. [Google Scholar] [CrossRef]
- Qureshi, A.A.; Javed, S.; Javed, H.M.A.; Jamshaid, M.; Ali, U.; Akram, M.A. Systematic Investigation of Structural, Morphological, Thermal, Optoelectronic, and Magnetic Properties of High-Purity Hematite/Magnetite Nanoparticles for Optoelectronics. Nanomaterials 2022, 12, 1635. [Google Scholar] [CrossRef]
- Hafeez, M.; Siddique Saleemi, A.; Ur Rehman, S.; Adrees, M.; Mehmood, S.; Mir, I.A.; Zhu, L. CVD growth of layered Cr2O3 hexagonal flakes for optoelectronic applications. Appl. Surf. Sci. 2021, 536, 147713. [Google Scholar] [CrossRef]
- Cantrell, S.R.; Welch, E.; Scolfaro, L.M.; Geerts, W.J. Opto-electronic properties of carbon doped NiO. J. Phys. Chem. Solids 2023, 174, 111110. [Google Scholar] [CrossRef]
- Li, L.; Zhang, X.; Zeng, H.; Zheng, X.; Zhao, Y.; Luo, L.; Liu, F.; Li, X. Thermally-stable and highly-efficient bi-layered NiOx-based inverted planar perovskite solar cells by employing a p-type organic semiconductor. Chem. Eng. J. 2022, 443, 136405. [Google Scholar] [CrossRef]
- Carbone, M. NiO-Based Electronic Flexible Devices. Appl. Sci. 2022, 12, 2839. [Google Scholar] [CrossRef]
- Bhujel, K.; Rai, S.; Singh, N.S. Review on NiO thin film as hole transport layer in perovskite solar cell. Nanosyst. Phys. Chem. Math. 2021, 12, 703–710. [Google Scholar] [CrossRef]
- Nkele, A.C.; Nwanya, A.C.; Shinde, N.M.; Ezugwu, S.; Maaza, M.; Shaikh, J.S.; Ezema, F.I. The use of nickel oxide as a hole transport material in perovskite solar cell configuration: Achieving a high performance and stable device. Int. J. Energy Res. 2020, 44, 9839–9863. [Google Scholar] [CrossRef]
- Dong, J.; Jia, J.; Shi, B.; Feng, X.; Wu, Y.; Lv, P.; Cao, B. Cr2O3 interlayer at TiO2/perovskite interface propelling the efficiency improvement of perovskite solar cells. Surf. Interfaces 2022, 29, 101761. [Google Scholar] [CrossRef]
- Ghotekar, S.; Pansambal, S.; Bilal, M.; Pingale, S.S.; Oza, R. Environmentally friendly synthesis of Cr2O3 nanoparticles: Characterization, applications and future perspective—A review. Case Stud. Chem. Environ. Eng. 2021, 3, 100089. [Google Scholar] [CrossRef]
- Fan, Z.; Zhu, M.; Pan, S.; Ge, J.; Hu, L. Giant photoresponse enhancement in Cr2Oy films by Ni doping-induced insulator-to-semiconductor transition. Ceram. Int. 2021, 47, 13655–13659. [Google Scholar] [CrossRef]
- Sekizawa, K.; Sato, S.; Arai, T.; Morikawa, T. Solar-Driven Photocatalytic CO2 Reduction in Water Utilizing a Ruthenium Complex Catalyst on p-Type Fe2O3 with a Multiheterojunction. ACS Catal. 2018, 8, 1405–1416. [Google Scholar] [CrossRef]
- Gong, M.; Zhou, W.; Kenney, M.J.; Kapusta, R.; Cowley, S.; Wu, Y.; Lu, B.; Lin, M.-C.; Wang, D.-Y.; Yang, J.; et al. Blending Cr2O3 into a NiO-Ni Electrocatalyst for Sustained Water Splitting. Angew. Chem. Int. Ed. 2015, 54, 11989–11993. [Google Scholar] [CrossRef]
- Hakiki, N.E. Influence of surface roughness on the semiconducting properties of oxide films formed on 304 stainless steel. J. Appl. Electrochem. 2008, 38, 679–687. [Google Scholar] [CrossRef]
- Hakiki, N.E. Comparative study of structural and semiconducting properties of passive films and thermally grown oxides on AISI 304 stainless steel. Corros. Sci. 2011, 53, 2688–2699. [Google Scholar] [CrossRef]
- Maachi, B.; Pirri, C.; Mehdaoui, A.; Hakiki, N.E.; Bubendorff, J.L. Atomic Force Microscopy, Scanning Kelvin Probe Force Microscopy and magnetic measurements on thermally oxidized AISI 304 and AISI 316 stainless steels. Corros. Sci. 2011, 53, 984–991. [Google Scholar] [CrossRef]
- Hakiki, N.E.; Bubendorff, J.L.; Pirri, C.; Mechehoud, F.; Mehdaoui, A.; Belhadji, M. Electrochemical and structural characterization of nickel based alloys oxides. Phys. Procedia 2014, 55, 243–250. [Google Scholar] [CrossRef]
- Benaioun, N.E.; Maafa, I.; Florentin, A.; Denys, E.; Hakiki, N.E.; Moulayat, N.; Bubendorff, J.L. Time dependence of the natural passivation process on AISI 304 in an alkaline medium: Atomic force microscopy and scanning Kelvin probe force microscopy as additional tools to electrochemical impedance spectroscopy. Appl. Surf. Sci. 2018, 436, 646–652. [Google Scholar] [CrossRef]
- Mechehoud, F.; Benaioun, N.E.; Hakiki, N.E.; Khelil, A.; Simon, L.; Bubendorff, J.L. Thermally oxidized Inconel600 and 690 nickel-based alloys characterizations by combination of global photoelectrochemistry and local near-field microscopy techniques (STM, STS, AFM, SKPFM). Appl. Surf. Sci. 2018, 433, 66–75. [Google Scholar] [CrossRef]
- Hadjadj, A.; Larbi, F.; Gilliot, M.; Roca i Cabarrocas, P. Etching of a-Si:H thin films by hydrogen plasma: A view from in situ spectroscopic ellipsometry. J. Chem. Phys. 2014, 141, 084708. [Google Scholar] [CrossRef]
- Azzam, R.M.A.; Bashara, N.M. Ellipsometry and Polarized Light; North-Holland: Amsterdam, The Netherlands, 1997; p. 274. [Google Scholar]
- Aspnes, D.E. Optical properties of thin films. Thin Solid Film. 1982, 89, 249–262. [Google Scholar] [CrossRef]
- Eldlio, M.; Che, F.; Cada, M. Drude-Lorentz model of semiconductor optical plasmons. Lect. Notes Electr. Eng. 2014, 247, 41–49. [Google Scholar] [CrossRef]
- Hones, P.; Diserens, M.; Lévy, F. Characterization of sputter-deposited chromium oxide thin films. Surf. Coat. Technol. 1999, 120–121, 277–283. [Google Scholar] [CrossRef]
- RefractiveIndex.INFO. Available online: https://refractiveindex.info/?shelf=main&book=Fe2O3&page=Querry-e (accessed on 24 August 2022).
- Likhachev, D.V.; Malkova, N.; Poslavsky, L. Modified Tauc-Lorentz dispersion model leading to a more accurate representation of absorption features below the bandgap. Thin Solid Film. 2015, 589, 844–851. [Google Scholar] [CrossRef]
- Poelman, D.; Smet, P.F. Methods for the determination of the optical constants of thin films from single transmission measurements: A critical review. J. Phys. D Appl. Phys. 2003, 36, 1850–1857. [Google Scholar] [CrossRef]
- Xu, T.; Wang, S.; Tang, X.; Li, Y.; Yang, J.; Li, J.; Zhang, Y. Corrosion Mechanism of Inconel 600 in Oxidizing Supercritical Aqueous Systems Containing Multiple Salts. Ind. Eng. Chem. Res. 2019, 58, 23046–23056. [Google Scholar] [CrossRef]
- Mintz, T.S.; Devine, T.M. Influence of surface films on the susceptibility of Inconel 600 to stress corrosion cracking. Key Eng. Mater. 2004, 261–263, 875–884. [Google Scholar] [CrossRef]
- Powell, R.J.; Spicer, W.E. Optical properties of NiO and CoO. Phys. Rev. B 1970, 2, 2182–2193. [Google Scholar] [CrossRef]
- Erkan, S.; Arpat, E.; Peters, S. Investigation of percolation thickness of sputter coated thin NiCr films on clear float glass. Appl. Surf. Sci. 2017, 421, 373–377. [Google Scholar] [CrossRef]
- Hadjadj, A.; St’ahel, P.; Roca i Cabarrocas, P.; Paret, V.; Bounouh, Y.; Martin, J.C. Optimum doping level in a-Si:H and a-SiC:H materials. J. Appl. Phys. 1998, 83, 830–836. [Google Scholar] [CrossRef]
- Tippo, P.; Singjai, P.; Sroila, W.; Jaisamer, T.; Suttanon, N.; Panthawan, A.; Kantarak, E.; Sroila, W.; Thongsuwan, W.; Kumpika, T.; et al. Improving the properties of Fe2O3 by a sparking method under a uniform magnetic field for a high-performance humidity sensor. RSC Adv. 2022, 12, 1527–1533. [Google Scholar] [CrossRef]
- Sarcan, F.; Doğan, U.; Althumali, A.; Vasili, H.B.; Lari, L.; Kerrigan, A.; Kuruoğlu, F.; Lazarov, V.K.; Erol, A. A novel NiO-based p-i-n ultraviolet photodiode. J. Alloys Compd. 2023, 934, 167806. [Google Scholar] [CrossRef]


Disclaimer/Publisher’s Note: The statements, opinions and data contained in all publications are solely those of the individual author(s) and contributor(s) and not of MDPI and/or the editor(s). MDPI and/or the editor(s) disclaim responsibility for any injury to people or property resulting from any ideas, methods, instructions or products referred to in the content. |
© 2023 by the authors. Licensee MDPI, Basel, Switzerland. This article is an open access article distributed under the terms and conditions of the Creative Commons Attribution (CC BY) license (https://creativecommons.org/licenses/by/4.0/).