Abstract
To study the surface morphology of laser cladding, Workbench simulated the influence of laser power and scanning speed on the width and height of the cladding layer numerically, as well as the temperature field change and residual stress distribution of the cladding layer. The simulation results reveal that the melting height and width of the cladding layer are inversely proportional to the scanning speed. When the scanning speed is from V = 3 mm/s to V = 5 mm/s, the Al cladding layer’s melting width and melting height are reduced by 15.59% and 20.8%, respectively. A positive correlation exists between the melting height and width of the cladding layer and the laser power. When the laser power changes from P = 23 w to P = 27 w, the welding width and height of the A1 cladding layer increase by 6.55% and 55.56%, respectively. The melting height and width of the second cladding layer are generally higher than those of the bottom cladding layer. The pre-experiment screening process parameters ranges are laser power P (23 w–27 w) and scanning speed (3 mm/s–8 mm/s). Based on the Minitab response surface central composite method, the most notable influence on the melting height and width is revealed to be the powder-feeding rate and laser power, respectively. The response surface analysis method establishes the regression prediction models of melting width and height. The predicted value of melting width was 95.68%, and the predicted value of melting height was 82.26%. The results show that the values of cladding width and height are within the 95% prediction interval, proving that the regression model is correct.
1. Introduction
Laser cladding technology uses a high-energy laser beam to carry out the workpiece’s high-power, small-scale local precision heating, which has sizeable instantaneous power, a low dilution rate, and a small heat-affected zone [1,2]. As a surface modification technology, the high-energy laser beam causes the cladding material and the substrate to form a metallurgical bond, which can prepare high-performance coatings on low-cost metal surfaces, prolong the service life of parts, and improve the comprehensive performance of materials [3,4,5]. This paper mainly discusses three aspects: numerical simulation of cladding layer morphology, selection of cladding material Ni60-WC, and response optimization analysis of cladding results.
Numerical simulation: Many scholars have studied the influence of pores and cracks on the cladding layer’s surface quality by analyzing the residual stress in the cladding process under different process parameters [6,7]. Others have studied the distribution of residual stress in the cladding layer to control the residual stress by adjusting the process parameters [8,9]. Some scholars have analyzed the influence of different scanning strategies on the morphology of the cladding layer by simulating the laser scanning path [10,11]. Zeng et al. [12] simulated the temperature and stress fields of 6061 aluminum alloy cladding Ni60 by ANSYS and analyzed the influence of preset coating thickness on cladding layer formation. The results show that the thicker the preset coating, the greater the penetration depth and width of the molten pool and the greater the residual stress, but the smaller the melting depth of the substrate. Tavakoli et al. [13] analyzed the height and deformation of different cladding layers by simulating clockwise and counterclockwise circular scanning paths.
Selection of Ni60-WC cladding material: Ni60 material has suitable self-melting properties and good wettability with WC, which is widely used in the surface repair treatment of parts [14]. On the one hand, WC material has high hardness and chemical stability [15,16]. On the other hand, it has a high melting point, and metallurgical bonding with the matrix is difficult. Adding WC material to the cladding material improves the performance of the cladding layer. Still, excessive WC content will cause the cladding layer to break and fall off [17]. Hu et al. [18] prepared Ni-based materials with different WC contents on stainless steel substrate materials. The experimental results show that the increase in WC content will significantly improve the hardness and thermal stability of the coating. Liu et al. [19] used laser cladding technology to clad the Ni60-WC layer on the surface of a copper alloy substrate and tested the sample’s wear and corrosion resistance. The experimental results show that the Ni60-WC coating has good metallurgical bonding strength and hardness, and the sample’s wear and corrosion resistance after cladding are improved.
Results prediction analysis: The morphology of the cladding layer is an essential characteristic index of the laser cladding process [20], which is affected by many factors. Process parameters are the most critical factors affecting the cladding layer formation [21,22]. Therefore, many scholars mainly divide the prediction of cladding layer morphology into algorithm optimization, model establishment, and optimization of statistical variables [23]. The response surface method optimizes statistical variables to solve multivariate problems. In the process of laser cladding, most of the research on the response of cladding results focuses on the laser power, scanning speed, spot diameter, and powder-feeding rate [24]. Based on the response surface optimization method, Lian et al. [25] established a prediction model of process parameters, lap rate, and cladding efficiency, which provided a theoretical basis for the prediction of cladding efficiency. Based on the response surface method and variance analysis, Meng et al. [26] analyzed the relationship between process parameters and coating geometry in single-pass cladding, which provided a reference for multi-objective optimization of composite coatings in the later stage. Sun et al. [27] modeled the cladding layer’s width and height response surface for the laser single-pass cladding TC4 process.
Therefore, in numerical simulation analysis of laser cladding, Workbench establishes the temperature and stress field simulation of a multichannel Ni60-WC cladding layer with return path scanning. The influence of process parameters on the morphology characteristics of cladding layer melting height and melting width is analyzed. The range of process parameters is screened and combined with a laser cladding pre-experiment. The cladding experiment was carried out using the selected process parameters based on the response surface method. The prediction model of melting height and melting width was established and verified by experiments.
2. Multilayer Numerical Simulation Analysis
2.1. Pre-Processing
Grid division: The grid division unit adopts the SOLID70 unit because SOLID70 has eight-node units, which can realize three-way uniform heat transfer. The matrix edge applies size adjustment, the number of partitions is 30, the offset coefficient is 4, and the number of divisions is 5.
Convective heat transfer: the convective heat transfer coefficient of the substrate and air convection is set to 5 W/(m2·°C), the initial temperature is 22 °C, and the lower surface of the substrate regard to an adiabatic state during the laser cladding process. The purpose is to simulate the laser cladding process of the substrate at room temperature.
Boundary conditions: Set the two bottom edges of the matrix to be free in the x direction and fixed in the y and z directions. Specify the bottom edge of the left bottom in the x direction and accessible in the y and z directions. The purpose is to simulate the bending of the substrate after laser cladding.
The laser adopts a Gaussian heat source with a laser absorption coefficient of 0.47 [28,29], and the laser heat source loads in the middle of the front end of the A2 cladding layer. High-speed steel is the base material (50 mm × 50 mm × 1 mm), Ni60 alloy is the backing cladding layer, and Ni60-WC mixed material is the second cladding layer. The birth-and-death unit method simulates the cladding process [30,31,32], and the cladding process is A2 → A3 → A1 → A4, as shown in Figure 1.
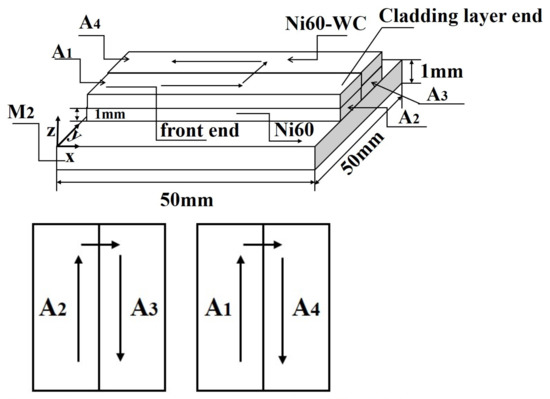
Figure 1.
Laser cladding diagram.
2.1.1. Material Physical Parameters and Composition
The matrix is W6Mo5Cr4V2 high-speed steel. Table 1 and Table 2 display Young’s modulus and thermal physical parameters. Based on JMatPro, the material-related performance parameters were obtained and imported into the Workbench material library for thermo-solid coupling analysis.

Table 1.
Thermal physical parameters of W6Mo5Cr4V2.

Table 2.
Young’s modulus changes with temperature.
The cladding material is Ni60-WC material, and Figure 2 shows the thermophysical parameters [33].
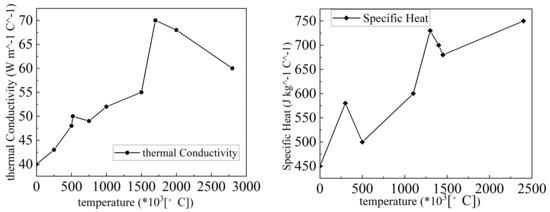
Figure 2.
Thermal physical parameters of Ni60-WC [34].
2.1.2. Numerical Simulation Analysis
The multichannel multilayer laser cladding process is a simulation method based on the finite element method. The APDL language simulates the movement process of the laser heat source and the increase and decrease in the cladding layer material using the birth-and-death element method.
Based on APDL language, the laser cladding path is written using the Gaussian heat source. See Formulas (1) and (2). Set the direction according to the cladding sequence A2 → A3 → A1 → A4, calculating the cladding time according to the laser scanning speed. Establish the step number to 4 and turn on the automatic time step. Setting the time step to 4 equally distributes the time of the four cladding layers. The heat source is located at the center of the front end of the A2 cladding layer and applies cyclic loading through the *DO cycle.
The Gaussian reservoir model in Cartesian coordinates is
where R is the radius of the finite heat source, unit m; A is the aluminum absorption of the material surface layer to the laser, taking A = 0.47; K is the heat source concentration factor; and r is the distance from a point in the heating area to the center of the spot, unit m [35].
As a nonlinear problem of state change, the life-and-death of the component will cause the failure or regeneration of some specified elements [36,37]. A cladding layer is a life-and-death unit, and a substrate is a non-life-and-death unit. Along the direction of the laser scanning speed, when the laser scanning area is unreached, the cladding layer is an unactivated area, and the cladding unit is not displayed. After the laser scanning area, the unactivated cladding layer area is transformed into an activated state and participates in the laser cladding process. The schematic diagram is shown in Figure 3. As a technical means of increasing and decreasing materials, the life-and-death element method provides a theoretical basis for the subsequent simulation of the temperature and stress fields and the selection of simulation process parameters.
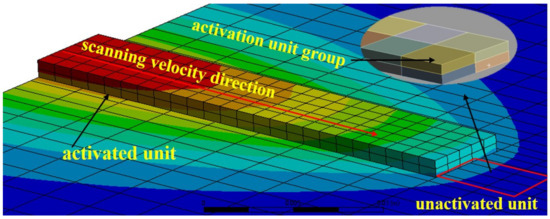
Figure 3.
Life-and-death unit method.
2.2. Effect of Process Parameters on Melting Height and Width
The laser power and scanning speed will directly affect the energy input of the laser to the cladding layer. Exploring the mechanism of laser power and scanning speed on the morphology characteristics of the cladding layer melting height and melting width provides a theoretical basis for adjusting process parameters of subsequent laser cladding experiments.
2.2.1. Effect of Scanning Speed on Melting Height and Width
The nanosecond laser cladding sequence is A2 → A3 → A1 → A4 back-type path cladding. In Figure 4a, the cladding layer melting height and melting width under fixed laser power are inversely proportional to the scanning speed. When the scanning speed changes from V = 3 mm/s to 5 mm/s, the cladding layer melting width values corresponding to A2, A1, A3, and A4 are reduced by 43.93%, 15.59%, 3.03%, and 2.9%, respectively, and the cladding layer melting height values corresponding to A2, A1, A3, and A4 are reduced by 28.6%, 20.8%, 22.4%, and 16.67%, respectively. The reason for this phenomenon is that when the laser power and spot diameter are constant, the increase in scanning speed makes the laser cladding energy decrease in unit time. The amount of cladding powder decreases, resulting in a decrease in cladding height and width.
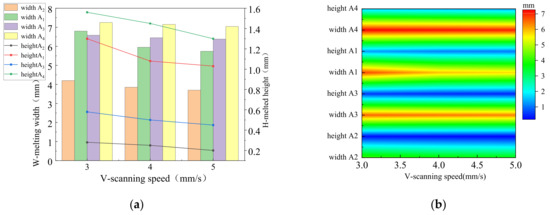
Figure 4.
Variable scanning speed–melting width–melting height relationship: (a) V-W-H variation curves; and (b) V-W-H contour diagrams.
In Figure 4a, the melting height and width of A3 and A4 in the post-cladding area are more significant than that of A2 and A1 in the pre-cladding layer. The reason for this phenomenon is that during multipass cladding, there is heat accumulation in the post-cladding area compared to the cladding area; the melting state time of the molten pool and the amount of cladding powder increases, as well as the melting height and width increase.
In Figure 4b, the width and height of the A1 and A4 cladding layers are more remarkable than those of the A2 and A3 cladding layers. This phenomenon is because, in the process of multilayer laser cladding, there is heat accumulation between the cladding layers and between the layers. When carrying out the second layer of laser cladding, the temperature of the top molten pool is higher than that of the bottom molten pool, and the amount of cladding material increases, so the width and height of the cladding increase.
2.2.2. Effect of Laser Power on Melting Height and Width
Figure 5a shows that the melting width and height positively correlated with the laser power when the scanning speed was 4 mm/s. When the laser power changed from 23 w to 27 w, the cladding width values corresponding to A2, A1, A3, and A4 increased by 11.68%, 6.55%, 4.6%, and 2.8%, respectively, and the cladding height values corresponding to A2, A1, A3, and A4 increased by 28%, 55.56%, 24%, and 6.15%, respectively. The above phenomenon is because laser power directly affects the absorption of laser energy in the cladding layer. The laser power increase will improve the powder utilization rate per unit of time, and the cladding layer’s melting width and height will increase accordingly.
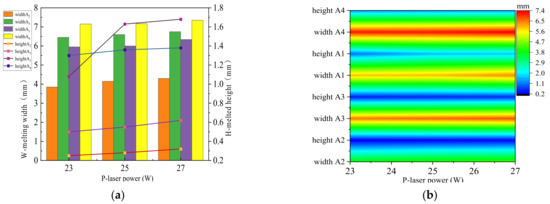
Figure 5.
Relationship between variable laser power and weld width: (a) P-W-H variation curves; and (b) P-W-H contour diagrams.
Figure 5b indicates that the two-layer cladding A1 and A4 cladding height and width values are generally higher than in the bottom cladding area. That the melting width and height increase in the two-layer cladding area is consistent with Figure 4b. The heat accumulation between the cladding layers is the most obvious factor for the increase in melting width and height.
2.3. Temperature Field Change of Melting Height and Width
Simulating the change of laser cladding temperature field allows us to judge the melting point temperature of the cladding layer material under various process parameters, as well as the formation, melting height, and melting width of the cladding layer.
In Figure 6a, the overall temperature change of the multilayer multichannel laser cladding layer shows a stepwise upward trend. Four temperature peaks correspond to A2, A1, A3, and A4 cladding processes. When v = 4 mm/s, the substrate length is 50 mm, and the corresponding time of each cladding time is 12.5 s. The high-speed steel material melts at about 1060 °C according to the overall temperature curve and can form metallurgically bonded between the substrate and the cladding material. The three-stage temperature rise curve can reach the melting point temperature of high-speed steel after 50 s cladding time and heat accumulation, proving that the laser power meets the material melting conditions when P = 23 w, P = 25 w, and P = 27 w.
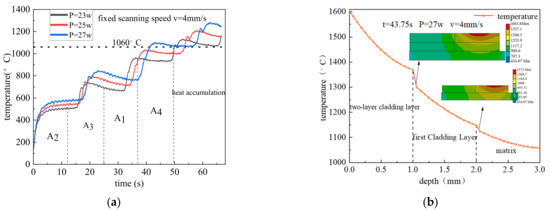
Figure 6.
Temperature field curve: (a) global temperature curve; and (b) variation curve of cladding depth.
As shown in Figure 6b, under the process parameters of P = 27 w and v = 4 mm/s, the cladding depth-temperature change from the surface of the simulated cladding layer (25 mm, 43.75 mm, 2 mm) to the bottom of the substrate (25 mm, 43.75 mm, −1 mm) is simulated. There are two turning points in the temperature change curve. The depth values correspond to 1 mm and 2 mm, located at the junction of the second cladding layer, the bottom cladding layer, and the intersection of the bottom cladding layer and the matrix. The heat-affected zone of the cladding layer presents a circular state distribution. The temperature field value attenuates outward along the center, and the molten pool shapes like a spoon. The temperature gradient at the front end of the molten pool is more significant than that at the tail end. The heat-affected area is affected by heat accumulation, and the range becomes more extensive.
2.4. Change of Cladding Stress Field
The residual stress will affect the morphology of the cladding layer, the quality of the cladding layer, and the size of the bonding force between the cladding layer and the substrate. Therefore, the residual stress distribution of the cladding layer should be studied. Under the premise of determining the quality of the cladding layer, it screens the laser processing parameters to provide theoretical support for selecting the cladding layer width and height.
2.4.1. Cladding Overall Stress Change
Select the middle of the A1 cladding layer as y = 22.5 mm, x = 1 mm, 25 mm, and 49 mm, and plot paths 1, 2, and 3 according to the z direction of the vertical laser scanning speed direction. In Figure 7a, the middle of the z direction’s residual stress is higher than that in the front and end. Compared with the front and back of the cladding layer, the melting height value in the middle of the cladding layer is slightly higher, and the melting width value is lower. The reason is that during the laser cladding process, the substrate with a slender shape and thin thickness is prone to bending. The middle of the cladding layer is subjected to tensile stress, and the residual stress value increases. In contrast, both sides of the substrate are subjected to compressive stress to balance the residual stress in the middle.
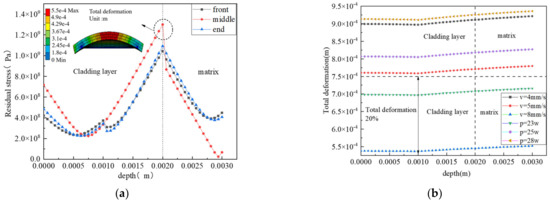
Figure 7.
Overall stress change: (a) overall residual stress changes; and (b) total deformation curve.
In Figure 7b, Workbench simulates the total deformation of the cladding model under different laser powers and scanning speeds. The overall deformation of the cladding is the largest when the process parameters are P = 28 w and V = 4 mm/s. The laser power increase and the scanning speed decrease positively correlate with the cladding layer’s bending degree. The overall thickness of the model is 3 mm when the process parameters are P = 23 w and v = 4 mm/s; when P = 25 w and v = 8 mm/s, the total deformation rate is less than 25% and can carry out laser cladding. Now, bending does not affect the melting height and width of the cladding layer.
2.4.2. Residual Stress Change in Cladding Layer
In Figure 8a, the residual stress value reaches the peaks at the junction of the cladding layer and the substrate. It gradually decreases away from the inside and both sides of the substrate. Therefore, the junction is most prone to fracture or poor metallurgical bonding. The increased laser power and the decreased scanning speed will increase the residual stress of the cladding layer. Figure 8b selects four cladding layers of A1, A2, A3, and A4. Along the direction of laser scanning speed, the residual stress value of the bottom cladding layer is about 2.5 times that of the second cladding layer, which proves that the residual stress at the junction of the cladding layer and the matrix is immense and prone to fracture.
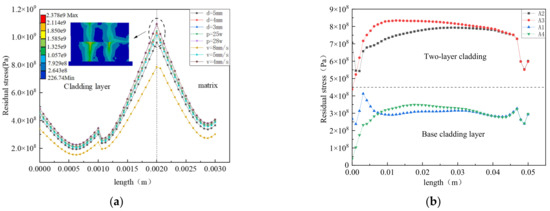
Figure 8.
Residual stress change of cladding layer: (a) residual stress in the z direction of the cladding layer; and (b) residual stress in the z direction of the cladding layer.
3. Laser Cladding Experiment and Analysis
3.1. Laser Cladding Experiment
Experimental process is as follows: selection of cladding layer material, pretreatment of high-speed steel substrate surface, cladding process, laser parameter setting, empirical results analysis.
Experimental materials are as follows: Base high-speed steel material (10 mm × 10 mm × 2 mm), polished by an angle grinder, alcohol washing for surface smoothing. Cladding material: Ni60 alloy (150–300 mesh), WC powder (1 micron), the cladding material, and the substrate material placed at 100 °C in a vacuum-drying oven for 1 hour. The first layer of cladding is with Ni60 alloy powder backing and the second layer is with WC and Ni60 alloy (1:5) mixed. Ni60 alloy backing, as a layer of cladding adhesive, improves the metallurgical bonding strength. The purpose of the second cladding layer using Ni60 and WC mixed material is to improve the wear resistance and hardness of the cladding layer. The chemical composition of Ni60 is shown in Table 3 below.

Table 3.
Ni60 elemental composition (wt.%).
Cladding process: The bottom cladding layer is laser cladding for 2 min by the preset powder laying method. After the cladding begins, the powder is fed once by the side shaft at 1 min. After 2 min of cladding, carry out the second cladding layer by side-shaft powder feeding. The total cladding time is about 3.5 min–4 min, and Figure 9a shows the cladding process.

Figure 9.
Cross section of the cladding layer: (a) schematic diagram of the cladding experimental process; and (b) the cross-section structure of cladding layer and matrix.
Laser parameter settings: The laser uses a B3 Smart fiber nanosecond laser with a fixed spot diameter of 50 um, a laser pulse of 10 ns, a focal length of 31.9 mm, a laser wavelength of 1064 nm, a laser maximum power of Pmax = 60 w, and a laser frequency of 30 KHz. The laser scanning path uses a zigzag, and the scanning path interval is 0.03 mm.
After the experiment, the cladding layer’s surface was cut and polished, and the cladding layer’s width and height were measured. Figure 9b describes the schematic diagram. W represents the width of the cladding layer, H represents the height of the cladding layer, and W/H represents the aspect ratio of the cladding layer.
Experimental equipment were as follows: nanosecond fiber laser, auxiliary side-axis powder feeder, and HG-1 video microscope. Figure 10 explains the side-shaft powder-feeding mechanism.

Figure 10.
Off-axis powder-feeding device.
The transmission mode of the mechanism is screw drive in the direction of x, y, and z, corresponding to mechanisms 1, 3, and 2 in Figure 10 (left), respectively, to carry out powder feeding motion; Mechanism 4 is an oscillating device, which controls cylinder 5 to load and feed the cladding powder. The 8 and 9 devices correspond to the speed regulating valve and the air pump device, respectively, constituting the air pressure regulating circuit. The cylinder body provides a powder-feeding port and can carry out the operation when the cylinder is horizontal. The top of the powder-feeding cylinder connects to the air pressure control circuit. The 555 air pump is connected to the 5 v and 2 A power supply to control the powder flow through the adjusting valve to carry out the off-axis powder-feeding process.
Pre-Experiment
Through the above numerical simulation analysis, the process parameters such as P = 23 w, 25 w, 28 w, V = 2 mm/s, 4 mm/s, 5 mm/s, and 8 mm/s were pre-tested to determine the range of process parameters.
Figure 11a–c show that the surface quality improves with the decrease in laser power. When P = 23 w, the quality of the cladding layer reaches the best value, reaching the melting point of the cladding material. The temperature field simulation results are verified. When P = 23 w, the melting phenomenon of high-speed steel material occurs at 1060 degrees, forming metallurgical bonding. When P = 28 w, the surface of the cladding layer will form melting holes and cracks. The simulation results of the temperature field were verified. In multichannel laser cladding, the overall temperature change shows a stepwise upward trend. The phenomenon of heat accumulation in the cladding process will make the end temperature of the cladding layer higher than the front and middle ends.
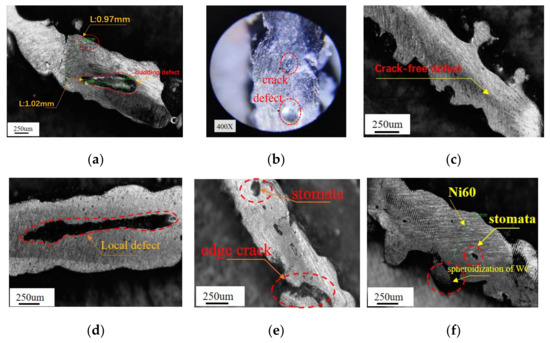
Figure 11.
Pre-experimental results: (a) P = 28 w; (b) P = 25 w; (c) P = 23 w; (d) V = 2 mm/s; (e) V = 5 mm/s; and (f) V = 8 mm/s.
Figure 11d–f show that when the scanning speed v = 2 mm/s, the laser has an impact on the powder and causes the powder to disperse, resulting in local defects, but the powder particles are fully clad. When v = 8 mm/s, the increase in scanning speed will reduce the impact force on the powder. The surface quality of the cladding layer can be improved by sufficiently cladding the powder particles. When V = 5 mm/s, both ends of the cladding layer are easily deformed and generate cracks. This phenomenon verifies the stress field simulation results. In the thin substrate of laser cladding, both sides of the cladding layer are subjected to compressive stress to balance the residual stress in the middle, resulting in easy deformation at both ends of the cladding layer.
Therefore, the pre-experimental results can determine the range of process parameters based on spot diameter, laser power P (23 w–27 w), and scanning speed (3 mm/s–8 mm/s).
3.2. Scheme Design
Based on the response surface method, identify the laser power (A), scanning speed (B), and powder-feeding rate (C) as optimization variables and regard the melting width (D), melting height (E), and aspect ratio (F) as response variables. Using central composite design (CCD), construct the relationship between optimization and response variables. Establish eight cubic points, six asterisk points, and six center points, a total of twenty groups of a center composite experiment. Table 4 and Table 5 reveal the coding level table, experimental scheme, and results, respectively.

Table 4.
Process parameter level table.

Table 5.
Experimental scheme and results.
3.3. Response Surface Analysis
3.3.1. Model Variance Analysis
Based on the experimental results, Minitab software fits the data in Table 5. Establish the mathematical relationships of melting width, height, and aspect ratio and analyze variance. By analyzing the model p value, R2, and R-sq, we can see the accuracy of the model prediction. Table 6 represents the variance analysis results of the cladding layer melting width and height, respectively.

Table 6.
Variance analysis of melting width and height.
From the analysis of the variance of melting width in Table 6, it is shown that the powder-feeding rate (C) and the square term have a quite predominance effect on the melting width (P < 0.0001). The laser power (A) of the linear part and the two-factor interaction (AB) have a comparatively notable effect on the melting width of the cladding layer (P < 0.05). The model error mismatch is 0.74 > 0.05 in Table 7, indicating that the aberration is insignificant, and R-sq (prediction) = 95.68% > 70%, indicating that the mathematical model is significant.

Table 7.
Summary of models.
Figure 12a shows the standardized effect plot of the melting width (statistics and Analysis of factor significance), in which the primary and secondary order of process parameters affecting melt width is A2 > B2 > C > C2 > AB. The variance analysis of melting height reveals that the powder-feeding rate (C) has a quite predominance effect on the melting height (P < 0.0001), and the laser power (A) and square term (B2) (C2) have a comparatively notable effect on the melting height (P < 0.05). The model error loss is 0.713 > 0.05, indicating that the error loss is insignificant; R-sq (prediction) = 82.26% > 70%, meaning that the mathematical model is significant.

Figure 12.
Standardized effect Pareto plots: (a) melting width; and (b) melting height.
According to the standardized effect Pareto plot of the melting height (statistics and Analysis of factor significance) shown in Figure 12b, the primary and secondary order of process parameters affecting the molten height is C > A > C2 > B2. The variance analysis of the width–height ratio is consistent with width. The variance results of the aspect ratio revealed that powder-feeding rate (C), laser power*laser power (A2), and scanning speed*scanning speed (B2) had a pretty significant effect on the aspect ratio (P < 0.0001). The error lack of fit is 0.572, more notable than 0.05, indicating that the model’s lack of fit is insignificant. R-sq (prediction) equals 72.4%, and the predicted value is more excellent than 70%, indicating that the mathematical model predominates.
3.3.2. Data Screening
According to the overall temperature change curve of the temperature field, whether the temperature of the cladding layer and the substrate reaches the melting point temperature of the material can be observed and screens the combination of process parameters. When v = 4 mm/s, P = 23 w, 25 w, 27 w; when v = 3 mm/s, P = 23 w.
The serial number headings in Figure 13 correspond to the serial number of the experimental cladding group in Table 5. The comparison of Figure 13d,i shows that when the process parameters of v = 4 mm/s and f = 1.5 g/min are determined, the cladding layer width increases by 0.25 mm, and the melting height increases by 0.16 mm when the laser power changes from P = 21.6 w to 28.36 w. This phenomenon proves the correctness of the simulation. The cladding layer’s melting width and height correlate with increased laser power.
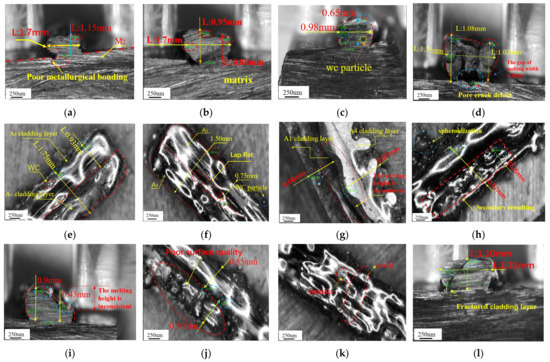
Figure 13.
Section-surface morphology of cladding layer: (a) 5-section; (b) 15-section; (c) 3-section; (d) 10-section; (e) 5-surface; (f) 15-surface; (g) 3-surface; (h) 10-surface; (i) 9-section; (j) 9-surface; (k) 11-surface; and (l) 11-section.
The comparison of the 11 and 12 groups in Table 5 shows that when other process parameters are constant, the melting width of the cladding layer decreases by 0.03 mm, and the melting height decreases by 0.02 mm by increasing the scanning speed. The results show that the simulation is correct. The melting width and height of the cladding layer negatively correlate with increased scanning speed.
According to the surface morphology of the cladding layer and the cross section size of the cladding layer, it can be discerned that the width of the cladding layer in Figure 13a–c is the same as that of Figure 13d,i,l. The cladding layer height is inconsistent in Figure 13i, proving the correctness of the simulation results. The cladding area height value is greater than the pre-cladding layer height value.
The surface morphology of the cladding layer in Figure 13e–g is better than that of the cladding layer in Figure 13h,j,k. It can be perceived from Figure 13d that when P = 28.36 w and v = 4 mm/s, there are pores, cracks, and poor metallurgical bonding between the substrate and the cladding material. This phenomenon verifies the simulation results of the residual stress of the cladding layer. The increased laser power and the decreased scanning speed will aggravate the residual stress of the cladding layer, resulting in cracks and other defects in the metallurgical bonding.
The surface morphology of Figure 13h shows the poor surface quality of the multipass cladding layer in the cladding process due to the considerable laser power, resulting in cladding material splashing and the substrate over-melting. The temperature of the cladding layer cannot reach the melting point temperature of the cladding material when P = 21.63 w and v = 4 mm/s, resulting in inconsistent melting width of the cladding layer.
In Figure 13l, cracks appear in the cladding layer and the substrate during the cladding process. The reason is that when v = 2.32 mm/s causes the thermal stress concentration, the laser’s instantaneous energy density will be enormous. However, the appearance of cracks relates to the amount of WC added to the cladding material. Excessive WC content will increase the thermal sensitivity of the cladding layer.
According to the temperature field curve, cladding layer section, and surface topography, the optimum process parameters are P = 23 w, v = 3 mm/s, f = 2 g/min; P = 25 w, v = 4 mm/s, f = 1.5 g/min.
3.3.3. Regression Model Results and Analysis
Establish the regression prediction model based on the response surface method as follows:
The contour map of Figure 14a indicates the cladding layer width distribution area under the interaction of factors (AB). The increase in laser power will expand the size of the molten pool, melt more powder, and increase the width of the molten pool. However, increasing the scanning speed will reduce the probability of cladding powder entering the molten pool. Therefore, under the premise of f = 1.5 g/min, the melting width is the largest in the range of 24 w < P < 26 w and 3.6 mm/s < v < 4.3 mm/s.
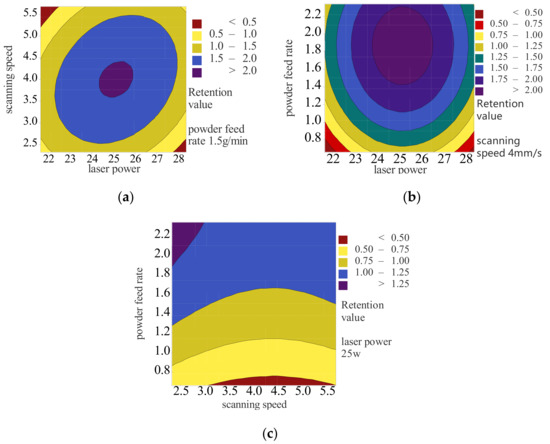
Figure 14.
Contour diagram: (a) P-V melting width; (b) P-f melting width; and (c) V-f melting height.
Figure 14b explains that the cladding width increases with improved laser power and powder-feeding rate. The reason is that the increase in laser power will expand the range of the molten pool. Under the condition of a high powder-feeding rate, increasing the amount of cladding powder will make the cladding layer wider. The results show that the melting width is the largest under 24 w < P < 26 w, 1.6 g/min < f < 1.8 g/min.
Figure 14c reveals that with the low scanning speed and high powder-feeding rate under the action of standard factors, the melting height of the cladding layer will increase during the cladding process., and the melting height value will achieve the maximum range of 1–1.25 mm.
According to the main effect diagram in Figure 15, it can be seen that the powder-feeding rate has a positive effect on the melting height and width. For the melting height, the minimum value of melting height is when the scanning speed v = 5 mm/s; for the melting width, when v = 4 mm/s, the melting width value (1.78 mm) reaches the peak, and when 4 mm/s < v < 5 mm/s, the melting width value decreases.

Figure 15.
Main effect diagram: (a) melting width; and (b) melting height.
The laser power has a positive effect on the melting height. For the melting width, the peak value of the melting width appears at P = 25 w. When 25 w < P < 27 w, the melting width decreases. After the laser power and scanning speed reach the peak of the melting width, the reason for the decrease of the melting width is that the factors affecting the melting width are two-factor interaction, and the numerical distribution of the melting width is consistent with the distribution in Figure 14a,b.
3.3.4. Regression Model Prediction and Validation
Use the response optimizer in the Minitab response surface to set the target value for the response. According to the data screening results, the maximum target value of the melting width is set at 1.7–1.97 mm. The obtained process parameters are P = 25 w, v = 4 mm/s, and f = 1.28 g/min, and the value of the melting width is 1.9 mm. The maximum target value of the melting height is set at 0.65–1.15 mm, and the process parameters are P = 25 w, v = 4 mm/s, and f = 1.41 g/min, and the value of the melting height is 0.9 mm.
The predicted response values are shown in Table 8 below. Using the optimized process parameters P = 25w, v = 4 mm/s, f = 1.35 g/min to carry out three cladding experiments, respectively, the cladding height values were 0.85 mm, 0.98 mm, and 1.06 mm, respectively. The melting width values were 2.15 mm, 1.98 mm, and 2.1 mm, respectively. The experimental melting height and width values are within the 95% prediction interval, proving that the model prediction is accurate.

Table 8.
Multi-response prediction.
4. Conclusions
Aiming at multilayer multichannel nanosecond laser cladding high-speed steel substrate, workbench software was used to simulate the multilayer multichannel laser cladding process, to study the effects of laser power and scanning speed on the cladding height and width of the cladding layer, and to explored the temperature and stress field changes at the melting height and width. Used Minitab software based on the response surface method to design the central composite experiment, analyzed the cladding layer’s melting height and width variance, and established the regression prediction model of melting height, melting width, and aspect ratio. The optimal process parameters were screened and verified by experiments.
- The numerical simulation results reveal that the cladding height and width are inversely proportional to the scanning speed, and the cladding width and height are positively correlated with the laser power. Increased laser power and decreased scanning speed positively correlate with the cladding layer’s bending degree. The bending of the cladding layer will make the middle melting height slightly higher and the melting width lower.
- According to the analysis of the response surface method, the primary and secondary order of process parameters affecting the weld height is f > P > f2 > v2, and the primary and secondary order of process parameters affecting the weld width is P2 > v2 > f. The interaction between P and v factors significantly affects the weld width. The increase in laser power will increase the melting width. Under the condition of low scanning speed and high powder-feeding rate, the melting height will increase.
- The optimal process parameters P = 25 w, v = 4 mm/s, and f = 1.5 g/min were screened and compared. The results indicate that the melting width and height are within the 95% prediction range using the response optimizer.
- In future research, laser cladding experiments can be carried out by adjusting the laser process parameters to predict the defects of different shapes and thicknesses. Consider the model prediction analysis under different cladding layer overlap rates. It is significant to study the laser cladding repair technology of high-speed steel tools based on the Ni60-WC system by applying integral tools of high-speed steel material.
Author Contributions
Methodology, R.Y. and Z.L.; software, R.Y.; formal analysis, R.Y. and Z.L.; writing—original draft, R.Y.; data curation, R.Y.; supervision, Z.L. All authors have read and agreed to the published version of the manuscript.
Funding
This research received no external funding.
Institutional Review Board Statement
Not applicable.
Informed Consent Statement
Not applicable.
Data Availability Statement
Not applicable.
Conflicts of Interest
The authors declare no conflict of interest.
References
- Lisiecki, A. Development of laser welding and surface treatment of metals. Materials 2022, 15, 1765. [Google Scholar] [CrossRef] [PubMed]
- Yap, C.; Chua, C.; Dong, Z.; Liu, Z.; Zhang, D.; Loh, L.E.; Sing, S. Review of selective laser melting: Materials and applications. Appl. Phys. Rev. 2015, 2, 41101. [Google Scholar] [CrossRef]
- Zhu, L.; Wang, S.; Pan, H. Research on remanufacturing strategy for 45 steel gear using H13 steel powder based on laser cladding technology. J. Manuf. Process. 2020, 49, 344–354. [Google Scholar] [CrossRef]
- Wang, Y.; Zhou, J.; Zhang, T.; Li, P.; Zhu, H.; Meng, X. Effects of WC Particles on the Microstructure of IN718/WC Composite Coatings Fabricated by Laser Cladding: A Two-Dimensional Phase-Field Study. Coatings 2023, 13, 432. [Google Scholar] [CrossRef]
- Chakraborty, S.S.; Dutta, S. Estimation of dilution in laser cladding based on energy balance approach using regression analysis. Sādhanā 2019, 44, 150. [Google Scholar] [CrossRef]
- Liu, L.; Qi, Z.; Wang, B.; Zhang, G.; Wang, X.; Wang, D. Numerical simulation of temperature field during electron beam cladding for NbSi2 on the surface of Inconel617. Mater. Res. Express 2018, 5, 036528. [Google Scholar] [CrossRef]
- Wang, R.; Shen, G.B.; Wei, D.Q. Numerical simulation and experimental verification of temperature field for 6061 aluminum alloy surface modification by electron beam. Trans. Mater. Heat Treat. 2012, 33, 5. [Google Scholar]
- Vasinonta, A.; Beuth, J.L.; Griffith, M. Process maps for predicting residual stress and melt-pool size in the laser-based fabrication of thin-walled structures. J. Manuf. Sci. Eng. 2007, 129, 101–109. [Google Scholar] [CrossRef]
- Somashekara, M.A.; Naveenkumar, M.; Kumar, A.; Viswanath, C.; Simhambhatla, S. Investigations into effect of weld-deposition pattern on residual stress evolution for metallic additive manufacturing. Int. J. Adv. Manuf. Technol. 2017, 90, 2009–2025. [Google Scholar] [CrossRef]
- Hoseinpour Gollo, M.; Mahdavian, S.M.; Moslemi Naeini, H. Statistical analysis of parameter effects on bending angle in laser forming process by pulsed Nd: YAG laser. Opt. Laser Technol. 2011, 43, 475–482. [Google Scholar] [CrossRef]
- Shen, H.; Shi, Y.; Yao, Z. Numerical simulation of the laser forming of plates using two simultaneous scans. Comput. Mater. Sci. 2006, 37, 239–245. [Google Scholar] [CrossRef]
- Zeng, Z.; Liu, H.; Tang, J.; Peng, Z.; Gong, Y. Effect of Pre-Set Coating Thickness on the Quality of Electron Beam Cladding Forming of Aluminum Alloys. Coatings 2022, 12, 350. [Google Scholar] [CrossRef]
- Tavakoli, A.; Moslemi Naeini, H.; Roohi, A.H.; Hoseinpour Gollo, M.; Imani Shahabad, S. Codification of scan path parameters and development of perimeter scan strategies for 3D bowl-shaped laser forming. Opt. Laser Technol. 2018, 98, 121–133. [Google Scholar] [CrossRef]
- Fan, S.; Zhang, L.; Li, H. Effect of initial state of WC on microstructure and properties of laser cladding Ni60/WC coatings. Trans. Mater. Heat Treat. 2021, 42, 157–162. [Google Scholar]
- Lu, L.; Feng, D.; Wang, Y. Microstructure, wear resistance and electrochemical properties of spherical/non-spherical WC reinforced Inconel 625 superalloy by laser melting deposition. J. Manuf. Process. 2022, 74, 413–422. [Google Scholar]
- Tan, C.; Hu, J.; Shi, Q. Enhanced hardness and toughness in WC/W2C-Ni-Cu composites fabricated by selective laser melting. Int. J. Refract. Hard Met. 2022, 105, 105805. [Google Scholar] [CrossRef]
- Luo, J.; Niu, B.; Chen, J. Preparation Technology and Properties of Metal Matrix Composite wear-resistant Materials Reinforced by WC Particles. J. Netshape Form. Eng. 2020, 12, 126–131. [Google Scholar]
- Hu, Y.; Wang, Z.; Pang, M. Effect of WC content on laser cladding Ni-based coating on the surface of stainless steel. Mater. Today Commun. 2022, 31, 103357. [Google Scholar] [CrossRef]
- Liu, Y.; Xu, T.; Li, G. Research on Wear and Corrosion Resistance of Ni60-WC Coating Fabricated by Laser on the Preheated Copper Alloy. Coatings 2022, 12, 1537. [Google Scholar] [CrossRef]
- Shi, Y.; Li, Y.F.; Liu, J. Investigation on the parameter optimization and performance of laser cladding a gradient composite coating by a mixed powder of Co50 and Ni/WC on 20CrMnTi low carbon alloy steel. Opt. Laser Technol. 2018, 99, 256–270. [Google Scholar] [CrossRef]
- Zheng, Y.; Liu, F.; Gao, J.; Liu, F.; Huang, C.; Zheng, H.; Wang, P.; Qiu, H. Effect of different heat input on the microstructure and mechanical properties of laser cladding repaired 300M steel. J. Mater. Res. Technol. 2023, 22, 556–568. [Google Scholar] [CrossRef]
- Ebrahimnia, M.; Xie, Y.; Chi, C. Effect of cladding parameters on microstructure and defects in direct laser metal deposition of 24CrNiMo steel. J. Laser Appl. 2021, 33, 012007. [Google Scholar] [CrossRef]
- Fu, Y.; Downey, A.R.; Yuan, L.; Zhang, T.; Pratt, A.; Balogun, Y. Machine learning algorithms for defect detection in metal laser-based additive manufacturing: A review. J. Manuf. Process. 2022, 75, 693–710. [Google Scholar] [CrossRef]
- Zhang, H.; Pan, Y.; Zhang, Y.; Lian, G.; Cao, Q.; Yang, J. Influence of laser power on the microstructure and properties of in-situ NbC/WCoB–TiC coating by laser cladding. Mater. Chem. Phys. 2022, 290, 126636. [Google Scholar] [CrossRef]
- Lian, G.; Yao, M.; Chen, C. Quality and efficiency control method of laser cladding multipass lap forming. Surf. Technol. 2018, 47, 229–239. [Google Scholar]
- Meng, X. Prediction of Laser Fuse Cladding Appearance Made from Ni-WC Alloy Powder. China Heavy Equip. 2014, 119, 33–36. [Google Scholar] [CrossRef]
- Sun, Y.; Hao, M. Statistical analysis and optimization of process parameters in Ti6Al4V laser cladding using Nd; YAG laser. Opt. Lasers Eng. 2012, 50, 985–995. [Google Scholar] [CrossRef]
- Wang, S.; Tong, H.; Wang, D.; Li, X. Thermodynamic Analysis and Experimental Study of Masked Corrosion Protection of 304 Stainless Steel Processed with Nanosecond Pulsed Laser. Metals 2022, 12, 749. [Google Scholar] [CrossRef]
- Chen, Y.; Li, X.; Liu, J.; Zhang, Y.; Chen, X. Effect of Scanning Speed on Properties of Laser Surface Remelted 304 Stainless Steel. Micromachines 2022, 13, 1426. [Google Scholar] [CrossRef]
- Zhang, Y.; Jin, Y.; Chen, Y.; Liu, J. Design a New Type of Laser Cladding Nozzle and Thermal Fluid Solid Multi-Field Simulation Analysis. Materials 2021, 14, 5196. [Google Scholar] [CrossRef]
- Ma, C.; Wei, X.; Yan, B.; Yan, P. Numerical Simulation of Moving Heat Flux during Selective Laser Melting of AlSi25 Alloy Powder. Metals 2020, 10, 877. [Google Scholar] [CrossRef]
- Wang, J.; Zhang, Q.; Shen, W.; Liang, Z.; Chang, C.; Yang, L.; Li, J.; Huang, F. Failure Analysis of a Chromium Plating Layer on a Piston Rod Surface and the Study of Ni-Based Composite Coating with Nb Addition by Laser Cladding. Metals 2022, 12, 1194. [Google Scholar] [CrossRef]
- Zheng, L.; Li, Y.; He, D.; Fu, X.; Fu, Y. Analysis on temperature field of multi-path laser claded and microstructure of coatings layer. Infrared Laser Eng. 2013, 35, 107–110. [Google Scholar]
- Chen, X. Experiment and Numerical Simulation of Surface Laser Cladding Small Blade. Master’s Thesis, Fujian University of Technology, Fuzhou, China, 2022. [Google Scholar]
- Zhang, Z.; Wang, Y.; Ge, P.; Wu, T. A Review on Modelling and Simulation of Laser Additive Manufacturing: Heat Transfer, Microstructure Evolutions and Mechanical Properties. Coatings 2022, 12, 1277. [Google Scholar] [CrossRef]
- Perić, M.; Garašić, I.; Gubeljak, N.; Tonković, Z.; Nižetić, S.; Osman, K. Numerical Simulation and Experimental Measurement of Residual Stresses in a Thick-Walled Buried-Arc Welded Pipe Structure. Metals 2022, 12, 1102. [Google Scholar] [CrossRef]
- Perić, M.; Tonković, Z.; Karšaj, I.; Stamenković, D. A simplified engineering method for a T-joint welding simulation. Therm. Sci. 2018, 22, S867–S873. [Google Scholar] [CrossRef]
Disclaimer/Publisher’s Note: The statements, opinions and data contained in all publications are solely those of the individual author(s) and contributor(s) and not of MDPI and/or the editor(s). MDPI and/or the editor(s) disclaim responsibility for any injury to people or property resulting from any ideas, methods, instructions or products referred to in the content. |
© 2023 by the authors. Licensee MDPI, Basel, Switzerland. This article is an open access article distributed under the terms and conditions of the Creative Commons Attribution (CC BY) license (https://creativecommons.org/licenses/by/4.0/).