
The Amorphous Carbon Thin Films Synthesized by Gas Injection Magnetron Sputtering Technique in Various Gas Atmospheres

 ,
,  , , ,
, , , 
Abstract
1. Introduction
- (1)
- (2)
- By recording the effects of the interaction of the energetic GIMS plasma with the substrate surface [31];
- (3)
- (4)
2. Materials and Methods
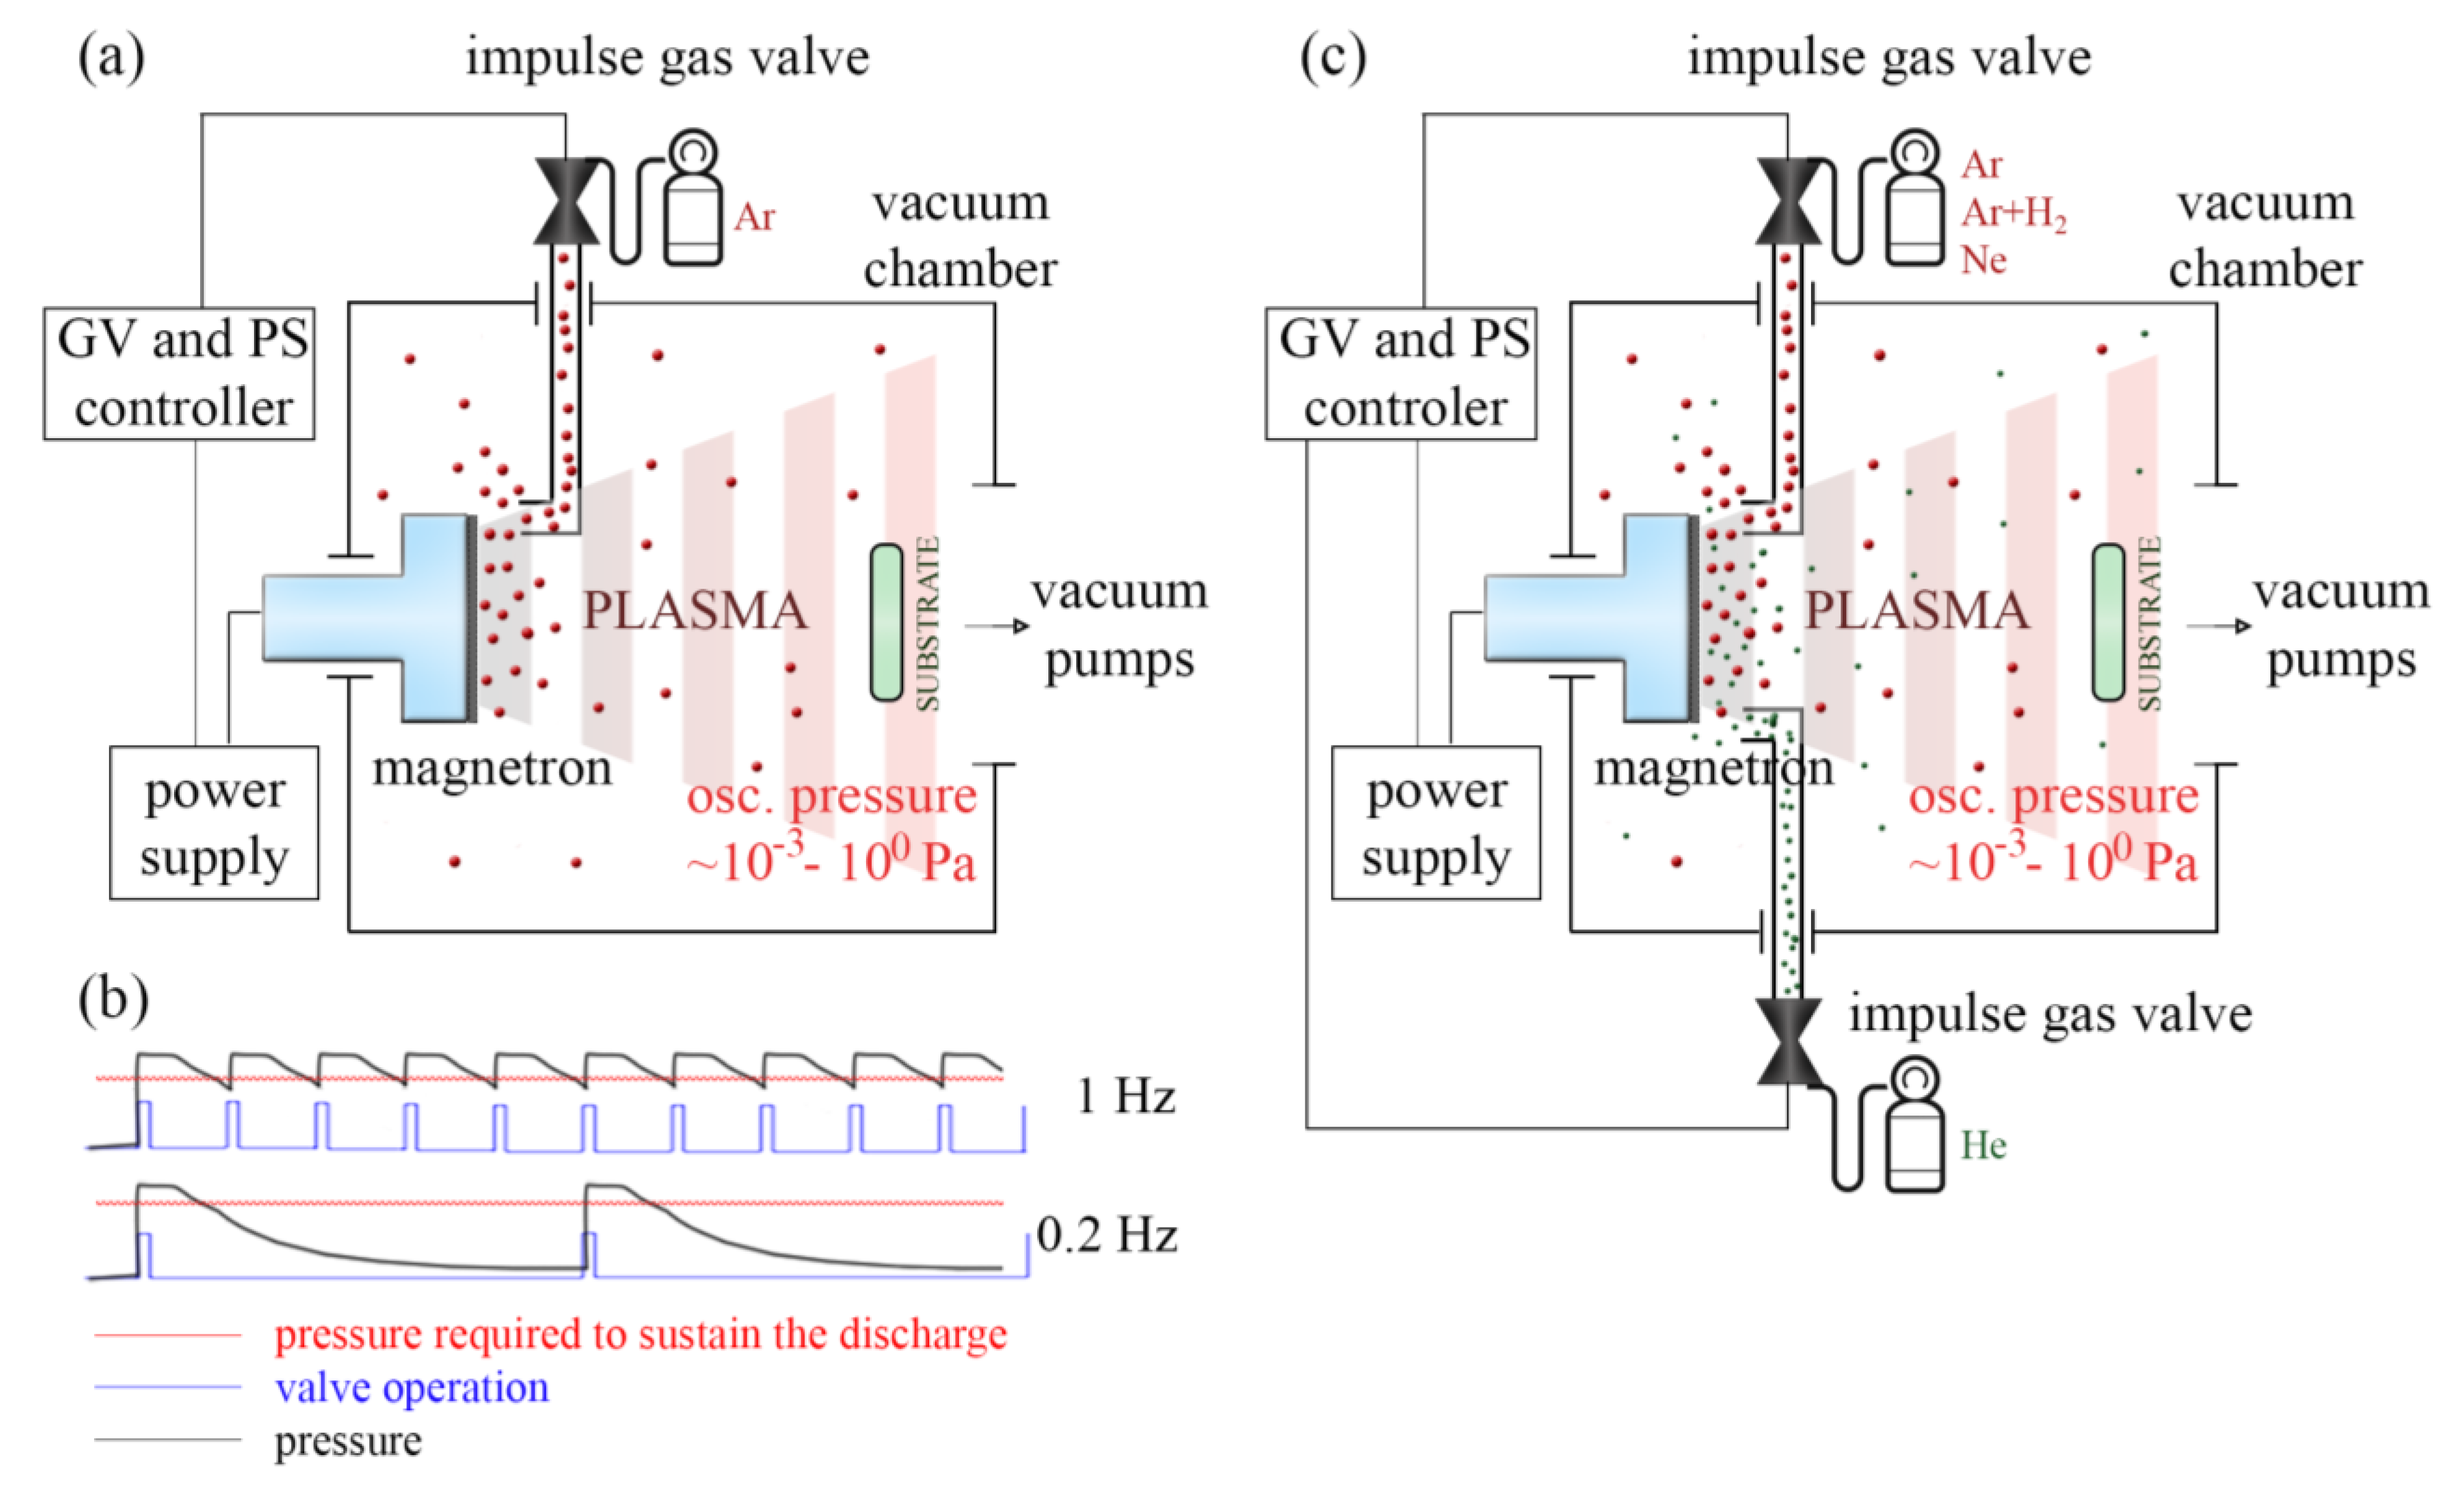
2.1. Apparatus
2.2. Coatings Synthesis Processes
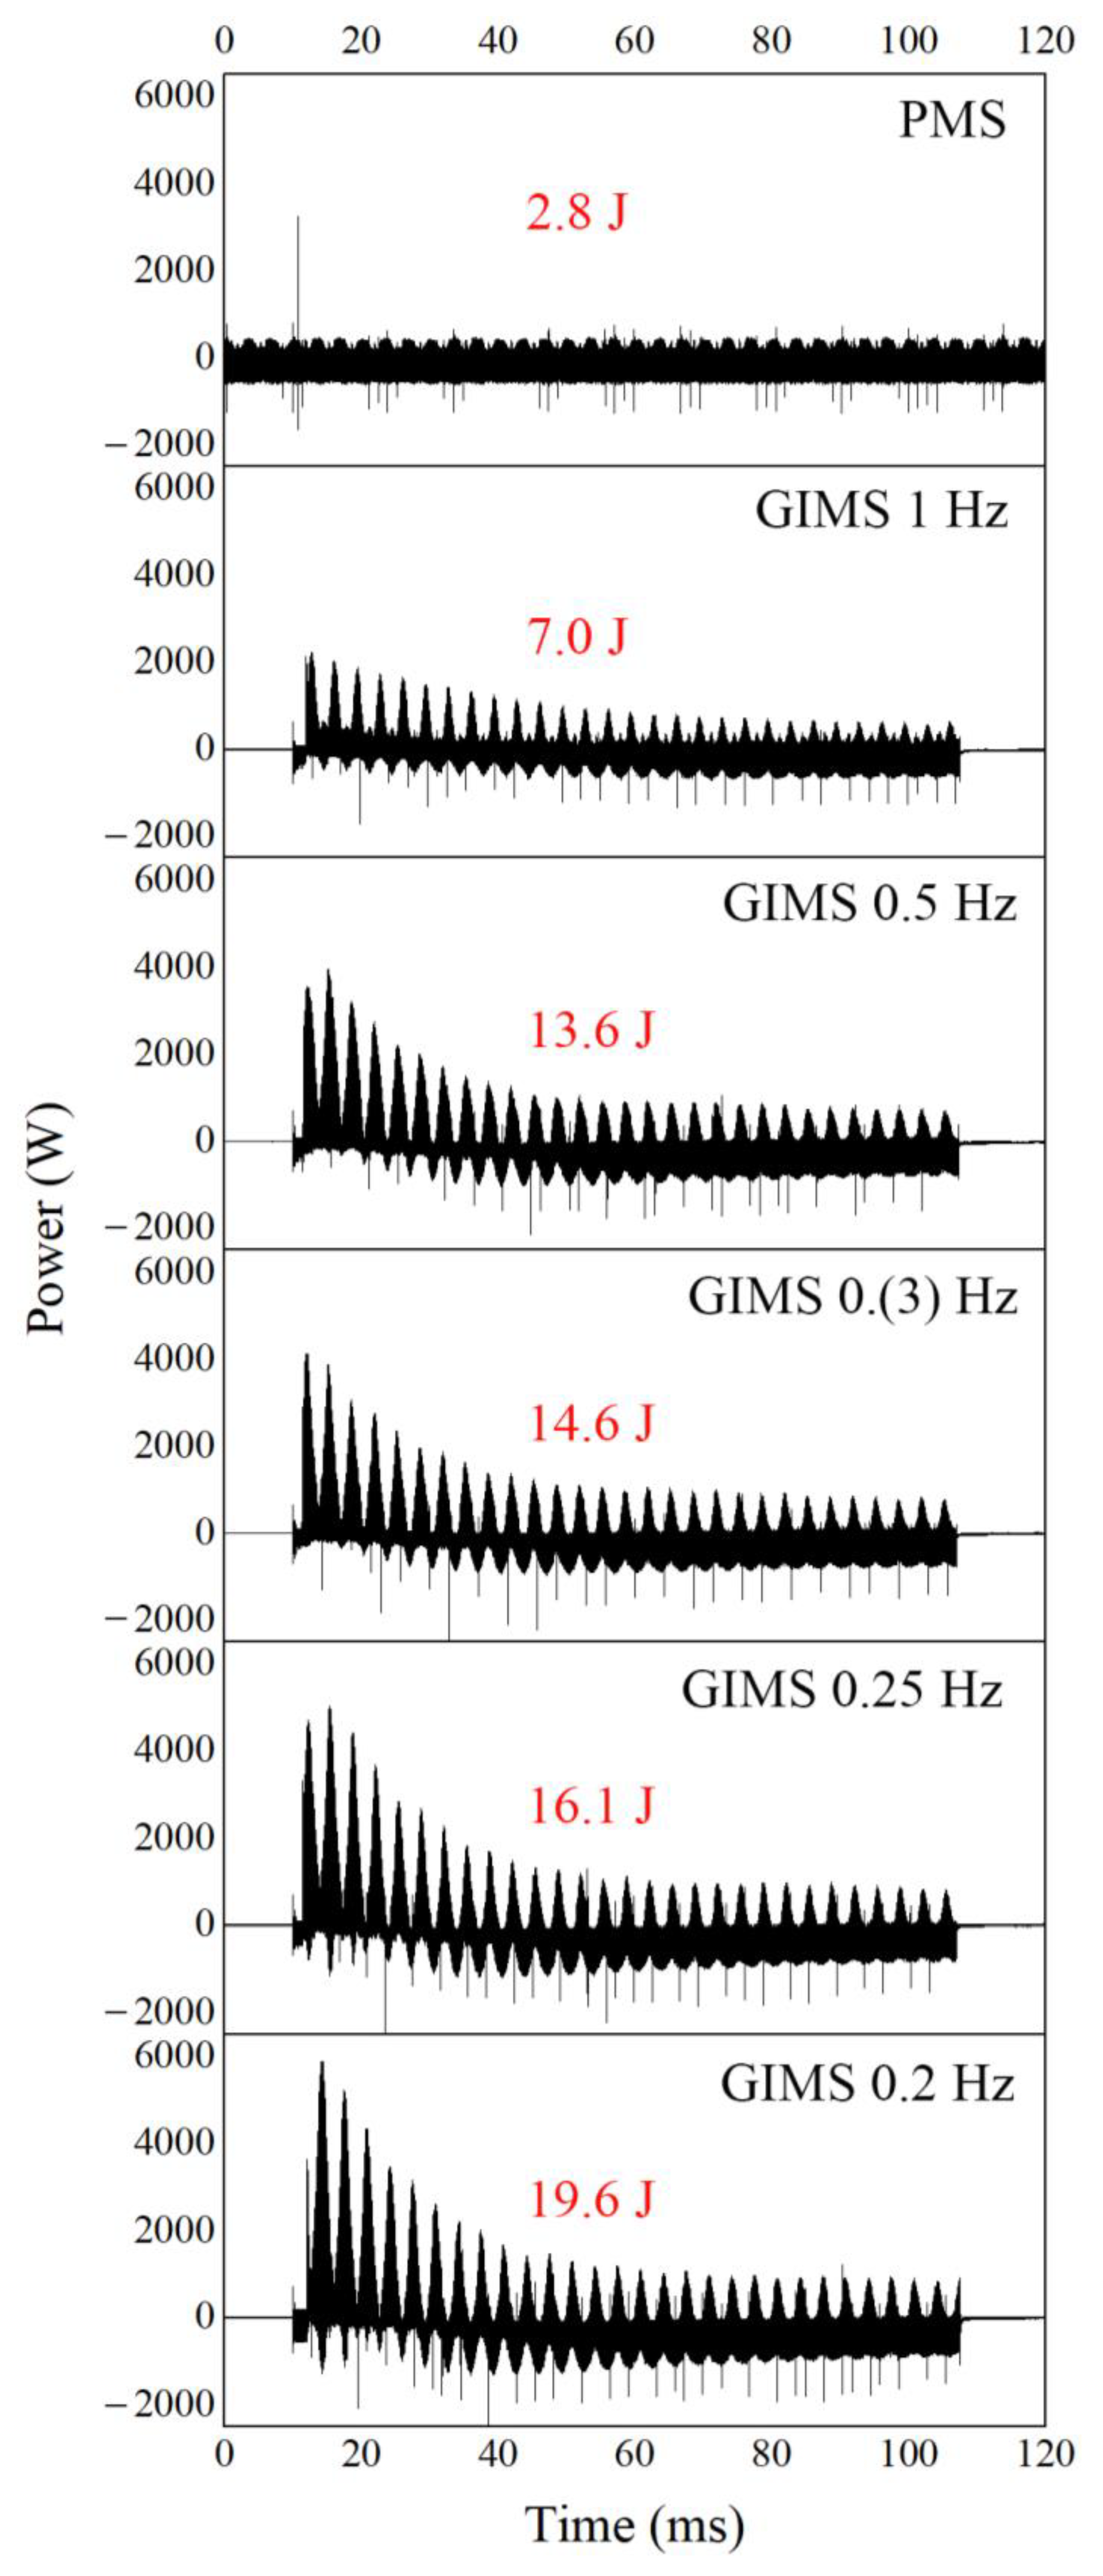
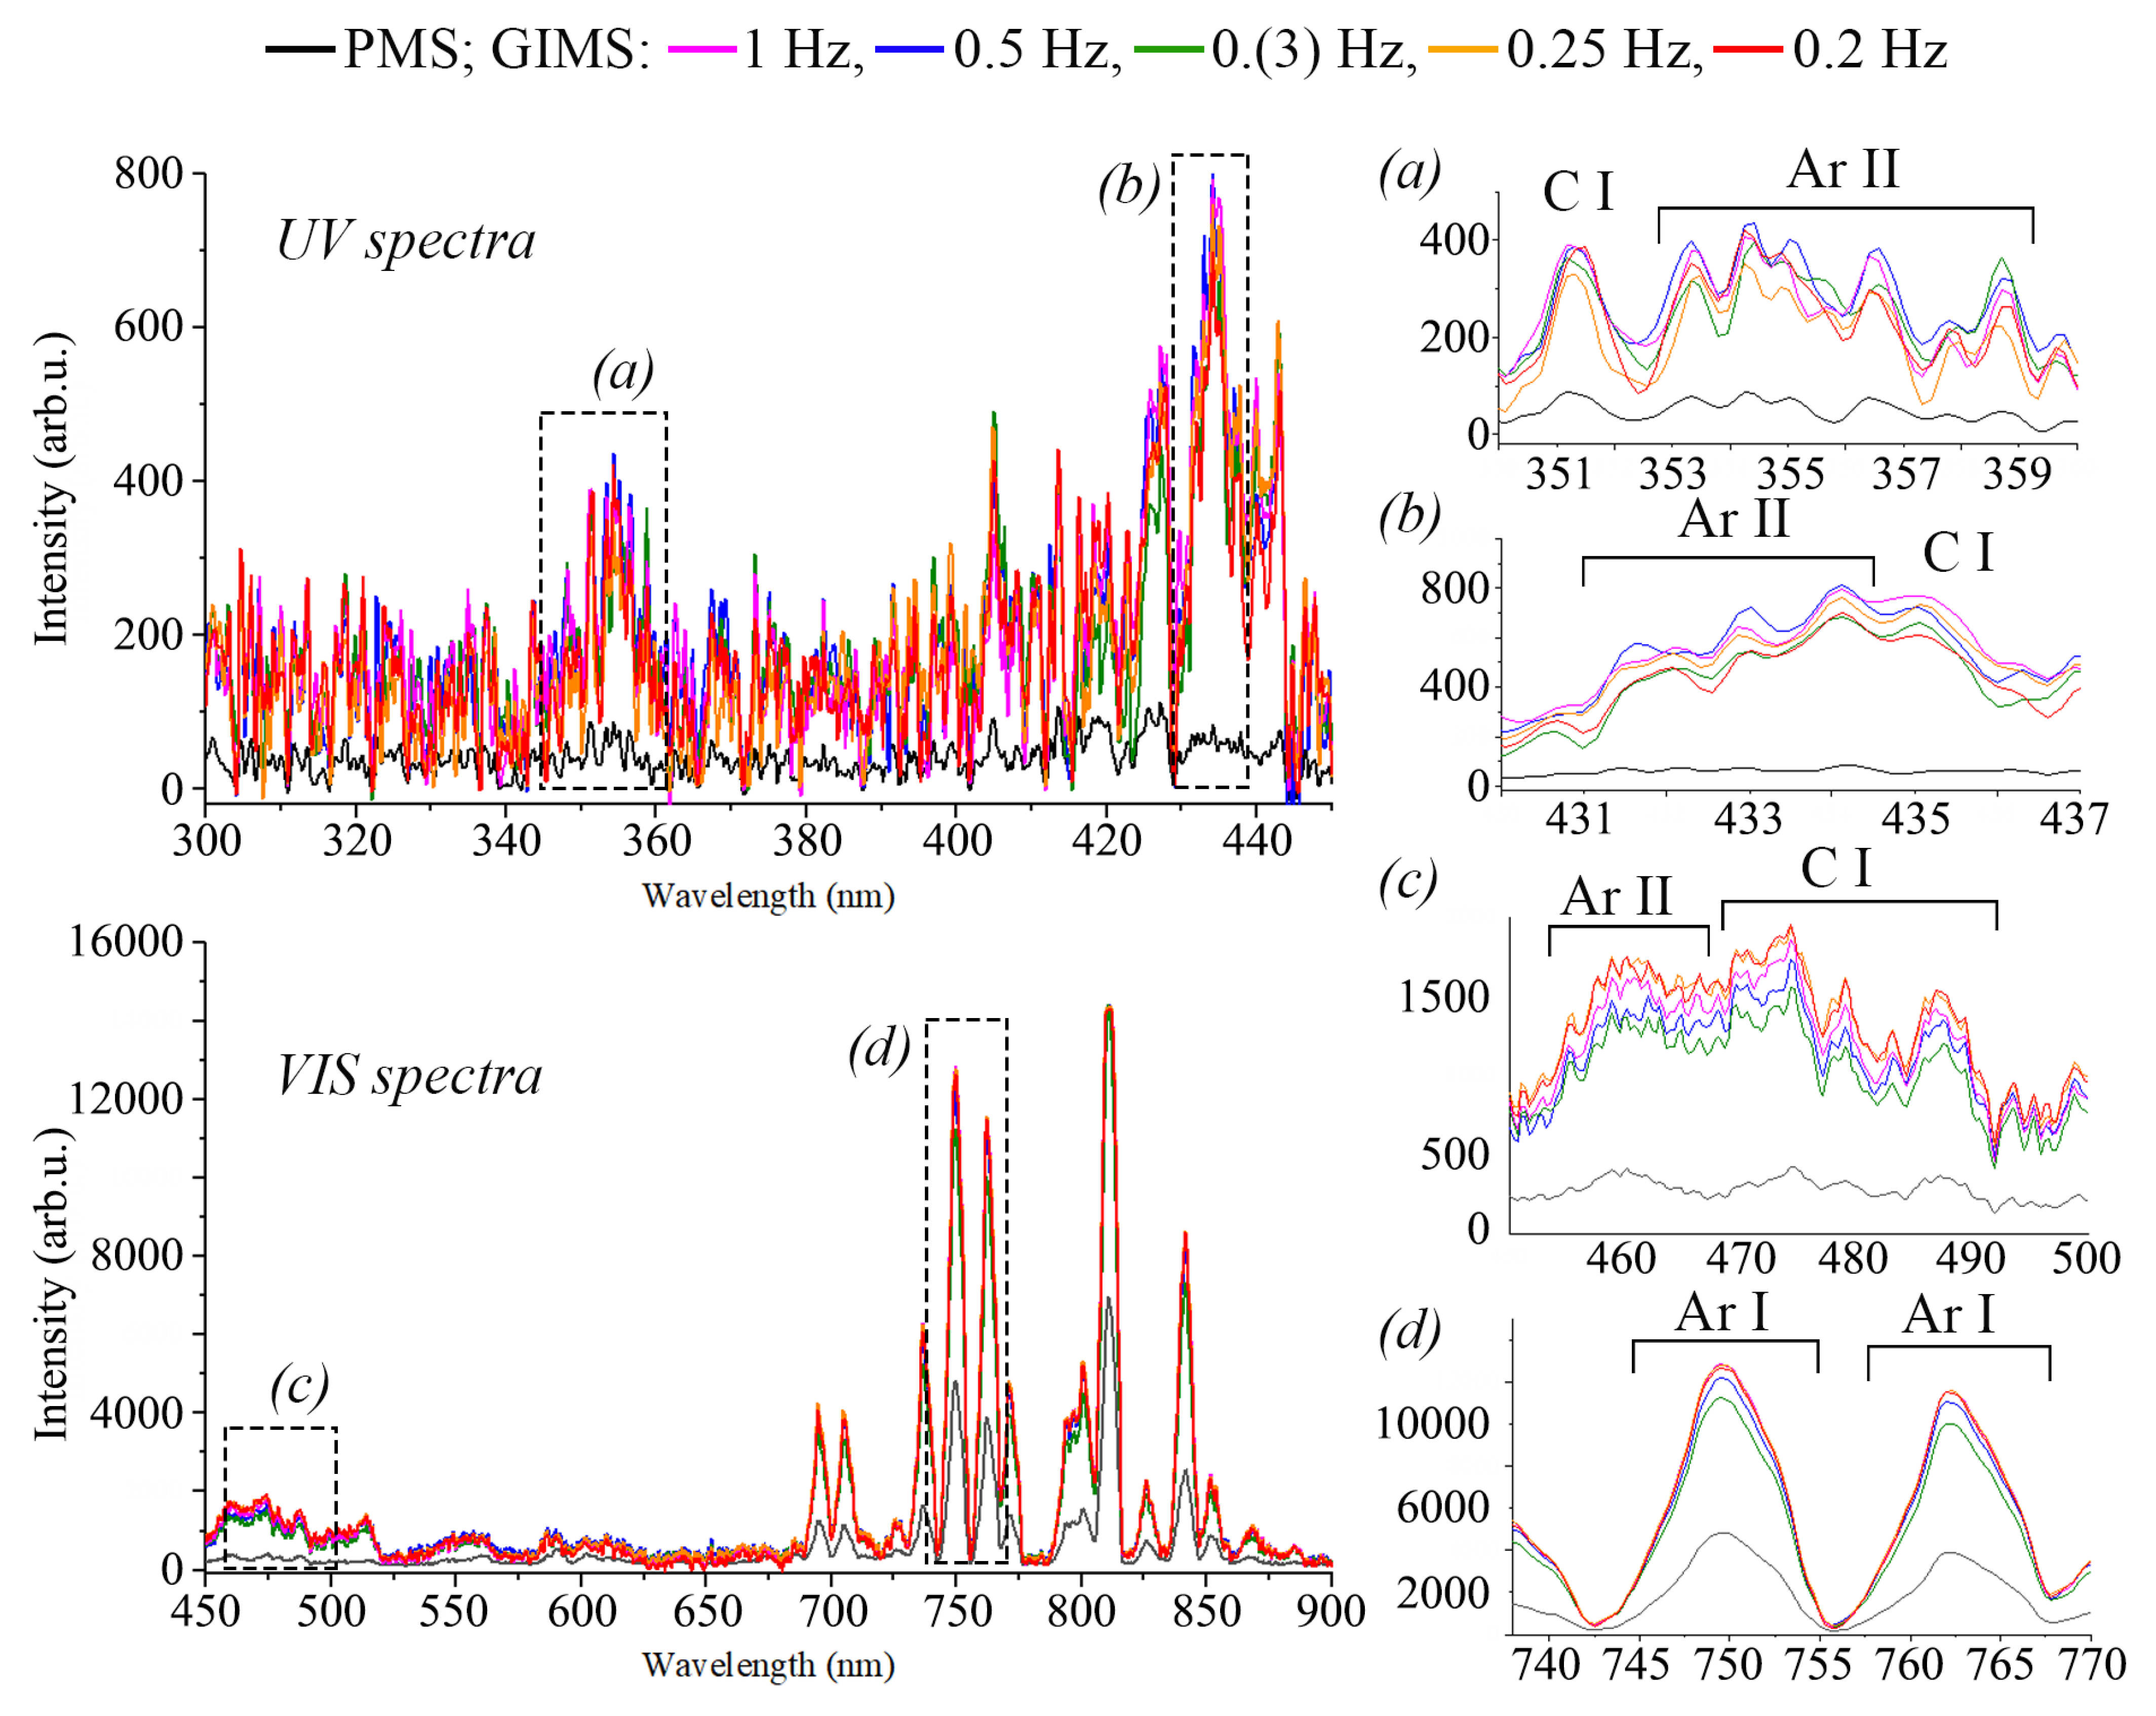
2.3. Plasma Characterization
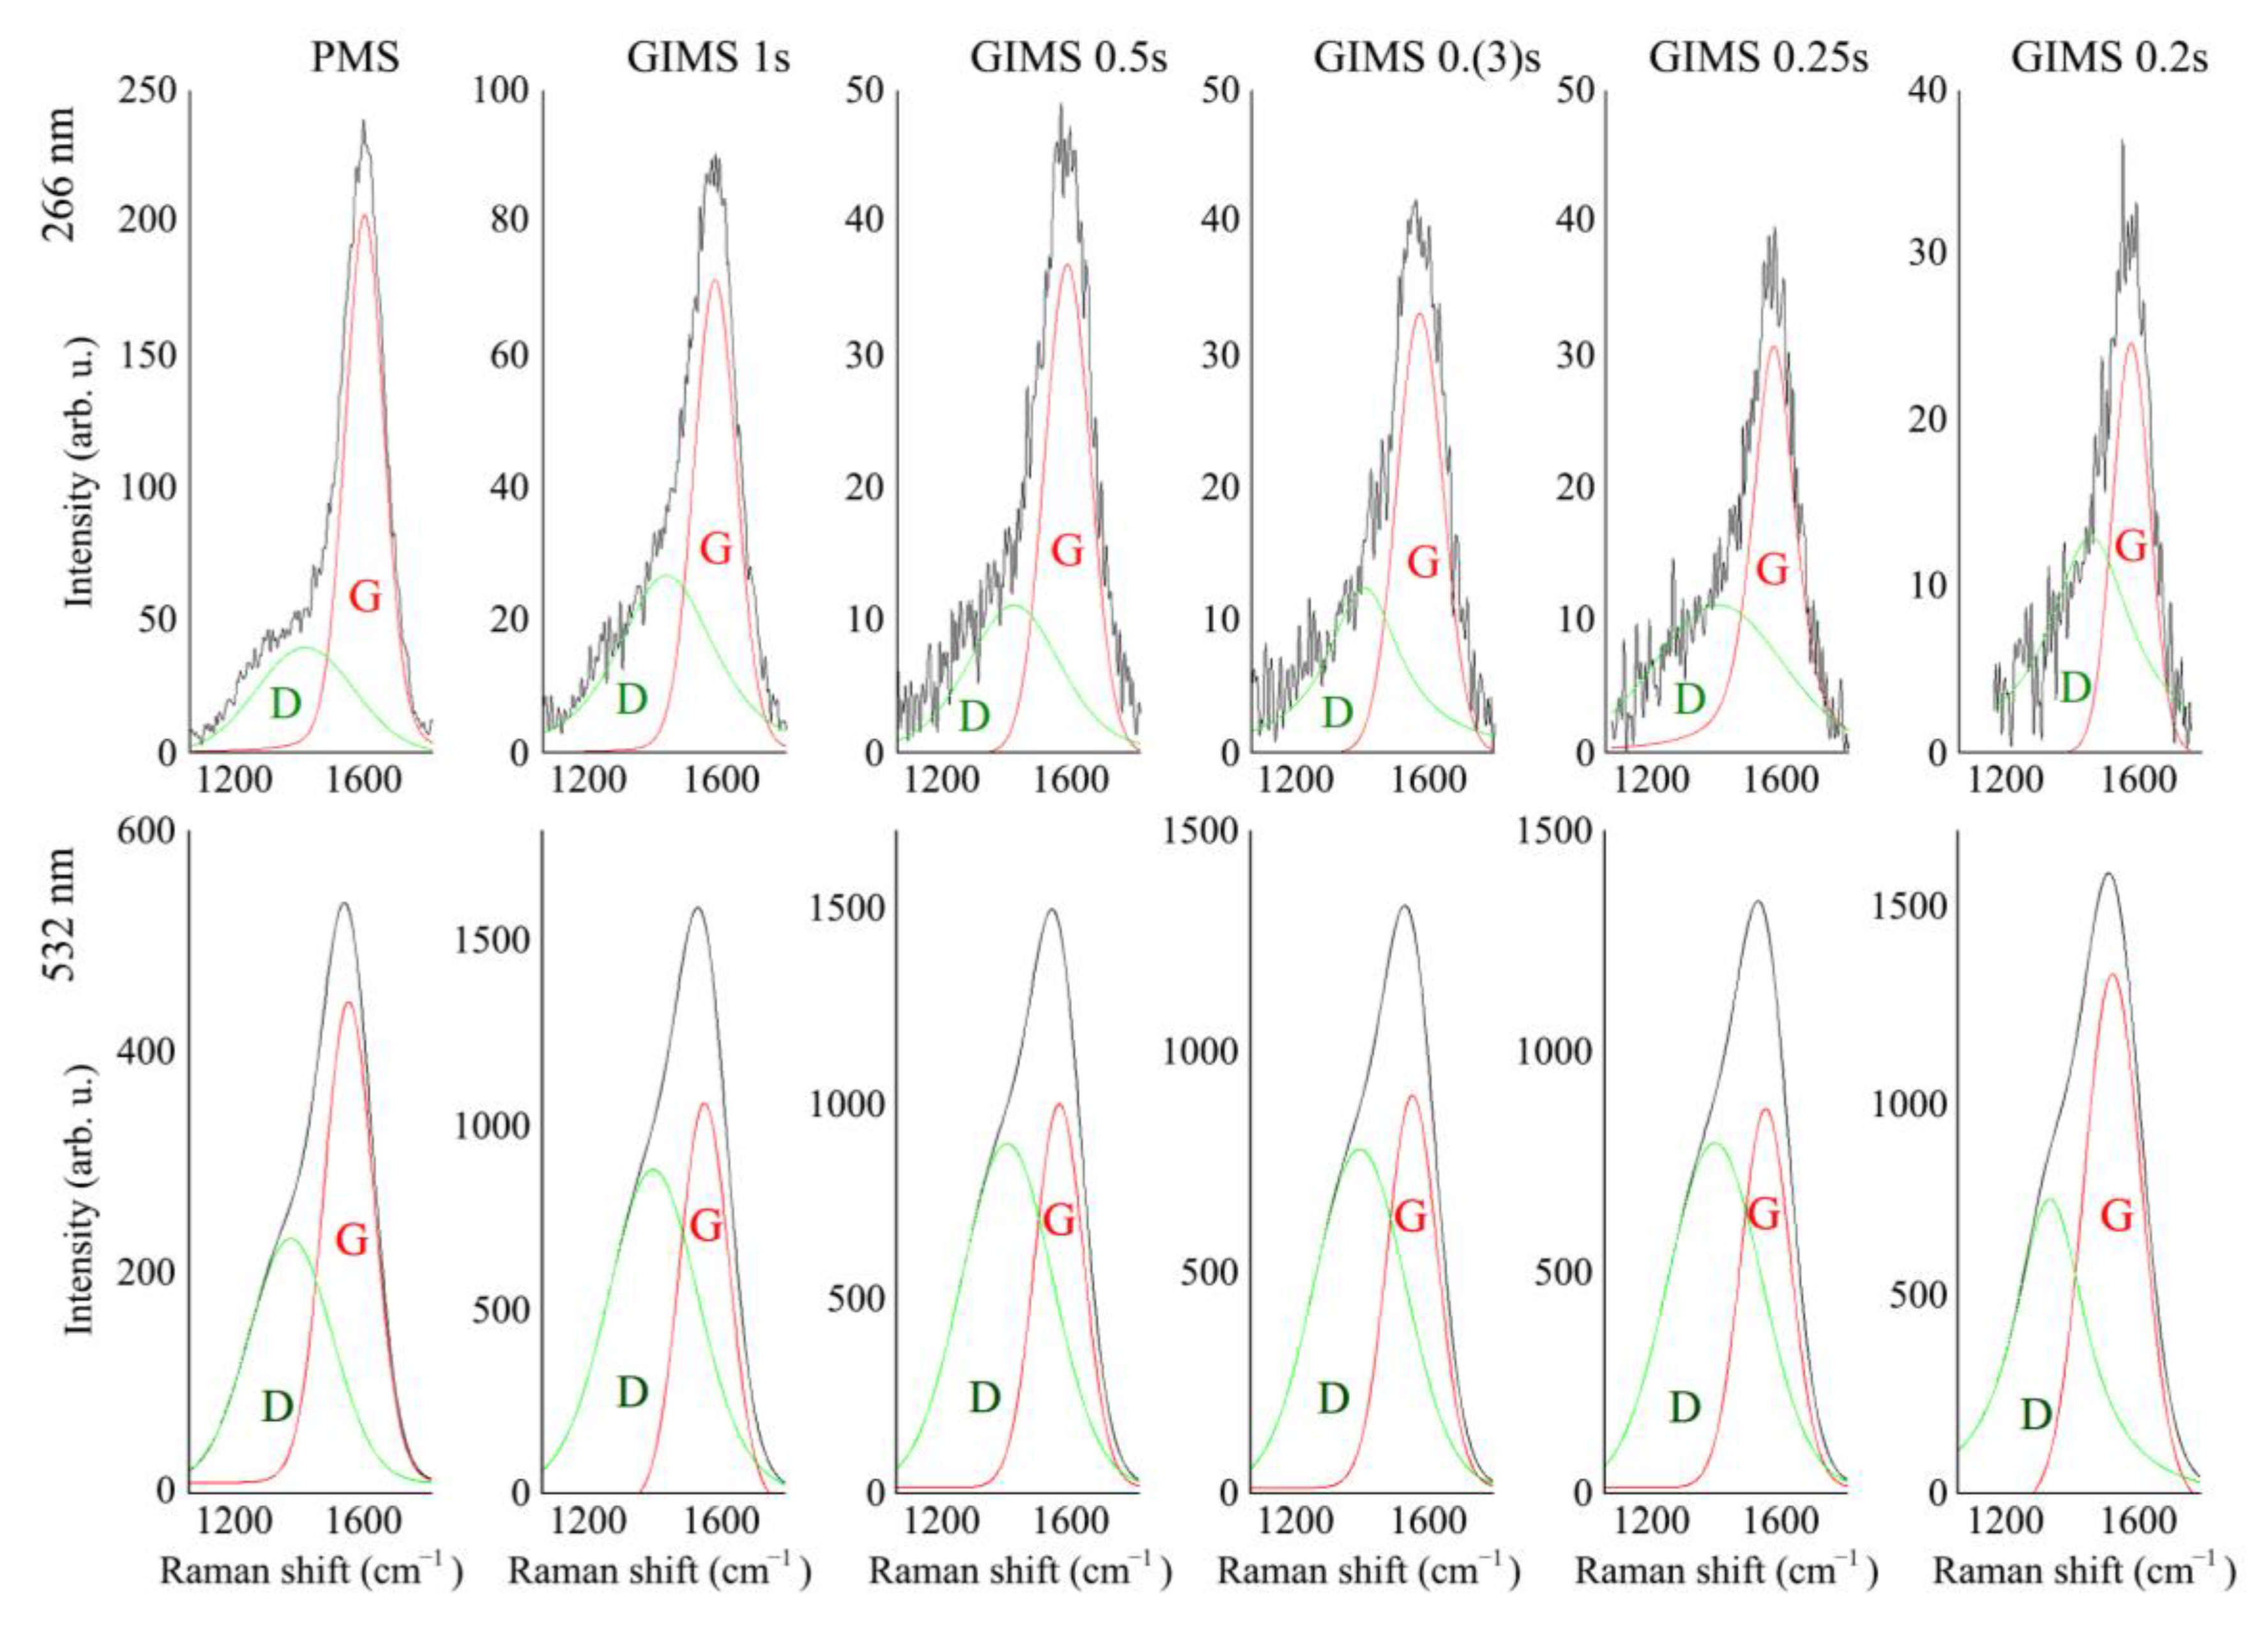
2.4. Coatings Characterization
3. Results and Discussion
4. Conclusions
Author Contributions
Funding
Institutional Review Board Statement
Informed Consent Statement
Data Availability Statement
Conflicts of Interest
References
- Robertson, J. Diamond-like amorphous carbon. Mater. Sci. Eng. R Rep. 2002, 37, 129–281. [Google Scholar] [CrossRef]
- Zhang, L.; Wei, X.; Lin, Y.; Wang, F. A ternary phase diagram for amorphous carbon. Carbon 2015, 94, 202–213. [Google Scholar] [CrossRef]
- Huang, J.; Wang, L.; Liu, B.; Wan, S.; Xue, Q. In Vitro Evaluation of the Tribological Response of Mo-Doped Graphite-like Carbon Film in Different Biological Media. ACS Appl. Mater. Interfaces 2015, 7, 2772–2783. [Google Scholar] [CrossRef]
- Gupta, B.K.; Bhushan, B. Micromechanical properties of amorphous carbon coatings deposited by different deposition techniques. Thin Solid Film. 1995, 270, 391–398. [Google Scholar] [CrossRef]
- Neuville, S. New application perspective for tetrahedral amorphous carbon coatings. QScience Connect 2014, 2014, 8. [Google Scholar] [CrossRef]
- Donnet, C.; Fontaine, J.; le Mogne, T.; Belin, M.; Héau, C.; Terrat, J.P.; Vaux, F.; Pont, G. Diamond-like carbon-based functionally gradient coatings for space tribology. Surf. Coat. Technol. 1999, 120–121, 548–554. [Google Scholar] [CrossRef]
- Risplendi, F.; Bernardi, M.; Cicero, G.; Grossman, J.C. Structure-property relations in amorphous carbon for photovoltaics. Appl. Phys. Lett. 2014, 105, 043903. [Google Scholar] [CrossRef]
- Kim, I.; Shim, C.; Kim, S.W.; Lee, C.; Kwon, J.; Byun, K.; Jeong, U. Amorphous Carbon Films for Electronic Applications. Adv. Mater. 2022, 2204912. [Google Scholar] [CrossRef]
- Patsalas, P. Optical properties of amorphous carbons and their applications and perspectives in photonics. Thin Solid Film. 2011, 519, 3990–3996. [Google Scholar] [CrossRef]
- Dhandapani, V.S.; Subbiah, R.; Thangavel, E.; Arumugam, M.; Park, K.; Gasem, Z.M.; Veeraragavan, V.; Kim, D.-E. Tribological properties, corrosion resistance and biocompatibility of magnetron sputtered titanium-amorphous carbon coatings. Appl. Surf. Sci. 2016, 371, 262–274. [Google Scholar] [CrossRef]
- Liu, E.; Shi, X.; Tay, B.K.; Cheah, L.K.; Tan, H.S.; Shi, J.R.; Sun, Z. Micro-Raman spectroscopic analysis of tetrahedral amorphous carbon films deposited under varying conditions. J. Appl. Phys. 1999, 86, 6078–6083. [Google Scholar] [CrossRef]
- Xu, S.; Tay, B.K.; Tan, H.S.; Zhong, L.; Tu, Y.Q.; Silva, S.R.P.; Milne, W.I. Properties of carbon ion deposited tetrahedral amorphous carbon films as a function of ion energy. J. Appl. Phys. 1996, 79, 7234–7240. [Google Scholar] [CrossRef]
- Jiang, Q.; Chen, Z.P. Thermodynamic phase stabilities of nanocarbon. Carbon 2006, 44, 79–83. [Google Scholar] [CrossRef]
- Sokolowski, M.; Sokolowska, A. Electric charge influence on the metastable phase nucleation. J. Cryst. Growth 1982, 57, 185–188. [Google Scholar] [CrossRef]
- Hwang, N.M.; Yoon, D.Y. Thermodynamic approach to the paradox of diamond formation with simultaneous graphite etching in the low pressure synthesis of diamond. J. Cryst. Growth 1996, 160, 98–103. [Google Scholar] [CrossRef]
- Liu, H.; Dandy, D.S. Studies on nucleation process in diamond CVD: An overview of recent developments. Diam. Relat. Mater. 1995, 4, 1173–1188. [Google Scholar] [CrossRef]
- Gudmundsson, J.T.; Lundin, D. Introduction to magnetron sputtering. In High Power Impulse Magnetron Sputtering; Elsevier: Amsterdam, The Netherlands, 2020; pp. 1–48. [Google Scholar] [CrossRef]
- Rossnagel, S.M. Magnetron sputtering. J. Vac. Sci. Technol. A 2020, 38, 060805. [Google Scholar] [CrossRef]
- Petrov, I.; Myers, A.; Greene, J.E.; Abelson, J.R. Mass and energy resolved detection of ions and neutral sputtered species incident at the substrate during reactive magnetron sputtering of Ti in mixed Ar+N2 mixtures. J. Vac. Sci. Technol. A Vac. Surf. Film. 1994, 12, 2846–2854. [Google Scholar] [CrossRef]
- Christou, C.; Barber, Z.H. Ionization of sputtered material in a planar magnetron discharge. J. Vac. Sci. Technol. A Vac. Surf. Film. 2000, 18, 2897–2907. [Google Scholar] [CrossRef]
- Huang, M.; Zhang, X.; Ke, P.; Wang, A. Graphite-like carbon films by high power impulse magnetron sputtering. Appl. Surf. Sci. 2013, 283, 321–326. [Google Scholar] [CrossRef]
- Crespi, Â.E.; Ballage, C.; Hugon, M.C.; Robert, J.; Lundin, D.; Vickridge, I.; Alvarez, J.; Minea, T. Low resistivity amorphous carbon-based thin films employed as anti-reflective coatings on copper. Thin Solid Film. 2020, 712, 138319. [Google Scholar] [CrossRef]
- Greczynski, G.; Lu, J.; Jensen, J.; Bolz, S.; Kölker, W.; Schiffers Ch Lemmer, O.; Greene, J.E.; Hultman, L. A review of metal-ion-flux-controlled growth of metastable TiAlN by HIPIMS/DCMS co-sputtering. Surf. Coat. Technol. 2014, 257, 15–25. [Google Scholar] [CrossRef]
- Minea, T.M.; Costin, C.; Revel, A.; Lundin, D.; Caillault, L. Kinetics of plasma species and their ionization in short-HiPIMS by particle modeling. Surf. Coat. Technol. 2014, 255, 52–61. [Google Scholar] [CrossRef]
- Lundin, D.; Čada, M.; Hubička, Z. Ionization of sputtered Ti, Al, and C coupled with plasma characterization in HiPIMS. Plasma Sources Sci. Technol. 2015, 24, 035018. [Google Scholar] [CrossRef]
- Lin, J.; Sproul, W.D.; Wei, R.; Chistyakov, R. Diamond like carbon films deposited by HiPIMS using oscillatory voltage pulses. Surf. Coat. Technol. 2014, 258, 1212–1222. [Google Scholar] [CrossRef]
- Sarakinos, K.; Braun, A.; Zilkens, C.; Mráz, S.; Schneider, J.M.; Zoubos, H.; Patsalas, P. Exploring the potential of high power impulse magnetron sputtering for growth of diamond-like carbon films. Surf. Coat. Technol. 2012, 206, 2706–2710. [Google Scholar] [CrossRef]
- Lattemann, M.; Abendroth, B.; Moafi, A.; McCulloch, D.G.; McKenzie, D.R. Controlled glow to arc transition in sputtering for high rate deposition of carbon films. Diam. Relat. Mater. 2011, 20, 68–74. [Google Scholar] [CrossRef]
- Hiratsuka, M.; Azuma, A.; Nakamori, H.; Kogo, Y.; Yukimura, K. Extraordinary deposition rate of diamond-like carbon film using HIPIMS technology. Surf. Coat. Technol. 2013, 229, 46–49. [Google Scholar] [CrossRef]
- Santiago, J.A.; Fernández-Martínez, I.; Wennberg, A.; Molina-Aldareguia, J.M.; Castillo-Rodríguez, M.; Rojas, T.C.; Sánchez-López, J.C.; González, M.U.; García-Martín, J.M.; Li, H.; et al. Adhesion enhancement of DLC hard coatings by HiPIMS metal ion etching pretreatment. Surf. Coat. Technol. 2018, 349, 787–796. [Google Scholar] [CrossRef]
- Chodun, R.; Nowakowska-Langier, K.; Wicher, B.; Okrasa, S.; Kwiatkowski, R.; Zaloga, D.; Dypa, M.; Zdunek, K. The state of coating–substrate interfacial region formed during TiO2 coating deposition by Gas Injection Magnetron Sputtering technique. Surf. Coat. Technol. 2020, 398, 126092. [Google Scholar] [CrossRef]
- Chodun, R.; Nowakowska-Langier, K.; Wicher, B.; Okrasa, S.; Minikayev, R.; Dypa, M.; Zdunek, K. TiO2 coating fabrication using gas injection magnetron sputtering technique by independently controlling the gas and power pulses. Thin Solid Film. 2021, 728, 138695. [Google Scholar] [CrossRef]
- Chodun, R.; Skowronski, L.; Okrasa, S.; Wicher, B.; Nowakowska-Langier, K.; Zdunek, K. Optical TiO2 layers deposited on polymer substrates by the Gas Injection Magnetron Sputtering technique. Appl. Surf. Sci. 2019, 466, 12–18. [Google Scholar] [CrossRef]
- Wicher, B.; Chodun, R.; Trzcinski, M.; Lachowski, A.; Nowakowska-Langier, K.; Ibrahim, S.H.; Jaroszewicz, J.; Kubiś, M.; Grzanka, E.; Zdunek, K. Application of the plasma surface sintering conditions in the synthesis of ReBx–Ti targets employed for hard films deposition in magnetron sputtering technique. Int. J. Refract. Met. Hard Mater. 2022, 103, 105756. [Google Scholar] [CrossRef]
- Wicher, B.; Chodun, R.; Trzciński, M.; Lachowski, A.; Kubiś, M.; Nowakowska-Langier, K.; Zdunek, K. Design of pulsed neon injection in the synthesis of W-B-C films using magnetron sputtering from a surface-sintered single powder cathode. Thin Solid Film. 2020, 716, 138426. [Google Scholar] [CrossRef]
- Wicher, B.; Chodun, R.; Kwiatkowski, R.; Trzcinski, M.; Nowakowska–Langier, K.; Lachowski, A.; Minikayev, R.; Rudnicki, J.; Naparty, M.K.; Zdunek, K. Plasmochemical investigations of DLC/WCx nanocomposite coatings synthesized by gas injection magnetron sputtering technique. Diam. Relat. Mater. 2019, 96, 1–10. [Google Scholar] [CrossRef]
- Skowronski, L.; Zdunek, K.; Nowakowska-Langier, K.; Chodun, R.; Trzcinski, M.; Kobierski, M.; Kustra, M.K.; Wachowiak, A.A.; Wachowiak, W.; Hiller, T.; et al. Characterization of microstructural, mechanical and optical properties of TiO2 layers deposited by GIMS and PMS methods. Surf. Coat. Technol. 2015, 282, 16–23. [Google Scholar] [CrossRef]
- Wicher, B.; Chodun, R.; Trzcinski, M.; Nowakowska-Langier, K.; Skowroński, Ł.; Lachowski, A.; Zdunek, K. Applications insight into the plasmochemical state and optical properties of amorphous CNx films deposited by gas injection magnetron sputtering method. Appl. Surf. Sci. 2021, 565, 150540. [Google Scholar] [CrossRef]
- Wicher, B.; Chodun, R.; Nowakowska-Langier, K.; Trzcinski, M.; Skowroński, L.; Okrasa, S.; Minikayev, R.; Naparty, M.K.; Zdunek, K. Chemical and structural characterization of tungsten nitride (WNx) thin films synthesized via Gas Injection Magnetron Sputtering technique. Vacuum 2019, 165, 266–273. [Google Scholar] [CrossRef]
- Zdunek, K.; Skowroński, L.; Chodun, R.; Nowakowska-Langier, K.; Grabowski, A.; Wachowiak, W.; Okrasa, S.; Wachowiak, A.; Strauss, O.; Wronkowski, A.; et al. Novel GIMS technique for deposition of colored Ti/TiO2 coatings on industrial scale. Mater. Sci.-Pol. 2016, 34, 137–141. [Google Scholar] [CrossRef]
- Skowronski, L.; Chodun, R.; Zdunek, K. TiO2—Based decorative interference coatings produced at industrial conditions. Thin Solid Film. 2020, 711, 138294. [Google Scholar] [CrossRef]
- Gencoa Ltd. Gencoa: Balanced and Unbalanced. Available online: https://www.gencoa.com/balance-unbalance (accessed on 23 March 2023).
- Pawlak, W.; Jakubowska, M.; Sobczyk-Guzenda, A.; Makówka, M.; Szymanowski, H.; Wendler, B.; Gazicki-Lipman, M. Photo activated performance of titanium oxide coatings deposited by reactive gas impulse magnetron sputtering. Surf. Coat. Technol. 2018, 349, 647–654. [Google Scholar] [CrossRef]
- Posadowski, W.M.; Wiatrowski, A.; Dora, J.; Radzimski, Z.J. Magnetron sputtering process control by medium-frequency power supply parameter. Thin Solid Film. 2008, 516, 4478–4482. [Google Scholar] [CrossRef]
- Dora, J. Resonant Power Supply. Patent No. 313150, 6 March 1996. [Google Scholar]
- Cui, W.G.; Lai, Q.B.; Zhang, L.; Wang, F.M. Quantitative measurements of sp3 content in DLC films with Raman spectroscopy. Surf. Coat. Technol. 2010, 205, 1995–1999. [Google Scholar] [CrossRef]
- Streletskiy, O.; Perevedentseva, E.; Zavidovskiy, I.; Karmenyan, A.; Sychev, V.; Sadykova, V.; Kuvarina, A.; Cheng, C.-L. Amorphous Carbon Films with Embedded Well-Dispersed Nanodiamonds: Plasmon-Enhanced Analysis and Possible Antimicrobial Applications. Magnetochemistry 2022, 8, 171. [Google Scholar] [CrossRef]
- Zavidovskiy, I.A.; Streletskiy, O.A.; Nishchak, O.Y.; Haidarov, A.A.; Pavlikov, A.V. The influence of ion assistance energy on structural and optical properties of carbon-silver nanocomposites. Thin Solid Film. 2021, 738, 138966. [Google Scholar] [CrossRef]
- Ferrari, A.C.; Libassi, A.; Tanner, B.K.; Stolojan, V.; Yuan, J.; Brown, L.M.; Rodil, S.E.; Kleinsorge, B.; Robertson, J. Density, sp3 fraction, and cross-sectional structure of amorphous carbon films determined by x-ray reflectivity and electron energy-loss spectroscopy. Phys. Rev. B 2000, 62, 11089–11103. [Google Scholar] [CrossRef]
- Tuinstra, F.; Koenig, J.L. Raman Spectrum of Graphite. J. Chem. Phys. 1970, 53, 1126–1130. [Google Scholar] [CrossRef]
- Streletskiy, O.A.; Zavidovskiy, I.A.; Balabanyan, V.Y.; Tsiskarashvili, A.V. Antibacterial properties of modified a-C and ta-C coatings: The effects of the sp2/sp3 ratio, oxidation, nitridation, and silver incorporation. Appl. Phys. A 2022, 128, 929. [Google Scholar] [CrossRef]
- Caro, M.A.; Deringer, V.L.; Koskinen, J.; Laurila, T.; Csányi, G. Growth Mechanism and Origin of High sp3 Content in Tetrahedral Amorphous Carbon. Phys. Rev. Lett. 2018, 120, 166101. [Google Scholar] [CrossRef]
- Lifshitz, Y.; Kasi, S.R.; Rabalais, J.W. Mass selected ion beam deposition: A tool for parametric growth studies, process development and fabrication of diamondlike films. Adv. Mater. Manuf. Process. 1988, 3, 157–194. [Google Scholar] [CrossRef]
- Lifshitz, Y.; Kasi, S.R.; Rabalais, J.W. Subplantation model for film growth from hyperthermal species: Application to diamond. Phys. Rev. Lett. 1989, 62, 1290–1293. [Google Scholar] [CrossRef] [PubMed]
- Aijaz, A.; Sarakinos, K.; Lundin, D.; Brenning, N.; Helmersson, U. A strategy for increased carbon ionization in magnetron sputtering discharges. Diam. Relat. Mater. 2012, 23, 1–4. [Google Scholar] [CrossRef]
- Aijaz, A.; Louring, S.; Lundin, D.; Kubart, T.; Jensen, J.; Sarakinos, K.; Helmersson, U. Synthesis of hydrogenated diamondlike carbon thin films using neon–acetylene based high power impulse magnetron sputtering discharges. J. Vac. Sci. Technol. A Vac. Surf. Film. 2016, 34, 061504. [Google Scholar] [CrossRef]
- Akhavan, B.; Ganesan, R.; Matthews, D.T.A.; McKenzie, D.R.; Bilek, M.M.M. Noble gas control of diamond-like content and compressive stress in carbon films by arc-mixed mode high power impulse magnetron sputtering. Surf. Coat. Technol. 2021, 427, 127785. [Google Scholar] [CrossRef]
- Wicher, B.; Chodun, R.; Skowroński, Ł.; Trzcinski, M.; Kulikowski, K.; Zdunek, K. Design of thin DLC/TiO2 film interference coatings on glass screen protector using a neon–argon-based gas injection magnetron sputtering technique. Diam. Relat. Mater. 2022, 123, 108859. [Google Scholar] [CrossRef]
- Zeb, S.; Qayyum, A.; Sadiq, M.; Shafiq, M.; Waheed, A.; Zakaullah, M. Deposition of Diamond-like Carbon Films using Graphite Sputtering in Neon Dense Plasma. Plasma Chem. Plasma Process. 2007, 27, 127–139. [Google Scholar] [CrossRef]
- Zdunek, K. Concept, techniques, deposition mechanism of impulse plasma deposition—A short review. Surf. Coat. Technol. 2007, 201, 4813–4816. [Google Scholar] [CrossRef]
- Nowakowska-Langier, K.; Chodun, R.; Nietubyc, R.; Minikayev, R.; Zdunek, K. Dependence of the specific features of two PAPVD methods: Impulse Plasma Deposition (IPD) and Pulsed Magnetron Sputtering (PMS) on the structure of Fe–Cu alloy layers. Appl. Surf. Sci. 2013, 275, 14–18. [Google Scholar] [CrossRef]
- JA Woollam Co. Inc. Guide to Using WVASE32; Wextech Systems; JA Woollam Co., Inc.: Lincoln, NE, USA, 2010. [Google Scholar]
- Fujiwara, H. Spectroscopic Ellipsometry. Principles and Applications; John Wiley and Sons: Hoboken, NJ, USA, 2009. [Google Scholar]
- Zoubos, H.; Koutsokeras, L.E.; Anagnostopoulos, D.F.; Lidorikis, E.; Kalogirou, S.A.; Wildes, A.R.; Kelires, P.C.; Patsalas, P. Broadband optical absorption of amorphous carbon/Ag nanocomposite films and its potential for solar harvesting applications. Sol. Energy Mater. Sol. Cells 2013, 117, 350–356. [Google Scholar] [CrossRef]
- Dai, H.Y.; Zhan, C.; Du, J. Studies on the influence of sputtering power on amorphous carbon films deposited by pulsed unbalanced magnetron sputtering. Optik 2016, 127, 2512–2515. [Google Scholar] [CrossRef]
- Dai, H.Y.; Du, J.; Zhan, C. Role of target-substrate distance on the structural, mechanical and electrical properties of amorphous carbon films. J. Mater. Sci. Mater. Electron. 2015, 26, 6552–6556. [Google Scholar] [CrossRef]
- Radek, N.; Pietraszek, J.; Szczotok, A.; Fabian, P.; Kalinowski, A. Microstructure and Tribological Properties of DLC Coatings. Terotechnology 2020, XI, 171–176. [Google Scholar] [CrossRef]
- Jatti, V.S.; Laad, M.; Singh, T.P. Raman Spectroscopy Studies on DLC Films Synthesized by PECVD Method. Appl. Mech. Mater. 2014, 592–594, 842–846. [Google Scholar] [CrossRef]


| Process | PMS | GIMS 1 Hz | GIMS 0.5 Hz | GIMS 0.(3) Hz | GIMS 0.25 Hz | GIMS 0.2 Hz |
|---|---|---|---|---|---|---|
| Valve frequency (Hz) | - | 1 | 0.5 | 0.(3) | 0.25 | 0.2 |
| Time of valve opening (ms) | - | 1 | ||||
| Pressure (Pa) | 0.4 | - | ||||
| Pulse of power duration (ms) | - | 100 | ||||
| Deposition time (min) | 3 | 30 | 60 | 90 | 120 | 150 |
| Gas 1 | Ar | Ar + H2 | Ne | |||
| Gas 2 | - | He | - | He | - | He |
| Time of valve opening (ms) | 2 (Ar) | 1 (Ar) 1 (He) | 2 (Ar + H2) | 2 (Ar + H2) 1 (He) | 2 (Ne) | 2 (Ne) 1 (He) |
| Valve frequency (Hz) | 0.2 | |||||
| Pulse of power duration (ms) | 100 | |||||
| Deposition time (min) | 150 | |||||
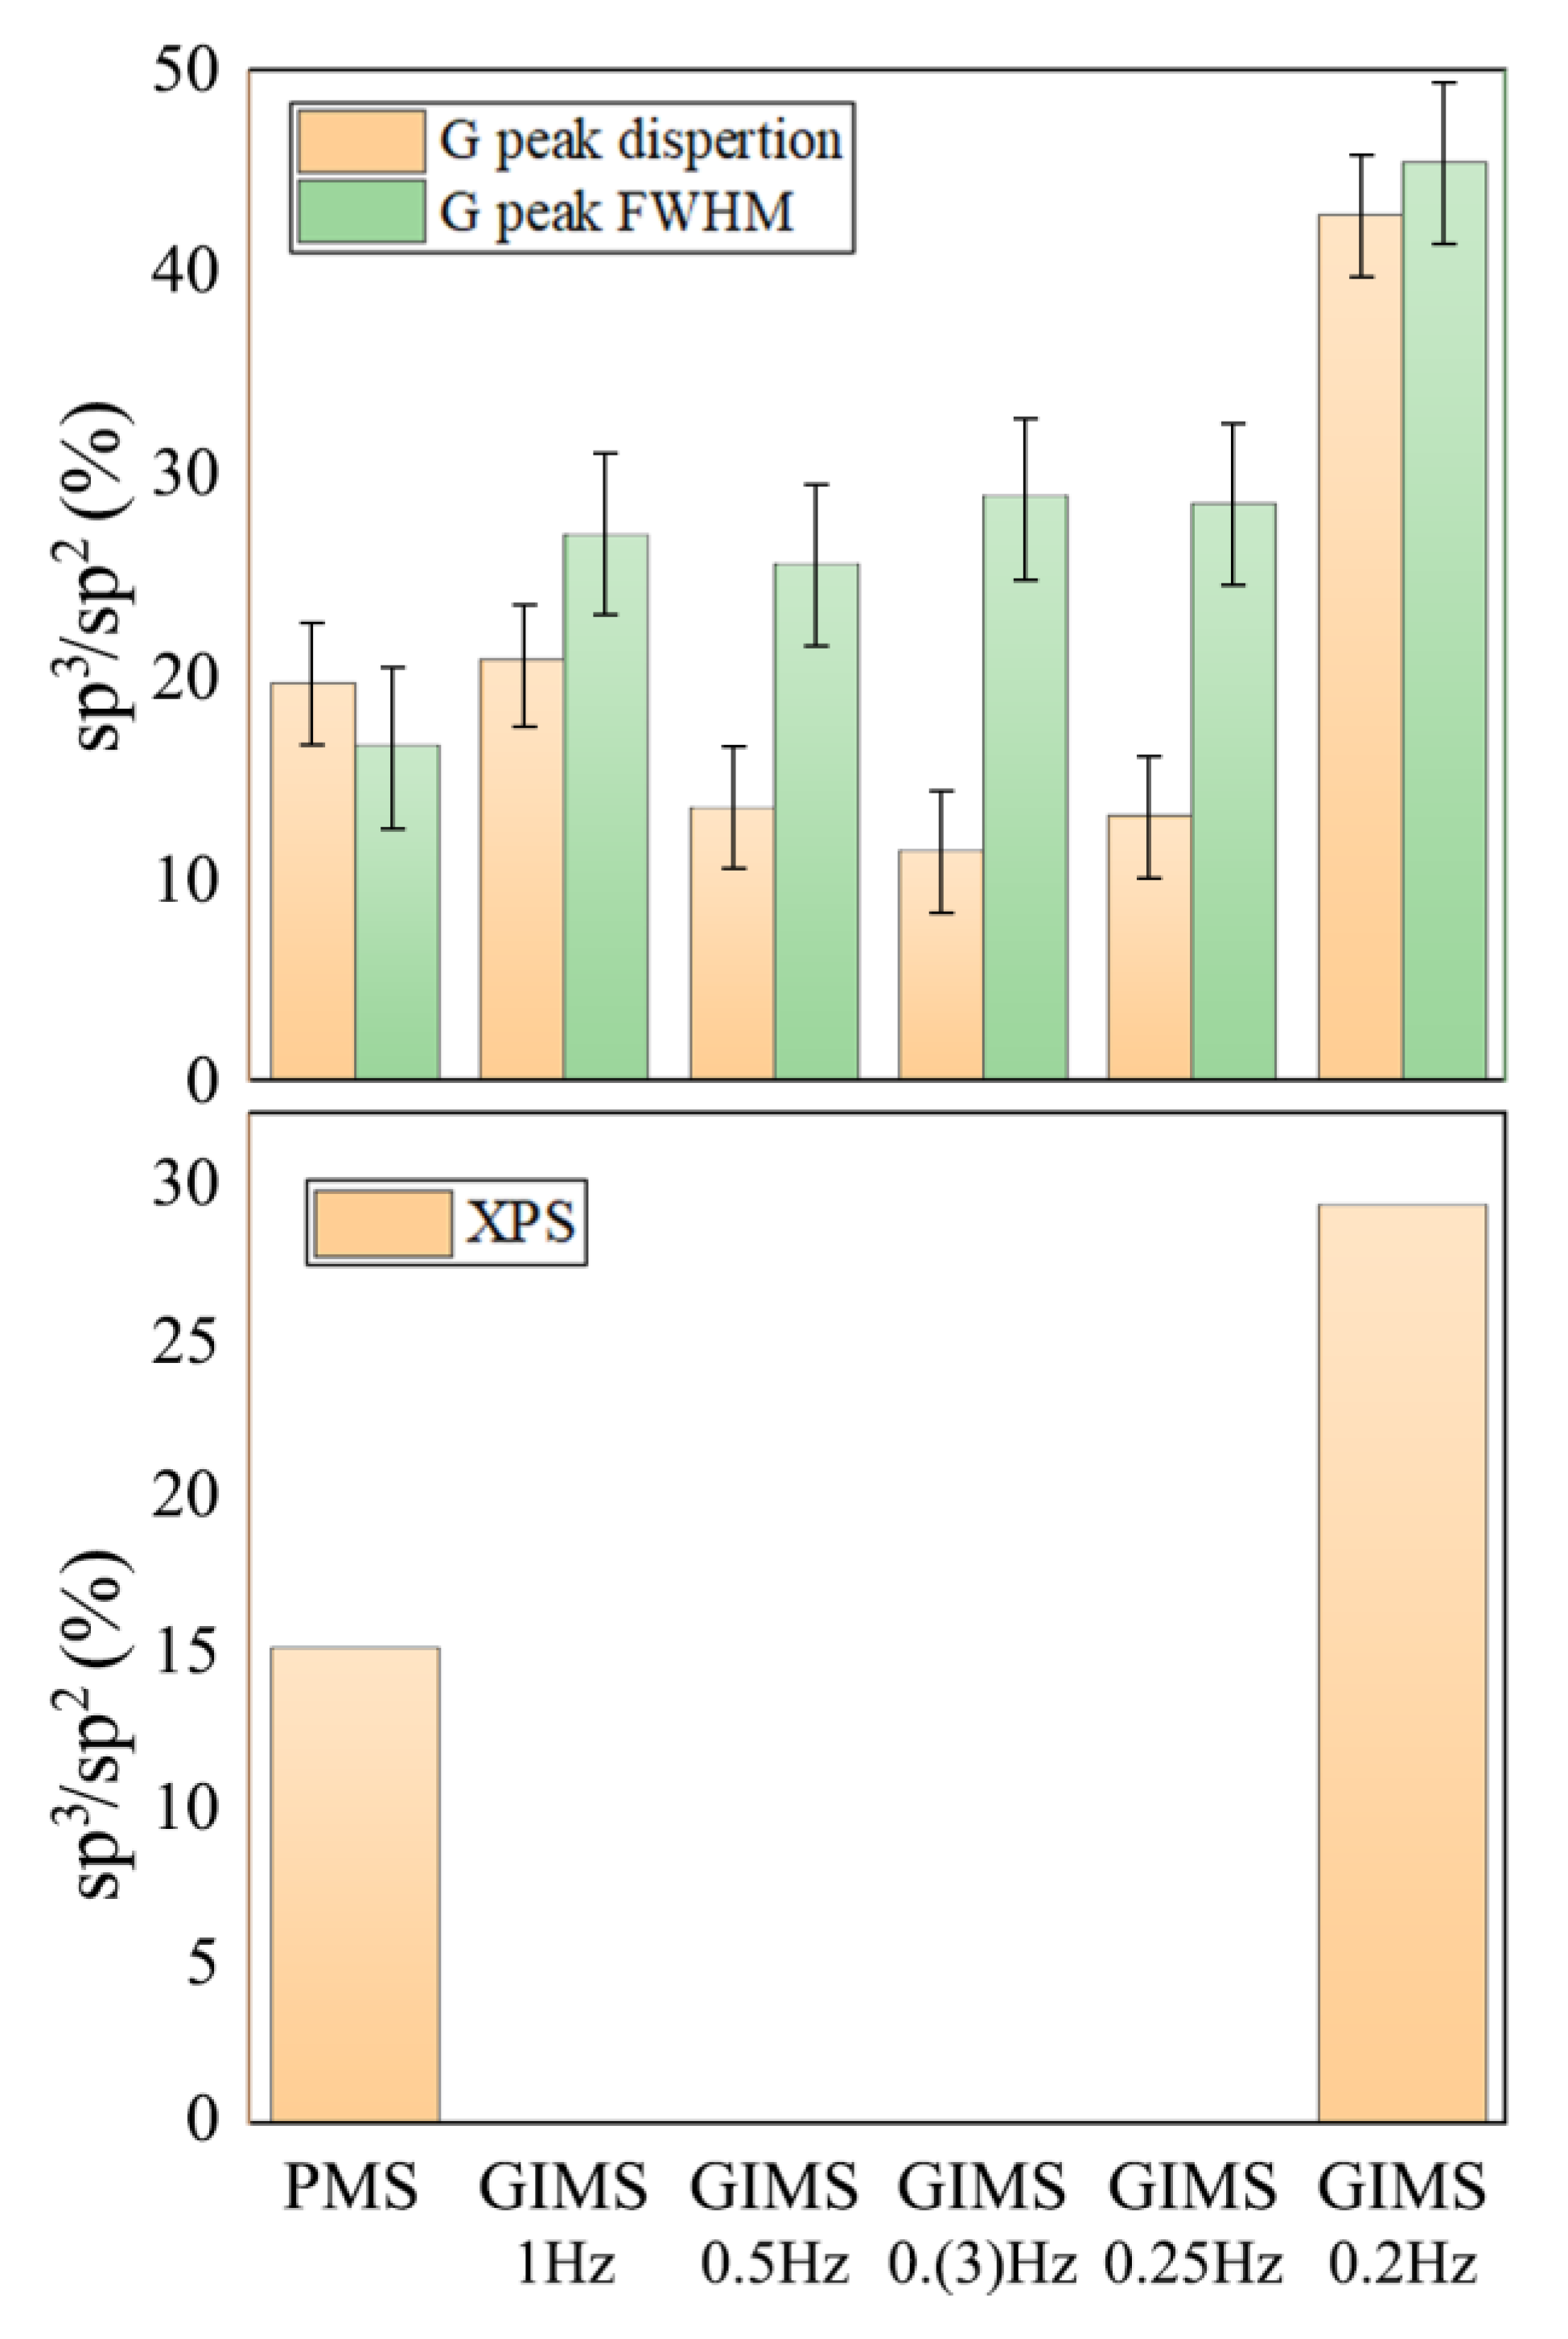
| Process | Laser | Peak | Position (cm−1) | FWHM (cm−1) | Height (arb. u.) | sp3/sp2 (G Peak Dispersion Criterion) [44] | sp3/sp2 (G Peak FWHM Criterion) [44] |
|---|---|---|---|---|---|---|---|
| PMS | 266 nm | G | 1583.88 | 144.25 | 201.98 | 0.19 | 0.21 |
| D | 1404.25 | 352.11 | 39.91 | ||||
| 532 nm | G | 1555.44 | 163.40 | 390.91 | |||
| D | 1389.43 | 338.13 | 245.68 | ||||
| GIMS 1 Hz | 266 nm | G | 1579.84 | 155.31 | 71.33 | 0.20 | 0.35 |
| D | 1427.54 | 350.66 | 26.85 | ||||
| 532 nm | G | 1550.16 | 178.70 | 10,562.39 | |||
| D | 1391.60 | 338.98 | 8760.61 | ||||
| GIMS 0.5 Hz | 266 nm | G | 1574.24 | 166.14 | 36.74 | 0.13 | 0.33 |
| D | 1407.06 | 337.76 | 11.20 | ||||
| 532 nm | G | 1552.38 | 176.35 | 9912.99 | |||
| D | 1391.07 | 331.55 | 8964.35 | ||||
| GIMS 0.(3) Hz | 266 nm | G | 1569.99 | 168.98 | 33.09 | 0.11 | 0.37 |
| D | 1397.53 | 273.29 | 12.37 | ||||
| 532 nm | G | 1550.46 | 181.52 | 9615.17 | |||
| D | 1387.94 | 331.29 | 8319.19 | ||||
| GIMS 0.25 Hz | 266 nm | G | 1569.54 | 155.49 | 30.72 | 0.13 | 0.37 |
| D | 1390.69 | 473.23 | 11.18 | ||||
| 532 nm | G | 1548.18 | 181.00 | 9862.05 | |||
| D | 1391.01 | 340.68 | 8964.35 | ||||
| GIMS 0.2 Hz | 266 nm | G | 1580.48 | 135.29 | 24.71 | 0.42 | 0.46 |
| D | 1450.91 | 306.81 | 13.13 | ||||
| 532 nm | G | 1527.50 | 210.35 | 14,067.37 | |||
| D | 1333.38 | 268.57 | 7964.90 |
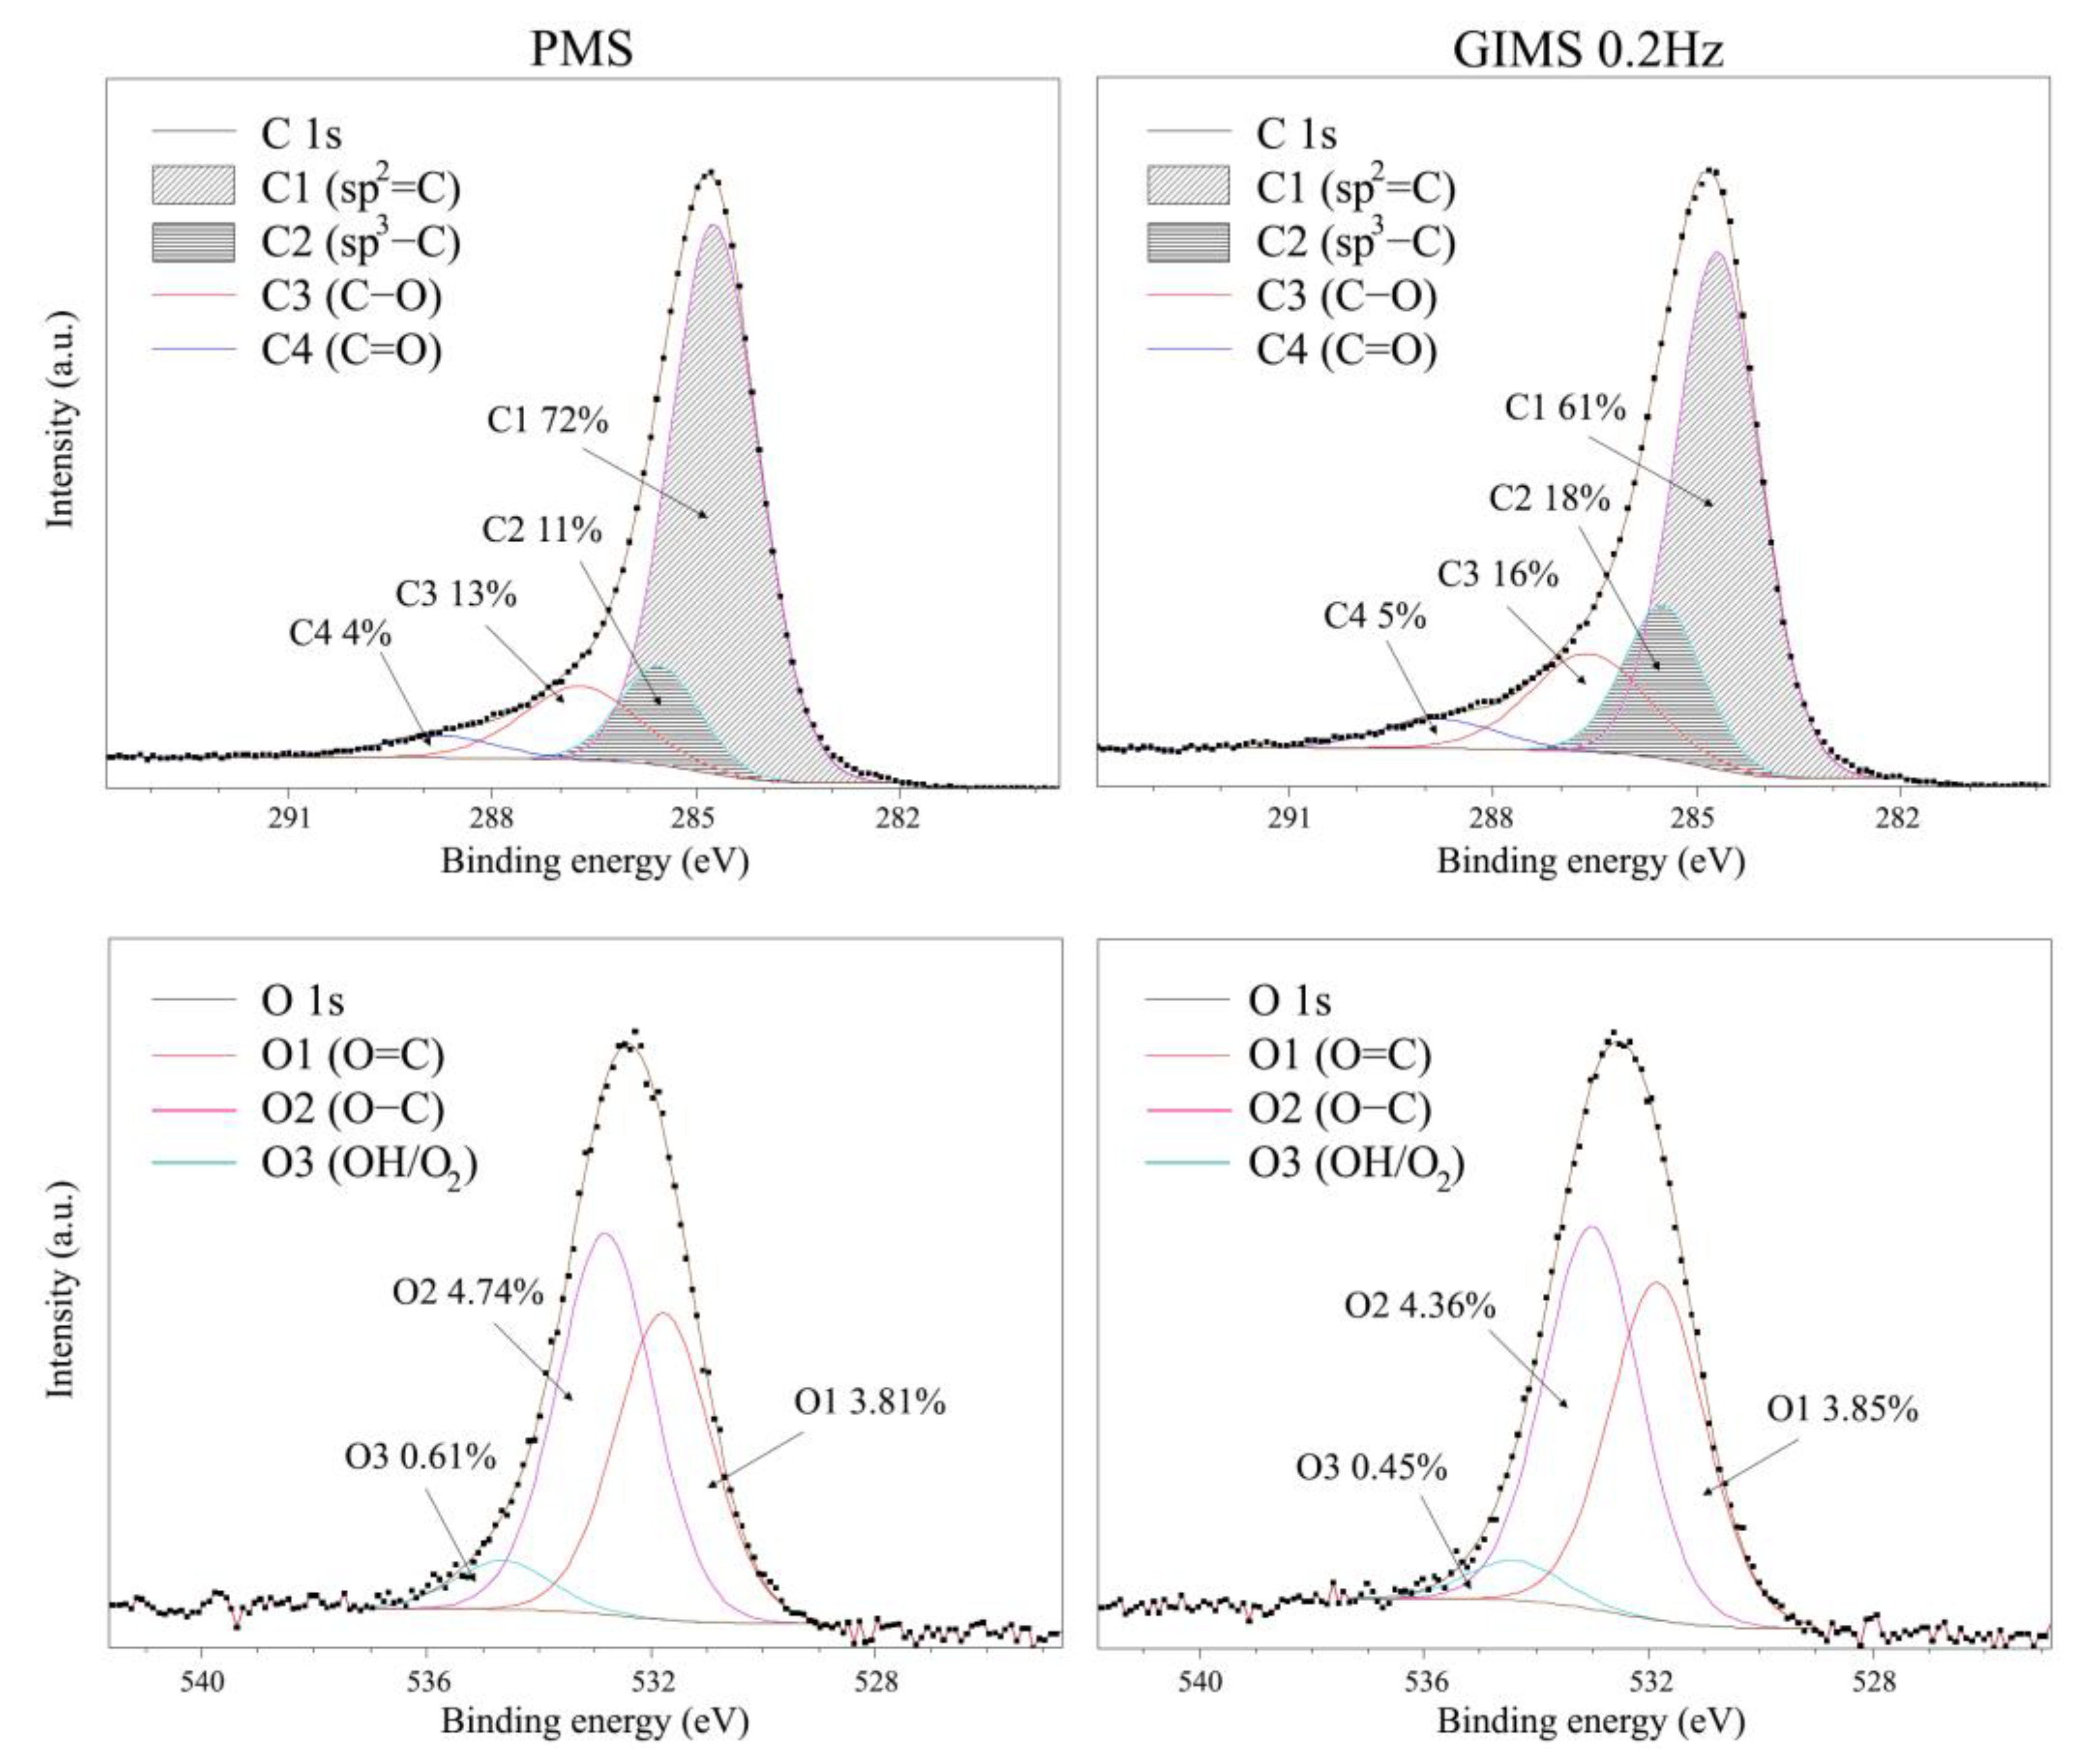
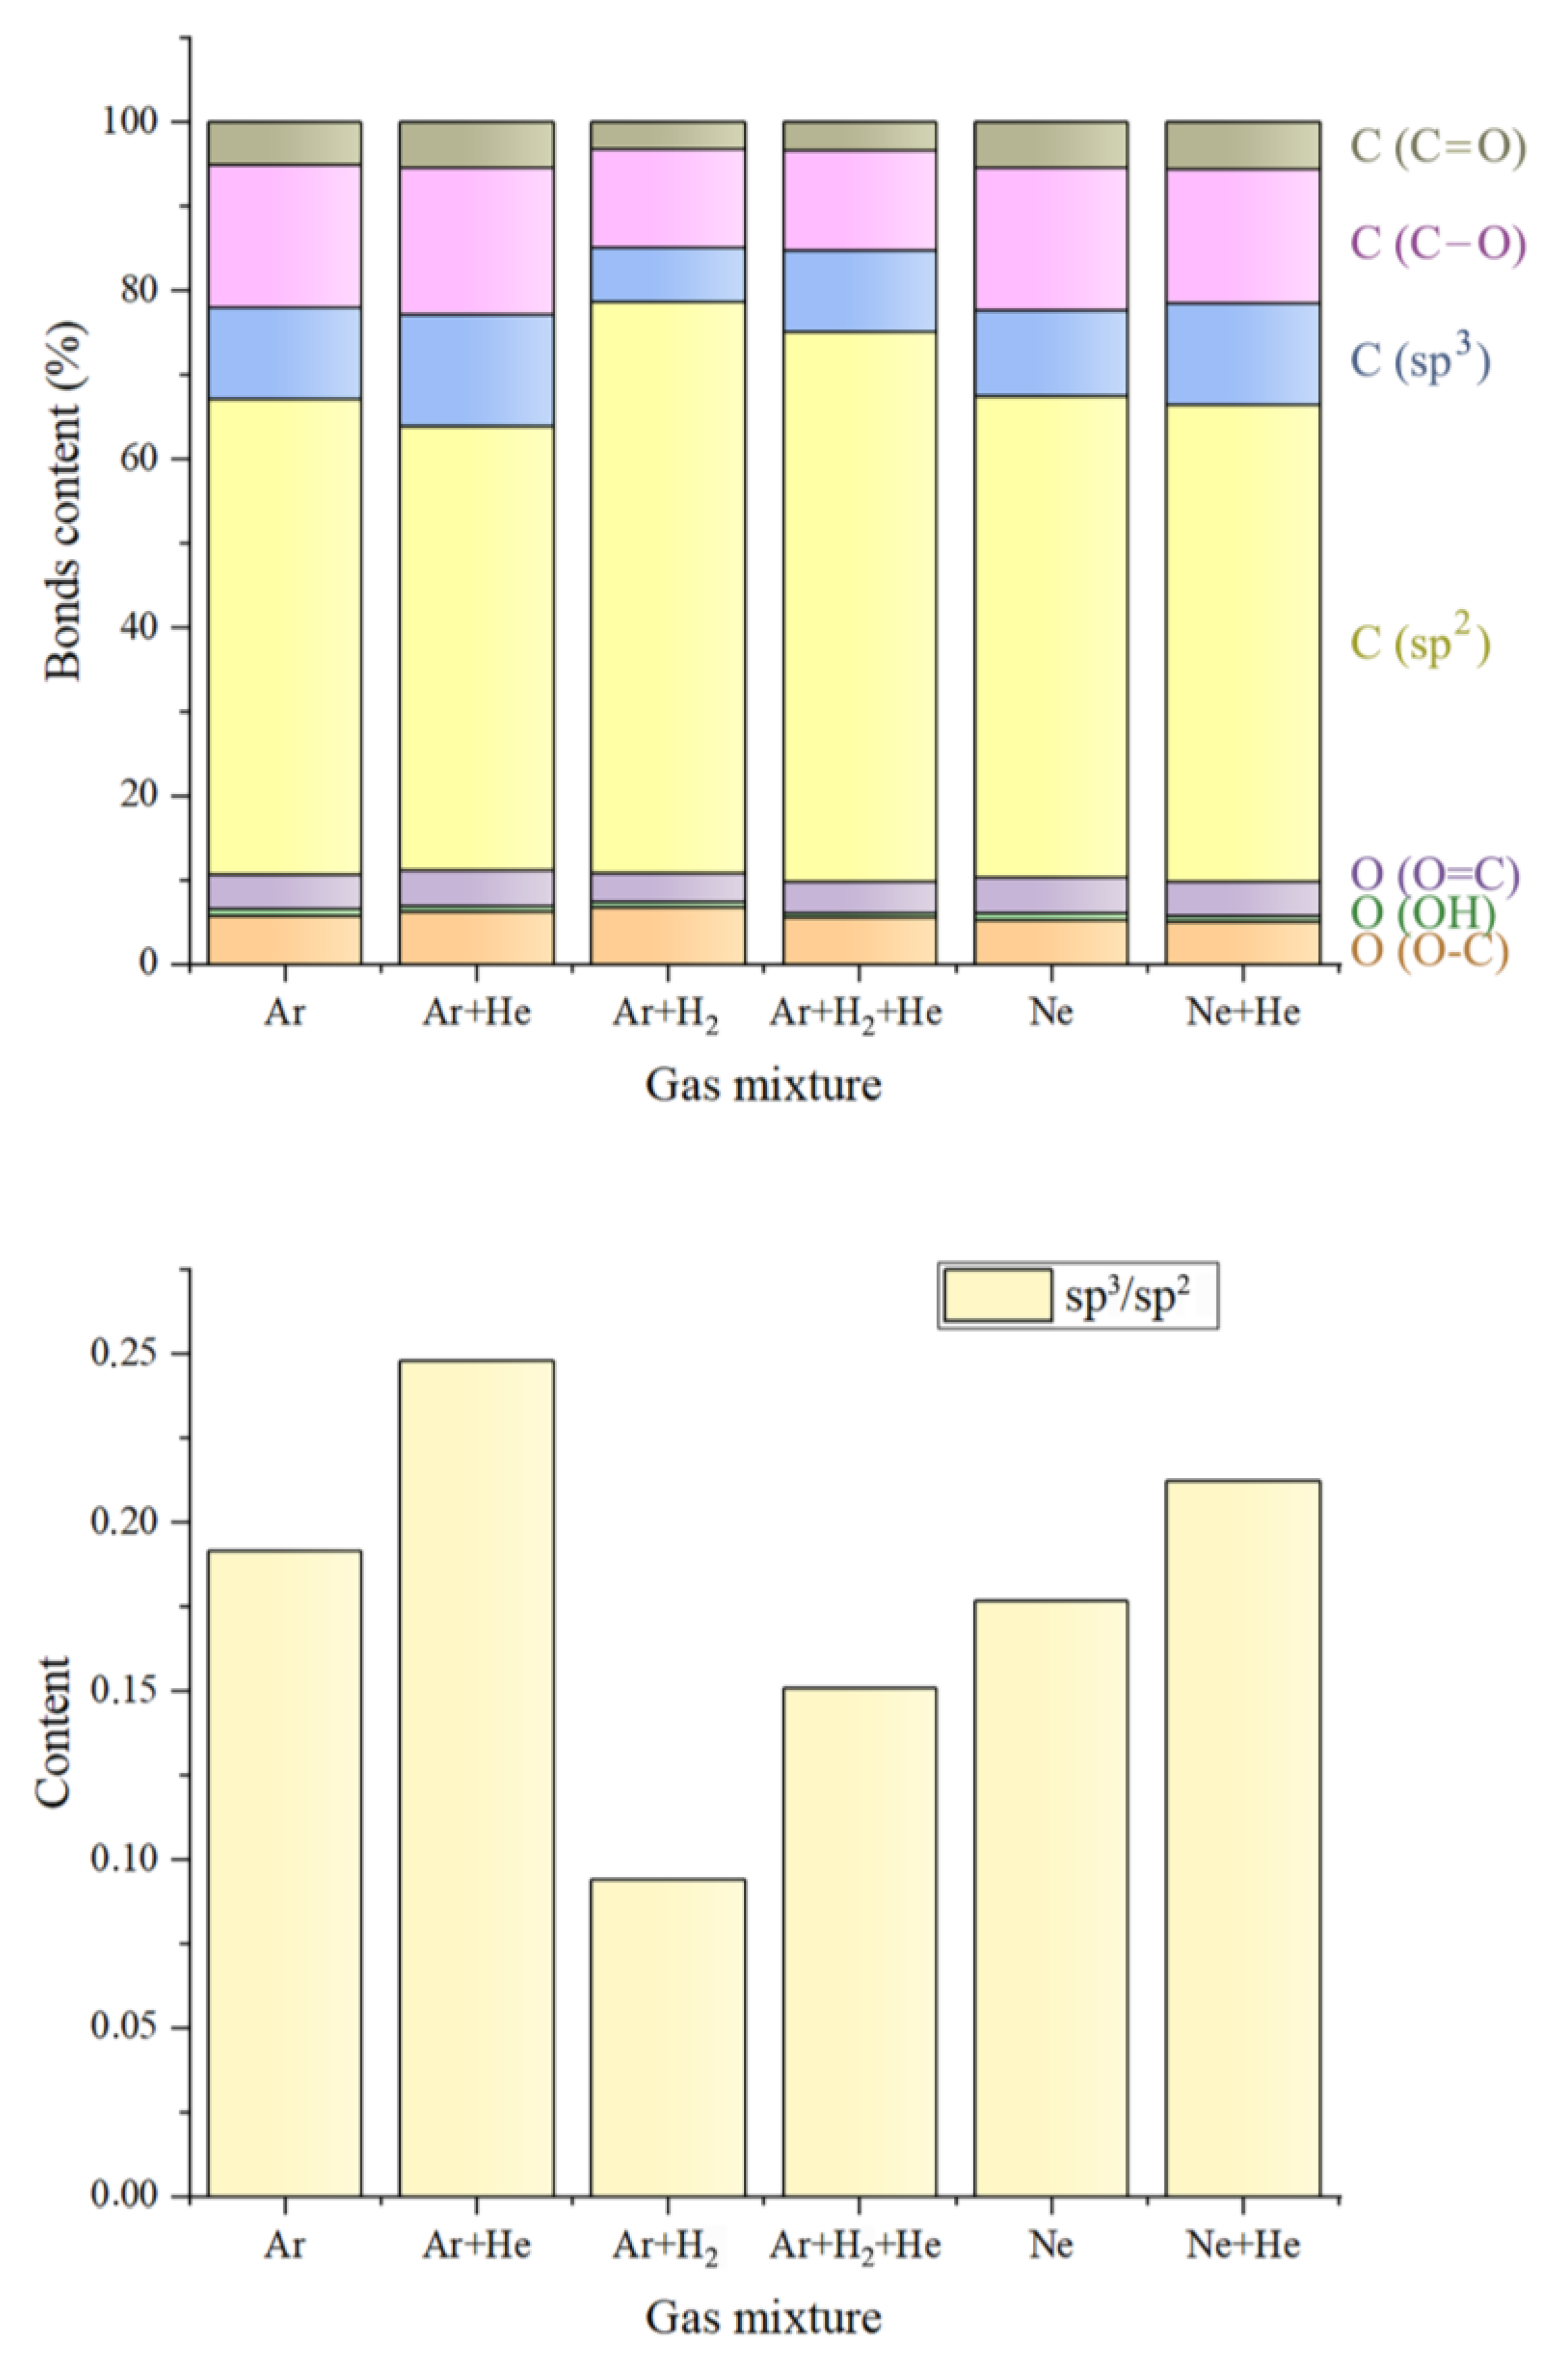
| C1s (%) | O1s (%) | Concentration (%) | |||||||
|---|---|---|---|---|---|---|---|---|---|
| C (sp2) | C (sp3) | C (C–O) | C (C=O) | O (O–C) | O (O=C) | O (OH) | C | O | |
| PMS | 65.20 | 10.75 | 11.45 | 3.44 | 4.74 | 3.81 | 0.61 | 90.84 | 9.16 |
| GIMS 0.2 Hz | 56.50 | 15.72 | 14.72 | 4.40 | 4.36 | 3.85 | 0.45 | 91.34 | 8.66 |
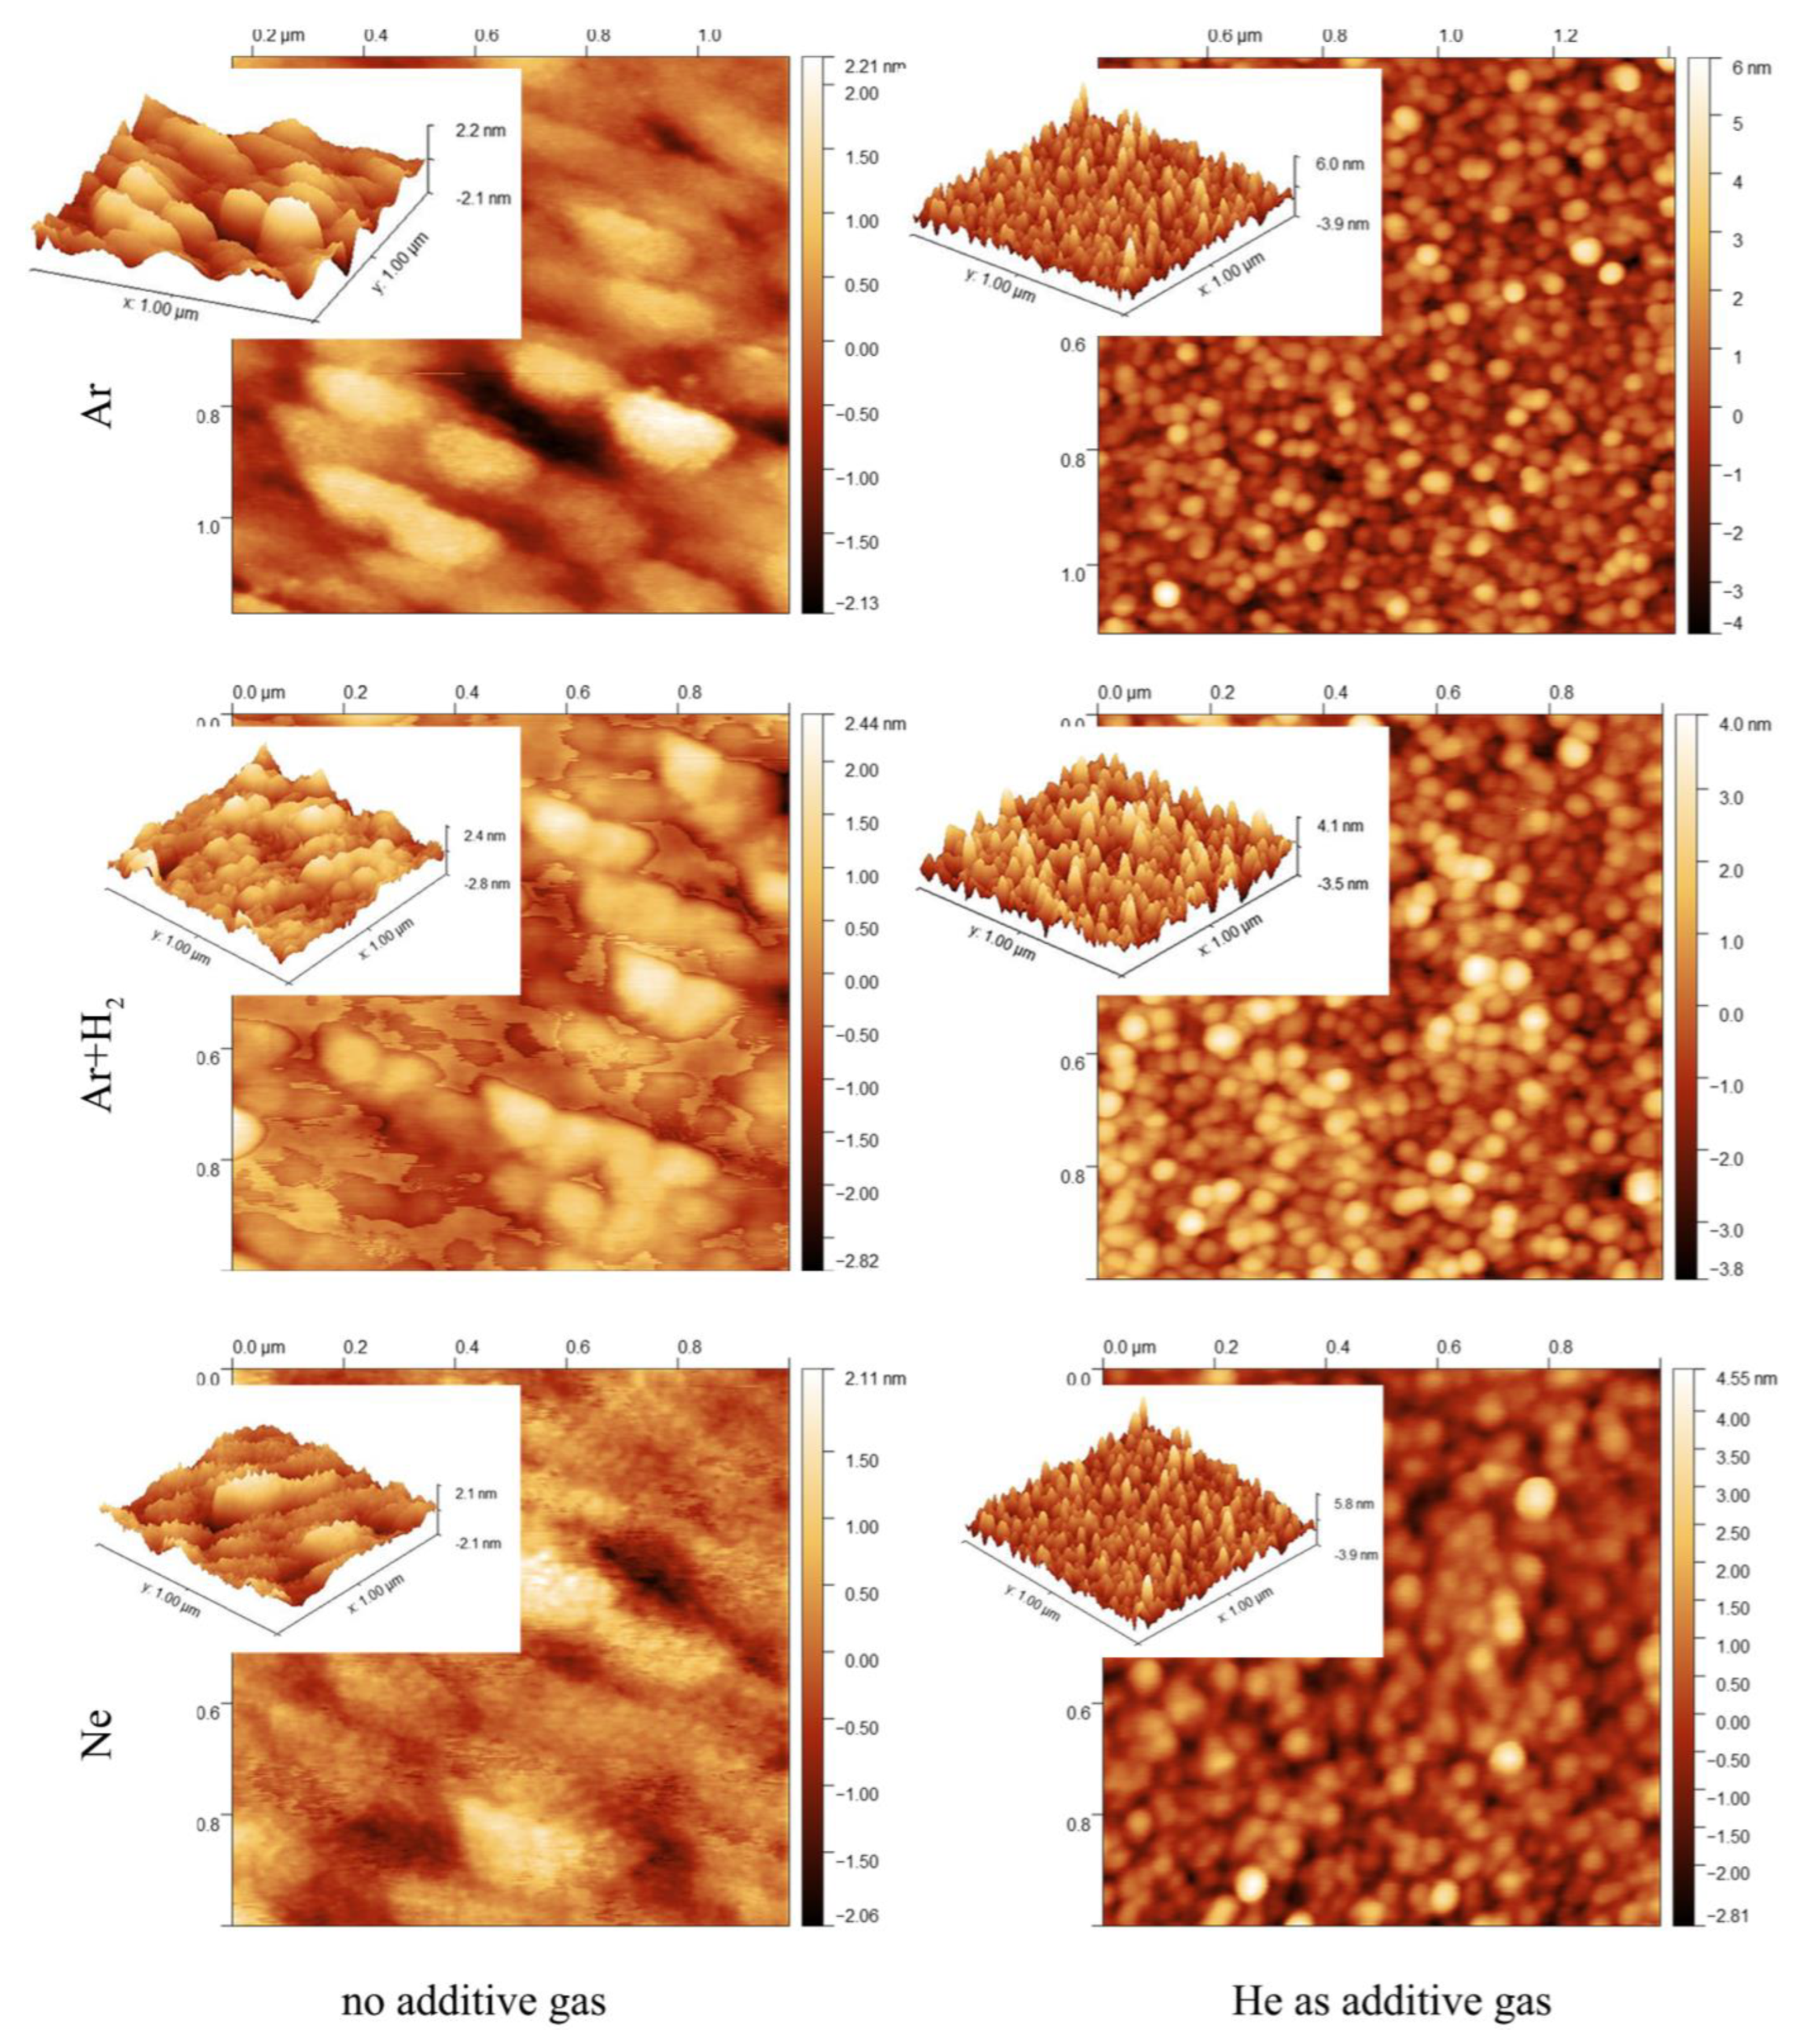
| C 1s (%) | O 1s (%) | Concentration (%) | |||||||
|---|---|---|---|---|---|---|---|---|---|
| C (sp2) | C (sp3) | C (C–O) | C (C=O) | O (O–C) | O (O=C) | O (OH) | C | O | |
| Ar | 57.3 | 10.7 | 16.5 | 5.3 | 5.3 | 4.0 | 0.6 | 89.99 | 10.01 |
| Ar + He | 52.8 | 13.1 | 17.5 | 5.4 | 6.2 | 4.1 | 0.6 | 88.95 | 11.05 |
| Ar + H2 | 67.8 | 6.3 | 11.7 | 3.2 | 6.7 | 3.3 | 0.6 | 89.21 | 10.79 |
| Ar + H2 + He | 65.2 | 9.8 | 11.7 | 3.4 | 5.5 | 3.5 | 0.6 | 90.31 | 9.69 |
| Ne | 57.2 | 10.1 | 17.0 | 5.3 | 5.2 | 4.3 | 0.7 | 89.73 | 10.27 |
| Ne + He | 56.7 | 12.0 | 15.8 | 5.6 | 5.0 | 4.0 | 0.7 | 90.22 | 9.78 |
Disclaimer/Publisher’s Note: The statements, opinions and data contained in all publications are solely those of the individual author(s) and contributor(s) and not of MDPI and/or the editor(s). MDPI and/or the editor(s) disclaim responsibility for any injury to people or property resulting from any ideas, methods, instructions or products referred to in the content. |
© 2023 by the authors. Licensee MDPI, Basel, Switzerland. This article is an open access article distributed under the terms and conditions of the Creative Commons Attribution (CC BY) license (https://creativecommons.org/licenses/by/4.0/).
Share and Cite
Chodun, R.; Skowronski, L.; Trzcinski, M.; Nowakowska-Langier, K.; Kulikowski, K.; Naparty, M.; Radziszewski, M.; Zdunek, K. The Amorphous Carbon Thin Films Synthesized by Gas Injection Magnetron Sputtering Technique in Various Gas Atmospheres. Coatings 2023, 13, 827. https://doi.org/10.3390/coatings13050827
Chodun R, Skowronski L, Trzcinski M, Nowakowska-Langier K, Kulikowski K, Naparty M, Radziszewski M, Zdunek K. The Amorphous Carbon Thin Films Synthesized by Gas Injection Magnetron Sputtering Technique in Various Gas Atmospheres. Coatings. 2023; 13(5):827. https://doi.org/10.3390/coatings13050827
Chicago/Turabian StyleChodun, Rafal, Lukasz Skowronski, Marek Trzcinski, Katarzyna Nowakowska-Langier, Krzysztof Kulikowski, Mieczyslaw Naparty, Michal Radziszewski, and Krzysztof Zdunek. 2023. "The Amorphous Carbon Thin Films Synthesized by Gas Injection Magnetron Sputtering Technique in Various Gas Atmospheres" Coatings 13, no. 5: 827. https://doi.org/10.3390/coatings13050827
APA StyleChodun, R., Skowronski, L., Trzcinski, M., Nowakowska-Langier, K., Kulikowski, K., Naparty, M., Radziszewski, M., & Zdunek, K. (2023). The Amorphous Carbon Thin Films Synthesized by Gas Injection Magnetron Sputtering Technique in Various Gas Atmospheres. Coatings, 13(5), 827. https://doi.org/10.3390/coatings13050827