Article

Numerical and Experimental Investigation Gas-Particle Two Phase Flow in Cold Spraying Nanostructured HA/Ti Composite Particle

Xinyu Key Laboratory of Materials Technology and Application for Intelligent Manufacturing, School of Mechanical and Electrical Engineering, XinYu University, Xinyu 338004, China
*
Authors to whom correspondence should be addressed.
Coatings 2023, 13(5), 818; https://doi.org/10.3390/coatings13050818
Submission received: 29 March 2023 / Revised: 16 April 2023 / Accepted: 21 April 2023 / Published: 23 April 2023
(This article belongs to the Special Issue Trends in Coatings and Surface Technology)

Abstract

:
HA composite coatings added reinforcement phases could improve the mechanical properties and bonding strength of the coatings. Cold spraying is a feasible surface technology for preparing HA composite coatings. In order to investigate the influence of cold spraying parameters on the deposition behavior of a single HA/Ti composite particle, numerical and experimental investigation of gas-particle two-phase flow in cold spraying nanostructured HA/Ti composite particle were investigated in this study. The results show that the influence of different temperatures and pressures on static pressure was not significant. The effects of gas pressure on the static temperature were tiny under the same inlet temperature and different pressure conditions; however, the static temperature in the entire spray gun cavity increased as the inlet temperature increased under the same pressure and different inlet temperature conditions. There is little effect of gas pressure on the axial velocity of gas flow in the spray gun cavity; however, the axial velocity of gas flow increased with the increase in gas temperature. Meanwhile, the axial velocity of gas flow gradually increases throughout the spraying process. At a gas temperature of 573 K and 973 K, the maximum axial velocities of a gas flow at gas pressure of 2.2 MPa were 778 m/s and 942 m/s, respectively. There is little effect of gas pressure on the axial velocity of HA/30 wt.% Ti particles under the same gas temperature. The axial velocity of HA/30 wt.% Ti particles increased with the increase in gas temperature under the same gas pressure condition. The axial velocity of composite particles decreased with the increase in the particle size under the same gas pressure and gas temperature. At a gas temperature of 573 K and 973 K, the minimum axial velocity of HA/30 wt.% Ti particles with a particle size of 30 μm at a gas pressure of 2.2 MPa was 435 m/s and 467 m/s, respectively. A certain deformation of splats occurred after impacting the substrate, and the splats adhered to the surface of the Ti6Al4Vsubstrate, clearly presenting a flat shape with a central hump surrounded by a ringy band. At a gas temperature of 973 K, particles generated more severe deformation with more cracks and ejecta phenomenon. The splats attached to the substrate were increased as the gas temperature increased.

1. Introduction

Cold spraying (CS) technology, as a novel surface technology for depositing solid-state particles, was focused on the investigation of pure metals (e.g., Cu [1], Al [2], Ti [3], and Mg [4], etc.), metallic alloys (e.g., Ti6Al4V [3], Ni50Cr [5], CrMnCoFeNi [6], etc.), cermet (e.g., WC-Co [7,8], WC-Ni [9], Cr3C2-NiCr(Ni) [10], etc.), ceramics (e.g., TiO2 [11,12], TiN [13], SiC-TiN [14], etc.) coatings. Hydroxyapatite (HA, Ca10(PO4)6(OH)2) is often used as a biological coating material for surface modification of Ti and its alloys because of its unique biological characteristics [15]. Vilardell et al. [16] reported that micro- and nanocrystalline HA coatings were fabricated on Ti6Al4V substrate using CS technology, and NC-HA coating surface with finer porous nanocrystalline structures could achieve faster cell proliferation compared to CS HA coating. Chen et al. [17] reported that HA particle size and substrate materials could influence the deposition behavior of cold-sprayed HA splats, and HA coating with homogenous and dense microstructure present higher microhardness and tensile strength compared to air plasma spray (APS) and microplasma spray (MIPS) ones. Chatelain et al. [18] studied the influence of the thermal treatment of HA particles on the microstructure of HA splats and coatings with different nano-crystallite sizes. Ji et al. [19] reported that the characteristics of nano-HA splats cold-sprayed on Ti6Al4V and stainless-steel substrates, and the dense nano-HA coatings were successfully deposited on the Ti butter layer. Meanwhile, nano-HA coatings present high abrasive resistance after sliding against polycarbonate (PC) and polyurethane (PU) sheets, and good apatite-forming ability. However, the low interfacial adhesion problem of pure HA material, which was induced by poor mechanical properties, or low crystallinity and phase transformation decomposition during thermal spraying, greatly hinders the role of HA as a bone repair material for load-bearing parts of human bodies [20,21].
Therefore, the focus of current research is that, in order to improve the interface bonding and mechanical properties, HA composite coatings are prepared by adding a reinforcement phase into pure HA. At present, HA composite coatings were prepared by different surface technologies, such as electrochemical deposition, RF magnetron sputtering, laser cladding, and thermal spraying. HA composite coatings added the second particles (e.g., CNTs [22], TiO2 [23], and GO [24], etc.) were deposited by electrochemical deposition to improve the interface bonding strength of the coatings. However, due to the complex affecting factors (e.g., electrolyte composition, current, voltage, temperature, etc.), it was difficult to effectively control the microstructure and composition of HA composite coatings [25]. HA gradient composite coatings prepared by RF magnetron sputtering, such as HA/Al2O3/TiO2 [26], HAF/YSZ [27], HA/TiO2 [28], and HA/Ti [29] coatings, could improve the mechanical properties and bonding strength by alleviating the difference in thermal expansion coefficient between the coating and the substrate. However, the decomposition and hydroxyl deletion in the coating could reduce the interfacial bonding of the coating particles [30]. The interface bonding mechanism of HA composite coatings (e.g., Ti/HA [31], CNTs-HA [32], TiO2/HA [33], etc.) prepared by laser cladding was metallurgical bonding [34]. However, decomposition phases (e.g., Ca4(PO4)2O, Ca3(PO4)2, or Ca2P2O7, etc.) induced by elevated temperature and cracks induced by thermal stress led it to be difficult to control the uniformity and stability of the coating [34]. Currently, many researchers have performed a lot of research work on the preparation of HA composite coating by thermal spraying technologies (e.g., plasma spraying, high-velocity oxygen fuel spraying, high-velocity suspension flame spraying, warm spraying, etc.). The interfacial bonding strength of HA composite coatings was mainly improved by adding ZrO2 [35,36], Al2O3 [35,37], Al2O3-TiO2 [38], TiO2 [39,40], Ti [41,42], nanodiamond (ND) [43], or other second-phase particles in the coatings. However, HA composite coatings were prone to decomposition, phase transformation, or oxidation under the action of flame flow at high temperature [35,36,37,38,39,40,42], especially nanostructure HA composite coatings. Hence, although many surface technologies were applied to successfully prepare HA composite coatings, due to the difficulty in controlling the composition and crystallinity of the HA coatings, or the existence of large residual stress in the coatings, it was difficult to effectively improve the interfacial bonding of the coatings.
CS, as a low-temperature deposition technology, can effectively prevent the change of feedstock composition and the generation of tensile stress [1,2,3,4], especially suitable for preparing HA composite coating. Guillem-Marti et al. [44] reported that Ti-HA composite coating prepared by CS presented high adhesion and bond strength as well as biological stability. Zhou et al. [45] reported that cold-sprayed 20 wt.% HA/Ti coatings presented lower corrosion resistance compared to cold-sprayed Ti and 50 wt.% HAP/Ti coatings. Meanwhile, the corrosion resistance and mechanical properties of 20 wt.% HAP/Ti coatings could be improved after heat treatment. Gardon et al. [46] studied the plastic deformation behavior of HA and Ti powders blended in different percentages, as well as the microstructure and bonding strength of cold-sprayed HA/Ti coatings before and after immersing in the simulated body fluids. Although certain experimental research of cold-sprayed HA composite coatings has been performed by many researchers, there are few reports on the numerical analysis of the influence of cold spraying parameters (e.g., gas temperature, gas pressure, particle size, etc.) on the distributions of HA composite particle axial velocity. Hence, in order to investigate the influence of CS parameters on the deposition behavior of a single HA/Ti composite particle, numerical and experimental investigation of gas-particle two-phase flow in CS nanostructured HA-Ti composite particle were investigated in this study. The main innovations of this study include the following: (1) the distributions of gas flow and HA/Ti composite particles’ axial velocity in the flow field under the conditions of different gas pressure and different gas temperature were studied; (2) combined with the results of numerical simulation analysis, the deposition characteristic of cold-sprayed single nanostructured HA/Ti composite particle was studied through experiments.

2. Model Description and Methodology

2.1. Computational Method

Euler–Lagrangian model was applied to the working model of gas flow and gas-particle two-phase flow. The gas flow parameters in the flow field and the trajectory and axial velocity of HA/Ti composite particles in the flow field were calculated by Euler–Lagrangian method.

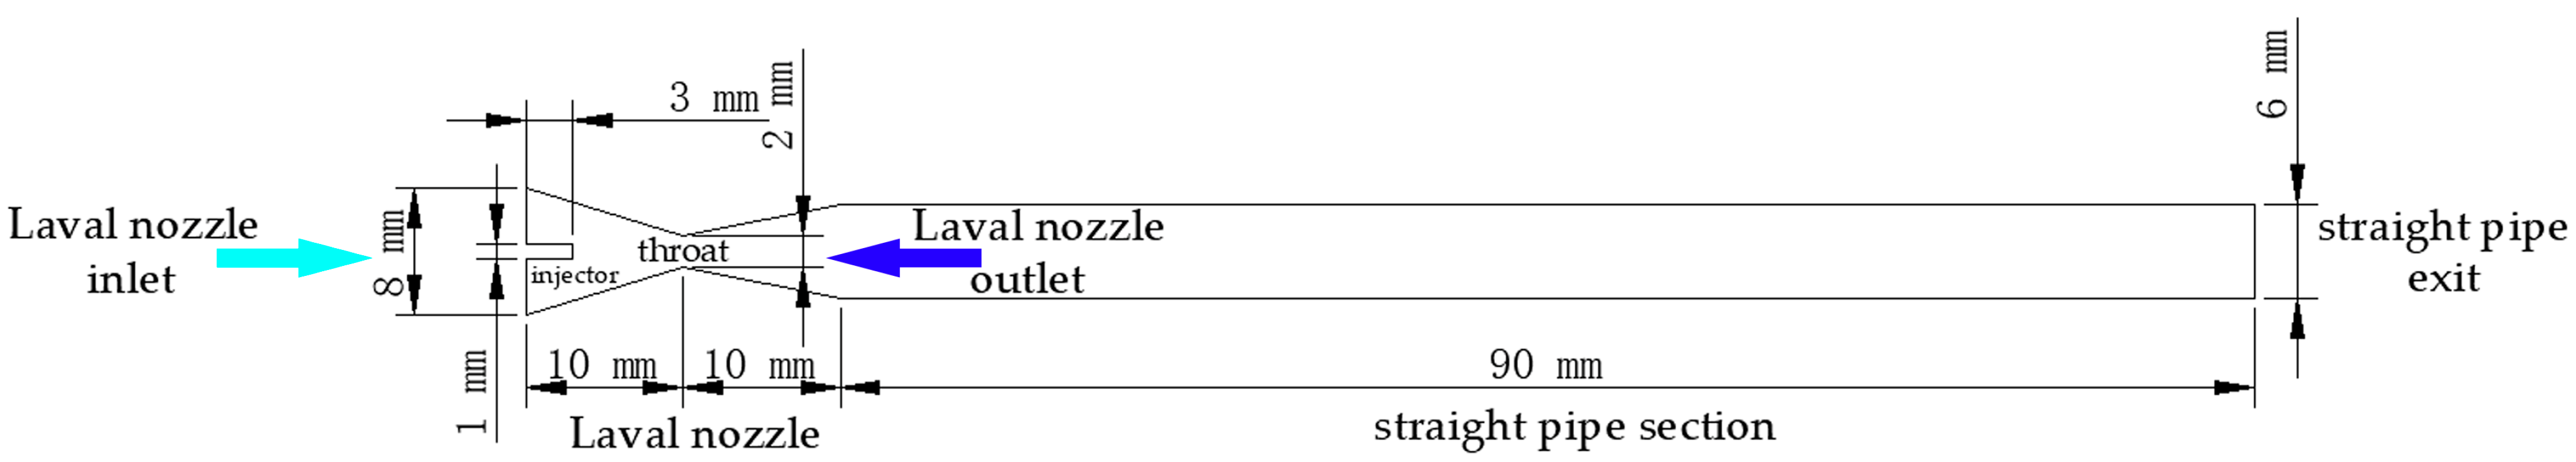
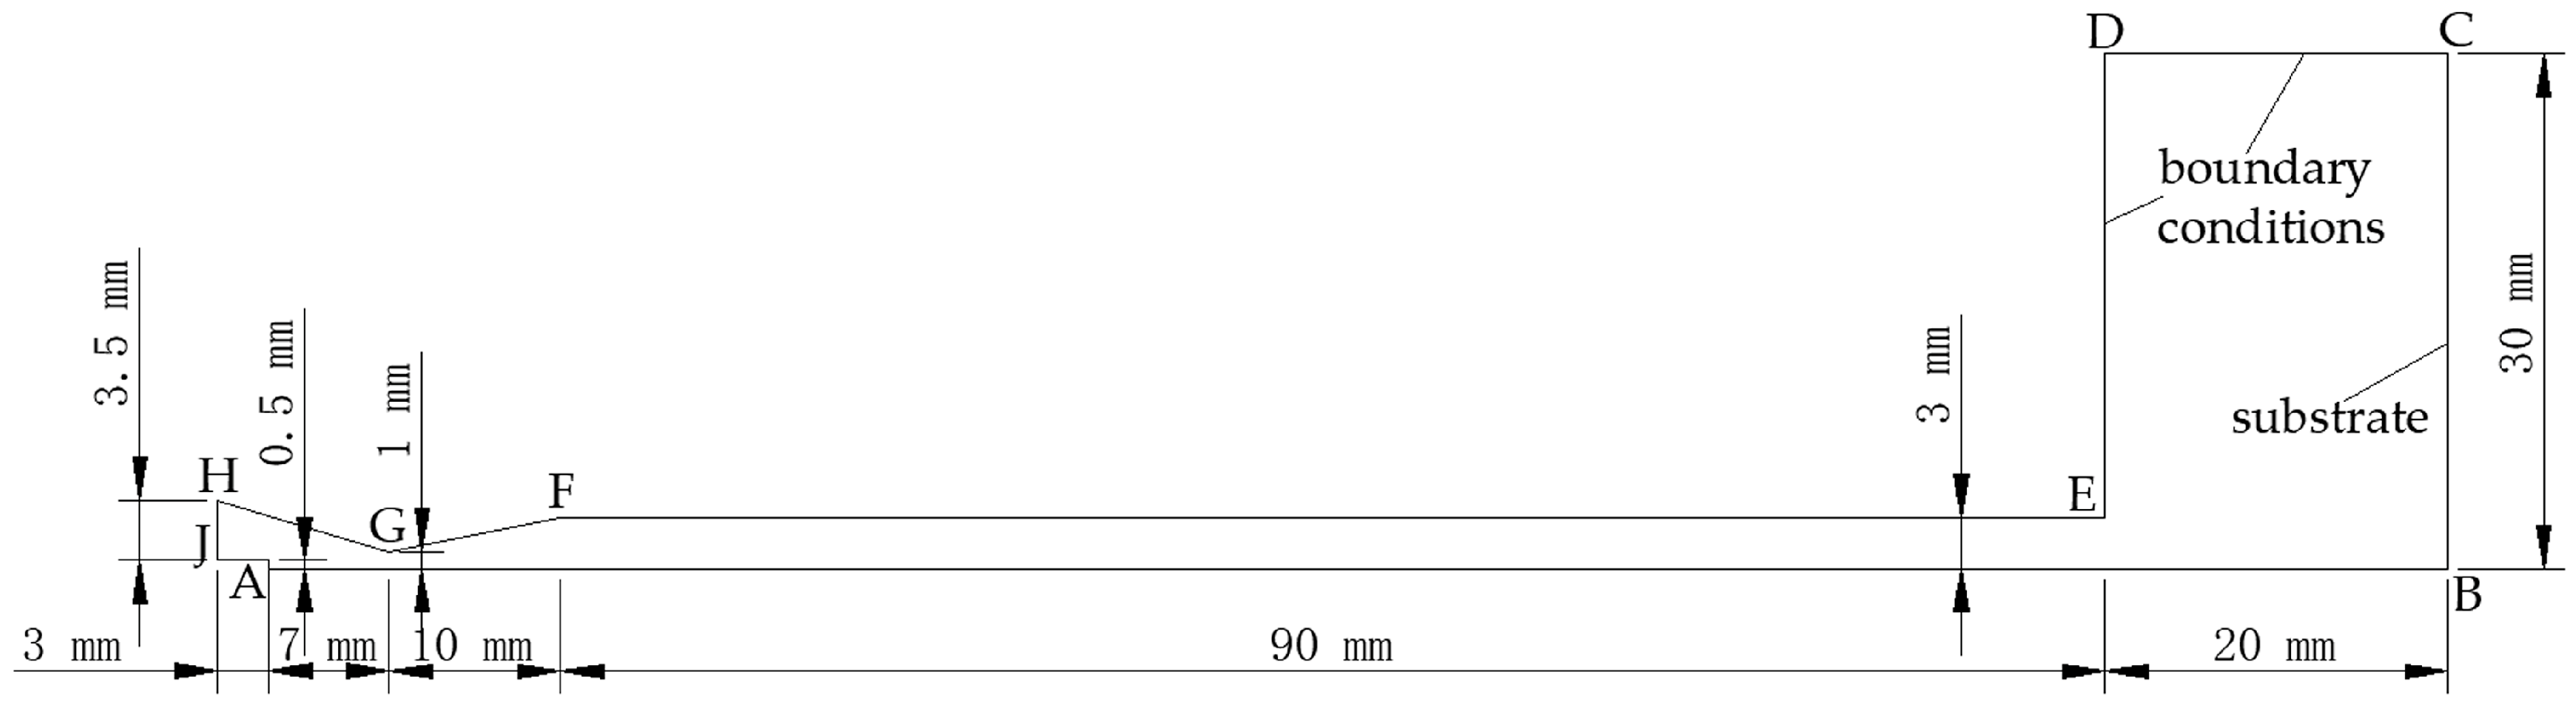
2.2. Geometry and Boundary Conditions

The jet domain of HA/Ti CS process consists of the following three parts: Laval nozzle, straight pipe section with constant cross-sectional area of spray gun, and atmospheric environment outside the spray gun. Figure 1 shows the schematic diagram of the internal cavity structure of cold spray gun. The nozzle contains a Laval nozzle inlet of 8 mm diameter (as marked by cyan arrow), a powder injector diameter is 1 mm with a length of 3 mm, a throat of 2 mm diameter, a Laval nozzle outlet of 8 mm diameter (as marked by blue arrow), a straight pipe exit of 6 mm diameter, and a straight pipe section of 90 mm length. The horizontal distance from the inlet to the throat is 10 mm, and the horizontal distance from the throat to the pressure outlet is 100 mm. Figure 2 shows the schematic diagram of calculation domain. The measurement distance of static pressure, static temperature, and axial velocity of gas flow is from Laval nozzle inlet to the substrate (the axial distance from 0 mm to 130 mm). The outside domain is a cylinder of 30 mm in radius and 20 mm in length from the nozzle exit to the substrate [47]. The detailed simulation parameters of FLUENT flow field analysis in the CS process of HA/Ti composite particles are listed in Table 1. It can be shown from Figure 2 that JH was set as pressure inlet, and the inlet temperature was set as 573 K and 973 K, respectively. Correspondingly, the inlet pressure is set as 1.8 MPa, 2.0 MPa, and 2.2 MPa. The spray gun axis AB was set as the horizontal axis. DE and DC were set as pressure outlets, and the outlet pressure value was consistent with the inlet pressure. Meanwhile, the outlet temperature was consistent with the inlet temperature. HG, GF, and FE were set as spray gun walls. BC was set as substrate wall, and the substrate temperature was set as 300 K. For HA/Ti particles, the particle size for simulation analysis is set as 10 μm, 20 μm, and 30 μm, respectively. In addition, HG, GF, and FE were set as the reflecting wall, and BC was set as the escaping wall.

2.3. Gas and Particle Flow

The flow field analysis of Laval spray gun is simplified in the modeling process. In order to simplify the computation, the assumptions used for cold spraying carrier gas and particle in the computational fluid dynamics are listed as follows:
(1)
The gas is regarded as an ideal gas with constant specific heat capacity;
(2)
The particles are incompressible and spherical in shape;
(3)
The interaction between the particles is negligible in the flow field;
(4)
The influence of the particles on the flow state of the gas is negligible;
(5)
The friction resistance effect and thermal transmission of nozzle pipe on the gas are negligible;
(6)
The gravity effect of the particles is negligible.

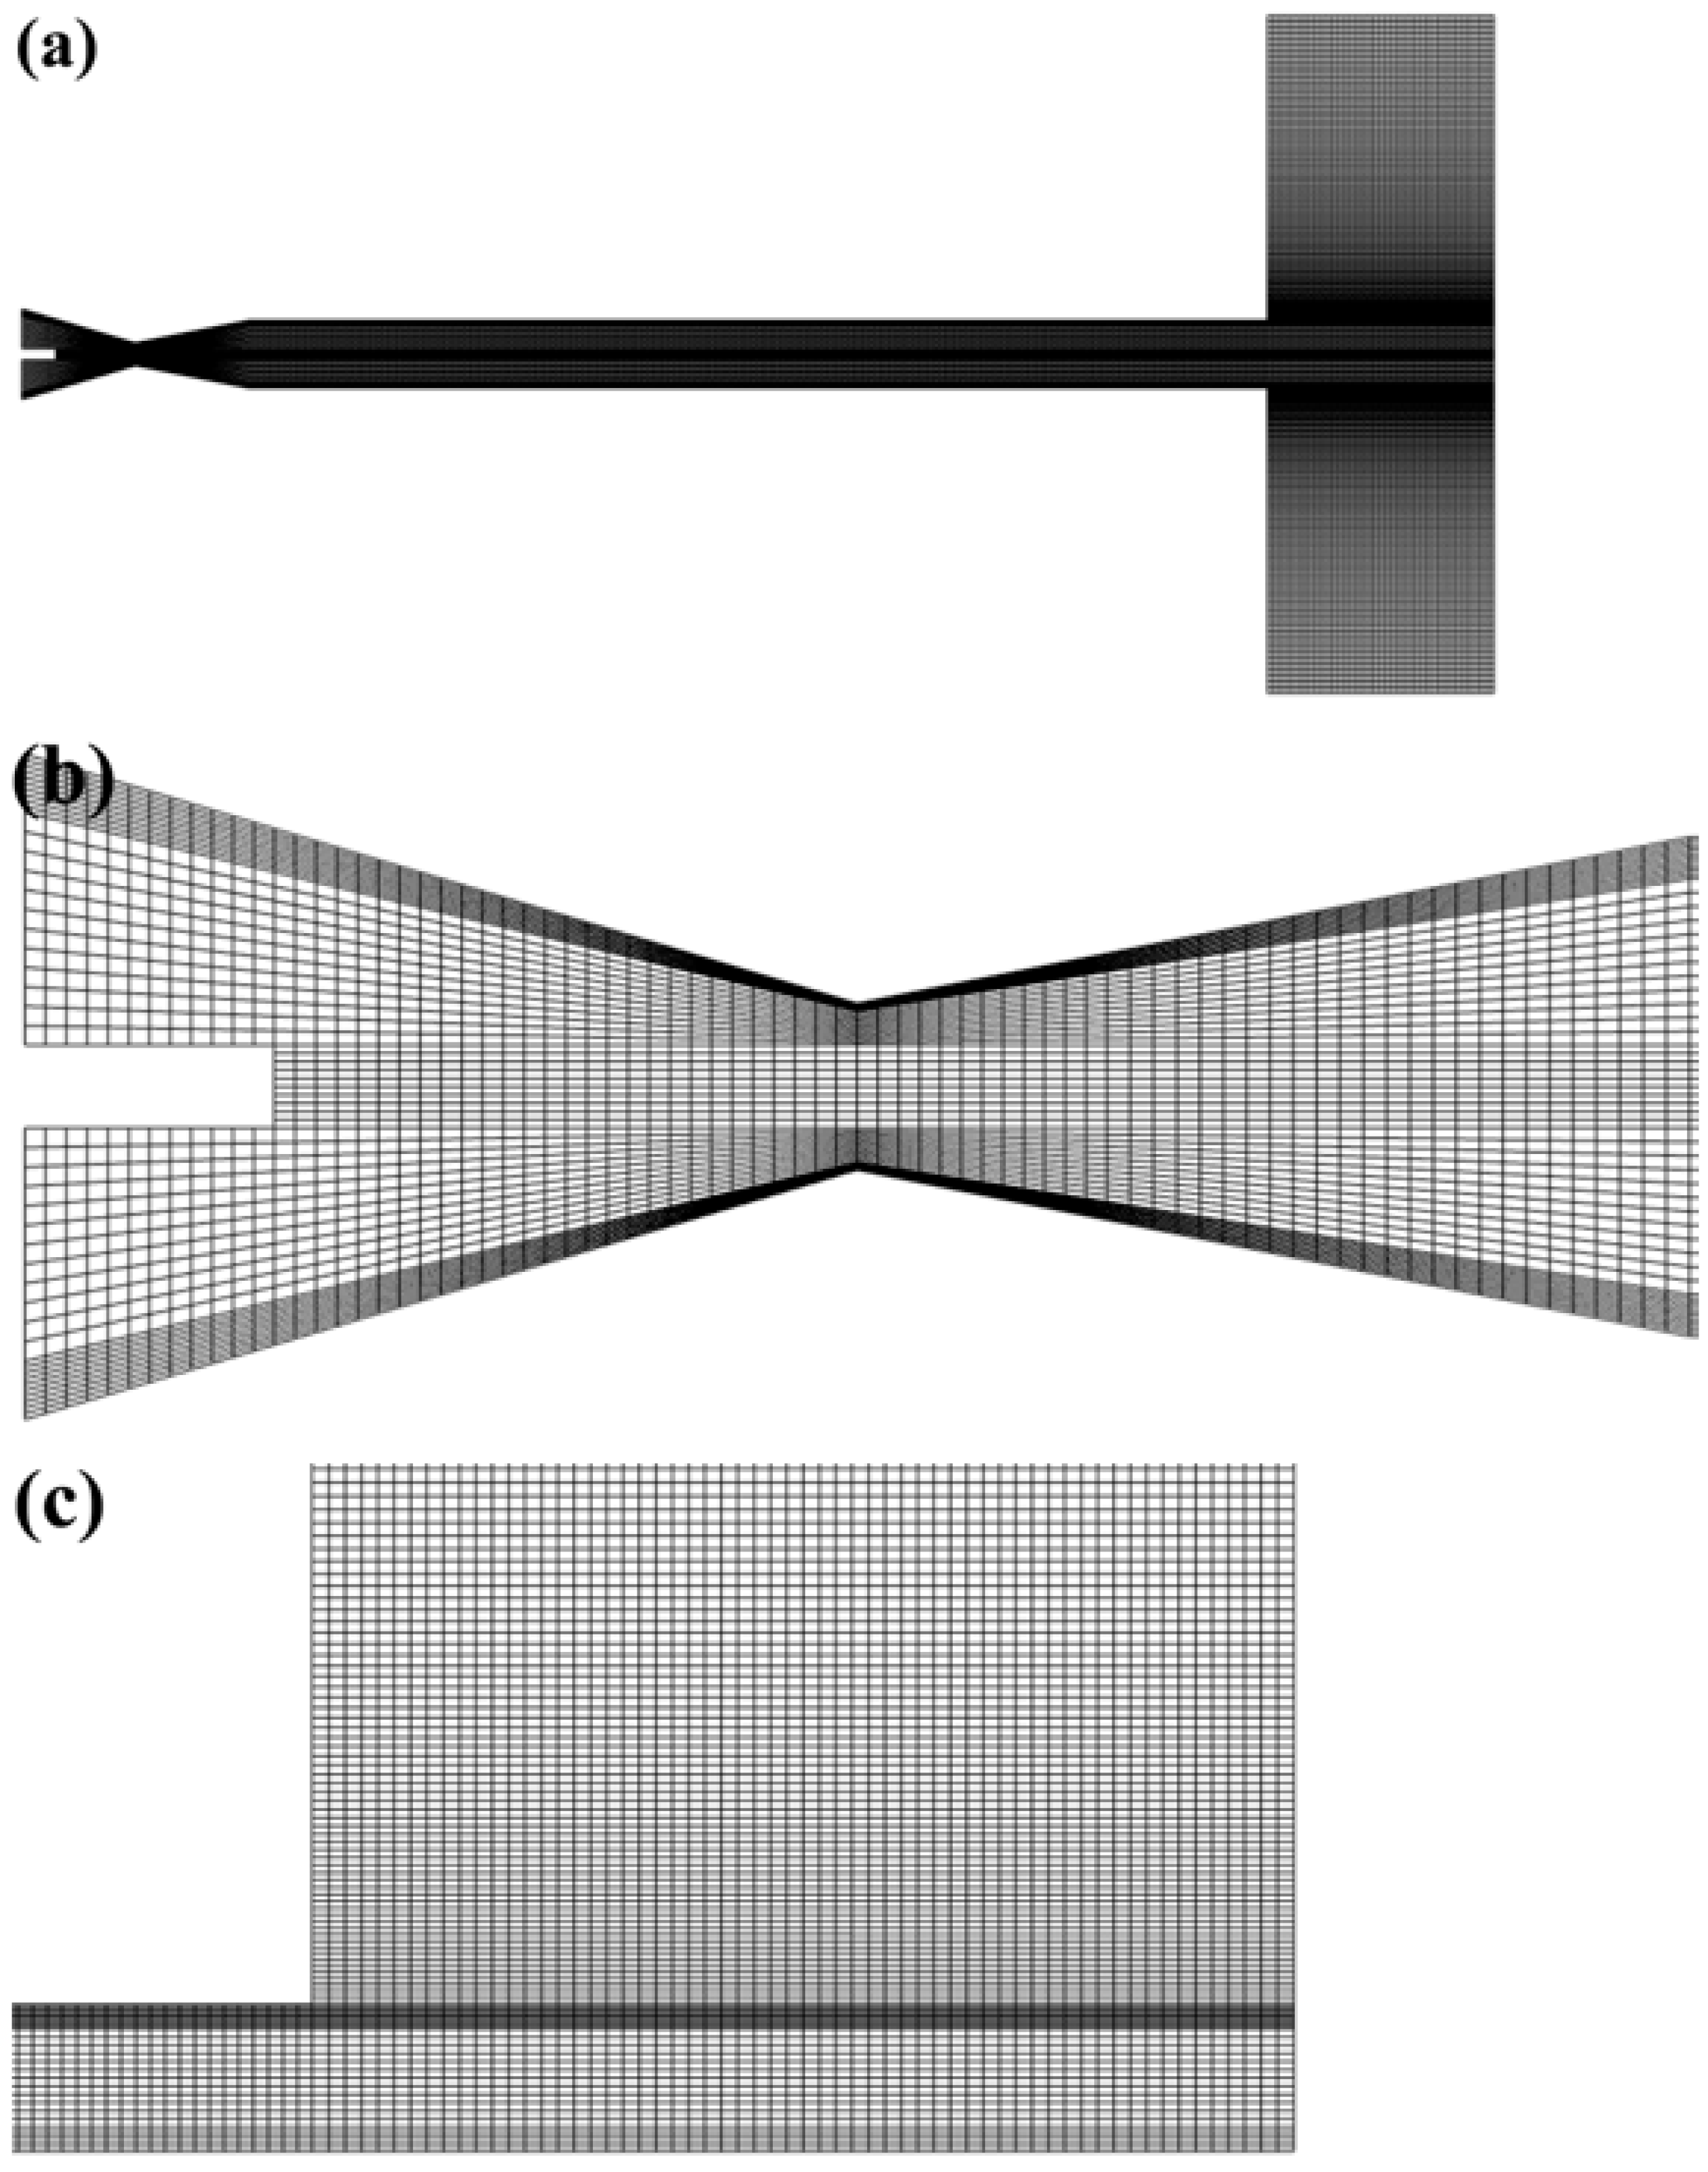
2.4. Meshing of Calculation Domain
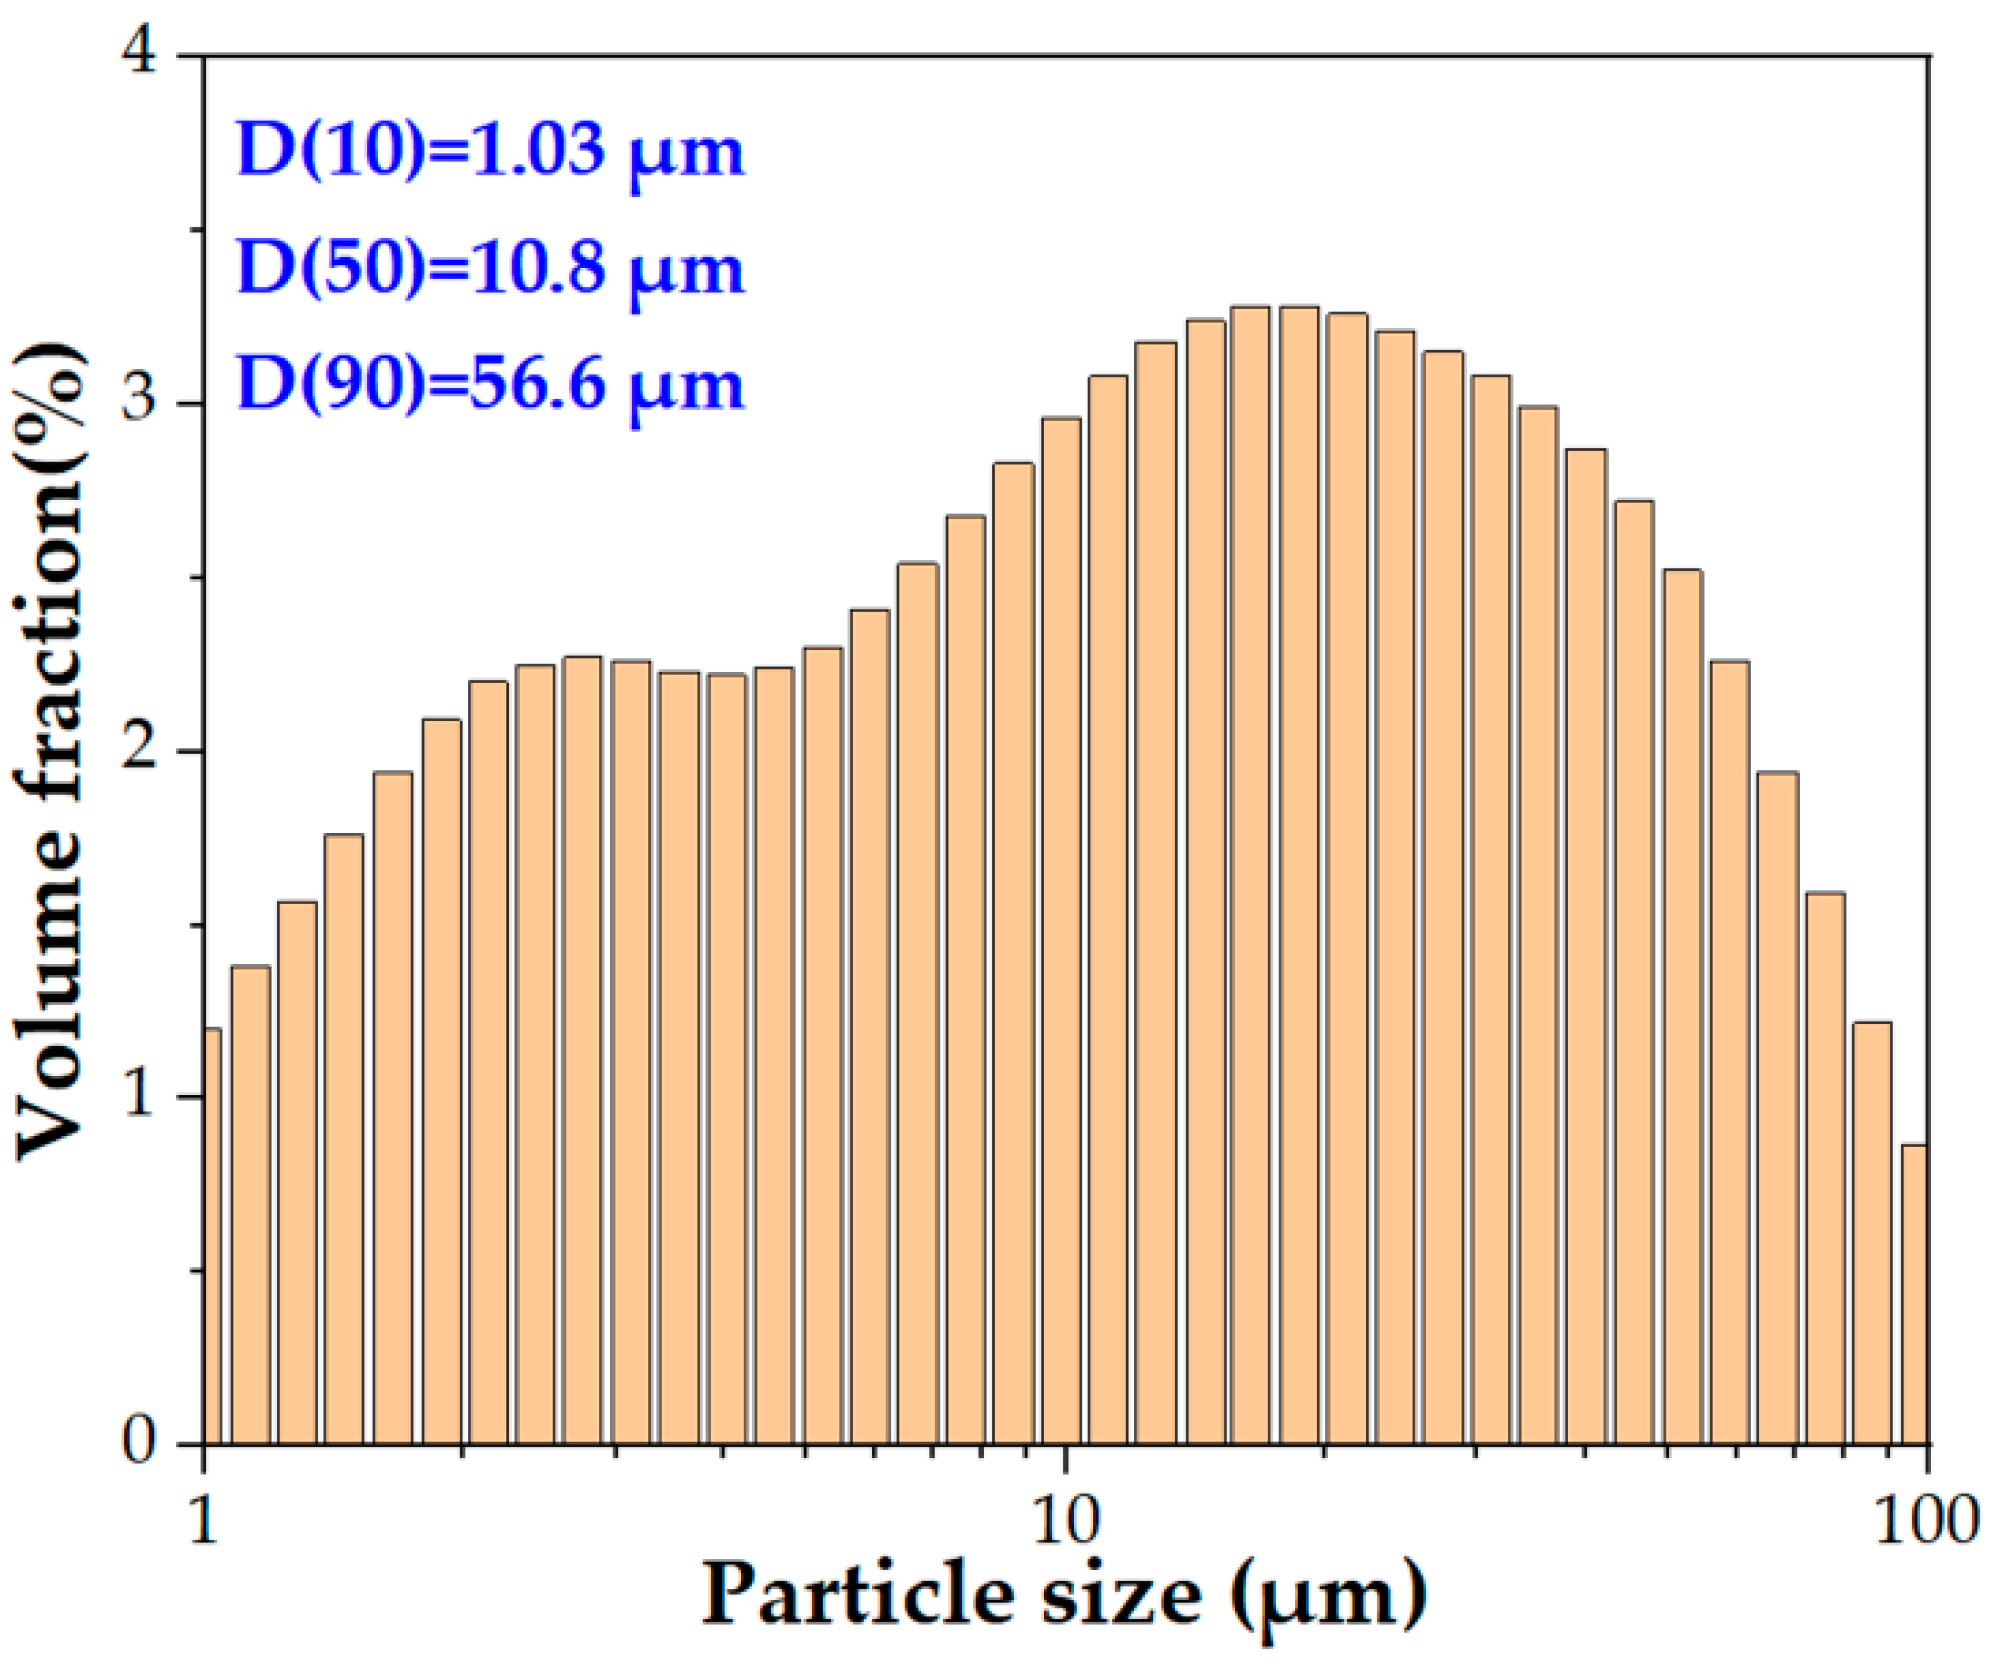
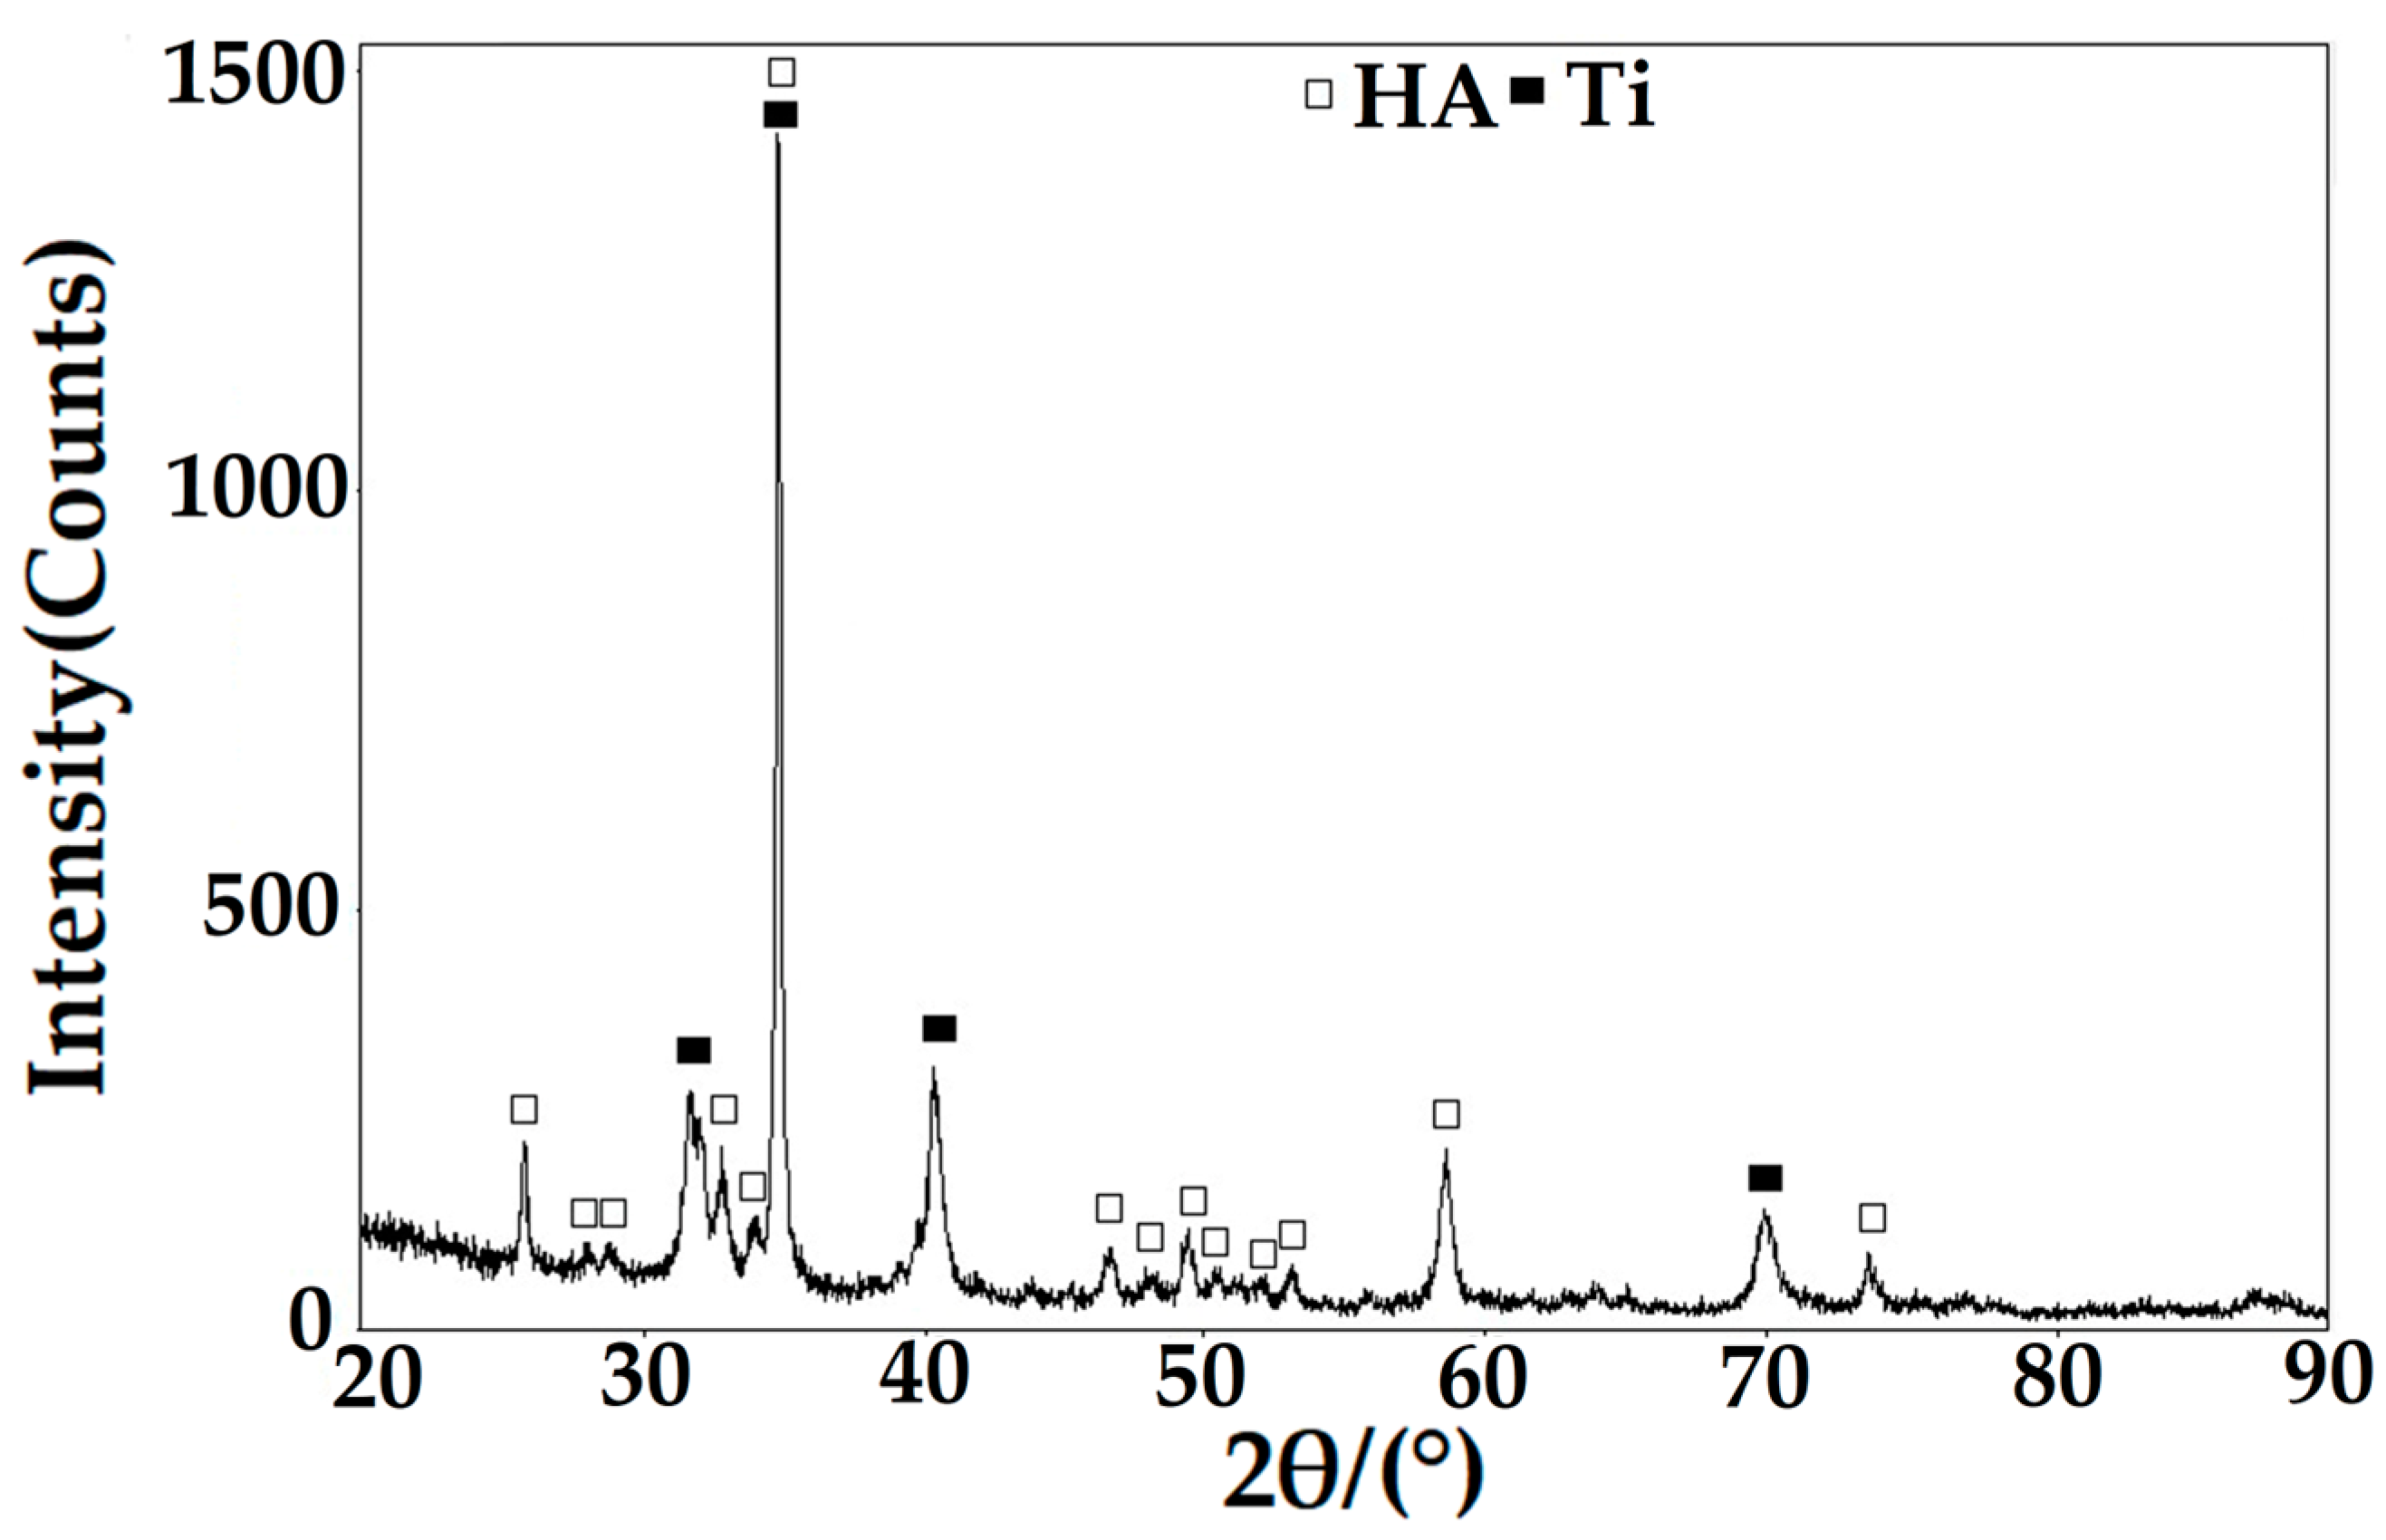
According to the structure size of Laval spray gun and the length of spray distance, the size of flow field calculation domain is set. The calculation domain is meshed and discretized. The point-line method is mainly applied to model, and the edges are divided first during meshing. In order to make the flow direction of the fluid consistent with the meshing direction, the quadrilateral structure mesh is used for division to reduce the numerical diffusion in the calculation. Due to the complex flow near the wall, the wall is divided into high-density grids to reduce the impact of grid on the calculation accuracy of the wall. The simulation meshing of entire calculation domain, pressure inlet and throat domain, and outlet was shown in Figure 3a–c, respectively. The total number of mesh is 51,056.

2.5. Materials

Raw materials manufactured by an agglomeration sintering method were HA/Ti composite powders with HA size of 10–20 nm (Beijing Dk nano S&T Ltd., Beijing, China). The mass ratio of HA and Ti is 7:3. The preparation process steps of HA/Ti composite powders are as follows: firstly, pure HA powders and pure Ti powders with a mass ratio of 7:3 were mixed evenly by wet ball milling method for 2 h, and then polyvinyl alcohol (PVA) binder was added to continue ball milling for 2.5 h, the milling rotation speed was 300 rpm; finally, HA/Ti composite powders were successfully prepared by spray drying combined with sintering technology. The density (2697.8 kg/m3) and heat capacity (1375.7 J/(kg·K)) properties of HA/30 wt.% Ti particles were considered in the numerical simulations. Figure 4 shows the surface and cross-sectional morphologies of HA/Ti powders. The particle size distribution of HA/Ti powders is characterized by a laser diffraction meter (GSL-1020, Liaoning Instrument Research Institute Co., Ltd., Dandong, China). The size distribution (D10, D50, and D90) of HA/Ti powders is shown in Figure 5. Ti6Al4V sheet was used as a substrate for depositing single HA/Ti particle. The substrate dimensions were 50 × 25 × 3 mm3. Prior to CS, in order to better observe the morphologies of HA/Ti splat deposited on the surface of the substrate, the substrate was ground with metallographic sandpaper and subsequently polished with diamond abrading agent. The polished substrate roughness is 0.05 μm.

2.6. Single HA/Ti Particle Deposition

The deposition of single HA/Ti particles was carried out by a CS system (CS-2000, Xi’an Jiaotong University, Xi’an, China). The schematic diagram of CS system can be found in the literature [48]. Detailed CS parameters of single HA/Ti particle deposition are listed in Table 2.

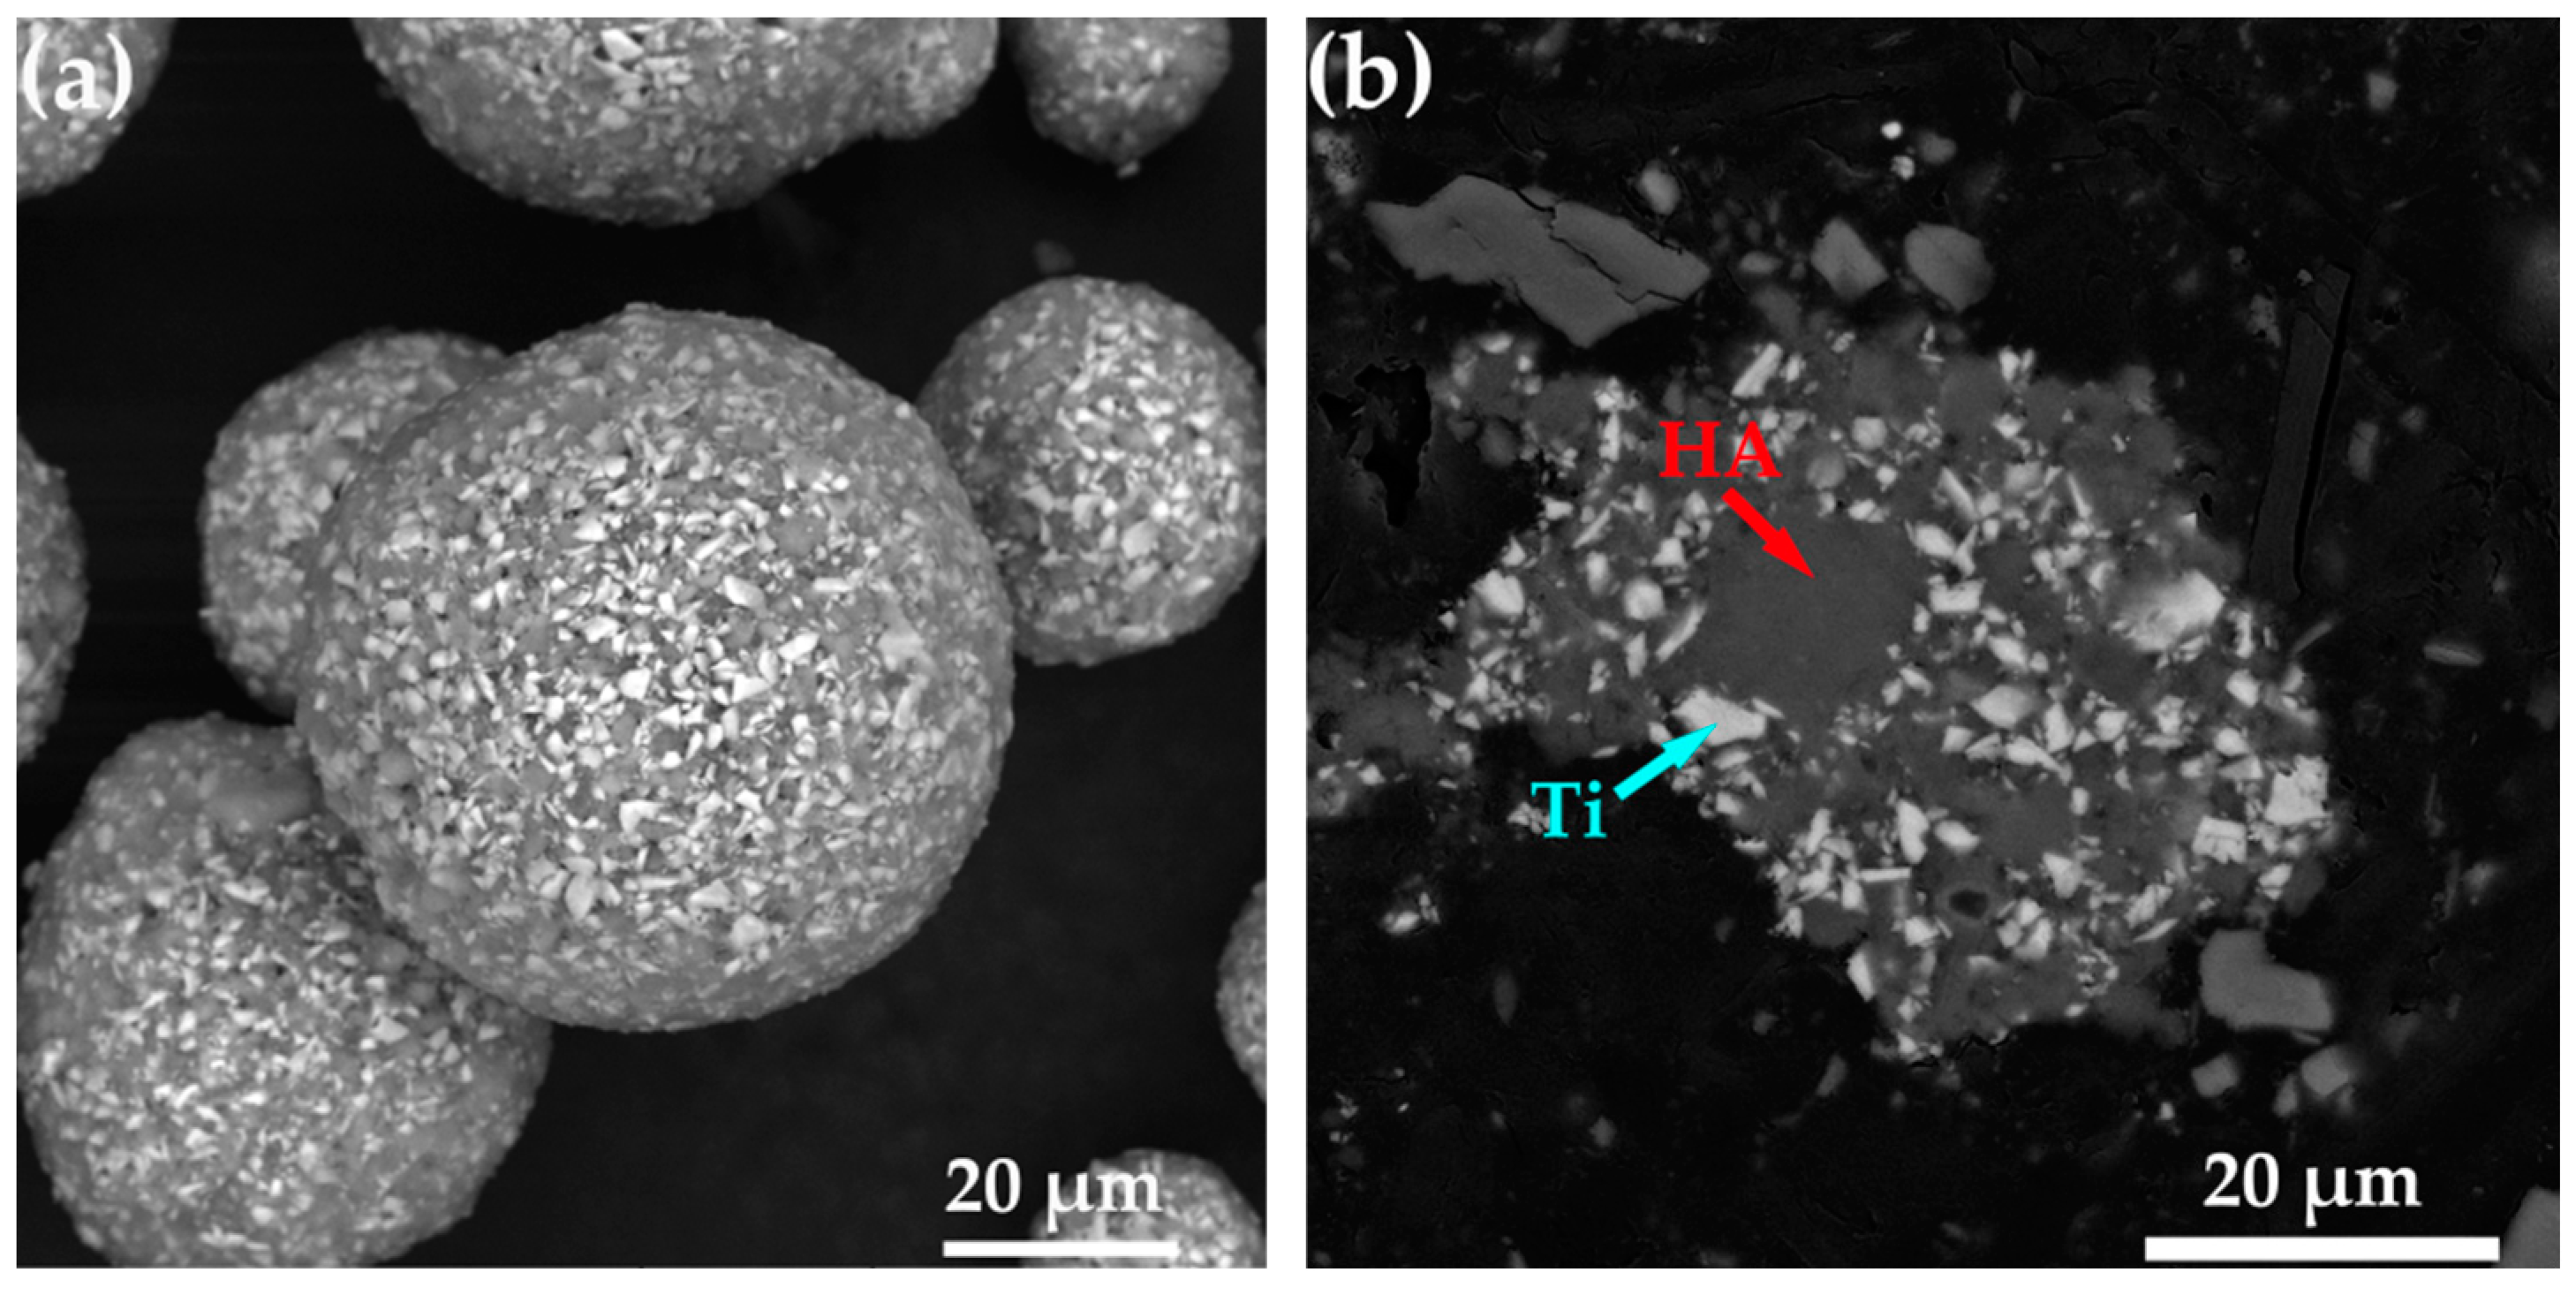
2.7. Microstructure Characterization of Powders and Splats

The morphologies of HA/Ti feedstock powders and deposited splats were characterized by scanning electron microscope (SEM; VEGA II-LSU, TESCAN, Brno, Czech Republic) in backscattering electron (BSE) mode. The phase compositions of HA/Ti feedstock powders were analyzed by X-ray diffraction (XRD; Bruker D8 Advance, Karlsruhe, Germany) with Cu-Kα radiation (λ = 1.5418 Å, 35 kV, and 35 mA). The XRD patterns of HA/Ti powders are shown in Figure 6.

2.8. Particle Velocity

The velocity distribution of HA/30 wt.% Ti particles was measured by DPV eVOLUTION system (Tecnar Automation Ltd., Saint-Bruno-de-Montarville, QC, Canada).

3. Results and Discussion

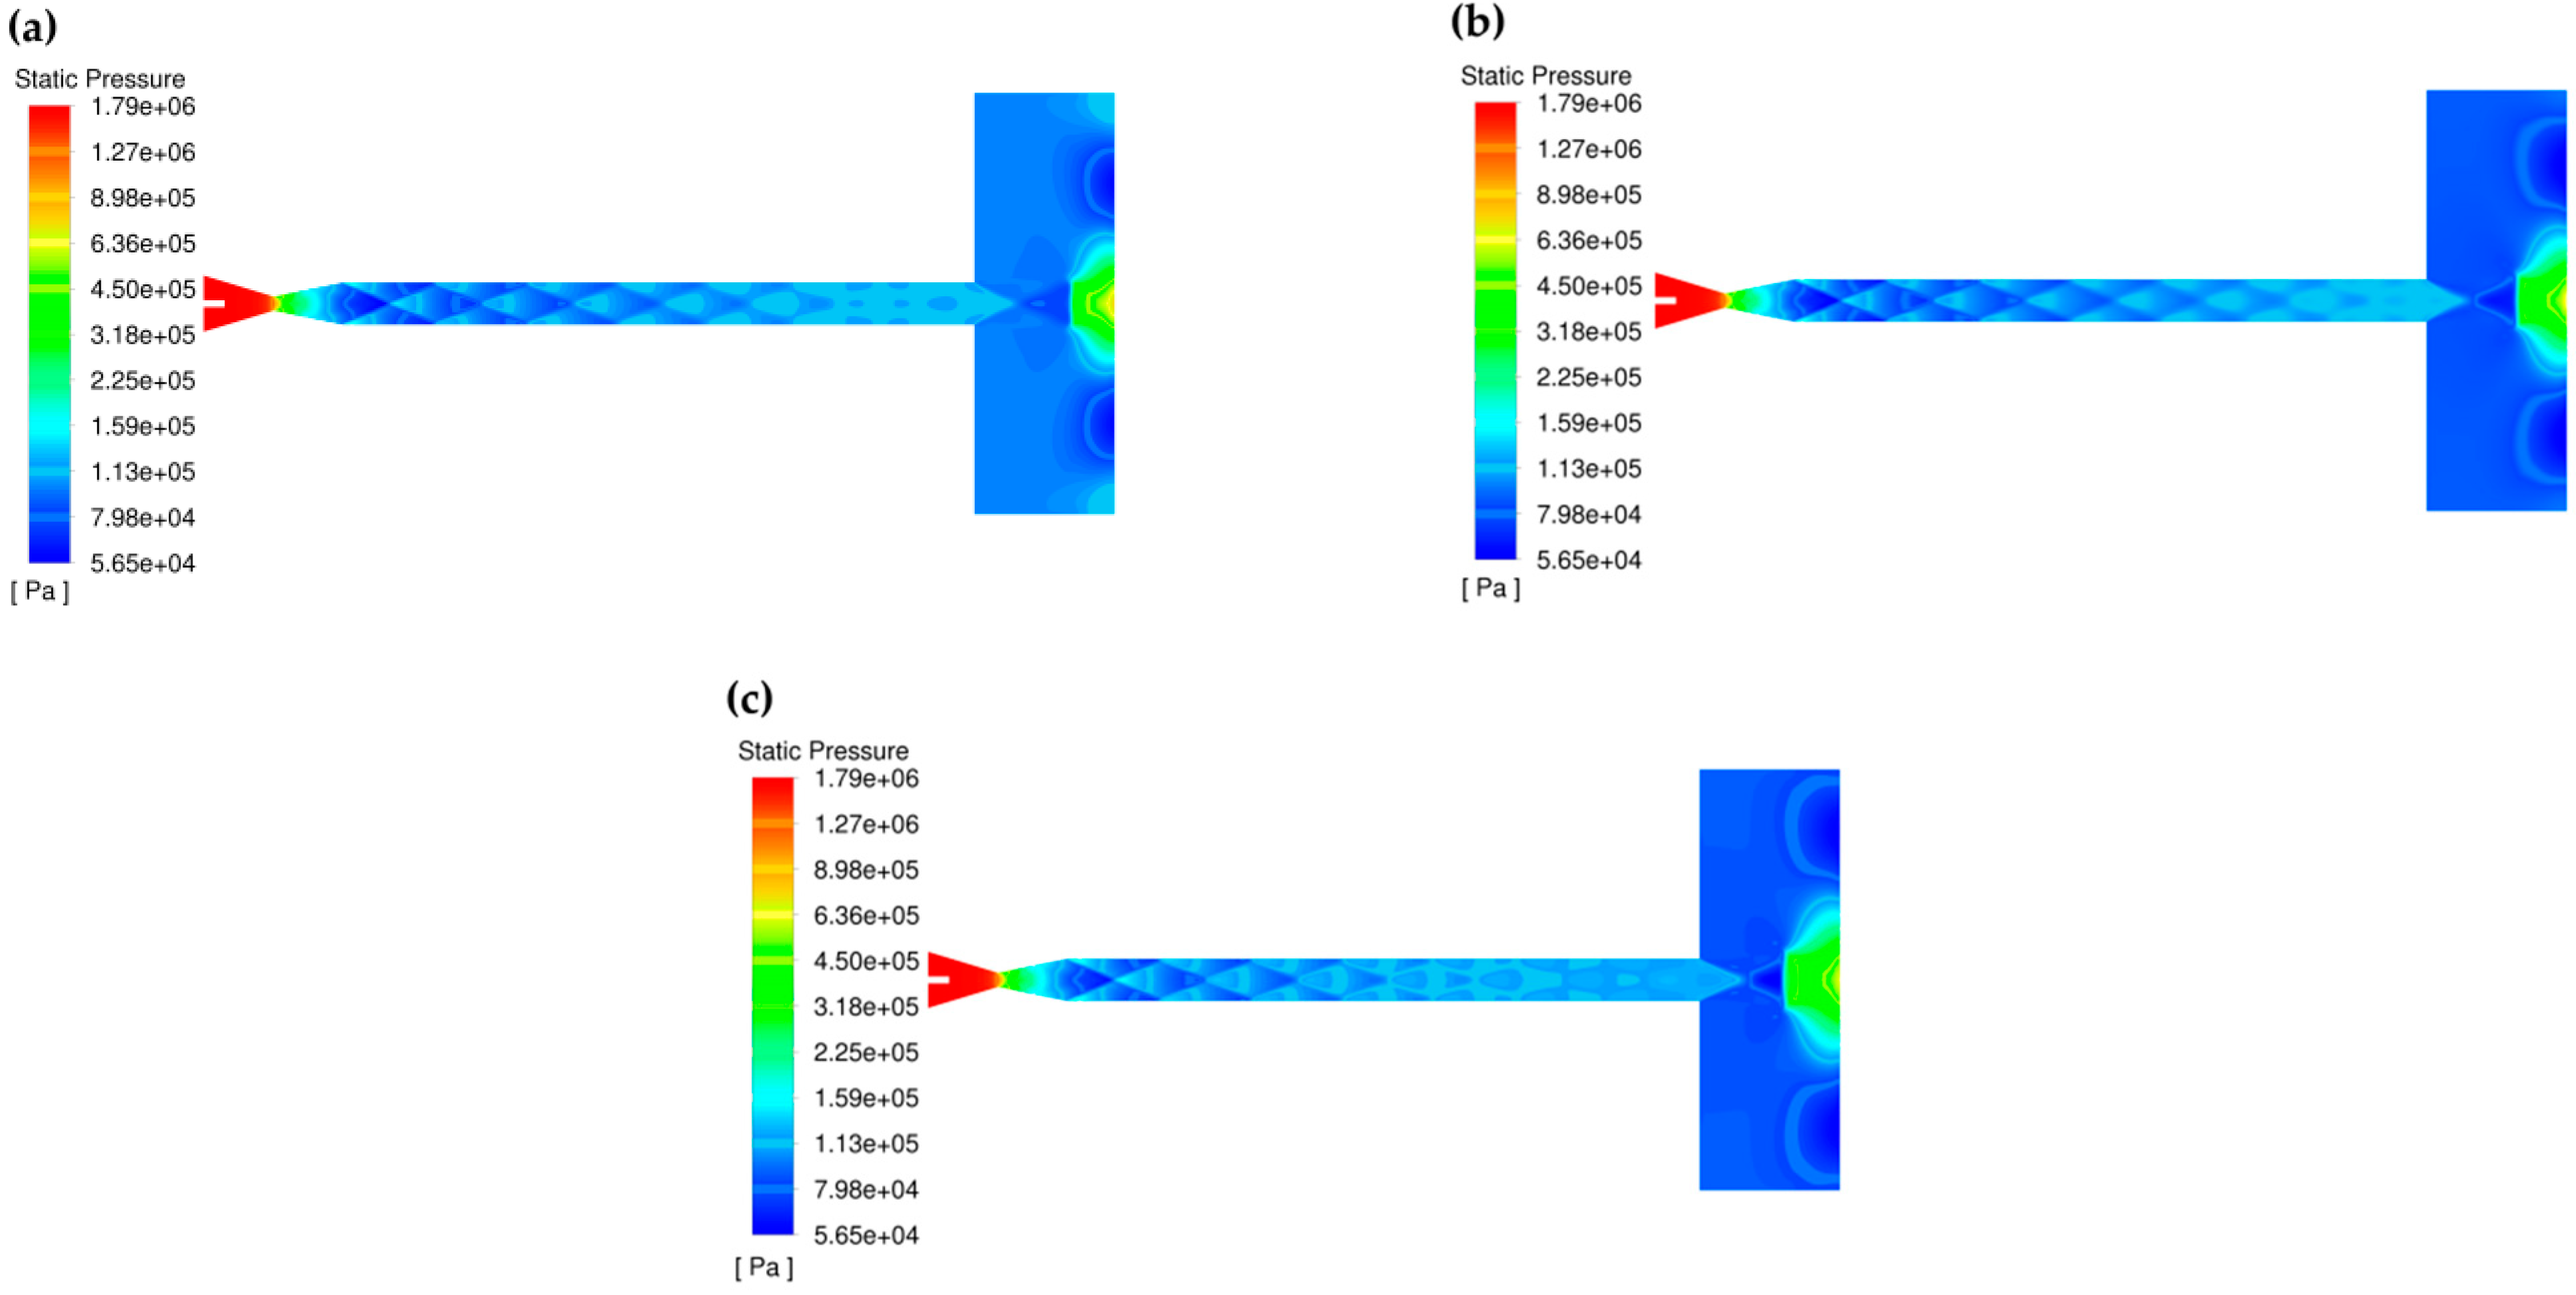
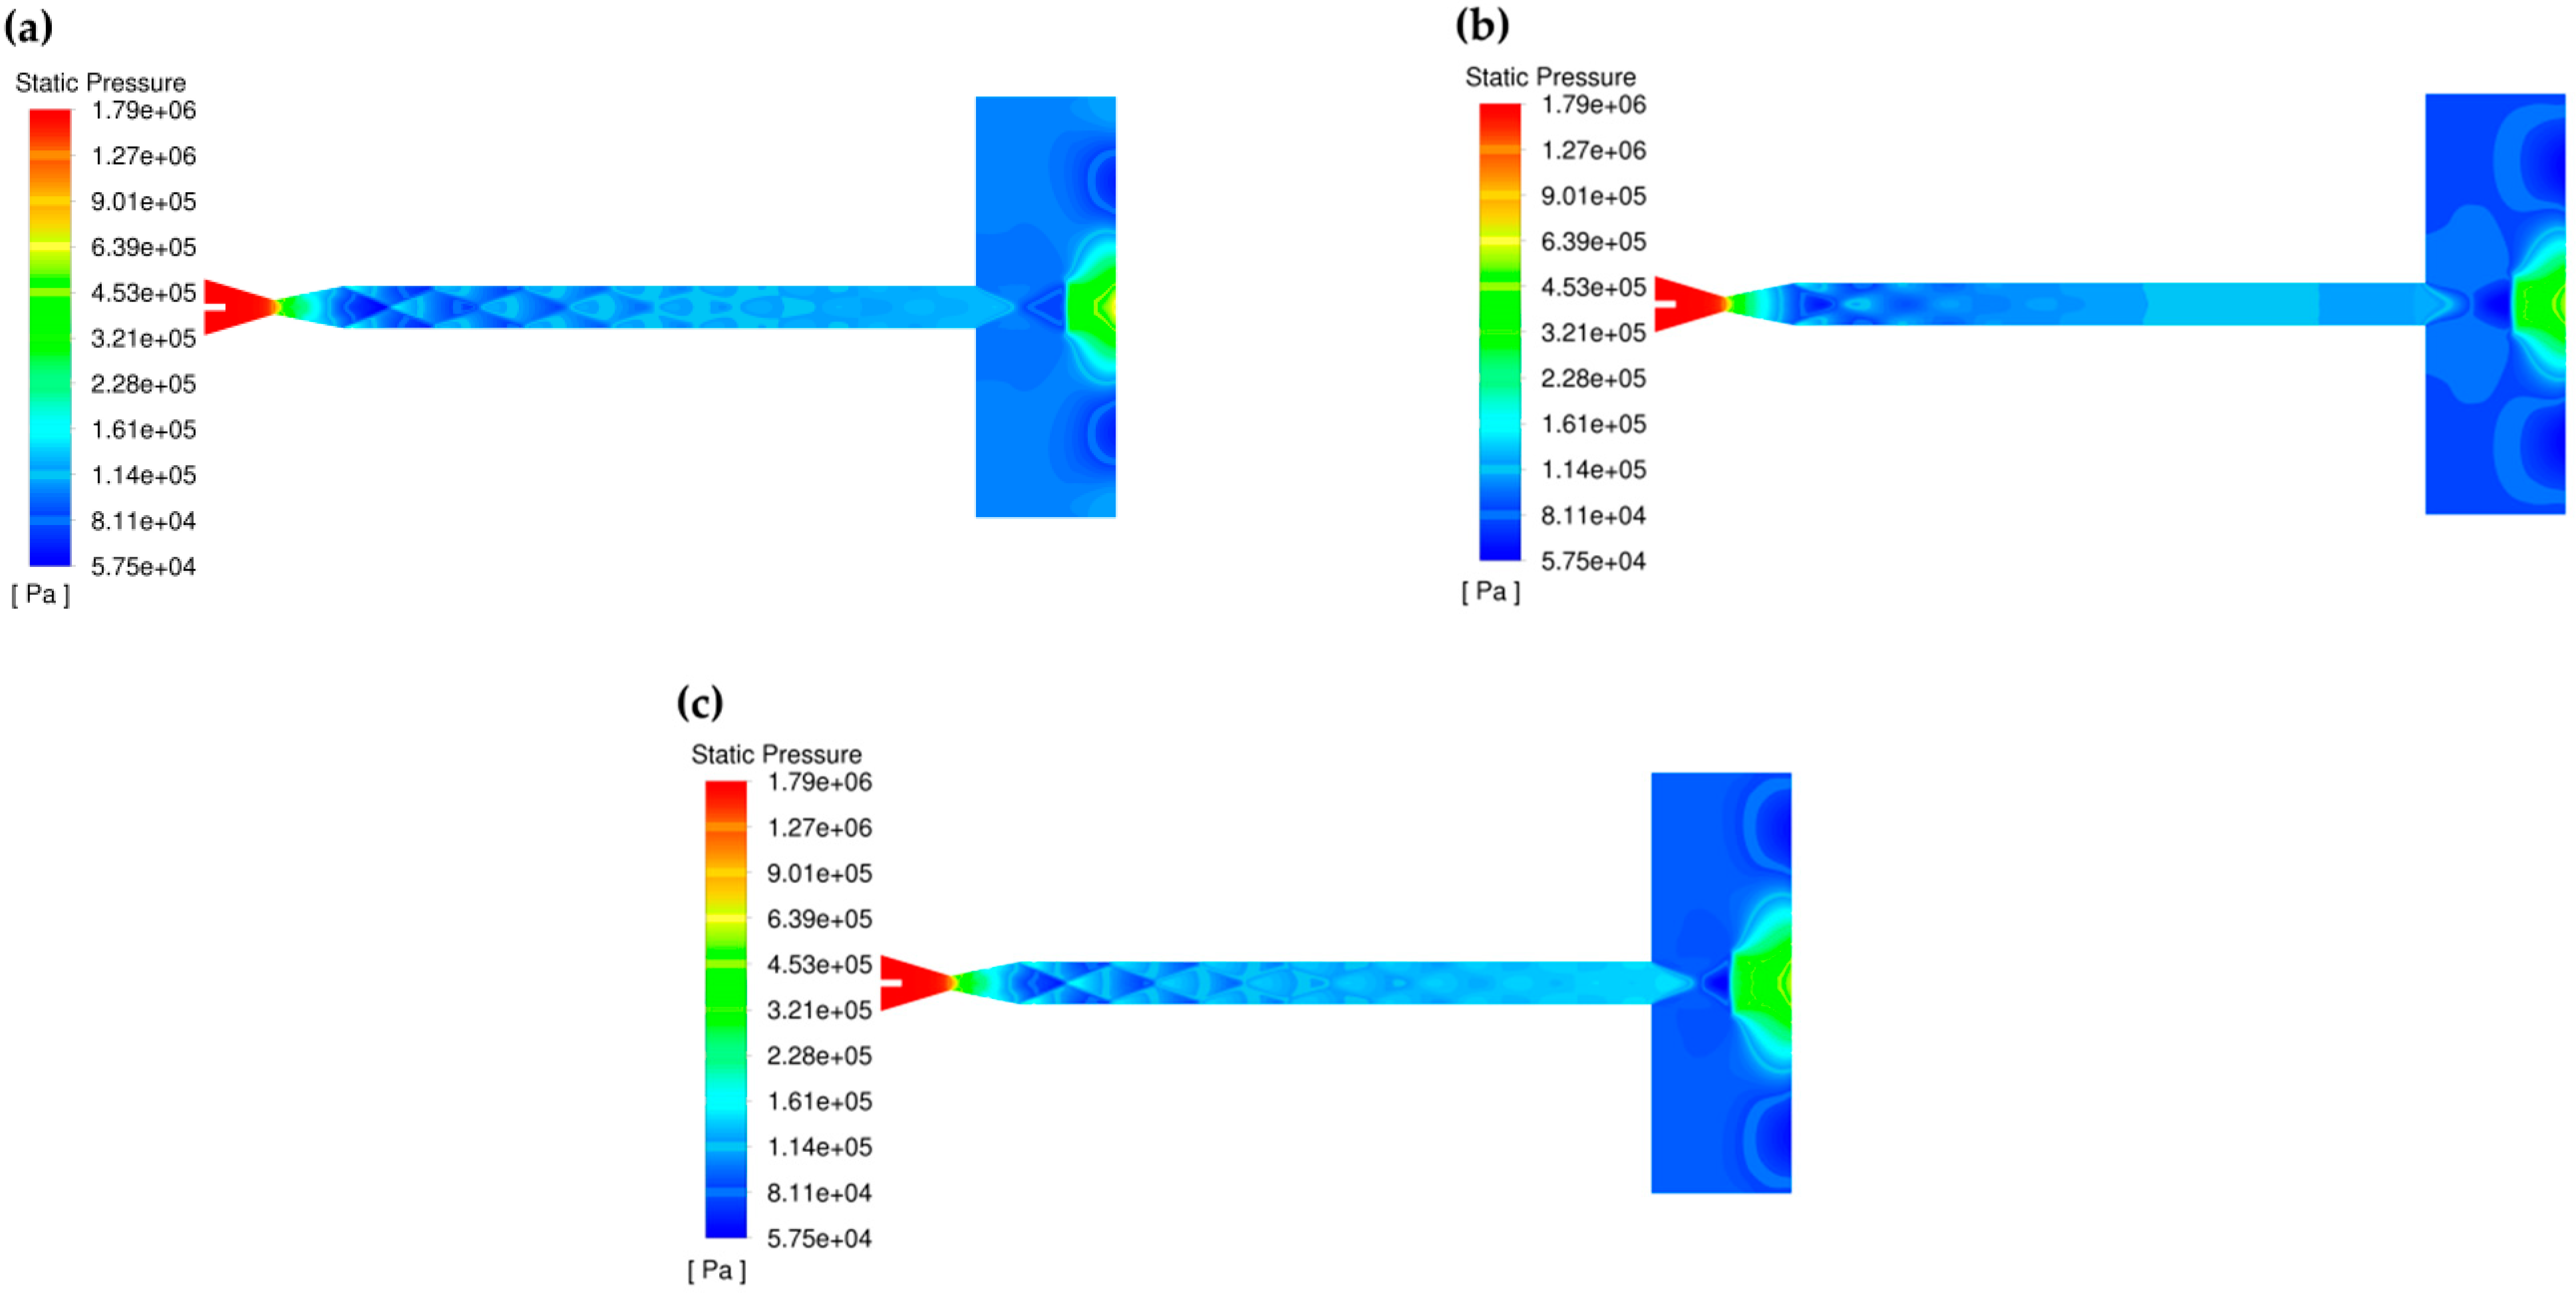
3.1. Static Pressure Analysis of Flow Field

Figure 7 and Figure 8 show static pressure distribution cloud diagrams of the flow field for 573 K and 973 K under different gas pressure conditions, respectively. Figure 9 shows the static pressure curve of the flow field for 573 K and 973 K at gas pressure ranging from 1.8 MPa to 2.2 MPa. It can be found that static pressure in the flow field decreased significantly from the Laval nozzle inlet to the throat and continued to decrease at the Laval nozzle outlet. At the same time, static pressure fluctuated in the straight pipe section of the spray gun (as shown in Figure 7 and Figure 8). This phenomenon can also be found simultaneously in the static pressure curve of the flow field (as shown in Figure 9). It also can be found that the fluctuation phenomenon was obvious at the axial distance of the spray gun from 20 mm to 80 mm and relatively stable at the axial distance from 80 mm to 110 mm. This illustrates that disturbance waves formed in the spray gun affected the gas flow during CS. Meanwhile, the influence of disturbance waves in the straight pipe of the spray gun is relatively stronger with the increase in inlet gas temperature and gas pressure. However, the pressure dropped at the straight pipe exit, and the maximum drop occurred at an axial distance of 120 mm. The main reason was that an expansion wave generated at the straight pipe exit led to a decrease in static pressure, even lower than the atmospheric pressure. Subsequently, the pressure gradually increased, and the pressure suddenly increased as the generation of a shock wave at the front of the substrate. It can be further found that the effects of different gas temperatures and gas pressure on the static pressure of the flow field are relatively close (as shown in Figure 9).

3.2. Static Temperature Analysis of Flow Field

Figure 10 and Figure 11 show the static temperature distribution cloud diagrams of the flow field for 573 K and 973 K under different gas pressure conditions, respectively. Figure 12 shows the static temperature curve of the flow field for 573 K and 973 K at gas pressure ranging from 1.8 Mpa to 2.2 Mpa. It can be found that the temperature in the flow field decreased significantly from the Laval nozzle inlet to the throat. Moreover, the temperature at the axial domain of the spray gun decreased more than that at the inner wall from the throat to the straight pipe exit (as shown in Figure 10 and Figure 11). The main reason was that, due to the lower thermal conductivity of the gas compared to the nozzle material, the temperature of the nozzle wall increased faster, caused by thermal conduction after the gas flow entered the straight pipe, it ultimately led to the temperature of the nozzle wall being higher than that of the gas. It also can be found that the fluctuation phenomenon is obvious at the axial distance of the spray gun from 20 to 80 mm and relatively stable at the axial distance from 80 to 110 mm. The temperature dropped at the straight pipe exit, and the maximum drop also occurred at an axial distance of 120 mm. Subsequently, the temperature gradually increased, and the temperature suddenly increased at the front of the substrate (as shown in Figure 12). This phenomenon is consistent with the static pressure analysis results of the flow field. Comparing the static temperature of the flow field under the same inlet temperature and differential pressure, it can be further found that the effects of gas pressure on the static temperature were tiny; however, the temperature at the front of the substrate increased as the gas pressure increased. It would be beneficial to increasing the particle temperature, thereby facilitating the deposition of particles on the substrate. Comparing the static temperature of the flow field under the same pressure and different inlet temperature, the static temperature in the entire spray gun cavity increased as the inlet temperature increased. Moreover, the temperature elevated greater at the front of the substrate as importing higher inlet temperature. It is also conducive to heating the particles for easily depositing on the substrate.

3.3. Axial Velocity of Gas Flow

Figure 13 and Figure 14 show the axial velocity distribution cloud diagram of the flow field for 573 K and 973 K under different gas pressure conditions, respectively. Figure 15 shows the axial velocity curve of the flow field for 573 K and 973 K at gas pressure ranging from 1.8 Mpa to 2.2 Mpa. It can be found that there is little effect of gas pressure on the axial velocity of gas flow in the spray gun cavity. Meanwhile, it can be further found that the axial velocity of gas flow is not affected by temperature and pressure from the Laval nozzle inlet to the throat. The axial velocity of gas flow at the throat is subsonic, with a value in the range of 288 m/s to 290 m/s. The axial velocity of gas flow rapidly increased to supersonic after passing through the throat. Moreover, the axial velocity of gas flow increased with the increase in Laval nozzle cross-section and gas temperature. The axial velocities of gas flow at the Laval nozzle outlet were 620 m/s and 633 m/s at a gas temperature of 573 K and 973 K and different gas pressure conditions (from 1.8 to 2.2 Mpa), respectively (as shown in Figure 15). Due to disturbance waves generated in the straight pipe, the fluctuation of the gas flow axial velocity was relatively obvious at the axial distance of from 20 to 80 mm from the straight pipe of the spray gun. Nevertheless, the gas flow fluctuation was small at the axial distance of 80–110 mm, and the axial velocity of gas flow increased relatively smoothly. Meanwhile, due to the static temperature of the nozzle wall being higher than that of the center of gas, the axial velocity of gas flow in the center is lower than in the jet periphery (as shown in Figure 13 and Figure 14). The axial velocities of gas flow at the straight pipe exit were 715 m/s and 841 m/s at a gas temperature of 573 K and 973 K and different gas pressure conditions (from 1.8 to 2.2 Mpa), respectively. Due to the inertia and the differences between internal and external flow field pressure, the acceleration of gas flow occurred owing to the expansion of gas flow after entering the jet zone, leading to attaining the maximum velocity (at an axial distance of 120 mm). At this time, the acceleration of the axial velocity is conducive to cold spray deposition. Meanwhile, the gas pressure had a certain effect on the axial velocity at this stage, and the axial velocity is higher with the increase in inlet gas temperature. At a gas temperature of 573 K, the maximum axial velocities of gas flow at gas pressure of 1.8 Mpa, 2.0 Mpa, and 2.2 Mpa are 744 m/s, 763 m/s, and 778 m/s, respectively. At a gas temperature of 973 K, the maximum axial velocities of gas flow at a gas pressure of 1.8 Mpa, 2.0 Mpa, and 2.2 Mpa are 901 m/s, 925 m/s, and 942 m/s, respectively.

3.4. Axial Velocity of HA/Ti Composite Particles

Based on the analysis of the continuous phase flow field, the axial velocity distribution of HA/30 wt.% Ti discrete phase with different particle sizes in the flow field was further analyzed. Figure 16 shows the axial velocity curve of HA/30 wt.% Ti with different particle sizes for 573 K and 973 K at gas pressure ranging from 1.8 Mpa to 2.2 Mpa. It can be found that the axial velocity of HA/30 wt.% Ti composite particles was accelerated driving by high-speed gas, and the axial velocity of HA/30 wt.% Ti particles increased with the increase in gas temperature under the same gas pressure condition. The axial velocity of composite particles increased significantly from the Laval nozzle inlet to the Laval nozzle outlet; however, the axial velocity of composite particles increased relatively slowly at the straight pipe section. Finally, the axial velocity of particles reached the maximum value at an axial distance of 120 mm. This is because the expansion of gas flow occurred into the jet domain led to accelerating the axial velocity of HA/Ti composite particles. Meanwhile, the axial velocity of composite particles also increased with the increase in gas temperature under the same gas pressure condition. The detailed maximum axial velocities of HA/30 wt.% Ti particles with different particle sizes are listed in Table 3. It can be revealed that the axial velocity of composite particles decreased with the increase in the particle size under the same gas pressure and gas temperature. Moreover, due to the lower inertia of smaller-size particles, the axial velocity of smaller-size composite particles accelerated faster than that of larger-size particles in the entire spray gun.

3.5. Experimental Investigation of the Deposition of Single HA/30 wt.% Ti Splat

Based on the analysis of axial velocity of HA/30 wt.% Ti particles in the flow field, in order to further analyze the deposition behavior of HA/30 wt.% Ti particles under different conditions, experimental research on the deformation morphologies of single HA/30 wt.% Ti particle was investigated. Figure 17 shows the surface morphologies of nanostructure HA/30 wt.% Ti composite particle deposited in different gas temperature. It can be found that a certain plastic deformation of HA/30 wt.% Ti particles generated after impacting on the substrate at different gas temperature, and the morphology of HA/30 wt.% Ti particles changed from spherical to flat shape. Meanwhile, it can be further found that there was a hump (marked in cyan dot circle) appearing in the center of the flat particle, grooves (as indicated by the red arrow) formed near the hump, a ringy band (as indicated by the purple arrow) appeared in the periphery of the groove, and the ejecta phenomenon (as indicated by the blue arrow) occurred at the edge of the flat particle. The reason for appearing the grooves is that the discontinuous and non-uniform radial spreading of particles occurred under the effect of pulsating waves after impacting on the substrate. The ejectas appearing at the edges of particles were the result of severe radial deformation of flat particles after impacting on the substrate [49]. Meanwhile, irregular cracks (as indicated by the green arrow) formed on the surface of the flat particle. Compared with the splat impacting at the gas temperature of 573 K (as shown in Figure 17a), the flattening degree of HA/30 wt.% Ti particles increased as impacting at gas temperature of 973 K, as well as more grooves and cracks generated (as shown in Figure 17b). This illustrates that the impacting velocity of HA/30 wt.% Ti particles increased owing to the kinetic energy of the particles increasing with the increase in gas temperature, it led to the deformation degree of the particles increase. This research result was consistent with the previous reports in the literature [7,19], the particles deformed more severely at higher temperature. Figure 18 shows the bonding morphologies of HA/30 wt.% Ti composite particles deposited in different gas temperature. It can be found that there are few splats adhered on the substrate at gas temperature of 573 K; however, the ratio of splats that was adhered on the substrate increased obviously as increasing the gas temperature to 973 K. The main reasons for this phenomenon are that the bonding mechanism between HA/30 wt.% Ti splat and Ti6Al4V substrate is mechanical bonding, the deformation degree of splat was small at the gas temperature of 573 K resulting in the weak bonding between the splats and Ti6Al4V substrate. Meanwhile, due to the high microhardness of Ti6Al4V substrate, more rebounding particles generated at the lower gas temperature. However, higher gas temperature is beneficial to improving the deformation of HA/30 wt.% Ti particles and promoting the bonding between the splats and Ti6Al4V substrate. Figure 19 shows the velocity distribution of HA/30 wt.% Ti particles. It can be found that the average velocity of HA/30 wt.% Ti particles at gas temperature of 573 K and 973 K was 486 m/s and 534 m/s, respectively. This also illustrates that the velocity of HA/30 wt.% Ti particles increased with the increase in gas temperature.

4. Conclusions

Numerical analysis of the influence of gas temperature and gas pressure of CS on the distributions of static pressure, static temperature, and axial velocity of gas flow was investigated. Based on the analysis of the continuous phase flow field, numerical analysis on the influence of CS parameters (e.g., gas temperature, gas pressure, particle size, etc.) on the distributions of HA/30 wt.% Ti composite particle axial velocity was also studied in this work. In order to further analyze the influence of gas temperature on the deposition behavior of the particles, an experimental analysis of the deposition of a single HA/30 wt.% Ti particle was simultaneously investigated. The main conclusions are as follows:
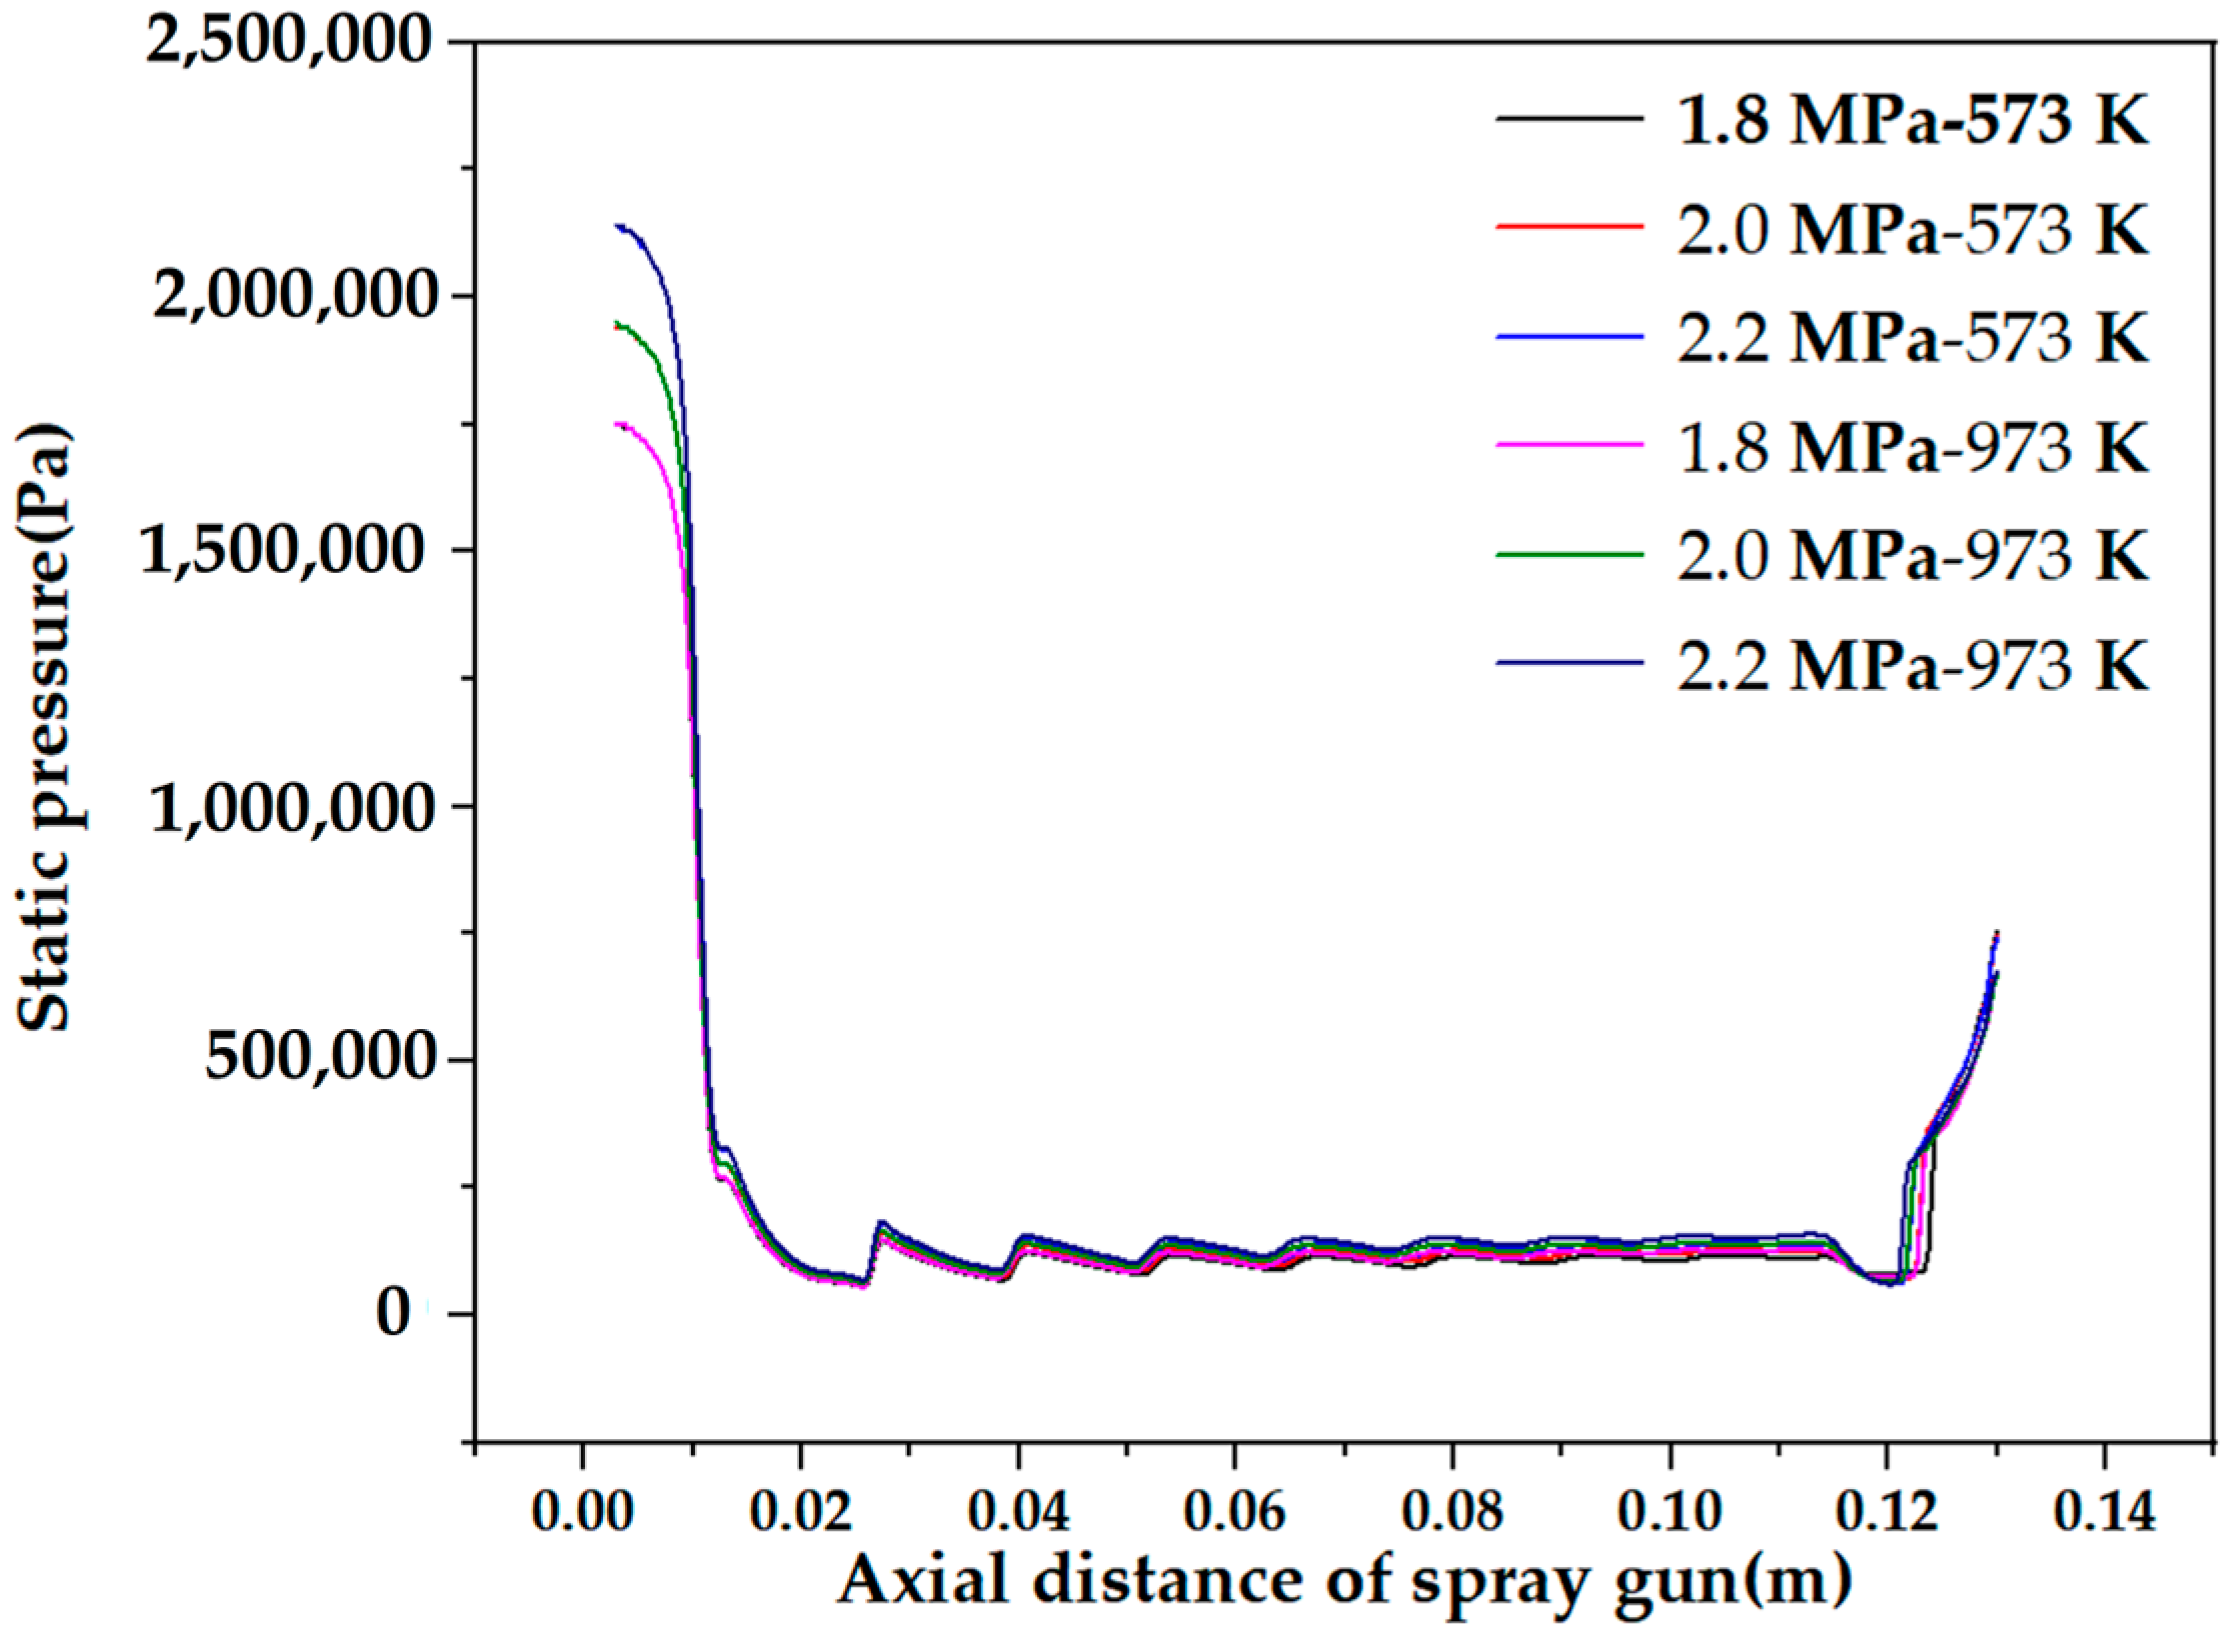
  • There was a certain variation in static pressure throughout the entire spraying area. In the spray gun, static pressure was mainly affected by disturbance waves, and there was a certain fluctuation phenomenon in the static pressure. Static pressure decreased caused by the expansion wave between the nozzle outlet to the substrate surface. Static pressure suddenly increased due to the influence of shock wave at the front of the substrate;
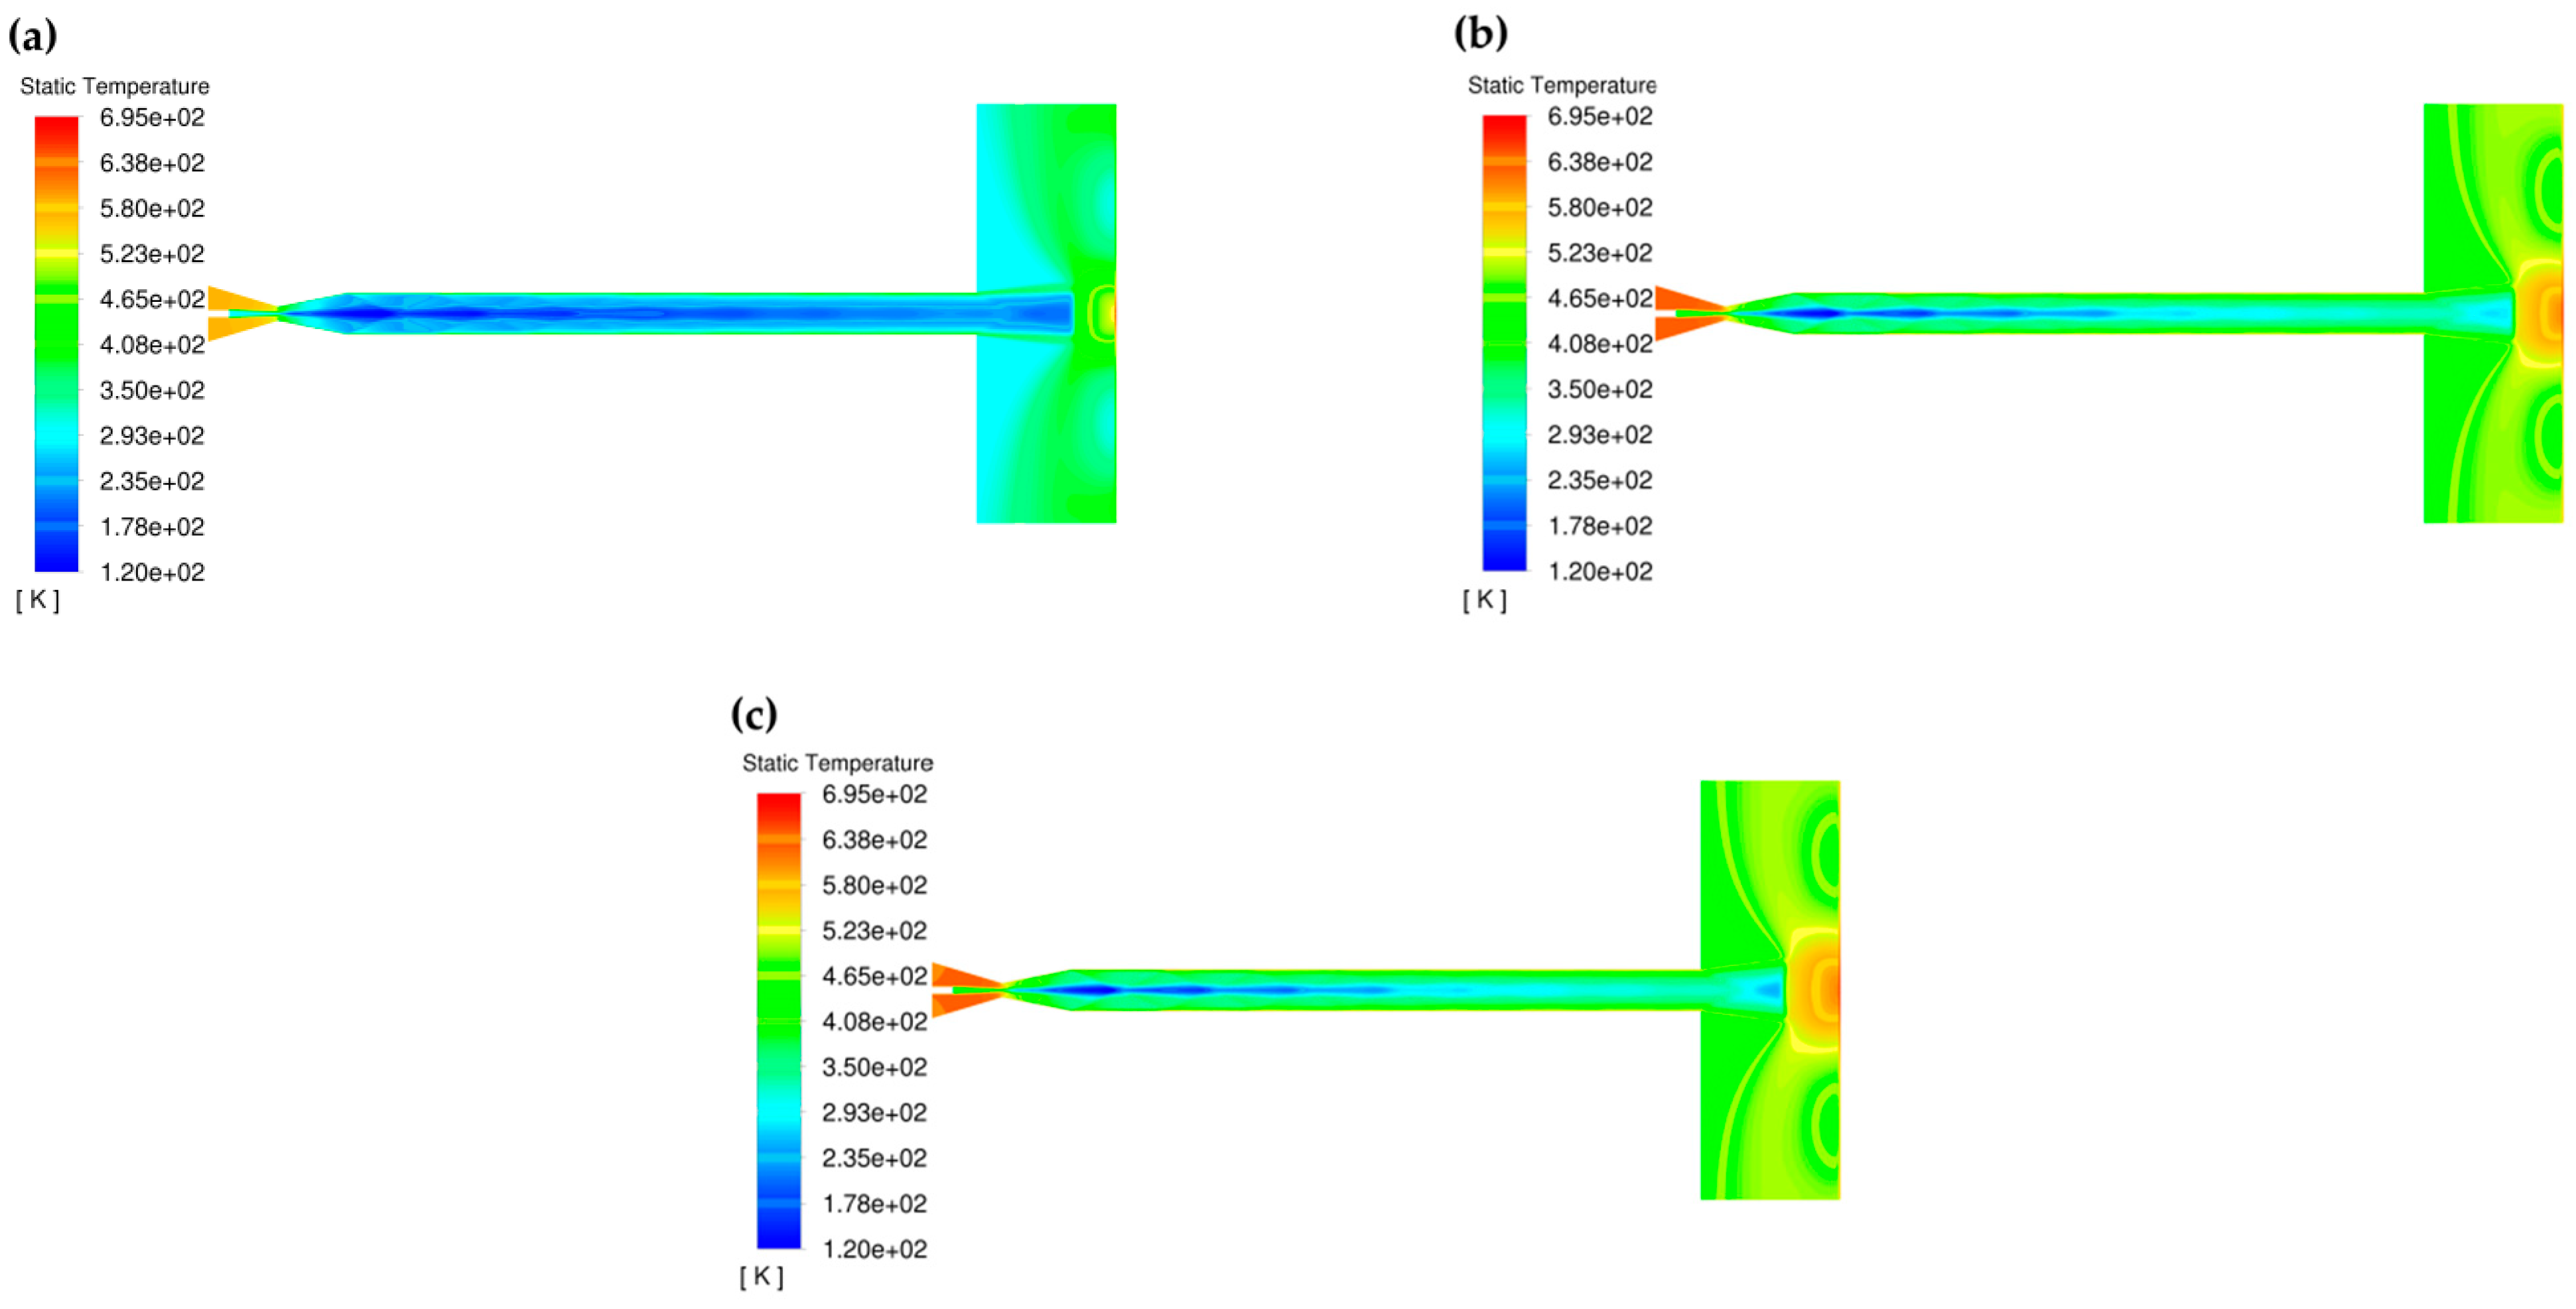
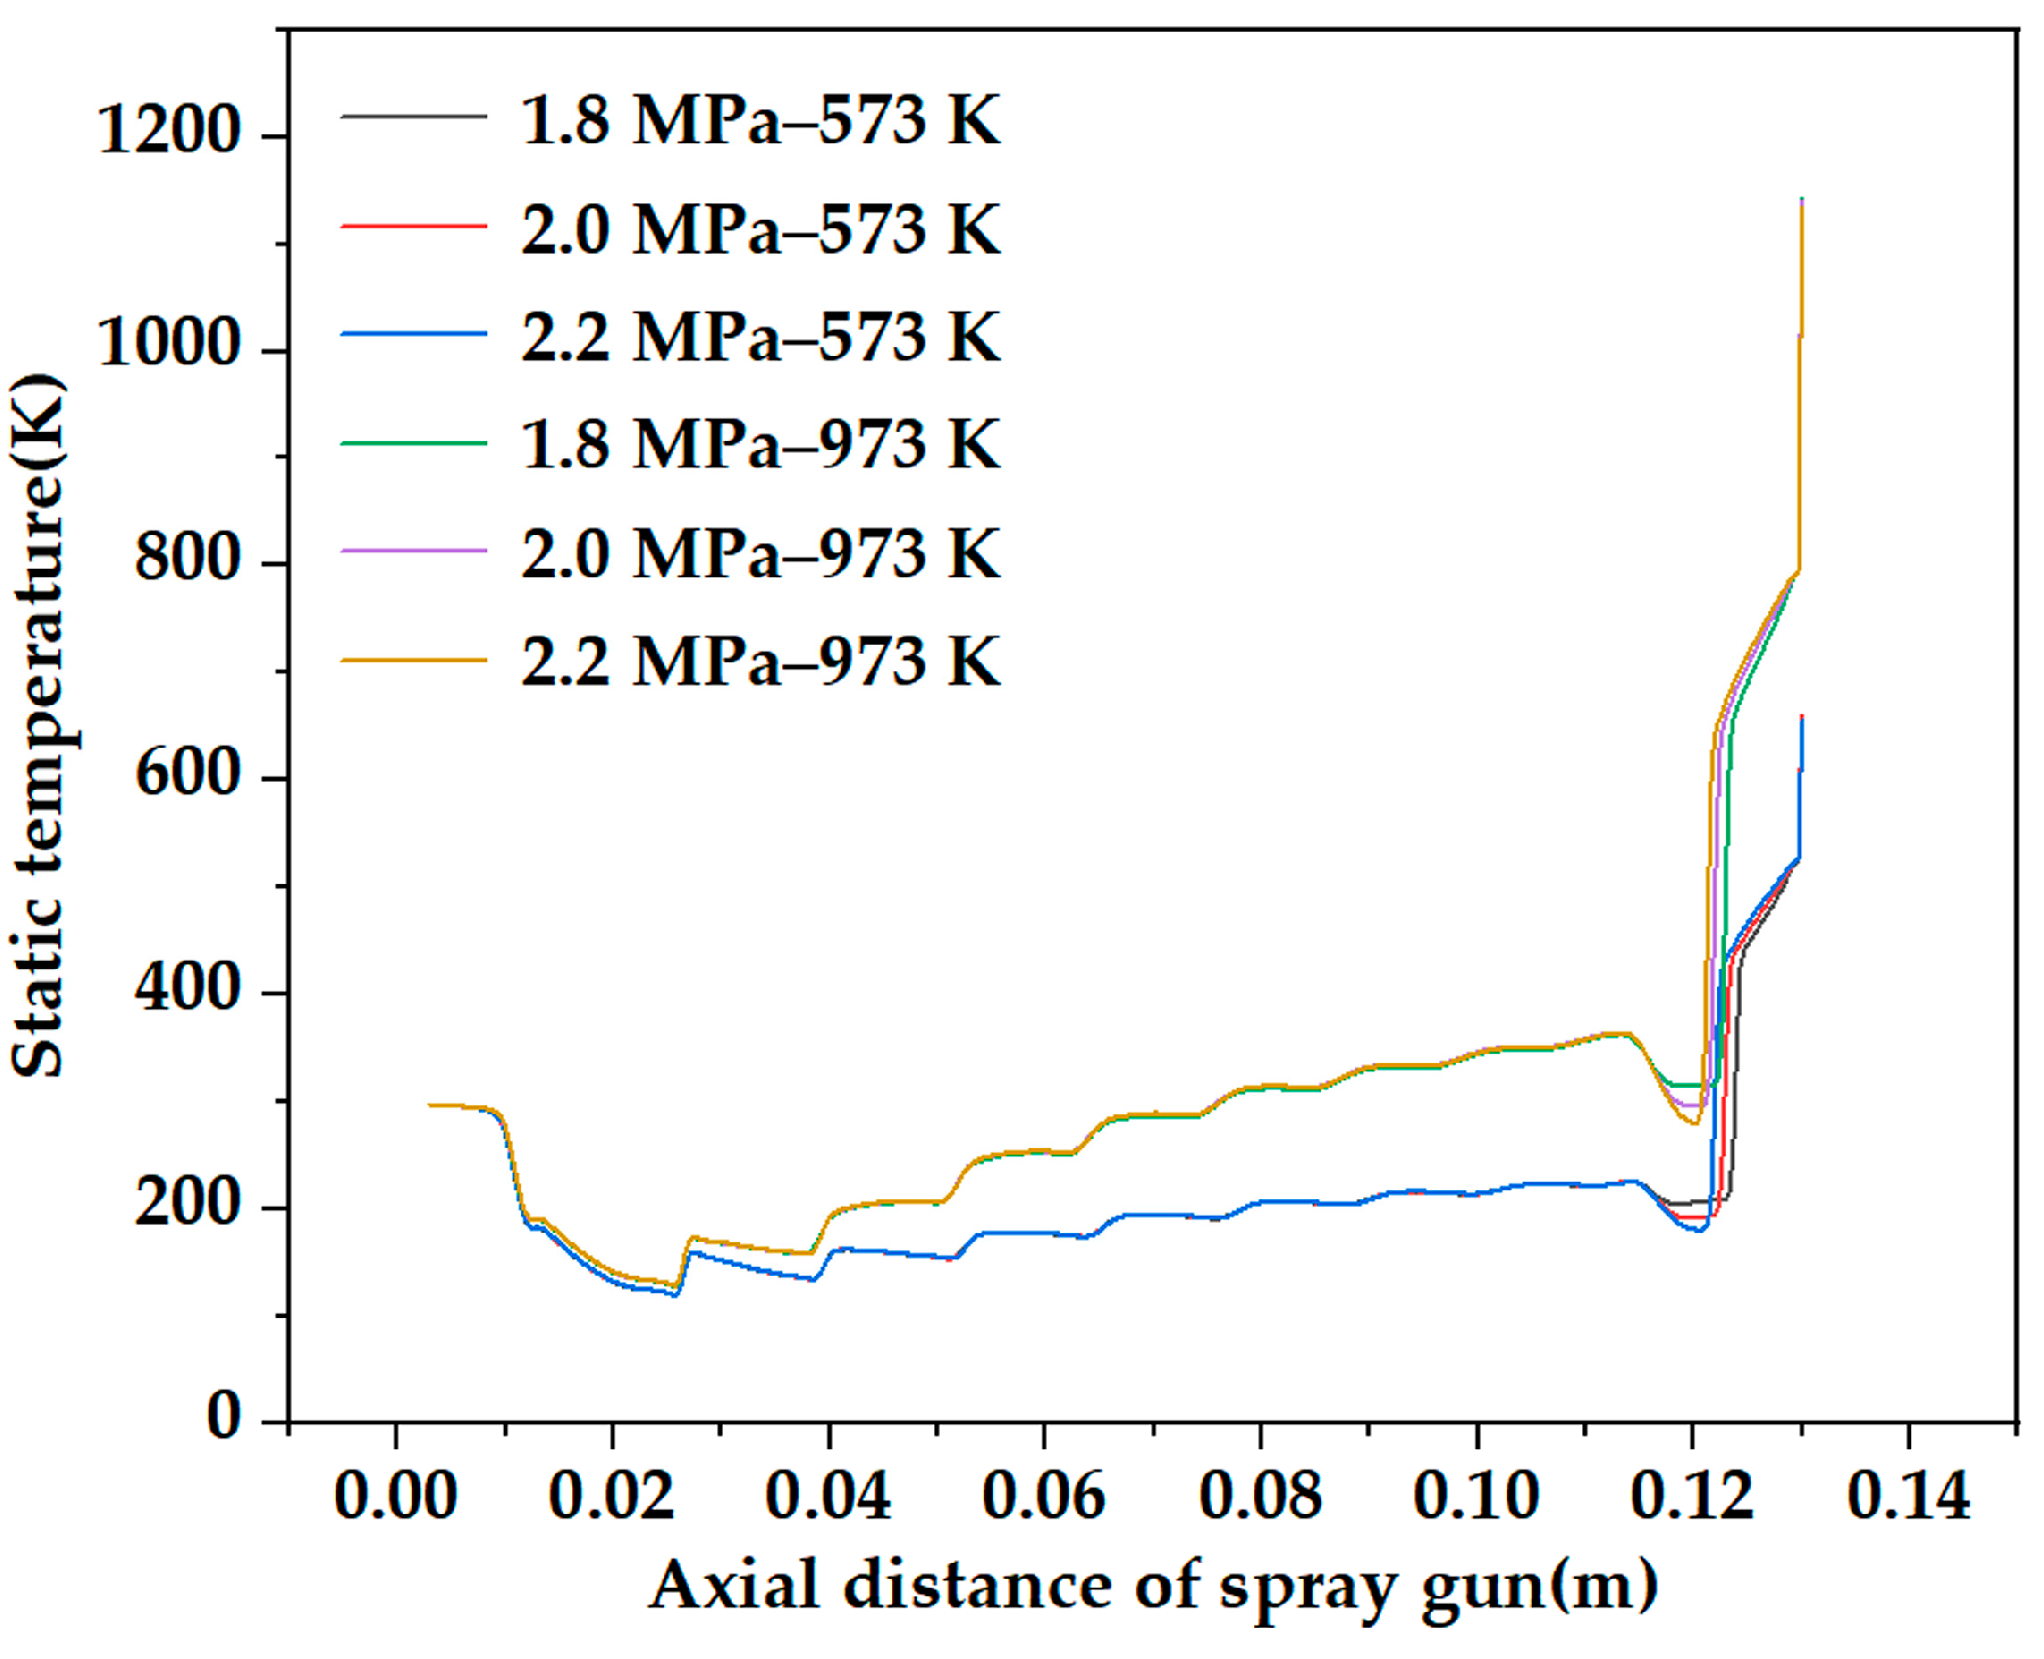
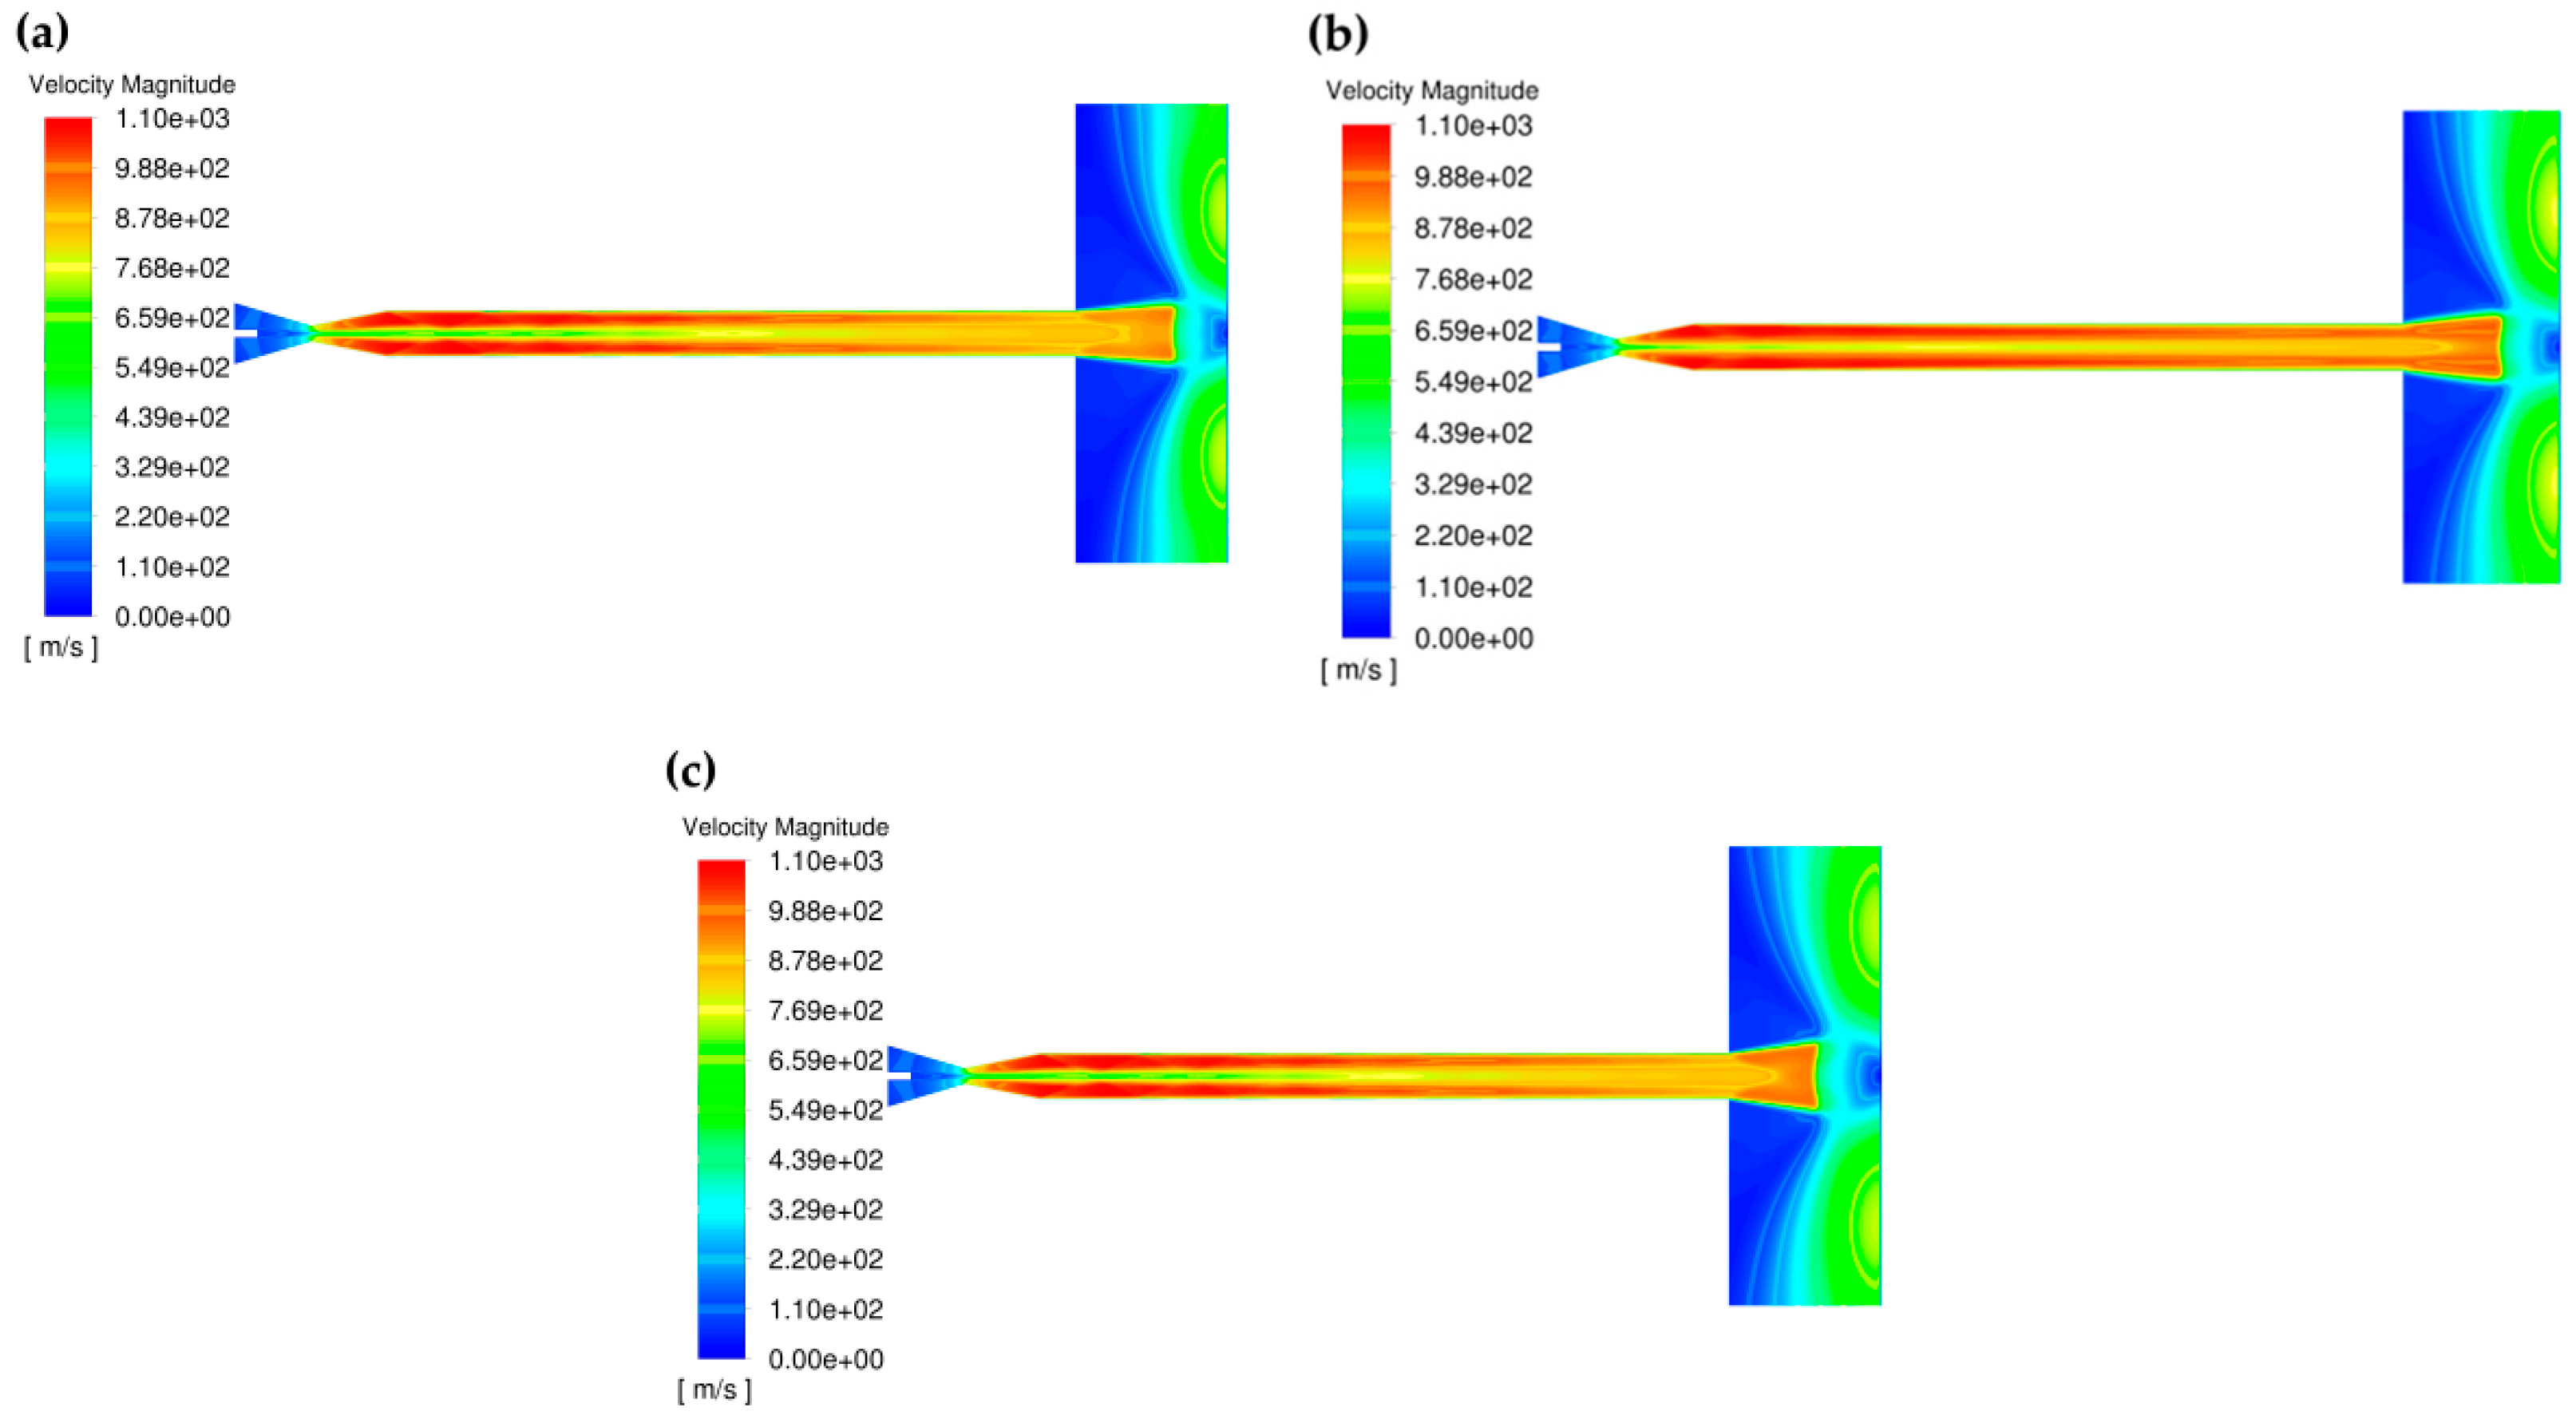
  • There was also a certain variation in static temperature throughout the entire spraying area. Due to the difference in thermal conductivity between the gas and the straight tube material of the spray gun, the static temperature of the gas flow near the nozzle wall was higher than that of the gas flow in the axial area of the spray gun. There was a certain fluctuation phenomenon in the static temperature due to the influence of disturbance waves in the spray gun. Due to the influence of the expansion wave, the static temperature decreased between the nozzle outlet and the substrate surface. Due to the influence of shock wave, static pressure also suddenly increased at the front of the substrate;
  • The effects of gas pressure on the static temperature were tiny under the same inlet temperature and different pressure conditions. The static temperature in the entire spray gun cavity increased as the inlet temperature increased under the same pressure and different inlet temperature conditions. The static temperature elevated greater at the front of the substrate as importing higher inlet temperature;
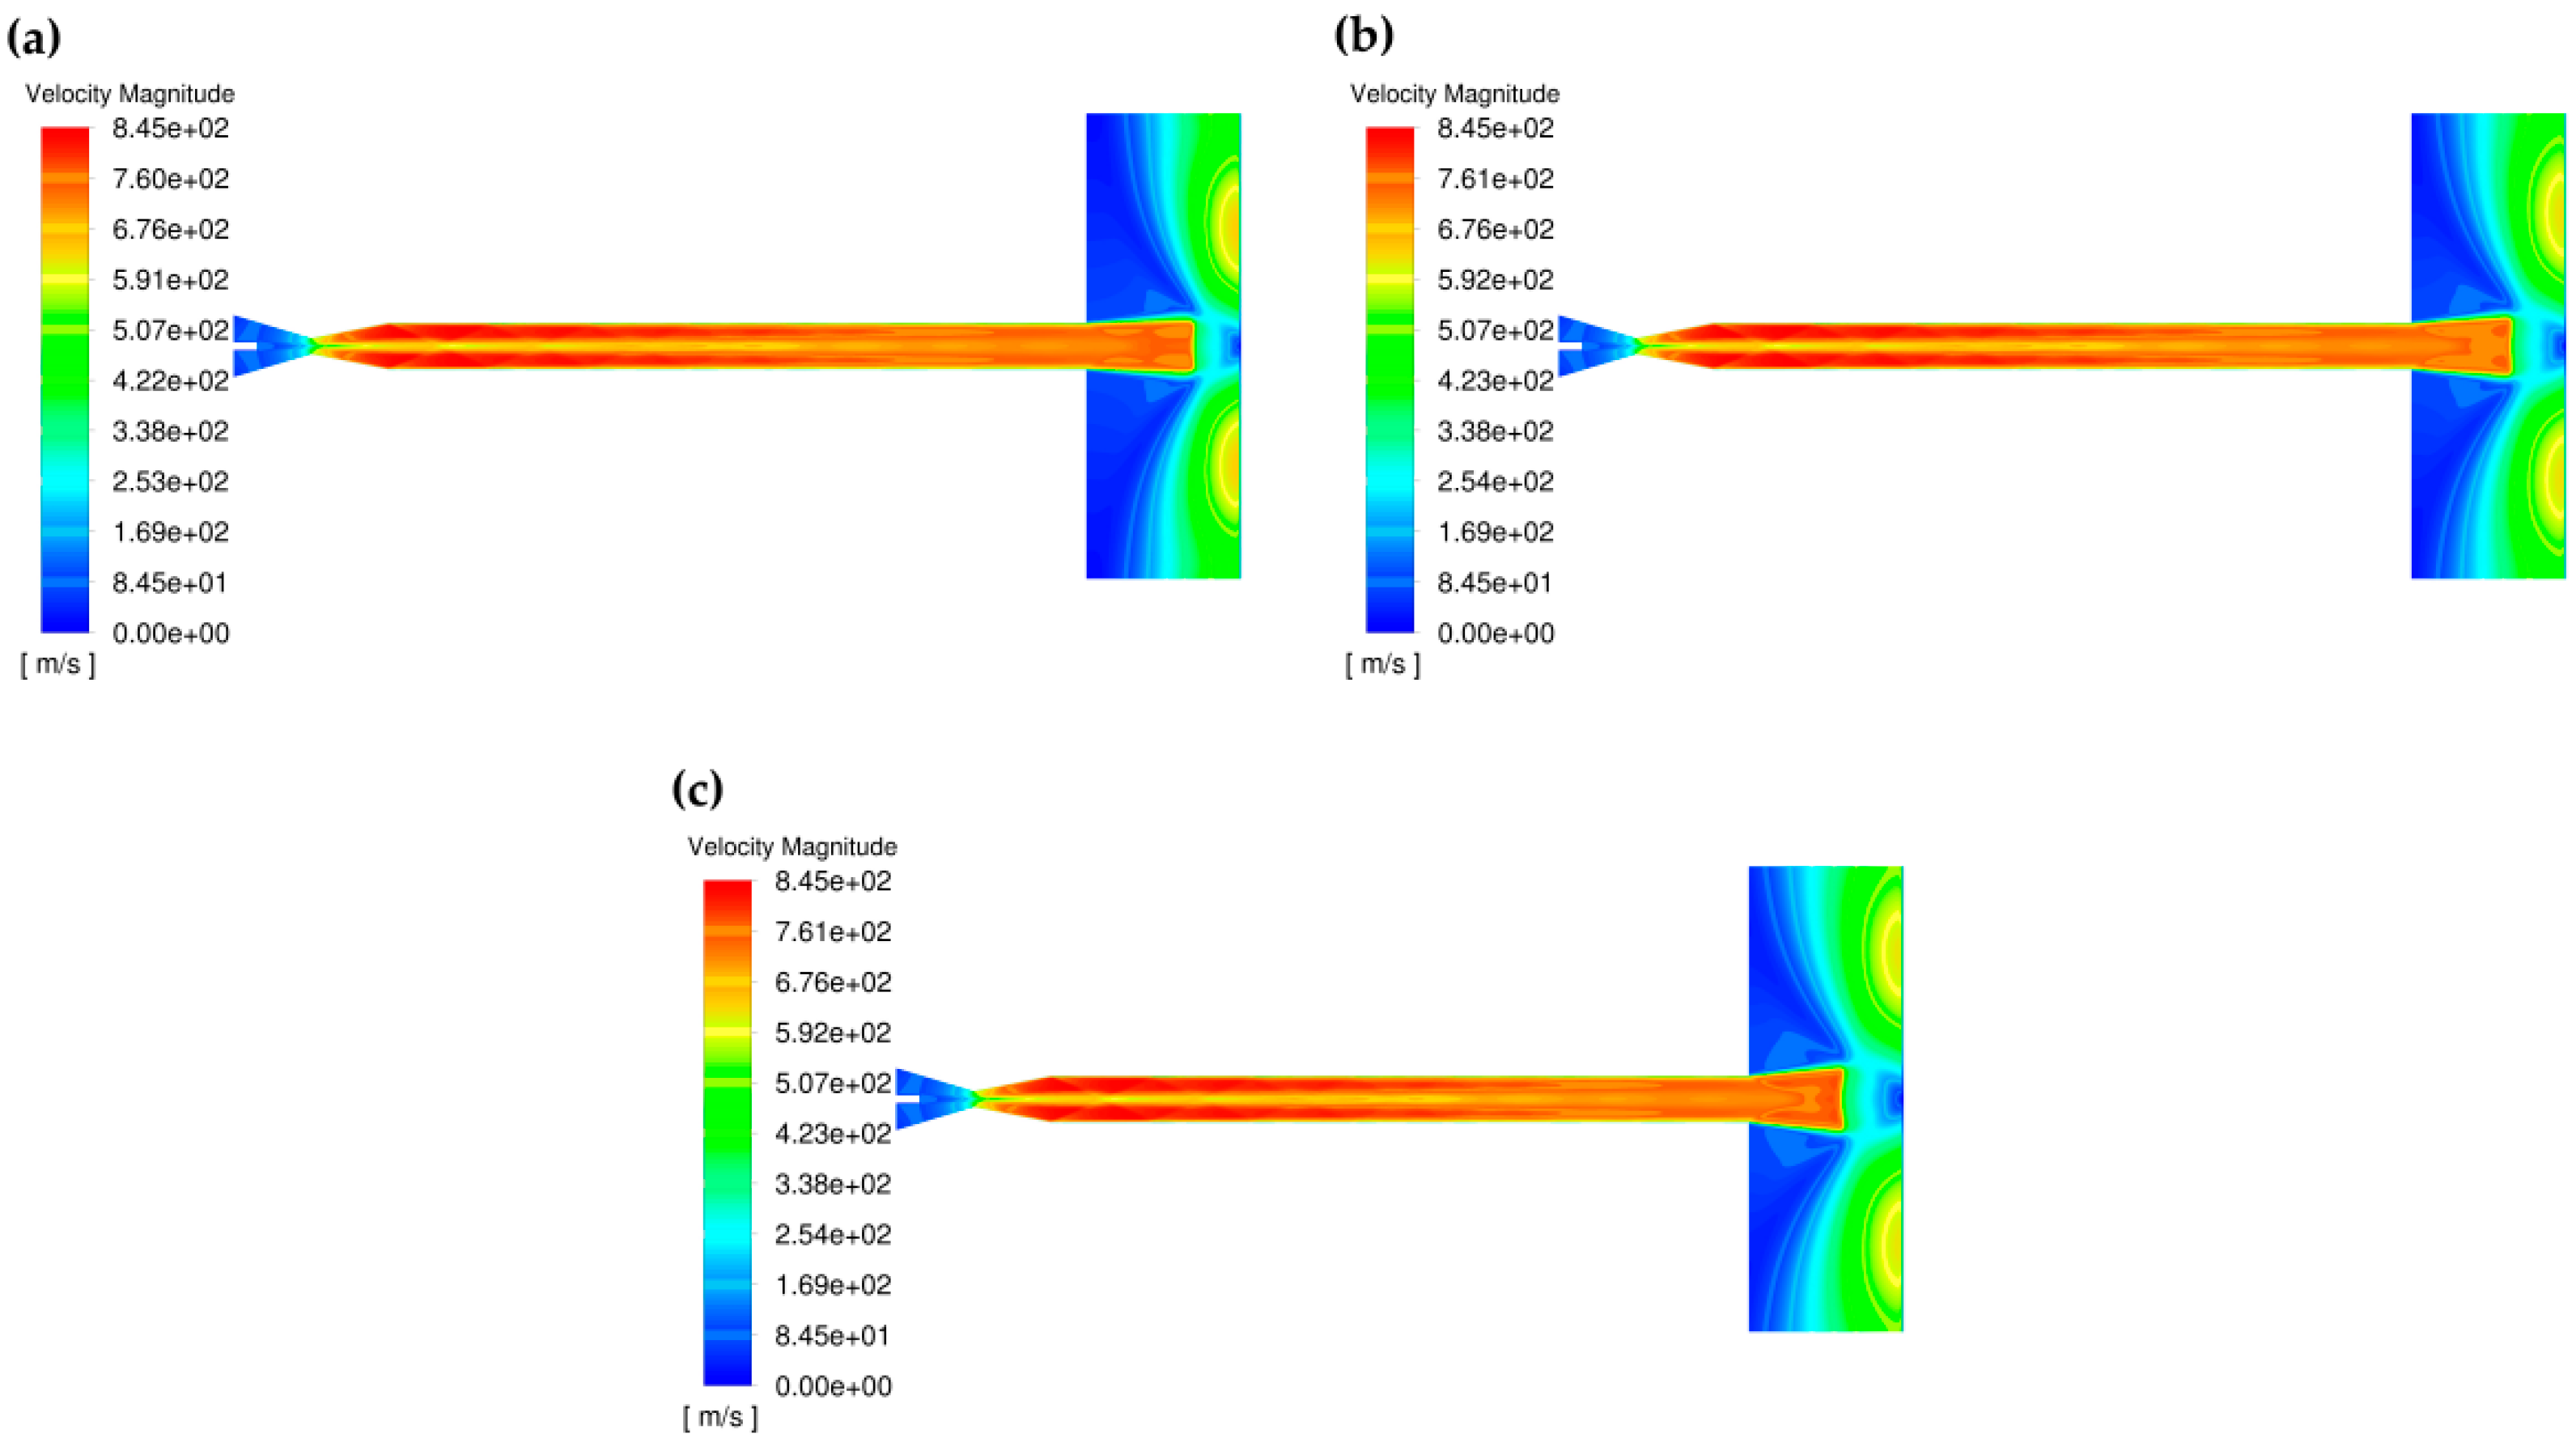
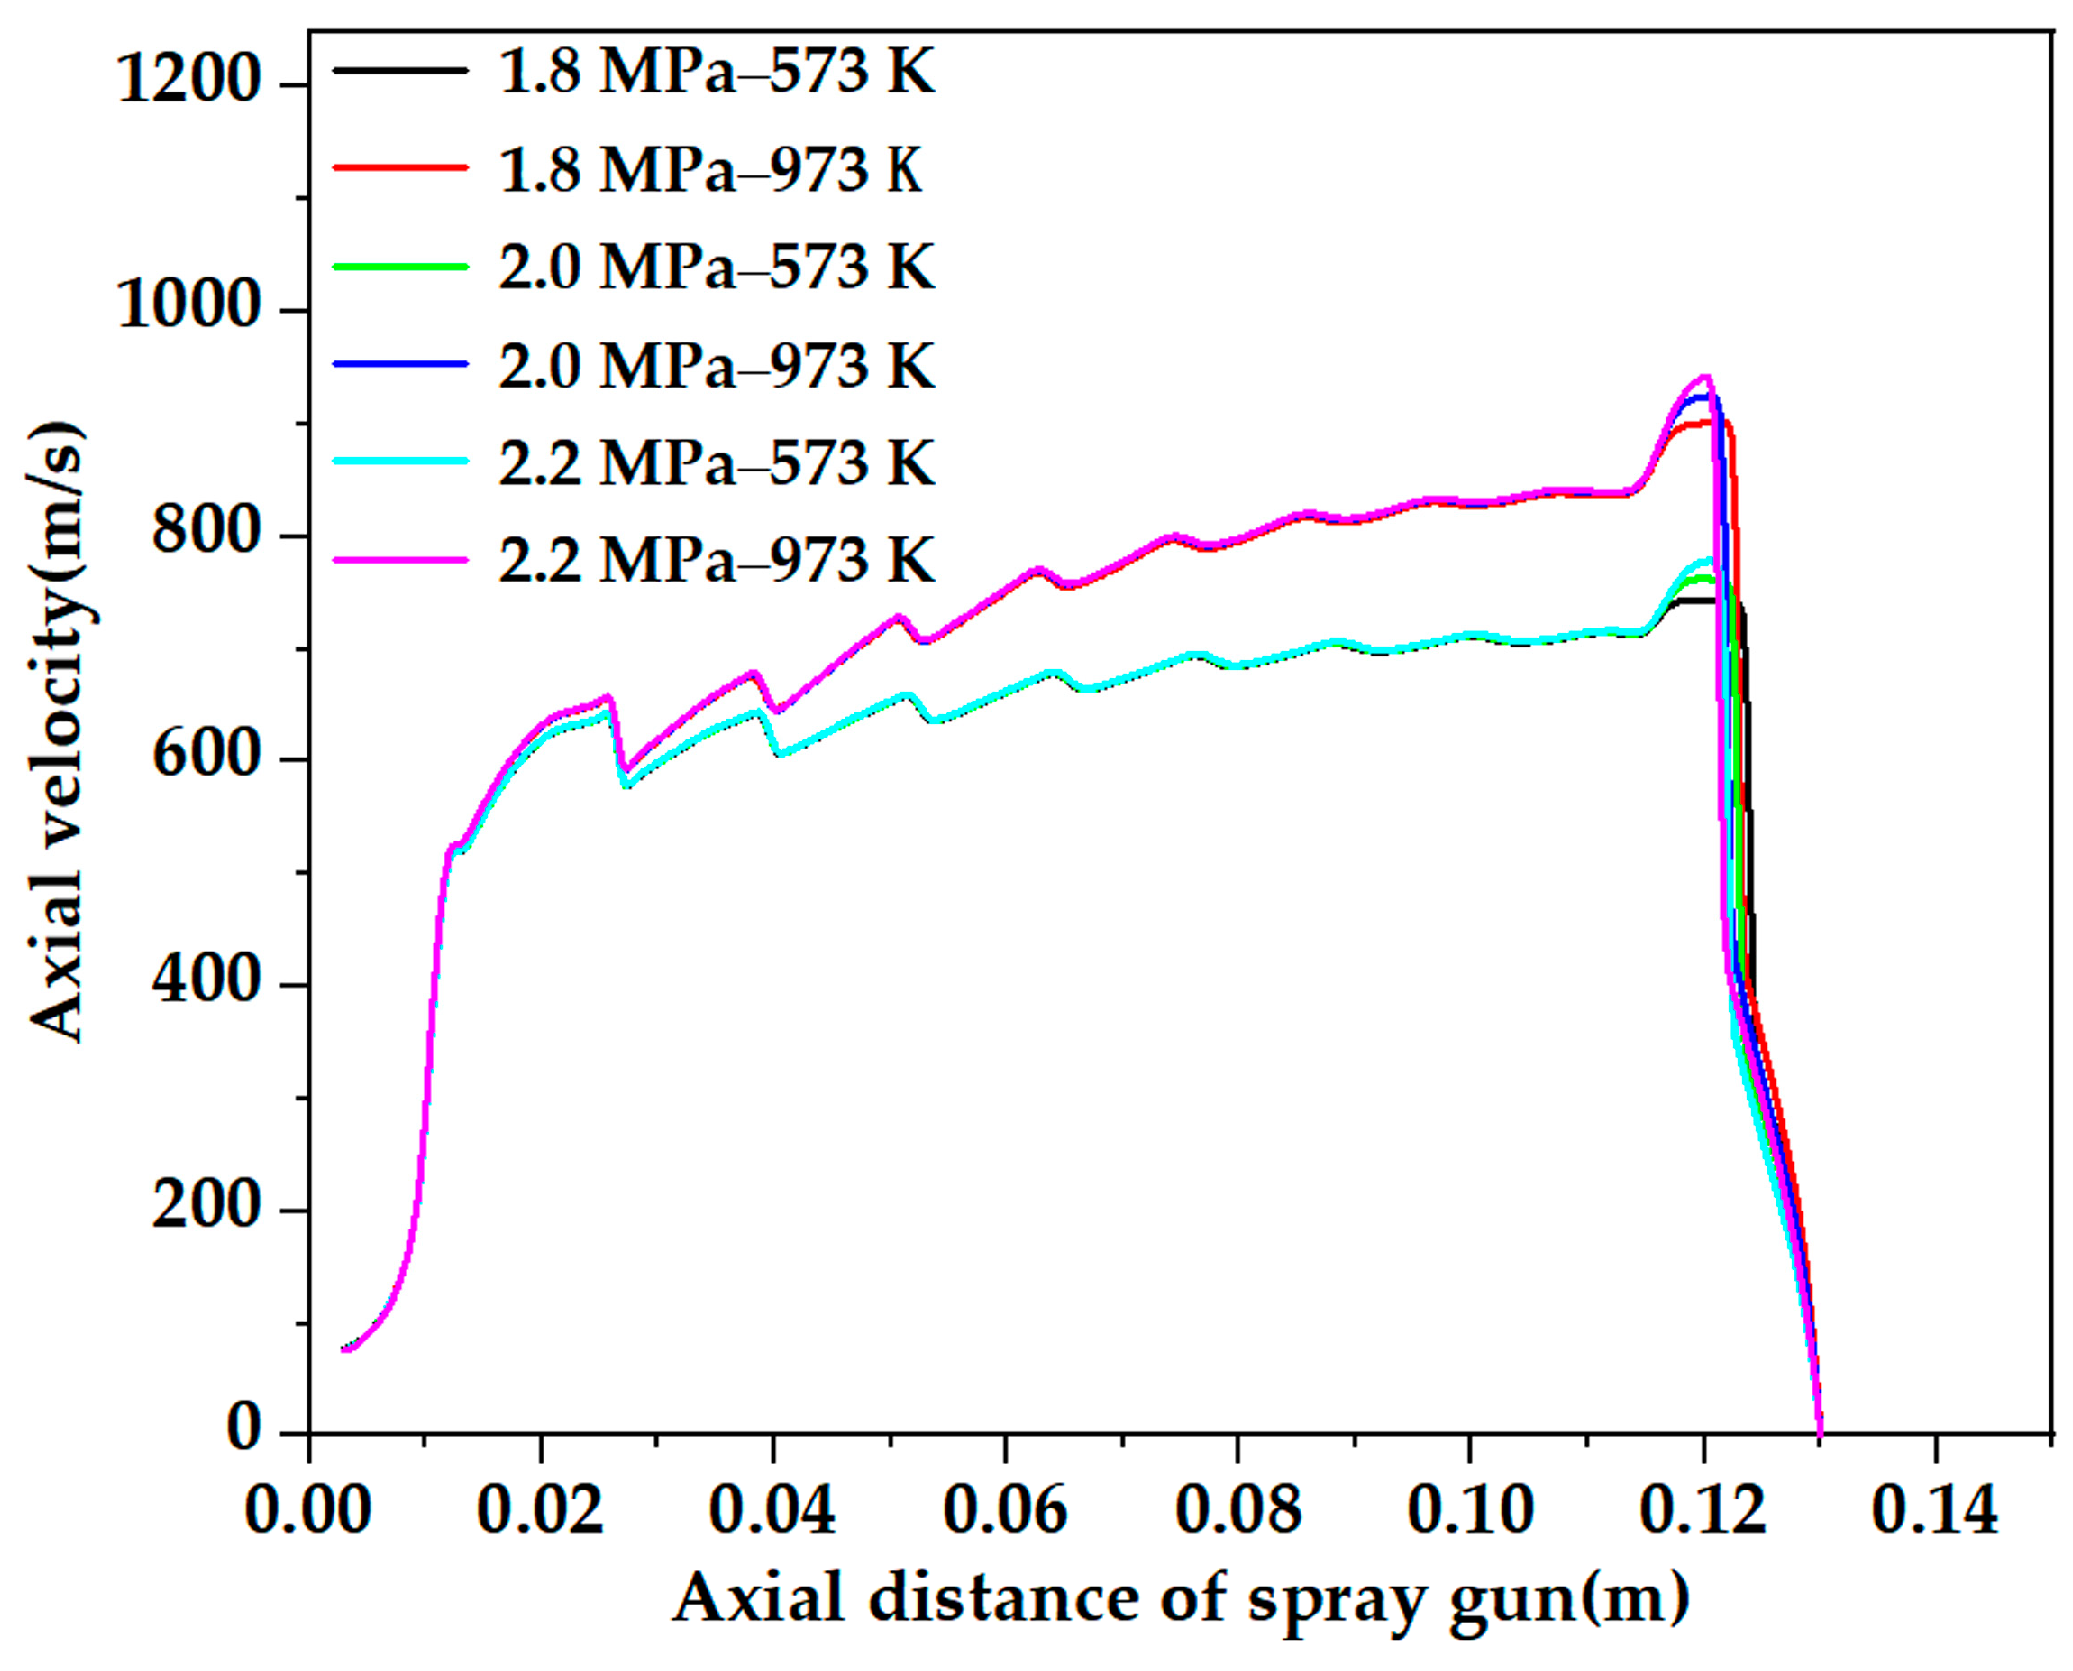
  • The axial velocity of gas flow continuously increased from the throat to the straight pipe exit. At gas temperatures of 573 K and 973 K and different gas pressure conditions (from 1.8 to 2.2 MPa), the axial velocity of the gas flow at the straight pipe exit increased to 715 m/s and 841 m/s, respectively. Due to the acceleration effect of the expansion wave, the axial velocity increased to the maximum value (at an axial distance of 120 mm) after the gas flow out of the straight pipe exit;
  • At a gas temperature of 573 K, the axial velocities of HA/30 wt.% Ti particles with a particle size of 10 μm at a gas pressure of 1.8 MPa, 2.0 MPa, and 2.2 MPa are 566 m/s, 572 m/s, and 577 m/s, respectively. At a gas temperature of 973 K, the axial velocities of HA/30 wt.% Ti particles with a particle size of 10 μm at a gas pressure of 1.8 MPa, 2.0 MPa, and 2.2 MPa are 636 m/s, 643 m/s, and 649 m/s, respectively. The axial velocities of HA/30 wt.% Ti particles at a gas temperature of 973 K and a different gas pressure were 12.4% higher than that at a gas temperature of 573 K and a different gas pressure;
  • At a gas temperature of 573 K, the axial velocities of HA/30 wt.% Ti particles with a particle size of 20 μm at a gas pressure of 1.8 MPa, 2.0 MPa, and 2.2 MPa are 471 m/s, 476 m/s, and 485 m/s, respectively. At a gas temperature of 973 K, the axial velocities of HA/30 wt.% Ti particles with a particle size of 20 μm at a gas pressure of 1.8 MPa, 2.0 MPa, and 2.2 MPa are 513 m/s, 522 m/s, and 530 m/s, respectively. The axial velocities of HA/30 wt.% Ti particles at a gas temperature of 973 K and different gas pressure were about 9.0% higher than that at a gas temperature of 573 K and a different gas pressure;
  • At a gas temperature of 573 K, the axial velocities of HA/30 wt.% Ti particles with a particle size of 30 μm at a gas pressure of 1.8 MPa, 2.0 MPa, and 2.2 MPa are 417 m/s, 427 m/s, and 435 m/s, respectively. At a gas temperature of 973 K, the axial velocities of HA/30 wt.% Ti particles with a particle size of 30 μm at a gas pressure of 1.8 MPa, 2.0 MPa, and 2.2 MPa are 448 m/s, 457 m/s, and 467 m/s, respectively. The axial velocities of HA/30 wt.% Ti particles at a gas temperature of 973 K and a different gas pressure were 7% higher than that at a gas temperature of 573 K and different gas pressure;
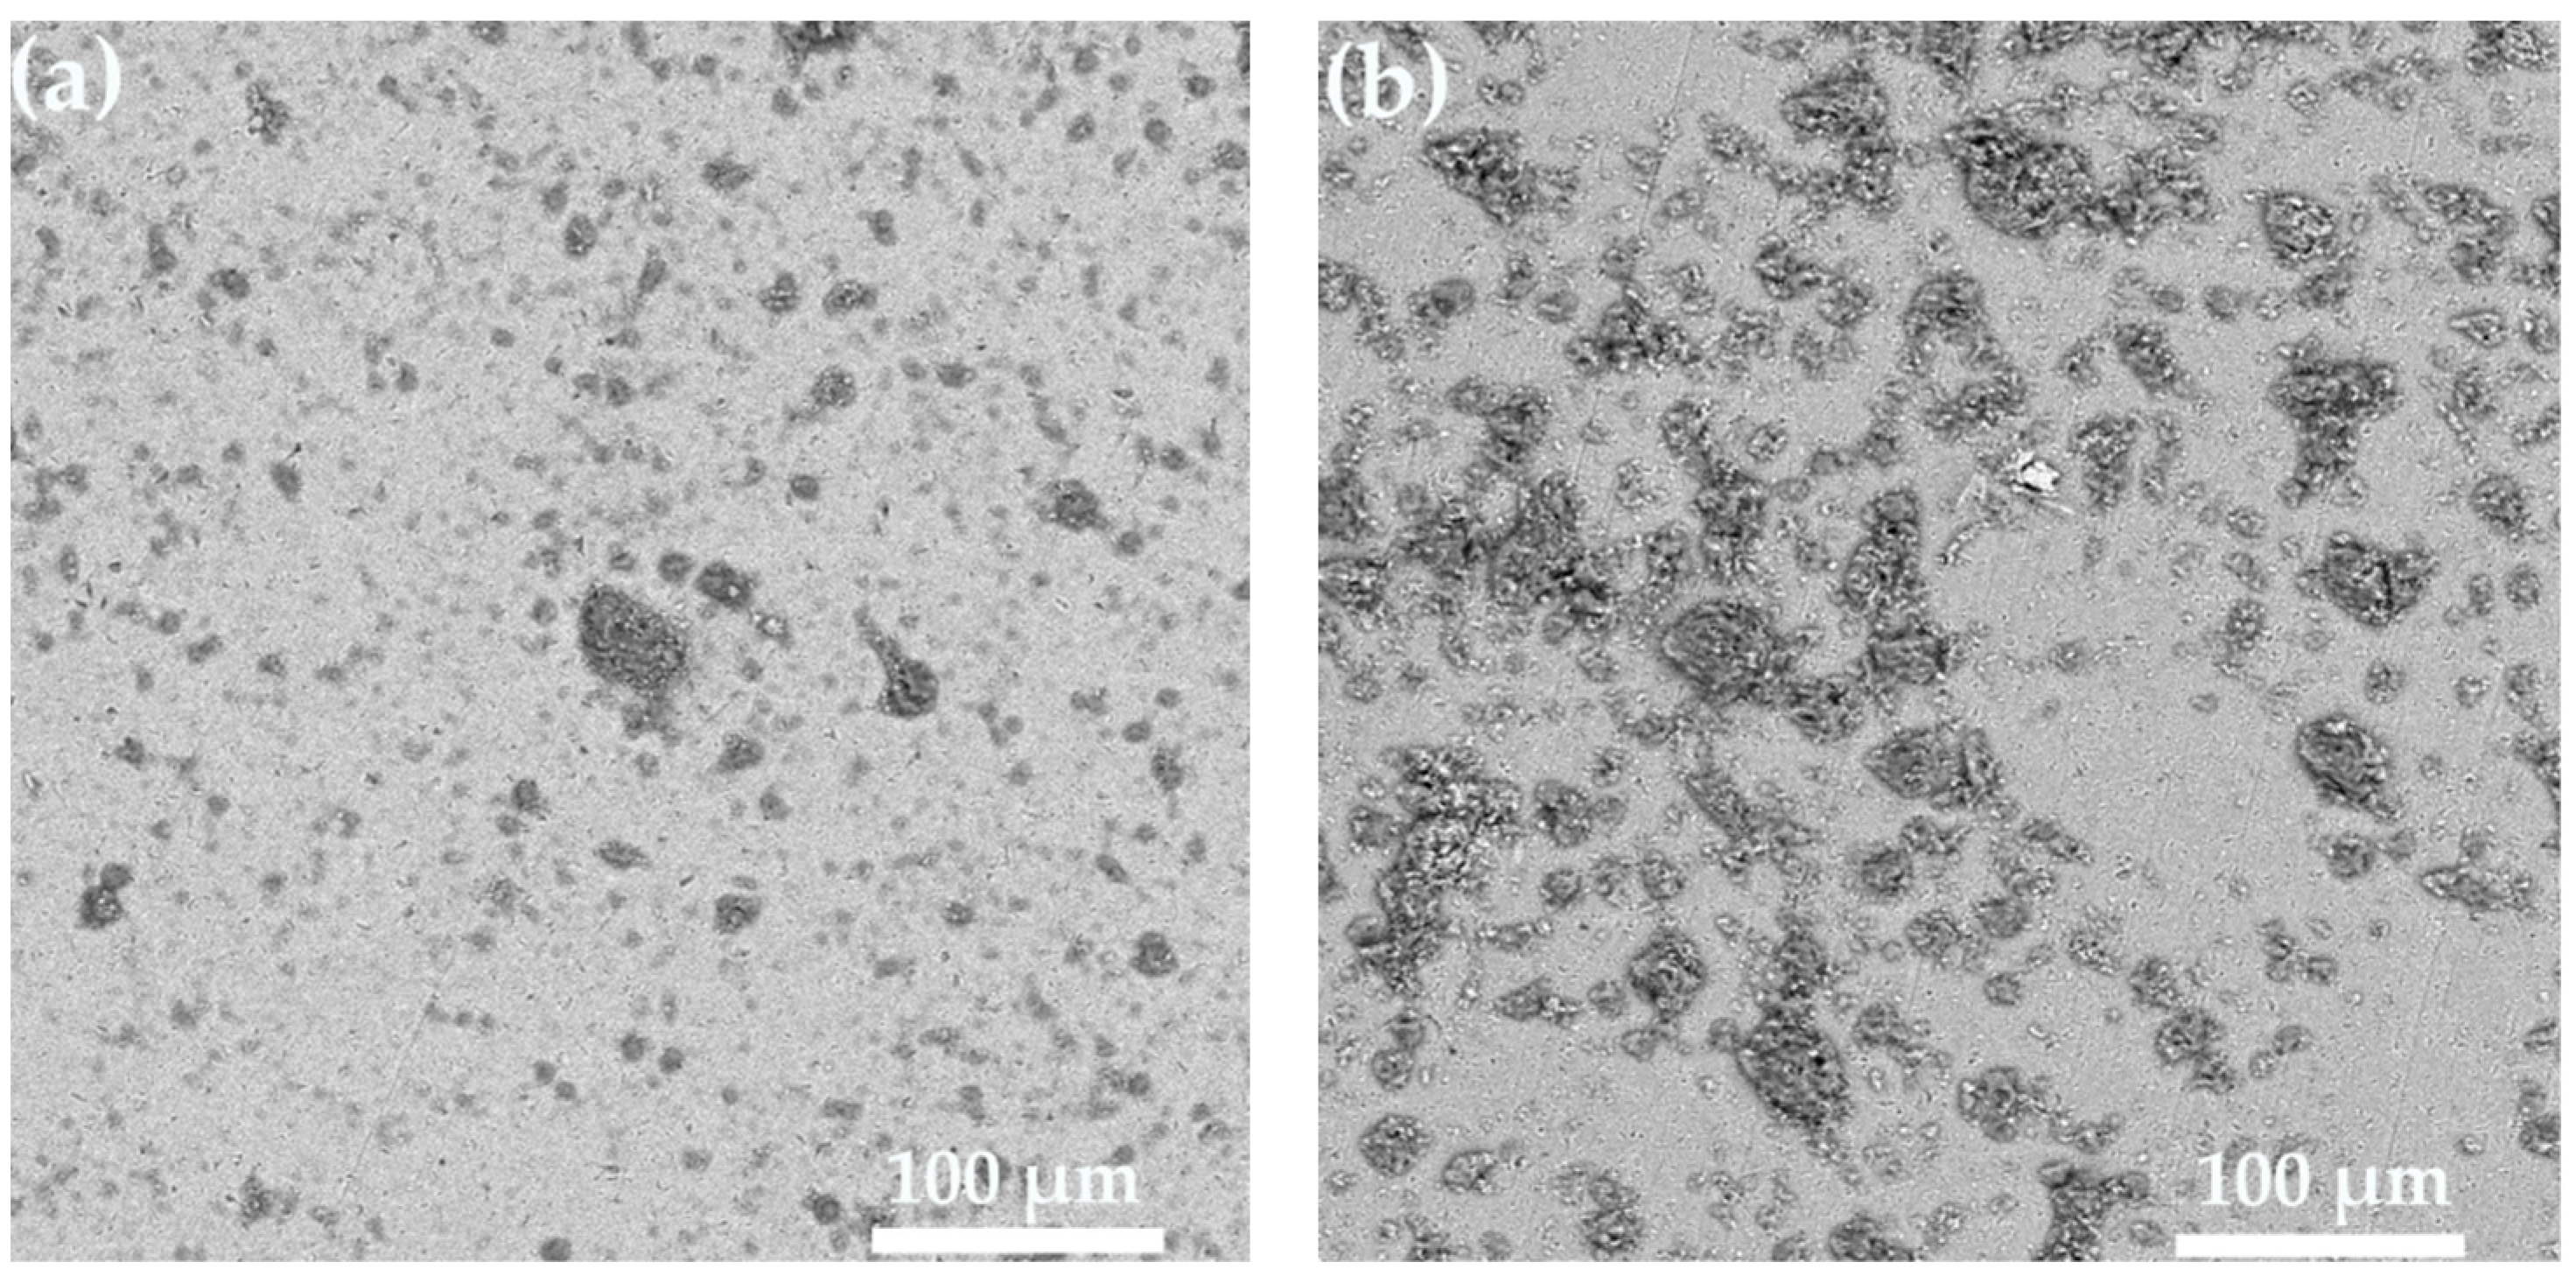
  • A significant plastic deformation of particles occurred as depositing on the surface of Ti6Al4V substrate at different gas temperatures, and the morphology of HA/30 wt.% Ti particles changed from spherical to a flat shape. Meanwhile, an ejecta phenomenon appeared at the edges of the splat. Moreover, the deformation of HA/30 wt.% Ti particle increased with the increase in gas temperature;
  • There is a certain influence of gas temperature on the bonding of HA/30 wt.% Ti particles to the substrate surface, and higher gas temperature is beneficial to improving the deformation of HA/30 wt.% Ti particles and promoting the bonding between the splats and Ti6Al4V substrate;
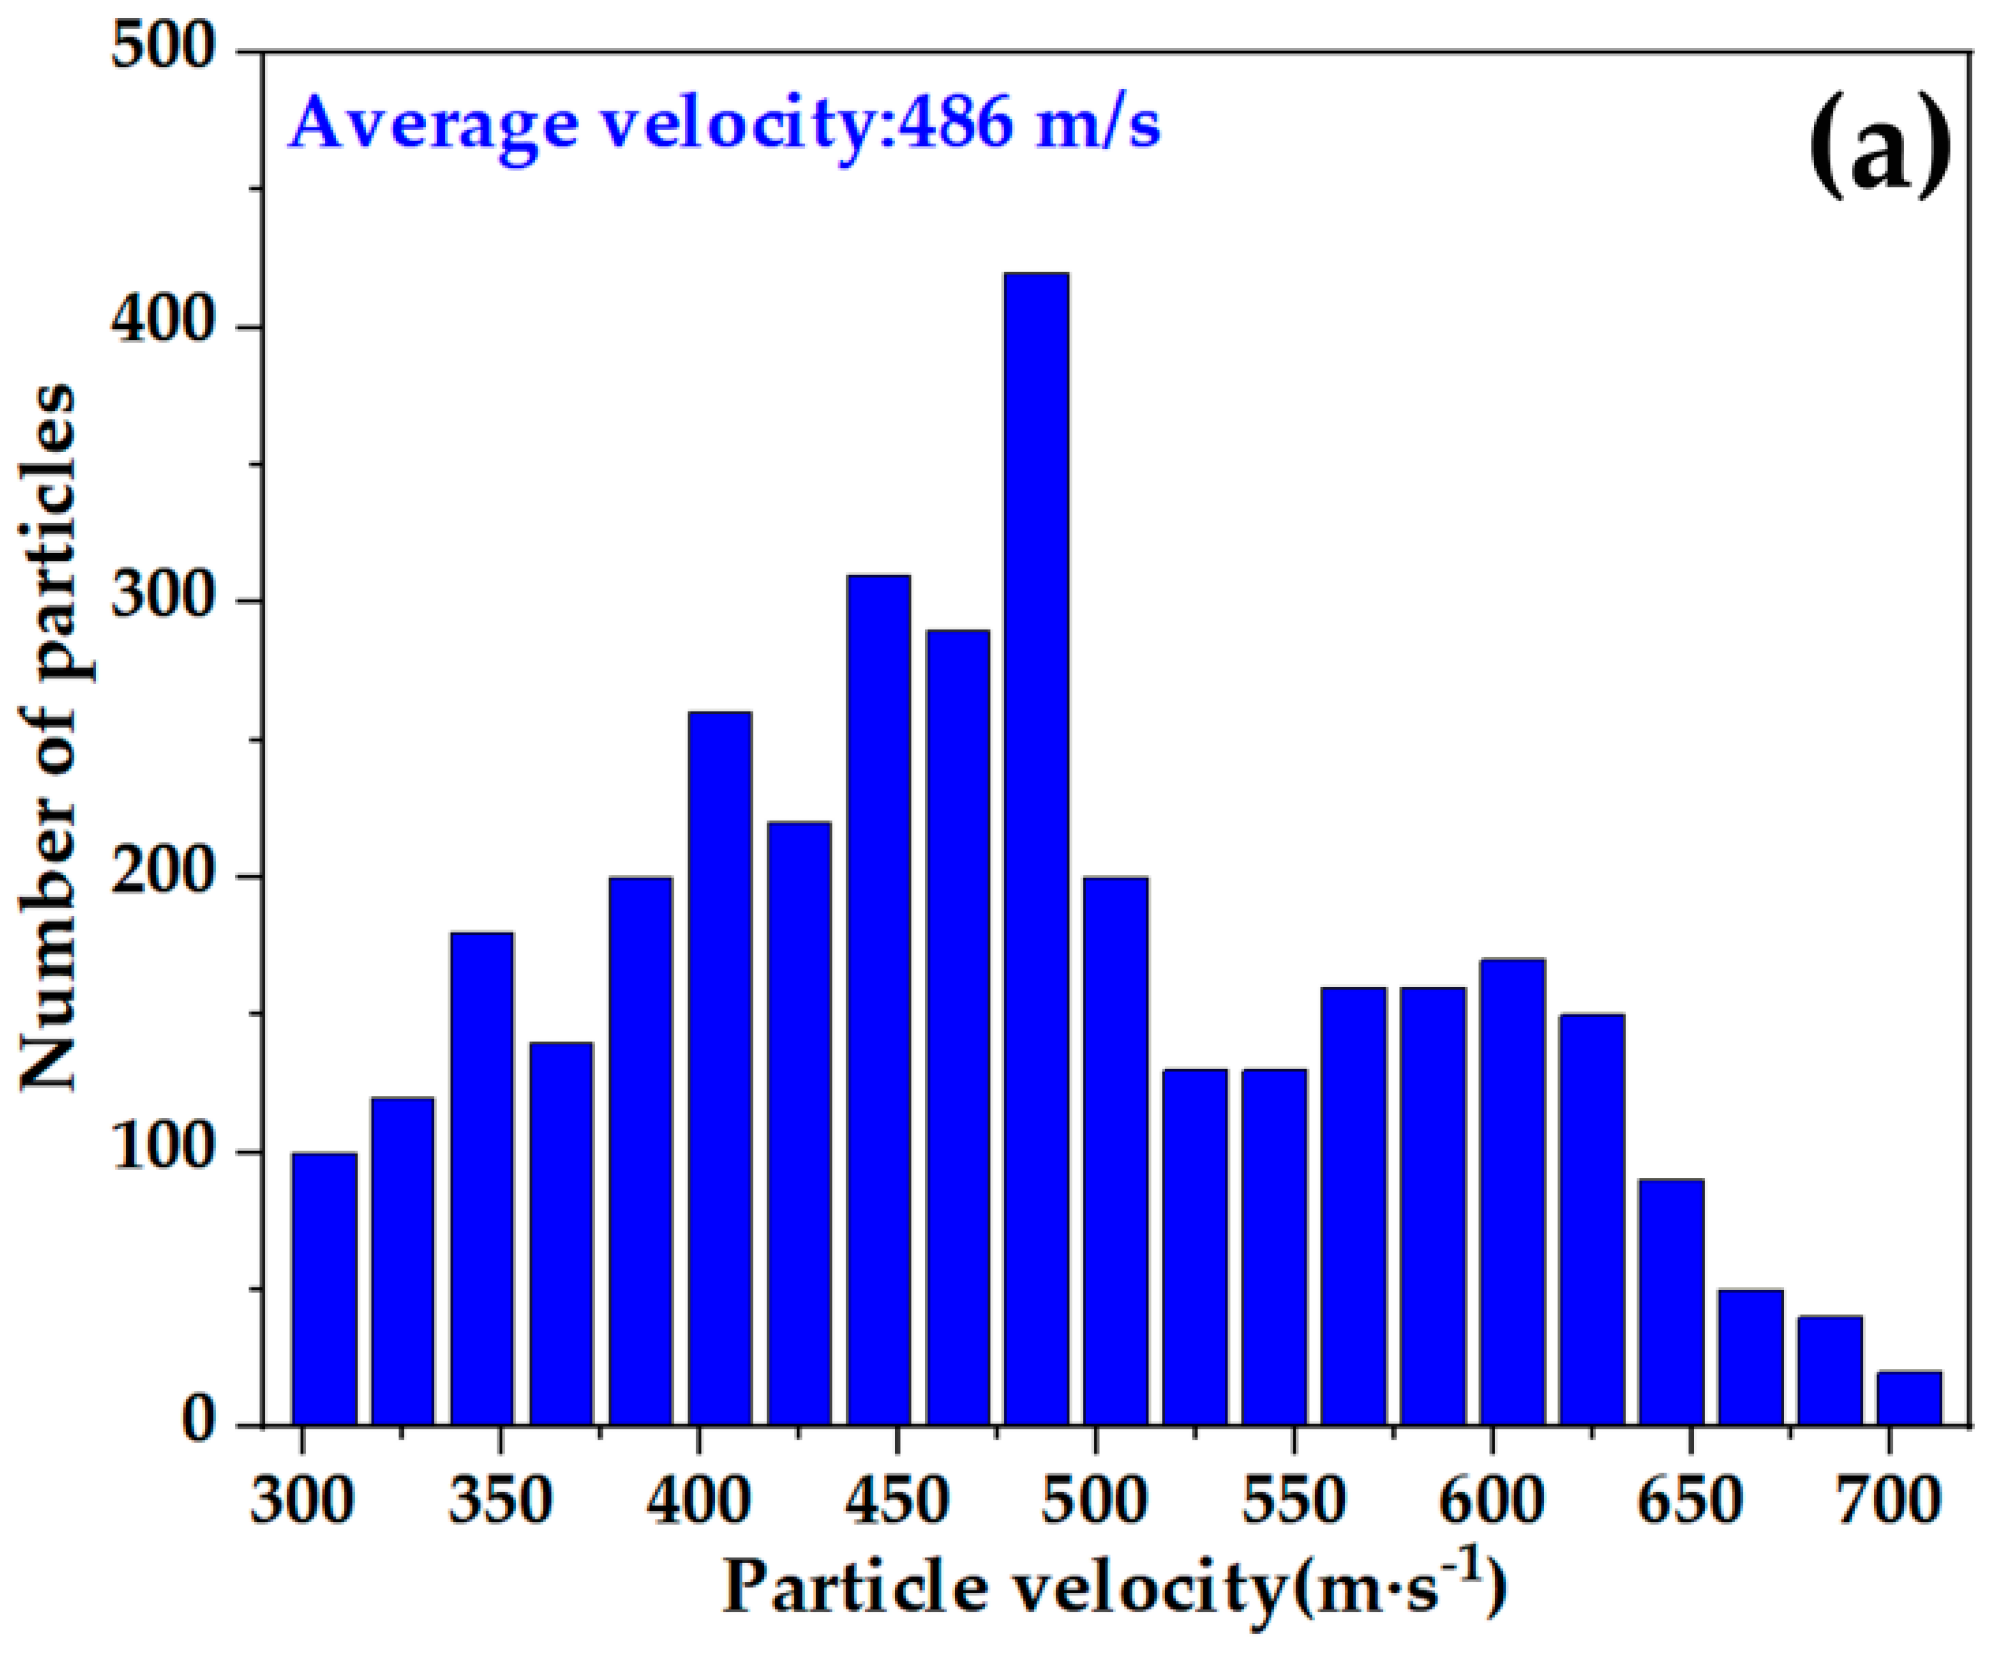
  • Comparing the numerical and experimental investigation, it was found that the experimental results were consistent with the numerical analysis results, and the deposition velocity of HA/30 wt.% Ti particles in the experiment was within the range of the axial velocity of the simulated HA/30 wt.% Ti particles.

Author Contributions

Conceptualization, X.C.; methodology, X.C. and Z.X.; software, Q.G.; validation, X.C. and X.D.; formal analysis, Z.X.; investigation, H.L.; resources, X.C.; data curation, X.C. and H.L.; writing—original draft preparation, X.C.; writing—review and editing, C.L.; visualization, Q.G.; supervision, X.D.; project administration, X.C.; funding acquisition, X.C. and C.L. All authors have read and agreed to the published version of the manuscript.

Funding

This research was funded by National Science Foundation of China, grant number 52161018, the Natural Science Foundation of Jiangxi, grant number 20224BAB214041, and the Science and Technology Project of Jiangxi Educational Bureau, grant number GJJ191068, GJJ212304, GJJ212307.

Institutional Review Board Statement

Not applicable.

Informed Consent Statement

Not applicable.

Data Availability Statement

Not applicable.

Conflicts of Interest

The authors declare no conflict of interest.

References

  1. Chen, C.Y.; Xie, X.L.; Xie, Y.C.; Yan, X.C.; Huang, C.J.; Deng, S.H.; Ren, Z.M.; Liao, H.L. Metallization of polyether ether ketone (PEEK) by copper coating via cold spray. Surf. Coat. Technol. 2018, 342, 209–219. [Google Scholar] [CrossRef]
  2. Li, W.Y.; Jiang, R.R.; Huang, C.J.; Zhang, Z.H.; Feng, Y. Effect of cold sprayed Al coating on mechanical property and corrosion behavior of friction stir welded AA2024-T351 joint. Mater. Des. 2015, 65, 757–761. [Google Scholar] [CrossRef]
  3. Li, W.Y.; Cao, C.C.; Yin, S. Solid-state cold spraying of Ti and its alloys: A literature review. Prog. Mater. Sci. 2020, 110, 100633. [Google Scholar] [CrossRef]
  4. Suo, X.K.; Yu, M.; Li, W.Y.; Planche, M.P.; Liao, H.L. Effect of substrate preheating on bonding strength of cold-sprayed Mg coatings. J. Therm. Spray Technol. 2012, 21, 1091–1098. [Google Scholar] [CrossRef]
  5. Song, B.; Voisey, K.T.; Hussain, T. High temperature chlorine-induced corrosion of Ni50Cr coating: HVOLF, HVOGF, cold spray and laser cladding. Surf. Coat. Technol. 2018, 337, 357–369. [Google Scholar] [CrossRef]
  6. Nikbakht, R.; Cojocaru, C.V.; Aghasibeig, M.; Irissou, R.; Kim, T.S.; Kim, H.S.; Jodoin, B. Cold Spray and Laser-Assisted Cold Spray of CrMnCoFeNi High Entropy Alloy Using Nitrogen as the Propelling Gas. J. Therm. Spray Technol. 2022, 31, 1129–1142. [Google Scholar] [CrossRef]
  7. Chen, X.; Wang, H.T.; Ji, G.C.; Bai, X.B.; Dong, Z.X. Deposition behavior of nanostructured WC-23Co particles in cold spraying process. Mater. Manuf. Process. 2016, 31, 1507–1513. [Google Scholar] [CrossRef]
  8. Yang, G.J.; Gao, P.H.; Li, C.X.; Li, C.J. Mechanical property and wear performance dependence on processing condition for cold-sprayed WC-(nanoWC-Co). Appl. Surf. Sci. 2015, 332, 80–88. [Google Scholar] [CrossRef]
  9. Sai Jagadeeswara, A.; Kumara, S.; Venkataraman, B.; Suresh Babu, P.; Jyothirmayi, A. Effect of thermal energy on the deposition behaviour, wear and corrosion resistance of cold sprayed Ni-WC cermet coatings. Surf. Coat. Technol. 2020, 399, 126138. [Google Scholar] [CrossRef]
  10. Wolfe, D.E.; Eden, T.J.; Potter, J.K.; Jaroh, A.P. Investigation and characterization of Cr3C2-based wear-resistant coatings applied by the cold spray process. J. Therm. Spray Technol. 2006, 15, 400–412. [Google Scholar] [CrossRef]
  11. Winnicki, M.; Gibas, A.; Baszczuk, A.; Jasiorski, M. Low pressure cold spraying of TiO2 on acrylonitrile butadiene styrene (ABS). Surf. Coat. Technol. 2020, 406, 126717. [Google Scholar] [CrossRef]
  12. Yang, G.J.; Liao, K.X.; Li, C.J.; Fan, S.Q.; Li, C.X.; Li, S. Formation of pore structure and its influence on the mass transport property of vacuum cold sprayed TiO2 coatings using strengthened nanostructured powder. J. Therm. Spray Technol. 2012, 21, 505–513. [Google Scholar] [CrossRef]
  13. Wang, Y.Y.; Liu, Y.; Yang, G.J.; Feng, J.J.; Kusumoto, K. Effect of microstructure on the electrical properties of nano-structured TiN coatings deposited by vacuum cold spray. J. Therm. Spray Technol. 2010, 19, 1231–1237. [Google Scholar] [CrossRef]
  14. Liu, Y.; Wang, Y.Y.; Yang, G.J.; Feng, J.J.; Kusumoto, K. Effect of nano-sized TiN additions on the electrical properties of vacuum cold sprayed SiC coatings. J. Therm. Spray Technol. 2010, 19, 1238–1243. [Google Scholar] [CrossRef]
  15. Tian, Y.S.; Qian, X.L.; Chen, M.Q. Effect of saturated steam treatment on the crystallinity of plasma-sprayed hydroxyapatite coatings. Surf. Coat. Technol. 2015, 266, 38–41. [Google Scholar] [CrossRef]
  16. Vilardell, A.M.; Garcia-Giralt, N.; Dosta, S.; Cano, I.G.; Guilemany, J.M. Functionalized coatings by cold spray: An in vitro study of micro- and nanocrystalline hydroxyapatite compared to porous titanium. Mater. Sci. Eng. C 2018, 87, 41–49. [Google Scholar] [CrossRef]
  17. Chen, Q.Y.; Zou, Y.L.; Chen, X.; Bai, X.B.; Yao, H.L.; Wang, H.T.; Wang, F. Morphological, structural and mechanical characterization of cold sprayed hydroxyapatite coating. Surf. Coat. Technol. 2019, 357, 910–923. [Google Scholar] [CrossRef]
  18. Chatelain, D.; Denoirjean, A.; Guipont, V.; Rossignol, F.; Tessier-Doyen, N. Influence of the thermal treatment of a hydroxyapatite powder on the characteristics of coatings deposited by cold gas spraying. Surf. Coat. Technol. 2022, 446, 128697. [Google Scholar] [CrossRef]
  19. Chen, X.; Ji, G.C.; Bai, X.B.; Yao, H.L.; Chen, Q.Y.; Zou, Y.L. Microstructures and properties of cold spray nanostructured HA coatings. J. Therm. Spray Technol. 2018, 27, 1344–1355. [Google Scholar] [CrossRef]
  20. Lin, Y.G.; Yang, Z.R.; Cheng, J. Preparation, characterization and antibacterial properties of cerium substituted hydroxyapatite nanoparticle. J. Rare Earth 2007, 25, 452–456. [Google Scholar] [CrossRef]
  21. Harun, W.S.M.; Asri, R.I.M.; Alias, J.; Zulkifli, F.H.; Kadirgama, K.; Ghani, S.A.C.; Shariffuddin, J.H.M. A comprehensive review of hydroxyapatite-based coatings adhesion on metallic biomaterials. Ceram. Int. 2018, 44, 1250–1268. [Google Scholar] [CrossRef]
  22. Liu, S.J.; Li, H.J.; Zhang, L.L.; Guo, Q. Pulsed electrodeposition of carbon nanotubes-hydroxyapatite nanocomposites for carbon/carbon composites. Ceram. Int. 2016, 42, 15650–15657. [Google Scholar] [CrossRef]
  23. Morteza, F. Electrophoretic deposition of fiber hydroxyapatite/titania nanocomposite coatings. Ceram. Int. 2018, 44, 622–630. [Google Scholar]
  24. Zeng, Y.X.; Pei, X.B.; Yang, S.Y.; Qin, H.; Cai, H.; Hu, S.S.; Lei, S.; Wan, Q.B.; Wang, J. Graphene oxide/hydroxyapatite composite coatings fabricated by electrochemical deposition. Surf. Coat. Technol. 2016, 286, 72–79. [Google Scholar] [CrossRef]
  25. He, D.H.; Zhang, X.X.; Liu, P.; Liu, X.K.; Chen, X.H.; Ma, F.C.; Li, W.; Zhang, K.; Zhou, H.L. Effect of hydrothermal treatment temperature on the hydroxyapatite coatings deposited by electrochemical method. Surf. Coat. Technol. 2021, 406, 126656. [Google Scholar] [CrossRef]
  26. Abdulsahib Hamdi, D.; Jiang, Z.T.; No, K.; Mahbubur Rahman, M.; Lee, P.C.; Nguyen, L.; Kim, J.; Altarawneh, M.; Thair, L.; Jumaa, T.A.J.; et al. Biocompatibility study of multi-layered hydroxyapatite coatings synthesized on Ti-6Al-4V alloys by RF magnetron sputtering for prosthetic-orthopaedic implant applications. Appl. Surf. Sci. 2019, 463, 292–299. [Google Scholar] [CrossRef]
  27. Li, S.M.; Zhang, Q.; Zhao, Y.T.; Da, Z.L.; Liu, X.Y.; Zhang, Z. Preparation, structure and properties of HAF/YSZ gradient composite coatings. Chin. J. Tissue Eng. Res. 2011, 15, 8805–8808. [Google Scholar]
  28. Chen, M.F.; Liu, J.W.; Wang, Y.H.; You, C. Preparation and characterization of TiO2/HA bio-composite film by RF magnetron sputtering. Acta Mate. Compo. Sin. 2003, 20, 52–56. [Google Scholar]
  29. Ding, S.J. Properties and immersion behavior of magnetron-sputtered multi-layered hydroxyapatite/titanium composite coatings. Biomaterials 2003, 24, 4233–4238. [Google Scholar] [CrossRef]
  30. Kou, S.Z.; Cheng, Y.L.; Guo, Y. The present situation of hydroxyapatite (HA) coatings on biomaterial substrate by magnetron sputtering. Mater. Rev. 2006, 20, 107–110. [Google Scholar]
  31. Chakraborty, R.; Raza, M.S.; Datta, S.; Saha, P. Synthesis and characterization of nickel free titanium–hydroxyapatite composite coating over Nitinol surface through in-situ laser cladding and alloying. Surf. Coat. Technol. 2019, 358, 539–550. [Google Scholar] [CrossRef]
  32. Pei, X.B.; Wang, J.; Wan, Q.B.; Kang, L.J.; Xiao, M.L.; Bao, H. Functionally graded carbon nanotubes/hydroxyapatite composite coating by laser cladding. Surf. Coat. Technol. 2011, 205, 4380–4387. [Google Scholar] [CrossRef]
  33. Behera, R.R.; Hasan, A.; Sankar, M.R.; Pandey, L.M. Laser cladding with HA and functionally graded TiO2-HA precursors on Ti-6Al-4V alloy for enhancing bioactivity and cyto-compatibility. Surf. Coat. Technol. 2018, 352, 420–436. [Google Scholar] [CrossRef]
  34. Smolina, I.; Szymczyk, P.; Chlebus, E.; Ivashchenko, I.; Kurzynowski, T. Composite laser-clad coating on titanium substrate using pure hydroxyapatite powder. Powder Metall. Met. Ceram. 2015, 54, 85–91. [Google Scholar] [CrossRef]
  35. Singh, A.; Singh, G.; Chawla, V. Characterization and mechanical behaviour of reinforced hydroxyapatite coatings deposited by vacuum plasma spray on SS-316L alloy. J. Mech. Behav. Biomed. Mater. 2018, 79, 273–282. [Google Scholar] [CrossRef]
  36. Li, H.; Khor, K.A.; Cheang, P. Effect of the powders’melting state on the properties of HVOF sprayed hydroxyapatite coatings. Mater. Sci. Eng. A 2000, 293, 71–80. [Google Scholar] [CrossRef]
  37. Mittal, M.; Nath, S.K.; Prakash, S. Improvement in mechanical properties of plasma sprayed hydroxyapatite coatings by Al2O3 reinforcement. Mater. Sci. Eng. C 2013, 33, 2838–2845. [Google Scholar] [CrossRef]
  38. Singh, G. Mechanical behavior of plasma-sprayed pure and reinforced hydroxyapatite coating on Ti6Al4V alloy. J. Aust. Ceram. Soc. 2019, 55, 85–96. [Google Scholar] [CrossRef]
  39. Li, H.; Khor, K.A.; Cheang, P. Titanium dioxide reinforced hydroxyapatite coatings deposited by high velocity oxy-fuel (HVOF) spray. Biomaterials 2002, 23, 85–91. [Google Scholar] [CrossRef] [PubMed]
  40. Yao, H.L.; Wang, H.T.; Bai, X.B.; Ji, G.C.; Chen, Q.Y. Improvement in mechanical properties of nano-structured HA/TiO2 multilayer coatings deposited by high velocity suspension flame spraying (HVSFS). Surf. Coat. Technol. 2018, 342, 94–104. [Google Scholar] [CrossRef]
  41. Yao, H.L.; Zou, Y.L.; Bai, X.B.; Wang, H.T.; Ji, G.C.; Chen, Q.Y. Microstructures, mechanical properties and electrochemical behaviors of nano-structured HA/Ti composite coatings deposited by high-velocity suspension flame spray (HVSFS). Ceram. Int. 2018, 44, 13024–13030. [Google Scholar] [CrossRef]
  42. Ji, G.C.; Zou, Y.L.; Chen, Q.Y.; Yao, H.L.; Wang, F. Mechanical properties of warm sprayed HATi bio-ceramic composite coatings. Ceram. Int. 2020, 46, 27021–27030. [Google Scholar] [CrossRef]
  43. Chen, X.Y.; Zhang, B.T.; Gong, Y.F.; Zhou, P.; Li, H. Mechanical properties of nanodiamond-reinforced hydroxyapatite composite coatings deposited by suspension plasma spraying. Appl. Surf. Sci. 2018, 439, 60–65. [Google Scholar] [CrossRef]
  44. Guillem-Marti, J.; Cinca, N.; Punset, M.; Cano, I.G.; Gil, F.J.; Guilemany, J.M.; Dosta, S. Porous titanium-hydroxyapatite composite coating obtained on titanium by cold gas spray with high bond strength for biomedical applications. Colloids Surf. B Biointerfaces 2019, 180, 245–253. [Google Scholar] [CrossRef] [PubMed]
  45. Zhou, X.; Mohanty, P. Electrochemical behavior of cold sprayed hydroxyapatite/titanium composite in Hanks’ solution. Electrochim. Acta 2012, 65, 134–140. [Google Scholar] [CrossRef]
  46. Gardon, M.; Concustell, A.; Dosta, S.; Cinca, N.; Cano, I.G.; Guilemany, J.M. Improved bonding strength of bioactive cermet cold gas spray coatings. Mater. Sci. Eng. C 2014, 45, 117–121. [Google Scholar] [CrossRef]
  47. Ning, X.J.; Wang, Q.S.; Ma, Z.; Kim, H.J. Numerical study of in-flight particle parameters in low-pressure cold spray process. J. Therm. Spray Technol. 2010, 19, 1211–1217. [Google Scholar] [CrossRef]
  48. Chen, X.; Li, C.; Gao, Q.Q.; Duan, X.X.; Liu, H. Comparison of microstructure, microhardness, fracture toughness, and abrasive wear of WC-17Co coatings formed in various spraying ways. Coatings 2022, 12, 814. [Google Scholar] [CrossRef]
  49. Ji, G.C.; Chen, X.; Wang, H.T.; Bai, X.B.; Dong, Z.X. Deformation behaviors of cold-sprayed WC-Co particles. J. Therm. Spray Technol. 2015, 24, 1100–1110. [Google Scholar] [CrossRef]
Figure 1. Schematic diagram of the internal cavity structure of cold spray gun.
Coatings 13 00818 g001
Figure 2. Schematic diagram of calculation domain.
Coatings 13 00818 g002
Figure 3. Simulation meshing (a) entire calculation domain, (b) pressure inlet and throat domain, (c) outlet.
Coatings 13 00818 g003
Figure 4. The morphologies of HA/Ti powders (a) surface, 2000×, (b) cross-section, 3000×.
Coatings 13 00818 g004
Figure 5. The size distribution of HA/Ti powders.
Coatings 13 00818 g005
Figure 6. The X-ray diffraction (XRD) patterns of HA/Ti powders.
Coatings 13 00818 g006
Figure 7. Static pressure distribution cloud diagram of flow field for 573 K under different gas pressure conditions (a) 1.8 MPa, (b) 2.0 Mpa, and (c) 2.2 Mpa.
Coatings 13 00818 g007
Figure 8. Static pressure distribution cloud diagram of flow field for 973 K under different gas pressure conditions (a) 1.8 MPa, (b) 2.0 Mpa, and (c) 2.2 Mpa.
Coatings 13 00818 g008
Figure 9. Static pressure curve of flow field.
Coatings 13 00818 g009
Figure 10. Static temperature distribution cloud diagram of flow field for 573 K under different gas pressure conditions (a) 1.8 MPa, (b) 2.0 Mpa, and (c) 2.2 Mpa.
Coatings 13 00818 g010
Figure 11. Static temperature distribution cloud diagram of flow field for 973 K under different gas pressure conditions (a) 1.8 MPa, (b) 2.0 Mpa, and (c) 2.2 Mpa.
Coatings 13 00818 g011
Figure 12. Static temperature curve of flow field.
Coatings 13 00818 g012
Figure 13. Axial velocity distribution cloud diagram of gas flow for 573 K under different gas pressure conditions (a) 1.8 MPa, (b) 2.0 Mpa, and (c) 2.2 Mpa.
Coatings 13 00818 g013
Figure 14. Axial velocity distribution cloud diagram of gas flow for 973 K under different gas pressure conditions (a) 1.8 MPa, (b) 2.0 Mpa, and (c) 2.2 Mpa.
Coatings 13 00818 g014
Figure 15. Axial velocity curve of gas flows.
Coatings 13 00818 g015
Figure 16. Axial velocity of HA/30 wt.% Ti composite particles (a) 10 μm, (b) 20 μm, and (c) 30 μm.
Coatings 13 00818 g016
Figure 17. Surface morphologies of nanostructure HA/30 wt.% Ti composite particle deposited in different gas temperature (a) 573 K, (b) 973 K.
Coatings 13 00818 g017
Figure 18. Bonding morphologies of nanostructure HA/30 wt.% Ti composite particles deposited in different gas temperature (a) 573 K, (b) 973 K.
Coatings 13 00818 g018
Figure 19. Velocity distribution of HA/30 wt.% Ti particles at gas temperature of (a) 573 K and (b) 973 K.
Coatings 13 00818 g019aCoatings 13 00818 g019b
Table 1. The detail simulation parameters of FLUENT flow field analysis in the CS process of HA/Ti composite particles.
Simulation ParametersValue
Gas pressure/MPa1.8, 2.0, 2.2
Gas temperature inlet/K573, 973
Particle size/μm10, 20, 30
Spray distance/mm20
Table 2. The detail spraying parameters of single HA/Ti particle deposition.
Value
Accelerating gas pressure/MPa2.0
Powder-feeding gas pressure/MPa2.2
Gas temperature in gun chamber/°C300 ± 10, 700 ± 10
Transverse speed of gun/mm·s−1500
Spray distance/mm20
SubstrateTi6Al4V
Table 3. The detail maximum axial velocities of HA/30 wt.% Ti particles with different particle size.
Particle SizeGas PressureGas Temperature
573 K973 K
10 μm1.8 MPa566 m/s636 m/s
2.0 MPa572 m/s643 m/s
2.2 MPa577 m/s649 m/s
20 μm1.8 MPa471 m/s513 m/s
2.0 MPa476 m/s522 m/s
2.2 MPa485 m/s530 m/s
30 μm1.8 MPa417 m/s448 m/s
2.0 MPa427 m/s457 m/s
2.2 MPa435 m/s467 m/s
Disclaimer/Publisher’s Note: The statements, opinions and data contained in all publications are solely those of the individual author(s) and contributor(s) and not of MDPI and/or the editor(s). MDPI and/or the editor(s) disclaim responsibility for any injury to people or property resulting from any ideas, methods, instructions or products referred to in the content.

