Article

Optimization and Characterization of Centrifugal-Cast Functionally Graded Al-SiC Composite Using Response Surface Methodology and Grey Relational Analysis

1
College of Civil and Transportation Engineering, Hohai University, Nanjing 210098, China
2
Production Engineering Department, Alexandria University, Alexandria 21544, Egypt
3
College of Mechanical and Electrical Engineering, Nanjing University of Aeronautics and Astronautics, Nanjing 210016, China
4
College of Energy and Electrical Engineering, Hohai University, Nanjing 211100, China
5
Department of Electrical and Electronic Engineering, College of Engineering Science, Nyala University, Nyala 63311, Sudan
6
Department of Mechanical Engineering, Amrita School of Engineering, Coimbatore, Amrita Vishwa Vidyapeetham, Coimbatore 641112, India
7
College of Mechanics and Materials, Hohai University, Nanjing 211100, China
*
Author to whom correspondence should be addressed.
Coatings 2023, 13(5), 813; https://doi.org/10.3390/coatings13050813
Submission received: 27 March 2023 / Revised: 19 April 2023 / Accepted: 20 April 2023 / Published: 22 April 2023
(This article belongs to the Special Issue Advanced Corrosion Protection through Coatings and Surface Rebuilding)

Abstract

:
In this study, an optimization approach was employed to determine the optimal main parameters that improve the performance of functionally graded composites manufactured using a combination of stirring and horizontal centrifugal casting. Pure aluminum reinforced with silicon carbide particles was used as the material for the composites. The effects of key input parameters such as mold speed, pouring temperature, stirring speed, and radial distance were optimized using a combination of grey relational analysis and response surface methodology. The statistical significance of the predicted grey relational grade model was assessed through an analysis of variance to identify the appropriate main parameters. The results showed that radial distance had the greatest impact on the performance of the composites, followed by pouring temperature. The optimal combination of main parameters was determined to be a mold speed of 1000 rpm, a pouring temperature of 750 °C, a stirring speed of 150 rpm, and a radial distance of 1 mm. Confirmation tests using these optimal values resulted in a 54.69% improvement in the grey relational grade.

1. Introduction

Functionally graded materials (FGMs) are a sort of novel traditional composite material in which compositions or microstructures are gradually altered, resulting in a specific enhancement in material characteristics in a particular direction [1,2,3,4]. Due to the unique graded properties, FGMs have become increasingly important for researchers in a variety of fields, including automotive, aerospace, biomaterials, electronics, and others, in recent years [5,6,7,8]. FGMs are frequently used where one end of a layer must endure hard conditions, and the other side of the substrate must be linked to the base material that requires protection from these hostile surroundings [9,10,11]. FGM manufacturing methods have evolved over the years, with numerous techniques now employed to create these gradient materials, including centrifugal casting, powder metallurgy, vapor deposition, thermal spray, and additive manufacturing techniques [12,13,14]. Centrifugal casting and powder metallurgy processes, in particular, have proven effective in the fabrication of FGMs with smooth variation in microstructures and/or compositions [15,16,17]. Centrifugal casting is typically more desirable to FGM production because it produces pieces that are substantially larger than those generated by powder metallurgy [18,19]. Furthermore, centrifugal casting processes offer a continuous gradient and cost-effective approach for creating FGMs when compared to other techniques [20,21,22]. Among the various matrix materials available, aluminum alloys are widely used in the production of FGMs and have reached the industrial level of development [23,24]. Various ceramic particles, including SiC, B4C, Al2O3, zircon, and TiC, have also been utilized to reinforce Al alloy for the production of graded composites [25,26]. Many theoretical and experimental studies have been conducted in recent years to investigate the effect of graded structure on the mechanical, thermal, and tribological properties of FGMs produced by centrifugal casting [27,28]. In contrast with multi-response optimization using grey relational analysis, the statistics research has focused primarily on using the Taguchi technique as the main approach for optimizing the effect of wear testing parameters on the wear resistance for the graded tubes [29,30]. However, few studies have been conducted to investigate the effect of main testing parameters such as applied load, sliding speed, sliding time, and temperature during the test on the tribological properties of graded composites reinforced with ceramic particles using response surface methodology [31,32,33,34].
To show an example, Radhika and Raghu [35] determined optimum wear testing parameters for better wear resistance of centrifugally cast functionally graded aluminum composites reinforced with aluminum diboride using the Taguchi method. The wear rate was observed to rise with increasing load and decrease with increasing sliding speed and particle size. Moreover, the signal-to-noise ratio analysis and analysis of variance revealed that load has the greatest influence on the wear resistance, followed by particle size and sliding speed. In another work, El-Galy et al. [29] used multiple regression analysis to forecast the wear rate of graded tubes in different zones, on the basis of tests conducted using the Taguchi method for varied process parameters and wear-testing parameters. The analysis of variance (ANOVA) revealed that the applied load is the most important parameter influencing wear rate, followed by the weight fraction of particles. In another related study, Savaş [36] used the Taguchi method to develop an empirical model to predict the wear rate of functionally graded aluminum composite reinforced with Al3Ti flakes or TiB2 particles produced via centrifugal casting. L16 (2344) orthogonal design was built using seven parameters: particles type, sample zone, matrix type, abrasive particle size, applied load, sliding speed, and sliding distance. It was found that the wear rate rises with increasing abrasive particle size, applied load, sliding speed, and distance, and that TiB2 particles are more effective in reducing wear rate than Al3Ti flakes. According to the desirability function methodology, Saleh et al. [31] used the response surface methodology to evaluate the wear rate of graded composites and observed that an effect of the increasing load had a much more significant influence on wear rate than a rise in other parameters. Conversely, Babu et al. [37] used grey relational analysis to optimize the main parameters during wear testing of centrifugally cast functionally graded aluminum composite reinforced with SiC particles and found that the radial distance and applied load had a significant effect on the wear resistance of the produced composites. Furthermore, the best design parameters were achieved at an applied load of 40 N, a sliding velocity of 3 m/s, and a radial distance of 15 mm. Recently, Yıldız and Sur [38] employed grey relational analysis to improve drilling parameters on thrust force and average surface roughness of graded composites manufactured using high-temperature isostatic pressing and powder metallurgy processes. It was reported that feed rate is the most essential factor contributing to thrust force and surface roughness. In addition to the previously mentioned types of reinforcement particles, a newly developed functionally graded composite material called functionally graded graphene nanoplatelets reinforced composite (FG-GPLRC) incorporates graphene as a reinforcement particle. This type of FGM is also referred to as a functionally graded reinforced graphene composite [39,40]. Recent studies have investigated the mechanical and thermal properties of FG-GPLRC, demonstrating that it possesses high strength, stiffness, and excellent thermal conductivity. The use of graphene as a reinforcement in FG-GPLRC has been found to enhance its mechanical and thermal properties, owing to graphene’s high surface area, strength, and electrical conductivity. These findings suggest that FG-GPLRC may have potential applications in various fields that require high-performance materials [41,42].
According to a review of the literature and recent works [43], some experimental work has been conducted, and optimization tools have been used to optimize the wear rate and coefficient of friction of graded composites using the Taguchi technique and response surface methodology. The lack of advanced optimization methods, such as grey relational analysis, which solves complex issues with multiple and conflicting responses, is one of these studies’ practical limitations. Moreover, due to the heterogeneous properties of the graded composites and the presence of reinforcements in the host matrix material, there is a lack of appropriate and adequate analytical models to evaluate the mechanical and wear response characteristics. Thus, the principal aim of this study was focused on multi-objective optimization in order to determine the effect of main parameters such as mold speed, pouring temperature, stirring speed, and radial distance on the mechanical and wear characteristics of the graded composites using grey relational analysis coupled with response surface methodology. The findings of the study reported in this paper will provide new suggestions to scholars and scientists to better understand the effect of main parameters on mechanical and wear responses for graded composites.

2. Materials and Methods

2.1. Raw Materials and Fabrication Method

The present study conducted experiments using commercially pure aluminum as a matrix to manufacture graded composites via a stirring and centrifugal casting method. Moreover, pure aluminum provides economic consideration to the cost of producing graded composites relative to Al alloys. The graded composites were strengthened by 10 wt.% of SiC particles with an average size of 16 μm due to their distinct properties, such as high hardness and wear resistance. In contrast to commercially pure aluminum with a density of 2700 kg/m3, the SiC particles had a density of 3200 kg/m3. The properties of used particles have terribly high hardness and high wear resistance; thus, adding ceramic particles to the pure Al matrix can significantly improve mechanical properties and wear performance. The combination of stirring and horizontal centrifugal casting was used to fabricate graded composites (with 230 mm outer diameter and 30 mm thickness) at various mold rotational speeds (800, 900, and 1000 rpm). The matrix material was melted in a graphite crucible at three different temperatures (700, 725, and 750 °C), while the used particles were simultaneously heated to 250 °C. The dried particles were added to the molten metal and stirred at 10 min for different stirring speeds (100, 150, and 200 rpm) before pouring into the machine feeder tube. The centrifugal casting machine used in the experiments is shown with more details in a previous publication [44].

2.2. Mechanical Tests

In this study, samples were taken from three different regions (at 1, 10, and 25 mm from the surface) of the thickness of the graded tube. The MRB-250 was used as a hardness testing machine for a 62.5 N load and a 5 mm steel ball indenter. The average of five hardness values was measured in order to obtain a consistent average value. In compliance with the ASTM E8 Standard [45], the tensile test samples were cut and prepared from the graded composites. A universal testing machine (Model: UTM4294X) was used to conduct tensile testing on the graded composites in separate zones (outer, middle, and inner) to track reinforcement particle distribution. Tensile testing was carried out with a strain rate of 5 × 10⁻⁴ s−1 at room temperature. Four tensile samples were examined in each zone to obtain a credible average value.

2.3. Wear Test

The pin-on-disk type machine (TR20, DUCOM) was utilized for dry sliding wear testing to evaluate the wear rate of manufactured graded composites in accordance with the ASTM: G99-05 standard [46]. The spinning disk EN31 hardened steel (63 HRC) was used to test the wear specimens with dimensions of 10 × 10 × 2 mm3. The wear studies were carried out at room temperature using constant wear testing parameters such as an applied load of 30 N, sliding speeds of 200 rpm, a sliding distance of 1000 m, and a sliding time of 5 min. Prior to the wear test, the specimens were cleaned and dried with cloth and acetone after being polished with emery papers. At the end of each wear test, the specimens were thoroughly cleaned with alcohol and weighed up to 0.0001 g with an accurate digital balance. All wear tests were repeated three times for a credible average mass loss result to evaluate the wear rate of specimens. Wear rate was calculated using the expression wear rate (in mm3/m) = (Dm/ρL), where Dm, ρ, and L are the mass loss from the specimen, density of the composite, and sliding distance, respectively.

2.4. Design of Experiments

To optimize the properties of FGMs, the optimal distribution of the constituent materials along the thickness of the material must be determined. Response surface methodology (RSM) is a statistical tool for optimizing the properties of FGMs. RSM employs mathematical models to describe the relationship between input variables and response variables of interest. The models can then be used to predict response variables for various input factor combinations [47,48,49]. In regard to FGMs, RSM can be used to optimize material properties by determining the optimal distribution of constituent materials along the material’s thickness. The main parameters of the manufacturing method would be the input factors in this case, and the response variables would be the material’s mechanical, thermal, or electrical properties. RSM can be used to determine the distribution of constituent materials that will result in the desired FGM properties. Design of experiments (DOE), building mathematical models, optimization, and validation are essential steps of the RSM model, as shown in Figure 1a [50].
In the current study, the DOE was conducted via the Minitab 19 statistical software based on RSM. The independent parameters under consideration were rotational speed, pouring temperature, stirring speed, and radial distance to determine the optimum values of main parameters on the properties of the graded composites. Four production parameters were selected with three levels, as summarized in Table 1. Twenty-five experimental runs were produced for the chosen four parameters, as shown in Table 2. Polynomial equations were created to account for the measured responses (hardness, tensile strength, and wear rate) as a function of the input parameters with six coefficients. The mathematical model was formulated as follows (Equation (1)) [51,52]:
Y = α 0 + α 1 x 1 + α 2 x 2 + α 3 x 1 2 + α 4 x 2 2 + α 5 x 1 x 2
where Y is the estimated response; x 1 and x 2 are main parameters; α o is the intercept coefficient; α 1 : α 5 are the regression coefficients; x 1 2 , x 2 2 is the quadratic effect; and x 1 x 2 is the interaction effect.

2.5. Grey Relational Analysis

Grey relational analysis (GRA) is a mathematical method that can be used to evaluate the degree of correlation between two or more variables. GRA has been used in many fields, including engineering, economics, and management, to solve complex problems and optimize systems. In the context of FGMs, GRA can be used to optimize the properties of the material by determining the optimal distribution of the constituent materials along the thickness of the material [53,54]. Functionally graded composites are materials that have varying properties and composition along their length or thickness, which can result in improved performance and functionality [55,56]. The GRA method involves comparing the performance of different main parameters against a set of criteria or objectives, such as mechanical properties or cost [57,58]. The method uses grey relational coefficients to quantify the degree of relationship between the main parameters and the criteria, which can then be used to identify the optimal combination of parameters. In general, the optimization process using GRA entails many steps, such as identifying the input and output variables, normalizing the data, constructing the grey relational coefficient matrix, determining the grey relational grade, and determining the optimal input variables, as illustrated in Figure 1b. In this study, GRA was utilized to convert multi-objective responses (Vicker hardness, tensile strength, and wear rate) into a single objective response through obtaining the grey relational grade (GRG). Moreover, GRG is favorably defined as an indicator of multiple performance properties for mechanical and wear evaluation of the graded composites [59]. Empirical models were developed using regression analysis to anticipate the nonlinear relationship between responses (such as hardness, tensile strength, wear rate, and GRG) and main parameters (such as mold speed, pouring temperature, stirring speed, and radial distance). Optimized main factors were employed in the confirmation tests to verify the created models. The following steps were used to convert a multi-answer optimization issue into a single response problem [60,61]:
Step 1: The experimental data were first normalized from 0 to 1 using Equations (2) and (3).
According to higher-the-better,
x i j = y i j min ( y i j ) max ( y i j ) min ( y i j )
According to lower-the-better,
x i j = max ( y i j ) y i j max ( y i j ) min ( y i j )
where y i j are original data for a response j of experiment i ; x i j is the sequence after data pre-processing; max ( y i j ) is the largest value of y i j ; and min ( y i j ) is the smallest value of y i j .
Step 2: On the basis of normalized experimental data, the grey relational coefficient was computed (4).
γ ( x 0 j , x i j ) = Δ min + ζ Δ max Δ i j + ζ Δ max
where γ ( x 0 j , x i j ) is the grey relational coefficient between x i j and x 0 j , Δ min is the smallest value of Δ i j , Δ max is the largest value of Δ i j , and ζ is the distinguishing coefficient. Usually, the value of ζ is taken as 0.5.
Step 3: The overall GRG was calculated by averaging the grey relational coefficients for each chosen response using (5). The parameter combination with the highest grey relational grade (Rank 1) is known to be closer to the best parametric setup.
C R G ( x 0 , x i ) = j = 1 n w j γ ( x 0 j , x i j )
where C R G ( x 0 , x i ) is the grey relational grade between comparability sequence x i and reference sequence x 0 . The weight of response j is w j and usually depends on the decision makers’ judgement. Figure 2 depicts a schematic diagram of the methodology used in this study.

3. Results and Discussion

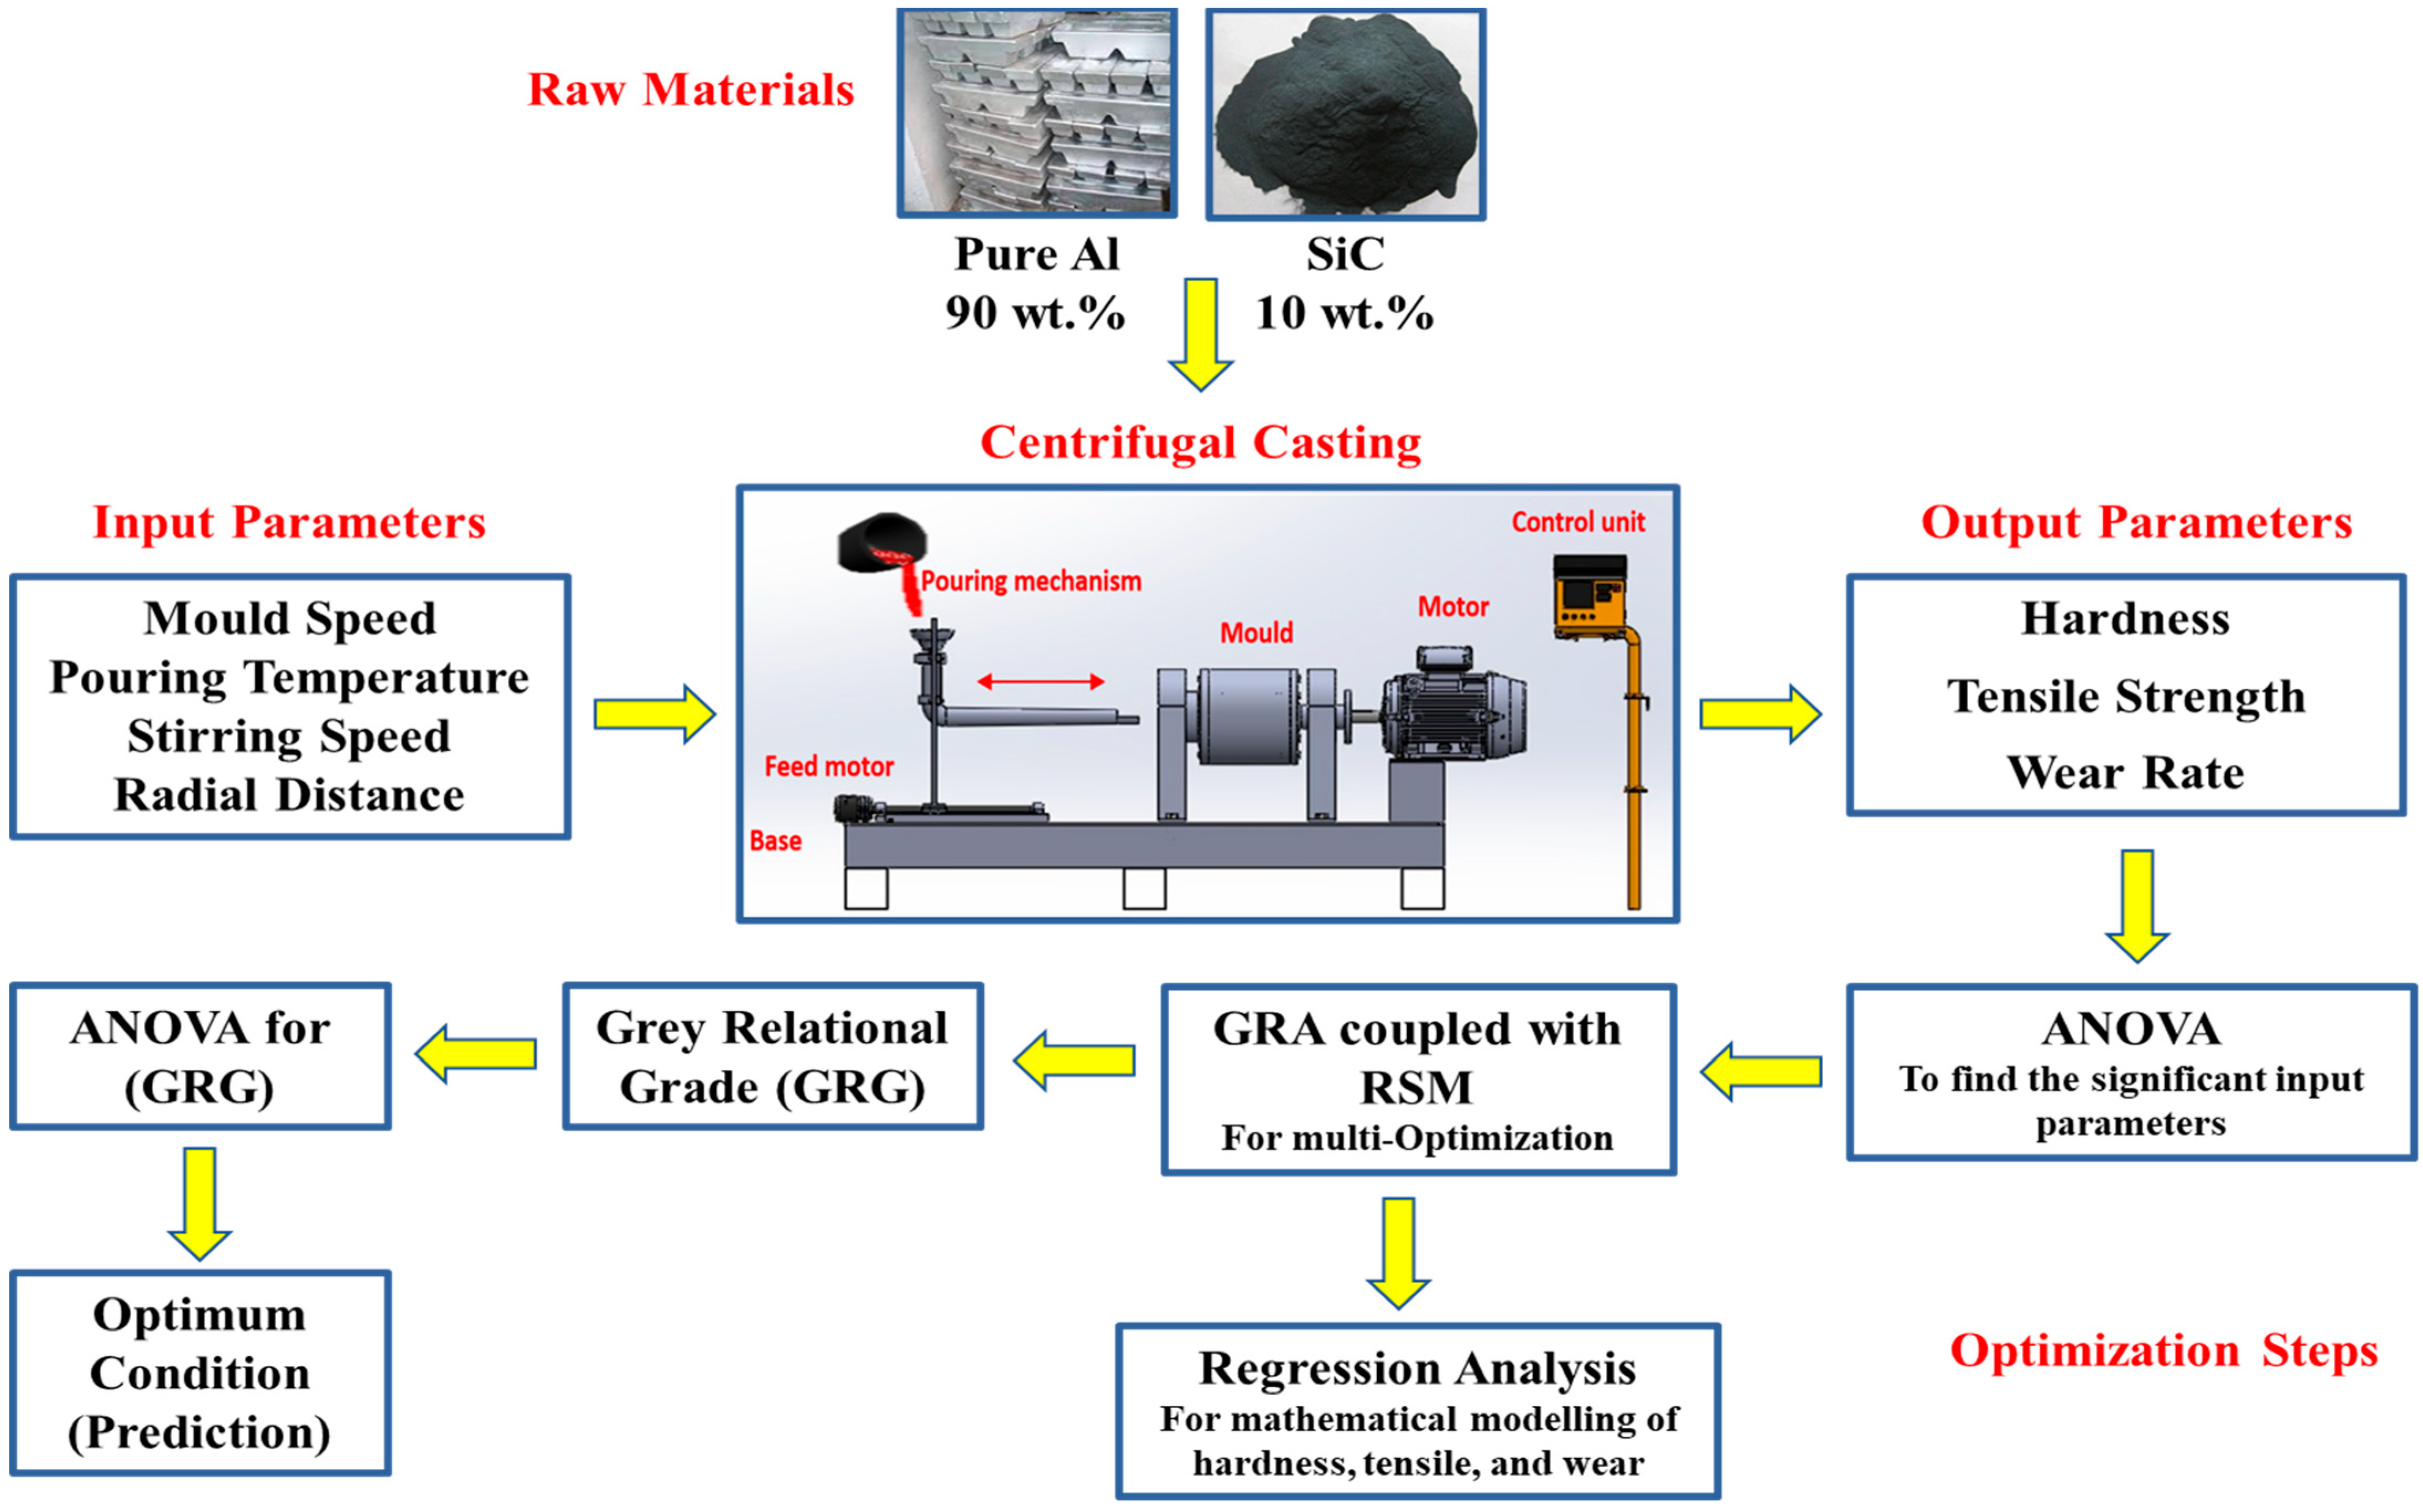
3.1. Regression Analysis

Minitab statistical software version 19 was used to create the RSM models for hardness, tensile strength, and wear rate. Table 2 displays the experimental results of four parameters (mold speed, pouring temperature, stirring speed, and radial distance) with their levels for three output responses of characteristics of graded composites. Table 3, Table 4 and Table 5 show the values of R2 and adjusted R2 for models, and these values were found to be closest to each other, indicating that the developed full-quadratic models were accurate in linking the responses to the parameters. Furthermore, the R2 was in close approximation with the adjusted R2, with a discrepancy of less than 0.3 in all cases. The effect of output responses on achieving optimal values for main factors and assessing the competency of the present models was examined through analysis of variance (ANOVA), as shown in Table 3, Table 4 and Table 5.
Multiple regression models were developed at a 95% confidence level for both responses such as hardness, tensile strength, and wear rate using mold speed (A), pouring temperature (B), stirring speed (C), and radial distance (D) as input parameters. The regression coefficients produced from the significance tests were utilized to build the empirical models, as illustrated in the equations below (6–8). The developed models demonstrate that the linear term, square term, and interaction term all had an effect on the responses of graded composites in this study. For instance, for all graded composites, the main effects of mold speed (A), pouring temperature (B), and radial distance (D); interaction effects of pouring temperature and radial distance (BD) and of stirring speed and radial distance (CD); and quadratic effects of stirring speed (C2) and radial distance (D2) were observed as significant for hardness, tensile strength, and wear rate.
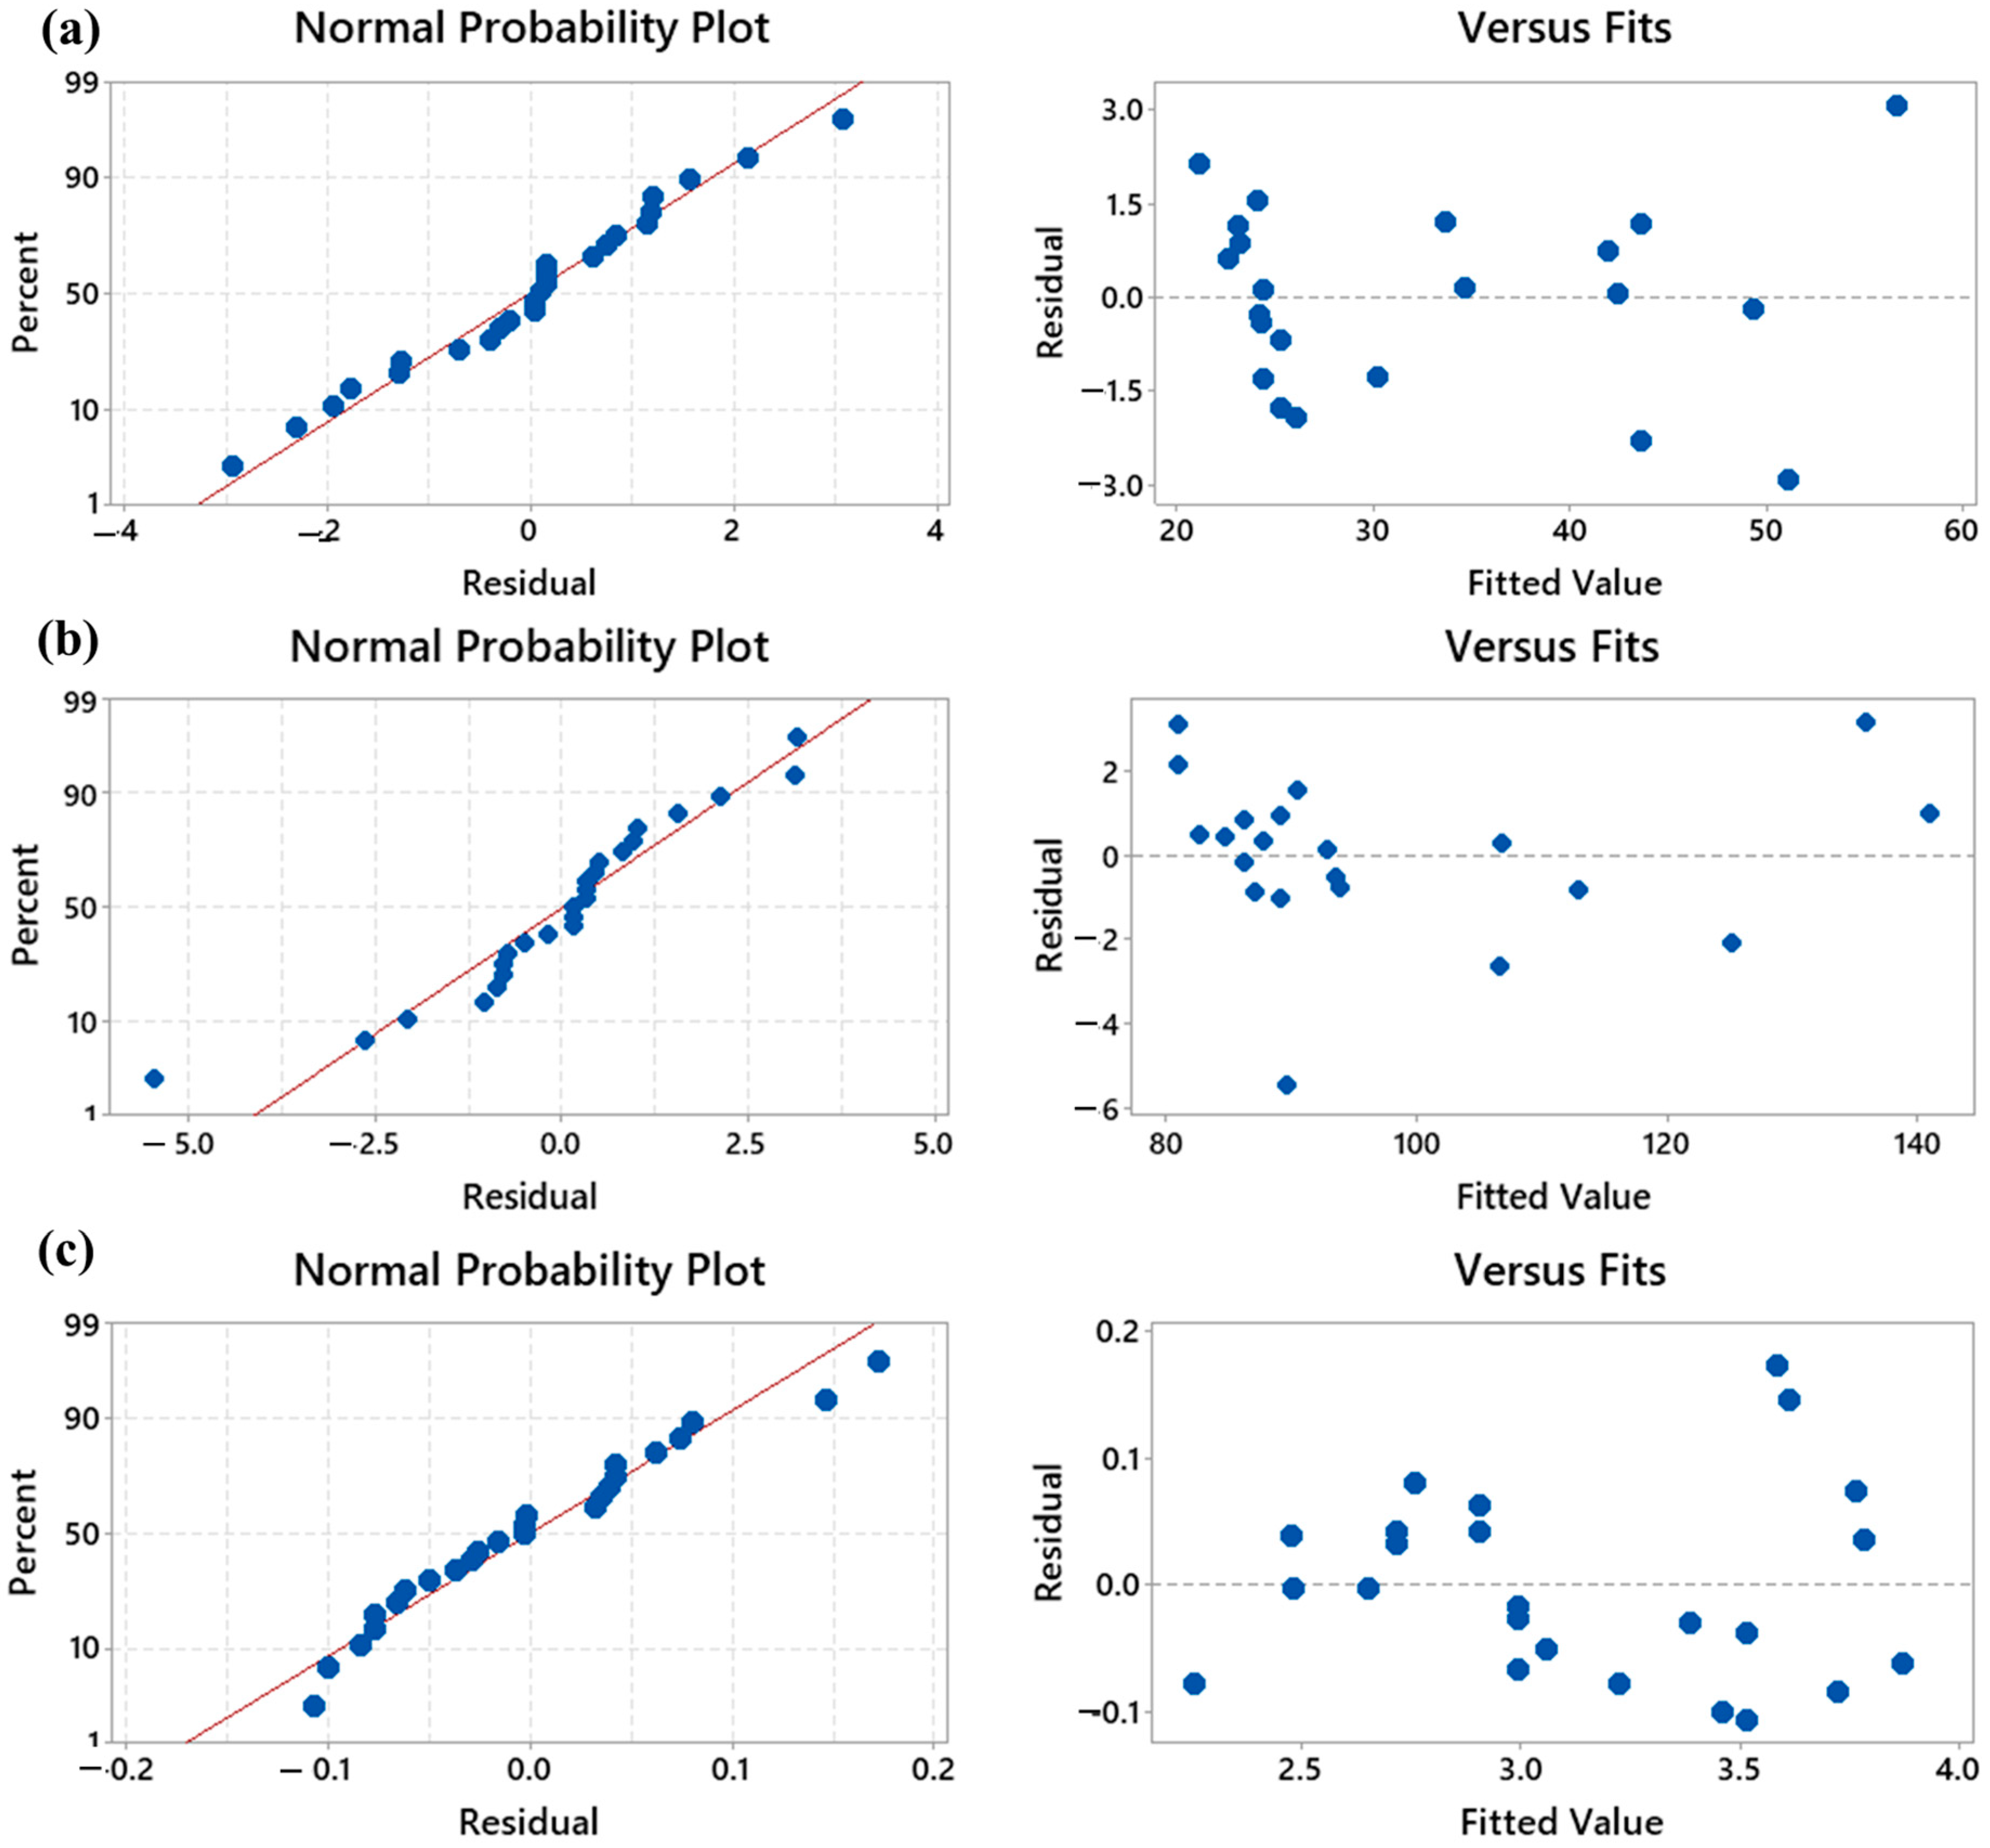
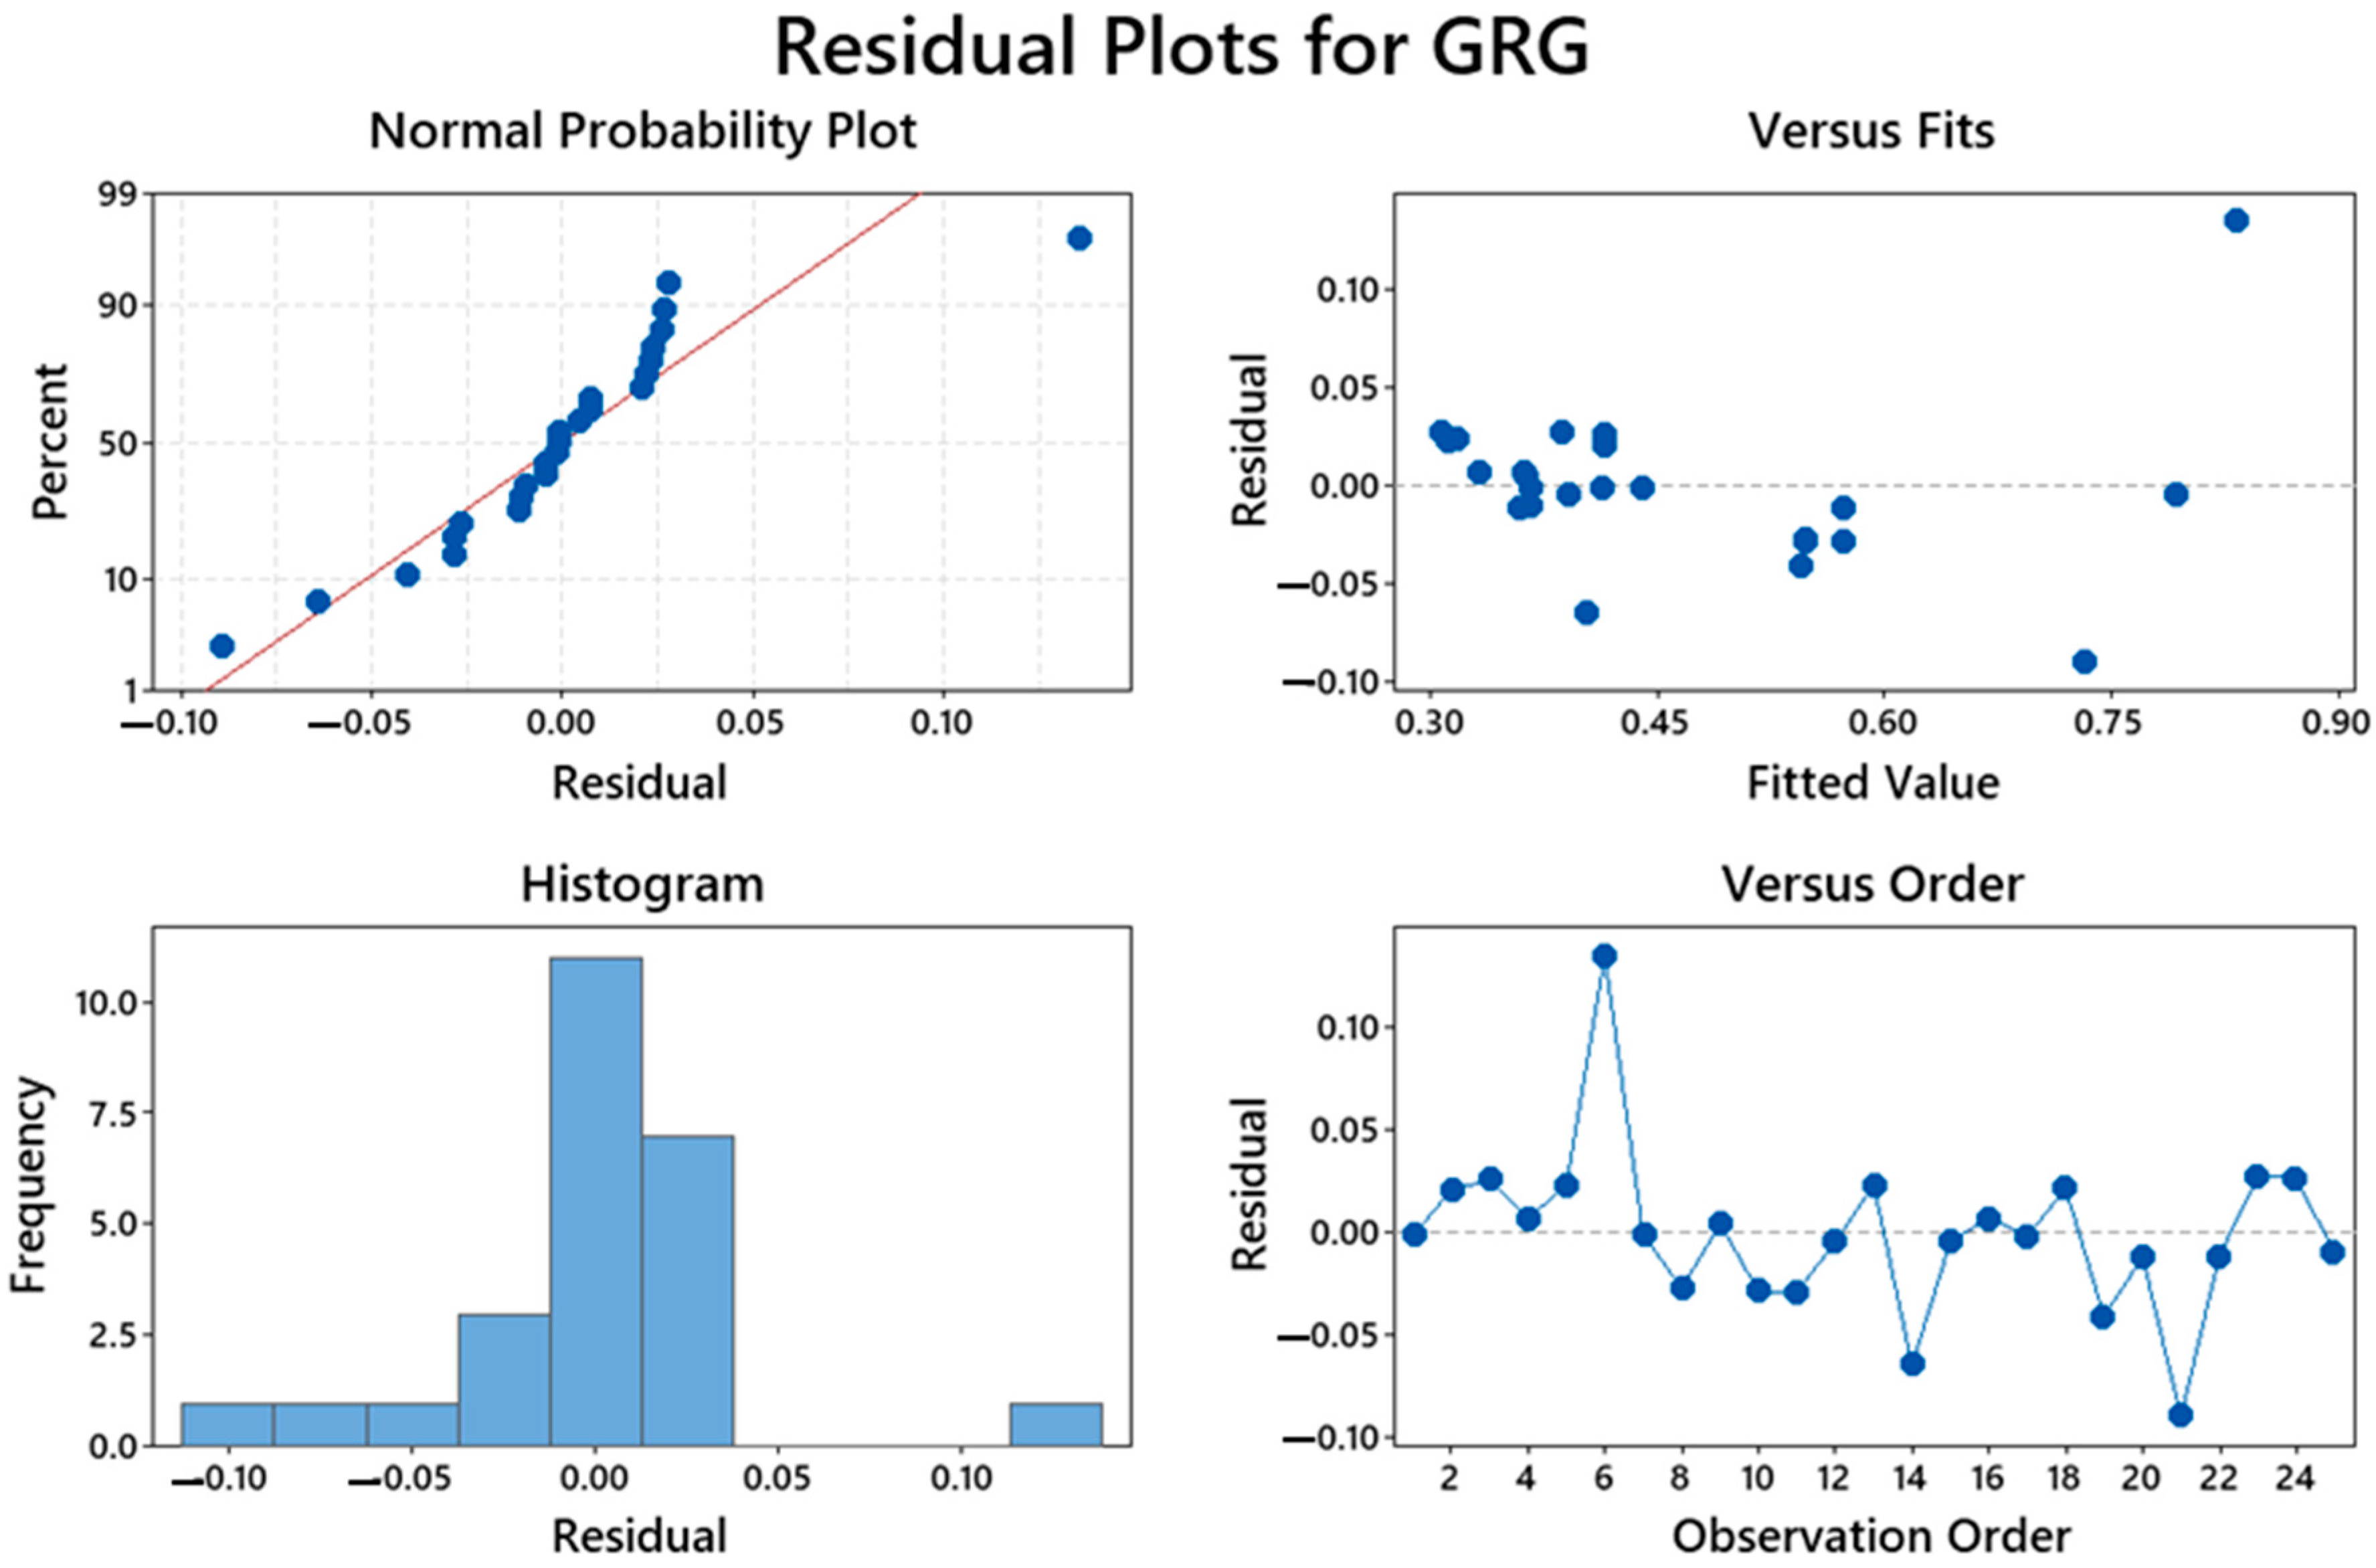
When the measured values of variables in Equations (6)–(8) were substituted, responses (hardness, tensile strength, and wear rate) of the graded composites formed by the centrifugal casting method were able to be computed within the range of factors investigated. The normal probability plot of the residuals, given in Figure 3, was used to assess the adequacy of the regression equations. The points were extremely close to the normal probability line, indicating that the models were sufficient. The results also revealed that the residuals were consistent with the premise that errors were normally distributed and lacked a particular structure that is distinctive. Furthermore, Figure 3 shows the normal plot of residuals for the quadratic models of responses for the graded composites, with all residuals aligned along the inclined line. It signifies that all the experimental data points were within the range of all experimental values, confirming ANOVA’s normal distribution. As a result, the models created for predicting the properties of graded composites were adequate.
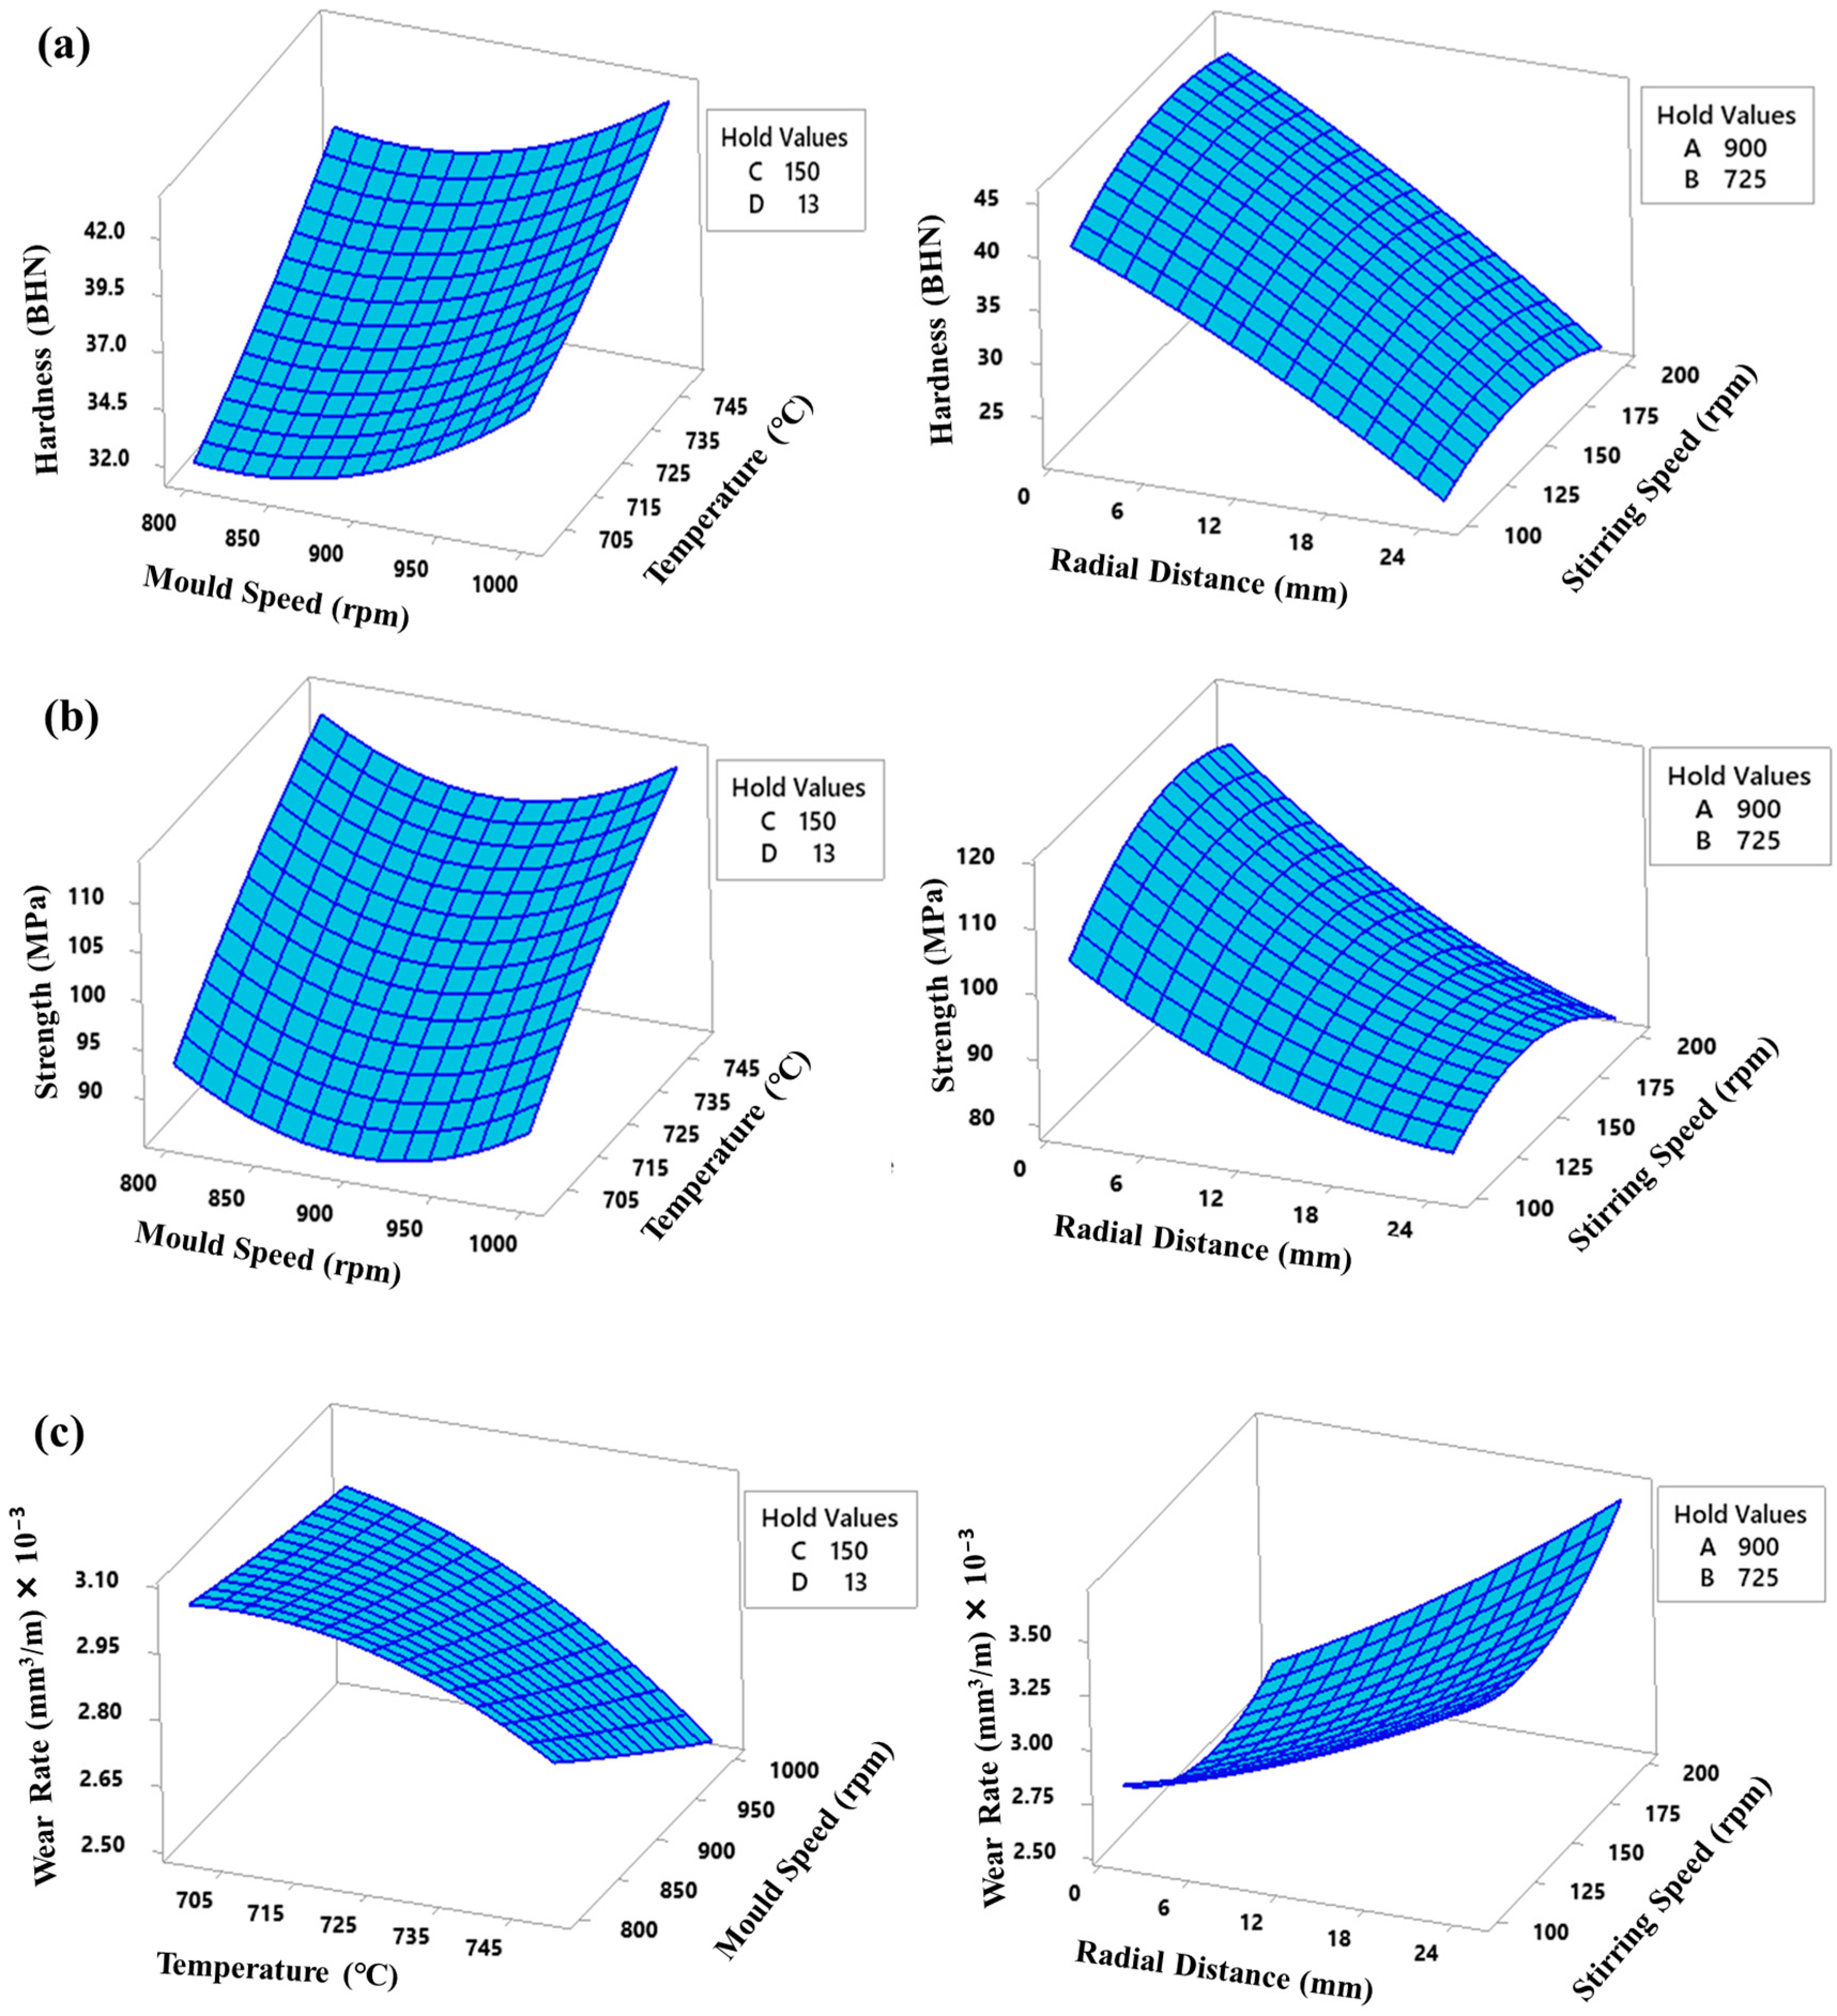
Figure 4 shows three-dimensional (3D) surface plots of hardness, tensile strength, and wear rate depending on the speed of rotation, pouring temperature, and stirring speed at radial distances (1, 10, and 25 mm). In the surface plots, the hardness, tensile strength, and wear resistance increased as the interaction between rotation speed and the pouring temperature increased. Moreover, in the outer zone (1 mm from the outer surface), the interaction between the main parameters became higher by the centrifugal force, leading to the increased mechanical properties and wear resistance of the graded composites. Throughout a centrifugal casting, denser particles (SiC) move to the external surface of the graded composite, while lighter particles (pure Al) drop within the spinning axis. This is mostly due to the centrifugal force governing particle and molten metal mobility; the high density leads ceramic particles to push away from the rotating axis and form the particle-enriched outer region, and other investigations reported a similar observation of results [20,62]. Moreover, improved properties of the produced composites are primarily due to the extreme existence of particles at the outer region with a smoother distribution due to centrifugal force. Compared to the properties at the inner zone (25 mm from the outer surface), the middle zone (10 mm from the outer surface) was sufficiently high, and there was no perceivable augmentation in properties with increasing main parameters in this zone. This observation has been reported by other researchers [63,64]. Furthermore, Figure 4 demonstrates a considerable rise in characteristics at high mold speed (1500 rpm) and pouring temperature (750 °C) in the outer zone, and the influence of radial distance was considerably more obvious at lower levels (1 mm from the outer surface) compared to stirring speed, which had a greater influence at middle levels (150 rpm).
H a r d n e s s ( B H N ) = 352 0.181 A 0.87 B + 7.39 D + 0.000165 A 2 0.001058 C 2 0.00716 D 2 0.00899 B × D 0.00153 C × D
T e n s i l e S t r e n g t h ( M P a ) = 1083 1.226 A + 3.84 B + 17.45 D + 0.000593 A 2 0.002706 C 2 + 0.0290 D 2 0.02864 B × D 0.00528 C × D
W e a r R a t e ( m m 3 / m ) = 65.6 + 0.0132 A + 0.184 B + 0.160 D + 3.9 × 10 7 A 2 + 0.000074 C 2 + 0.000398 D 2 0.000176 B × D + 0.000166 C × D
where A is the mold speed (rpm), B is the pouring temperature (°C), C is the stirring speed (rpm), and D is the radial distance from the outer surface of the graded composite (mm).

3.2. Grey Relational Grade Evaluation

Table 6 shows the normalized values, deviation coefficients, grey relational coefficients, GRG, and rank obtained from the previous Equations (2)–(5) in order to acquire the best combination of main parameters to achieve the best properties such as hardness, tensile strength, and wear resistance for the produced composites. If the normalized value generated from the data pre-processing procedure is equal to or close to 1 for any response at any experiment, the performance of this experiment is considered to be the best for this response [60]. Moreover, Table 6 displays that the highest GRG was of the order of 1. The closest optimum controllable parameter combination was experiment number 6, highlighted in gray: mold speed of 1000 rpm (level 3), pouring temperature of 750 °C (level 3), stirring speed of 150 rpm (level 2), and radial distance of 1 mm (level 1) from the outer surface of the produced composites.
Table 6 was used to determine the means of the grey relational grade for each level of configurable parameters, which are summarized in Table 7. The higher the grey relational grade, which is shown in bold in Table 7, the better the numerous performance attributes. As a result, the ideal main parameters were computed as Level 3 for mold speed, Level 3 for pouring temperature, Level 2 for stirring parameters, and Level 1 for the radial distance, as shown in Table 7.
Further validation for optimal values of process conditions was performed by studying the relationship between the main effects of main parameters and GRG results, as shown in Figure 5. According to the plot, the peak value at each level reflects the best possible result for GRG. Thus, the ideal combination of parameters to optimize the GRG was found to be 1000 rpm, 750 °C, 150 rpm, and 1 mm for the mold speed, pouring temperature, stirring speed, and the radial distance, respectively, as confirmed by the response table for the grey relational grades provided in Table 7. A similar trend of these results was obtained by another study [31].

3.3. Analysis of Variance for Grey Relational Grade

In this study, ANOVA was used to determine the statistical significance of output parameters to achieve the optimal values for main parameters and check the competency of the current GRG model. This was conducted by separating the entire variability of the GRG (calculated as the sum of the squared deviations from the total mean of the GRG into contributions through each controllable parameter). In order to assess the importance of the controllable change in the performance characteristic, the percentages of each parameter in the total sum of squared deviations were employed. 
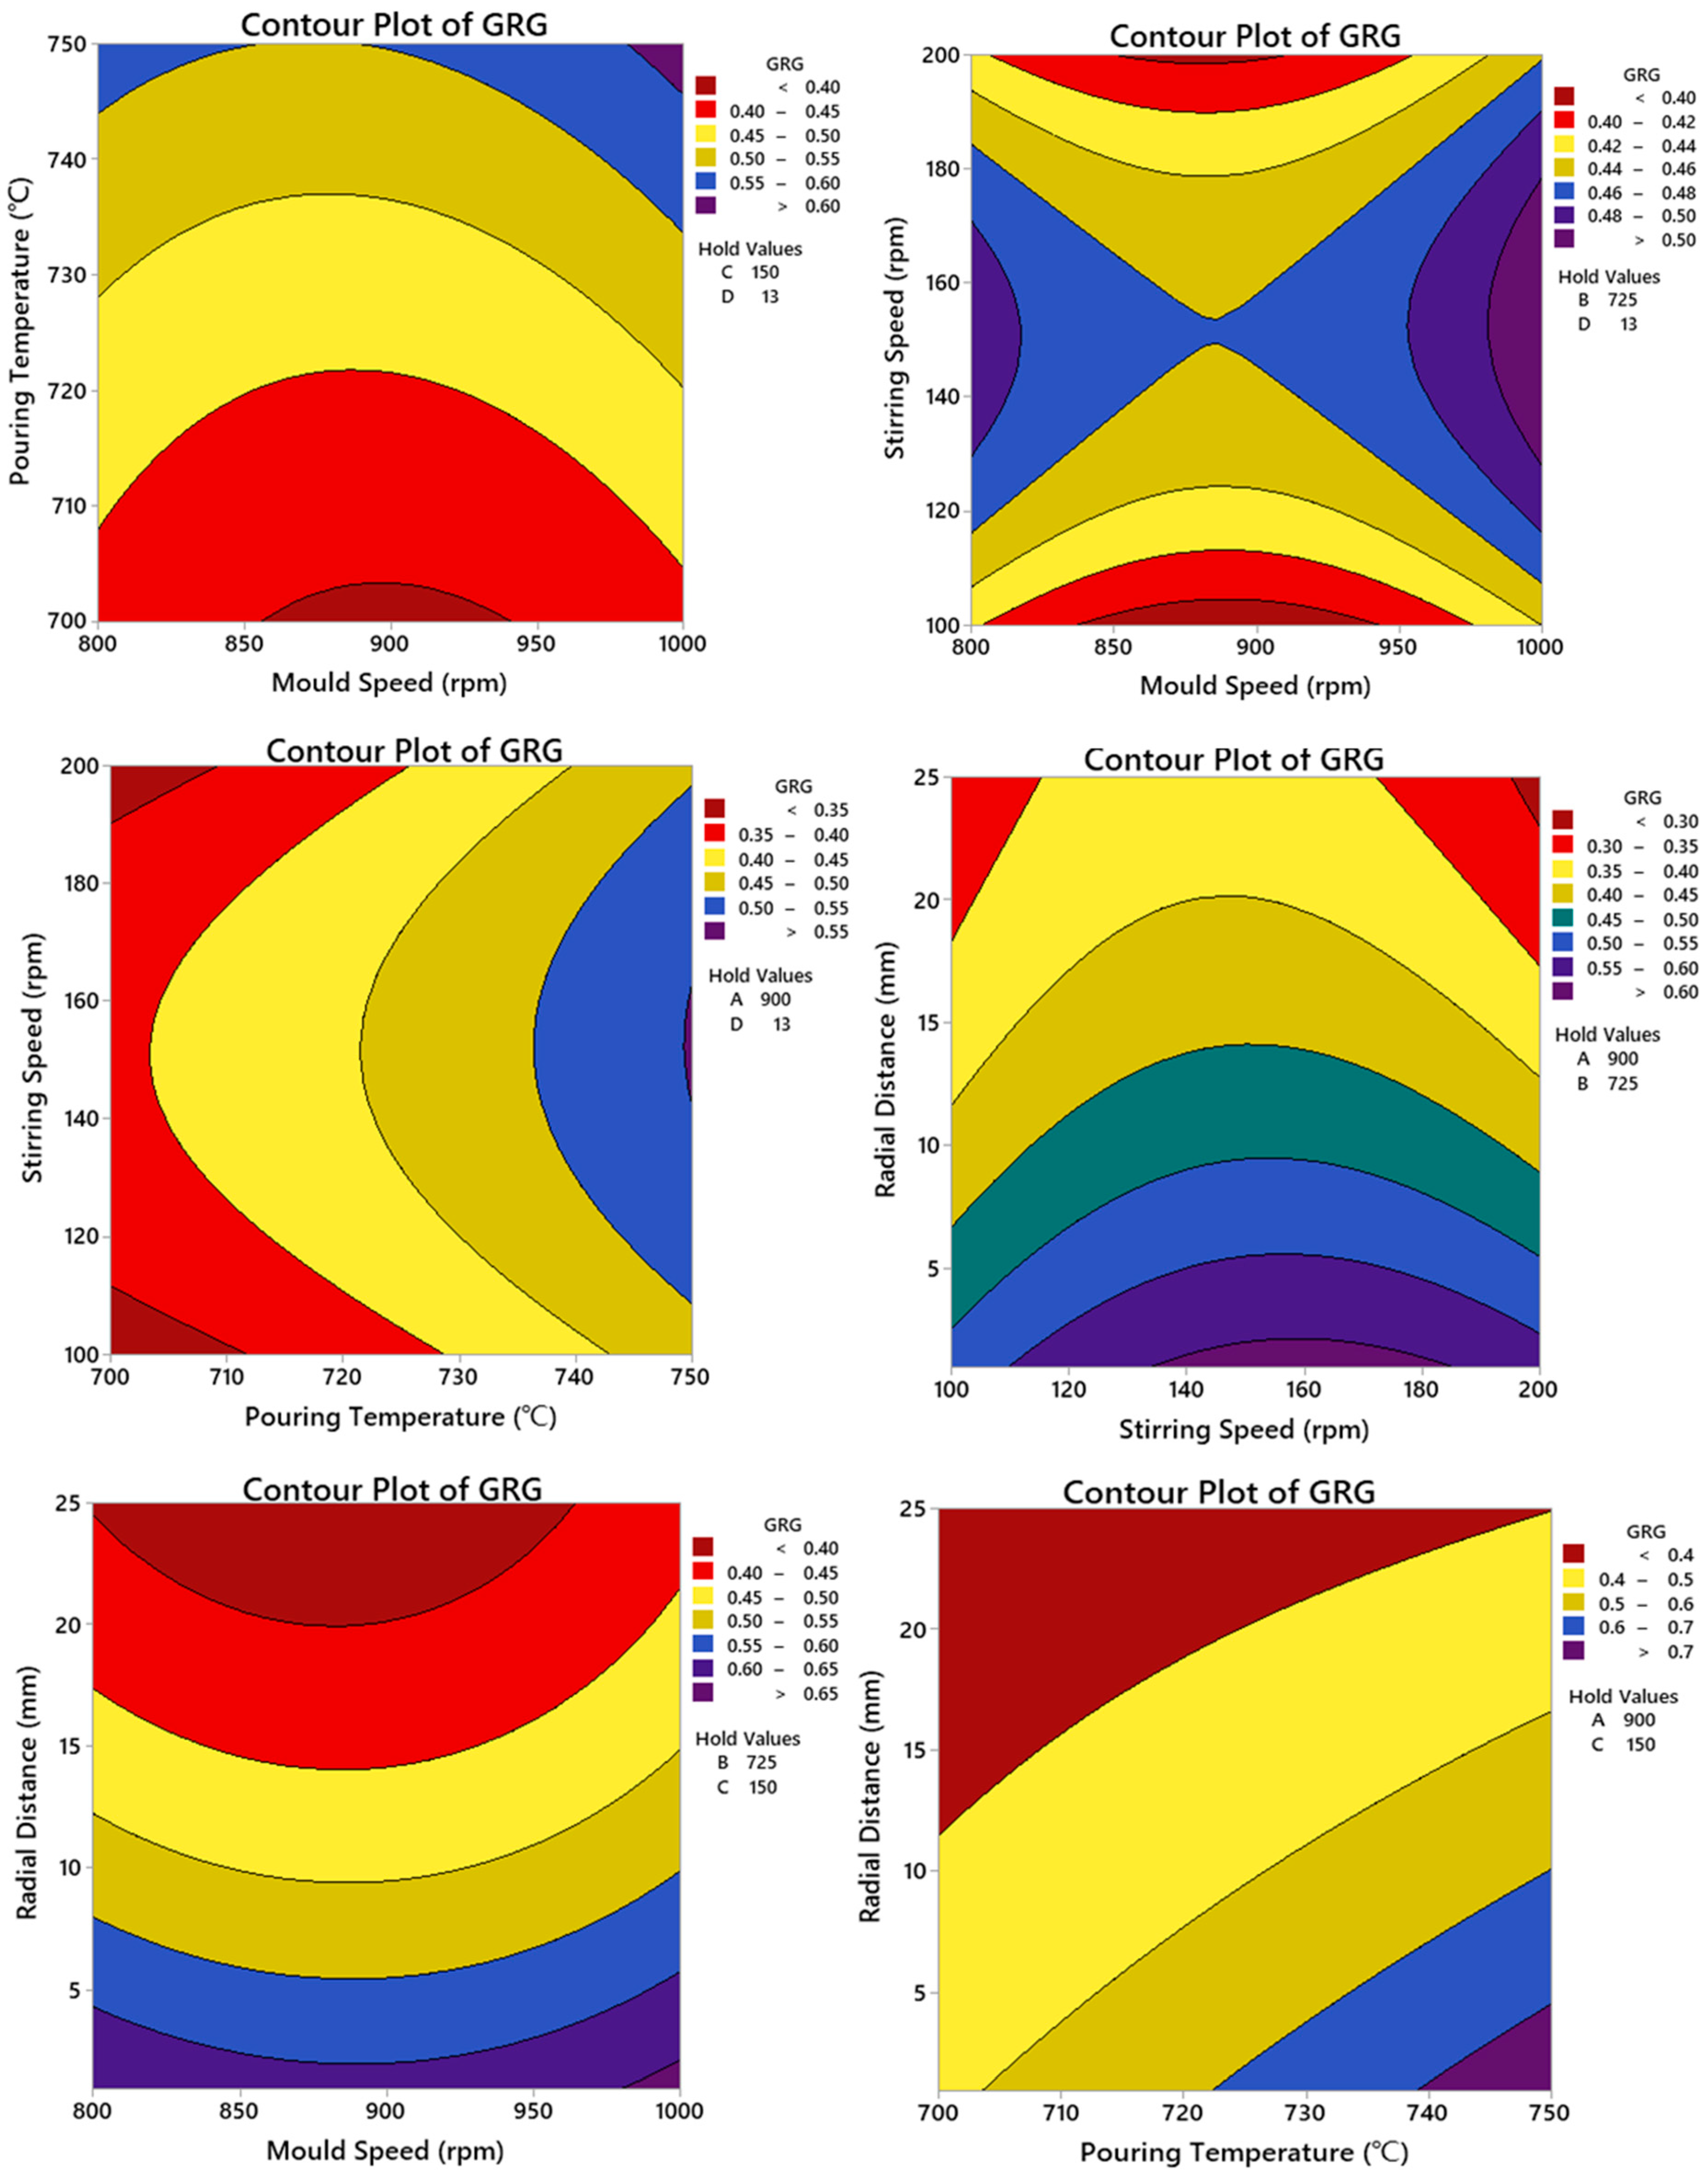
Table 8 presents the results of ANOVA for the GRG values with the percentage of contributions for the main parameters. In addition, the ANOVA table indicates the effect of each parameter on GRG performance. Similar to the ranking, the parameter with the greatest effect on the properties of the generated composites was D, with a contribution of 25.24%, followed by parameters B, A, and C, with contributions of 8.012%, 0.265%, and 0.053%, respectively. On the basis of these analyses, it was observed that the radial distance between the outer and inner surfaces was critical in determining the properties of the produced composites due to the heterogeneous distribution of particles within the matrix. The grey-theory-calculated GRG was used as a quality representative of all the responses, which were then analyzed using surface plots. The effect of various parameters on hardness and tensile strength (represented by GRG in the produced composites) was investigated using 2D contour plots created with Minitab 19 software. The effect of the main parameters such as mold speed, pouring temperature, stirring speed, and radial distance in the produced composites is depicted in Figure 6. It shows that increasing the mold speed and pouring temperature raised the GRG. This was because increases in these parameters increased hardness, tensile strength, and wear resistance of all composites produced. Furthermore, Figure 6 depicts nonlinear growing contour lines, indicating that the variation in GRG is a nonlinear relationship between the main parameters.
Figure 7 depicts the GRG residual pots, including the normal probability plot, which provides strong evidence that the GRG model is adequate; the points were very close to the normal probability line. The results also show that the residuals were consistent with the assumption that errors are normally distributed. Thus, it means that all the model data points were within the range of all experimental values, which certifies the normal distribution of ANOVA. Therefore, the GRG model developed for the properties prediction for the produced composites is appropriate.
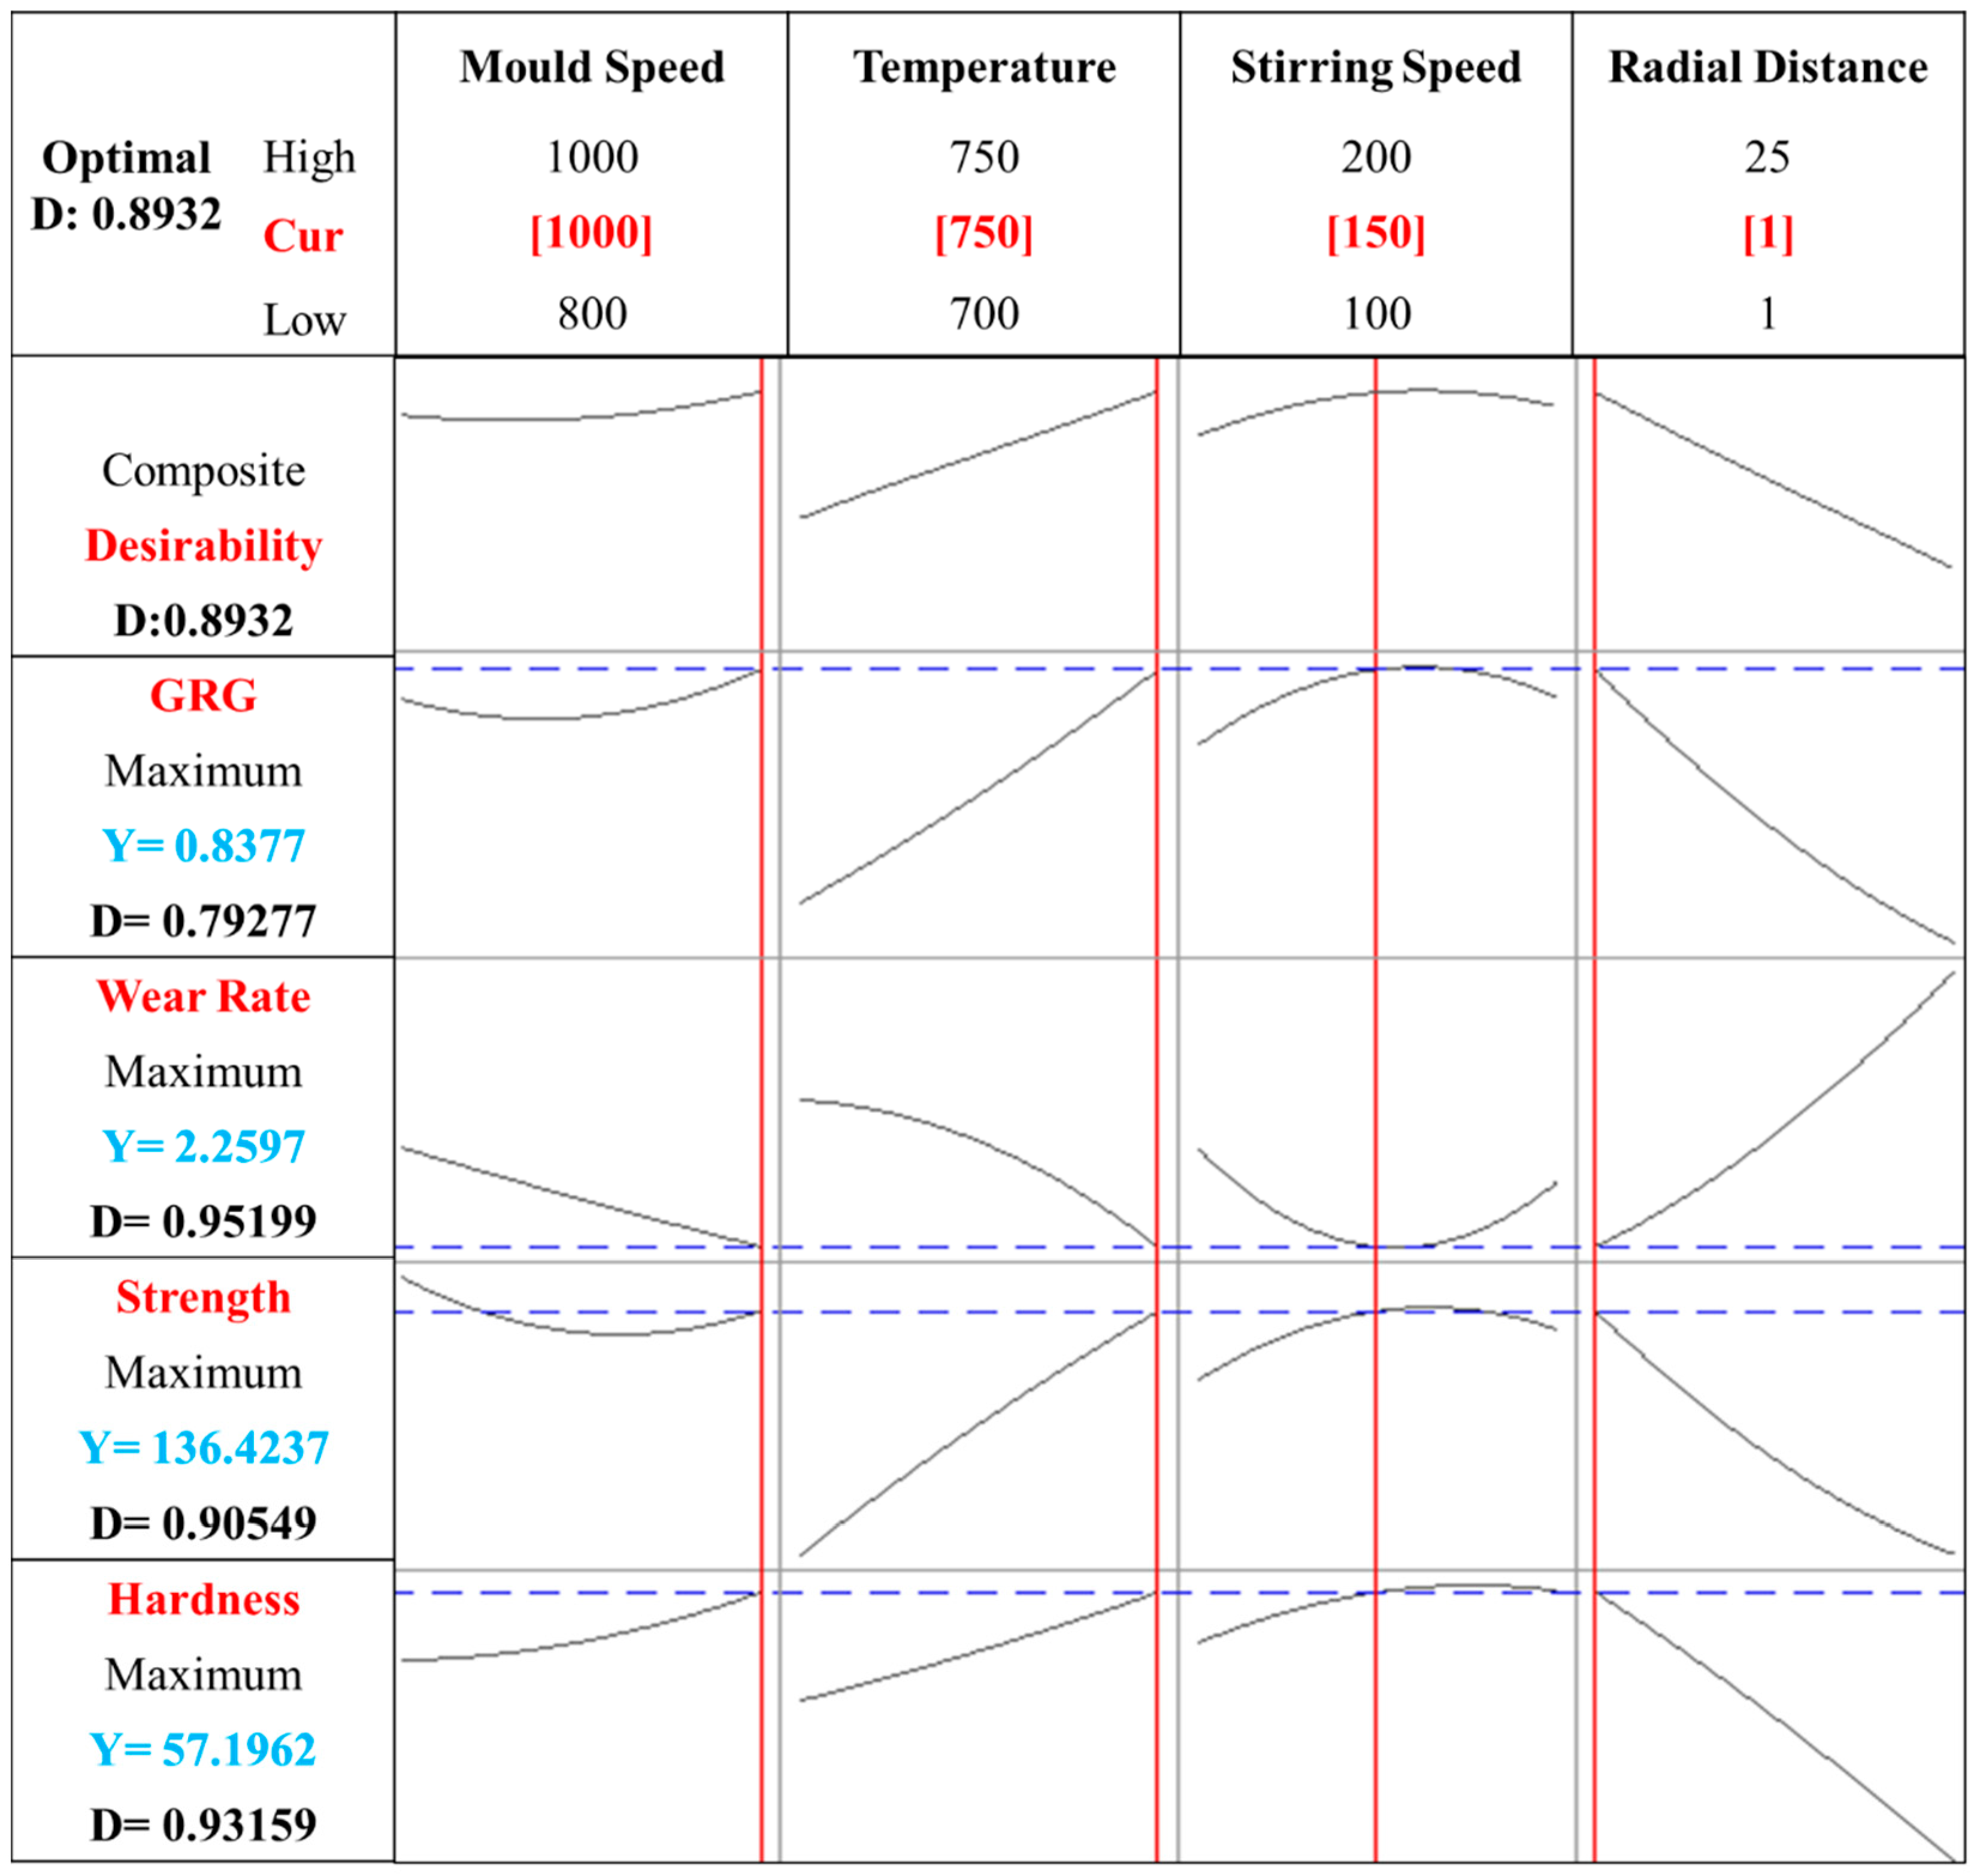
This study aimed to find the best combination of main parameters for producing composites with the highest hardness, tensile strength, and wear resistance. Minitab 19 was used for response surface optimization to achieve this desired goal, and the results are shown in Figure 8. A mold speed of 1000 rpm, a pouring temperature of 750 °C, a stirring speed of 150 rpm, and a radial distance of 1 mm were found to be the best combination. These values of optimal main parameters are one of a hundred suggestions derived by regression models to achieve the best properties of the produced composites; thus, depending on the nature of the application, any range of these suggestions can be used to create a combination of experimental parameters. Figure 8 also shows the desirability values of the optimum conditions of the key parameters. Desirability is an objective function that ranges from zero outside the border to one at the target and is very significant in choosing the aim. The desirability values for hardness, tensile strength, wear rate, and GRG were 0.91585, 0.89555, 0.95377, and 0.78684, respectively, with a total value of 0.8857 for the established grey relational analysis model in order to set the optimum experimental parameters to maximize the mechanical properties and wear resistance (which obtains at desirability = 1).

3.4. Confirmation Experiment

The confirmation experiment is an essential step in the GRA process as it verifies the improvement of the performance characteristic using the optimal level of main parameters selected from the previous analysis. Once the optimal level of the main parameters has been determined, it is crucial to conduct confirmatory tests to verify the predicted improvement in the performance characteristic. This step is critical to ensure that the optimal level of main parameters is indeed the best choice for improving the performance characteristic and to validate the reliability of the GRA results. The confirmation experiment involves conducting tests using the selected optimal level of main parameters and comparing the results with the predicted values obtained from the GRA analysis. The results of the confirmation experiment help to establish the effectiveness of the GRA approach in identifying the optimal level of main parameters for improving the performance characteristic. In summary, the confirmation experiment is a crucial step in the GRA process as it validates the results obtained from the analysis and ensures that the selected optimal level of main parameters is the best option for improving the performance characteristic. The equation for confirmation experiments can be expressed as below [60,65]:
γ p r e d i c t e d = γ t + j = 1 n γ i γ t
where γ t is the total mean of the grey relational grade; γ i is the mean of grey relational grade at the optimum level of significant factors A, B, C, and D; and ‘n’ is the number of significant main parameters that affect the quality characteristics. The best input main parameter combination was A3B3C2D1, and the computed grey relational grade by (9) was 0.919. The error percentage was calculated by comparing the values generated by the GRG model and the experimental result, and the error was found to be less than 6%, indicating that the GRG-built model is adequate in relating the major parameters with the response and effectively predicts the GRG of the produced composites in any set of parameters without conducting actual experiments. Additionally, the results of the confirmation experiment using the optimal main parameters are shown in Table 9. Brinell hardness increased from 34.8 to 59.7 BHN, tensile strength increased from 93 to 142 MPa, and wear rate decreased from 2.95 × 10⁻³ to 2.18 × 10⁻³ mm3/m. It should be noted that grey relational analysis significantly improved the experimental value of hardness, tensile strength, and wear resistance of the graded composites.
In conclusion, the response surface methodology—grey relational analysis (RSM-GRA) employed in this study is a popular method for optimizing complex systems with multiple objectives. When comparing RSM-GRA to other methods, there are several advantages and disadvantages to consider. One of the main advantages of RSM-GRA is that it can provide more accurate prediction models for the response surface of the system being optimized. This is because RSM-GRA is more flexible compared to other theories such as Taguchi—grey relational analysis (Taguchi-GRA) in accommodating various types of response surfaces and models. Additionally, RSM-GRA can handle a larger number of design variables and response variables than Taguchi-GRA, making it suitable for more complex problems. RSM-GRA can also provide a more detailed understanding of the relationship between design variables and response variables, making it easier to identify and quantify the impact of each variable on the system performance. However, there are also some drawbacks to using RSM-GRA. One of the main disadvantages is that it requires a larger number of experiments than Taguchi-GRA to construct the response surface models, which can be time consuming and expensive. RSM-GRA also assumes that the response surface is smooth and continuous, which may not always be the case in real-world systems with complex interactions and nonlinearities. Finally, RSM-GRA can be sensitive to outliers and noise in the experimental data, which can affect the accuracy of the response surface models. Overall, while RSM-GRA has some clear advantages over Taguchi-GRA in terms of accuracy, flexibility, and detail, it also has some important limitations that need to be considered when choosing an optimization method.

3.5. Experimental Results of Optimal Main Parameters

The experimental results of the optimal main parameters are critical to determine the effectiveness of the GRA approach in identifying the best combination of main parameters for producing the graded composite. This section presents the experimental results of the graded composite at different locations from the outer surface to the inner surface within the thickness. By examining the results from different locations, it is possible to gain a better understanding of the effect of the optimal main parameters on the properties of the graded composite. The optimal main parameters, which were determined using the GRA approach, were a mold speed of 1000 rpm, pouring temperature of 750 °C, and stirring speed of 150 rpm. By comparing the experimental results with the predicted values obtained from the GRA analysis, it is possible to validate the effectiveness of the GRA approach in identifying the optimal main parameters. The experimental results will also provide valuable insights into the properties of the graded composite, such as its mechanical properties, wear resistance, and microstructure. This information is crucial for understanding the performance of the graded composite and for optimizing its production process. In summary, the experimental results of the optimal main parameters play a crucial role in validating the effectiveness of the GRA approach and in providing insights into the properties of the graded composite. Thence, 
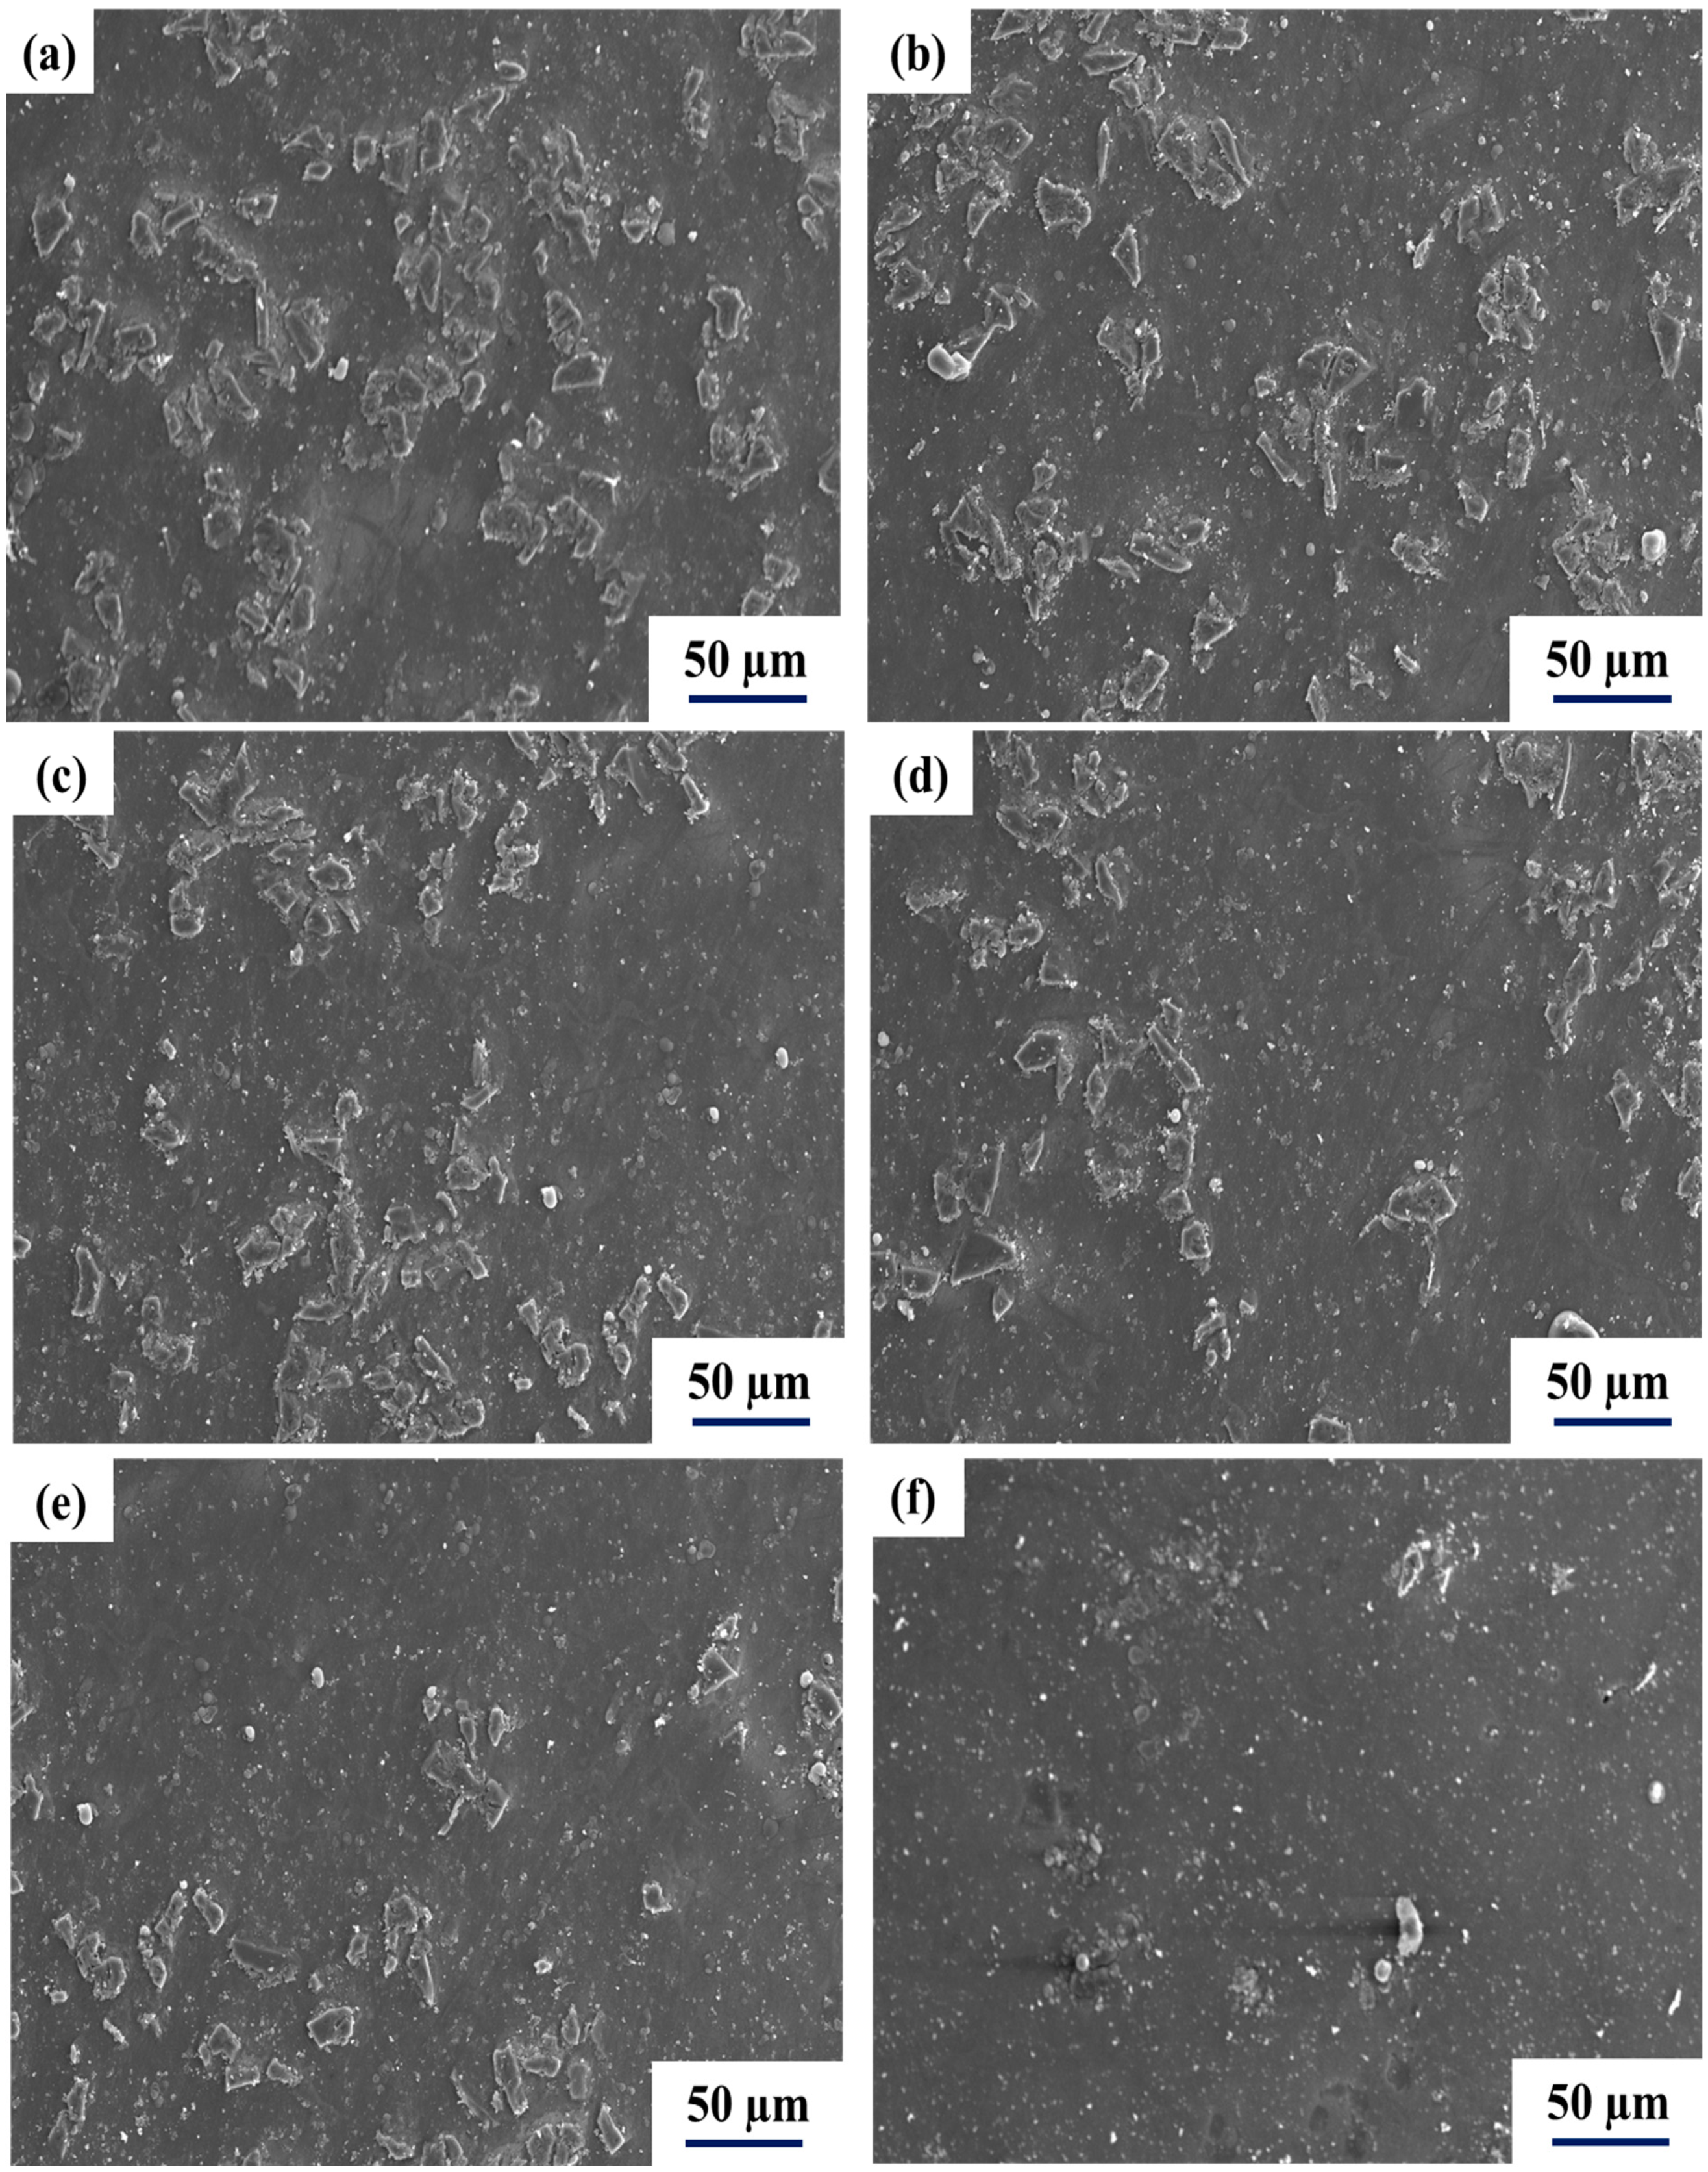
Figure 9 shows the SEM micrographs of the graded pure Al/SiC composite at different positions: (a) 1 mm, (b) 5 mm, (c) 10 mm, (d) 15 mm, (e) 20 mm, and (f) 25 mm. It is noticeable that there was a heterogeneous distribution of solid particles inside the pure Al matrix, resulting in a smooth gradient from the inner surface to the outer surface of the produced composite. To avoid the formation of a chill zone caused by the temperature difference between the molten metal and the mold, the mold was heated to 250 °C for an hour. Thus, the particle-rich region was formed on the external surface (1 mm) of the produced composite directly, as shown in Figure 9a. As shown in Figure 9b,c, the particle-rich zone continued to form until it reached 15 mm as a result of the centrifugal force induced by the rotation of the mold. The particle concentration inside the matrix then began to fall, forming an intermediate zone between the particle-rich and particle-depleted zones, as shown in Figure 9d,e. Conversely, Figure 9f depicts the particle-free zone (25 mm) of the graded composite at the internal surface. A comparison between Figure 9a,f shows a clear difference in the particle concentration across the thickness of the graded pure Al/SiC composite. Figure 9a illustrates that the particle-rich zone was formed directly on the external surface (1 mm) of the composite. This region contained a high concentration of particles, which gradually decreased with the movement towards the internal surface. In contrast, Figure 9f depicts the particle-free zone (25 mm) at the internal surface of the graded composite. The absence of particles in this region demonstrated the graded nature of the composite, wherein the particle concentration varied across its thickness. This graded structure was designed to improve the composite’s efficiency and overall functionality by providing a gradient behavior in terms of both structure and attributes. The variation in particle concentration across the thickness of the composite is an essential factor in determining its properties and performance. The same observation of findings was achieved by other studies [44,63]. Figure 10 shows that there were no obvious pits, interactions, or cracks along with the boundary in the graded composite. Furthermore, no interfacial contaminant was identified within the EDS analysis measurement range, showing that the fabrication method used in this study was efficient and that excellent bonding occurred between the pure Al and SiC particles of the graded composite.
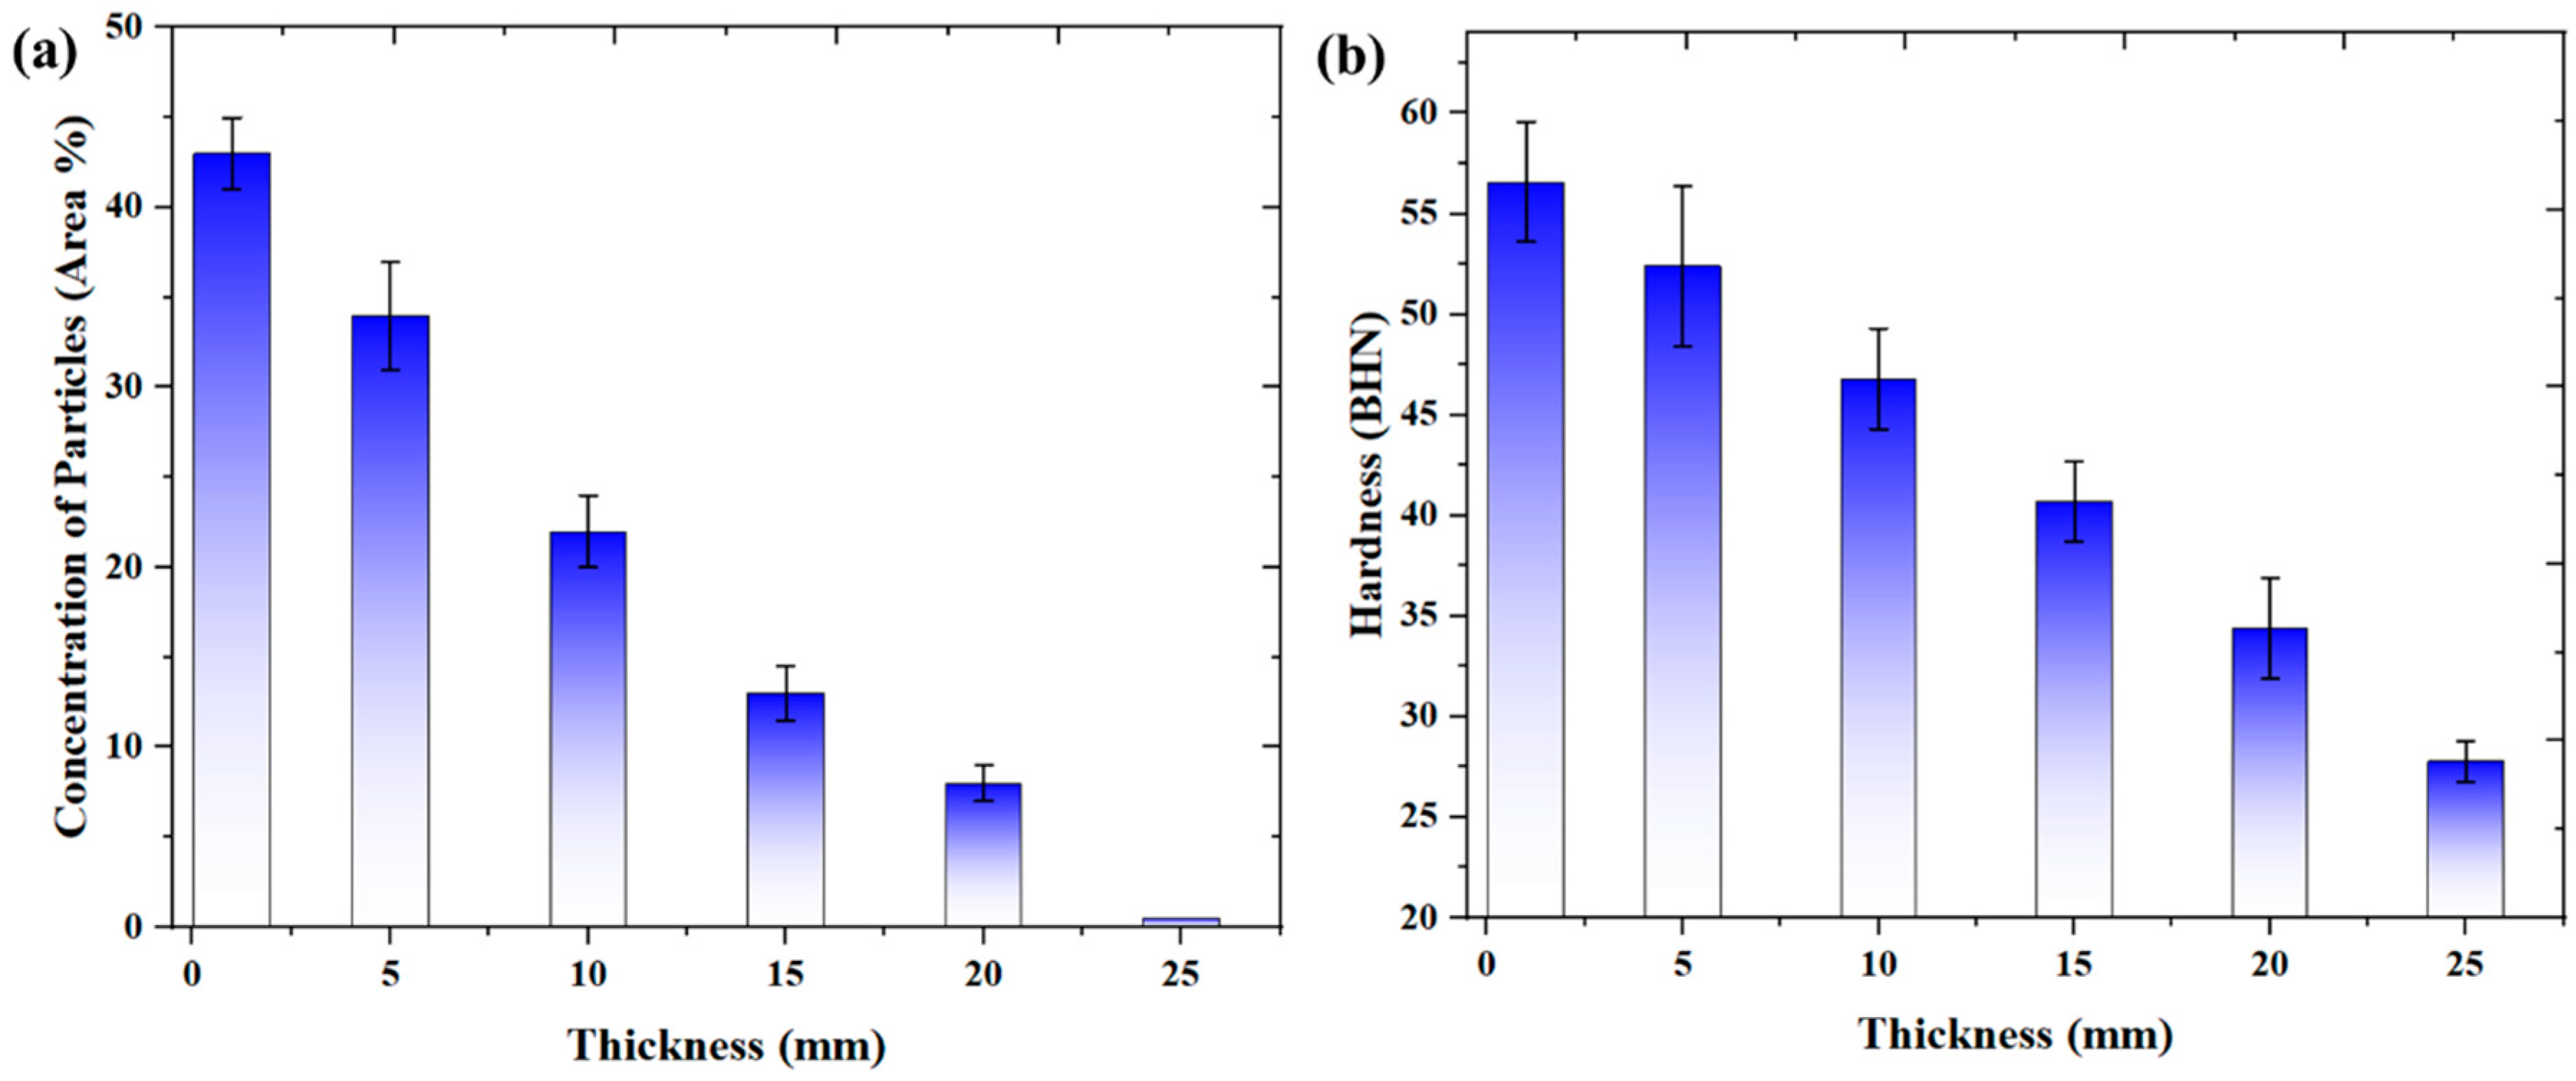
Figure 11a depicts the percentage of solid reinforcements within the pure Al matrix as determined by image pro plus software. The image analysis, like the SEM findings, indicated a greater concentration of solid reinforcements near the external surface (1 mm) of the graded composite due to density differences between pure Al matrix and SiC particles as well as centrifugal force. The particle concentration at 1 mm was 43 ± 2%, and then the particle concentration began to decline throughout the matrix before reaching zero concentration at 25 mm, forming a smooth gradient in the SiC particle distribution via pure Al matrix. A similar trend of results was obtained by another study [20]. Figure 11b depicts the Brinell hardness of the graded pure Al/SiC composites at different locations within the thickness. The Brinell hardness measurements of the functionally graded Al/SiC composite revealed values ranging from 46.8 to 56.6 BHN in the outer zone (1 mm to 10 mm from the outer surface), 34.4 to 46 BHN in the middle zone (11 mm to 20 mm from the outer surface), and 27.8 to 25 BHN in the inner zone (21 mm to 30 mm from the outer surface). This can be attributed to the presence of a larger percentage of solid reinforcements within the pure Al matrix towards the external surface, which resulted in improved hardness properties of the graded composite.
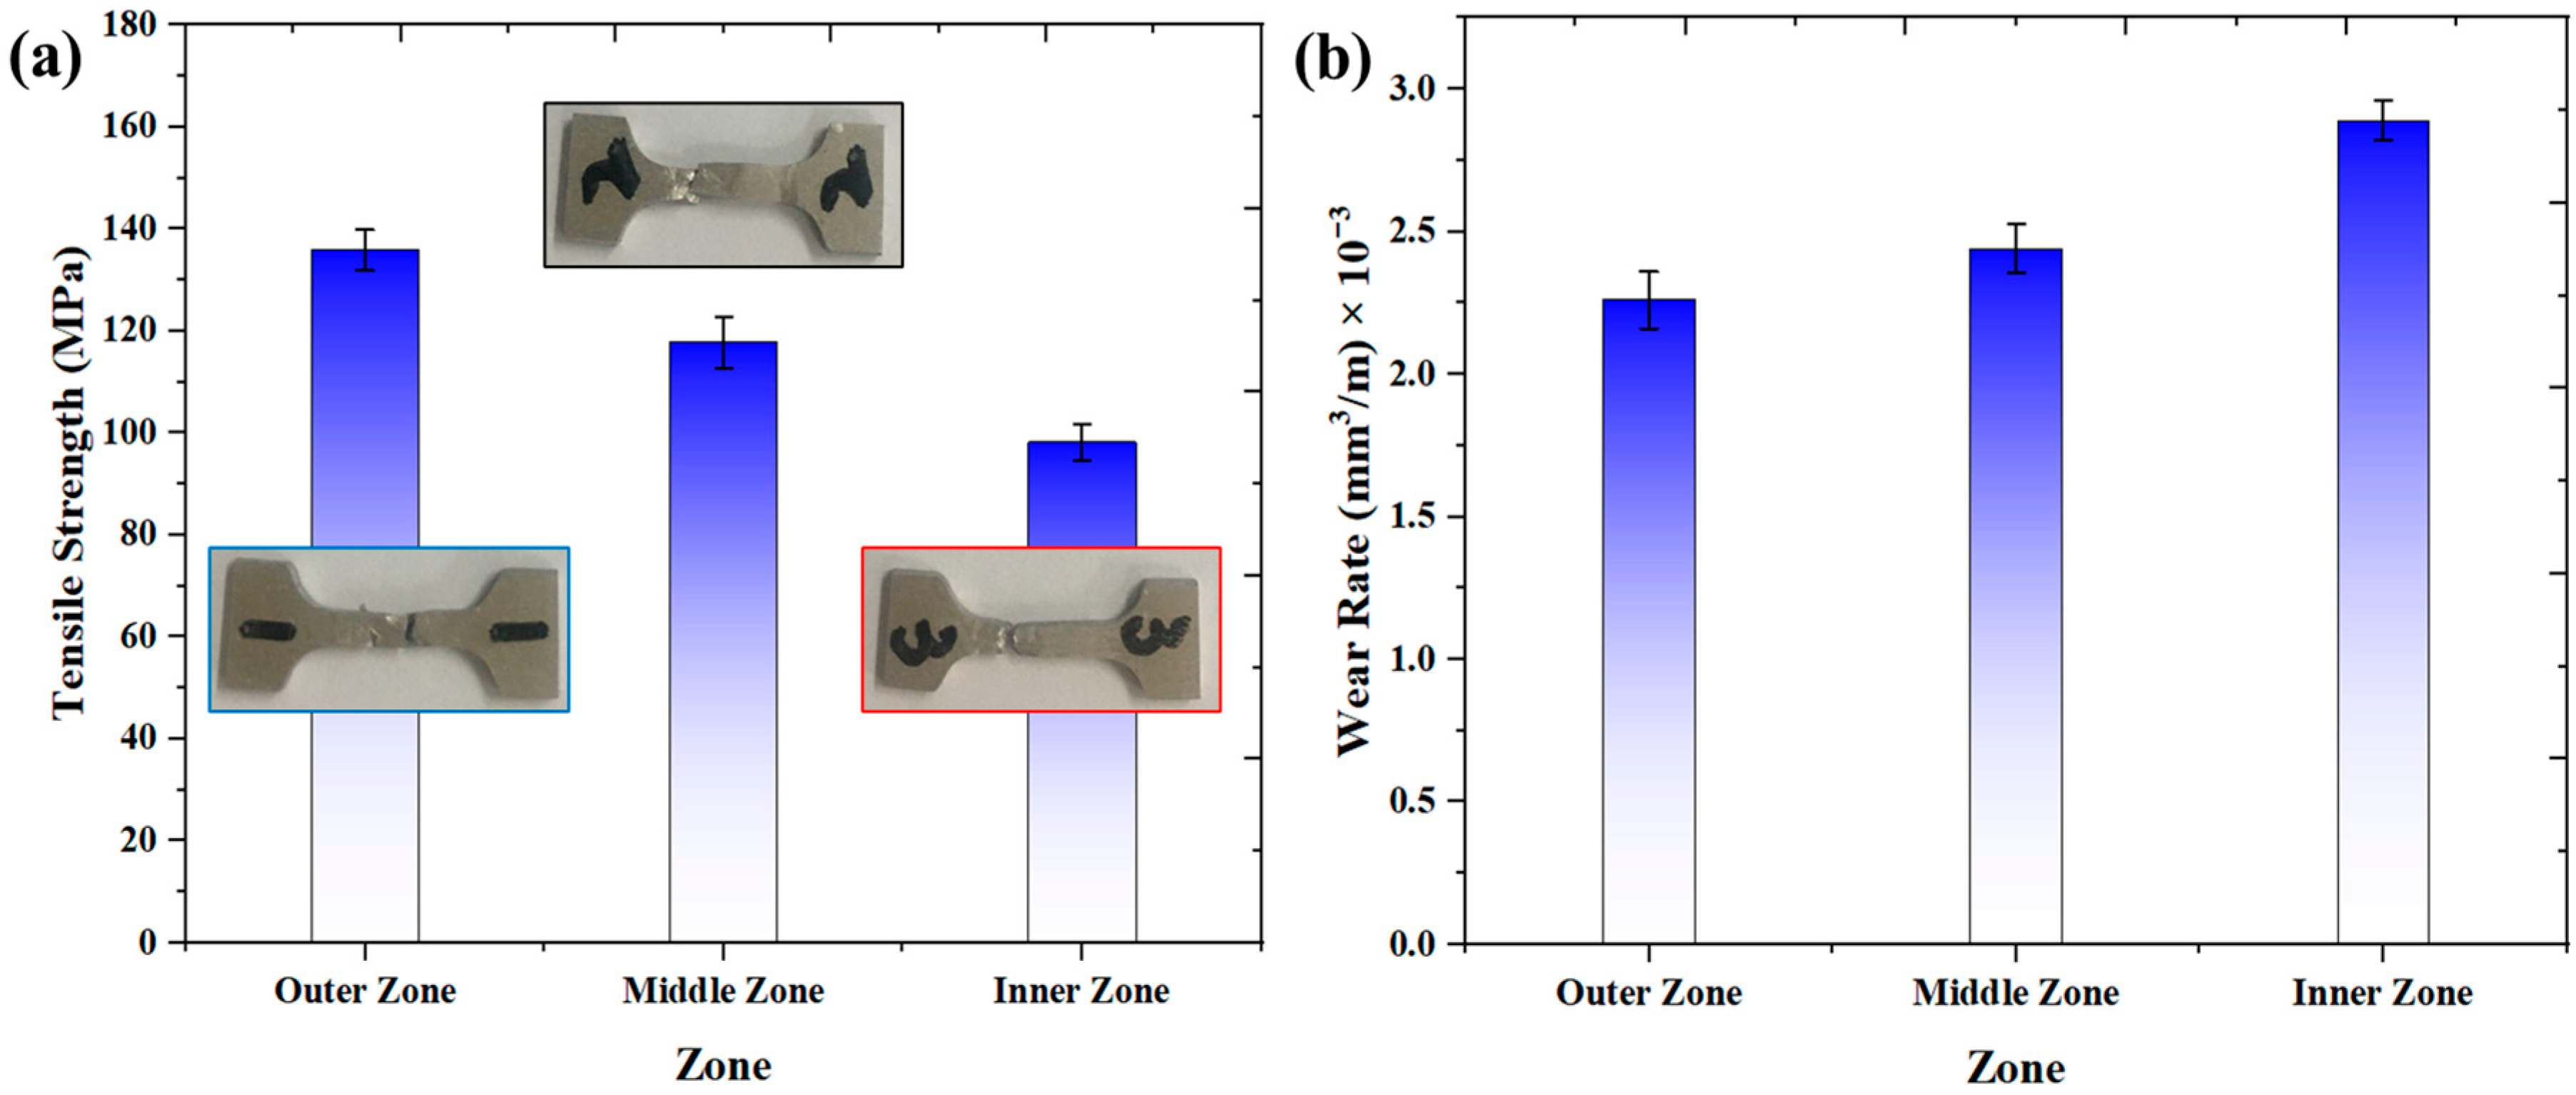
Figure 12a depicts the tensile strength of the graded pure Al/SiC composite at various zones within the thickness. The outside zone had a tensile strength of 135.9 ± 4 MPa, whereas the middle and inner zones had tensile strengths of 117.8 ± 3 MPa and 98.2 ± 2 MPa, respectively. The incorporation of a large concentration of solid reinforcements within the matrix and improved compaction owing to centrifugal action resulted in enhanced tensile strength near the external region of the graded pure Al/SiC composite. Figure 12b shows the wear rate of the graded pure Al/SiC composite at various zones within the thickness. The outside zone wear rate of the graded pure Al/SiC composite was 2.26 × 10⁻³ ± 0.02 mm3/m, whereas the middle and inner zone wear rates were 2.44 × 10⁻³ ± 0.01 mm3/m and 2.89 × 10⁻³ ± 0.015 mm3/m, respectively. 
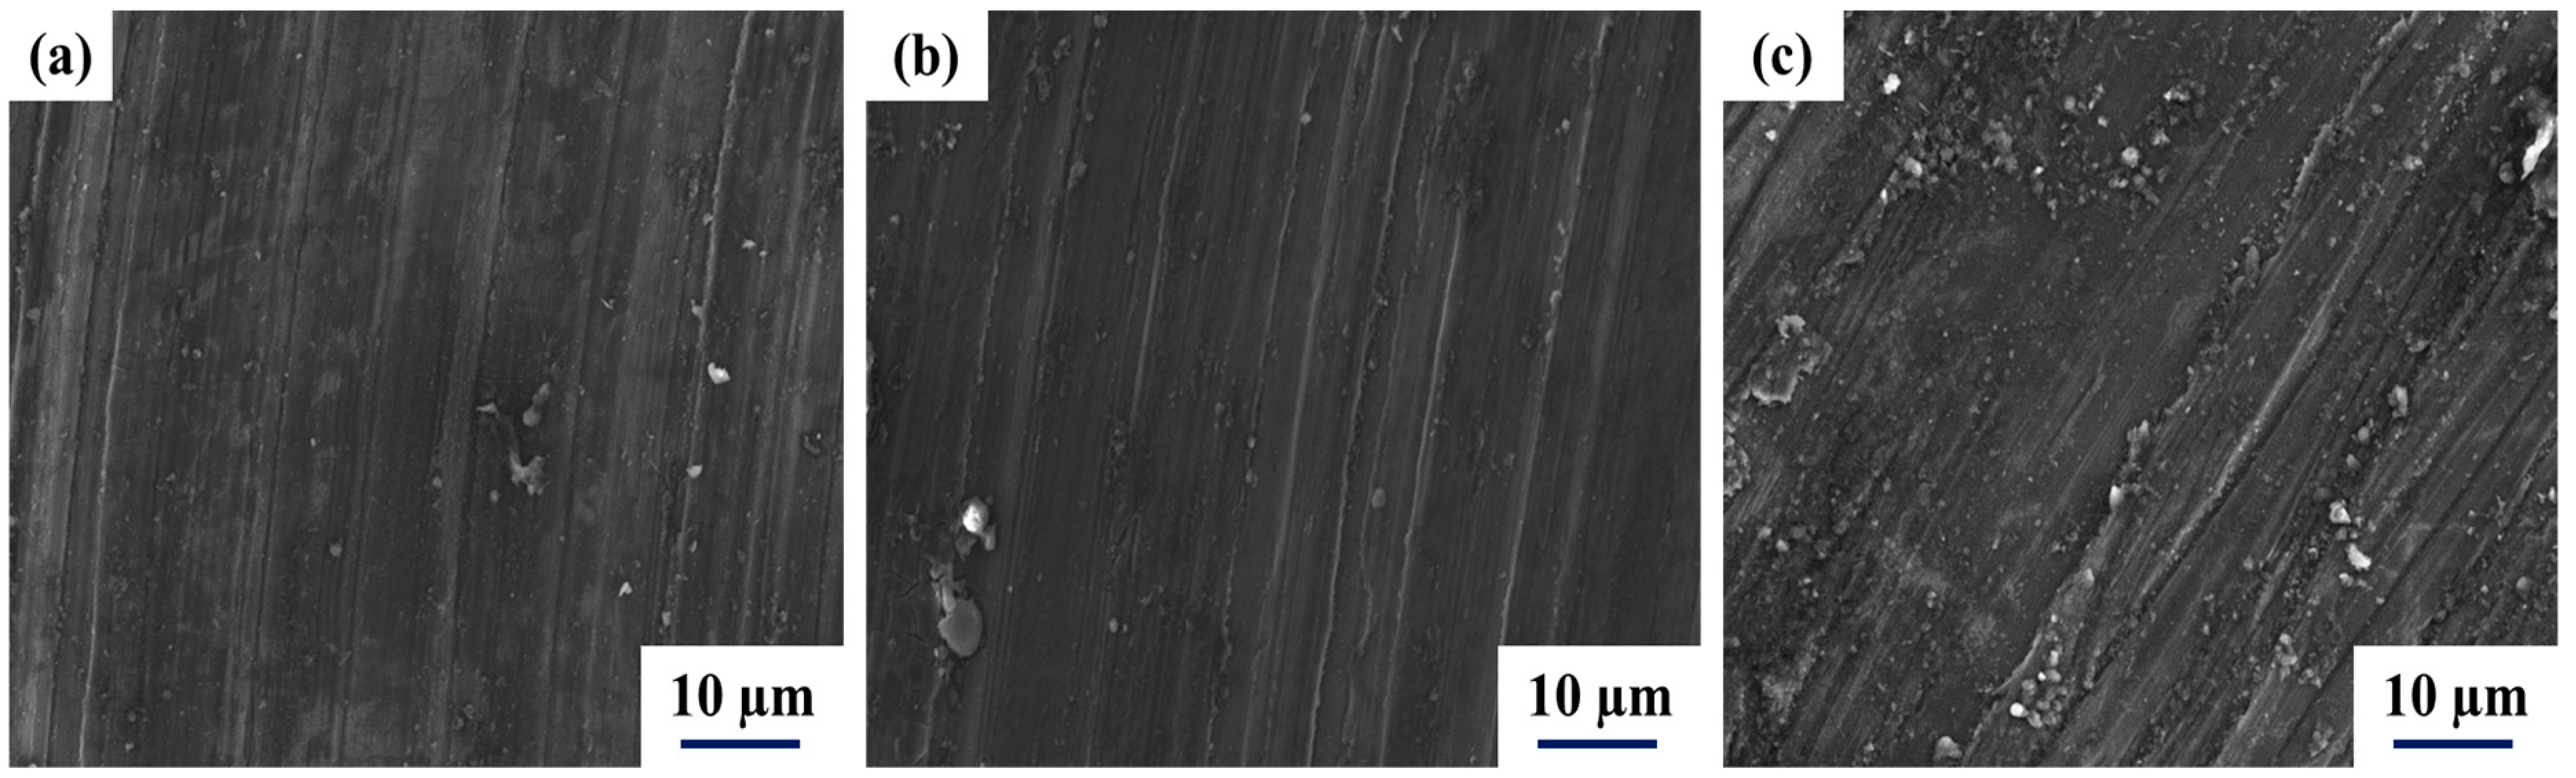
Figure 13 provides a set of SEM images that depict the worn surfaces of a graded pure Al/SiC composite at different zones across its thickness. The wear rate of the composite was found to decrease with an increase in the concentration of ceramic reinforcements in the outer region, as depicted in Figure 13a. Furthermore, Figure 12c and Figure 13b show that the worn surface of the middle and inner regions of the graded pure Al/SiC composite featured numerous notches that were predominantly aligned parallel to the sliding direction. A comparison between Figure 13a,c reveals a difference in the worn surface characteristics of the graded pure Al/SiC composite at different zones across its thickness. Figure 13a shows that the wear rate of the composite decreased with an increase in the concentration of ceramic reinforcements in the outer region. Because of the higher concentration of ceramic reinforcements, the outer region of the composite had improved wear resistance. Figure 13c, on the other hand, shows numerous notches on the worn surface of the inner region of the composite, which were mostly aligned parallel to the sliding direction. This observation implies that the inner region of the composite had lower wear resistance due to the presence of these notches, which were formed as a result of the absence of ceramic reinforcements in this region. These variations in mechanical properties and wear resistance clearly indicate that the qualities of the composite were significantly influenced by its structure, and that it exhibited gradient behavior in terms of both its structure and attributes [66]. The improved properties of the outer zone of the functionally graded pure Al/SiC composite can have a significant impact on its efficiency and overall performance [67]. This underscores the crucial role of the composite’s structure in determining its mechanical properties and overall functionality [68]. By tailoring the distribution of SiC particles within the composite material, it is possible to enhance the performance of the outer zone of the composite material, which can have important practical applications in various industries, including automotive and aerospace engineering [69,70].
In discussing the uncertainty and errors of experimental results for functionally graded Al/SiC composites, it is crucial to evaluate potential sources of uncertainty and error in the experimental setup and data analysis. These sources could include variations in material composition, processing conditions, and testing conditions. For instance, variations in the particle size, morphology, and distribution of the SiC particles could affect the mechanical properties of the composite material. Similarly, variations in processing conditions such as mixing time, temperature, and pressure could impact the microstructure and mechanical properties of the material. To mitigate the impact of these sources of uncertainty, several measures were taken to ensure the accuracy and reliability of the experimental results in this study. These measures included a standardized processing protocol with carefully calibrated instrumentation to control the processing conditions for each composite sample. Additionally, multiple tests were conducted for each composite sample, and the average values were computed to minimize the impact of any outliers or anomalies.
The limitation of this study is that it did not consider all the possible process variables that may affect the properties of the functionally graded metal matrix composite. For example, stirring time and preheating temperature of the mold were not included in the present work. Additionally, only three mechanical properties were determined, namely, Brinell hardness, quasi-static tensile strength, and wear loss, while there are a host of other mechanical properties that are important for the practical application of the composite material. Moreover, the study did not consider the effects of fatigue life, creep resistance, and corrosion rate, which are important properties for potential applications of the composite material. It is important to note these limitations to provide a clear understanding of the scope and implications of the study. Finally, it is demonstrated that the performance characteristics of the graded composites, such as hardness, tensile strength, and wear resistance, are improved together by using grey relational analysis in this research.

4. Conclusions

A combination of grey relational analysis and response surface methodology was used to determine optimal values of four main parameters in the combination process of stirring and horizontal centrifugal casting, which was the method used to manufacture a functionally graded metal matrix composite (pure Al reinforced with 10 wt.% SiC particles). The following are the conclusions derived from the study findings:
  • A multi-purpose decision model was developed using grey relational analysis, with the main variables being stirring speed, molten charge temperature, mold speed, and radial distance, and the responses being characteristics (hardness, tensile strength, and wear loss).
  • The analysis of variance for GRG revealed that the radial distance was the most significant parameter, accounting for 25.24% of the influence, followed by pouring temperature and mold speed, with stirring speed having the least influence on the multi-performance properties.
  • The optimal value for the set of characteristics determined was obtained with the variables of a medium level of stirring speed (150 rpm), a high level of charge temperature (750 °C), a high level of mold speed (1000 rpm), and a low level of radial distance (1 mm), which yielded a GRG of 0.919.
  • With the variables values given above, the predicted GRG was determined to be 0.969. As a result of this approach, optimizing complicated multiple performance characteristics can be significantly simplified.
  • The enhanced characteristics of the outer zone of the graded pure Al/SiC composite can significantly improve its efficiency and overall functionality, highlighting the importance of the composite’s structure in determining its performance.

Author Contributions

Conceptualization, B.S.; methodology, B.S. and R.F.; software, B.S. and M.A.A.A.; validation, B.S., A.M. and J.J.; formal analysis, B.S.; investigation, B.S.; resources, B.S.; data curation, B.S. and M.A.A.A.; writing—original draft preparation, B.S. and R.F.; writing—review and editing, B.S. and N.R.; visualization, M.A.A.A., N.R. and J.J.; supervision, J.J. and A.M.; project administration, R.F.; funding acquisition, B.S. All authors have read and agreed to the published version of the manuscript.

Funding

Not applicable.

Institutional Review Board Statement

Not applicable.

Informed Consent Statement

Not applicable.

Data Availability Statement

No associated data.

Acknowledgments

The authors are grateful for the financial support and the postdoctoral fellowship provided by Hohai University (HHU).

Conflicts of Interest

The authors declare that no competing interest exist. The authors have no conflicts of interest to declare that are relevant to the content of this article.

References

  1. Sun, J.; Jing, Q.; Lei, L.; Zhang, J. Compositional gradient affects the residual stress distribution in Si3N4/SiC functionally graded materials. Ceram. Int. 2023, 49, 19281–19289. [Google Scholar] [CrossRef]
  2. Saleh, B.; Jiang, J.; Fathi, R.; Al-hababi, T.; Xu, Q.; Wang, L.; Song, D.; Ma, A. 30 Years of functionally graded materials: An overview of manufacturing methods, Applications and Future Challenges. Compos. Part B Eng. 2020, 201, 108376. [Google Scholar] [CrossRef]
  3. Fathi, R.; Wei, H.; Saleh, B.; Radhika, N.; Jiang, J.; Ma, A.; Ahmed, M.H.; Li, Q.; Ostrikov, K.K. Past and present of functionally graded coatings: Advancements and future challenges. Appl. Mater. Today 2022, 26, 101373. [Google Scholar] [CrossRef]
  4. Zhao, T.Y.; Liu, Z.F.; Pan, H.G.; Zhang, H.Y.; Yuan, H.Q. Vibration Characteristics of Functionally Graded Porous Nanocomposite Blade-disk-shaft Rotor System Reinforced with Graphene Nanoplatelets. Appl. Compos. Mater. 2021, 28, 717–731. [Google Scholar] [CrossRef]
  5. Sathish, M.; Radhika, N.; Saleh, B. A critical review on functionally graded coatings: Methods, properties, and challenges. Compos. Part B Eng. 2021, 225, 109278. [Google Scholar] [CrossRef]
  6. Majzoobi, G.H.; Mohammadi, M.; Rahmani, K. Microstructural examination and mechanical characterization of Ti/HA and Ti/SiO2 functionally graded materials fabricated at different loading rates. J. Mech. Behav. Biomed. Mater. 2022, 136, 105497. [Google Scholar] [CrossRef]
  7. Moita, J.S.; Araújo, A.L.; Mota Soares, C.M.; Mota Soares, C.A.; Herskovits, J. Material and Geometric Nonlinear Analysis of Functionally Graded Plate-Shell Type Structures. Appl. Compos. Mater. 2016, 23, 537–554. [Google Scholar] [CrossRef]
  8. Klecka, J.; Cizek, J.; Matejicek, J.; Lukac, F.; Vala, J. Thick functionally-graded W-316L composite coatings for nuclear fusion applications. Nucl. Mater. Energy 2023, 34, 101373. [Google Scholar] [CrossRef]
  9. Saleh, B.; Jiang, J.; Ma, A.; Song, D.; Yang, D. Effect of Main Parameters on the Mechanical and Wear Behaviour of Functionally Graded Materials by Centrifugal Casting: A Review. Met. Mater. Int. 2019, 25, 1395–1409. [Google Scholar] [CrossRef]
  10. Qi, Y.; Liang, W.; Miao, Q.; Yi, J.; Lin, H.; Liu, Y.; Ma, H. Role of the nitrogen ratio on mechanical properties and wear resistance of CrN / Fe functionally graded coating produced by double glow plasma alloying. Appl. Surf. Sci. 2022, 585, 152735. [Google Scholar] [CrossRef]
  11. Wang, Z.; Maruyama, K.; Narita, F. A novel manufacturing method and structural design of functionally graded piezoelectric composites for energy-harvesting. Mater. Des. 2022, 214, 110371. [Google Scholar] [CrossRef]
  12. Sai Charan, M.; Naik, A.K.; Kota, N.; Laha, T.; Roy, S. Review on developments of bulk functionally graded composite materials. Int. Mater. Rev. 2022, 67, 797–863. [Google Scholar] [CrossRef]
  13. Majzoobi, G.H.; Rahmani, K.; Mohammadi, M.; Bakhtiari, H.; Das, R. Tribological behaviour of Ti/HA and Ti/SiO2 functionally graded materials fabricated at different strain rates. Biotribology 2023, 35–36, 100233. [Google Scholar] [CrossRef]
  14. Xin, D.; Yao, X.; Zhang, J.; Chen, X. Fabrication of functionally graded material of 304L stainless steel and Inconel625 by twin-wire plasma arc additive manufacturing. J. Mater. Res. Technol. 2023, 23, 4135–4147. [Google Scholar] [CrossRef]
  15. Hamamcı, M.; Nair, F.; Cerit, A.A. Microstructural and mechanical characterization of functionally graded Fe/Fe2B (Fe/B4C) materials fabricated by in-situ powder metallurgy method. Ceram. Int. 2023, 49, 18786–18799. [Google Scholar] [CrossRef]
  16. Borand, G.; Uzunsoy, D. Fabrication of functionally graded few-layered graphene reinforced Al-4.5Cu alloy by powder metallurgy. J. Alloys Compd. 2022, 923, 166348. [Google Scholar] [CrossRef]
  17. Florenciano, J.T.O.; Ambrosi, A.; Hotza, D.; González, S.Y.G. Understanding centrifugal casting in the manufacture of functionally graded materials. J. Eur. Ceram. Soc. 2022, 42, 7089–7101. [Google Scholar] [CrossRef]
  18. Mukunda, P.G.; Shailesh, R.A.; Rao, S.S. Influence of rotational speed of centrifugal casting process on appearance, microstructure, and sliding wear behaviour of Al-2Si cast alloy. Met. Mater. Int. 2010, 16, 137–143. [Google Scholar] [CrossRef]
  19. Saleh, B.; Ma, A.; Fathi, R.; Radhika, N.; Ji, B.; Jiang, J. Wear Characteristics of Functionally Graded Composites Synthesized from Magnesium Chips Waste. Tribol. Int. 2022, 174, 107692. [Google Scholar] [CrossRef]
  20. Fathi, R.; Ma, A.; Saleh, B.; Xu, Q.; Jiang, J. Investigation on mechanical properties and wear performance of functionally graded AZ91-SiCp composites via centrifugal casting. Mater. Today Commun. 2020, 24, 101169. [Google Scholar] [CrossRef]
  21. Jojith, R.; Radhika, N. Fabrication of LM 25/WC functionally graded composite for automotive applications and investigation of its mechanical and wear properties. J. Brazilian Soc. Mech. Sci. Eng. 2018, 40, 292. [Google Scholar] [CrossRef]
  22. Saleh, B.; Ji, B.; Fathi, R.; Guo, S.; Ahmed, M.H. Utilization of machining chips waste for production of functionally gradient magnesium matrix composites. J. Mater. Process. Tech. 2022, 308, 117702. [Google Scholar] [CrossRef]
  23. Zou, Q.; Dong, Z.; Zhang, Z.; Qiao, C.; Jie, J.; An, X.; Han, N. Electromagnetic construction and mechanical properties of in-situ Si reinforced Al matrix functionally graded material with Si-rich◎Si-poor coating structure. Compos. Part B Eng. 2021, 226, 109341. [Google Scholar] [CrossRef]
  24. Liu, J.; Zhang, Y.; Zhang, Y.; Kitipornchai, S.; Yang, J. Aeroelastic analyses of functionally graded aluminium composite plates reinforced with graphene nanoplatelets under fluid-structural interaction. Aerosp. Sci. Technol. 2023, 136, 108254. [Google Scholar] [CrossRef]
  25. Saleh, B.; Ahmed, M. Development of Functionally Graded Tubes Based on Pure Al/Al2O3 Metal Matrix Composites Manufactured by Centrifugal Casting for Automotive Applications. Met. Mater. Int. 2020, 26, 1430–1440. [Google Scholar] [CrossRef]
  26. Sam, M.; Radhika, N.; Saleh, B. Improving reciprocal tribo-mechanical performance and corrosion resistance using carbide ceramics: T6 thermal-treated A333 mono-hybrid functionally graded composites. Mater. Today Chem. 2023, 29, 101479. [Google Scholar] [CrossRef]
  27. Karun, A.; Rajan, T.; Pillai, U.; Pai, B.; Rajeev, V. Enhancement in tribological behaviour of functionally graded SiC reinforced aluminium composites by centrifugal casting. J. Compos. Mater. 2016, 50, 2255–2269. [Google Scholar] [CrossRef]
  28. Rajan, T.; Pillai, R.; Pai, B. Centrifugal casting of functionally graded aluminium matrix composite components. Int. J. Cast Met. Res. 2008, 21, 214–218. [Google Scholar] [CrossRef]
  29. IEl-Galy, I.M.; Bassiouny, B.I.; Ahmed, M.H. Empirical Model for Dry Sliding Wear Behaviour of Centrifugally Cast Functionally Graded Al/SiCp Composite. Key Eng. Mater. 2018, 786, 276–285. [Google Scholar] [CrossRef]
  30. Radhika, N.; Raghu, R. Effect of Centrifugal Speed in Abrasive Wear Behavior of Al-Si5Cu3/SiC Functionally Graded Composite Fabricated by Centrifugal Casting. Trans. Indian Inst. Met. 2017, 71, 715–726. [Google Scholar] [CrossRef]
  31. Saleh, B.; Jiang, J.; Fathi, R.; Xu, Q.; Li, Y.; Ma, A. Influence of gradient structure on wear characteristics of centrifugally cast functionally graded magnesium matrix composites for automotive applications. Arch. Civ. Mech. Eng. 2021, 21, 12. [Google Scholar] [CrossRef]
  32. Saleh, B.; Jiang, J.; Xu, Q.; Fathi, R.; Ma, A.; Li, Y.; Wang, L. Statistical Analysis of Dry Sliding Wear Process Parameters for AZ91 Alloy Processed by RD-ECAP Using Response Surface Methodology. Met. Mater. Int. 2021, 27, 2879–2897. [Google Scholar] [CrossRef]
  33. Wang, L.; Jiang, J.; Saleh, B.; Fathi, R.; Huang, H.; Liu, H.; Ma, A. Optimization of the Experimental Parameters Affecting the Corrosion Behavior for Mg–Y–Zn–Mn Alloy via Response Surface Methodology. Met. Mater. Int. 2021, 27, 5095–5107. [Google Scholar] [CrossRef]
  34. Sam, M.; Radhika, N.; Ramu, M.; Saleh, B.; Pramanik, A. Optimizing reciprocal wear responses of centrifugally cast A333 hybrid functionally graded composite using Taguchi and response surface methodology. Int. J. Interact. Des. Manuf. 2022, 18, 1–16. [Google Scholar] [CrossRef]
  35. Radhika, N.; Raghu, R. The Mechanical Properties and Abrasive Wear Behavior of Functionally Graded Aluminum /AlB2 Composites Produced by Centrifugal Casting. Part. Sci. Technol. 2016, 35, 575–582. [Google Scholar] [CrossRef]
  36. Savaş, Ö. Application of Taguchi’s method to evaluate abrasive wear behavior of functionally graded aluminum based composite. Mater. Today Commun. 2020, 23, 100920. [Google Scholar] [CrossRef]
  37. Babu, K.; Jappes, J.; Rajan, T.; Uthayakumar, M. Dry sliding wear studies on SiC reinforced functionally graded aluminium matrix composites. J. Mater. Des. Appl. 2016, 230, 182–189. [Google Scholar] [CrossRef]
  38. Yıldız, T.; Sur, G. Investigation of drilling properties of AA7075/Al2O3 functionally graded materials using gray relational analysis. Proc. Inst. Mech. Eng. Part B J. Eng. Manuf. 2021, 235, 1384–1398. [Google Scholar] [CrossRef]
  39. Selim, B.A.; Liu, Z. Impact analysis of functionally-graded graphene nanoplatelets-reinforced composite plates laying on Winkler-Pasternak elastic foundations applying a meshless approach. Eng. Struct. 2021, 241, 112453. [Google Scholar] [CrossRef]
  40. Zhao, S.; Zhao, Z.; Yang, Z.; Ke, L.; Kitipornchai, S.; Yang, J. Functionally graded graphene reinforced composite structures: A review. Eng. Struct. 2020, 210, 110339. [Google Scholar] [CrossRef]
  41. Huo, J.; Zhang, G.; Ghabussi, A.; Habibi, M. Bending analysis of FG-GPLRC axisymmetric circular/annular sector plates by considering elastic foundation and horizontal friction force using 3D-poroelasticity theory. Compos. Struct. 2021, 276, 114438. [Google Scholar] [CrossRef]
  42. Ghabussi, A.; Habibi, M.; NoormohammadiArani, O.; Shavalipour, A.; Moayedi, H.; Safarpour, H. Frequency characteristics of a viscoelastic graphene nanoplatelet–reinforced composite circular microplate. JVC/J. Vib. Control. 2021, 27, 101–118. [Google Scholar] [CrossRef]
  43. Saleh, B.; Jiang, J.; Ma, A.; Song, D.; Yang, D.; Xu, Q. Review on the Influence of Different Reinforcements on the Microstructure and Wear Behavior of Functionally Graded Aluminum Matrix Composites by Centrifugal Casting. Met. Mater. Int. 2020, 26, 933–960. [Google Scholar] [CrossRef]
  44. El-Galy, I.; Ahmed, M.; Bassiouny, B. Characterization of functionally graded Al-SiCp metal matrix composites manufactured by centrifugal casting. Alexandria Eng. J. 2017, 56, 371–381. [Google Scholar] [CrossRef]
  45. ASTM E8 Standard; Standard Test Methods for Tension Testing of Metallic Materials. ASTM International: West Conshohocken, PA, USA, 1924.
  46. ASTM G99-05 Standard; Standard Test Method for Wear Testing with a Pin-on-Disk Apparatus. ASTM International: West Conshohocken, PA, USA, 2017.
  47. Zhu, Z.; Xu, L.; Han, Z.; Liu, J.; Zhang, L.; Tian, S.; Xu, Y.; Koppala, S. Optimization of response surface methodology (RSM) for defluorination of spent carbon cathode (SCC) in fire-roasting aluminum electrolysis. Miner. Eng. 2022, 182, 107565. [Google Scholar] [CrossRef]
  48. Ferreira, N.; Viana, T.; Henriques, B.; Tavares, D.S.; Jacinto, J.; Colónia, J.; Pinto, J.; Pereira, E. Application of response surface methodology and box–behnken design for the optimization of mercury removal by Ulva sp. J. Hazard. Mater. 2023, 445, 130405. [Google Scholar] [CrossRef] [PubMed]
  49. Fathi, R.; Hongyu, W.; Mingguang, L.; Liang, W.; Silai, Z.; Saleh, B. Optimization of Stirring Parameters for Stir-Cast Magnesium Matrix Composites Using Response Surface Methodology. Trans. Nanjing Univ. Aeronaut. Astronaut. 2022, 39, 42–50. [Google Scholar]
  50. Saleh, B.; Ma, A.; Fathi, R.; Radhika, N.; Yang, G. Optimized mechanical properties of magnesium matrix composites using RSM and ANN. Mater. Sci. Eng. B 2023, 290, 116303. [Google Scholar] [CrossRef]
  51. Dantas, T.N.C.; Cabral, T.J.O.; Dantas Neto, A.A.; Moura, M.C.P.A. Enrichmnent of patchoulol extracted from patchouli (Pogostemon cablin) oil by molecular distillation using response surface and artificial neural network models. J. Ind. Eng. Chem. 2020, 81, 219–227. [Google Scholar] [CrossRef]
  52. Behera, S.; Meena, H.; Chakraborty, S.; Meikap, B. Application of response surface methodology (RSM) for optimization of leaching parameters for ash reduction from low-grade coal. Int. J. Min. Sci. Technol. 2018, 28, 621–629. [Google Scholar] [CrossRef]
  53. Raghavendra, C.R.; Basavarajappa, S.; Sogalad, I. Grey relational analysis for optimization of wear parameters and surface roughness on nano composite coating. J. Indian Chem. Soc. 2021, 98, 100171. [Google Scholar] [CrossRef]
  54. Işık, A.T.; Çakıroğlu, R.; Günay, M. Multiresponse optimization of performance indicators through Taguchi-grey relational analysis in EDM of cemented carbide. CIRP J. Manuf. Sci. Technol. 2023, 41, 490–500. [Google Scholar] [CrossRef]
  55. Naik, A.K.; Nazeer, M.; Prasad, D.K.V.D.; Laha, T.; Roy, S. Development of functionally graded ZrB2–B4C composites for lightweight ultrahigh-temperature aerospace applications. Ceram. Int. 2022, 48, 33332–33339. [Google Scholar] [CrossRef]
  56. Abubakar, A.A.; Akhtar, S.S.; Alotaibi, A.D.; Al-Athel, K.S.; Hakeem, A.S.; Adesina, A.Y. Development and analysis of functionally-graded SiAlON composites with computationally designed properties for cutting inserts. J. Mater. Res. Technol. 2023, 23, 5861–5879. [Google Scholar] [CrossRef]
  57. Yalagudige Dharmegowda, I.; Madarakallu Muniyappa, L.; Suresh, A.B.; Gowdru Chandrashekarappa, M.P.; Pradeep, N.B. Optimization for waste coconut and fish oil derived biodiesel with MgO nanoparticle blend: Grey relational analysis, grey wolf optimization, driving training based optimization and election based optimization algorithm. Fuel 2023, 338, 127249. [Google Scholar] [CrossRef]
  58. Li, B.; Liu, P.; Zhao, Y.; Li, X.; Cao, G. Effect of graphene oxide in different phases on the high temperature rheological properties of asphalt based on grey relational and principal component analysis. Constr. Build. Mater. 2023, 362, 129714. [Google Scholar] [CrossRef]
  59. Gajalakshmi, K.; Senthilkumar, N.; Prabu, B. Multi-response optimization of dry sliding wear parameters of AA6026 using hybrid gray relational analysis coupled with response surface method. Meas. Control. 2019, 52, 540–553. [Google Scholar] [CrossRef]
  60. Jozi, S.; Bajic, D.; Celent, L. Application of compressed cold air cooling: Achieving multiple performance characteristics in end milling process. J. Clean. Prod. 2015, 100, 325–332. [Google Scholar] [CrossRef]
  61. Patil, N.G. Determination of optimal performance in wire electrical discharge machining of Al/Al2O3/22p composites using response surface methods and grey relational analysis. Aust. J. Mech. Eng. 2021, 22, 1–13. [Google Scholar] [CrossRef]
  62. Saleh, B.; Ahmed, M. Wear Characteristics of Functionally Graded Tubes Reinforced with Silicon Carbide and Alumina: A Comparative Study. Trans. Nanjing Univ. Aeronaut. Astronaut. 2021, 38, 76–83. [Google Scholar] [CrossRef]
  63. Rajan, T.; Pillai, R.; Pai, B. Characterization of centrifugal cast functionally graded aluminum-silicon carbide metal matrix composites. Mater. Charact. 2010, 61, 923–928. [Google Scholar] [CrossRef]
  64. Sam, M.; Radhika, N. Influence of carbide ceramic reinforcements in improving tribological properties of A333 graded hybrid composites. Def. Technol. 2022, 18, 1107–1123. [Google Scholar] [CrossRef]
  65. Hussain, M.Z.; Khan, S.; Sarmah, P. Optimization of powder metallurgy processing parameters of Al2O3/Cu composite through Taguchi method with Grey relational analysis. J. King Saud Univ. Eng. Sci. 2020, 32, 274–286. [Google Scholar] [CrossRef]
  66. Xu, Q.; Ma, A.; Saleh, B.; Fathi, R.; Li, Y.; Jiang, J.; Ni, C. Dry Sliding Wear Behavior of AZ91 Alloy Processed by Rotary-Die Equal Channel Angular Pressing. J. Mater. Eng. Perform. 2020, 29, 3961–3973. [Google Scholar] [CrossRef]
  67. Jojith, R.; Radhika, N.; Saleh, B. Metallographic, mechanical and reciprocating wear characterization and behavioural studies of untreated and T6 treated Al2O3/Al7Si0.3Mg functional composite material. Tribol. Int. 2022, 174, 107693. [Google Scholar] [CrossRef]
  68. Noble, N.; Radhika, N.; Sathishkumar, M.; Saleh, B. Characterization and Property Evaluation of High Entropy Alloy Coating on 316L Steel via Thermal Spray Synthesis. Tribol. Int. 2023, 185, 108525. [Google Scholar] [CrossRef]
  69. Oza, M.J.; Schell, K.G.; Bucharsky, E.C.; Laha, T.; Roy, S. Developing a hybrid Al–SiC-graphite functionally graded composite material for optimum composition and mechanical properties. Mater. Sci. Eng. A 2021, 805, 140625. [Google Scholar] [CrossRef]
  70. Guo, Y.; Li, W.; Liu, X.; Sugio, K.; Liu, W.; Suzuki, A.S.; Sasaki, G. Microstructure evolution, property analysis, and interface study of 3%CF-3%SiC-10%SiC functional gradient aluminum matrix composites. Mater. Sci. Eng. A 2023, 872, 145010. [Google Scholar] [CrossRef]
Figure 1. The main steps of the models used in this work: (a) RSM model and (b) GRA model.
Coatings 13 00813 g001
Figure 2. Schematic diagram of main steps and methodology used in this research.
Coatings 13 00813 g002
Figure 3. Predicted versus actual values and residual plots for properties of the graded composites: (a) hardness, (b) tensile strength, and (c) wear rate.
Coatings 13 00813 g003
Figure 4. Influence of main parameters on the properties of the graded composites: (a) hardness, (b) tensile strength, and (c) wear rate.
Coatings 13 00813 g004
Figure 5. Main effects plot for grey relational grade.
Coatings 13 00813 g005
Figure 6. D contour plots showing the effect of the main parameters on GRG.
Coatings 13 00813 g006
Figure 7. Normal probability versus residual plots for GRG.
Coatings 13 00813 g007
Figure 8. Optimization plot of GRG using response optimizer.
Coatings 13 00813 g008
Figure 9. SEM images of the graded pure Al/SiC composite at different locations from the outer surface to inner surface: (a) 1 mm, (b) 5 mm, (c) 10 mm, (d) 15 mm, (e) 20 mm, and (f) 25 mm.
Coatings 13 00813 g009
Figure 10. SEM image and EDS analysis of the interface for the graded pure Al/SiC composite.
Coatings 13 00813 g010
Figure 11. Influence of radial distance of the graded pure Al/SiC composite on (a) concentration of ceramic reinforcements and (b) Brinell hardness.
Coatings 13 00813 g011
Figure 12. Influence of the different zones of the graded pure Al/SiC composite on (a) tensile strength and (b) wear rate.
Coatings 13 00813 g012
Figure 13. SEM micrographs of worn surfaces for graded composite at various zones: (a) outer, (b) middle, and (c) inner.
Coatings 13 00813 g013
Table 1. Values of main parameters and their levels.
ParametersUnitsSymbolLevels
Mold speedrpmA8009001000
Pouring temperatureºCB700725750
Stirring speedrpmC100150200
Radial distancemmD11025
Table 2. Experimental parameters and experimental responses.
RunInput ParametersOutput Responses
ABCDHardness R1 (BHN)Strength R2 (MPa)Wear Rate R3 (mm3/m) × 10−3
19007001502524.5873.41
29007251001034.8932.98
39007251001034.8932.93
410007001002524.5883.36
58007002002523.2833.81
61000750150159.71392.18
710007501002525.6932.97
810007251501042.51072.75
98007501002523.9883.36
1010007251501042.51072.76
11900725200141.31122.65
12800750150149.11422.48
139007001002524.2843.76
148007001502523.5843.76
1510007502002524.1903.15
1610007002002524863.84
17800700100134.8932.95
189007251001034.8932.97
199007502001042.71042.84
208007001002523.8853.64
211000750100148.21232.52
22900725200144.81122.65
238007002001028.9923.01
248007252002523.2833.82
259007001502523.1863.48
Table 3. Analysis of variance of quadratic model for hardness response.
SourceSum of SquaresdfMean SquareF-Valuep-Value
Model2652.7714189.4839.92<0.0001significant
Residual47.47104.75
Lack of fit40.3658.075.680.0398significant
Pure error7.1051.42
Cor total2700.2424
R2 = 98.24%, R2 (adj) = 95.78%.
Table 4. Analysis of variance of quadratic model for tensile strength response.
SourceSum of SquaresdfMean SquareF-Valuep-Value
Model5744.8214410.3449.33<0.0001significant
Residual83.18108.32
Lack of fit82.68516.54165.36<0.0001significant
Pure error0.500050.1000
Cor total5828.0024
R2 = 98.57%, R2 (adj) = 96.57%.
Table 5. Analysis of variance of quadratic model for wear rate response.
SourceSum of SquaresdfMean SquareF-Valuep-Value
Model5.35140.382030.22<0.0001significant
Residual0.1264100.0126
Lack of fit0.124050.024850.600.0003significant
Pure error0.002450.0005
Cor total5.4724
R2 = 97.69%, R2 (adj) = 94.46%.
Table 6. Normalized values, grey relational coefficients, and grey relational grades of responses.
RunNormalized ValuesDeviation CoefficientGrey Relational CoefficientGRGRank
R1R2R3R1R2R3R1R2R3
10.0380.0680.2590.9620.9320.7410.3420.3490.4030.36518
20.3200.1690.5180.6800.8310.4820.4240.3760.5090.43612
30.3200.1690.5480.6800.8310.4520.4240.3760.5250.4429
40.0380.0850.2890.9620.9150.7110.3420.3530.4130.36916
50.0030.0000.0180.9971.0000.9820.3340.3330.3370.33524
61.0000.9491.0000.0000.0510.0001.0000.9081.0000.9691
70.0680.1690.5240.9320.8310.4760.3490.3760.5120.41214
80.5300.4070.6570.4700.5930.3430.5150.4570.5930.5226
90.0220.0850.2890.9780.9150.7110.3380.3530.4130.36817
100.5300.4070.6510.4700.5930.3490.5150.4570.5890.5217
110.4970.4920.7170.5030.5080.2830.4990.4960.6380.5445
120.7101.0000.8190.2900.0000.1810.6331.0000.7350.7892
130.0300.0170.0480.9700.9830.9520.3400.3370.3440.34121
140.0110.0170.0480.9890.9830.9520.3360.3370.3440.33922
150.0270.1190.4160.9730.8810.5840.3400.3620.4610.38815
160.0250.0510.0000.9750.9491.0000.3390.3450.3330.33923
170.3200.1690.5360.6800.8310.4640.4240.3760.5190.43910
180.3200.1690.5240.6800.8310.4760.4240.3760.5120.43711
190.5360.3560.6020.4640.6440.3980.5180.4370.5570.5048
200.0190.0340.1200.9810.9660.8800.3380.3410.3620.34720
210.6860.6780.7950.3140.3220.2050.6140.6080.7090.6443
220.5930.4920.7170.4070.5080.2830.5510.4960.6380.5624
230.1580.1530.5000.8420.8470.5000.3730.3710.5000.41513
240.0030.0000.0120.9971.0000.9880.3340.3330.3360.33425
250.0000.0510.2171.0000.9490.7830.3330.3450.3900.35619
Bolder values indicate the closest optimal controllable parameter combination with the highest GRG.
Table 7. Response table for grey relational grade.
ParametersLevelsMax–MinRank
123
A0.4068130.4429540.5243530.117544
B0.36490.46180.57040.20552
C0.41990.57950.40970.16983
D0.66260.46960.35760.3051
Total mean value of the grey relational grade = 0.47251. Bolder values indicate better performance attributes with higher grey relational grade.
Table 8. Analysis of variance of the quadratic model for GRG.
SourceSum of SquaresdfMean SquareF-Valuep-ValueContribution (%)
Model0.5250140.03759.580.0005significant
A—mould speed0.001510.00150.39550.54350.265
B—pouring temperature0.045210.045211.560.00688.012
C—stirring speed0.000310.00030.08030.78260.053
D—radial distance0.142410.142436.390.000125.24
AB0.000710.00070.18250.67830.124
AC0.000110.00010.02890.86830.017
AD0.000110.00010.02290.88270.017
BC0.000010.00000.01100.91870.01
BD0.014510.01453.710.08292.570
CD0.004510.00451.160.30680.797
0.006910.00691.750.21481.22
0.000210.00020.05890.81310.035
0.017710.01774.530.05913.137
0.002910.00290.73760.41050.514
Residual0.0391100.0039
Lack of fit0.038950.0078186.74<0.0001significant
Pure error0.000250.0000
Cor total0.564124
Table 9. Comparison between initial and optimal main parameters.
Initial Controllable ParametersOptimal Controllable Parameters
PredictionExperiment
Setting levelA1B1C1D1A3B3C2D1A3B3C2D1
Hardness (BHN)34.8 59.7
Tensile strength (MPa)93 139
Wear rate × 10−3 (mm3/m)2.95 2.18
0.4390.9190.969
Improvement in GRG = 0.5469.
Disclaimer/Publisher’s Note: The statements, opinions and data contained in all publications are solely those of the individual author(s) and contributor(s) and not of MDPI and/or the editor(s). MDPI and/or the editor(s) disclaim responsibility for any injury to people or property resulting from any ideas, methods, instructions or products referred to in the content.

