Article

Influence of Different Contact Conditions on Friction Properties of AISI 430 Steel Sheet with Deep Drawing Quality

by
Valmir Dias Luiz
1,2,*,
Anderson Júnior dos Santos
1,
Marcelo Araújo Câmara
1 and
Paulo César de Matos Rodrigues
1
1
Graduate Program in Mechanical Engineering, Universidade Federal de Minas Gerais, Av. Antônio Carlos, 6627, Pampulha, Belo Horizonte 31270-901, MG, Brazil
2
Department of Metallurgy and Chemistry, Centro Federal de Educação Tecnológica de Minas Gerais, R. 19 de Novembro, 121, Centro Norte, Timóteo 35180-008, MG, Brazil
*
Author to whom correspondence should be addressed.
Coatings 2023, 13(4), 771; https://doi.org/10.3390/coatings13040771
Submission received: 30 December 2022 / Revised: 28 March 2023 / Accepted: 12 April 2023 / Published: 14 April 2023
(This article belongs to the Special Issue Microstructure, Fatigue and Wear Properties of Steels)

Abstract

:
This article aims to investigate the influence of different contact conditions on the friction properties of an Nb-stabilized AISI 430 ferritic stainless-steel sheet with deep drawing quality. Three tribological tests were performed: pin-on-disk, bending under tension, and strip-tension test. Moreover, counter samples of a hard metal (WC-12%Co) with surface finishes of 0.27 and 0.54 μm were used in the friction tests under dry and lubricated conditions. The influence of the texture and relative elongation of the strip on formability also were investigated. A comparative analysis of the results revealed that the coefficients of friction, wear, lubricant efficiency, and hardness measured below the wear surface indicated a strong dependence on surface roughness and the friction test type. The coefficients of friction obtained from the pin-on-disk test were higher than those obtained from the formability tests. In addition, the coefficient of friction increased with increasing relative elongation during the formability tests; it was higher in the bending-under-tension test than in the strip-tension test, mainly owing to the increasing strip surface roughness. The contact pressure during the formability tests was non-uniform during strip sliding under the tool. According to our results, for each friction condition in a specific area of the forming die, there is a value of the coefficient of friction, depending on the kinematic conditions. Therefore, the results can be used as input data to define design guidelines, improve productivity, and improve product quality from this steel sheet.

1. Introduction

Sheet metal forming (SMF) is an efficient and widely used manufacturing process in the production of pieces with complex geometries [1]. During stamping, friction between the sheet metal and the die has a significant impact on formability, surface quality, and die wear [2]. Several studies have been conducted to solve tribological problems in SMF processes. However, the results showed that these problems are difficult to solve because they differ from the tribological problems in actual SMF processes: tribological factors in actual forming are more complicated than in laboratory forming.
Friction is a crucial factor in tribological systems; it occurs because of the resistance to the relative motion between two bodies in contact. Holmberg and Erdemir [3] found that approximately 23% of global energy consumption can be attributed to tribological contact. It is commonly assumed that 20% of the consumed energy is used to overcome friction, and 3% is the cost of regenerating parts worn owing to failure or wear. As illustrated in Figure 1, the formability of sheet metal is influenced by several factors, for example, tribological aspects. In the case of SMF processes, the coefficient of friction (COF) is influenced by the surface roughness of the tool and sheet, friction conditions, lubricant properties, sliding velocity, and pressure values [4]. In most SMF processes, friction is an undesirable phenomenon due to the deleterious effects on equipment and products. Several parameters influence the tribological behavior of sheet metal during the forming process, for example, physicochemical phenomena, temperature, kinematics of tool movement, and dynamics of load [5,6].
Furthermore, the frictional resistances that exist in SMF under lubricated conditions depend on the interaction between two mechanisms: adhesion and flattening/roughening of the asperities [7]. Notoriously, the sheet roughness directly interferes with the occurrence and intensity of these two mechanisms. When low, the adhesion mechanism is dominant, while high, the mechanism of flattening/roughening of the asperities dominates. As the sheet hardness is significantly lower than that of the forming tool, this latter mechanism increases with increasing sheet metal deformation [8].
The study of friction is important to increase the quality of manufactured products and increase the life of components in engineering applications. For example, techniques such as the deposition of surface coatings have been increasingly used [9,10]. Owing to the presence of different contact pressures, stress states, and displacement speeds in specific regions of a piece manufactured by SMF processes, a series of friction tests were developed to simulate the tribological behavior. According to Staeves [11], these tests can be classified as follows: (1) operating trials (real forming tests in industrial processes), (2) laboratory-scale forming tests, (3) tribometer tests for sheet metal forming, and (4) general tribometer tests. Schell and Groche [12] emphasized that the tribometer tests of Group 1 are in-situ methods integrated into the press shop forming operations of real parts under the conditions of series production. The Group 2 tests can be used for the investigation of tribological systems (e.g., testing lubricants) with respect to their suitability for certain SMF processes. However, this group lacks a direct measurement of the forces involved in the tribocontact [13]. In contrast, Group 3 tests are most suitable for the study of tribological behavior under specific conditions, such as sliding velocity, contact pressure, roughness, and temperature. These studies focus on determining the COF value through different tribological tests of metallic strips (e.g., bending under tension test). The great advantage of Group 2 tribometers over Group 3 ones is the possibility of easily adjusting the tribological conditions independently. The main advantage of Group 4 tribometers (e.g., pin-on-disk or PoD) is their level of standardization. The disadvantage is their low transferability to SMF processes owing to different tribological conditions. As the contact area is small, this affects the COF value in lubricated contacts. In contrast to SMF processes, the relative motion of the tribological pair occurs over the same contact area. Finally, in contrast to the Group 4 tests, the deformation of the sheet metal affects the friction properties due to the increase in its surface roughness [8,14].
Recently, Trzepiecinski and Lemu [4] presented a review of the methods used to describe friction conditions in conventional SMF developments over the years. According to the authors, several friction tests have been used to simulate the friction phenomena in specific regions of SMF processes, for example, the strip-tension test (STT; sliding of the strip in the region of the punch radius) [8], bending under tension test (BUT) (sliding of the strip in the region of the die radius) [15], draw-bead test (DBT) [16,17], and strip drawing test (SDT) [14]. Bay et al. [18] divided friction tests used in SMF processes with respect to the sliding length, surface expansion, and normal pressure value into three groups. In Group 1 (bending under tension tests), the pressures are medium, low sliding speeds, but no surface expansion; On the other hand, in Group 2 (draw-bead tests) the pressures are medium-to-high, medium sliding lengths, and also no surface expansion; and in Group 3 (strip-reduction tests) the pressures are high, low sliding lengths, and in this case with surface expansion. Schmitz et al. [19] emphasize that laboratory tests remain the most accurate methods for investigating the friction and wear of arbitrary tribological pairs.
In recent years, there has been an increase in the use of stainless steel in applications requiring corrosion resistance and weight reduction, respectively [20,21]. Stainless steel is an alloy containing at least 10.5% Cr, which guarantees high corrosion resistance [22]. Cr is an element that stabilizes Ferrite-α, the body-centered structure of iron, and when homogeneously dispersed in a solid solution of steel, comes into contact with oxygen, forming a thin passive layer (3–5 nm) [23]. Ti and Nb are the stabilizing elements most commonly used. This layer is continuous and resistant over the entire surface, protecting it against corrosive attacks by the environment. In particular, corrosion resistance increases the longevity and integrity of metallic products. One of the ways found to improve the efficiency of this type of material in certain applications was achieved by reducing density [24,25].
However, the tribological behavior of a stainless-steel sheet in specific areas of a stamped part has rarely been investigated. Kirkhorn et al. [26] emphasized that friction-related aspects have been one of the main concerns in the manufacturing industry because they significantly influence productivity and product quality. For example, the SMF process is based on the deformation of a blank caused by the relative movement between a sheet and a tool. To produce high-quality products, it is important to understand and control the friction conditions because frictional forces influence the sheet metal formability and deformation distribution in the tool.
In this context, ferritic stainless steels (FSSs) have recently gained considerable prominence in SMF processes, mainly because of their excellent deep drawing capacity and lower cost compared to austenitic steels. Their lower cost is due to their lower Nb concentration, as the value of this metallic element has shown high volatility in recent years [27]. The excellent deep drawing capacity of FSS is because of the anisotropy of their properties, which is a result of the crystallographic texture of the material. This characteristic makes FSS more resistant to thinning than austenitic stainless steels (ASSs), which makes it possible to produce deeper blankets [28]. For these reasons, FSS has been widely used in applications requiring a combination of corrosion resistance and deep design quality (DDQ), such as in automotive parts, home appliances, dishes and cutlery, chimney ducts, decorative components, and dairy and catering equipment.
Therefore, this study aimed to investigate the influence of different contact conditions on the friction properties of Nb-stabilized AISI 430 steel sheets with deep drawing quality (DDQ). The friction conditions of specific areas of the stamped part were reproduced using PoD, BUT, and STT tests. In addition, the effects of the counter sample finish, relative elongation (only in the formability tests), and lubrification conditions were investigated. Due to the experimental nature of this article, the experimental results of COFs can be used as input data for numerical simulations, define design guidelines, improve productivity, and improve product quality from this material.

2. Materials and Methods

2.1. Materials

In this study, specimens were cut from a 0.8 mm-thick Nb-stabilized AISI 430 stainless-steel sheet with DDQ. This sheet was fabricated in accordance with the ASTM A480:2020 standard [29], with a no 2 B finish (cold-rolled, bright finish). The surface roughness parameters of the steel sheet were as follows: average roughness Sa = 0.053 μm and root-mean-square roughness Sq = 0.077 μm. The chemical compositions are listed in Table 1.
The mechanical parameters of the steel sheet (Table 2) were determined using a tensile test in accordance with ISO 6892-1:2020 [30]. The procedures described by Banabic et al. [31] were used to determine coefficients n, r, r b , and Δr. The tensile tests were performed on an Emic DL30000 universal testing machine (Instron/Emic; Massachusetts, USA) with a capacity of up to 300 kN. The specimens were prepared using a wire EDM Eurostec EURO-FW1 (Eurostec; Rio Grande do Sul, Brazil) to avoid distortions or microstructural changes in the cutting region. Three specimens were taken for each sheet rolling direction (RD; 0°, 45°, and 90°) in accordance with the ASTM E8:2016 standard [32]. The hardness of the as-received specimens was tested using a Vickers HMV-2T micro-durometer (Shimadzu; Kyoto, Japan) at a test force of 0.245 N. The average hardness was 120.6 ± 5 HV.
The counter samples used in the friction simulation tests were manufactured from TSF44 ultrafine carbide (WC-12% Co). In general, hard metals exhibit excellent tribological and thermal properties, wear resistance, hardness, toughness, and resistance to transverse rupture. These characteristics enable carbides to be widely used to produce wear-resistant tools and components. For each type of friction test (PoD and formability), two counter samples were manufactured at two different finishing levels (Level A: Sa = 0.27 μm, Sq = 0.37 μm; Level B: Sa = 0.54 μm, Sq = 0.74 μm).

2.2. Experimental Procedures

2.2.1. Pin-on-Disk Test

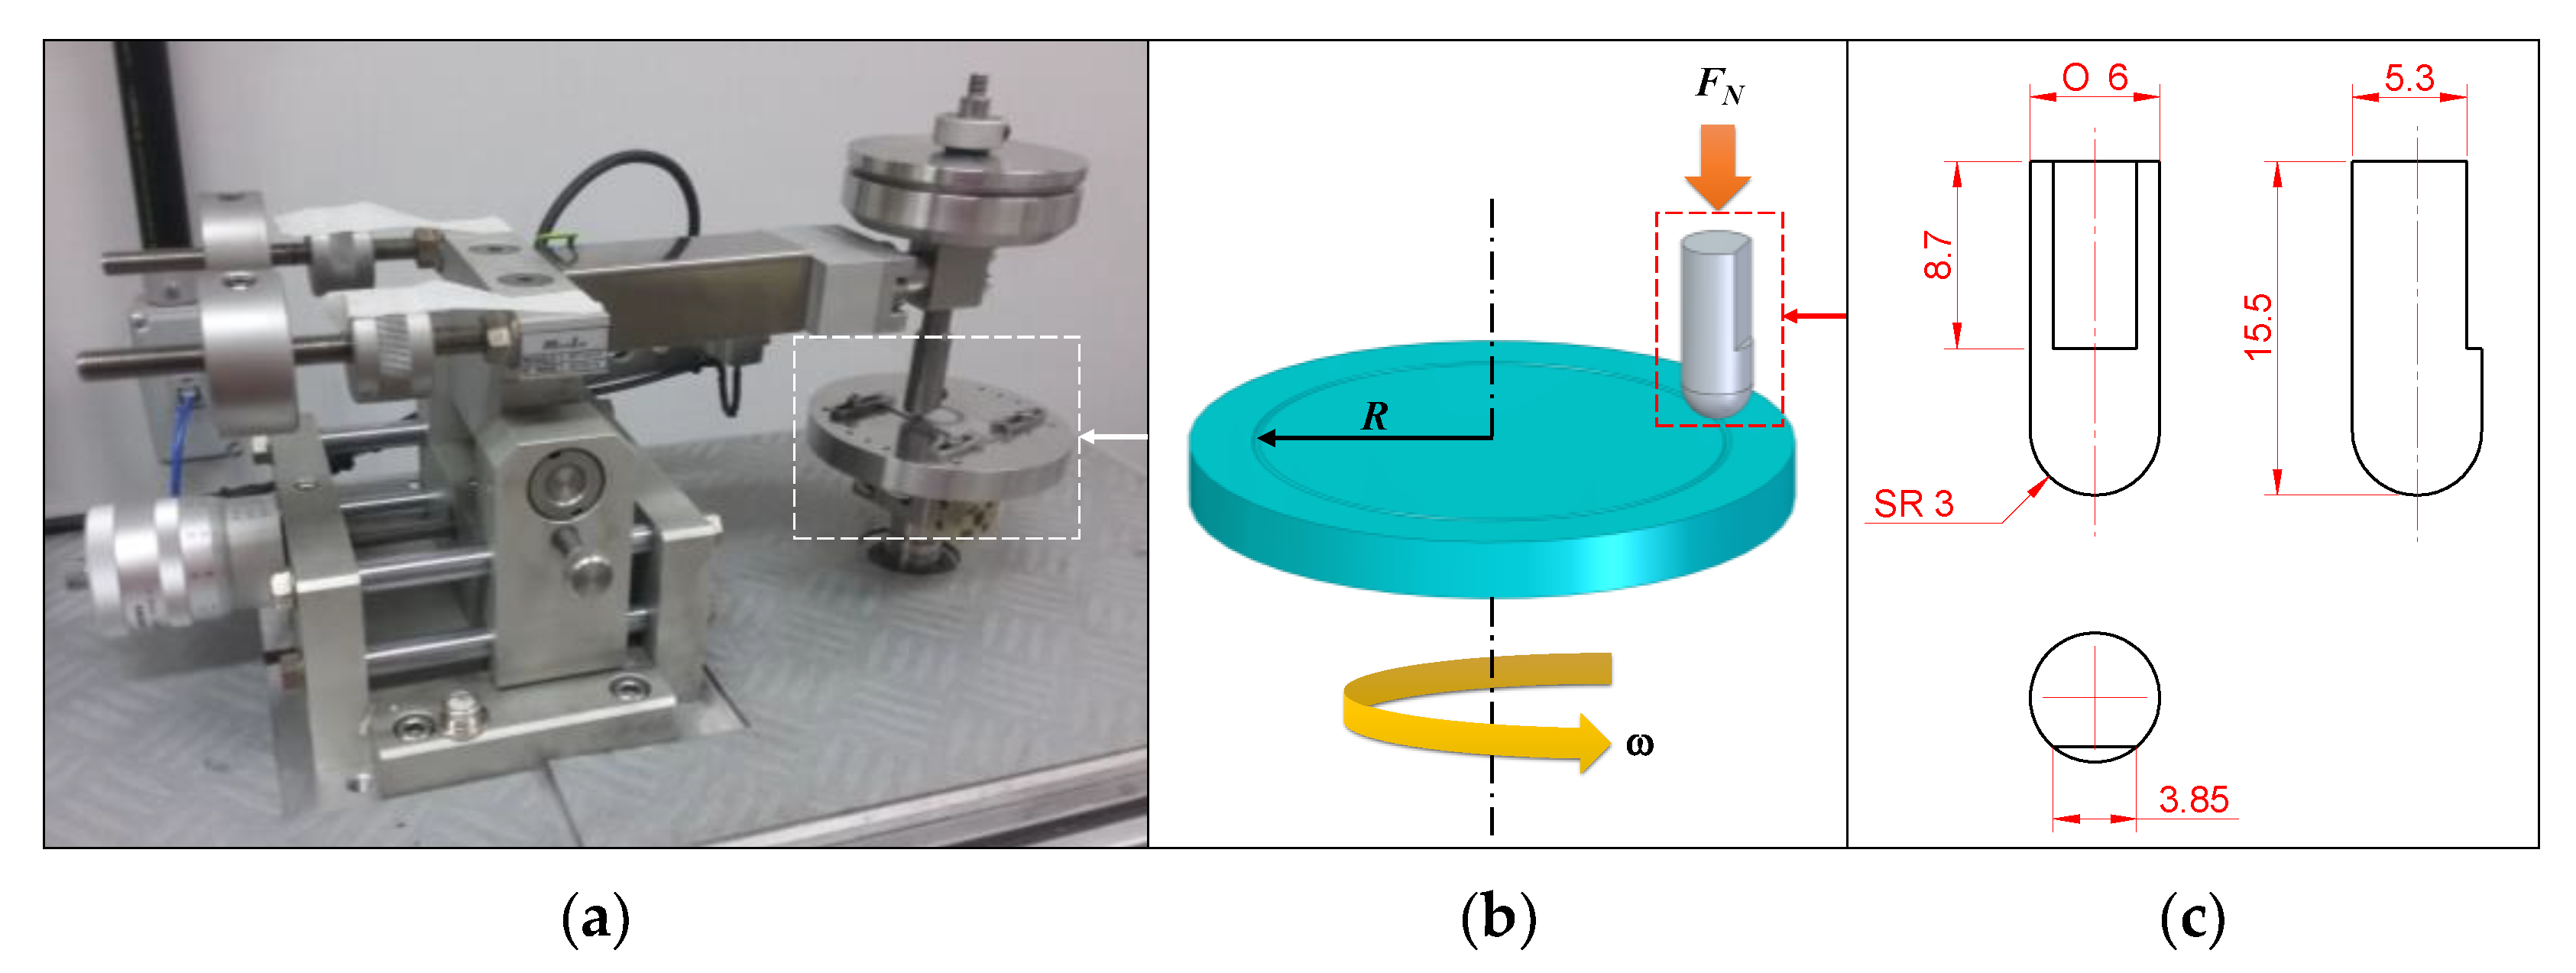
The PoD tests were performed under dry and lubricated conditions using a tribometer (Microphotonics SMT-A/0100-MT/60/NI, Microtest AS; Allentown, PA, USA), as shown in Figure 2a. The movement diagram of the test and dimensions of the carbide pin are illustrated in Figure 2b and Figure 2c, respectively.
The operational parameters are listed in Table 3. The lubricant used in the tribological tests had a viscosity of 120 mPa and a density of 0.894 g/cm3.
The frictional or tangential force F f and sliding distance L d were simultaneously measured during the PoD tests. As shown in Equation (1), the value of the COF was determined using the Amontons–Coulomb law [33], where COF (μ) is defined as the ratio of the frictional force F f to the normal force F N .
μ = F f F N
From the data recorded in the PoD test and measured for the specimens after the tests, the wear rate (introduced by Archard (1953)) [34] was determined using Equation (2).
K s = V · H N · L d
where K s is the Archard dimensionless constant, V is the volume loss, H is the hardness of the softest material, N is the applied normal load, and L d is the sliding distance.
Based on the ASTM G99-05:2012 guidelines [35], the loss of mass of the specimens was converted to loss of volume using Equation (3). The specimen masses were measured using an analytical balance (Shimadzu AUW220D, Shimadzu; Kyoto, Japan) with a resolution of 0.00001 g.
volume loss = mass loss density × 1000
where the units of volume loss, mass loss, and density are mm3, g, and g/cm3, respectively.

2.2.2. Formability Tests

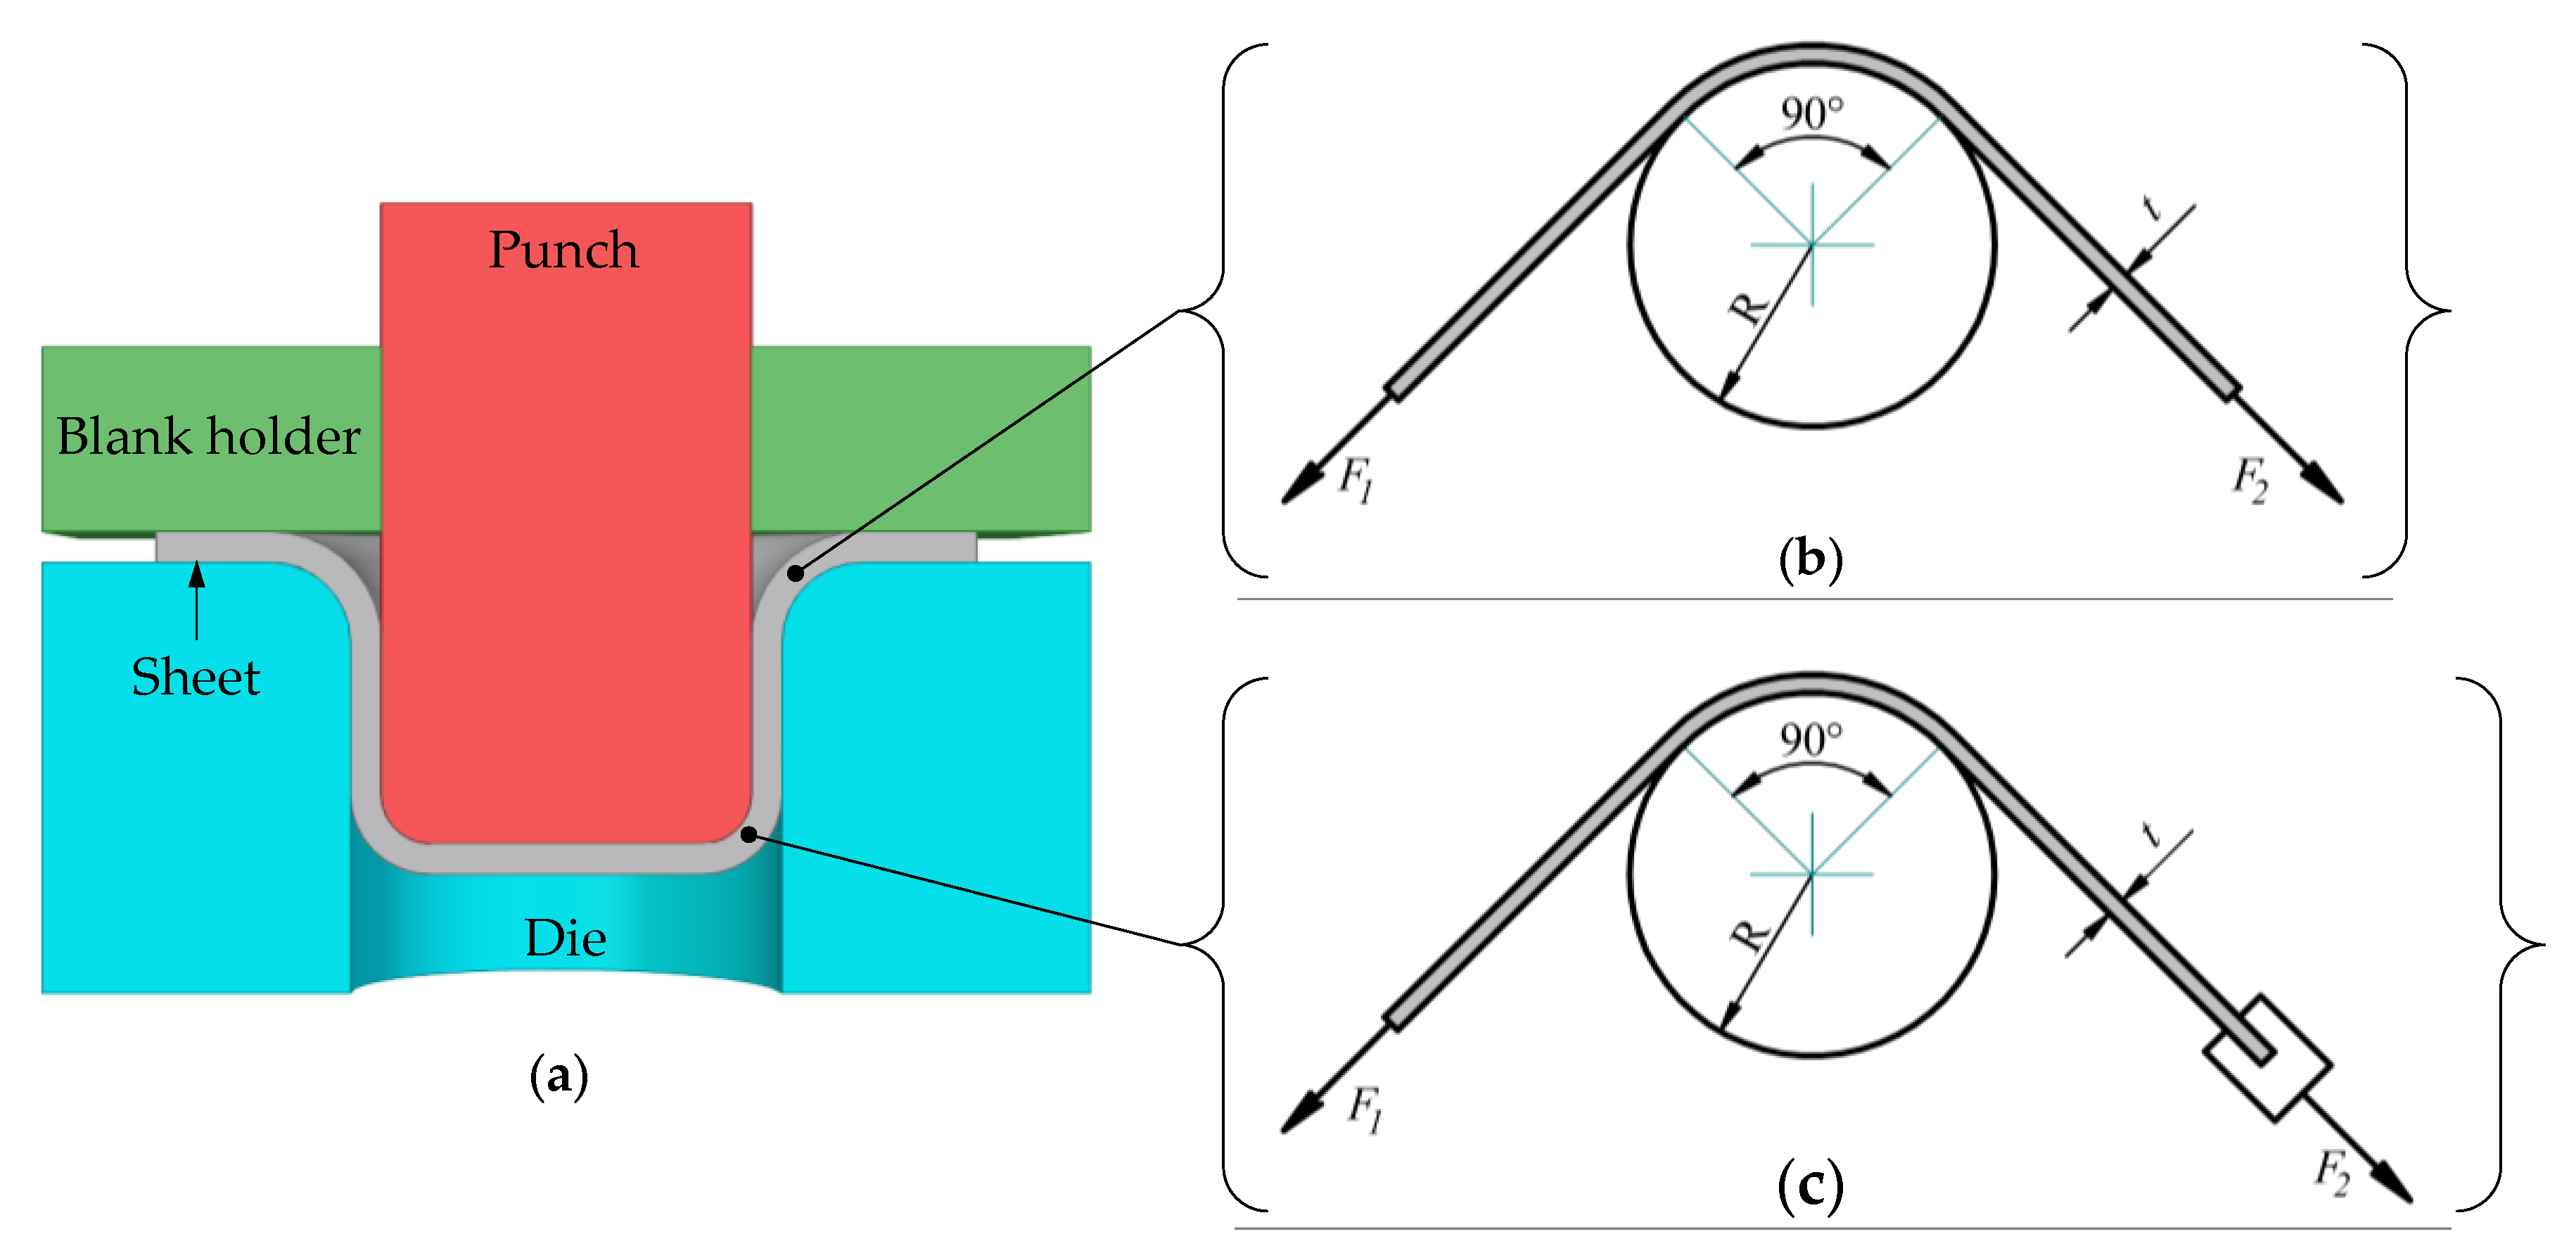
The friction tests simulating the contact conditions in the region of the die radius and punch in the deep drawing processes (Figure 3a) are illustrated in Figure 3b and Figure 3c, respectively.
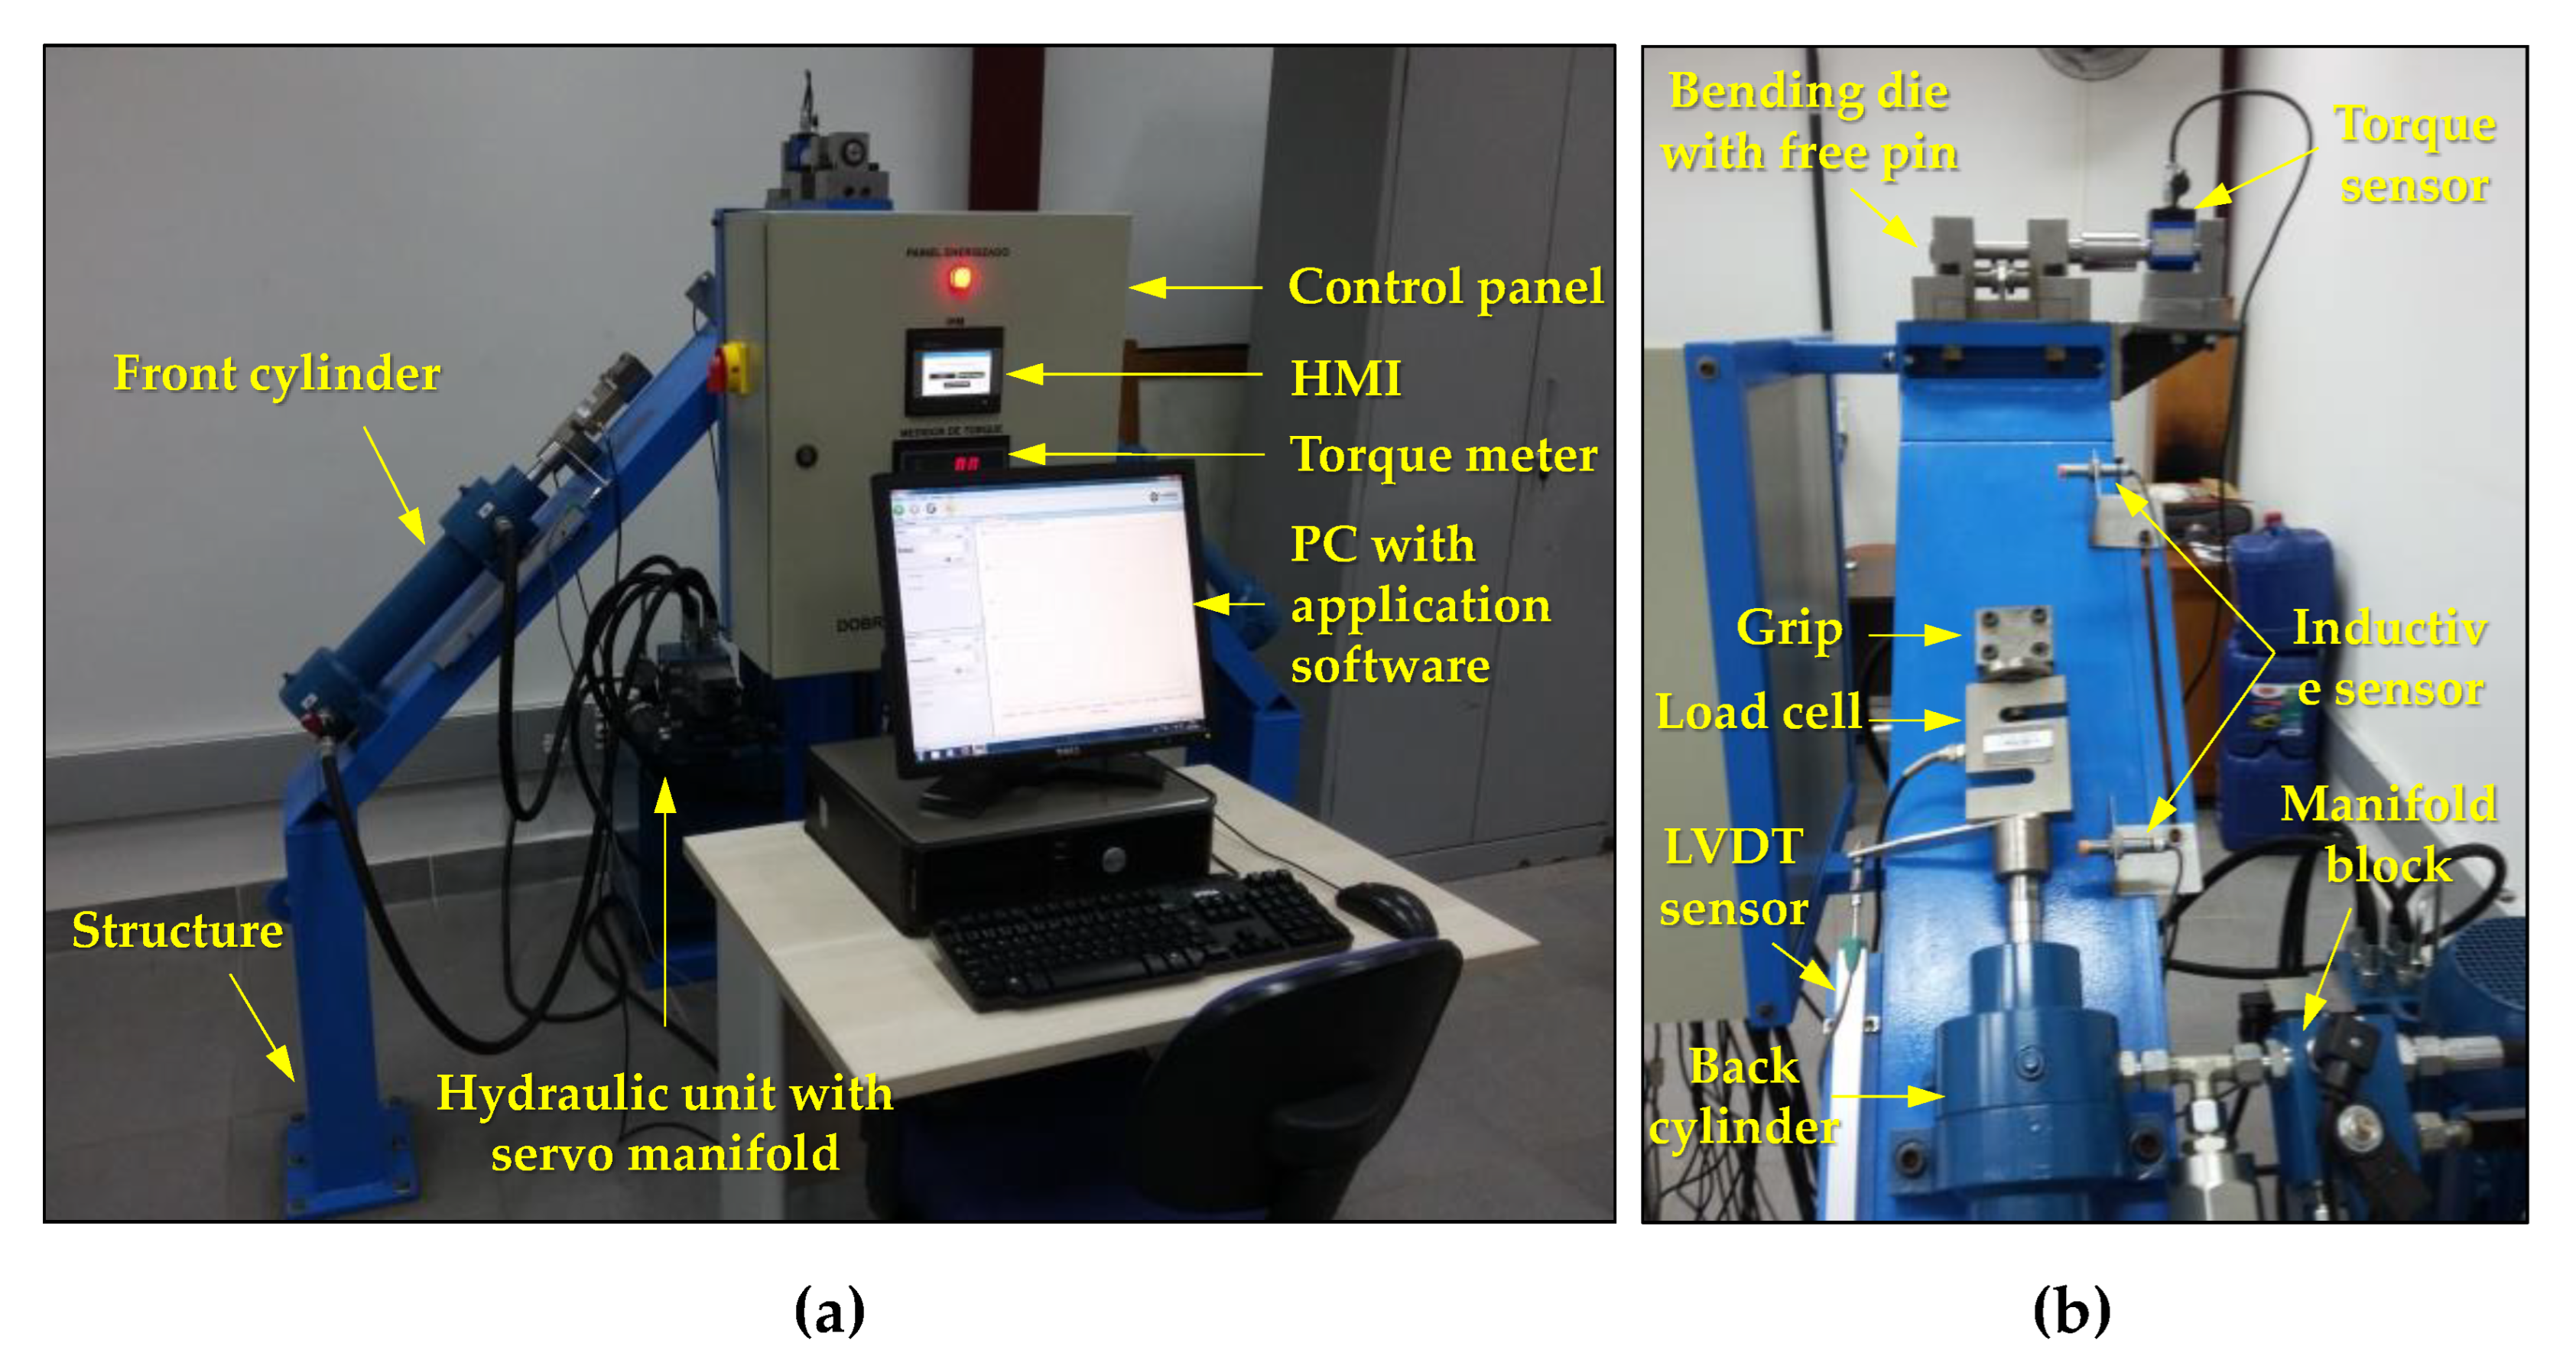
The contact condition illustrated in Figure 3b (BUT test) consists of bending and sliding a strip (t) around the radius (R) of the bending pin, thus simulating the contact condition between die/sheet in SMF processes [15]. In this test, a force is applied at one end of the strip (frontal force F 1 ) to cause a movement relative to the bending pin, whereas at the other end of the strip, a force opposite to the movement (back force F 1 ) is applied to submit it to the effect of stretching [22]. However, in the contact condition illustrated in Figure 3c (STT test), one end of the strip moves at a constant speed (owing to F 2 ), whereas the other end remains fixed (owing to t), thus simulating the contact condition between the punch radius/sheet. Figure 4 shows images of the tribo-simulator for studies on the SMF process.
The parameters used in the formability tests are presented in Table 4. It is important to emphasize that for each new test, the surfaces were cleaned using acetone, and the lubricant was then applied abundantly.
The COF (μ) was determined using Equation (4) (introduced by Andreassen et al.) [36], which defines the COF in the SMF process as the ratio between the friction stress τ and contact pressure p .
μ = τ p = 4 T π R F 1 + F 2
where T is friction-induced torque.
To describe how the COF changes as the specimens elongate, Equation (5) was used to determine the relative elongation ε r [8,14]:
ε r = l 1 l 0 l 0 × 100 %
where l 1 and l 0 are the final and initial lengths of the specimens, respectively.
The effectiveness of the lubricant ( L e -index) used in the friction tests was determined by Equation (6) [8,14].
L e = μ d μ l μ d × 100 %
where μ d is the dry COF and μ l is the lubricated COF.

3. Results and Discussion

3.1. Pin-on-Disk Test

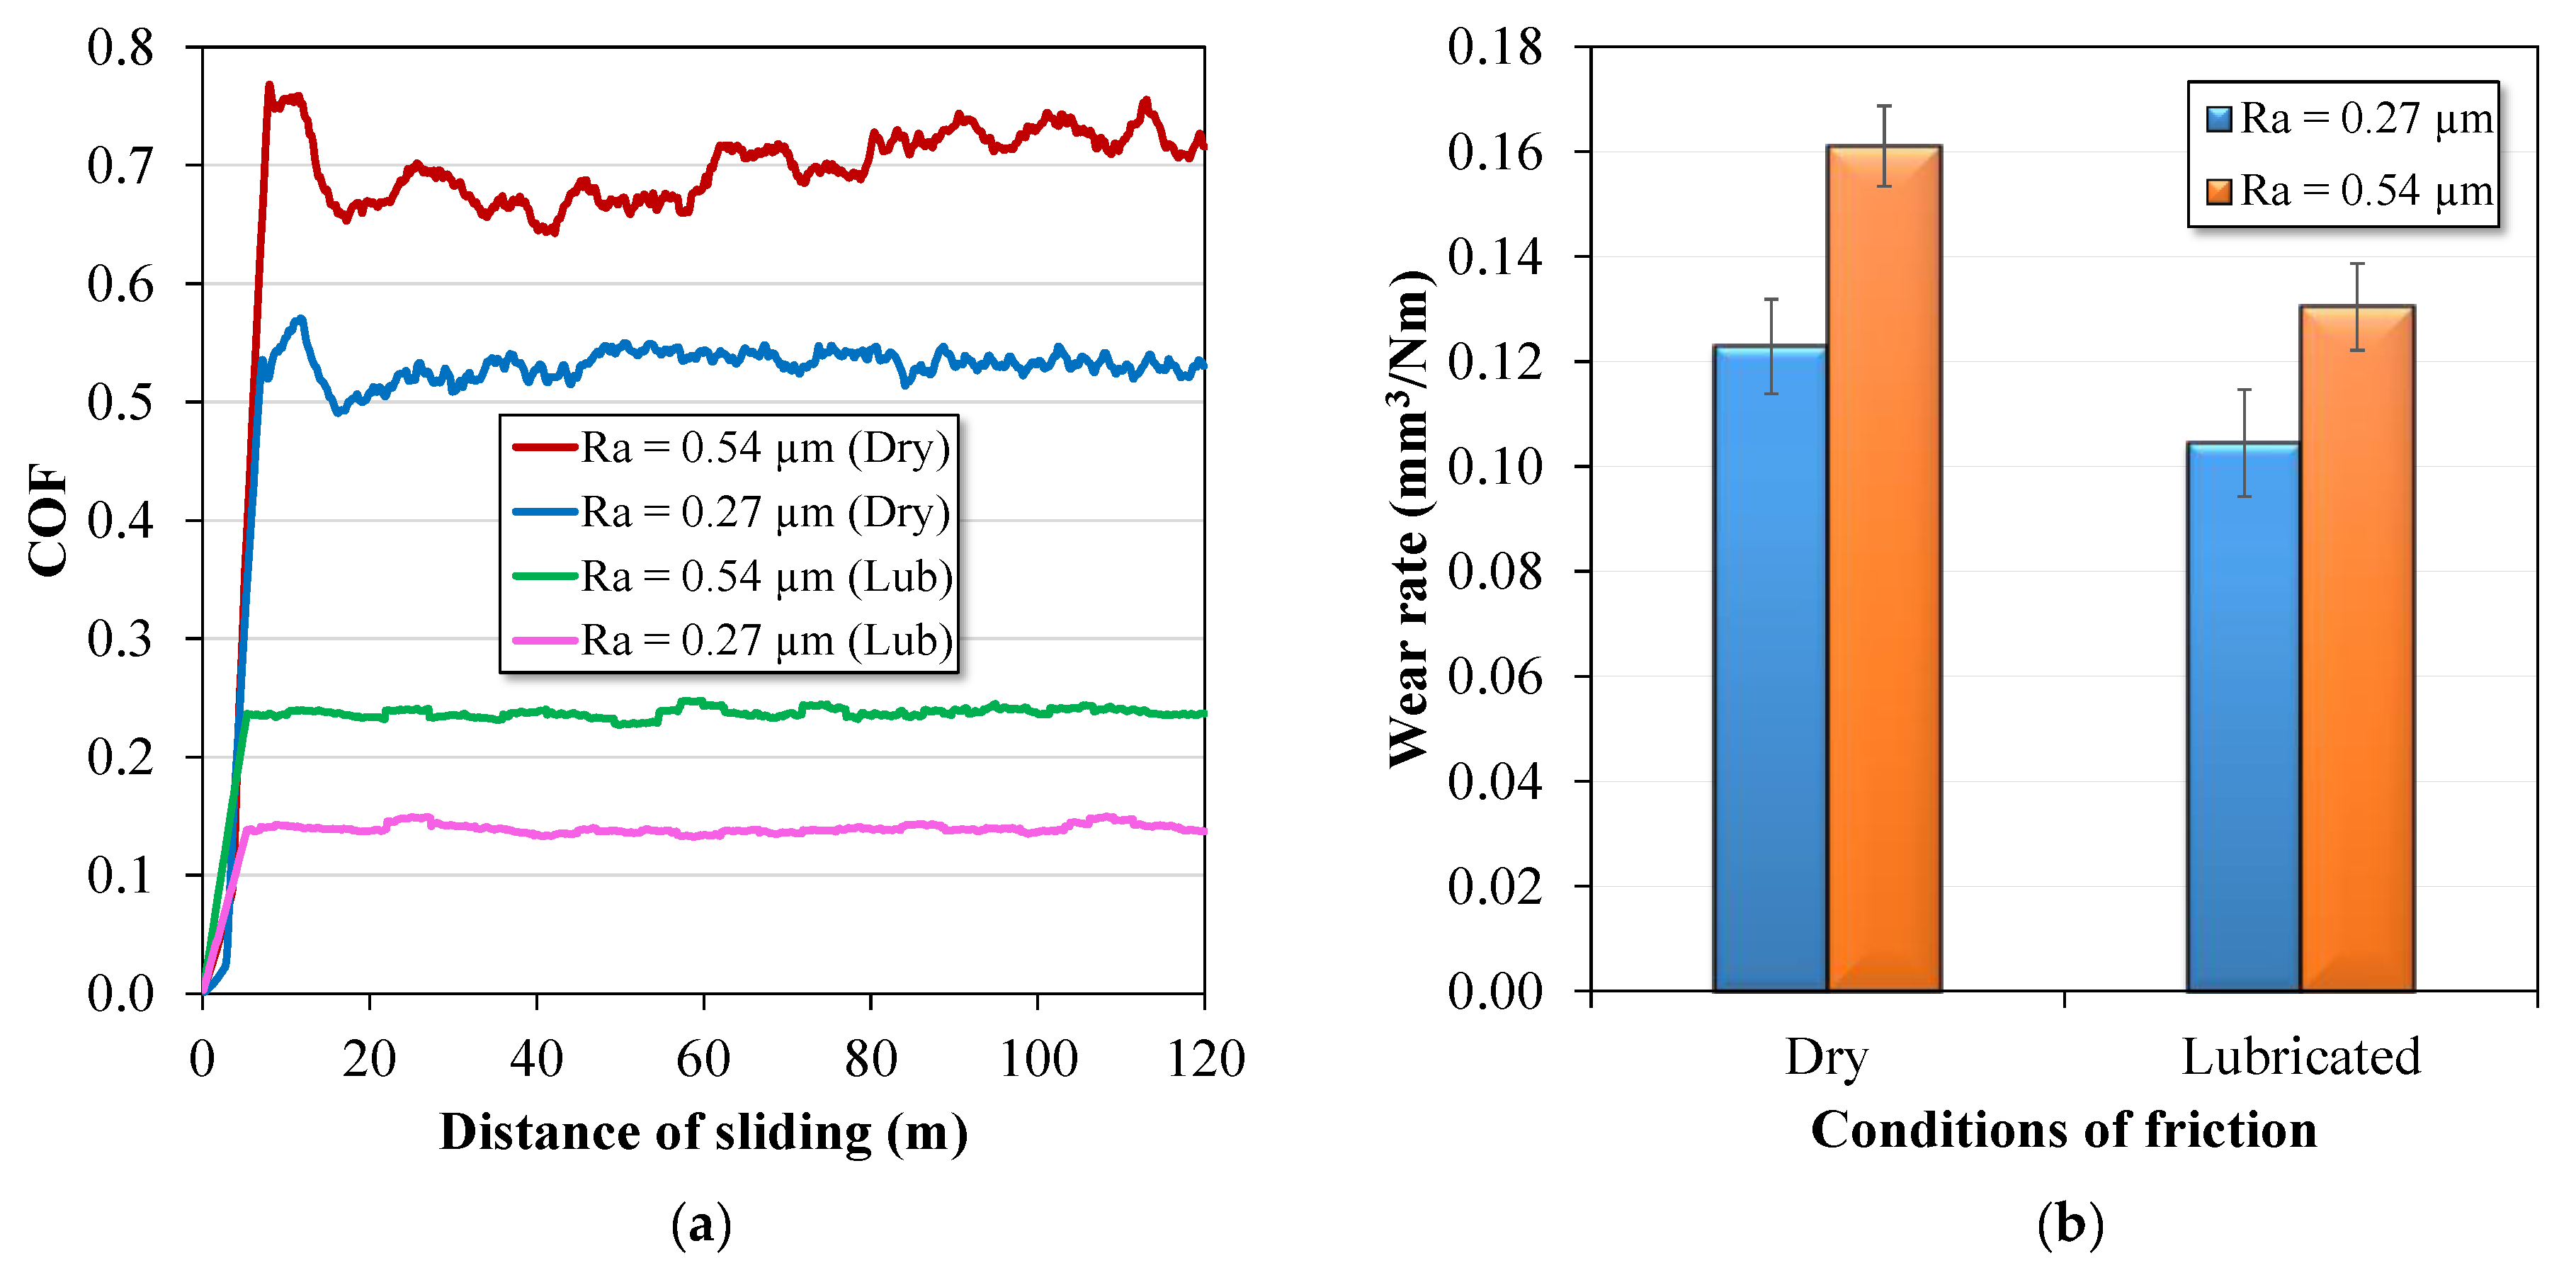
Figure 5 shows the COF value and wear rate as functions of the pin roughness (parameter Ra) and lubrication conditions. It can be seen that the COF value and wear rate increase as the pin roughness increases under dry and lubricated conditions. Generally, carbide tools with rough surfaces sliding under a soft and smooth surface produce a greater amount of debris, which increases the friction and wear rate. Additionally, Figure 5a,b demonstrates that the lubricant decreases the friction and wear rates. The lubricant reduces the effect of intermolecular forces that cause adhesion between tribosurfaces, and as a result, the resistance to friction and wear is lower compared to those in tests carried out under dry conditions.
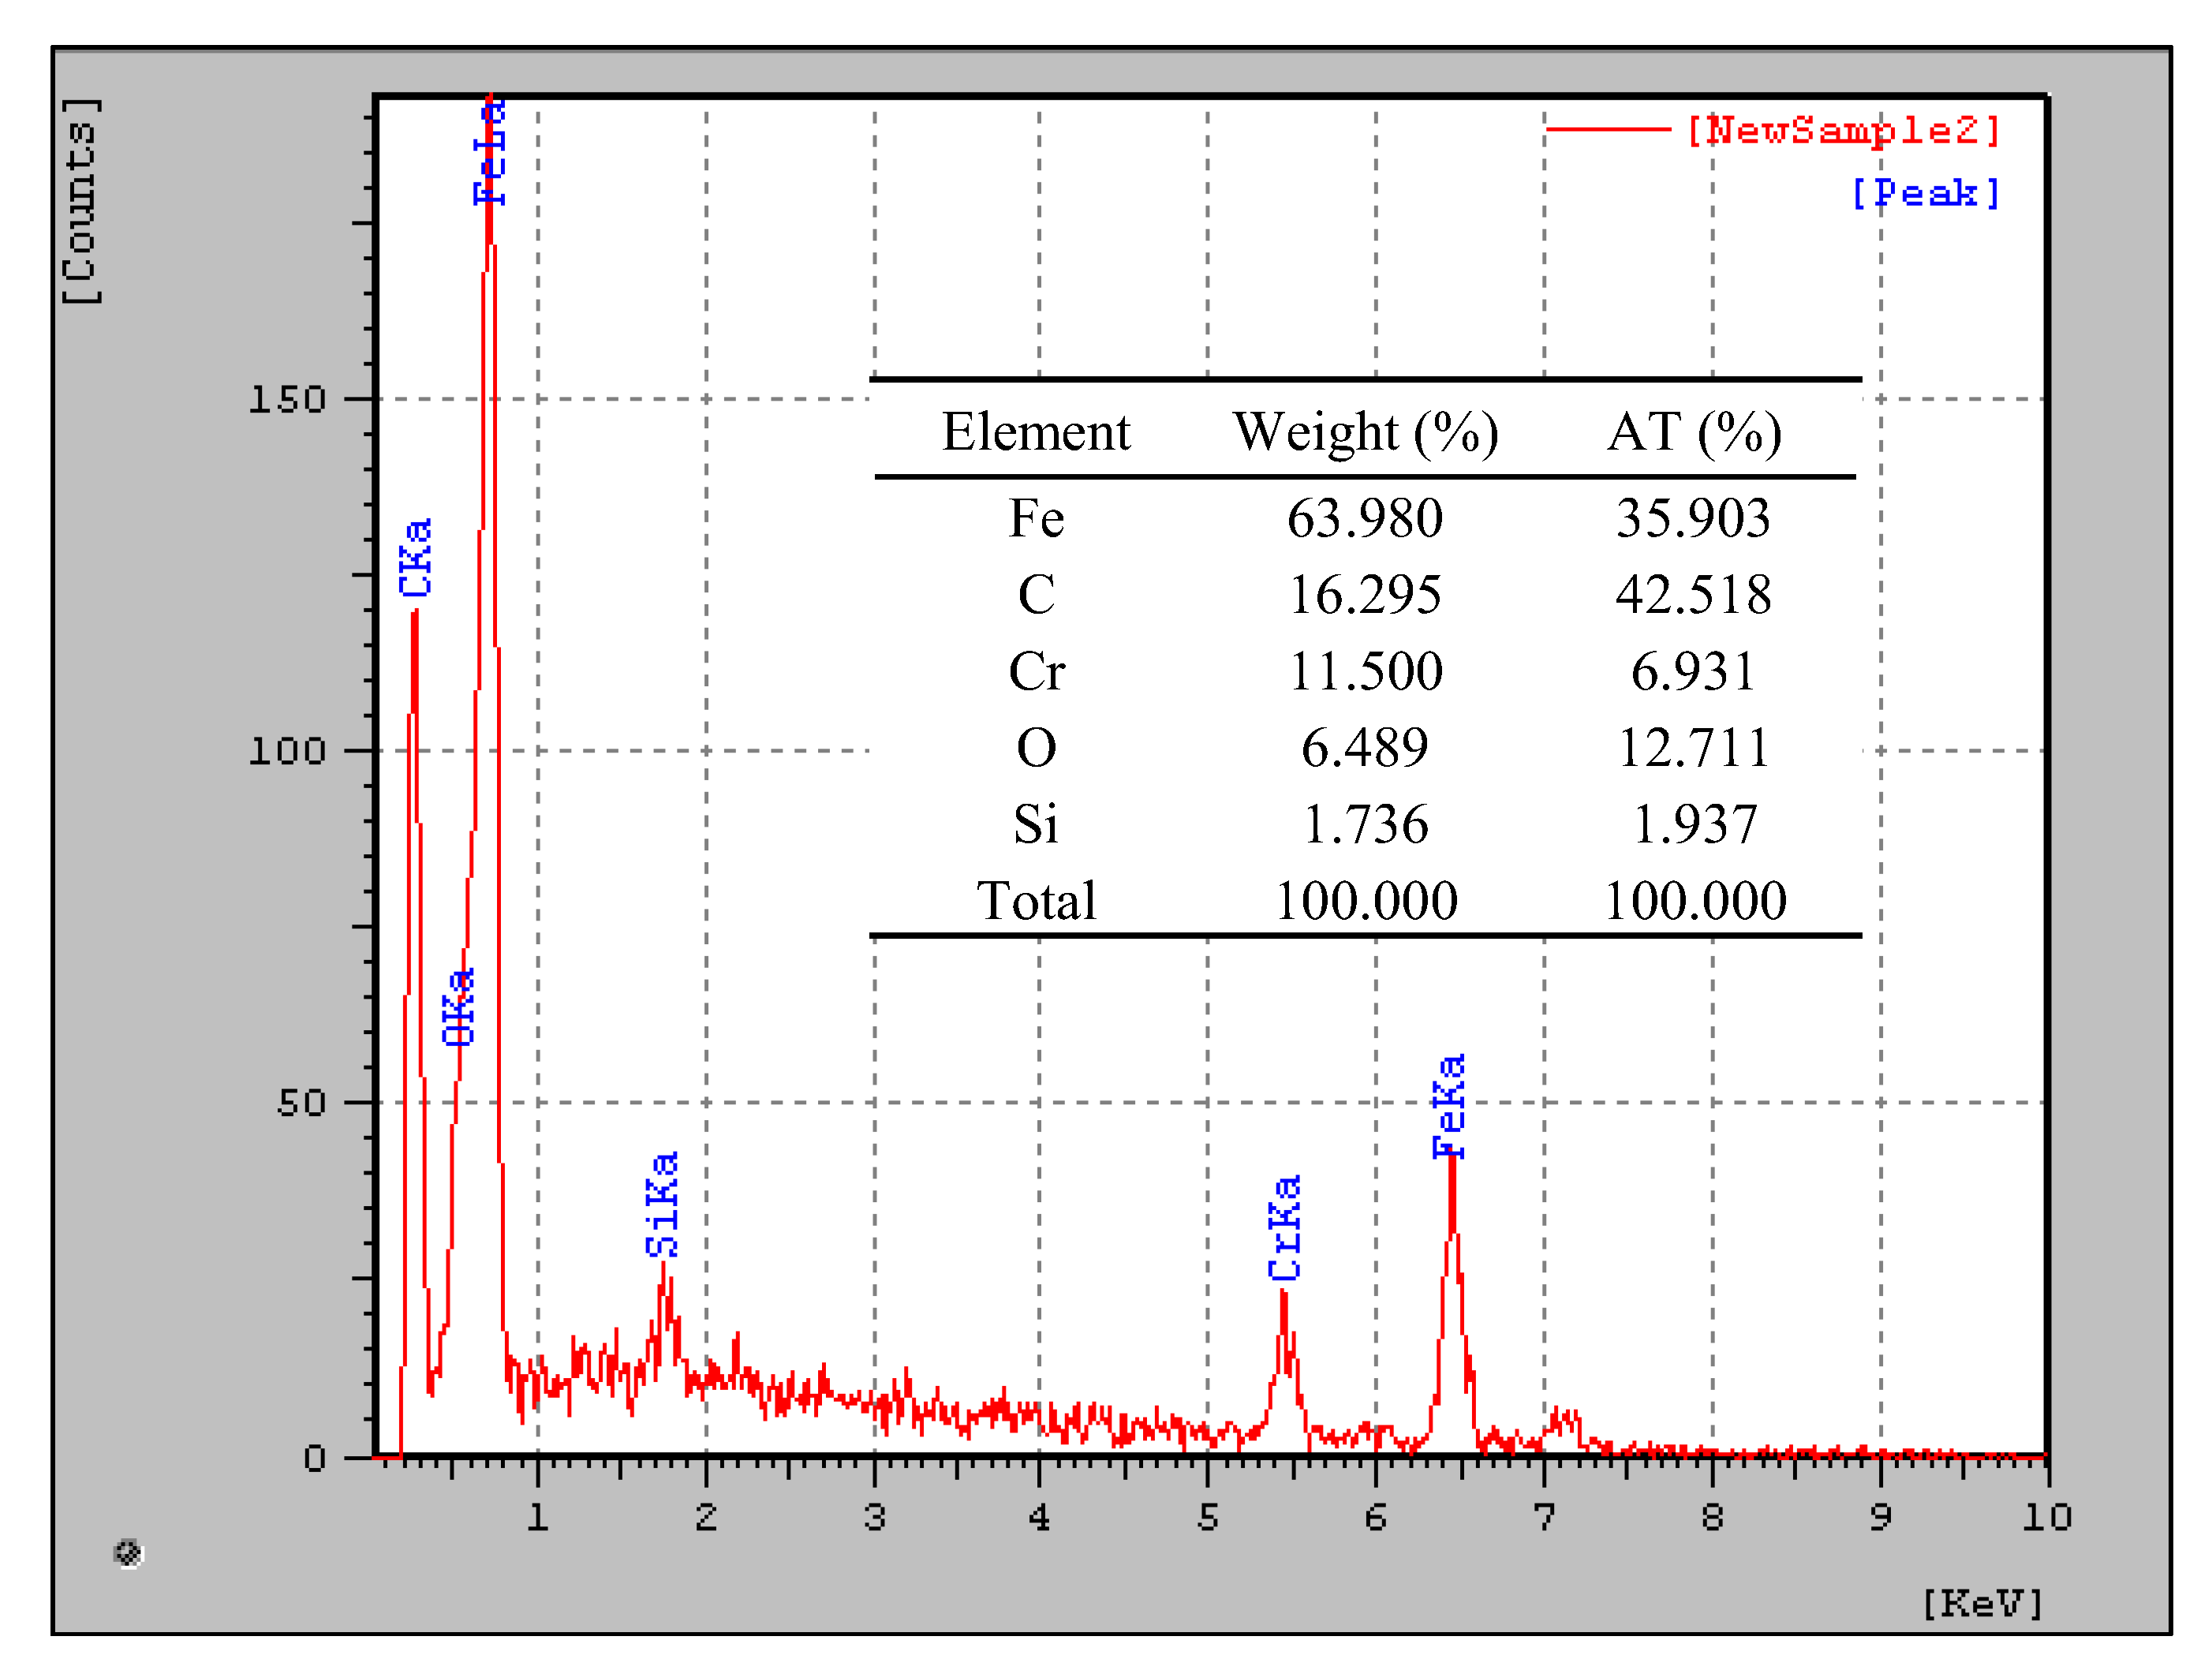
The occurrence of the stick-slip phenomenon that develops owing to the difference between static and dynamic friction is more evident under dry condition. Two factors contributed significantly to the decrease in friction at this stage. First, an oxide layer was formed, which acted as a solid lubricant in the interfacial areas of the sliding contact. In this regard, it can be seen in the EDS analysis in Figure 6 that high concentrations of O and Fe are present within the wear track, indicating that layers of a Fe-based oxide were formed on the wear track because of the heat generated by the friction in the tribocontact. Based on these results and the arguments of Hutchings and Shipway [37], it can be concluded that the oxide layer acts as a solid lubricant film (reducing friction and wear) if its hardness is less than that of the worn material surface. Additionally, the severe wear mechanism in the PoD test was mitigated by the presence of oxides formed during the sliding contact of the tribosurfaces. The second factor causing the decrease in friction was a decrease in the processes of grooving and asperity flattening or deformation, which attenuated the increase in the normal pressure. The real contact area is a function of the normal load, roughness of the tribosurfaces, mechanical properties (e.g., degree of asperity strain hardening), and contact surface geometry [14].
In addition, the COF under the dry condition showed greater instability (variation) along the sliding track when the pin with the greater roughness (Ra = 0.54 μm as compared to 0.27 μm) was used. This behavior can be attributed to two main reasons. First, a pin with a higher roughness tends to cause greater damage to the soft surface owing to plastic deformation, fracture [38], and deterioration of the oxide layer that functions as a solid lubricant. Figure 5a shows that after 60 m of sliding, the COF exhibits a tendency to increase with the use of the rougher pin under the dry condition. Second, as reported, FSSs have low ductility and toughness; as a result, they produce larger wear particles and exhibit a stronger tendency to agglomerate wear debris than ASSs. Holmberg and Matthews [39] explained that the agglomeration of debris acts as a third body at the interface of the tribocontact, which in turn can plow and plastically deform the soft surface asperities, increasing the friction and wear rate.
A combination of friction and an increase in temperature may also have contributed to the adhesive property of wear debris on the surface of the pin, thus aggravating the abrasive wear mechanism. This behavior can be explained by the high metallurgical compatibility between W and Cr, as the pin is carbide (WC-12% Co) and the specimen is AISI 430 FSS (containing a high concentration of Cr) (Table 1). This high metallurgical compatibility is supported by the Rabinowicz table [33].
The optical microscopy image of a specimen section in Figure 7a shows that the wear track surface is rougher, and the subsurface presents highly deformed and hardened grains. Figure 7b shows an image of the wear track surface obtained using a scanning electron microscope (SEM) (Jeol JSM-6510 LV, Jeol Ltd; Tokyo, Japan) with an acceleration voltage of 10.0 kV. The wear track surface presents a number of micro-effects resulting from sliding wear mechanisms, such as debris particles, cracks, grooves, and delamination flakes. Fatigue crack propagation in the direction perpendicular to the sliding direction was caused by the large tensile deformation of the specimen surface. The grooves were deeper owing to the plowing or plastic deformation and abrasive wear imposed by the hard asperities of the carbide pin. Delamination occurs as a result of the wear process at the contact interface, causing shear cracks on the surface of the soft material and producing flake-like debris [40]. The generation of fragments in the form of metal flakes can be explained by the delamination theory introduced by Suh [41].
In addition, the formation of oxides in the wear track can improve the lubrication efficiency. According to Schey [42], the oxides formed in sliding contact act as anchors or react with the liquid lubricant, improving its efficiency. In this regard, the efficiency of the lubricant used in the PoD test with the Ra values of 0.27 and 0.54 μm was determined using Equation (6), with results of approximately 74% and 65%, respectively. Figure 5a shows a significant attenuation of the stick-slip phenomenon in the friction curves under lubricated conditions, as the COF remains almost constant during the dynamic friction regime. The lower lubricant efficiency registered with the use of the rougher pin can also be attributed to the greater degree of flattening of the specimen asperities. In lubricated contacts, surface asperities function as an adequate reserve of lubricant at the contact interface; however, flattening decreases the ability to retain more lubricant, causing a change in the lubrication regime owing to the high normal load. Consequently, the interaction between the tribosurfaces increases.

3.2. Formability Tests

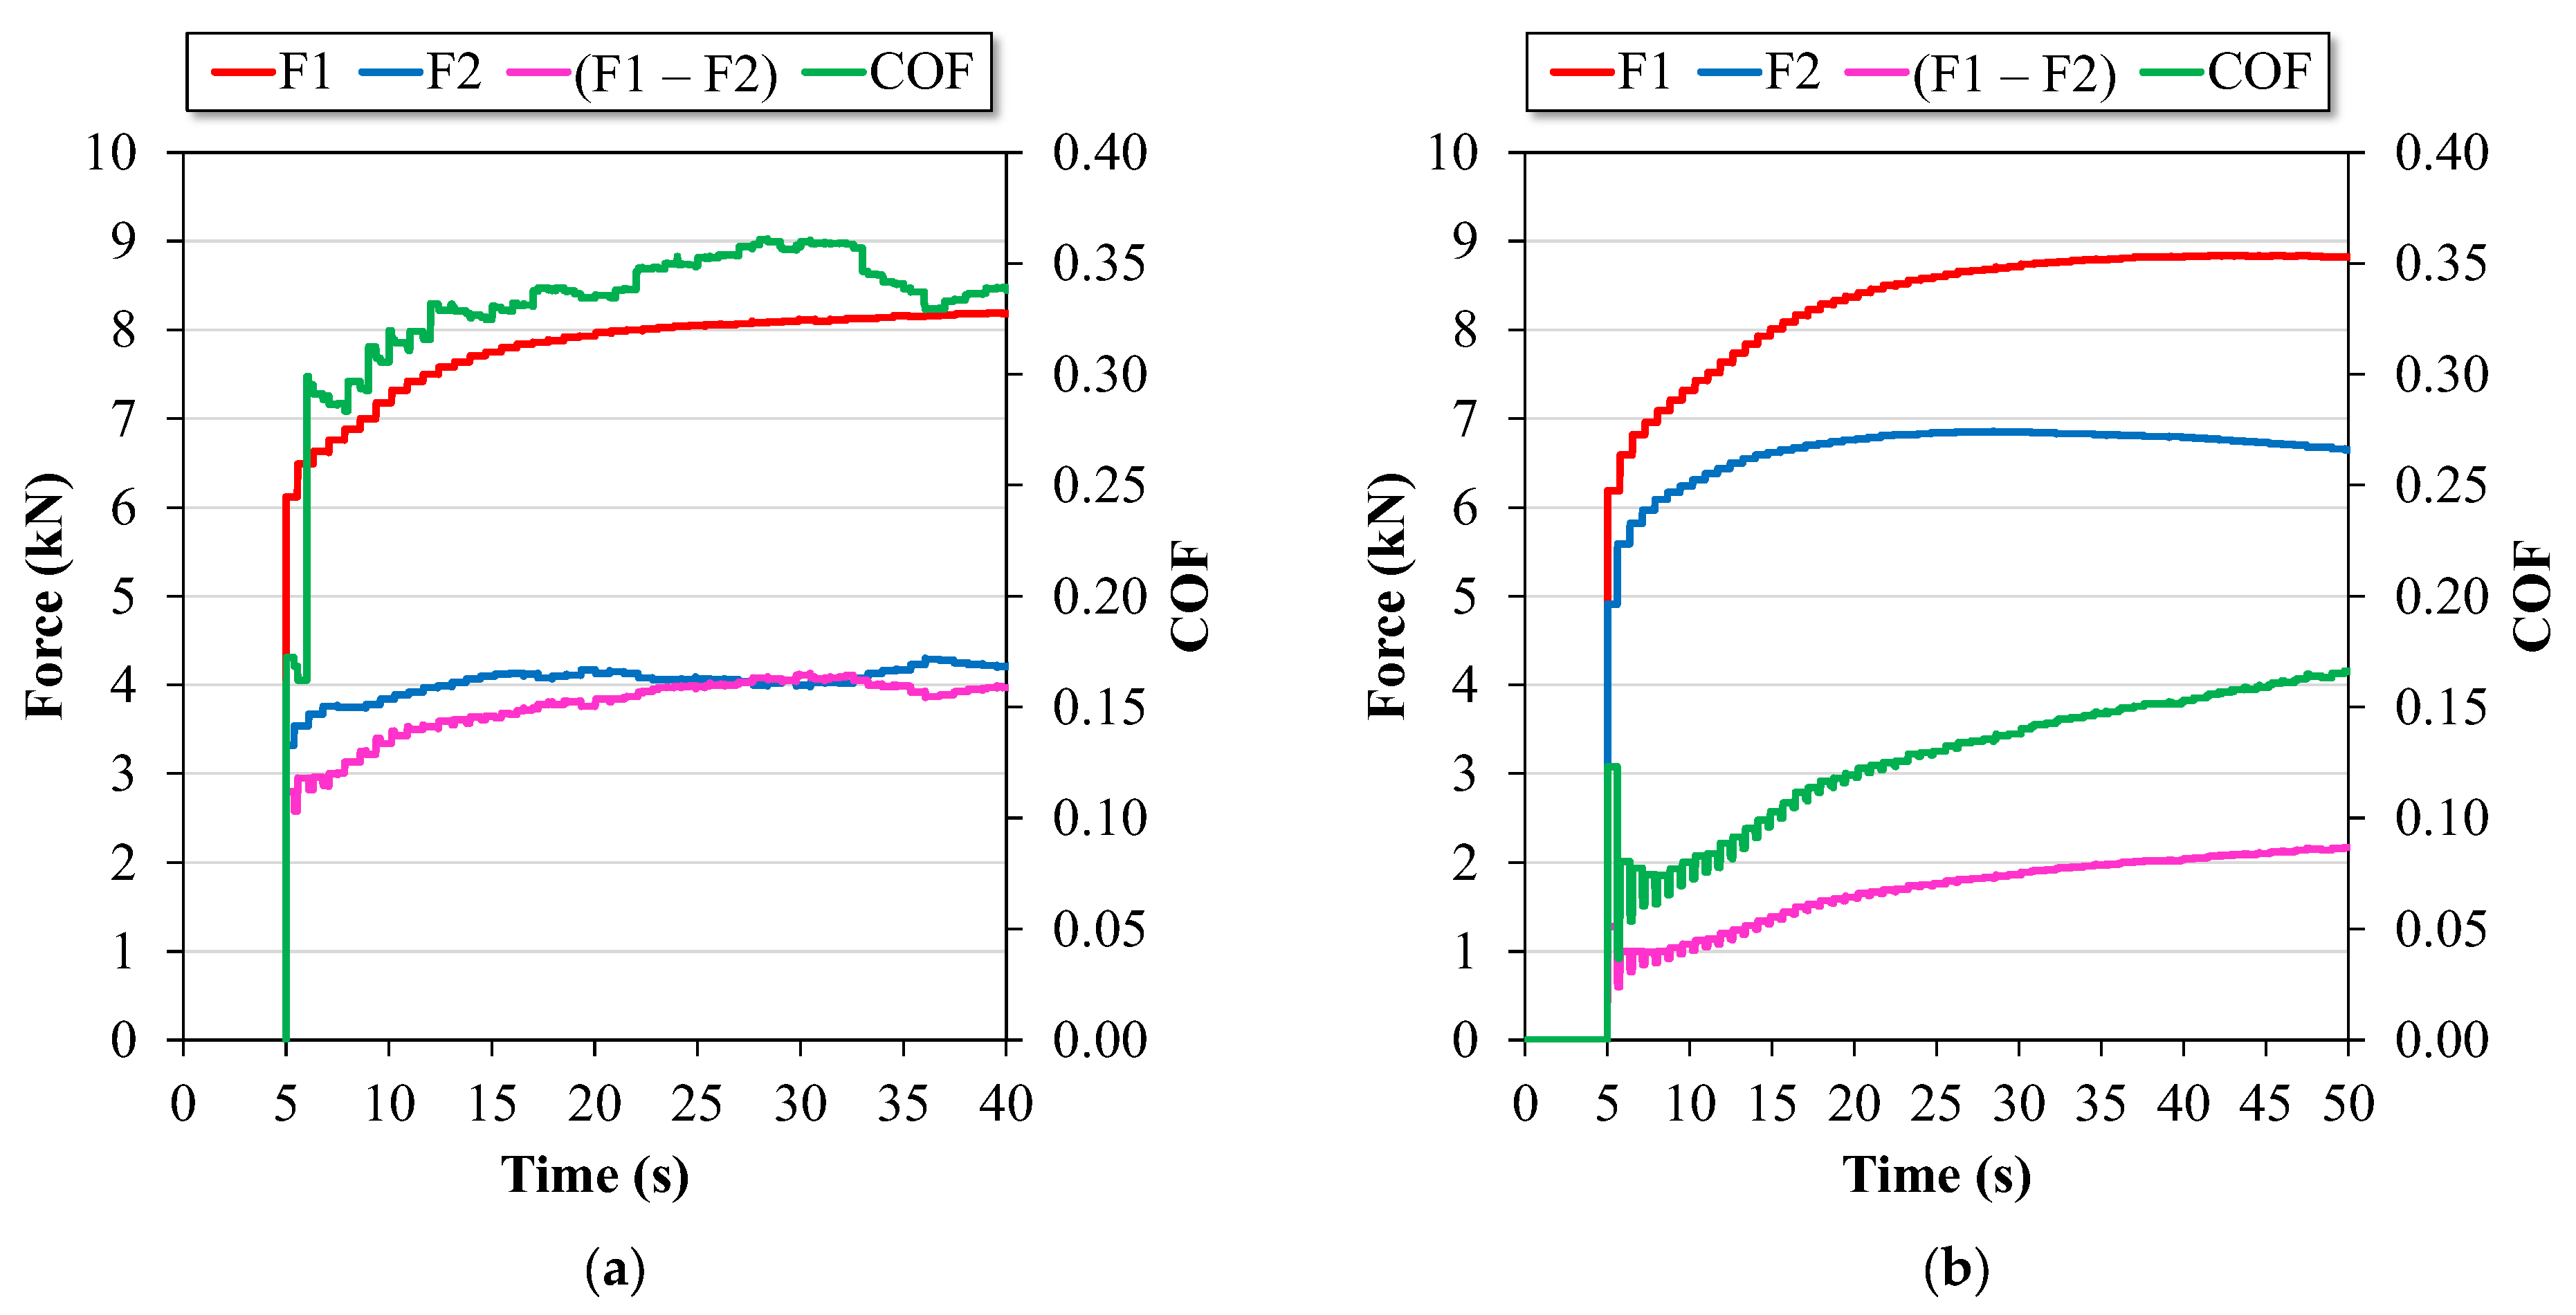
As an example, Figure 8 shows some results obtained for the acting forces ( F 1 and F 2 ) and COF in formability tests. The 0–5s interval is the waiting time for the test to start after the automatic command of the equipment. The showed values were obtained as averages of three samples for each test condition. It was noted in each test that the load increases almost linearly with increasing deformation to a certain value, then stabilizes. The increase observed in the front force is caused by the phenomenon of strain hardening, making F 1 to be greater than F 2 [8,14]. The regime of constant load ( F 1 F 2 ) is due to a stable friction condition at the contact interface. Therefore, the greater the difference between these forces, the greater the frictional force acting in the contact interface. This statement is supported by the Amontons–Coulomb friction law (Equation (1)), which defines the COF as the ratio between the frictional force F f and normal load F N , which in turn is assumed to be dependent on the normal load and independent of the sliding speed and apparent contact area [33].
In addition, the curves of the acting forces show an initial monotonic increase up to an average constant value. However, at the end of the initial transient the load shows a very irregular behavior, denoting the occurrence of the stick–slip phenomenon, just as observed in the PoD test (Figure 5a). In the formability tests, such a phenomenon was more evident in the BUT test. As can be seen in Figure 8a (BUT test), the values F 1 and F 2 were lower compared to Figure 8b (STT test). As reported, in the BUT test, the two ends of the strip move at the same time (Figure 3a), which contributed to the decrease in the intensity of the acting forces to promote the sliding of the strips over the bending pin. However, in this test, the combined effect of deformation and sliding of the strip over the surface of the pin is more severe compared to the STT test (Figure 3b), causing in greater degrees continuous changes in the topographic surface of the strips, as a consequence, the asperities deform further, increasing the actual contact area, the stick–slip phenomenon, and the difference between F 1 and F 2 . Bhushan [38] emphasizes the adhesive forces significantly increase if a shear displacement is added to the normal load, and the real contact area increases because of the increase in asperity plastic flow. Furthermore, adhesive bonds can break in the asperities junction of the corresponding materials, and the fragments are transferred from one surface to the other, causing different wear mechanisms in the same tribocontact.
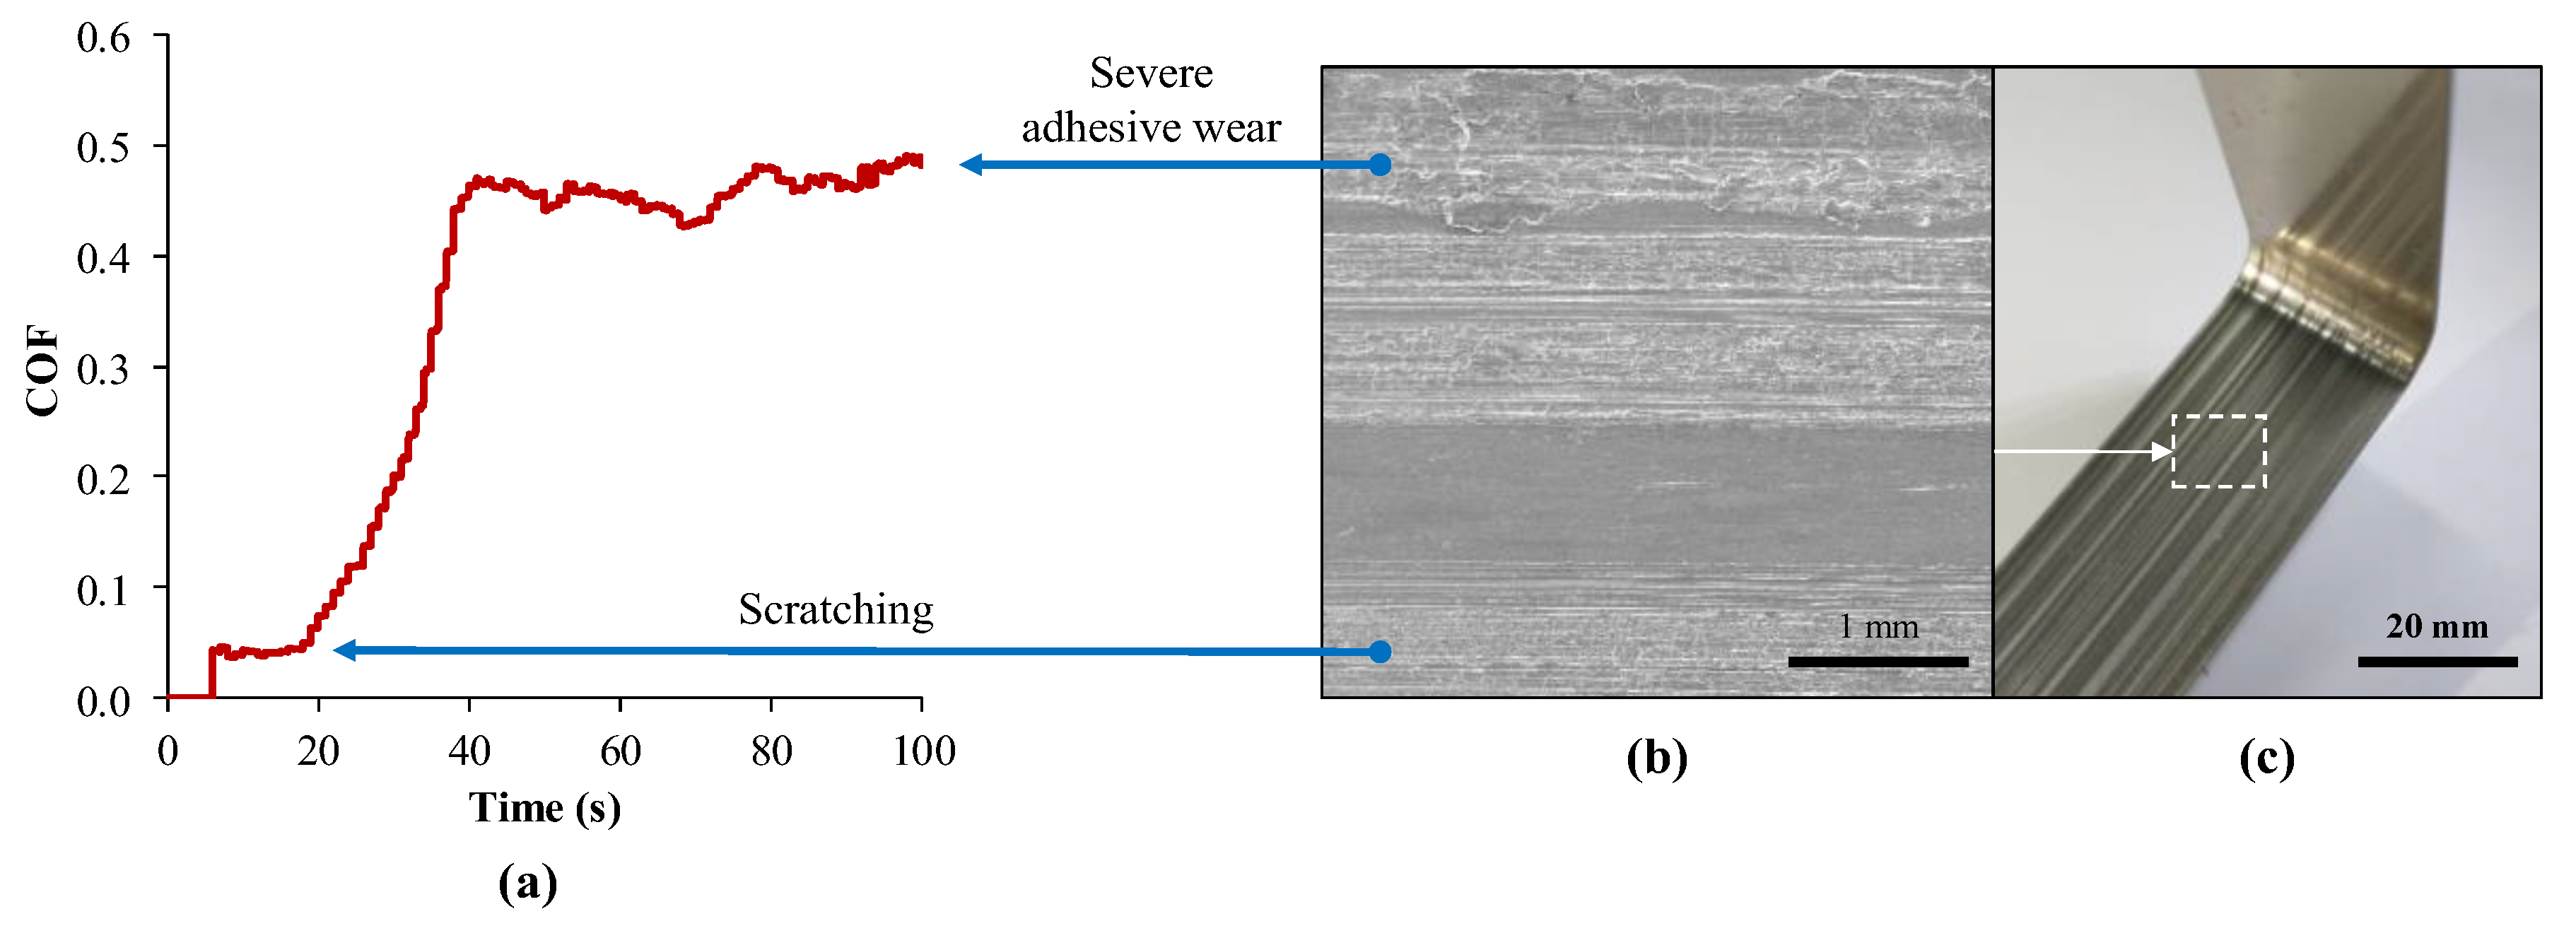
As shown in Figure 9a, this behavior is observed during the monitoring of the friction curve of a specimen subjected to the BUT test under lubricated conditions. The first stage of the COF (Figure 9a) corresponds to scratching on the strip surface, and the second stage corresponds to severe adhesive wear. Macroscopically, these surface defects appear on the strip with a high degree of discoloration and galling (Figure 9c). This behavior supports the statement that during sliding contact, the changes occurring in the tribosurfaces cause variations in the lubrication regime owing to the low thickness of the lubricant film in the contact interface.
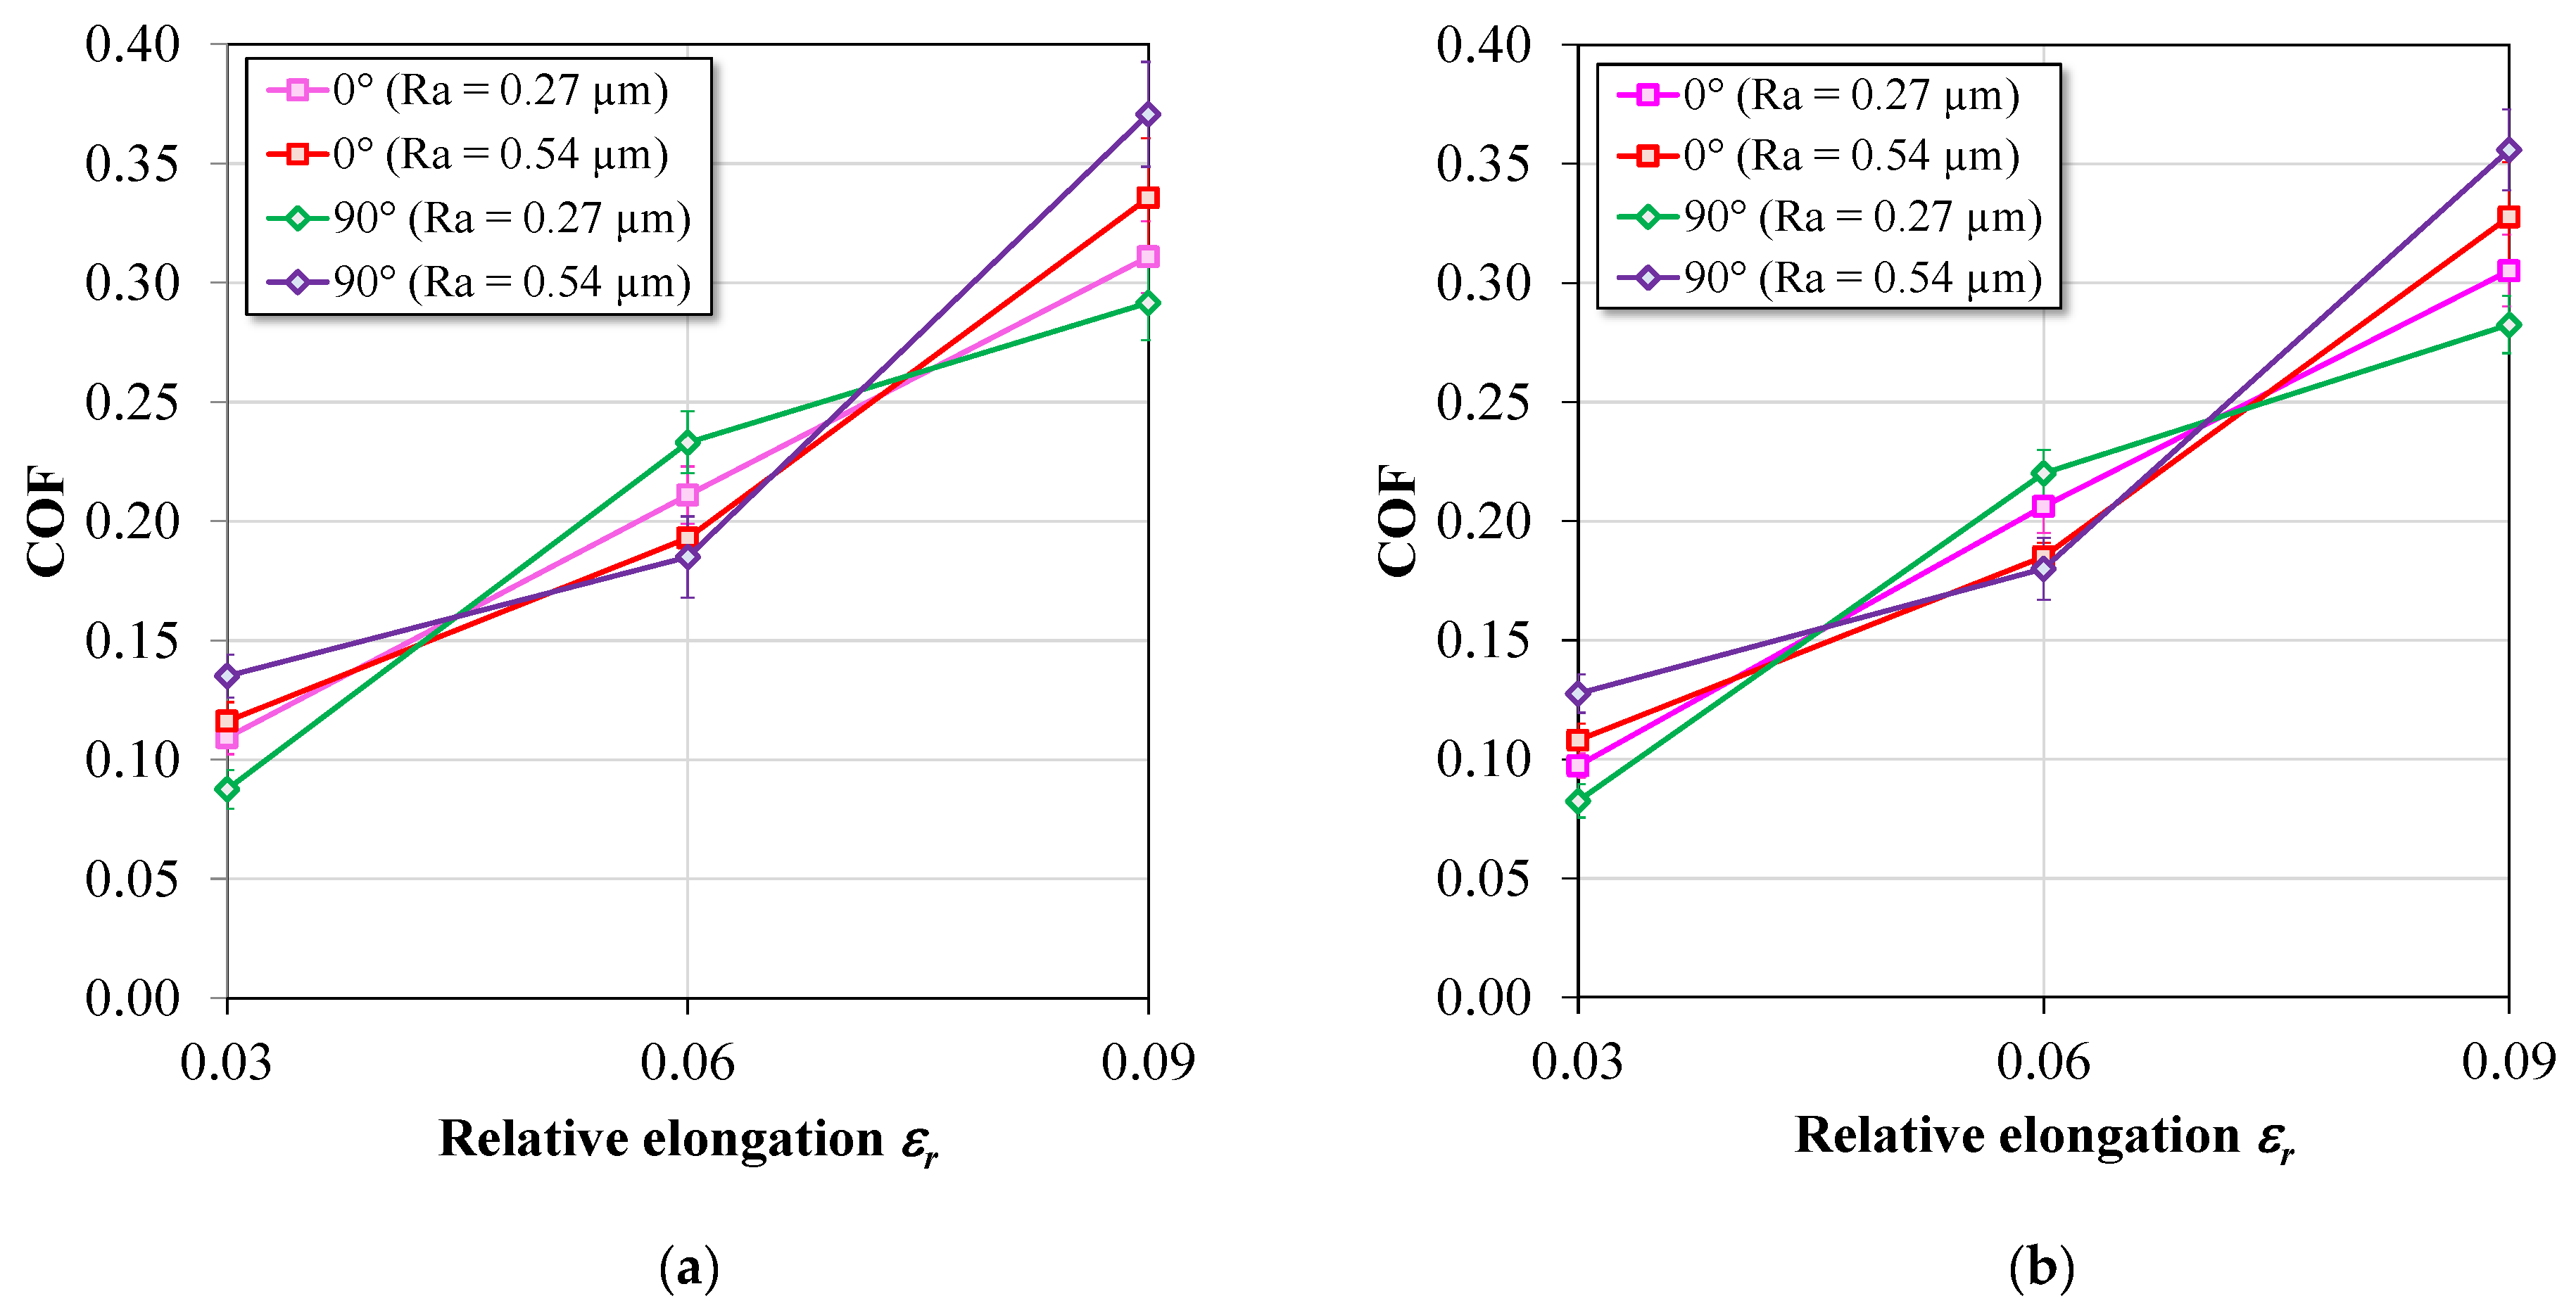
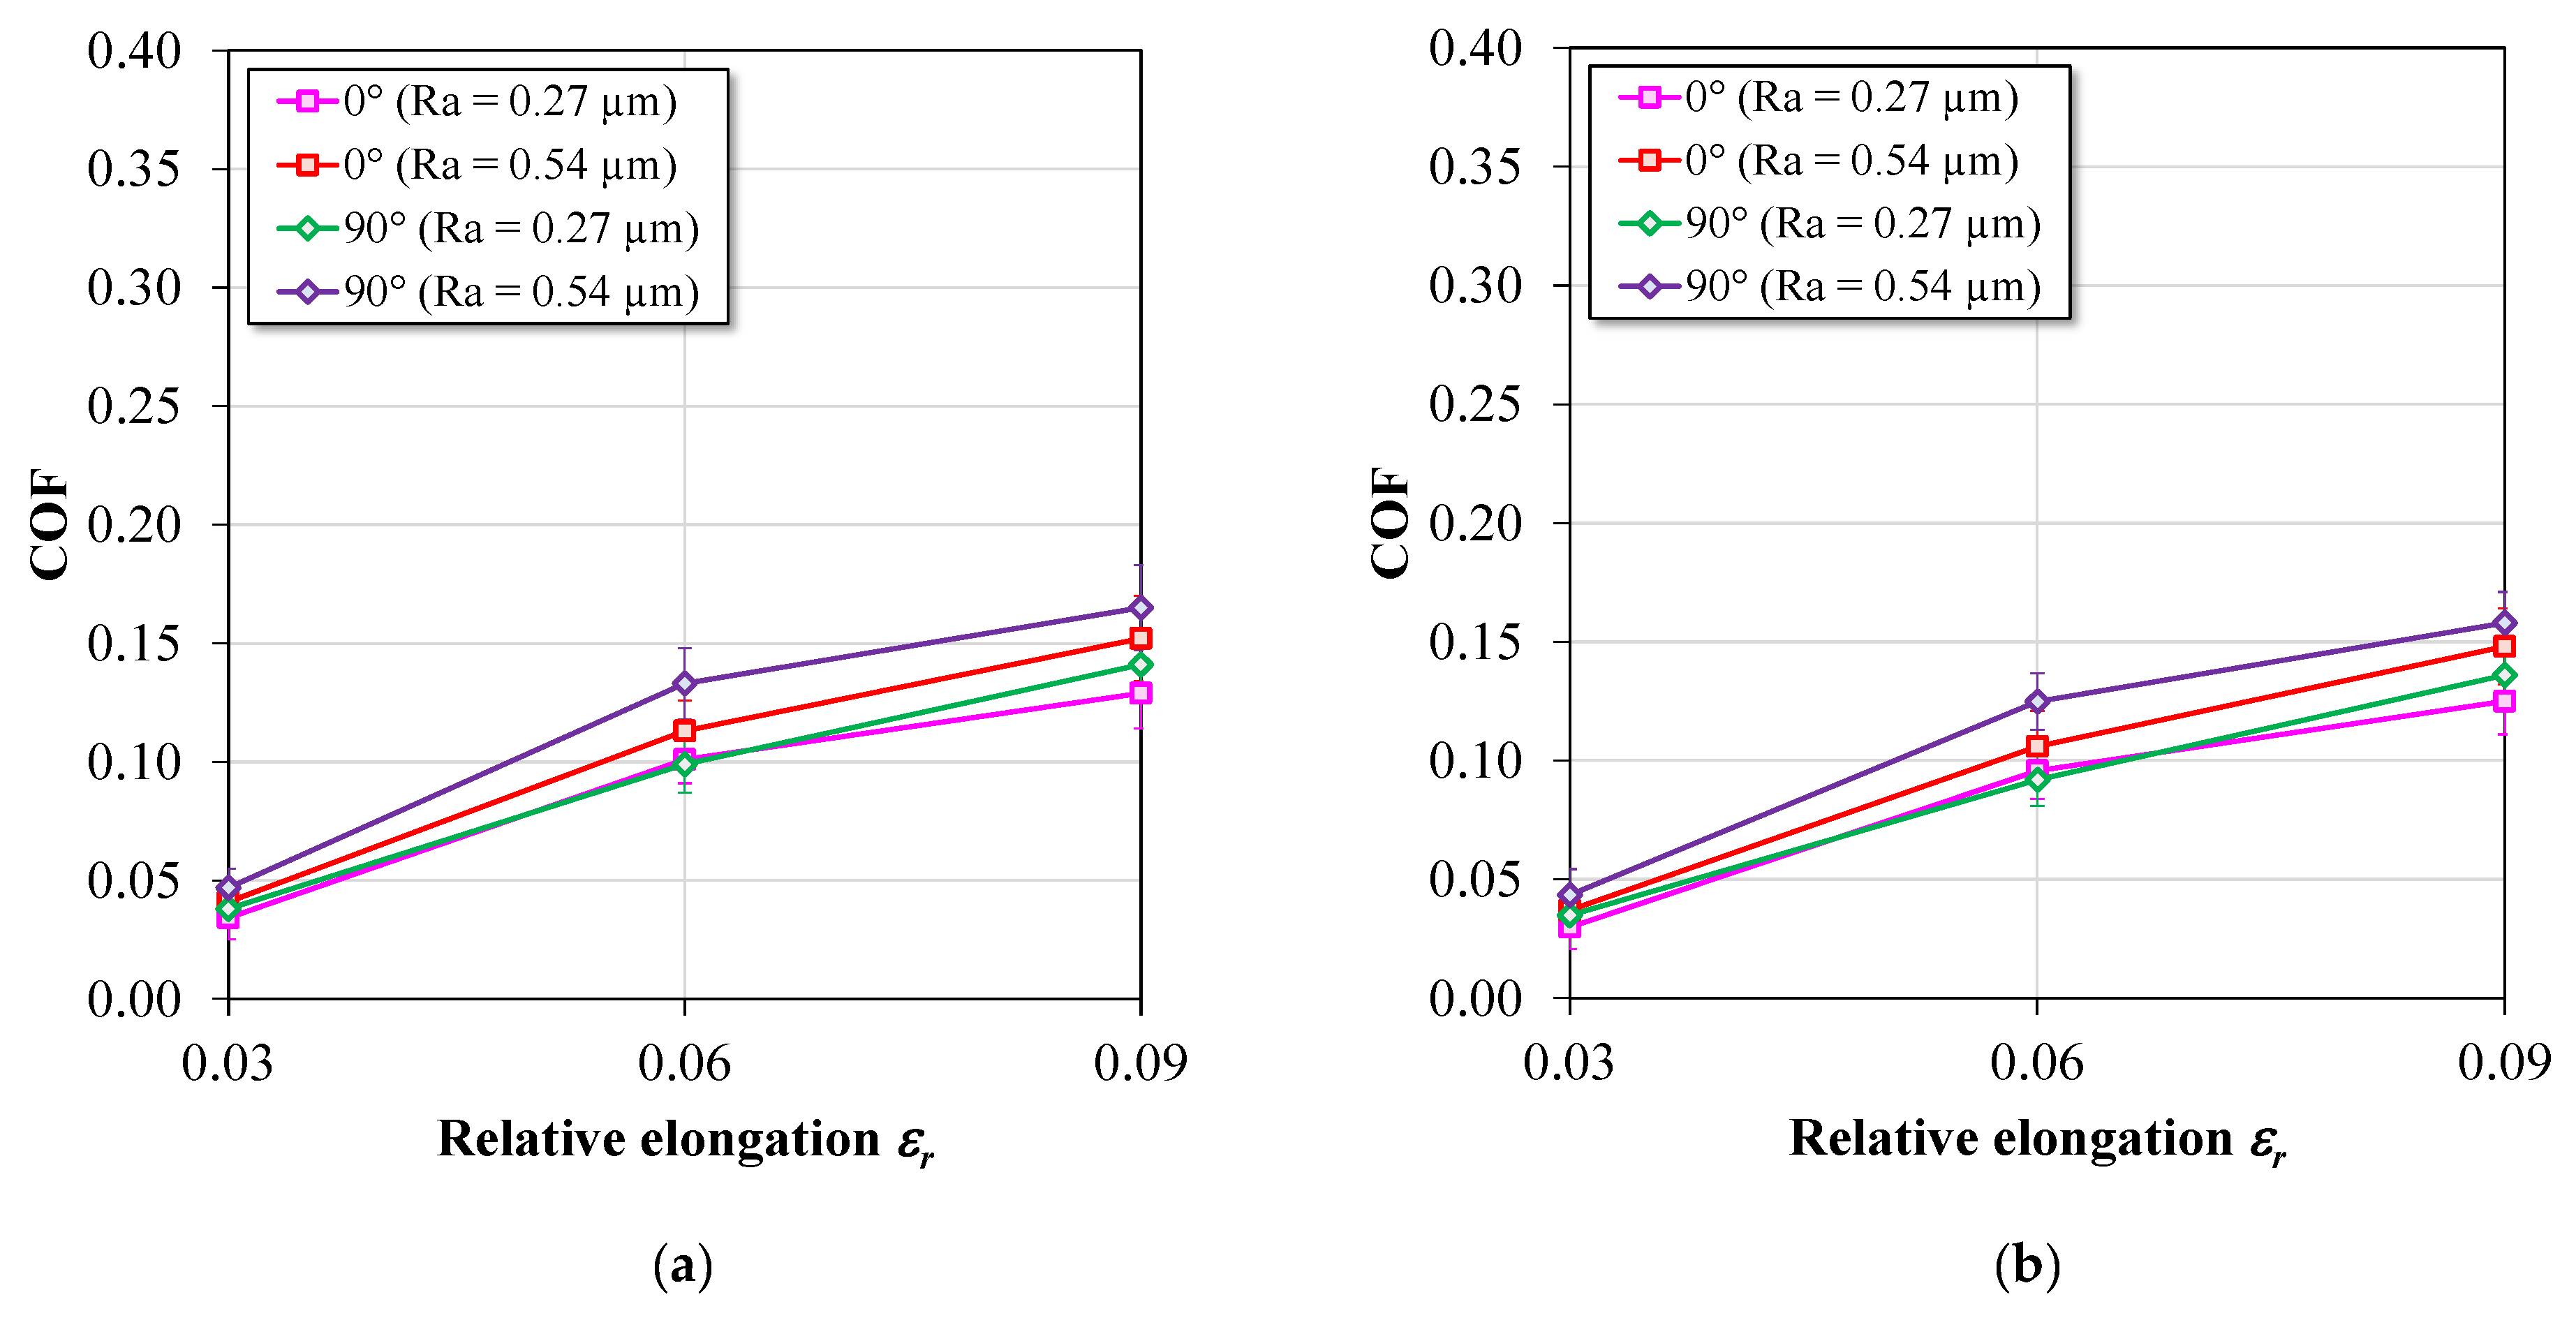
Figure 10 and Figure 11 show the variation in the COF obtained from the different formability tests as a function of the relative elongation ε r , strip orientation, pin roughness, and lubrication conditions. In general, the COF value increases with pin roughness under dry and lubricated conditions in both formability tests. Simultaneously, the amount of lubricant used reduces the COF value. In lubricated contacts, the intermolecular forces between the tribosurfaces tend to be reduced, causing attenuation in the frictional resistance. The increase in the COF value with the relative elongation is due to the increased strip roughening by plastic deformation, causing the real contact area to increase simultaneously with the normal pressure [43]. According to Trzepiecinski [14], this makes it difficult to generalize and interpret the results obtained for the variation of the coefficient of friction. According to Trzepiecinski [14], these variations make it difficult to analyze and interpret the results of the COF.
Other factors may also have contributed to the increase in COF with the relative elongation, for example, the structure, texture, and mechanical properties presented by the metal sheet. As can be seen in Table 2, the AISI 430 steel sheet presents a significant anisotropy of mechanical properties. In the BUT test, the bending and strip stretch over the roller creates a condition close to the plane-strain condition, even though the width is narrow compared to the length. Therefore, the greater heterogeneity of this strip makes it more resistant to the necking (high normal anisotropy coefficient, R), which gives greater plane deformation and increased strip roughness in the BUT test and, as a result, the COF increases to a greater degree compared to the STT test.
Under both tests and friction conditions, the samples tested with the rollers with a surface roughness of Ra = 0.54 μm demonstrated a tendency to present a higher value of the coefficient of friction with increased relative elongation compared to the samples tested with the rollers with a surface roughness of Ra = 0.27 μm. Therefore, an increase or decrease in the value of roll roughness resulted in a decreased value of the COF. This behavior is due to the balance of two friction mechanisms: adhesion and asperities flattening. In the first mechanism, friction increases owing to tribochemical interactions that form adhesive or intermolecular bonds at the asperities junctions [38]. In addition, smoother surfaces favor the increase in adhesive bonds, and as discussed in the PoD test results, this tribological pair has a strong tendency for adhesive mechanisms owing to its high metallurgical compatibility. In the second mechanism, high surface roughness and normal pressure cause a higher degree of asperities flattening. Therefore, in the tests with the smoother pin (Ra = 0.27 μm), the friction was governed to a greater degree by the adhesion mechanism, whereas that in the tests with the rougher pin (Ra = 0.54 μm) was governed to a greater degree by the mechanism of plastic deformation of the strip asperities. In addition, the results demonstrate that the pin of greater roughness has a greater effect on the COF value in contrast to the direction of the metal strip.
Asperity flattening tends to be aggravated by the mutual effect between the applied tangential force and the hard asperities of the rougher pin, which in turn act as indenters that plow or scratch the soft surface of the metallic strip. In this way, increases the production of debris, which acts as a third abrasive body during the relative movement of the strip over the pin, and, as a result, friction and wear increase, as also evidenced in the PoD test. Adhesive wear can aggravate adhesive wear. Notoriously, abrasive particles of high hardness can form due to the mechanisms of oxidation and hardening by deformation [37,38].
Additionally, the experimental results presented in Figure 10 and Figure 11 indicate that the COF values obtained from the BUT test are superior to those obtained from the STT test under dry and lubricated conditions. This behavior can be attributed to kinematic differences in the mutual movement of the tribosurfaces, causing the sheet to be under different states of tension and strain, which causes variations in shear stress τ and contact pressure p , as shown in Equation (4). Furthermore, during the BUT test, the most pronounced effect of the superficial defect (roping or riding) was observed, increasing the frictional resistance. Several authors [44,45] have explained that FSS sheets exhibit ridging parallel to the rolling direction when subjected to stretching or deep drawing. The ridges have a depth in the range of 20–50 μm.
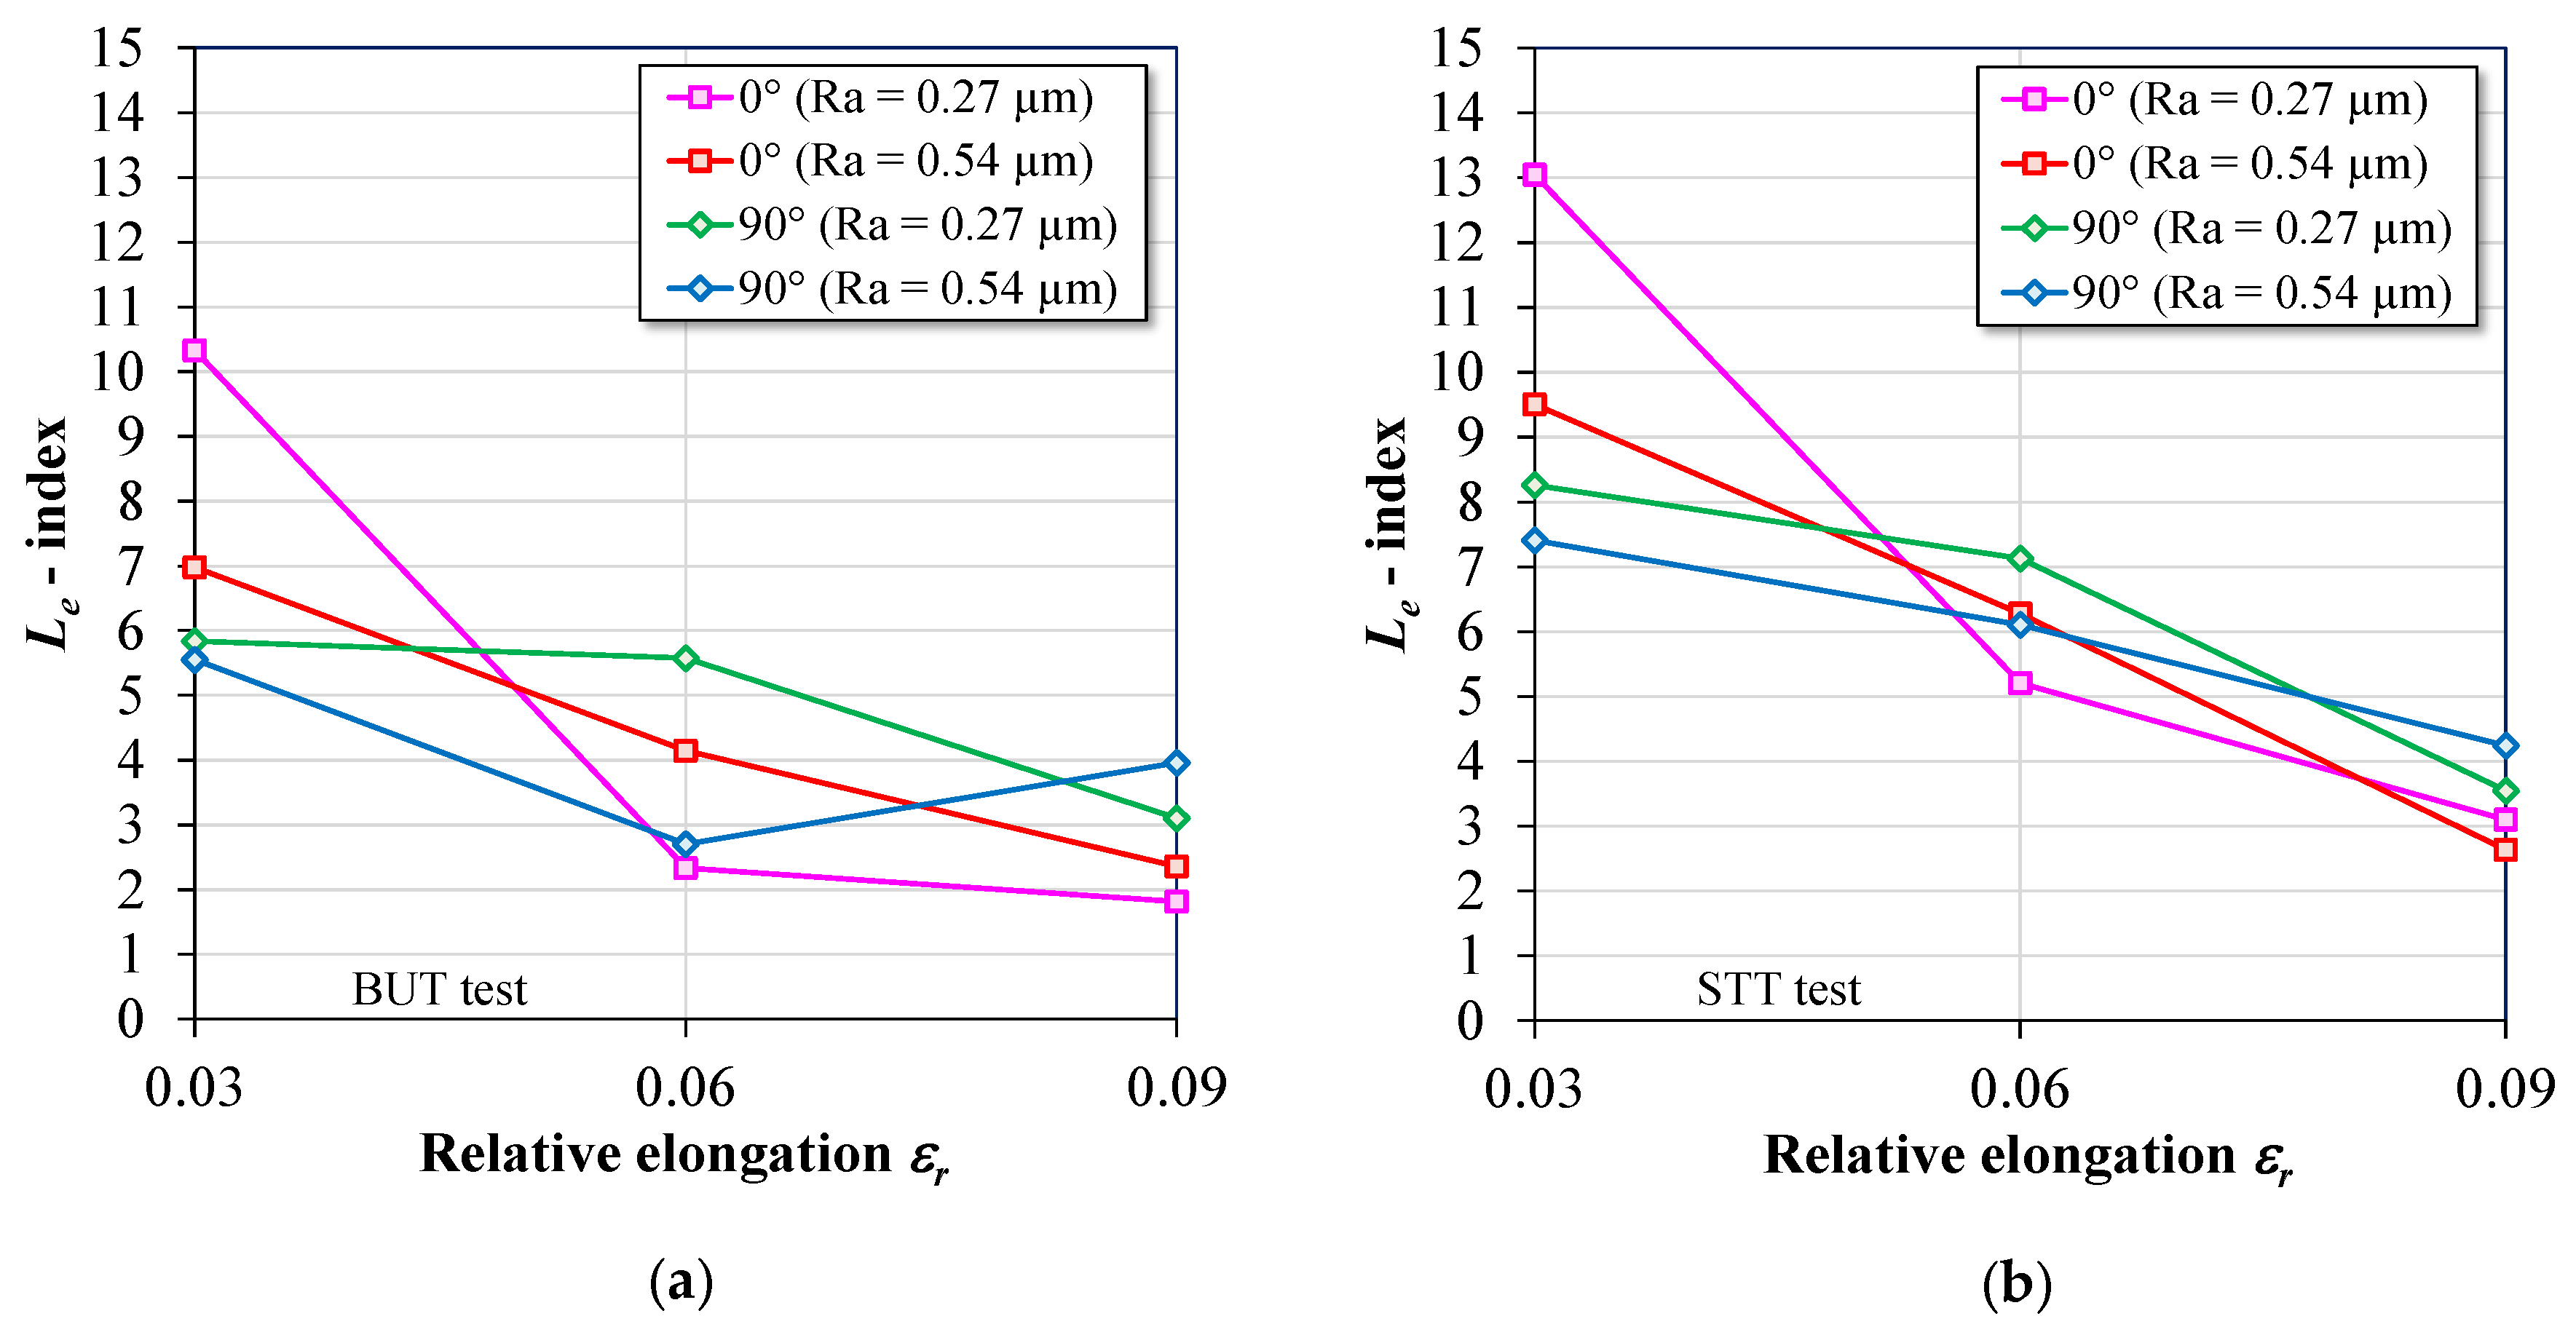
Figure 12a,b show the lubricant efficiency ( L e -index) in the formability tests. In general, the lubricant efficiency decreases with an increase in the relative elongation for both tests. This behavior can be attributed to the increase in the surface roughness of the strip with increasing relative elongation, causing a change in the lubrication regime. As a result, there was greater interaction between the asperities, decreasing the lubrication efficiency. The mutual effect of the different friction mechanisms (adhesion and asperities flattening) on lubricated contacts of SMF processes is of great importance. The highest lubrication efficiency was recorded during tests using the pin with a roughness Ra = 0.27 μm, strip orientation of 0°, and relative elongation of 0.03. Most likely, this behavior is due to the lower interaction between the asperity’s peaks of both surfaces and, at the same time, the oil pockets were large enough to function as an oil reservoir at the contact interface. However, it can be noted with the increase in relative elongation, that the efficiency of the lubricant of the strip with an orientation of 0°, showed a tendency of decreasing its value to a greater degree compared to the strip with an orientation of 90°. Most likely, this behavior is due to the greater uniform stretching of the strip in this particular direction, as shown in Table 2.
Additionally, Figure 12a shows that the lubrication efficiency in the STT test compared to that in the BUT test (Figure 12b) is higher under the same test parameters. The used lubricant was able to reduce the COF value approximately by 2.6%–13% and 1.8%–10.3% in relation to the surface roughness of pins, respectively. This behavior can be attributed to the lower tangential force of the strip over the pin during the STT test. Equations (1) and (4) also support this conclusion, as the COF decreases with decreasing tangential force or friction stress. In addition, there is a tendency for the efficiency of the lubricant to present values very close as the pin roughness increases, denoting that the greater interaction of the asperities governs the friction. As the lubricant film is very thin, the lubrication regime tends to be more boundary than mixed.

3.3. Comparative Analysis

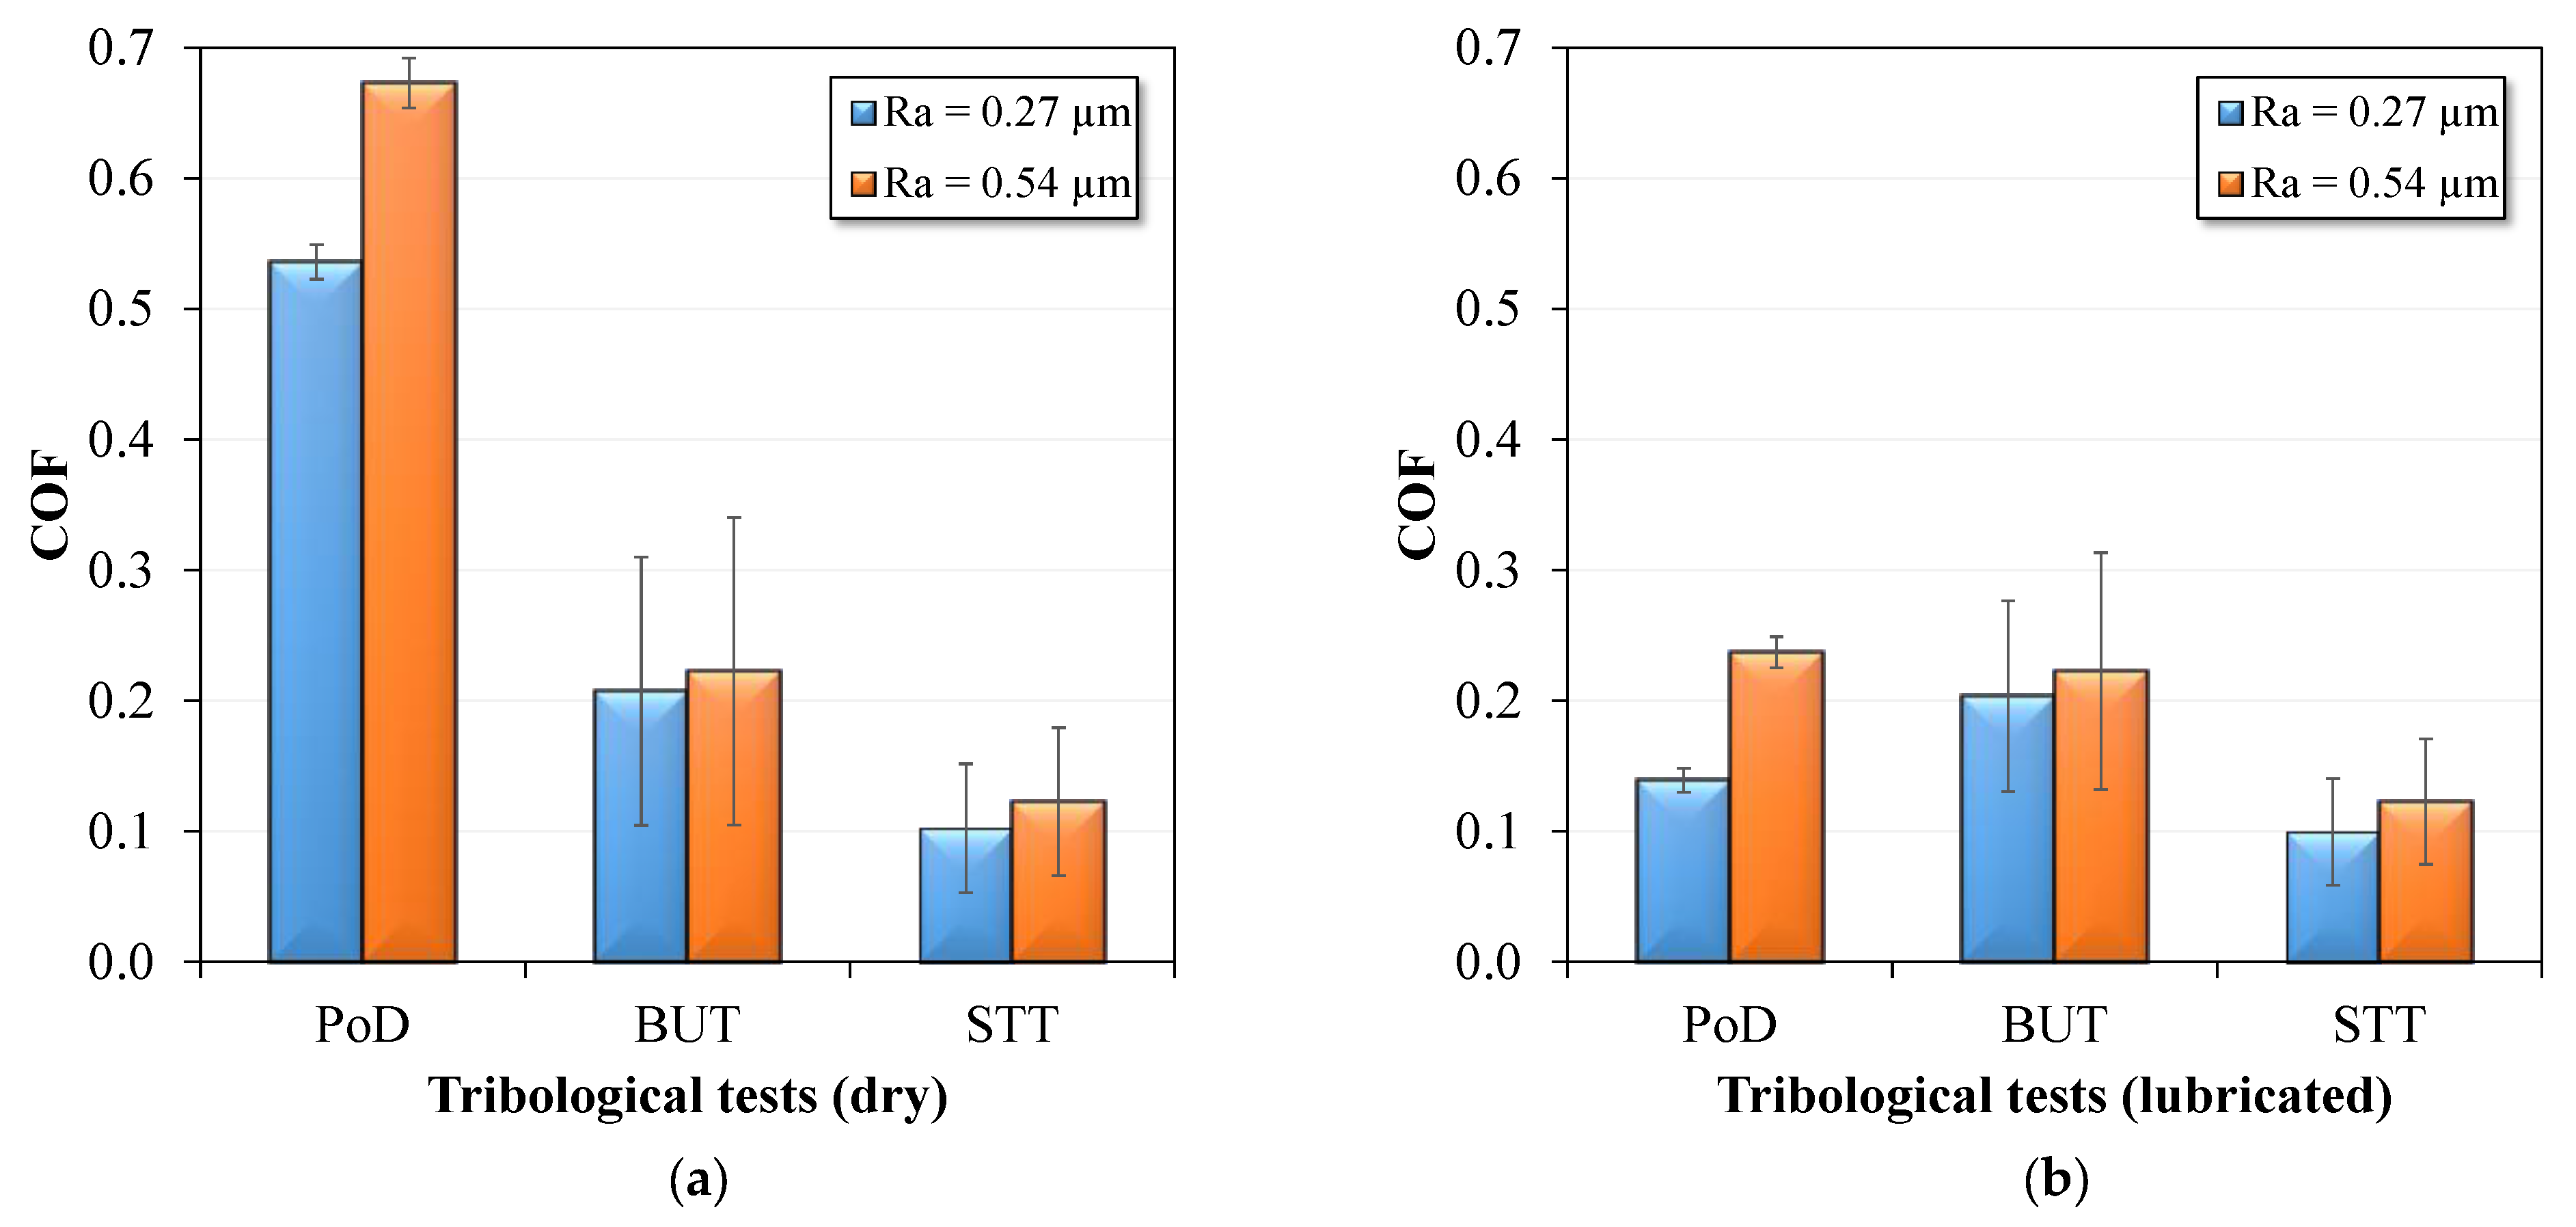
Figure 13 shows the average values of the COFs as a function of the tribological test, pin roughness, and lubrication conditions. It is important to emphasize that the average values of the COFs obtained in the different tribological tests were calculated and compared with those obtained in the PoD test, which resulted in greater variations in the standard deviations. As shown in Figure 13a, the average COF values obtained from the PoD test are higher than those obtained from formability tests under dry conditions. For the pin with a roughness of Ra = 0.27 μm, COF values for the PoD, BUT and STT tests are, on average, 0.536, 0.207, and 0.102, respectively. For the pin with a roughness of Ra = 0.54 μm, COF values are, on average, 0.673, 0.223, and 0.123, respectively.
The difference in sample behavior in the PoD test compared to formability tests can be attributed to two main reasons. Firstly, in the PoD test, there is a much smaller contact area between the sheet and pin than in the formability tests. Consequently, the pressure exerted by the pin on the specimen increases, causing a rapid expansion of the real contact area, which results in a greater frictional resistance [46]. Secondly, in the PoD test, the pin always slides on the same wear track, and this repetitive cycle causes a portion of the material adjacent to the wear surface to remain highly deformed and hardened (Figure 7a). Combined with the wear debris, this behavior caused a significant increase in the COF value and in wear. However, in the formability tests, the real contact area is spread over the specimen width (25 mm), and the load is transferred over a larger surface area than in the PoD test. Furthermore, in the formability tests, the strip slides over the bending pin surface only once, reducing the effects of the abrasive and adhesive wear mechanisms.
It can be seen in Figure 13b that the lubricant attenuates friction in both tests. For the pin with a roughness of Ra = 0.27 μm, COF values for the PoD, BUT and STT tests are, on average, 0.139, 0.204, and 0.100, respectively. For the pin with a roughness of Ra = 0.54 μm, COF values are, on average, 0.237, 0.223, and 0.123, respectively. In addition, it is noted that the lubricant attenuates the difference between the results of the COFs caused by the sheet texture or surface topography directionality. As a result, the standard deviations calculated from the average of the values of the COFs with different strip orientations under lubricated conditions were smaller than those obtained under dry conditions (Figure 13a). As reported, the friction coefficients obtained with the pins of greater roughness presented very similar values in both lubrication conditions, denoting that changes in the lubrication regime governed the tribocontact.
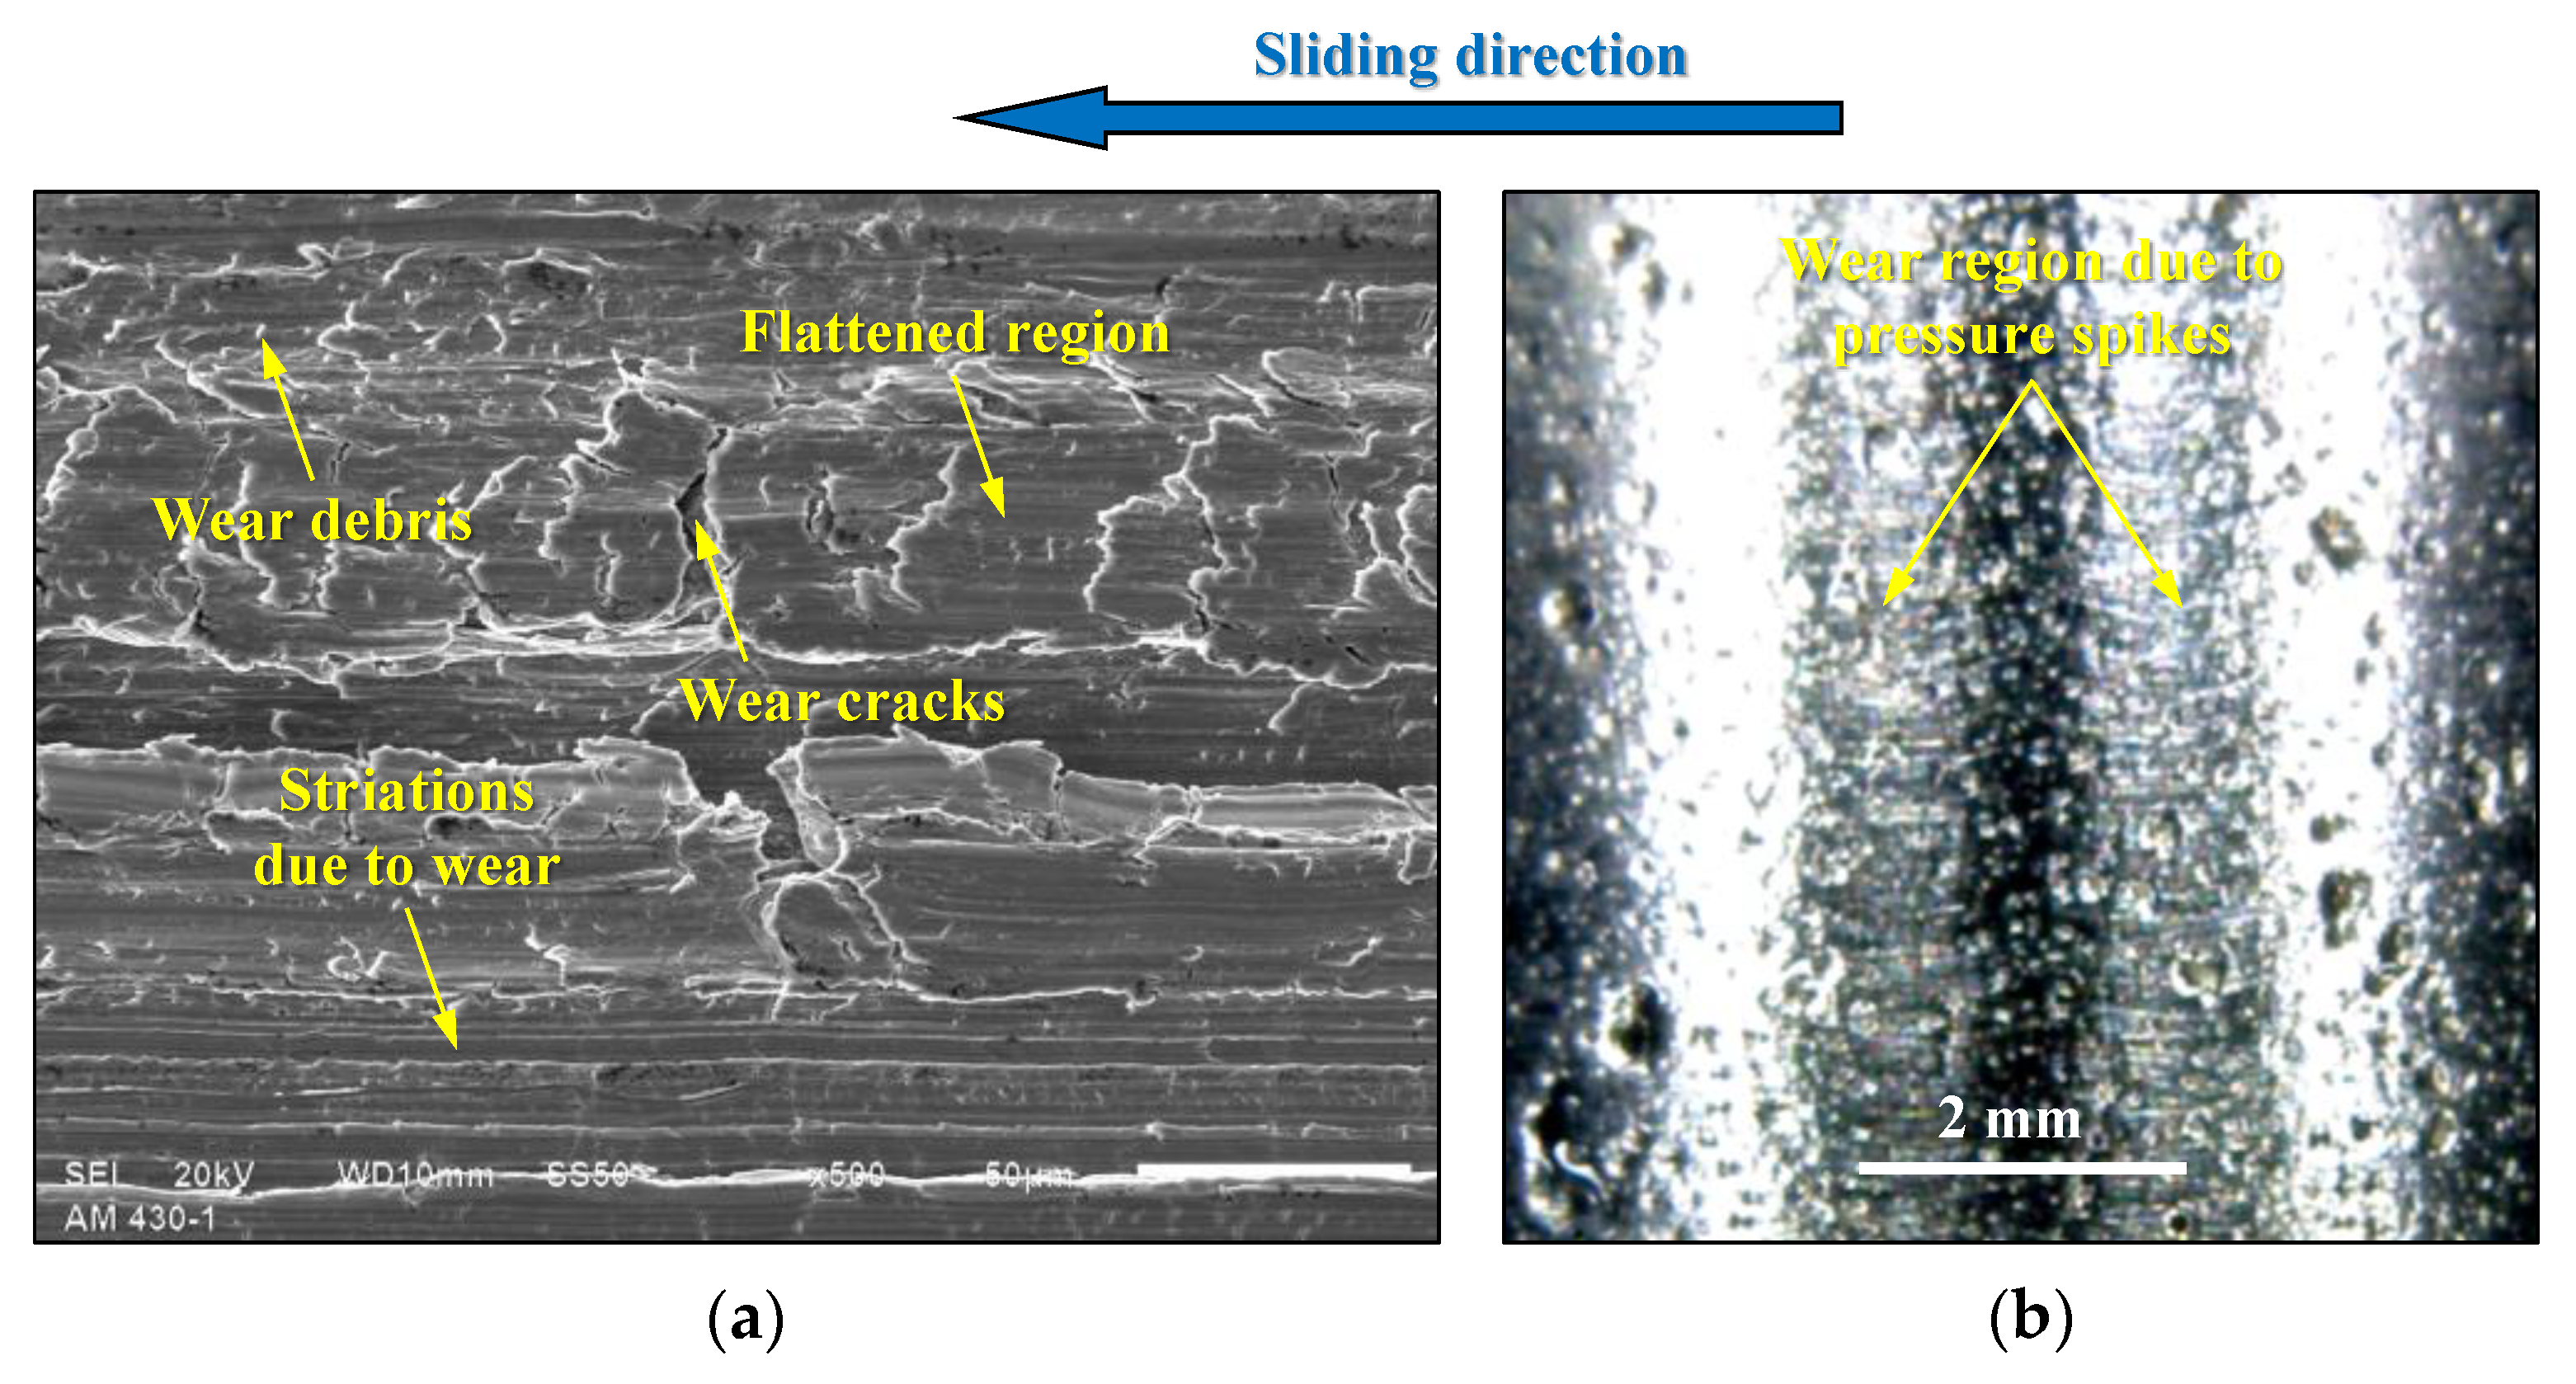
Additionally, as shown in Figure 13a,b, the values of the COFs obtained in the BUT test are, on average, higher than those obtained in the STT test. These results are in accordance with those shown in Figure 10 and Figure 11. Ter Haar [47] emphasized that the high normal pressure between the die radius/sheet (Figure 3b) causes a change in the lubrication regime. However, in the region between the punch radius/sheet (Figure 3c), stretching occur around the punch radius, which causes low velocities and high contact pressures. This leads to severe boundary conditions, which apply only to a small part of the sheet. However, the topographic variations observed on the surface of the tribological pair (Figure 14) suggest that the distribution of contact pressure was not uniform during the formability tests, most likely owing to pressure spikes (Figure 14b). Figura 14a evidence the presence of wear debris, striations, cracks, and flattened asperities. Figure 14a shows that the summits of the surface are deformed, creating flattened areas on the sheet surface. According to Schey [42], the impact of the plowing phenomenon is intensified in these wear regions, particularly under dry friction conditions when there are favorable conditions for revealing the scuffing mechanism.
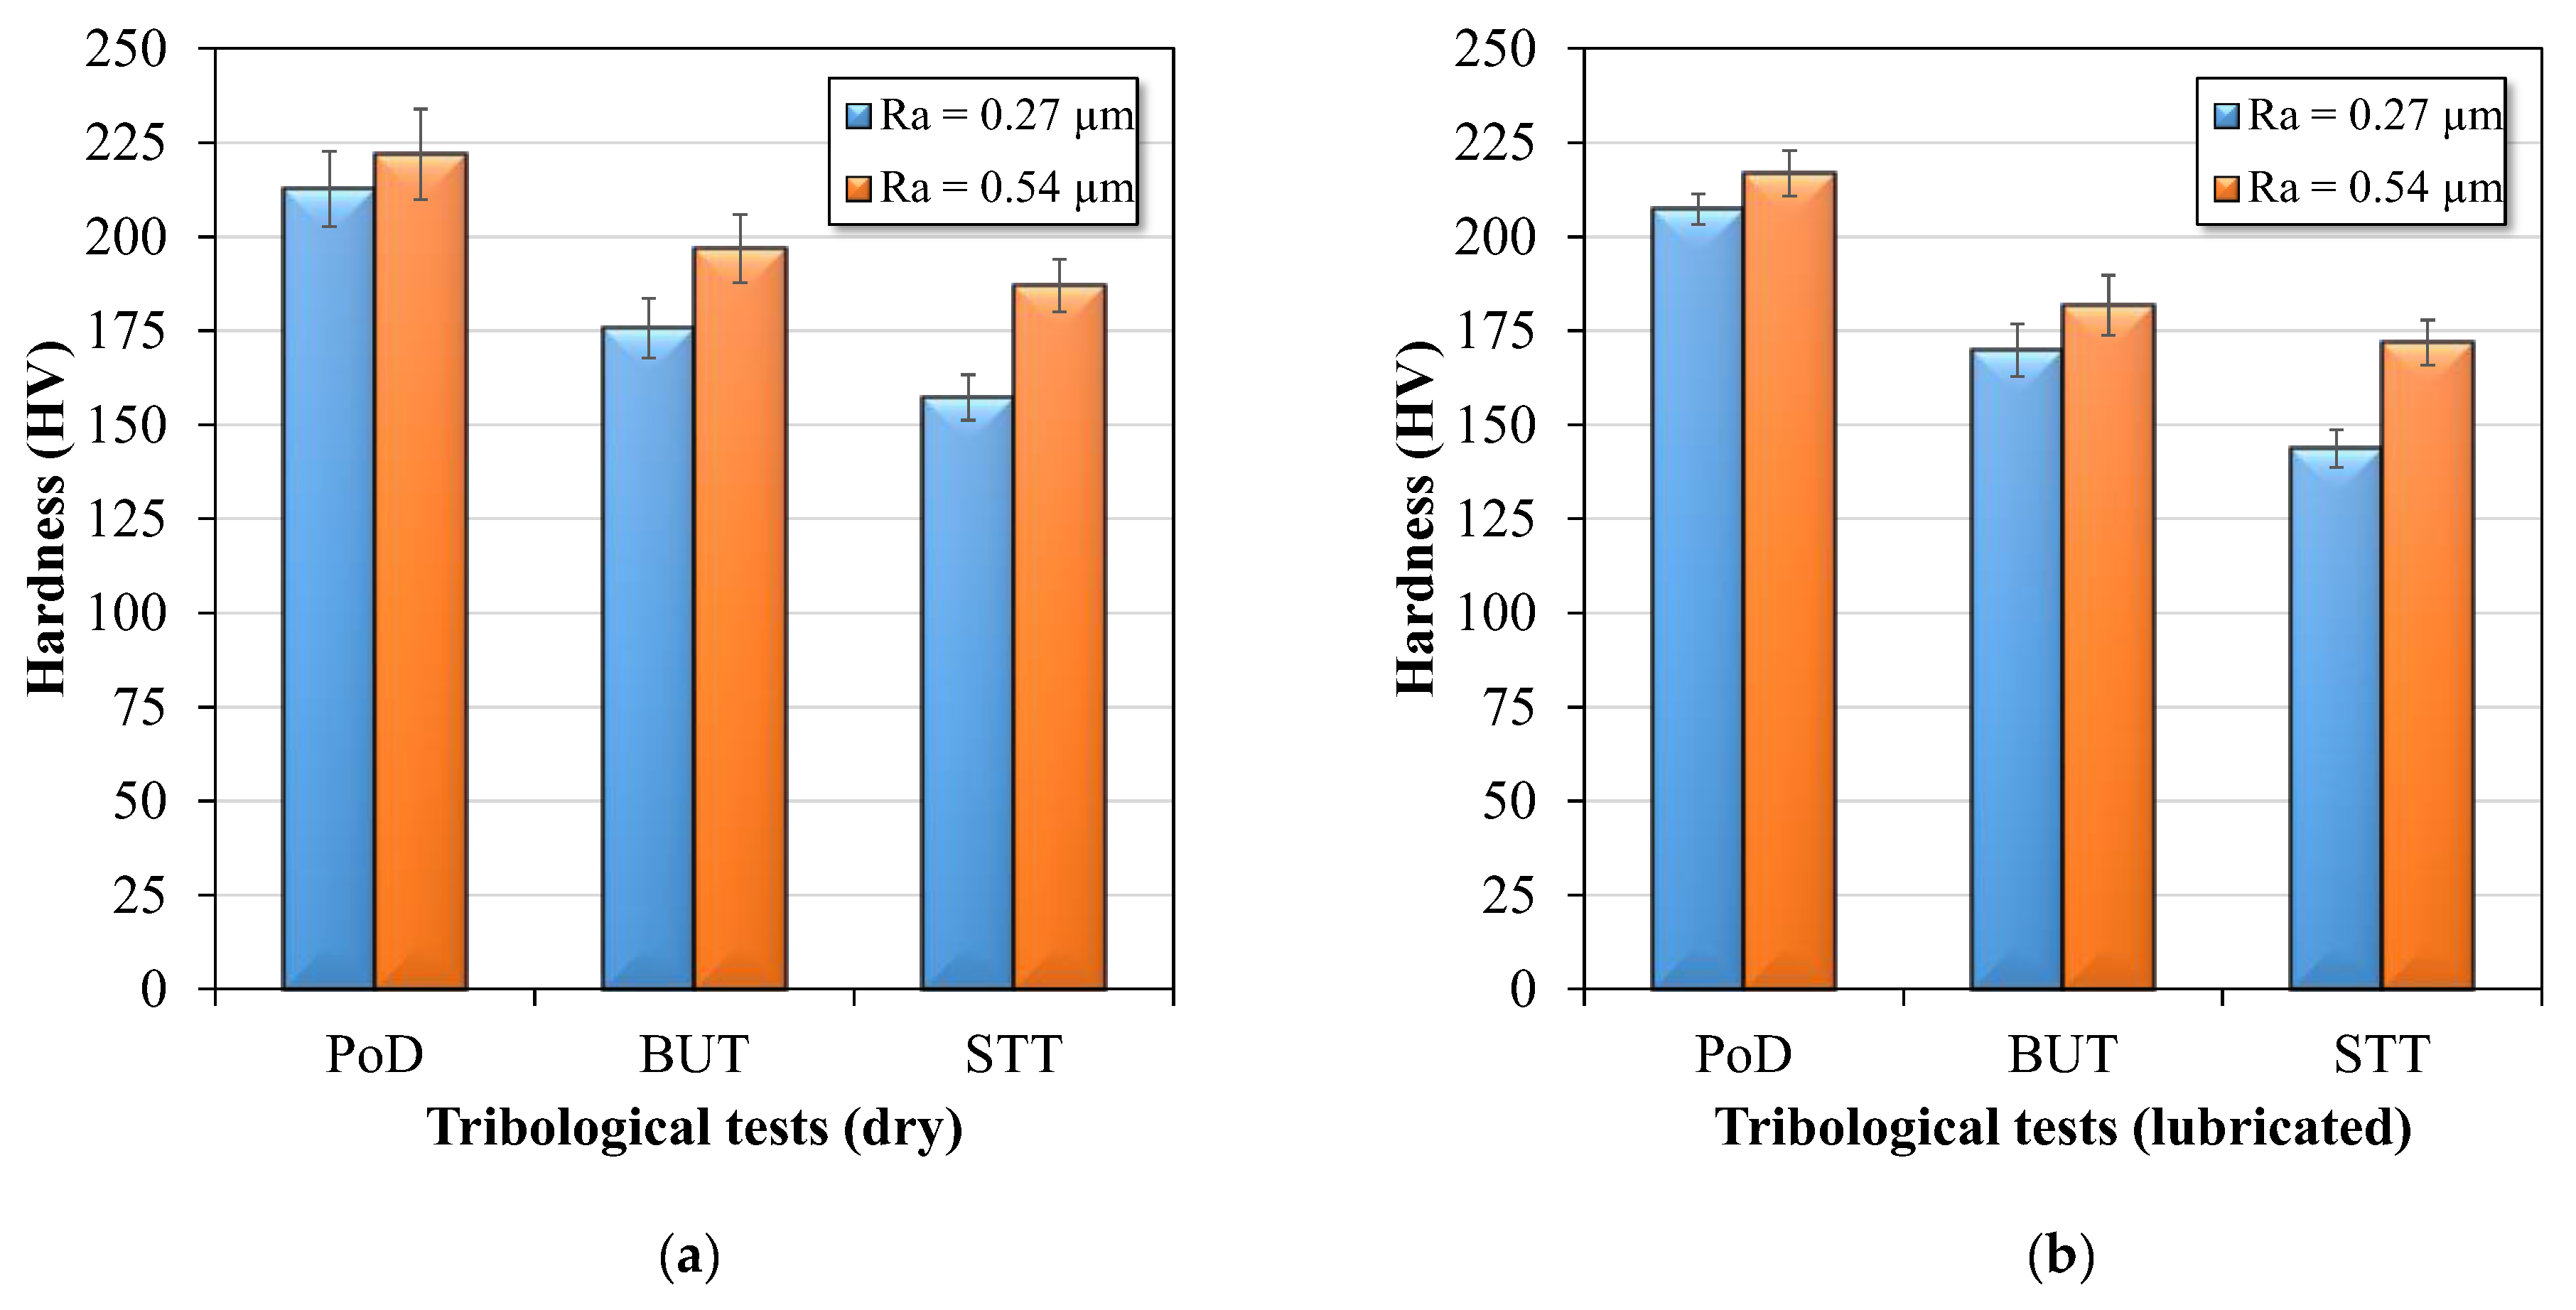
Figure 15 shows the hardness values as a function of tribological test type, pin roughness, and lubrication conditions. The hardness was measured in the section adjacent to the wear surface. In total, 10 measurements were taken with a load of 0.245 N and a permanence time of 15 s. In general, the results indicate that the final hardness of the specimens was greater than their initial hardness. Under dry conditions (Figure 15a), the hardness measured in the samples submitted to the PoD, BUT, and STT tests increased, on average, approximately 80%, 54%, and 43%, respectively. However, under lubricated conditions, the increases were, on average, approximately 76%, 46%, and 31%, respectively. This increase can be attributed to the strain hardening mechanism, which in turn results from the flattening of asperities owing to the high roughness and counter sample hardness. The lower increase under the lubricated condition in relation to dry is due to the lower effect of the mechanism of asperities adhesion.
Furthermore, Figure 15a,b shows that the specimen hardness subjected to the PoD test was higher than that subjected to the formability tests. As emphasized, in the PoD test, there is a repetitive cycle of the mechanisms of adhesion and plastic deformation under the same wear track, which is related to the abrasive effect of the wear hard debris, causing a greater degree of strain hardening mechanism. Thus, the increase in hardness improved the wear resistance. In this respect, Askoy et al. [48] demonstrated that there is an approximately linear and increasing relationship between the wear resistance and microhardness of specimens of ferritic stainless steel AISI 430 containing Nb. Under these conditions, the asperities exhibit less plastic deformation and promote greater lubricant retention. This behavior probably mitigated the friction and wear imposed on the specimen, as shown in Figure 5.
However, as the formability tests were performed, a new contact area of the strip slid over the pin, reducing the effect of the hardening mechanism, even if an additional amount of this effect was attributed to bending deformation. In addition, it can be seen in Figure 15 (BUT and STT tests) that the hardness measured in the specimens that slid under the greater roughness pin was greater than that obtained with the lower roughness pin. As discussed, the sliding contact between the surfaces is rougher, causing a greater interaction between the asperities, and, as a result, the soft asperities are subject to a greater effect of the strain hardening mechanism. In addition, Figure 15 shows that the hardness measured in the strips subjected to the BUT test was greater than those subjected to the STT test under both lubrication conditions. This behavior is attributed to the greater tangential force in the BUT test, which causes plastic deformation of the asperities. However, when uniform elongation was achieved in the STT test and the necking phenomenon began to appear, the deformation was located in the thickness, while the plane and width of the strip were no longer subject to the plane state of tension and deformation, which certainly attenuated the effect of the strain-hardening mechanism.
Over the years, researchers and scientists around the world have increasingly sought to use more accurate COF values in finite element analysis in the pre-production of a part. The more the COF value obtained resembles the real process, the better the precision in manufacturing processes, which minimizes costs, failures, time, and resources consumed in experimental tests. Bay et al. [18] explained that simulative tests are those that simulate or model the tribological conditions present in real sheet metal forming processes with the objective of the study, especially friction, wear, and lubrication in a controlled manner. For these reasons, simulative tests have gained increasing prominence in manufacturing processes, mainly because it is possible to change parameters such as sliding speed, contact pressure, and geometric parameters (e.g., die radius), which are fundamental in the study of tribological behavior in actual SMF processes.
It is important to emphasize that in addition to the PoD, test simulating the friction condition experienced by a blank when sliding under the flat region of a drawing die (circumferential compressive tension), this test continues to be of great relevance for the understanding and characterization of the mechanisms of friction, wear, and lubrication in a tribocontact, regardless of the analysis being carried out in a specific region of the stamped piece.

4. Conclusions

This study investigated the influence of different contact conditions on friction properties of AISI 430 steel sheets with deep drawing quality. The experimental results show the following:
  • Differences observed in the COF value indicate a strong dependence of the friction properties of the material with the kinematic conditions of the different tribological tests.
  • The COF value in the PoD test, under dry conditions, and pin with roughness Ra = 0.27 μm and Ra = 0.54 μm was approximately 0.536 and 0.673, respectively, i.e., higher among all the friction conditions investigated. The contact area between the specimen/pin was much smaller compared to that of the formability tests, and the normal pressure exerted by the pin on the specimen caused a rapid expansion of the real contact area, increasing the frictional resistance. Under lubricated conditions, the COF value was approximately 0.139 and 0.237, respectively.
  • In the BUT and STT tests, the COF increased with the increase in relative elongation due to increased strip roughness. For the pin with roughness Ra = 0.27 μm, the COF value was approximately 0.207 and 0.102, respectively. However, for the pin with roughness Ra = 0.54 μm, the COF value was approximately 0.223 and 0.123, respectively. As a result of the relative elongation, wide and thin ridges were formed on the strip surfaces subjected to both formability tests, which increased the COF value and strip surface wear.
  • The highest lubrication efficiency of 10.3% and 13% for the BUT and STT tests, respectively, was recorded using the pin with a roughness Ra = 0.27 μm, strip orientation of 0°, and relative elongation of 0.03, most probably owing to the lower degree of flattening of strip asperities, which functioned as an adequate reservoir of lubricant to the tribocontact.
  • The pressure distribution was not uniform at the contact interface between the strip and pin during the formability tests.
  • The hardness measured in the samples submitted to the PoD, BUT, and STT tests increased, on average, approximately 80%, 54%, and 43% under condition dry, and 76%, 46%, and 31%, under condition lubricated, respectively. This increase can be attributed to the strain hardening mechanism, which in turn results from the flattening of asperities owing to the high roughness and counter sample hardness.
  • The experimental results of COFs can be used as input data for numerical simulations, define design guidelines, improve productivity, and improve product quality from this material.

Author Contributions

Conceptualization, V.D.L., A.J.d.S., M.A.C. and P.C.d.M.R.; methodology, V.D.L., A.J.d.S., M.A.C. and P.C.d.M.R.; validation, V.D.L., A.J.d.S., M.A.C. and P.C.d.M.R.; formal analysis, P.C.d.M.R.; investigation, V.D.L., A.J.d.S., M.A.C. and P.C.d.M.R.; resources, V.D.L., A.J.d.S., M.A.C. and P.C.d.M.R.; data curation, V.D.L. and P.C.d.M.R.; writing—original draft preparation, V.D.L.; writing—review and editing, V.D.L. and P.C.d.M.R.; visualization, V.D.L. and P.C.d.M.R.; supervision, M.A.C. and P.C.d.M.R.; project administration, V.D.L. and P.C.d.M.R. All authors have read and agreed to the published version of the manuscript.

Funding

This research received no external funding.

Institutional Review Board Statement

Not applicable.

Informed Consent Statement

Not applicable.

Data Availability Statement

The data presented in this study are available on request from the corresponding author.

Acknowledgments

The authors would like to thank CEFET (Federal Center for Technological Education) and UFMG (Federal University and Minas Gerais) for their technical support and allowing the use of their equipment. The authors also thank Aperam South America, Timóteo, Minas Gerais, Brazil, for providing the Samples used in this study.

Conflicts of Interest

The authors declare no conflict of interest.

References

  1. Zhao, D.; Zhao, K.; Song, H.; Ren, D.; Ying Chang, Y. Influence of geometric attributes on friction coefficient in sheet metal stamping. Sci. Mech. 2021, 12, 945–958. [Google Scholar] [CrossRef]
  2. Azushima, A. Tribological Technology in Sheet Metal Forming. Materials Forming, Machining and Tribology, 1st ed.; Springer: Singapore, 2022; pp. 1–33. [Google Scholar]
  3. Holmberg, K.; Erdemir, A. Influence of tribology on global energy consumption, costs and emissions. Friction 2017, 5, 263–284. [Google Scholar] [CrossRef]
  4. Trzepiecinski, T.; Lemu, H.G. Recent Developments and Trends in the Friction Testing for Conventional Sheet Metal Forming and Incremental Sheet Forming. Metals 2020, 10, 47. [Google Scholar] [CrossRef]
  5. Xu, Z.; Huang, J.; Mao, M.; Peng, L.; Lai, X. An investigation on the friction in a micro sheet metal roll forming processes considering adhesion and ploughing. J. Mater. Proc. Technol. 2020, 285, 116790. [Google Scholar] [CrossRef]
  6. Luiz, V.D.; Amaral, E.C.; de Souza, V.P.; de Matos Rodrigues, P.C. Influência da velocidade de estampagem e anisotropia no comportamento tribológico e fratura de uma chapa de aço AISI 430Nb. Materia 2022, 27, e20148196. [Google Scholar]
  7. Trzepiecinski, T.; Lemu, H. Effect of Lubrication on Friction in Bending under Tension Test-Experimental and Numerical Approach. Metals 2020, 10, 544. [Google Scholar] [CrossRef]
  8. Luiz, V.D.; de Matos Rodrigues, P.C. Effect of the test conditions on tribological behavior of an Nb-stabilized AISI 430 stainless steel sheet. J. Braz. Soc. Mech. Sci. Eng. 2021, 43, 505. [Google Scholar] [CrossRef]
  9. Baltatu, M.S.; Vizureanu, P.; Sandu, A.V.; Munteanu, C.; Istrate, B. Microstructural Analysis and Tribological Behavior of Ti-Based Alloys with a Ceramic Layer Using the Thermal Spray Method. Coatings 2020, 10, 1216. [Google Scholar] [CrossRef]
  10. Paleu, C.C.; Munteanu, C.; Istrate, B.; Bhaumik, S.; Vizureanu, P.; Bălţatu, M.S.; Paleu, V. Microstructural Analysis and Tribological Behavior ofAMDRY 1371 (Mo–NiCrFeBSiC) Atmospheric Plasma Spray Deposited Thin Coatings. Coatings 2020, 10, 1186. [Google Scholar] [CrossRef]
  11. Staeves, J. Beurteilung der Topografie von Blechen im Hinblick auf die Reibung bei der Umformung. Ph.D. Thesis, Technical University of Darmstadt, Darmstadt, Germany, 1998. [Google Scholar]
  12. Schell, L.; Groche, P. In Search of the Perfect Sheet Metal Forming Tribometer. In Forming the Future, Proceedings of the 13th International Conference on the Technology of Plasticity, Columbus, OH, USA, 25–30 July 2021; Daehn, G., Cao, J., Kinsey, B., Tekkaya, E., Vivek, A., Yoshida, Y., Eds.; The Minerals, Metals & Materials Series; Springer: Cham, Switzerland, 2021. [Google Scholar]
  13. Bensaid, K.; Fredj, N.B. Influence of Sliding Speed and Normal Loads on the Wear Resistance of Hardox 500 Steel Ground Surfaces. In Advances in Mechanical Engineering, Materials and Mechanics, Proceedings of the ICAMEM 2019, Hammamet, Tunisia, 16–18 December 2019; Kharrat, M., Baccar, M., Dammak, F., Eds.; Lecture Notes in Mechanical Engineering; Springer: Cham, Switzerland, 2021; pp. 84–90. [Google Scholar]
  14. Trzepieciński, T. A study of the coefficient of friction in steel sheets forming. Metals 2019, 9, 988. [Google Scholar] [CrossRef]
  15. Luiz, V.D.; de Matos Rodrigues, P.C. Design of a tribo-simulator for investigation of the tribological behavior of stainless-steel sheets under different contact conditions. Mater. Res. 2022, 25, e20210220. [Google Scholar] [CrossRef]
  16. Trzepieciński, T.; Najm, S.M. Application of artificial neural networks to the analysis of friction behaviour in a drawbead profile in sheet metal forming. Materials 2022, 15, 9022. [Google Scholar] [CrossRef]
  17. Trzepieciński, T. Polynomial multiple regression analysis of the lubrication effectiveness of deep drawing quality steel sheets by eco-friendly vegetable oils. Materials 2022, 15, 1151. [Google Scholar] [CrossRef] [PubMed]
  18. Bay, N.; Olsson, D.D.; Andreasen, J.L. Lubricant test methods for sheet metal forming. Tribol. Int. 2008, 41, 844–853. [Google Scholar] [CrossRef]
  19. Schmitz, T.L.; Action, J.E.; Ziegert, J.C.; Sawyer, W.G. The difficulty of measuring low friction: Uncertainty analysis for friction coefficient measurements. J. Tribol. 2005, 127, 673–678. [Google Scholar] [CrossRef]
  20. Codd, D.S. Automotive Mass Reduction with Martensitic Stainless Steel; SAE Technical Paper 2011-01-0427; SAE International: Warrendale, PA, USA, 2011. [Google Scholar]
  21. Moon, J.; Ha, H.Y.; Kim, K.W.; Park, S.J.; Lee, T.H.; Kim, S.D.; Jang, J.H.; Jo, H.H.; Hong, H.U.; Lee, B.H.; et al. A new class of lightweight, stainless steels with ultra-high strength and large ductility. Sci. Rep. 2020, 10, 12140. [Google Scholar] [CrossRef]
  22. Luiz, V.D.; de Matos Rodrigues, P.C. Failure analysis of AISI 430 stainless steel sheet under stretching and bending conditions. Int. J. Adv. Manuf. Technol. 2022, 121, 2759–2772. [Google Scholar] [CrossRef]
  23. Olsson, C.-O.; Landolt, D. Passive films on stainless steels—Chemistry, structure and growth. Electrochim. 2003, 48, 1093–1104. [Google Scholar] [CrossRef]
  24. Zuazo, I.; Hallstedt, B.; Lindahl, B.; Selleby, M.; Soler, M.; Etienne, A.; Perlade, A.; Hasenpouth, H.; Massardier-Jourdan, V.; Cazottes, S.; et al. Low-density steels: Complex metallurgy for automotive applications. JOM 2014, 201466, 1747–1758. [Google Scholar] [CrossRef]
  25. Chen, S.; Rana, R.; Haldar, A.; Ray, R.K. Current state of Fe–Al–Mn–C low density steels. Prog. Mater. Sci. 2017, 89, 345–391. [Google Scholar] [CrossRef]
  26. Kirkhorn, L.; Bushlya, V.; Andersson, M.; Stahl, J.-E. The influence of tool steel microstructure on friction in sheet metal forming. Wear 2013, 302, 1268–1278. [Google Scholar] [CrossRef]
  27. ISSF. The Ferritic Solution: Properties, Advantages, Applications. 2020. Available online: https://www.worldstainless.org/Files/issf/non-image-files/PDF/ISSF_The_Ferritic_Solution_English.pdf (accessed on 30 November 2022).
  28. Tanure, L.; Alcântara, C.M.; Santos, D.B.; Oliveira, T.R.; Gonzalez, B.M.; Kim Verbeken, K. Microstructural characterization and mechanical behavior during recrystallization annealing of Nb-stabilized type ASTM 430 and Nb-Ti-stabilized ASTM 439 ferritic stainless steels. J. Mater. Res. Technol. 2019, 8, 4048–4065. [Google Scholar] [CrossRef]
  29. ASTM A240:2012; Standard Specification for Chromium and Chromium-Nickel Stainless Steel Plate, Sheet, and Strip for Pressure Vessels and for General Applications. American Society for Testing and Materials: West Conshohocken, PA, USA, 2012.
  30. EN ISO 6892-1:2020; Specifies the Method for Tensile Testing of Metallic Materials and Defines the Mechanical Properties Which Can Be Determined at Room Temperature. International Organization for Standardization: Geneva, Switzerland, 2020.
  31. Banabic, D.; Bunge, H.-J.; Pöhlandt, K.; Tekkaya, A.E. Formability of Metallic Materials: Plastic Anisotropy, Formability Testing, Forming Limits. Springer: Berlin/Heidelberg, Germany, 2000. [Google Scholar]
  32. ASTM E8:2016; Standard Test Methods for Tension Testing of Metallic Materials. American Society for Testing and Materials: West Conshohocken, PA, USA, 2016.
  33. Rabinowicz, E. Friction and Wear of Materials, 2nd ed.; John Wiley & Sons Ltd.: New York, NY, USA, 1995. [Google Scholar]
  34. Archard, J.F. Contact and Rubbing of Flat Surfaces. J. Appl. Phys. 1953, 24, 981–988. [Google Scholar] [CrossRef]
  35. ASTM G99-05:2010; Standard Test Method for Wear Testing with a Pin on Disk Apparatus. American Society for Testing and Materials: West Conshohocken, PA, USA, 2010.
  36. Andreasen, J.L.; Olsson, D.D.; Chodnikiewicz, K.; Bay, N. Bending under tension test with direct friction measurement. Proc. Inst. Mech. Eng. B J. Eng. Manuf. 2006, 220, 73–80. [Google Scholar] [CrossRef]
  37. Hutchings, I.M.; Shipway, P. Tribology: Friction and Wear of Engineering Materials, 2nd ed.; Butterworth-Heinemann: Cambridge, UK, 2017. [Google Scholar]
  38. Bhushan, B. Introduction to Tribology, 2nd ed.; John Wiley & Sons Ltd.: New York, NY, USA, 2013. [Google Scholar]
  39. Holmberg, K.; Matthews, A. Coatings Tribology: Properties, Mechanisms, Techniques and Applications in Surface Engineering, 2nd ed.; Elsevier Sciense: London, UK, 2009. [Google Scholar]
  40. Wang, J.; Zhou, X.; Thompson, G.E.; Hunter, J.A.; Yuan, Y. Delamination of near-surface layer on cold rolled AlFeSi alloy during sheet forming. Mater. Charact. 2015, 99, 109–117. [Google Scholar] [CrossRef]
  41. Suh, N.P. The delamination theory of wear. Wear 1973, 25, 111–124. [Google Scholar] [CrossRef]
  42. Schey, J.A. Tribology in Metalworking: Friction, Lubrication, and Wear. J. Appl. Metalwork. 1984, 3, 173. [Google Scholar] [CrossRef]
  43. Masters, L.G.; Williams, D.K.; Roy, R. Friction behaviour in strip draw test of pre-stretched high strength automotive aluminium alloys. Int. J. Mach. Tools Manuf. 2013, 73, 17–24. [Google Scholar] [CrossRef]
  44. Xiaoguang Ma, X.; Zhao, J.; Du, W.; Zhang, X.; Jiang, L.; Jiang, Z. An analysis of ridging of ferritic stainless steel 430. Mater. Sci. Eng. A 2017, 685, 358–366. [Google Scholar]
  45. Shin, H.J.; An, J.K.; Park, S.H.; Lee, D.N. The effect of texture on ridging of ferritic stainless steel. Acta Mater. 2003, 51, 4693–4706. [Google Scholar] [CrossRef]
  46. Trzepieciński, T.; Bazan, A.; Lemu, H.G. Frictional characteristics of steel sheets used in automotive industry. Int. J. Automot. Technol. 2015, 16, 849–863. [Google Scholar] [CrossRef]
  47. Ter Haar, R. Friction in Sheet Metal Forming, the Influence of (Local) Contact Conditions and Deformation. Ph.D. Thesis, Universiteit Twente, Enschede, The Netherlands, 1996. [Google Scholar]
  48. Aksoy, M.; Kuzucu, V.; Korkut, M.H. The effect of niobium and homogenization on the wear resistance and some mechanical properties of ferritic stainless steel containing 17–18 wt.% chromium. J. Mater. Process. Technol. 1999, 91, 172–177. [Google Scholar] [CrossRef]
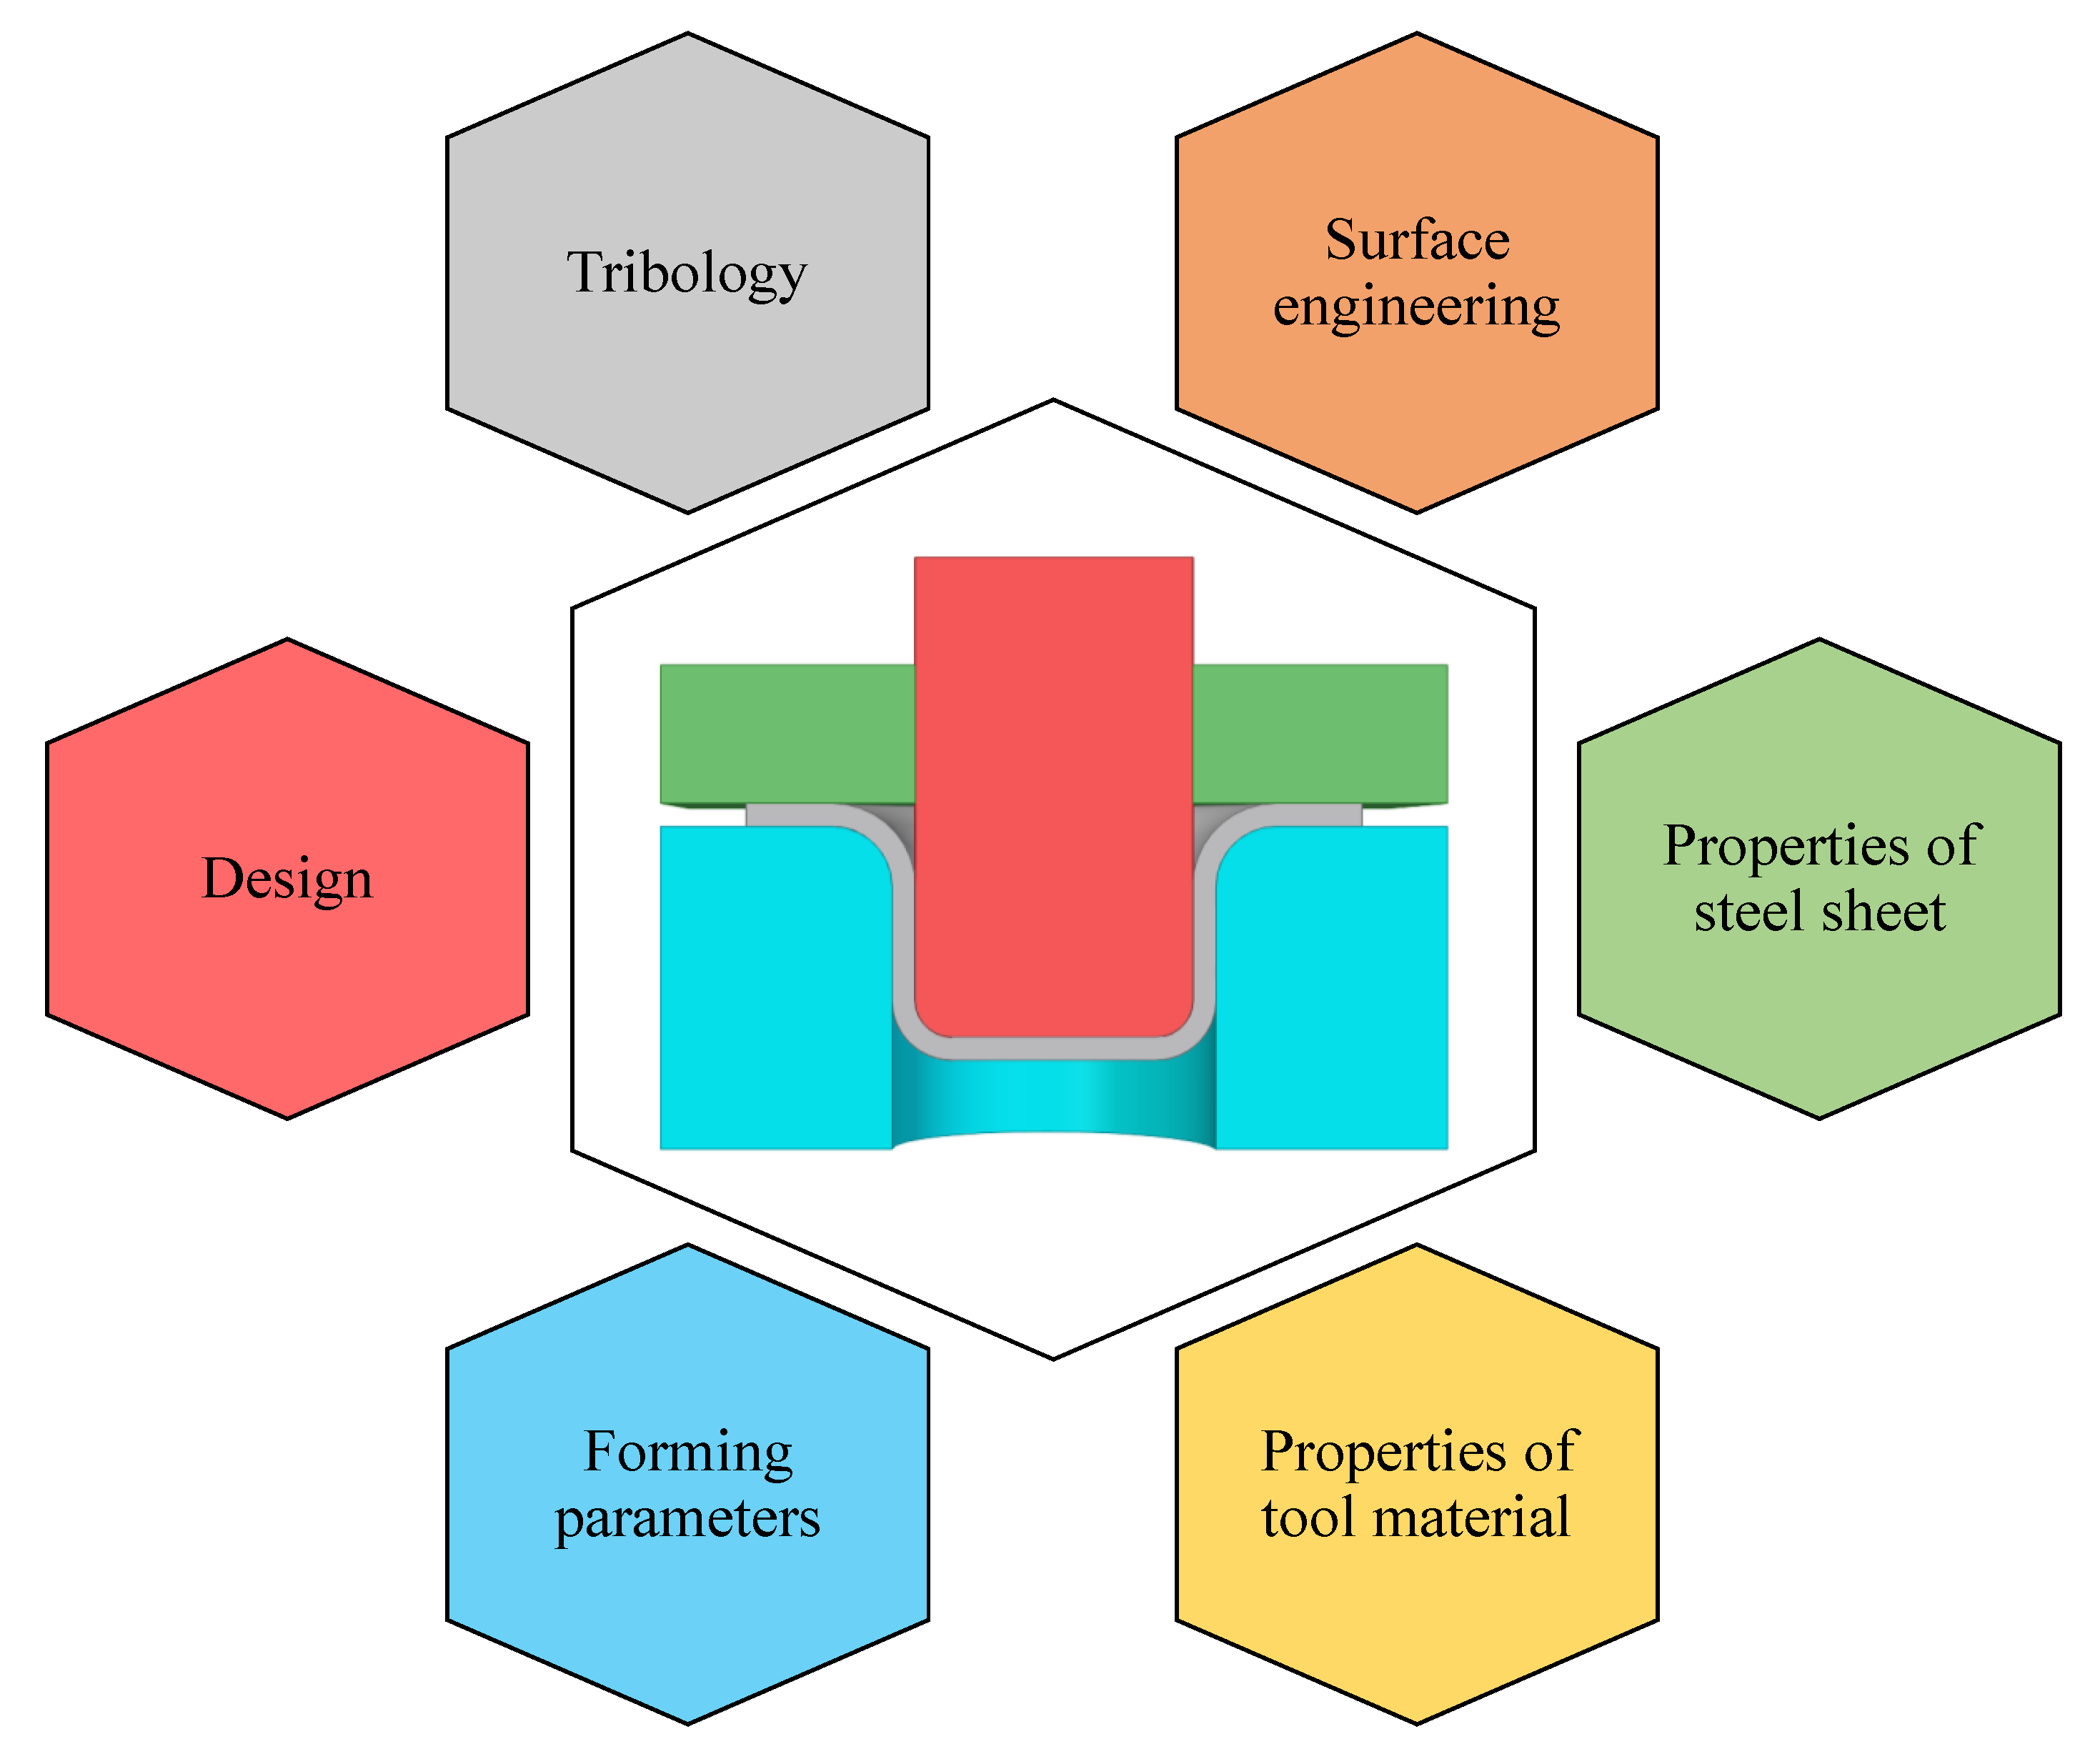
Figure 1. Factors influencing sheet metal formability.
Coatings 13 00771 g001
Figure 2. (a) Pin-on-disk tribometer; (b) motion diagram; (c) carbide pin dimensions (in mm).
Coatings 13 00771 g002
Figure 3. Schematic representation: (a) deep drawing process; (b) BUT test; (c) STT test.
Coatings 13 00771 g003
Figure 4. Tribo-simulator of metallic sheets: image (a) front and (b) side.
Coatings 13 00771 g004
Figure 5. Experimental results of the PoD test. (a) COF and (b) wear rate.
Coatings 13 00771 g005
Figure 6. EDS analysis of the wear track surface.
Coatings 13 00771 g006
Figure 7. (a) Specimen section and (b) SEM image of the wear track surface.
Coatings 13 00771 g007
Figure 8. Characteristic curves of the acting forces and COF under the following test conditions: pin roughness Ra = 0.54 μm, relative elongation ε r = 0.06, strip orientation: 0°, lubricated condition. (a) BUT test; (b) STT test. ( F 1 F 2 ) is the difference between the forces acting on each side of the metallic strip.
Coatings 13 00771 g008
Figure 9. (a) Friction characteristic curve with two stages of friction (BUT test); (b) Image showing the change from scratching to severe adhesive wear; (c) Specimen with a high degree of discoloration and galling.
Coatings 13 00771 g009
Figure 10. COF values obtained in the BUT test: (a) dry contact and (b) lubricated contact.
Coatings 13 00771 g010
Figure 11. COF value obtained in the STT test: (a) dry contact and (b) lubricated contact.
Coatings 13 00771 g011
Figure 12. Effectiveness of lubrication ( L e -index): (a) BUT test and (b) STT test.
Coatings 13 00771 g012
Figure 13. Average values of the COFs: (a) dry contact and (b) lubricated contact.
Coatings 13 00771 g013
Figure 14. Image of tribological pair surface: (a) specimen and (b) counter samples (bending pin).
Coatings 13 00771 g014
Figure 15. Average hardness measured below wear surface: (a) dry contact and (b) lubricated contact.
Coatings 13 00771 g015
Table 1. Chemical composition of the AISI 430 steel (wt %).
CMnSiPSNiCrMoNbTiN (ppm)
0.01640.24540.24470.03620.00090.296416.4810.02340.33840.0035231
Table 2. Mechanical properties of the AISI 430 steel.
Direction S y , MPa S u , MPa e u , % e t nr r b Δr
316.1464.922.332.70.2051.4191.3660.340
45°343.4475.617.927.20.1881.196
90°317.5466.519.833.20.2011.654
Sy = yield strength, Su = ultimate tensile strength, e u = uniform elongation, e t = total elongation, n = hardening coefficient, r = normal anisotropy coefficient, r b = mean normal anisotropy coefficient, and Δr = planar anisotropy coefficient.
Table 3. Operating parameters used in the PoD test.
ParameterDescription
Normal force15 N
Tangential speed0.2 m/s
Rotation speed191 rpm
Wear track radius10 mm
Sliding distance120 m
Specimen dimensions0.8 mm × 25 mm × 58 mm
Table 4. Operating parameters used in the formability tests.
ParameterDescription
Speed drawing v 10 mm/s
Pin radius R 9 mm
Relative elongation ε r 3%, 6%, and 9%
Specimen direction0° and 90°
Specimen dimensions t × w × l 0.8 mm × 25 mm × 750 mm
Disclaimer/Publisher’s Note: The statements, opinions and data contained in all publications are solely those of the individual author(s) and contributor(s) and not of MDPI and/or the editor(s). MDPI and/or the editor(s) disclaim responsibility for any injury to people or property resulting from any ideas, methods, instructions or products referred to in the content.