Article

Nondestructive Inspection of Underwater Coating Layers Using Ultrasonic Lamb Waves

1
Graduate School of Mechanical System Design, Pusan National University, Busan 46241, Republic of Korea
2
School of Mechanical Engineering, Pusan National University, Busan 46241, Republic of Korea
3
Institute of Nuclear Safety and Management, Pusan National University, Busan 46241, Republic of Korea
4
Ocean Space Development and Energy Research Department, Korea Institute of Ocean Science & Technology, Busan 49111, Republic of Korea
*
Author to whom correspondence should be addressed.
Coatings 2023, 13(4), 728; https://doi.org/10.3390/coatings13040728
Submission received: 30 December 2022 / Revised: 29 March 2023 / Accepted: 1 April 2023 / Published: 3 April 2023

Abstract

:
Coatings play a crucial role in protecting ships and marine structures from corrosion and extending their service life. The reliability of these coatings depends on their proper maintenance, which in turn, relies on the application of reliable diagnostic techniques. Non-destructive testing (NDT) techniques are useful in material diagnostics, such as detecting debonded zone in water. However, the challenging access environment in the ocean, and the high attenuation characteristics of the material itself add too many technical challenges. In this paper, we propose a guided wave-based technique for characterizing the bonded zone state of coatings, which uses FFT analysis in different bonded zone states. The proposed technique has been demonstrated to be effective in characterizing the bonded zone state of water coatings through numerical and experimental results.

1. Introduction

The corrosion of marine structures poses a significant threat to the development of the marine industry [1,2]. Steel structures, in particular, are vulnerable to attack from seawater, which can lead to chloride and sulfate corrosion [3,4]. To combat this problem, surface coating techniques using epoxy resins have been widely employed for the repair and protection of steel structures [5,6,7]. However, the integrity of these coatings can deteriorate over time, leading to the debonded zone of the coating layer from the underlying substrate [8,9,10]. This degradation of coatings can compromise the structural integrity of marine structures and threaten the safety of personnel and equipment [11]. Therefore, it is crucial to develop effective methods for identifying and assessing the debonded zone state of coatings in marine structures. Such structures always have corrosion problems due to the presence of salt in seawater [12], and the attached marine organisms may threaten the structure’s safety [13,14]. An accident occurred in 1980 when the welds on the pile legs of the Alexander Gideon rig in the British North Sea were corroded by seawater, and the cracks expanded under repeated wave loads, resulting in the capsizing of the rig and the death of 123 people [15]. Another accident occurred when the Deepwater on 20 April 2010, the Deepwater Horizon rig in the Gulf of Mexico exploded due to the failure of a subsea valve, killing 11 people, followed by a three-month spill of crude oil from the seabed that exceeded 4 million barrels, making it the worst environmental disaster in U.S. waters [16]. Surface coatings play a crucial role in preserving the integrity and longevity of structures. In particular, the increasing demand for offshore wind farm structures is expected to drive the need for cost-effective maintenance solutions [17]. The maintenance cost of these structures can be substantial, accounting for up to 31.3% of the total cost [18]. Epoxy resin coatings have been widely used for the protection of steel marine structures due to their excellent chemical resistance, adhesion, and durability. However, recent advancements in materials science have led to the development of high alloy and intermetallic coatings that can offer superior protection against corrosion and erosion. These coatings can be deposited using thermal spray techniques such as plasma spraying, flame spraying, and arc spraying [19,20,21]. Recently, many researchers have studied the microstructure and corrosion behavior of the prepared composite coatings, such as immersion corrosion and corrosion wear [22,23]. In our research work, the non-destructive detection method of coating delamination in an immersion test was studied. Therefore, the proper application and maintenance of surface coatings are essential for ensuring the longevity and cost-effectiveness of these structures. In this study, we will explore a critical aspect of surface coatings, namely the evaluation of the bonded zone state of the coating layer.
In summary, the effectiveness of testing protective coating is essential, and it accounts for a large part of offshore structures’ construction and operation costs. The increasing demand for offshore energy sources has led to the development of various structures, including wind power farms and marine oil and gas drilling platforms [24]. These structures play a crucial role in the economic growth and energy security of nations. However, the harsh and corrosive environment of the ocean presents several challenges to the integrity and longevity of these structures. The proper application and maintenance of surface coatings are critical in ensuring the safety and longevity of these structures, especially given the significant cost associated with maintenance and repairs. The leading cause of corrosion due to coating protection failure is the debonded zone between the coating and the steel structure surface. The hole and too thin thickness or much wear may lead to the debonded zone. In operation, the inflow of seawater into the gap between coating and steel significantly affects the progress of corrosion and, over time, will increase the area of corrosion, so the detection of the debonded zone for underwater coating is critical. However, the coatings to be inspected are often coated on submerged marine structures, making it difficult to apply general ultrasonic NDT to the structures in the ocean, making it more difficult to monitor the debonded zone of the coatings and therefore underwater ultrasonic NDT techniques are required to characterize the debonded zone.
Ultrasonic nondestructive testing (UT) is a type of NDT that uses high-frequency sound waves to evaluate the properties of a material, component, or system without causing any damage. UT is a highly accurate and reliable method of NDT that can detect very small flaws and variations in material properties. UT is commonly used to detect internal flaws, measure thickness, and evaluate the mechanical properties of materials. In UT, a small transducer is placed on the surface of the material being tested. A transducer generates ultrasonic waves, which are transmitted through the material being evaluated. These waves are reflected back to the transducer when they encounter changes in the material’s properties, such as defects or the opposite surface of the material. The time it takes for the waves to travel through the material and return to the transducer provides valuable information about the material’s condition and any defects it may contain. The time it takes for the waves to travel through the material and be reflected back is used to calculate the distance to the reflecting surface or flaw. UT has a wide range of applications in various industries, including aerospace, automotive, construction, energy, and manufacturing. It can be used to inspect welds, pressure vessels, pipelines, bridges, aircraft components, and many other structures and materials. UT is particularly useful for inspecting materials that are difficult to access or that have complex shapes, as it can be used to test these materials from one side without the need for disassembly [25,26,27].
In this paper, underwater ultrasonic-guided wave technology is used to characterize the debonded zone. In the existing research on ultrasonic wave bulk, waves are used to evaluate the thickness and debonded zone degree of coatings in the air environment [28]. However, the underwater part is easy to rust but not easy to detect, and once a problem occurs, it may lead to severe consequences, so monitoring its quality will be more critical. Therefore, a technology that can use ultrasonic waves to monitor the quality of coatings underwater has been developed [29,30]. Bulk waves are used for ultrasonic transducers located at a certain distance from the surface of the coating layer, with water as a delay line, reducing the degree of influence of the attenuation of the coating on the signal analysis, and more accurately evaluating the quality of the coating layer. However, this method has certain drawbacks, for example, the detection range of bulk waves is relatively small, and there are many hard-to-reach areas in the underwater parts of marine structures, coupled with the large surface area that needs to be inspected, so it increases the time cost and risk for NDT personnel. Therefore, there is a need for a long-distance contactless ultrasonic wave in water: The Lamb wave. British physicist Lamb discovered the Lamb wave in 1917 by studying the sine wave in an infinite plate, which is also known as the plate wave. Lamb waves are a type of guided wave that propagates along the thin-walled boundaries of structures. They are generated by the excitation of a stress wave that is coupled with both a shear wave and a longitudinal wave. It belongs to a type of guided wave. Guided waves are elastic waves that propagate along the thin-walled structure of the structure boundary. Guided waves and bulk waves are two types of waves that can propagate through a medium, such as a solid or a fluid. While both types of waves have their own unique properties and characteristics, guided waves offer several advantages over bulk waves in certain situations. One advantage of guided waves is that they can be confined to a specific path or channel within the medium, making them easier to be controlled and manipulated. This can be useful in situations where it is important to direct the energy of the wave to a specific location or to prevent it from spreading out over a large area. Another advantage of guided waves is that they can have a longer range of propagation compared to bulk waves. This is because guided waves are confined to a specific path within the medium, which can help to reduce losses and attenuation. As a result, guided waves can often be used to transmit signals over long distances with less degradation. In addition, guided waves can exhibit a higher degree of localization, meaning that the energy of the wave is concentrated in a specific region or channel within the medium [31]. This can be useful for tasks such as imaging or sensing, where it is important to focus the energy of the wave on a specific area. Overall, the advantages of guided waves over bulk waves depend on the specific application and the requirements of the system. While bulk waves are often used for tasks such as transmitting sound or transmitting energy over a large area, guided waves can be more useful for tasks that require precise control of the wave’s propagation or localization of energy. Lamb waves are generally implemented for defect inspection of thin plates, but in this study, we implemented Lamb waves to detect delamination between a coating and a substrate in an underwater structure. Many studies have been carried out to detect delamination in multilayer structures or composite materials using guided ultrasound [32,33,34]. However, most of the studies are conducted in an atmospheric environment, so research is needed to detect delamination of the underwater coating layer.
In addition, various studies have shown that guided waves can be used to inspect underwater structures, coatings, insulating materials, or other inaccessible structures with excellent sensitivity [35]. However, due to the complexity of wave propagation characteristics, especially the dispersion properties of guided waves, the mode conversion phenomenon at defects, and the changes in the wave structure of each mode at different frequencies, it is still difficult to classify and determine the size of defects through guided waves for solving the problem [36]. Among them, the study of defect scattering analysis using purely analytical methods has achieved limited success for defects with simple geometric shapes. However, since the mathematical expressions of guided wave eigenmodes in such waveguide structures cannot be obtained, purely analytical methods are not applicable to such waveguides. The study of guided waves and their interaction with structural defects has gained significant attention in recent years. Researchers have sought numerical methods, such as the boundary element method (BEM), to study the scattering of guided waves in structures. BEM has several advantages over traditional numerical methods, including dimensionality reduction, reduced computer time and storage, and ease in handling unbounded domains. The hybrid boundary element method combined with normal mode expansion has been used to study Lamb wave mode conversion at the edges of plates and the interaction with surface fracture defects [37]. The same technique has also been used to study the interaction of shear horizontal (SH) waves with various cracks and corrosion boundaries in structures. These studies highlight the great potential of guided waves in solving structural defect characterization and measurement problems.
In this research work, the propagation of the Lamb wave in the coated structure was investigated. As matter of fact, the coated structure is permanently immersed in the water, and the water itself can be used to excite the Lamb wave. For the laboratory-based inspection, the specimens of carbon steel were coated. In the fabricated specimen, the coating layer was applied with a 1 mm thickness. Additionally, in the experimental studies, the delaminated coating layer was fabricated as well. According to the experimental results application of the Lamb wave for the inspection of the coating layer is feasible. The attenuation rate in the material can be used as a parameter to determine the bonded zone condition of the coating layer. FFT techniques can be used to evaluate the debonded zone state of the coating. Accurate thickness estimation and bond state assessment using the FFT ultrasonic pulse-echo method [38]. In this study, FFT will be used to evaluate the debonded zone state. Obtained waveforms show clear results in both time and frequency domains.

2. Experimental Methods and Corresponding Theory

2.1. Theory

2.1.1. Guided Wave Propagation in a Free Plate

The fundamental difference between bulk waves and guided waves in the sense of wave propagation is the fact that a boundary is required for guided wave propagation.
As a result of the interaction between the wave and the boundary along a thin plate or an interface, a variety of different waves is formed from reflection and mode conversion inside a structure. It is then superimposed with the area of constructive and destructive interference that finally leads to guided wave packets that can travel.
As ultrasonic energy from the excitation region encounters the upper and lower boundary surfaces of the plate, mode conversions of bulk wave occur (L-wave to T-wave and vice versa). After some travel time in the plate, superpositions cause the formation of wave packets or guided wave modes. The excitation band can be considered a driving force. The plate displacements must be in equilibrium with this force according to Navier’s displacement equilibrium equation, also known as the equation of motion in linear electrodynamics. The equation is
G 2 u ¯ + λ + G ¯ ¯ · u ¯ = ρ u ¯ t
Since there will be both longitudinal and shear (transverse) displacements, the displacement vector can be separated into longitudinal Φ = y e i k x ω t and transverse   Ψ ¯ = 0 0 φ y e i k x ω t components according to Helmholtz’s decomposition, that is
U ¯ = ¯ Φ + ¯ x   Ψ ¯
Using this formulation of the plate problem, substituting (2) into (1), solving these two equations results in two additional equations, which depend on the spatial coordinates, angular frequency, and propagation number. The second-order differential operator and cancellation eliminate the time dependence. The solutions of these homogeneous second-order equations can be written as,   y = A 1 cos k l y + A 2 sin k l y   φ y = A 3 cos k t y + A 4 sin k t y .
Where A 1 ,   A 2 ,   A 3 , and A 4 are constants that can be determined by boundary conditions. The consideration of boundary conditions starts with Hooke’s law, which relates stress to the volume and linear deformation of the plate caused by ultrasonic excitation. With these boundary conditions, the system of equations for the constants A i ; can be written in matrix form. The matrix entries, a i j are the coefficient of the A i S within the stress field equations.
a 11 a 14 a 41 a 44 A 1 A 4 = 0 0
From linear algebra, to obtain a nontrivial solution of the constants A i , the determinant of a matrix must be zero. The following two relationships must be satisfied for (3) solutions.
tan   d k t tan   d k l = 4 k 2 k t k l k t 2 k 2 2           Symmetric tan   d k t tan   d k l = k t 2 k 2 2 4 k 2 k t k l           Antisymmetric
With:
k l 2 = ω 2 c L 2 k 2 k t 2 = ω 2 c T 2 k 2
That the first equations were created by grouping the cosine terms and the second one by grouping the sine terms. These two equations are known as the Rayleigh-Lamb frequency equations. c L , c T ,   d ,   ω , and k are the longitudinal velocity, transverse velocity, thickness, angular frequency, and wave number in Equation (5).

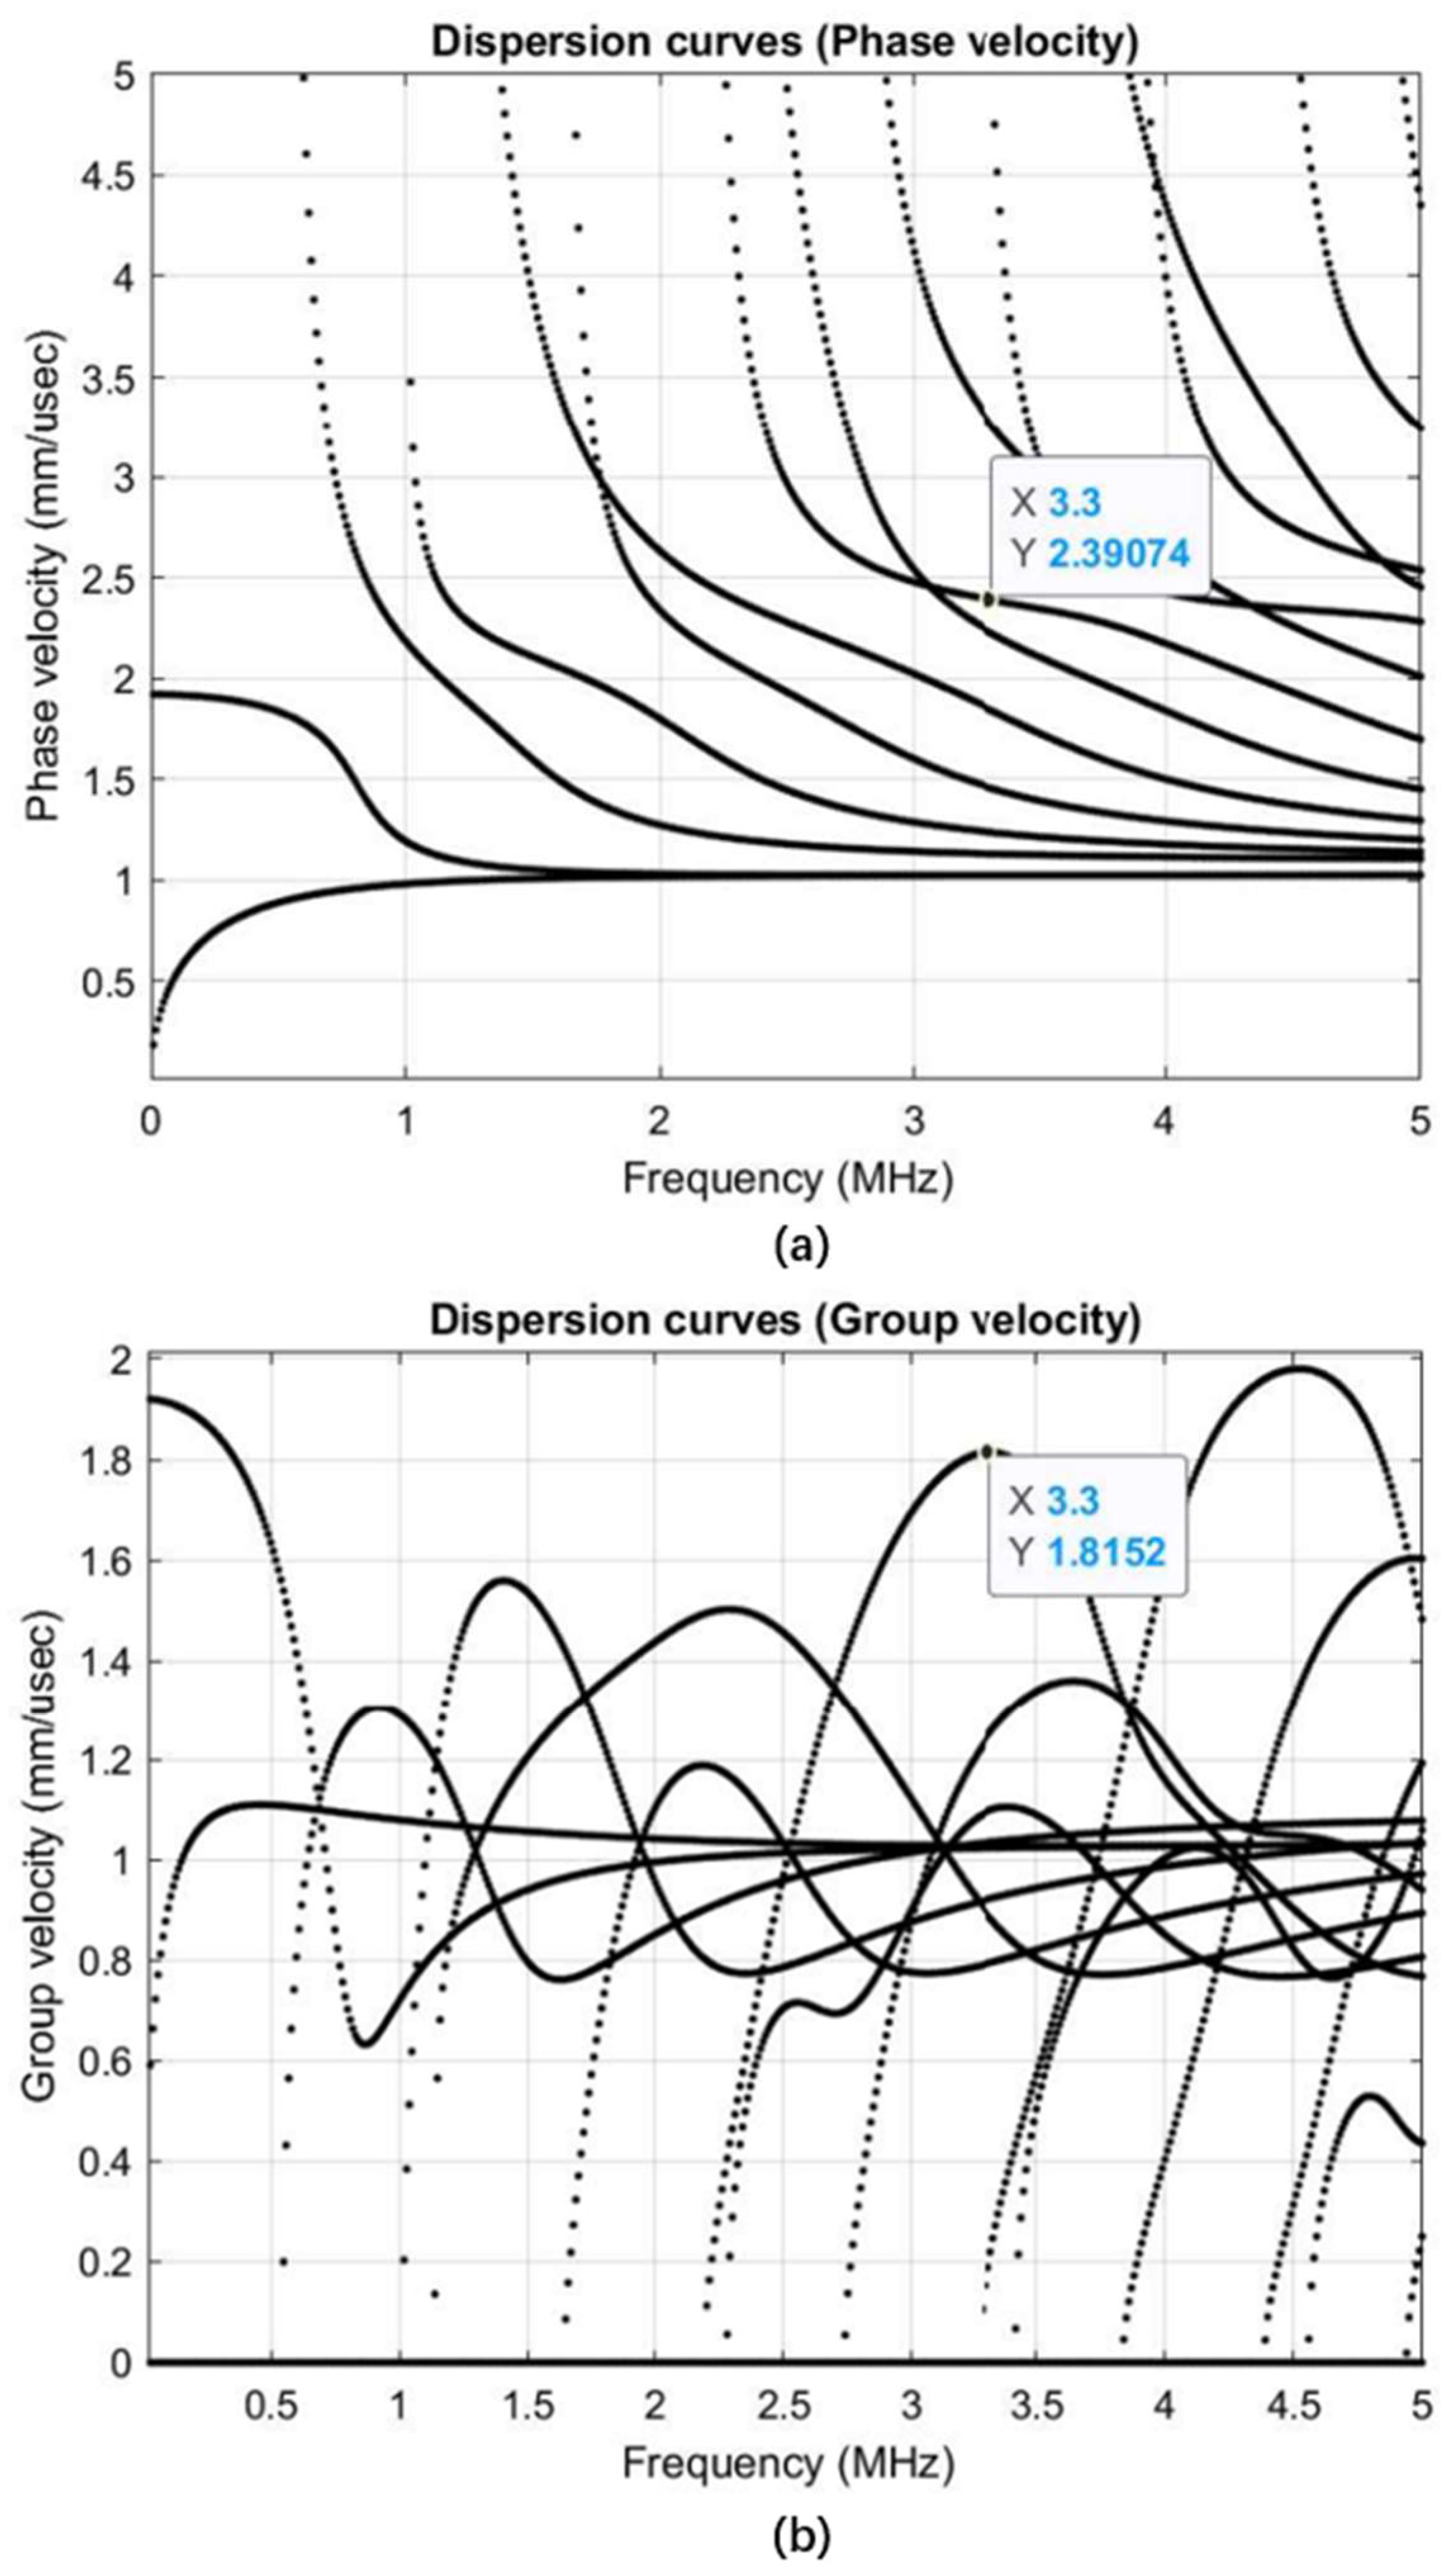
2.1.2. Dispersion Curves

In this study, proper mode selection plays an essential role in GW-based signal analysis. For experiments, the guided wave dispersion curves must be plotted, and the appropriate GW modes must be selected.
The longitudinal and transverse wave velocities ( c L = 2.28 mm / μ s and c T = 1.13 mm / μ s ) were measured experimentally to plot the dispersion curves. The dispersion curves of the dispersion equation are shown in Figure 1.
The mode selection for guided waves depends on the specimen geometry and material properties. The validation of Lamb wave modes relies on mode dominance, adequate wave energy ratio, and attenuation effects. From the dispersion line diagram, it can be concluded that for a coating material with a thickness of 1   mm , the appropriate Lamb wave mode is the S3 mode, and considering the attenuation and distortion effects, S3 mode, 3.3 MHz (with a thickness of 1   mm ) is considered to be the appropriate Lamb wave mode. The dispersion curve in Figure 1 shows that the calculated phase and group velocities are 2.39 and 1.81 mm/ μ s, respectively.

2.1.3. Fast Fourier Transform Analysis

In the time domain, the linear parameter of the Lamb wave, such as attenuation, time of flight, phase, and other parameters, can be observed. The frequency domain waveform allows the analysis of the nonlinear parameters. Frequency domain analysis of the waveform allows for determining fatigue and scattering.
Scattering of the waveform is the main physical phenomenon that occurs in the bonded coating layer due to the propagation of the waveform. This phenomenon is very difficult to recognize in the time domain because the scattering is usually called a variation of the main central frequency of the waveform. For this purpose, we use FFT for the analysis of the wave forming the timed frequency domain.

2.2. Experimental Methods

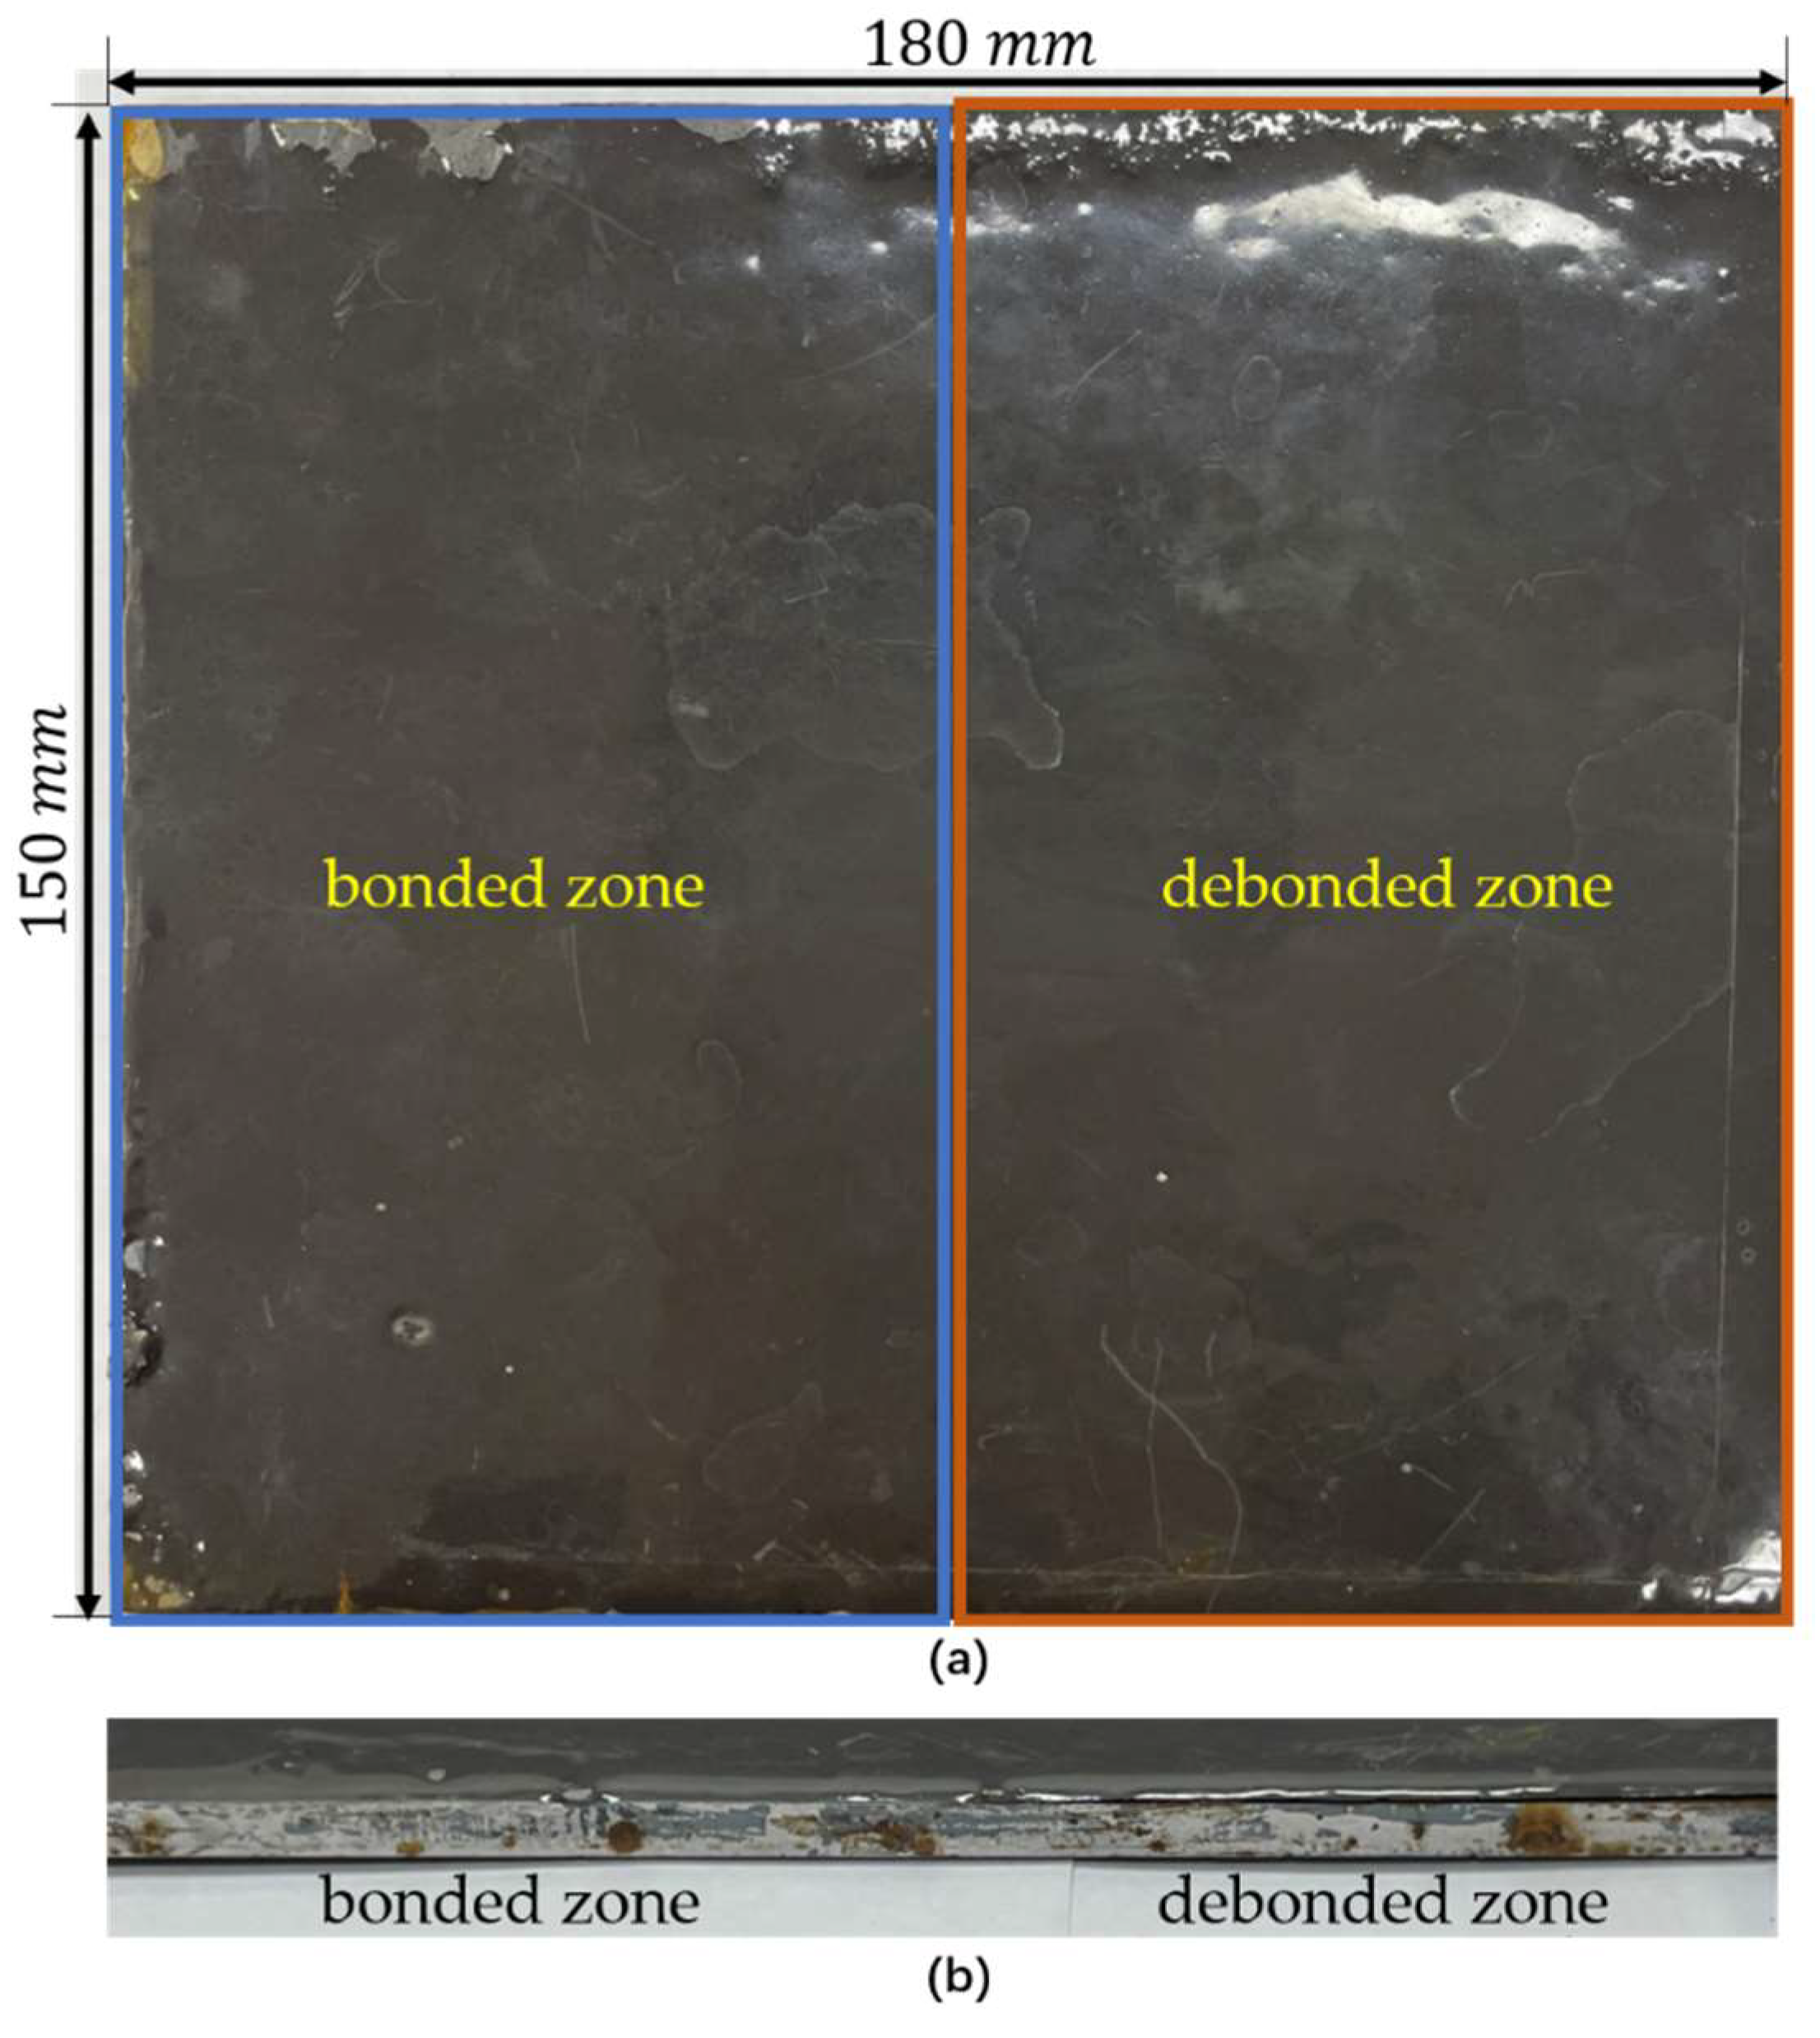
2.2.1. Preparation of Test Specimen

Coated specimens of marine structures were used to study the properties of guided wave propagation. SS275 steel plate (180 mm × 150 mm, thickness 4 mm) was used as the substrate of the specimen. SS275 steel is characterized by low carbon content, soft hardness, and tensile strength of 400 MPa. According to KS D 3505, its chemical composition consists of carbon (<0.25%), silicon (<0.45%), manganese (<0.14%), and low levels of phosphorus (<0.05%) and sulfur (<0.05%). The coating material was made according to the manufacturer’s instructions. The coating was prepared by mixing the epoxy resin (Alocit 28.14 epoxy coating-zinc primer dark grey) and hardener produced by ALOCIT SYSTEMS in a ratio of 5.1:1.
Before coating, use 400 and 800-grit sandpaper to cross-grind the surface of the steel plate and rubber from low to high, wipe with alcohol, apply the coating material evenly on the surface of the steel after drying, and put it into the mold to cure at room temperature for 72 h. There are various methods of coating application, but the commonly used way in this field is to use a traditional roller to coat only the surface of the substrate [34]. The specimens used to evaluate the debonded zone state of the coating are shown in Figure 2.
There are two types of experimental specimens; the first type is the area where the coating is bonded zone to the carbon steel plate, and the length and width of the bonded zone area are 90 and 150 mm, respectively, and the thickness of the coating is 1 mm. the second type is the area where the coating is debonded zone from the carbon steel, and the length and width and thickness of the debonded zone area of the coating are identical to the first type. The details of the coating material are shown in Table 1. In the process of fabricating the coating material, rollers were utilized to apply the coating onto the surface of the carbon steel plate. This method of application is conventional and commonly used in various industries. During the experiments, a carbon steel plate with a thickness of 4   mm was used. It is also worth mentioning that the surface of the plate could undergo a polishing process to ensure a uniform thickness of the coating material. After the fabrication of the specimen, the variation in thickness was measured at different positions on the surface using precise calipers. The average thickness was then calculated based on the collected data, which was found to be 0.99 mm, with a standard deviation of 0.0012 mm.

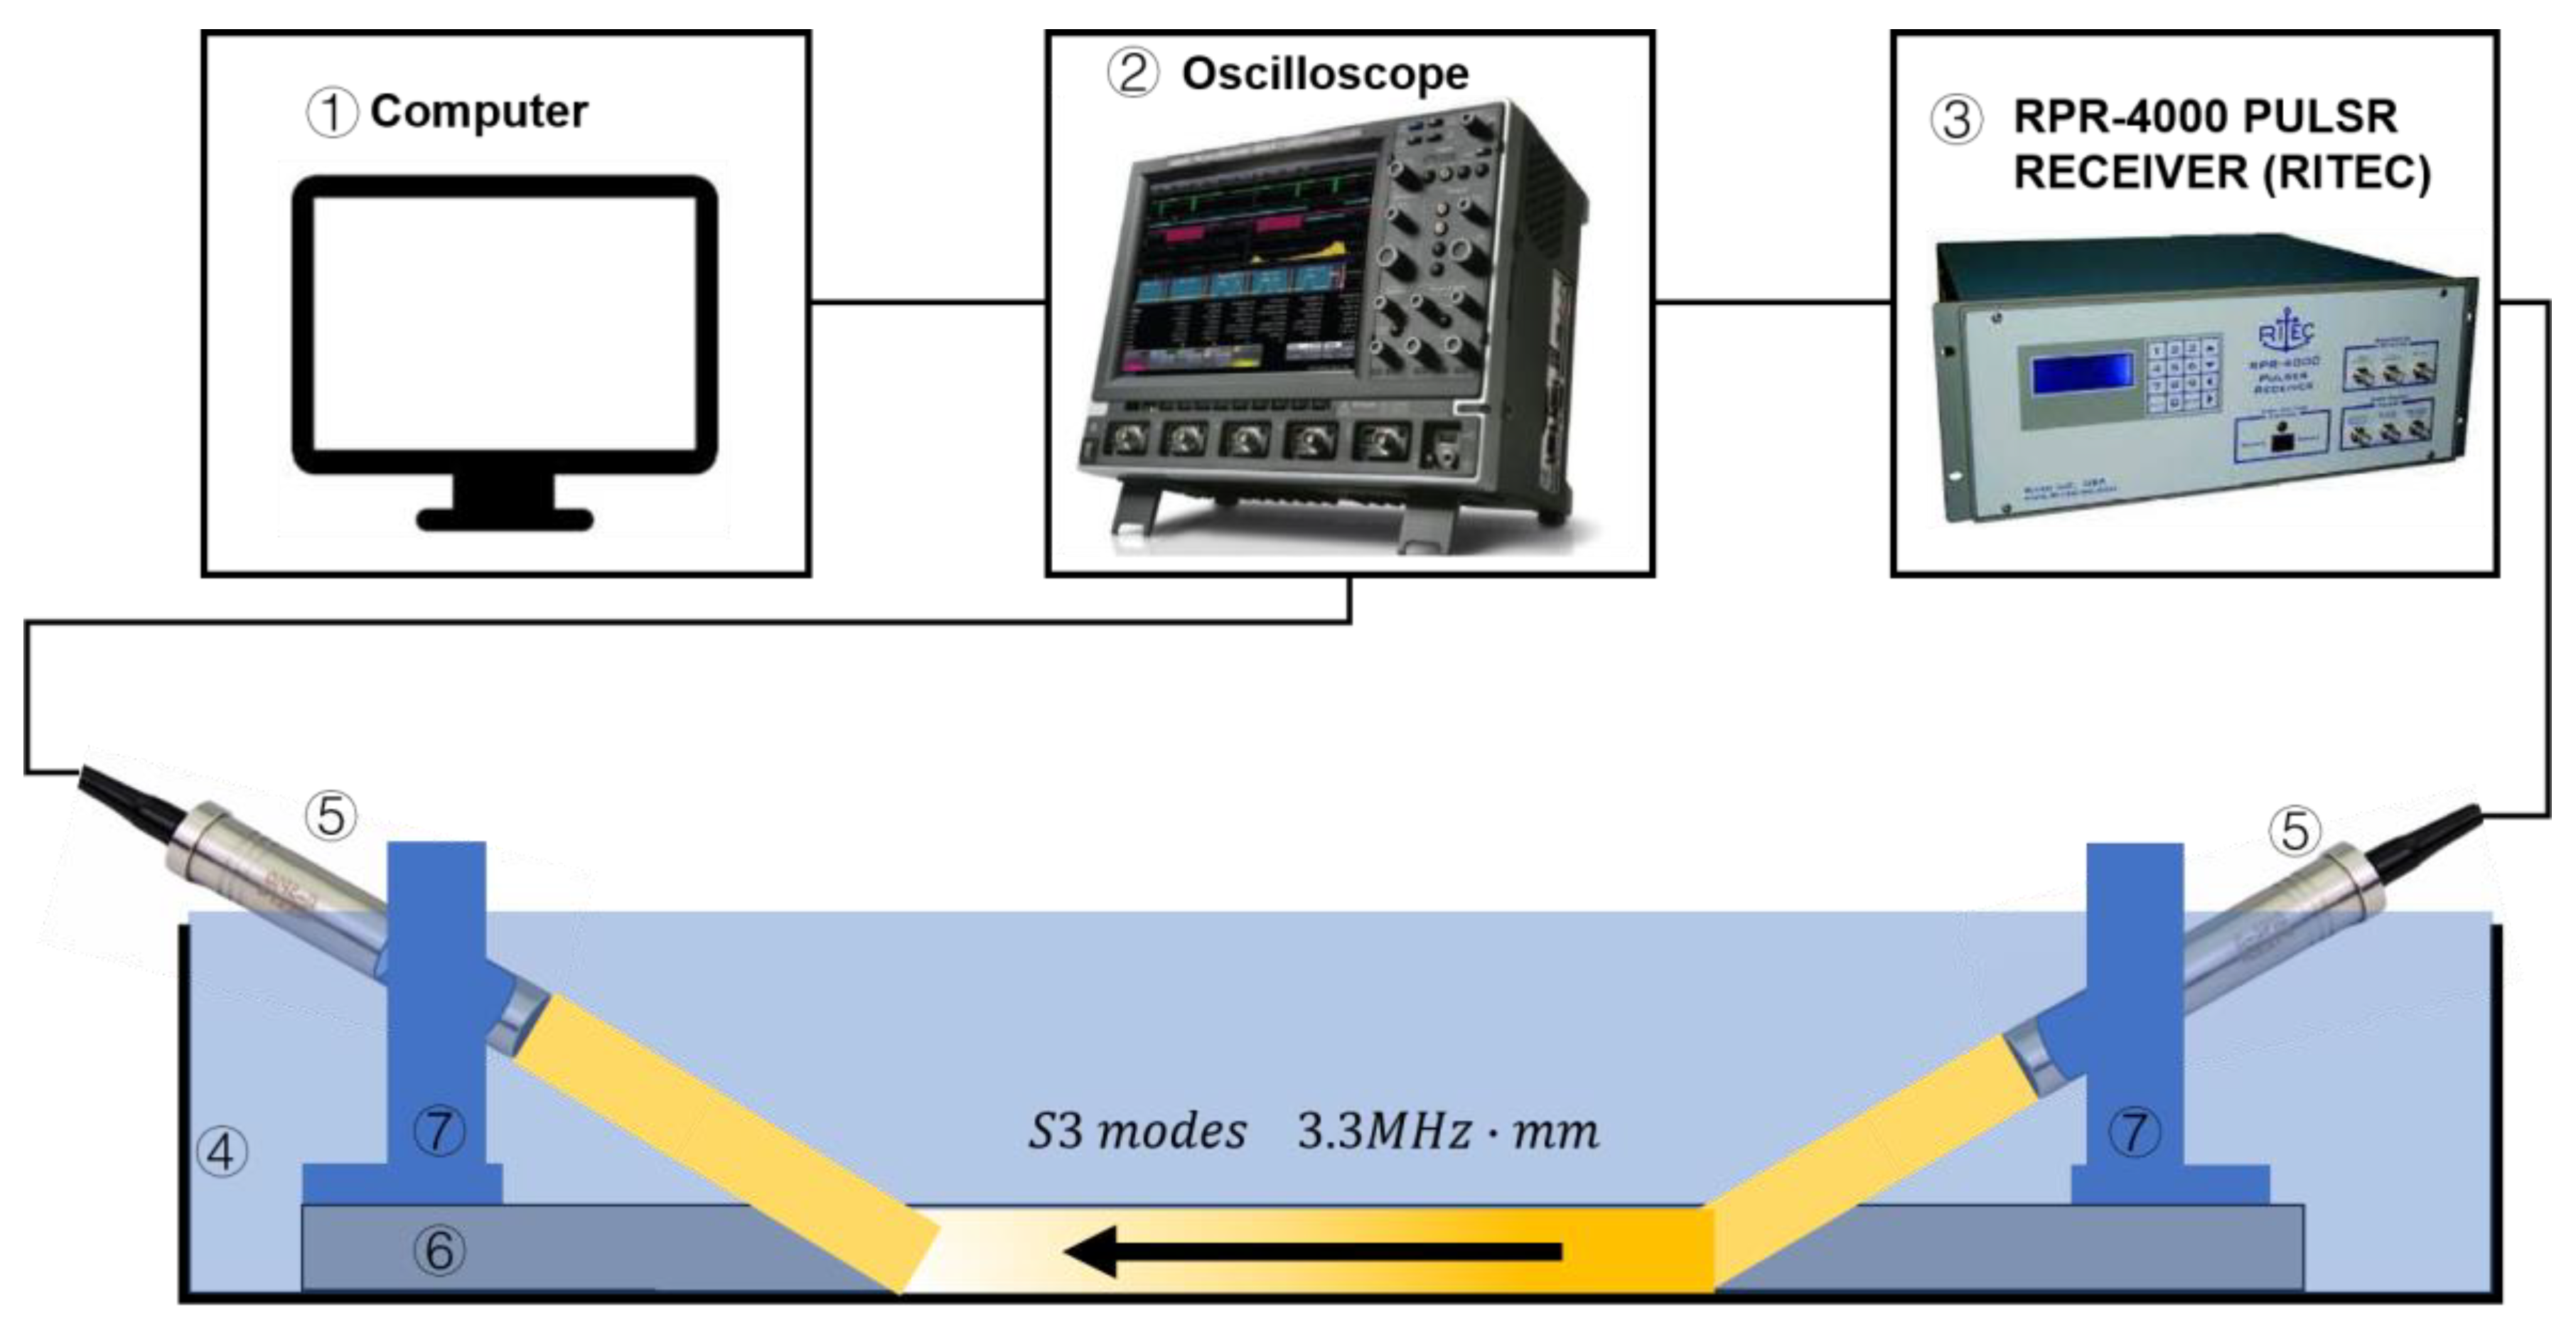
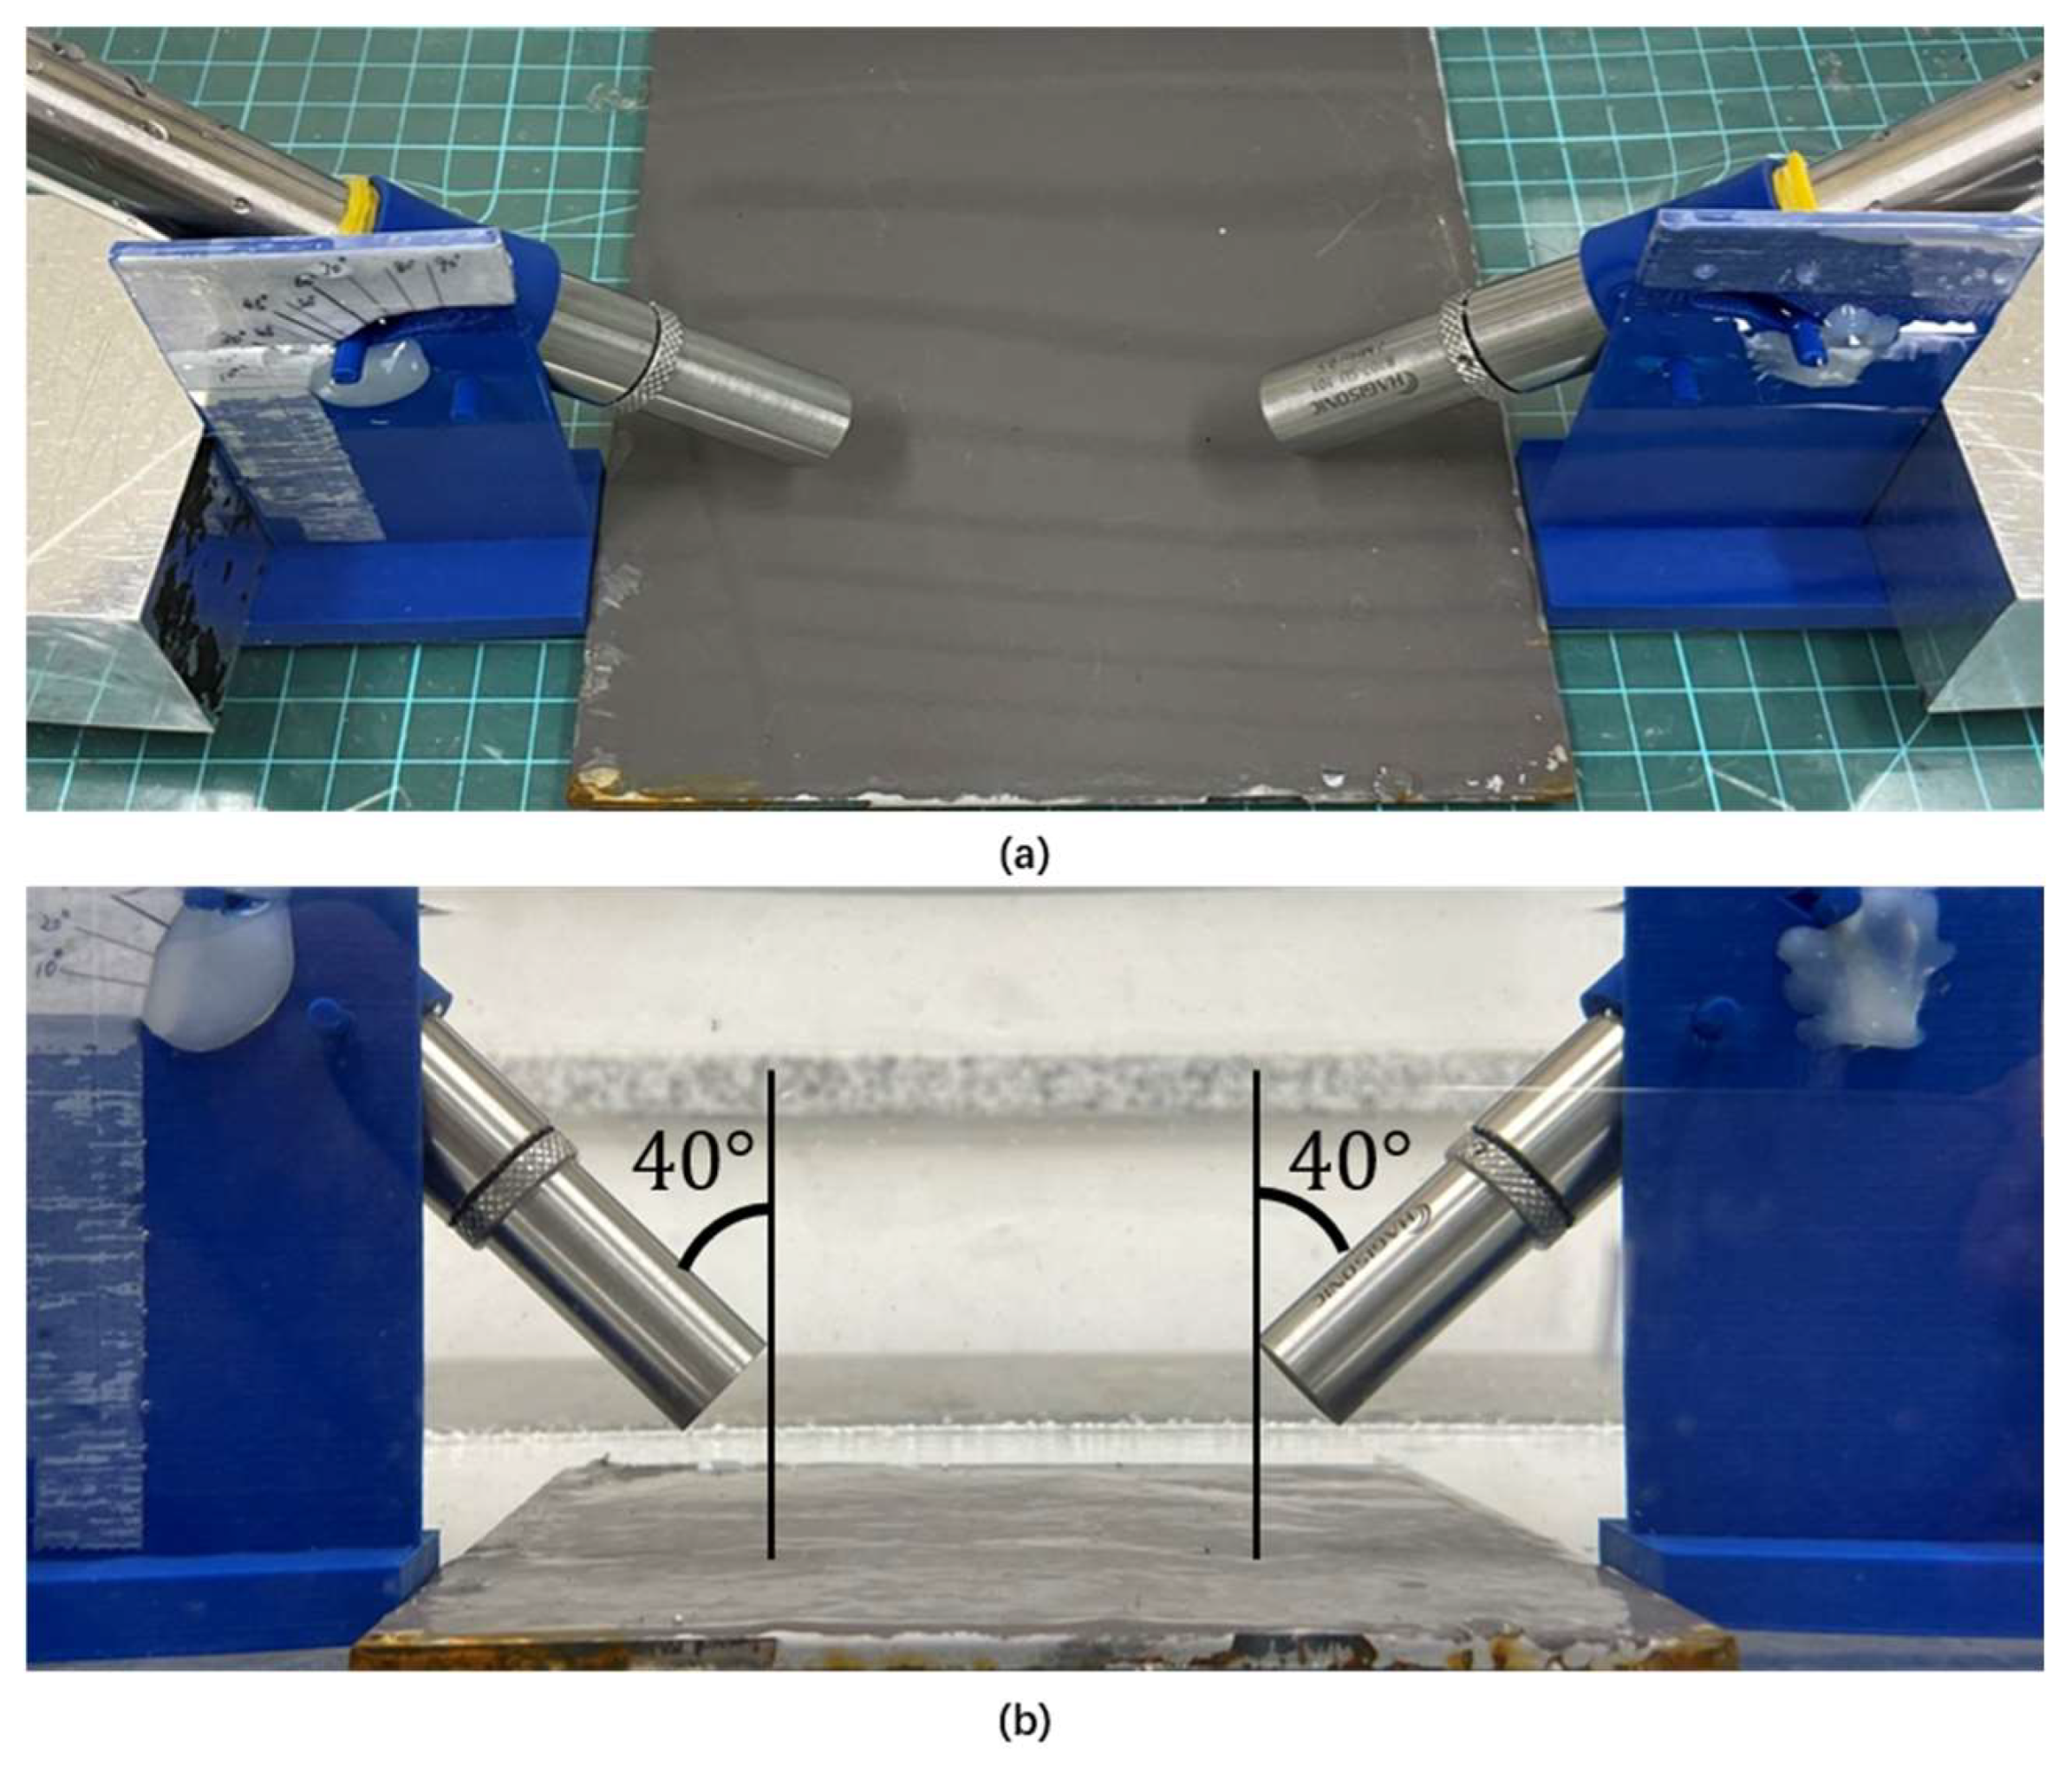
2.2.2. Experimental Setting

Figure 3 shows the instrument setup for water-induced ultrasonic measurements. In this experiment, a water immersion transducer is used for Lamb wave generation and an ultrasonic pulse signal is generated using an ultrasonic generating device (RITEC RPR-4000, RITEC, Warwick, RI, USA). This device can generate a signal at 3.3   MHz with a transducer with a center frequency of 3.5   MHz , which is similar to the mode selected in the theory. The ultrasonic generating device is connected to an oscilloscope (Wave runner 640 zi, Teledyne Lecroy, Rockland Country, New York, NY, USA) and a computer for signal processing and analysis. An immersion transducer was used in the coated coupon samples to transmit and receive Lamb wave signals. The transducer was made of an immersion transducer (HAGISONIC) with a center frequency of 3.5   MHz . Experiments were conducted using water as the acoustic coupling.

3. Wave Analysis of Coatings in Water

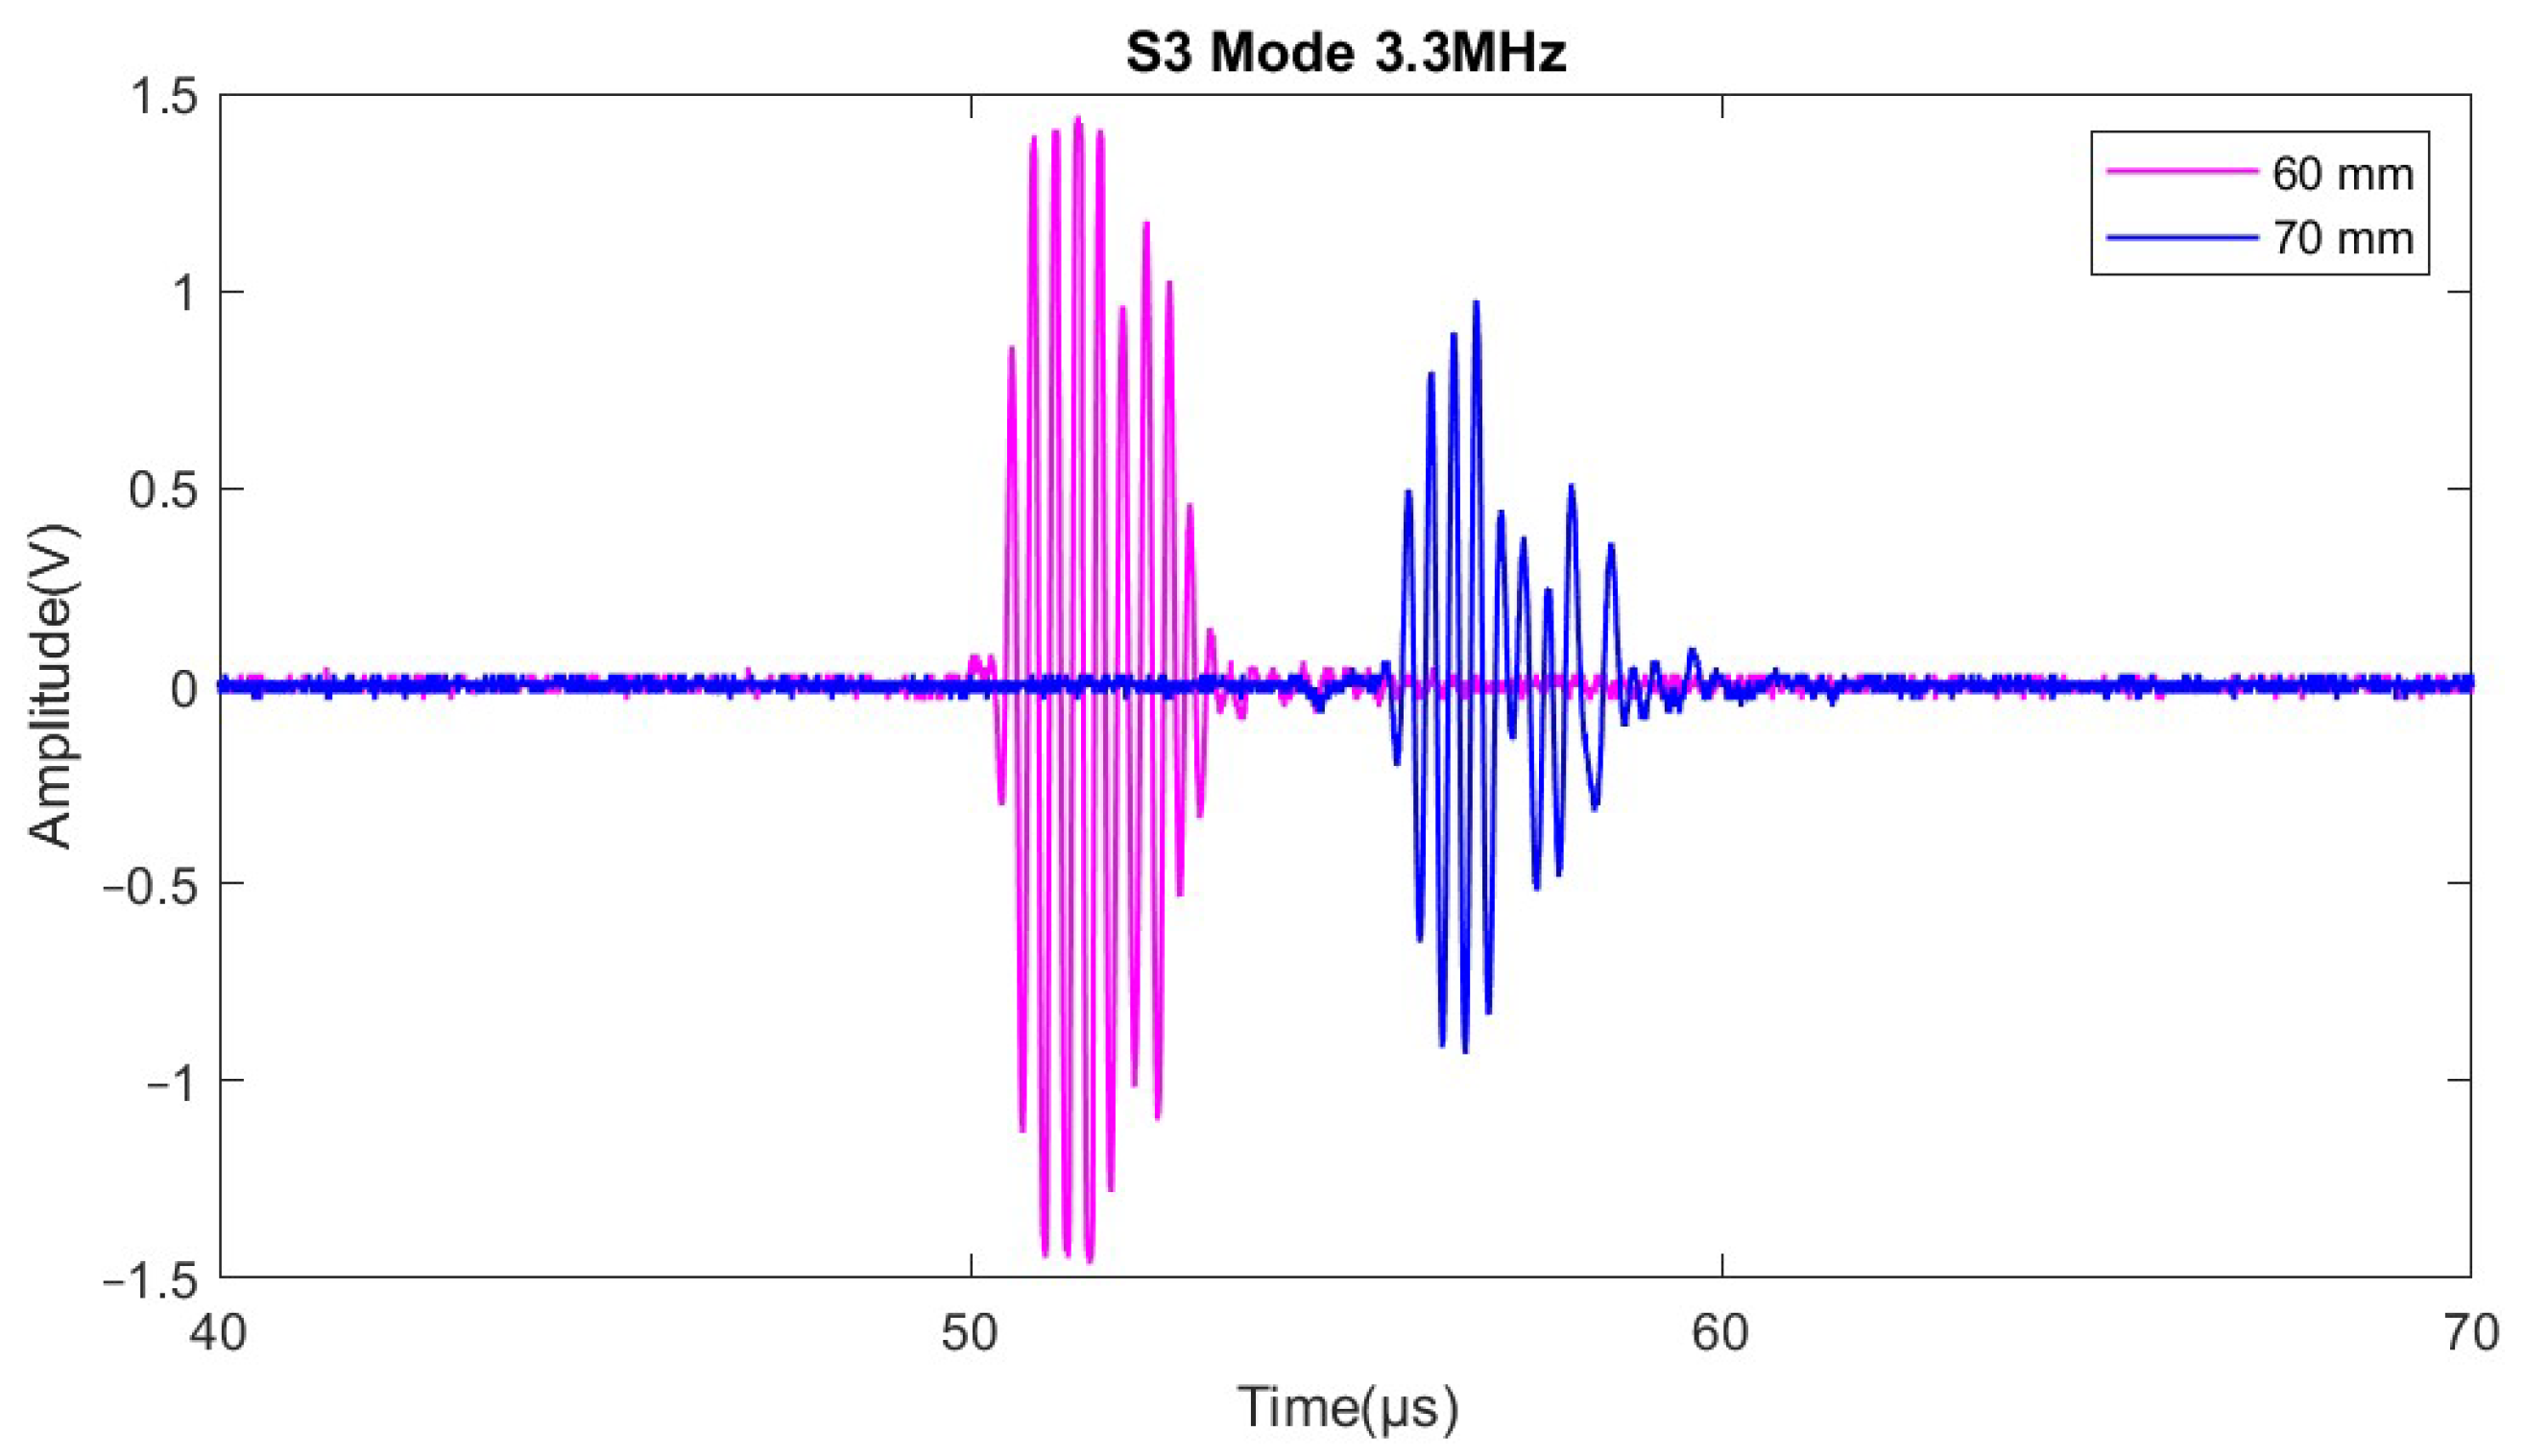
3.1. Wave Propagation of Coating-Bonded Zone Conditions

This study uses guided wave generation in water to evaluate coating samples. In the case of GW generation, it is necessary to consider the exact angle of incidence for correct wave propagation. In the case of symmetric and antisymmetric Lamb wave mode generation with an incidence angle of 40 ° , the GW signal will be acquired experimentally. The experiment is shown in Figure 4.
The symmetric S 3   modes   3.3   MHz · mm wave pattern was successfully generated, as shown in Figure 5. The wave propagation distances are 60   mm ,   70   mm ,   and   80   mm in steps of 10   mm , respectively. The propagation velocity is calculated from the wave signal as 1.81   mm / μ s , which is the same as the group velocity of the S 3 modes selected in theory by the dispersion line diagram, which means that the Lamb wave mode is successfully generated. Moreover, the wave signal naturally attenuates with increasing distance. These criteria can be used to assess the condition of the coating-bonded zone status.

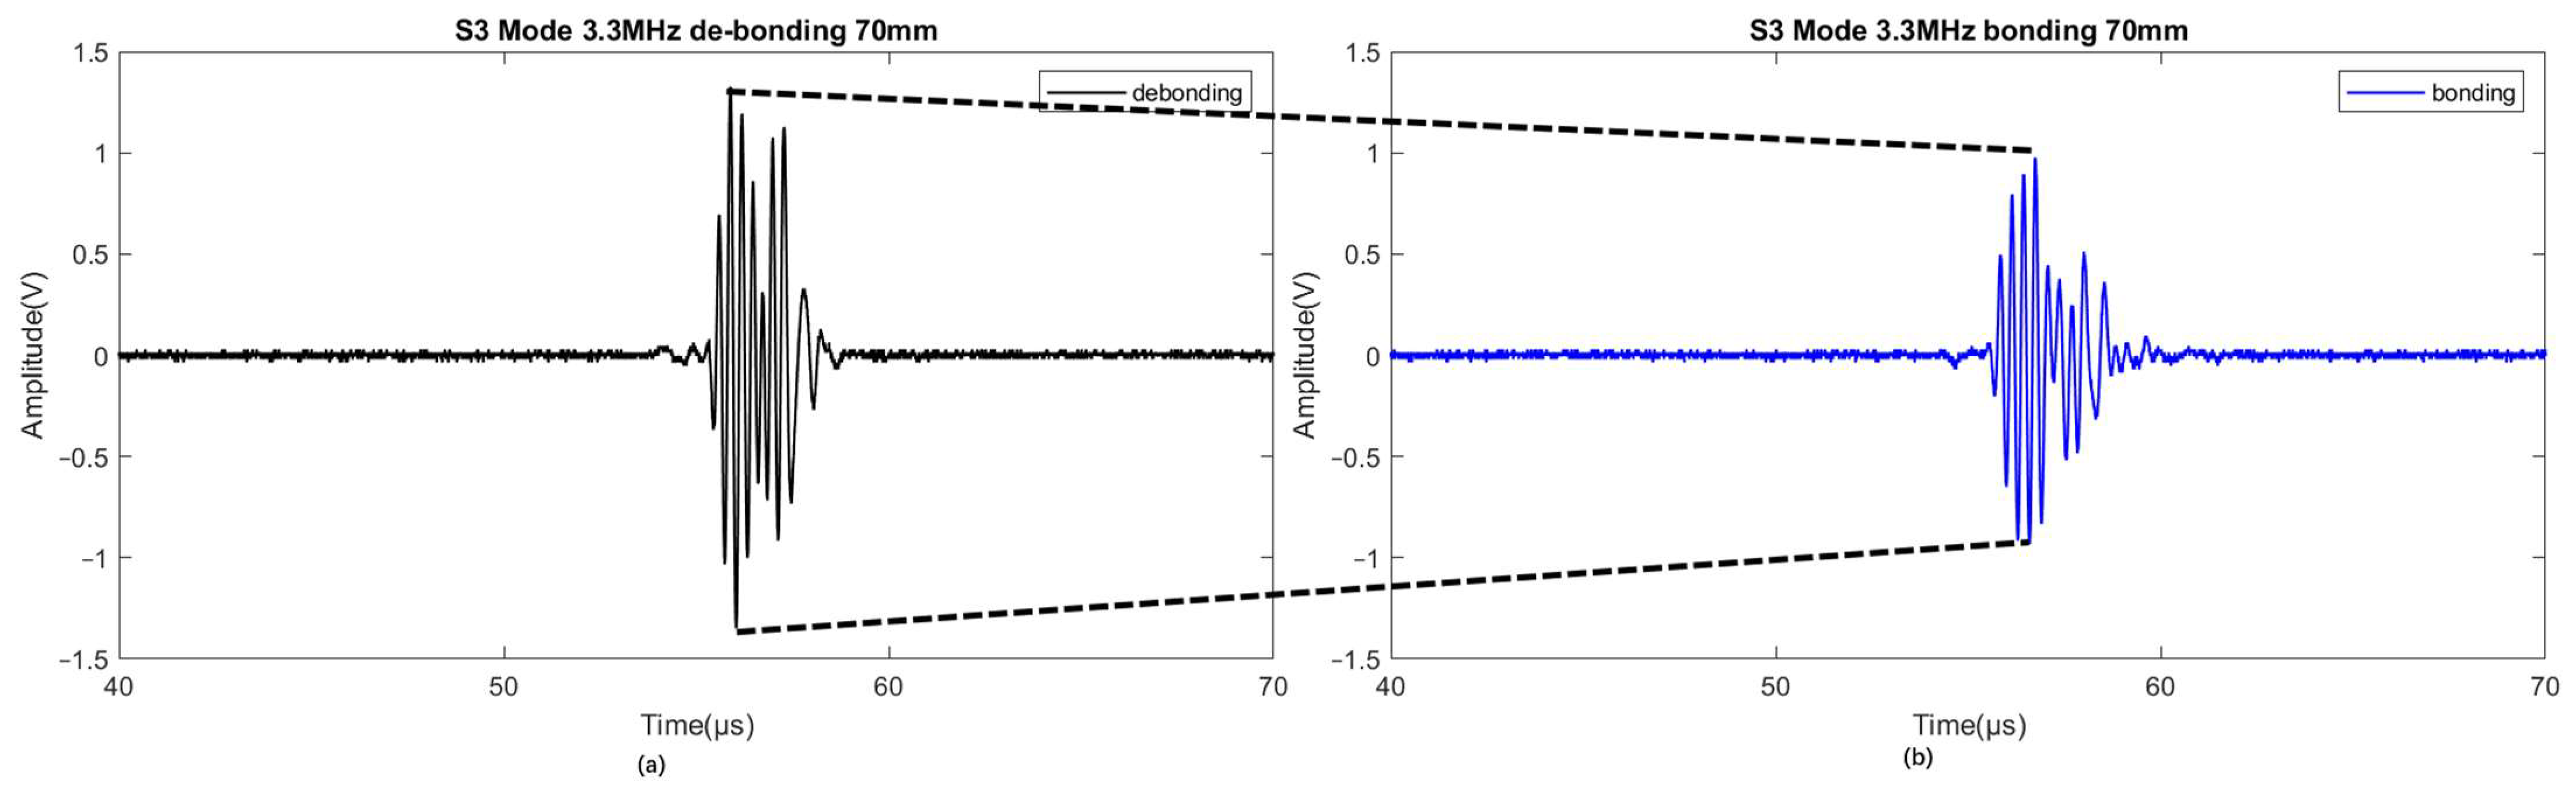
3.2. Wave Propagation of Coating-Debonded Zone Conditions

In order to determine the availability of symmetric wave modes under concrete debonded zone conditions, additional tests were performed on the plates. The propagation velocity calculated from the wave signal under stripping conditions is 1.82   mm / μ s , which is the same wave mode generation conditions achieved using the debonded zone conditions.
Lamb wave signals were successfully collected, representing the difference between bonded zone and debonded zone regions. In Figure 6, (a) is the signals from the debonded zone region, and (b) is the signal from the bonded zone region. It can be clearly seen that the wave signal in the debonded zone condition with the same propagation distance has a larger signal amplitude, and the waveform changes compared to the debonded zone condition.
In the data analysis of the experiment, the differences between waveforms in the time domain were observed. Experiments were repeated 30 times and on different days with the same instrument settings for different specimens. Based on the data, thresholds were set in the time domain (Table 2). Thresholds were established in 30 experiments in both domains using the average and standard deviation of the amplitude data. The average amplitude of the bonded and debonded conditions was calculated, and the standard deviation was determined for each condition.
Based on the average and standard deviation, a range of values was determined to classify the waves as either bonded or debonded. The threshold was set as the average + 1 standard deviation for the bonded condition and the average − 1 standard deviation for the debonded condition.
Waves with an amplitude below the threshold for the bonded condition were classified as bonded, while those with an amplitude above the threshold for the debonded condition were classified as debonded.

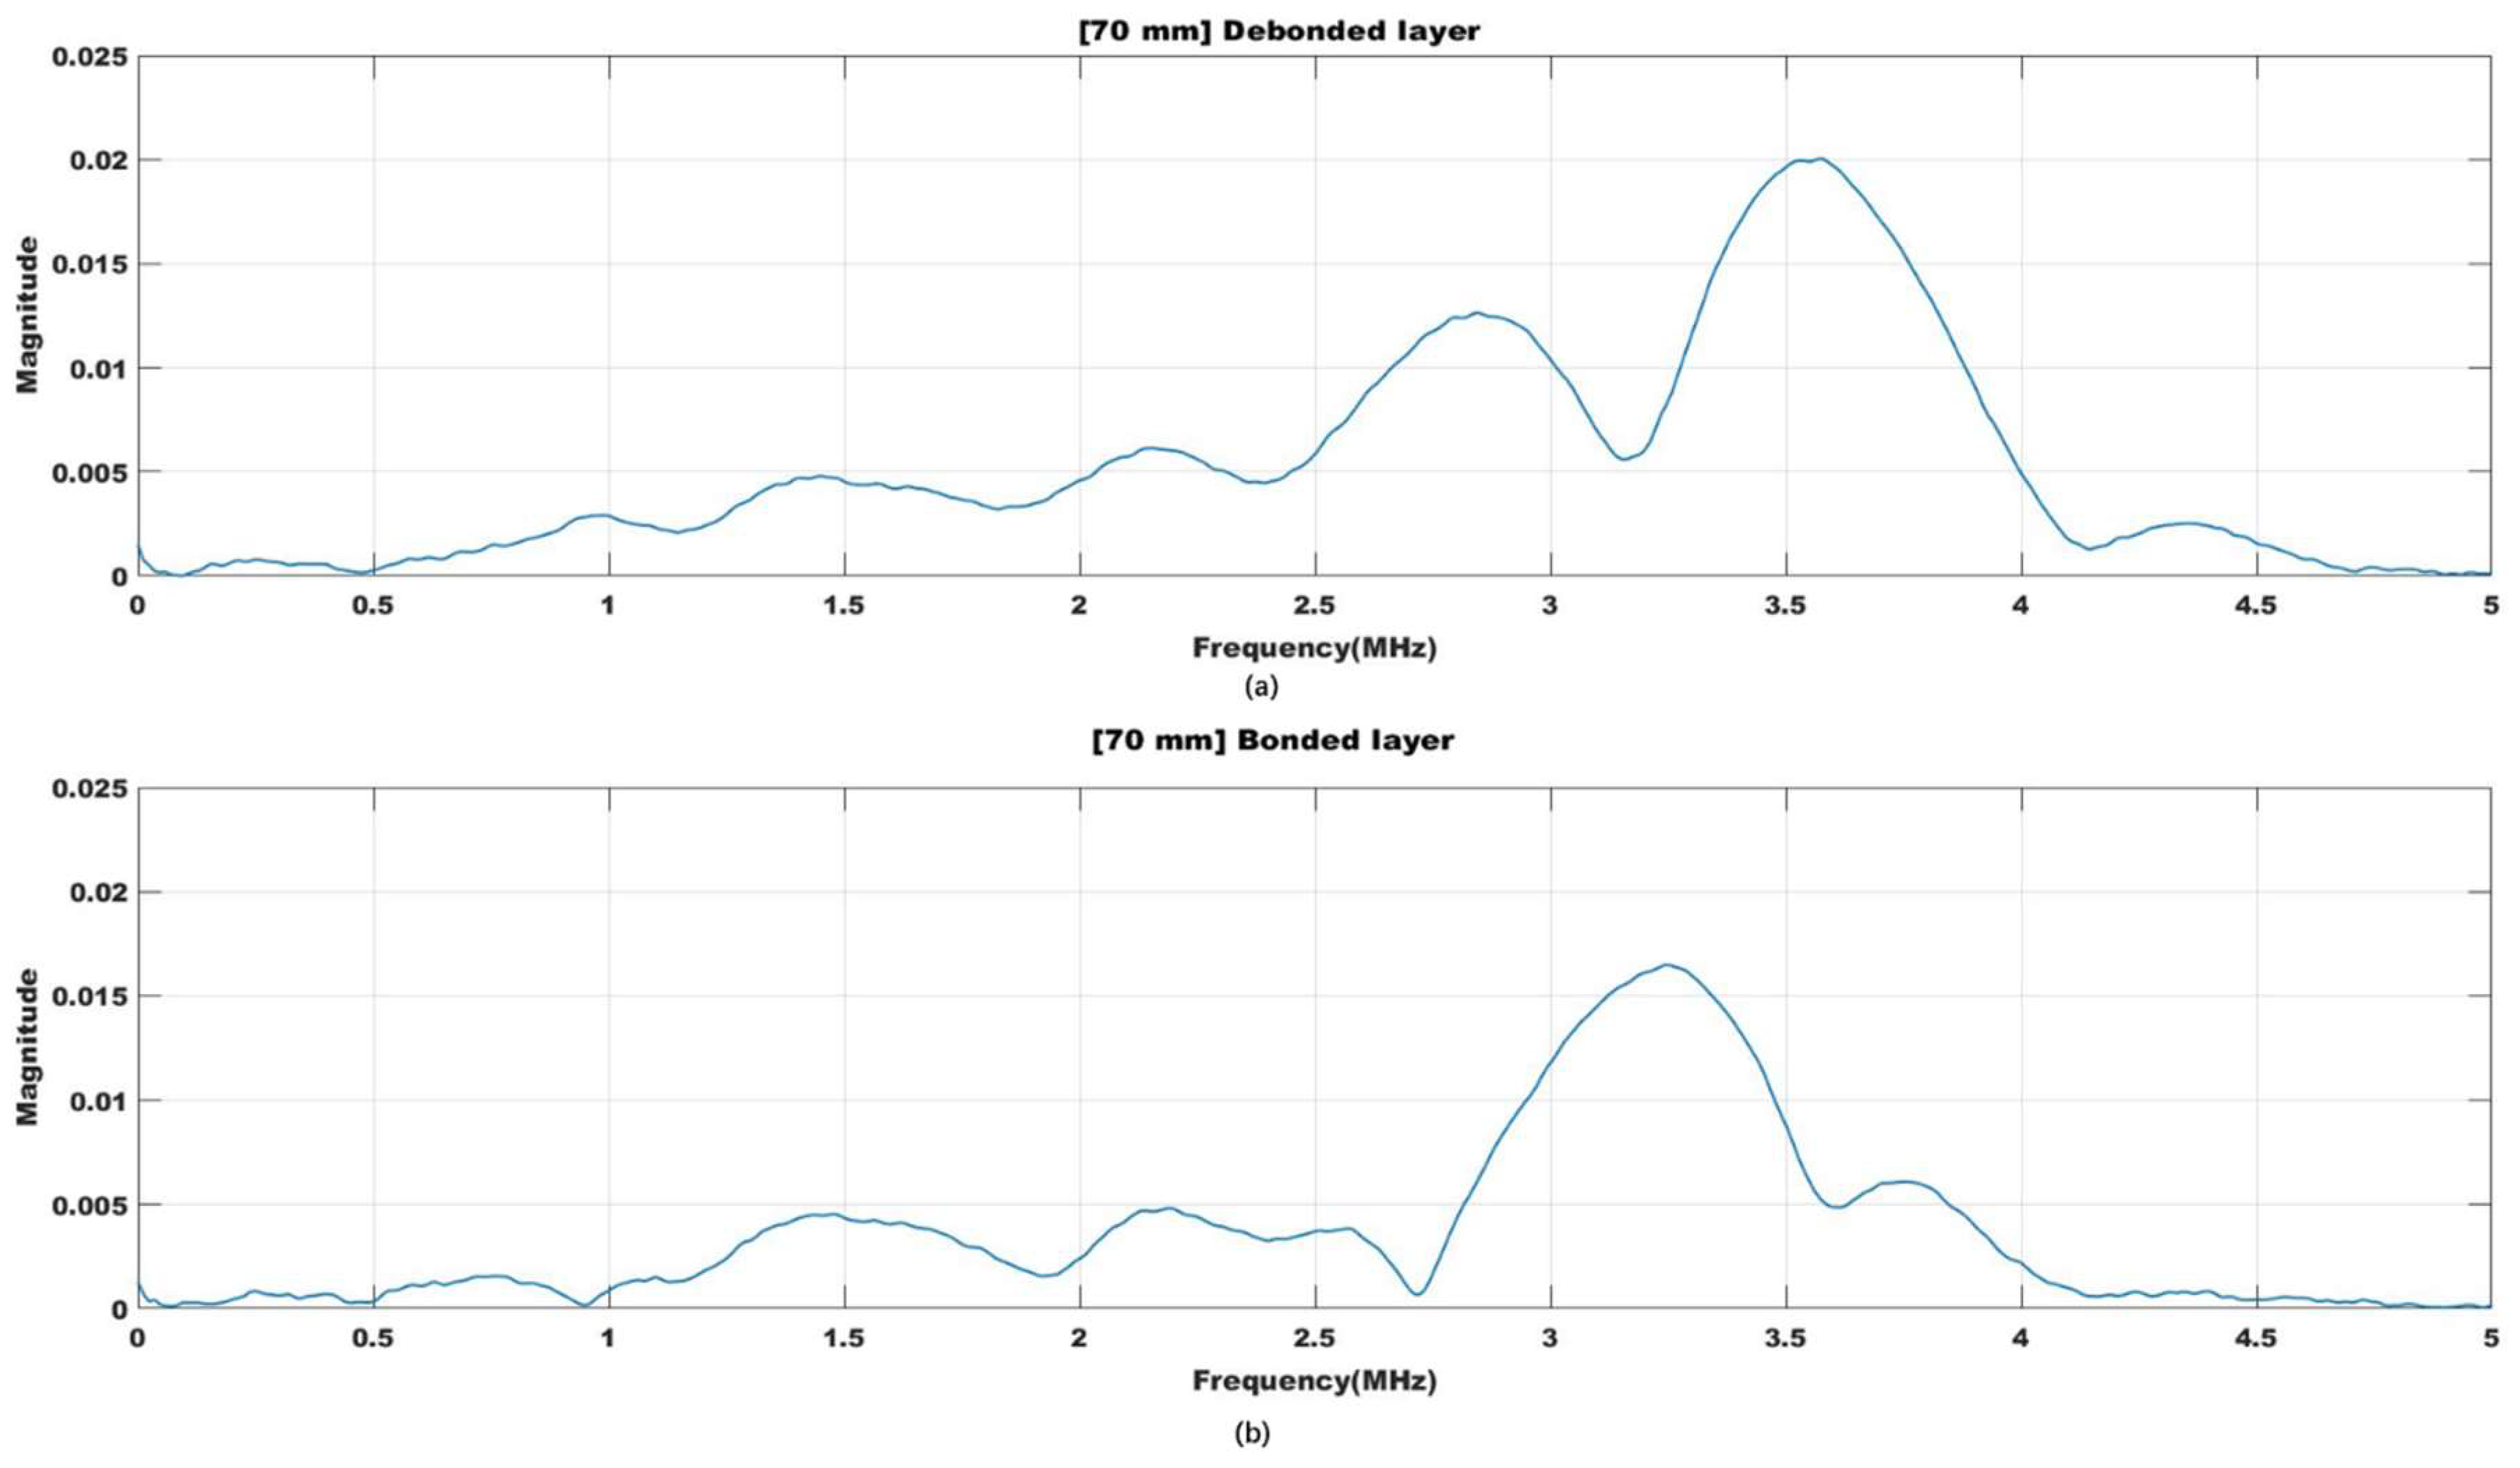
3.3. FFT and Waveform Analysis: Concrete-Bonded Area Ratio

As can be seen from Figure 7 FFT of the Lamb waves from the bonded zone and the debonded zone section are presented. That (a) is the FFT analysis of the signals from the debonded zone region, and (b) is the FFT analysis of the signal from the bonded zone region. As can be seen, the center frequency of the Lamb waves shifts when it is propagated through the laminated section of the coating material. The advantage of the frequency base of analysis of the waveform is that it can be used regardless of the distance between a pulsar receiver. The FFT-based approach allows us to more precisely and quickly determine the bonded zone state of the coating material by the selected mode.
This is due to the fact that in the bonded zone condition, a portion of the Lamb wave energy propagates from the coating into the carbon steel substrate plate, and the recipient only receives a portion of the energy from the coating. In the debonded zone condition, the energy of the wave has a gap between the coating and the carbon steel substrate, and the other medium in the gap will become the boundary of energy propagation, limiting the energy leakage from the coating so the receiver can receive most of the energy from the coating. The magnitude of the final energy will be reflected in the signal amplitude of the magnitude, and the combined state is sufficient to verify the gap quantitatively from the comparison of wave signals.
In addition, analysis of the Lamb waves in the frequency domain allows for determining the delamination of the coating layer. Important parameters such as scattering of the language can be seen in the frequency domain, and in this study, we use the FFT for the frequency analysis of the longwave. The scattering phenomena in the delaminated coating layer cost to shift the center frequency of the received waveform.

4. Conclusions

In this study, a technique for determining whether the coating is bonded in water using the Lamb wave phenomenon was studied. The results from the energy and waveform show clear differences between bonded zone and debonded zone regions, verifying the feasibility of the technique.
However, the study highlights the potential of this measurement method as a non-destructive testing technique in the laboratory setting. However, its current limitations in terms of applicability to real-world marine and deep-sea environments cannot be ignored. This could be an obstacle to wider dissemination, promotion, and practical application of the technology.
Despite these limitations, this method has important implications for the field of non-destructive testing of marine structures, as it provides a non-destructive and reliable method for assessing the debonded zone state of coatings in water. It could be used to monitor coatings applied to marine structures in hard-to-reach areas in the deep sea, reducing time and labor costs, and increasing the service life of marine structures compared to traditional methods.
Future research could focus on combining this technology with visualization technology to allow even those who are not familiar with ultrasound to easily judge the bonded zone state of the coating. Additionally, the integration of artificial intelligence and underwater ultrasonic non-destructive testing techniques can further enhance the accuracy and efficiency of inspection. More advanced deep learning algorithms can be developed to extract more features from the ultrasonic signals obtained. For instance, convolutional neural networks can be used to automatically identify and locate defects in coatings based on the features extracted from the ultrasonic signals [39]. This would greatly improve the precision and speed of the inspection process. In summary, our research has shown that Lamb wave signal analysis is an effective method for evaluating the debonded zone state of a coating in water, with the potential for further development and optimization.

Author Contributions

Conceptualization, J.Z. and Y.C.; methodology, J.Z. and A.K.u.M.; software, J.Z. and A.K.u.M.; validation, J.Z. and J.K.; formal analysis, J.Z. and A.K.u.M.; investigation, Y.H.K.; resources, J.-H.Y.; data curation, J.Z.; writing—original draft preparation, J.Z. and J.K.; writing—review and editing, Y.H.K. and Y.C.; visualization, J.Z.; supervision, Y.C.; project administration, Y.C. and J.-H.Y.; funding acquisition, Y.C. and J.-H.Y. All authors have read and agreed to the published version of the manuscript.

Funding

The authors appreciate being supported by the National Research Foundation of Korea (NRF) grant funded by the Korean government (MSIP) (No. 2020M2D2A1A02069933).

Institutional Review Board Statement

Not applicable.

Informed Consent Statement

Not applicable.

Data Availability Statement

Data are contained within the article.

Conflicts of Interest

The authors declare no conflict of interest.

References

  1. Justnes, H.; Kim, M.O.; Ng, S.; Qian, X. Methodology of calculating required chloride diffusion coefficient for intended service life as function of concrete cover in reinforced marine structures. Cem. Concr. Compos. 2016, 73, 316–323. [Google Scholar] [CrossRef]
  2. Kim, M.O.; Bordelon, A.; Lee, M.K.; Oh, B.H. Cracking and failure of patch repairs in RC members subjected to bar corrosion. Constr. Build. Mater. 2016, 107, 255–263. [Google Scholar] [CrossRef]
  3. Andrade, C. Calculation of chloride diffusion coefficients in concrete from ionic migration measurements. Cem. Concr. Res. 1993, 23, 724–742. [Google Scholar] [CrossRef]
  4. Kim, M.O.; Qian, X.; Lee, M.K.; Park, W.S.; Jeong, S.T.; Oh, N.S. Determination of structural lightweight concrete mix proportion for floating concrete structures. J. Korean Soc. Coast. Ocean Eng. 2017, 29, 315–325. [Google Scholar] [CrossRef]
  5. Basheer, L.; Cleland, D.; Long, A. Protection provided by surface treatments against chloride induced corrosion. Mater. Struct. 1998, 31, 459–464. [Google Scholar] [CrossRef]
  6. Christodoulou, C.; Goodier, C.I.; Austin, S.A.; Webb, J.; Glass, G.K. Long-term performance of surface impregnation of reinforced concrete structures with silane. Constr. Build. Mater. 2013, 48, 708–716. [Google Scholar] [CrossRef] [Green Version]
  7. Hammer, P.; dos Santos, F.C.; Cerrutti, B.M.; Pulcinelli, S.H.; Santilli, C.V. Carbon nanotube-reinforced siloxane-PMMA hybrid coatings with high corrosion resistance. Prog. Org. Coat. 2013, 76, 601–608. [Google Scholar] [CrossRef]
  8. Won, B.; Kim, M.O.; Park, S.; Yi, J. Effects of water exposure on the interfacial bond between an epoxy resin coating and a concrete substrate. Materials 2019, 12, 3715. [Google Scholar] [CrossRef] [PubMed] [Green Version]
  9. Kim, S.; Hong, H.; Han, T.H.; Kim, M.O. Early-age tensile bond characteristics of epoxy coatings for underwater applications. Coatings 2019, 9, 757. [Google Scholar] [CrossRef] [Green Version]
  10. Abbas, M.; Shafiee, M. An overview of maintenance management strategies for corroded steel structures in extreme marine environments. Mar. Struct. 2020, 71, 102718. [Google Scholar] [CrossRef]
  11. Zhao, Z.; Tang, J.; Tariq, N.H.; Wang, J.; Cui, X.; Xiong, T. Microstructure and corrosion behavior of cold-sprayed Zn-Al composite coating. Coatings 2020, 10, 931. [Google Scholar] [CrossRef]
  12. Ibrahim, M.; Kannan, K.; Parangusan, H.; Eldeib, S.; Shehata, O.; Ismail, M.; Zarandah, R.; Sadasivuni, K.K. Enhanced corrosion protection of epoxy/ZnO-NiO nanocomposite coatings on steel. Coatings 2020, 10, 783. [Google Scholar] [CrossRef]
  13. Singh, A.A.M.M.; Franco, P.A.; Binoj, J.S. Enhancement of corrosion resistance on plasma spray coated mild steel substrate exposed to marine environment. Mater. Today Proc. 2019, 15, 84–89. [Google Scholar] [CrossRef]
  14. Sambyal, P.; Ruhi, G.; Dhawan, S.K.; Bisht, B.M.S.; Gairola, S.P. Enhanced anticorrosive properties of tailored poly(aniline-anisidine)/chitosan/SiO2 composite for protection of mild steel in aggressive marine conditions. Prog. Org. Coat. 2018, 119, 203–213. [Google Scholar] [CrossRef]
  15. BBC. Available online: http://news.bbc.co.uk/onthisday/hi/dates/stories/march/27/newsid_2531000/2531091.stm (accessed on 6 December 2021).
  16. Britannica. Available online: https://www.britannica.com/event/Deepwater-Horizon-oil-spill (accessed on 7 December 2021).
  17. Global Wind Energy Council, Global offshore Wind Report 2020. Available online: https://www.rivieramm.com/news-content-hub/news-content-hub/offshore-wind-to-surge-to-more-than-234-gw-by-2030-60496 (accessed on 2 October 2020).
  18. Stehly, T.; Beiter, P. 2018 Cost of Wind Energy Review; Technical Report; NREL: Golden, CO, USA, 2019.
  19. Chmielewski, T.; Chmielewski, M.; Piątkowska, A.; Grabias, A.; Skowrońska, B.; Siwek, P. Phase structure evolution of the Fe-Al arc-sprayed coating stimulated by annealing. Materials 2021, 14, 3210. [Google Scholar] [CrossRef] [PubMed]
  20. Chmielewski, T.; Siwek, P.; Chmielewski, M.; Piątkowska, A.; Grabias, A.; Golański, D. Structure and selected properties of arc sprayed coatings containing in-situ fabricated Fe-Al intermetallic phases. Metals 2018, 8, 1059. [Google Scholar] [CrossRef] [Green Version]
  21. Bochenek, K.; Węglewski, W.; Strojny-Nędza, A.; Pietrzak, K.; Chmielewski, T.; Chmielewski, M.; Basista, M. Microstructure, mechanical, and wear properties of NiCr-Re-Al2O3 coatings deposited by HVOF, atmospheric plasma spraying, and laser cladding. J Therm. Spray Technol. 2022, 31, 1609–1633. [Google Scholar] [CrossRef]
  22. He, X.; Song, R.; Kong, D. Microstructure and corrosion behaviour of laser-cladding Al-Ni-TiC-CeO2 composite coatings on S355 offshore steel. J. Alloys Compd. 2019, 770, 771–783. [Google Scholar] [CrossRef]
  23. He, X.; Song, R.; Kong, D. Microstructure and corrosion behaviours of composite coatings on S355 offshore steel prepared by laser cladding combined with micro-arc oxidation. Appl. Surf. Sci. 2019, 497, 143703. [Google Scholar] [CrossRef]
  24. Bugnot, A.B.; Mayer-Pinto, M.; Airoldi, L.; Heery, E.C.; Johnston, E.L.; Critchley, L.P.; Strain, E.M.A.; Morris, R.L.; Loke, L.H.L.; Bishop, M.J.; et al. Current and projected global extent of marine built structures. Nat. Sustain. 2020, 4, 33–41. [Google Scholar] [CrossRef]
  25. Miller, D.L.; Smith, N.B.; Bailey, M.R.; Czarnota, G.J.; Hynynen, K. Makin IR Bioeffects Committee of the American Institute of Ultrasound in Medicine. Overview of therapeutic ultrasound applications and safety considerations. J. Ultrasound Med. 2012, 31, 623–634. [Google Scholar] [CrossRef] [PubMed] [Green Version]
  26. Liao, J.; Yang, H.; Yu, J.; Liang, X.; Chen, Z. Progress in the application of ultrasound elastography for brain diseases. J. Ultrasound 2020, 39, 2093–2104. [Google Scholar] [CrossRef] [PubMed]
  27. Schmalzl, J.; Fenwick, A.; Boehm, D.; Gilbert, F. The application of ultrasound elastography in the shoulder. J. Shoulder Elb. Surg. 2017, 26, 2236–2246. [Google Scholar] [CrossRef] [PubMed]
  28. Malikov, A.K.u.; Cho, Y.; Kim, Y.H.; Kim, J.; Park, J.; Yi, J.-H. Ultrasonic assessment of thickness and bonded zone quality of coating layer based on short-time fourier transform and convolutional neural networks. Coatings 2021, 11, 909. [Google Scholar] [CrossRef]
  29. Zhang, J.; Cho, Y.; Kim, J.; Malikov, A.K.u.; Kim, Y.H.; Yi, J.-H.; Li, W. Non-destructive evaluation of coating thickness using water immersion ultrasonic testing. Coatings 2021, 11, 1421. [Google Scholar] [CrossRef]
  30. Malikov, A.K.; Kim, Y.H.; Yi, J.-H.; Kim, J.; Zhang, J.; Cho, Y. Neural-network-based ultrasonic inspection of offshore coated concrete specimens. Coatings 2022, 12, 773. [Google Scholar] [CrossRef]
  31. Cho, Y. Model-based guided wave NDE: The evolution of guided wave NDE from “Magic” to “Physically based engineering tool”. J. Nondestruct. Eval. 2012, 31, 324–338. [Google Scholar] [CrossRef]
  32. Gao, T.; Liu, X.; Zhu, J.; Zhao, B.; Qing, X. Multi-frequency localized wave energy for delamination identification using laser ultrasonic guided wave. Ultrasonics 2021, 116, 106486. [Google Scholar] [CrossRef]
  33. Hervin, F.; Fromme, P. Guided wave propagation and scattering at composite delaminations. In Health Monitoring of Structural and Biological Systems XV; Proc. SPIE: Bellingham, WA, USA, 2021; Volume 115930. [Google Scholar]
  34. Murat, B.I.S.; Fromme, P. Finite element modeling of guided wave scattering at delaminations in composite panels. In Health Monitoring of Structural and Biological Systems; Proc. SPIE: Bellingham, WA, USA, 2016; Volume 98050S. [Google Scholar]
  35. Olisa, S.C.; Khan, M.A.; Starr, A. Review of current guided wave ultrasonic testing (GWUT) limitations and future directions. Coatings 2021, 21, 811. [Google Scholar] [CrossRef]
  36. Liu, X.-F.; Fan, Y.-H.; Chen, X.-F. Research on the cross of the dispersion curves of Rayleigh waves and multi-modes coupling phenomenon. Chin. J. Geophys. 2009, 52, 994–1002. [Google Scholar] [CrossRef]
  37. José, M.; Abascal, R. Lamb mode conversion at edges. A hybrid boundary element-finite-element solution. J. Acoust. Soc. Am. 2005, 177, 1777. [Google Scholar]
  38. Song, X.; Moilanen, P.; Zhao, Z.; Ta, D.; Pirhonen, J.; Salmi, A.; Hæeggström, E.; Myllylä, R.; Timonen, J.; Wang, W. Coded excitation speeds up the detection of the fundamental flexural guided wave in coated tubes. AIP Adv. 2016, 6, 095001. [Google Scholar] [CrossRef] [Green Version]
  39. Malikov, A.K.U.; Cho, Y.; Kim, Y.H.; Kim, J.; Kim, H.-K. A novel ultrasonic inspection method of the heat exchangers based on circumferential waves and deep neural networks. Sci. Progress 2023, 106, 00368504221146081. [Google Scholar] [CrossRef] [PubMed]
Figure 1. Dispersion curve for coatings specimen. (a) Dispersion curve for phase velocity; (b) dispersion curve for group velocity.
Coatings 13 00728 g001
Figure 2. Photographs of specimen coated on the SS400 steel. (a) Top view and (b) cross-section. The left side is bonded zone, and the right side is debonded zone.
Coatings 13 00728 g002
Figure 3. Experimental setup: ① Computer; ② Lecroy oscilloscope; ③ Pulser receiver; ④ Water tank; ⑤ Piezo electric immersion transducer; ⑥ Specimen; and ⑦ Transducer holder.
Coatings 13 00728 g003
Figure 4. Guided Wave Generation Experiments in Water: (a) top view; (b) front view.
Coatings 13 00728 g004
Figure 5. Amplitudes with respect to propagation distance on bonded zone area.
Coatings 13 00728 g005
Figure 6. Comparison of the amplitudes of the bonded zone and debonded zone areas for the same propagation distance.
Coatings 13 00728 g006
Figure 7. Comparison of the FFT of the bonded zone and debonded zone areas for the same propagation distance.
Coatings 13 00728 g007
Table 1. Information/Material Properties of the coating materials.
ProductAlocit 28.14
manufacturerAlocit Systems
Density 1.7   g / m 3
Longitudinal wave velocity 2.39   mm / μ s
Transverse wave velocity 1.35   mm / μ s
Poisson’s Ratio0.35
Young’s Modulus 6.15   GPa
Thickness 1   mm
Mixing weight ratio
(Alocit 28.14:hardener)
5.1:1
Table 2. Data analysis of the experiment.
Bonded ZoneDebonded Zone
AmplitudeAverageStd Dev.ThresholdAverageStd Dev.Threshold
Value e 0.18   V 0.98   V 1.46   V 0.32   V 1.15   V
Percentage 42.1 % 9.7 % 51.8 % 77.29 % 16.7 % 60.58 %
Disclaimer/Publisher’s Note: The statements, opinions and data contained in all publications are solely those of the individual author(s) and contributor(s) and not of MDPI and/or the editor(s). MDPI and/or the editor(s) disclaim responsibility for any injury to people or property resulting from any ideas, methods, instructions or products referred to in the content.

