Article

Model Development of Stress Intensity Factor on 7057T6 Aluminum Alloy Using Extended Finite Element Method

1
School of Engineering, Lishui University, Lishui 323000, China
2
State Key Laboratory of Fluid Power and Mechatronic Systems, Zhejiang University, Hangzhou 310027, China
3
Zhejiang Guanlin Machinery Inc., Anji 313300, China
4
College of Mechanical Engineering, Zhejiang University of Technology, Hangzhou 310014, China
5
Key Laboratory of Special Purpose Equipment and Advanced Processing Technology at Zhejiang University of Technology, Ministry of Education, Hangzhou 310014, China
*
Author to whom correspondence should be addressed.
Coatings 2023, 13(3), 581; https://doi.org/10.3390/coatings13030581
Submission received: 17 January 2023 / Revised: 17 February 2023 / Accepted: 27 February 2023 / Published: 7 March 2023
(This article belongs to the Special Issue Investigations and Applications in Advanced Materials Processing)

Abstract

:
The stress intensity factor represents a vital parameter within the realm of linear elastic fracture mechanics. It acts as the cornerstone in determining crack propagation and evaluating damage tolerance. However, calculating this factor is a complex task. To surmount this challenge, models of the stress intensity factor for both edge and center cracks were developed using the extended finite element method. The result of this effort is the ability to calculate the stress intensity factor at the crack tip under different loads and normalized crack lengths. The accuracy of these calculations was confirmed by comparing them to results from the NASGRO method, and the optimal mesh sizes for both the crack elements and overall units were established. Further analysis, conducted through MATLAB’s regression analysis, led to the development of an empirical model. This model was found to be both simple and reliable, making it an ideal tool for engineering applications.

Graphical Abstract

1. Introduction

For the industrial purpose, the quality of the essential parts in related equipment is increasingly needed to be improved [1,2,3,4,5], and with the advancements in information technology, advanced manufacturing engineering, and the new energy industry, enhancing the stability and performance of core parts has become increasingly crucial [6,7,8,9]. The distribution of stress and resulting fractures on the surface and subsurface of these parts can greatly impact their lifespan [10,11,12,13]. The conventional crack analysis techniques such as linear elastic fracture mechanics and finite element analysis have long been used, but they suffer from limitations such as inability to accurately capture microscale crack propagation and assumptions of small deformations and linear elasticity [14]. The peridynamic-based method presents an alternative, a nonlocal, particle-based approach that accurately depicts crack behavior at the microscale by considering material behavior as interactions between individual material points rather than continuous body deformation [15,16]. This method has proven successful in simulating crack propagation in both brittle and ductile materials and analyzing extreme loading failure behavior in structures [17,18].
The stress intensity factor, a central component in linear elastic fracture mechanics, has been a challenging problem to solve [19]. This difficulty arises from the singular stress at the crack tip of linear elastic materials, which becomes increasingly intense as the distance to the tip decreases and ultimately leads to nonconvergence in calculation results [20]. Efforts to address this challenge have yielded several methods, with the extended finite element method (XFEM) proposed by Belytschko and Black in 1999 being widely used [21]. This is due to its ability to handle cracks originating from force concentration or geometry discontinuity and its ability to capture the large stress concentrations that occur around crack tips, leading to crack propagation. In contrast, prior to the widespread use of XFEM, the finite element method (FEM) was used to address structural engineering problems; however, it faced significant difficulties in addressing discontinuities or singularities around crack tips [22]. Challenges with FEM included the requirement of mesh regeneration to align with crack boundaries, which led to stress concentration, and the need for mesh refinement, both of which negatively impacted prediction accuracy and computational efficiency. To address these issues, Belytschko and Black introduced the XFEM, a novel method based on the research of Melenk and Babuska [23], which significantly reduces the need for mesh refinement. Today, XFEM is a popular tool for studying crack propagation under varying loading and environmental conditions, and its success is attributed to its formulation based on the conventional FEM partition of unity theorem. The XFEM method is powerful in numerical modeling as it enriches conventional FEM mesh by incorporating special shape functions to account for displacement and discontinuity.
XFEM was considered well suited for crack propagation and was implemented in commercial software, such as ABAQUS and ANSYS [24,25]. Researchers have demonstrated the accuracy and efficiency of the XFEM method through various applications and improvements. Yu [26] used ABAQUS software to carry out the calculation of the XFEM method and deduced the governing equation of the cohesive crack model, which greatly simplified the calculation process of the stress intensity factor. The utilization of XFEM in the simulation of crack propagation and its impact on the behavior of Zircaloy-4 was undertaken by Suman et al. [27,28]. Through a comprehensive 3D analysis, they aimed to understand the effect of hydride precipitate on crack propagation in Zircaloy-4. Their study concluded that in the absence of hydride, cracks remained stable, yet when hydride was considered at the crack tip, the crack propagated under the same applied load. Although their work delved into the influence of hydride on cracking, it lacked the crucial component of quantitatively analyzing the relationship between the threshold stress intensity factor and the critical hydride length. Kumar et al. [29] presented a unique application of XFEM by conceptualizing homogenized and virtual node frameworks to accurately depict the progression of fatigue cracks and kinked cracks, respectively. Their pioneering approach involved the integration of nonuniform meshes and the establishment of transitional elements, either six-node or five-node, to preserve continuity in the displacement fields, thereby elevating the predictive accuracy of crack growth simulations.
However, these above research results either belong to the category of methodology, or are designed for a specific object and include excessive dependence on computer and numerical analysis technology, which have great limitations, and hence, the engineering application is very difficult. Despite these advancements, the XFEM method remains heavily reliant on computer and numerical analysis technology, making its engineering application difficult. On the other hand, the Forman/Mettu (NASGRO) calculation method used by major airlines such as Boeing and Airbus is simple and feasible, but limited details are available due to technical confidentiality [30,31].
Thus, in this paper the stress intensity factor analysis of the crack tip and central symmetric crack will be first carried out using the XFEM platform ABAQUS, and then the numerical results will be compared with the NASGRO theoretical calculation results. Finally, the empirical model will be developed according to the regression analysis, and this study will develop a convenient and reliable stress intensity factor calculation model suitable for engineering applications and providing support for the damage tolerance design of structures.

2. Principle of Extended Finite Element Method

The XFEM method, birthed from unit decomposition theory, is a computational technique that incorporates discontinuous shape functions to tackle fracture element discontinuity in fracture processes. In the context of crack propagation calculation, the XFEM method first calculates the stress field close to the crack tip through the crack tip’s displacement field; then, leveraging J-integral theory, it determines the crack tip’s stress intensity factor based on the calculated stress field results [32]. Typically, the standard XFEM displacement approximation calculation function can be expressed as follows:
u ξ , η , ζ = i n N i ξ , η , ζ U i + i n c N i ξ , η , ζ H ξ , η , ζ b i + i n p N i ξ , η , ζ i B j r , θ c j i
The displacement field function group of the XFEM method is composed of three terms. The first term on the right side of Equation (1) is the description function of the displacement field in the traditional finite element method, while the second term on the right side describes the discontinuous displacement property at the completely cut opening of the crack in the component. The third term is used to characterize the singularity of the crack tip position. In Equation (1), N i ( ξ , η , ζ ) is the shape function corresponding to the node serial number i, and U i represents the corresponding node displacement. n c denotes the set of element nodes completely cut by the crack, and n p denotes the set of nodes that are cut by the crack but not completely cut (only partially cut). b i is the additional degree of freedom coefficient on the node, which is closely related to the jump function. c j i represents the additional degree of freedom coefficient of the node related to the asymptotic displacement field at the crack tip.
The jump function H is defined as:
H ( ξ , η , ζ ) = + 1 : φ ( ξ , η , ζ ) > 0 1 : φ ( ξ , η , ζ ) < 0
The Bj crack tip displacement field function is expressed as:
B j ( r , θ ) = r sin ( θ 2 ) , r cos ( θ 2 ) , r sin ( θ 2 ) sin θ , r cos ( θ 2 ) sin θ
r, θ is a polar coordinate system parameter, and the coordinate origin is at the crack tip, where the expression is as follows:
r = φ 2 ( ξ , η , ζ ) + ψ 2 ( ξ , η , ζ )
θ = arctan φ ( ξ , η , ζ ) ψ ( ξ , η , ζ )
In the XFEM, the level set of ϕ = φ , ψ is obtained by interpolation of shape function that is expressed as:
ϕ ( ξ , η , ζ ) = i N i ( ξ , η , ζ ) Φ i
where Φ i is the discrete value of nodes in the region.
With its roots in FEM, the XFEM takes this legacy and elevates it by incorporating a jump function and an asymptotic displacement field function to succinctly capture the intricacies of crack surfaces [33]. The method then leverages an enrichment function to address the discontinuity of the displacement field in the vicinity of the crack tip, thereby eliminating the need for remeshing even as the crack progresses. This ability to traverse any element with ease highlights the superiority of the XFEM method [34].
The proliferation of the XFEM method along with its associated software and computer technology have led to the emergence of various large-scale commercial programs, propelling the method to the forefront of technical advancement. Standing tall among these offerings is the ABAQUS software, a paragon of computational might and dependable simulation analysis. Its widespread use across various industries such as machinery, aviation, civil engineering, and metallurgy is testament to its prowess. The software boasts precision in defining crack surfaces and crack propagation criteria, with a remarkable level of accuracy in determining stress intensity factors at crack tips [35]. This study leverages ABAQUS software to compute stress intensity factors. The engineering realm commonly encounters two types of cracks, unilateral edge crack and central symmetric crack, both of which require thorough examination of the stress intensity factor calculation model to enhance the durability of structural components.

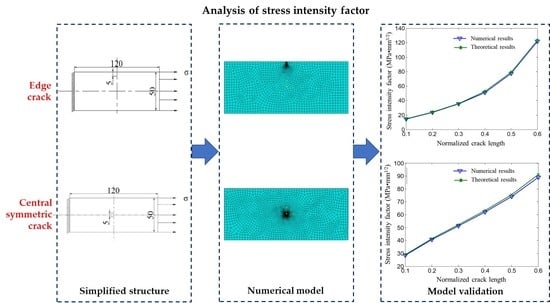
3. Prediction Model of Edge Crack Stress Intensity Factor

The proliferation of unilateral edge cracks in aircraft structures is a ubiquitous phenomenon, precipitated by various stress concentrators such as scratches and the like. As time marches on and the load cycles accumulate, these cracks tend to proliferate and grow, severely impairing the structural integrity and ultimate strength of the component.

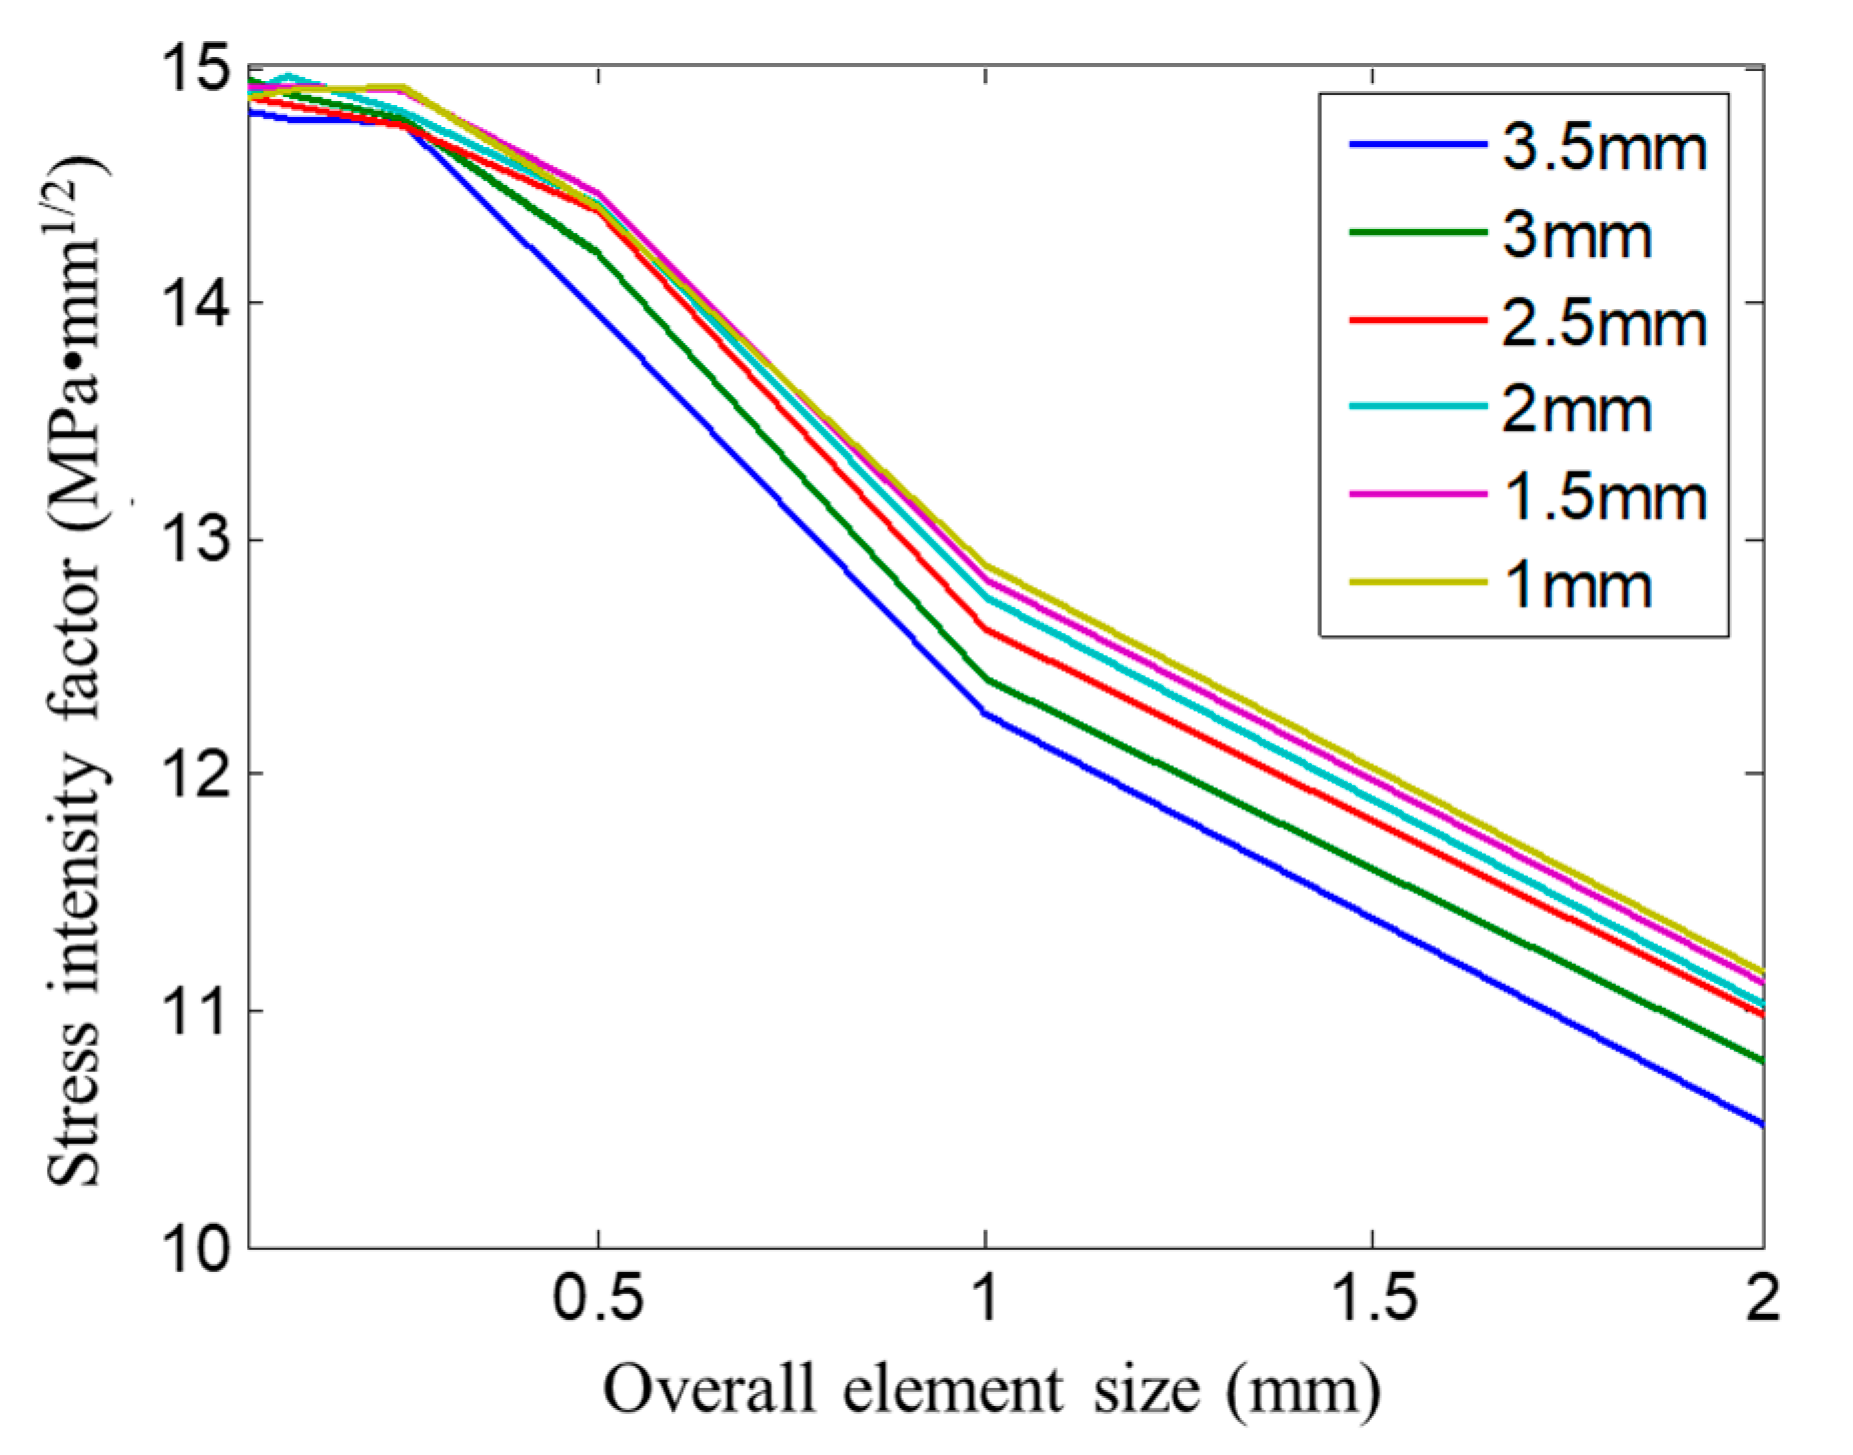
3.1. Development of Numerical Model for Crack Calculation

Numerical simulation has been extensively used in addressing the engineering issues [36], and amidst the intrinsic intricacies of aircraft structures, the prevalence of unilateral edge cracks has been a recurring phenomenon, primarily caused by the stress concentration, scratches, and other compounding factors. These cracks gradually expand over time with the increasing load cycles, rendering a decrease in the component’s bearing capacity, eventually leading to its downfall. The edge crack model is depicted in Figure 1a, where a thin-walled plate of 120 mm in length L, 50 mm in width W, and 2 mm in thickness h exhibits an initial crack of 2a, prefabricated at the center of the long side. The crack’s length direction aligns with the component’s width direction, subject to a fixed constraint at one end and a 100 MPa tensile stress at the other. The numerical model, as displayed in Figure 1b, was developed using eight-node hexahedral element meshing and encrypted near the crack tip (integral region). The plate material, 7057T6 high strength aluminum alloy from Southwest Aluminum, was used, with its major properties given in Table 1.

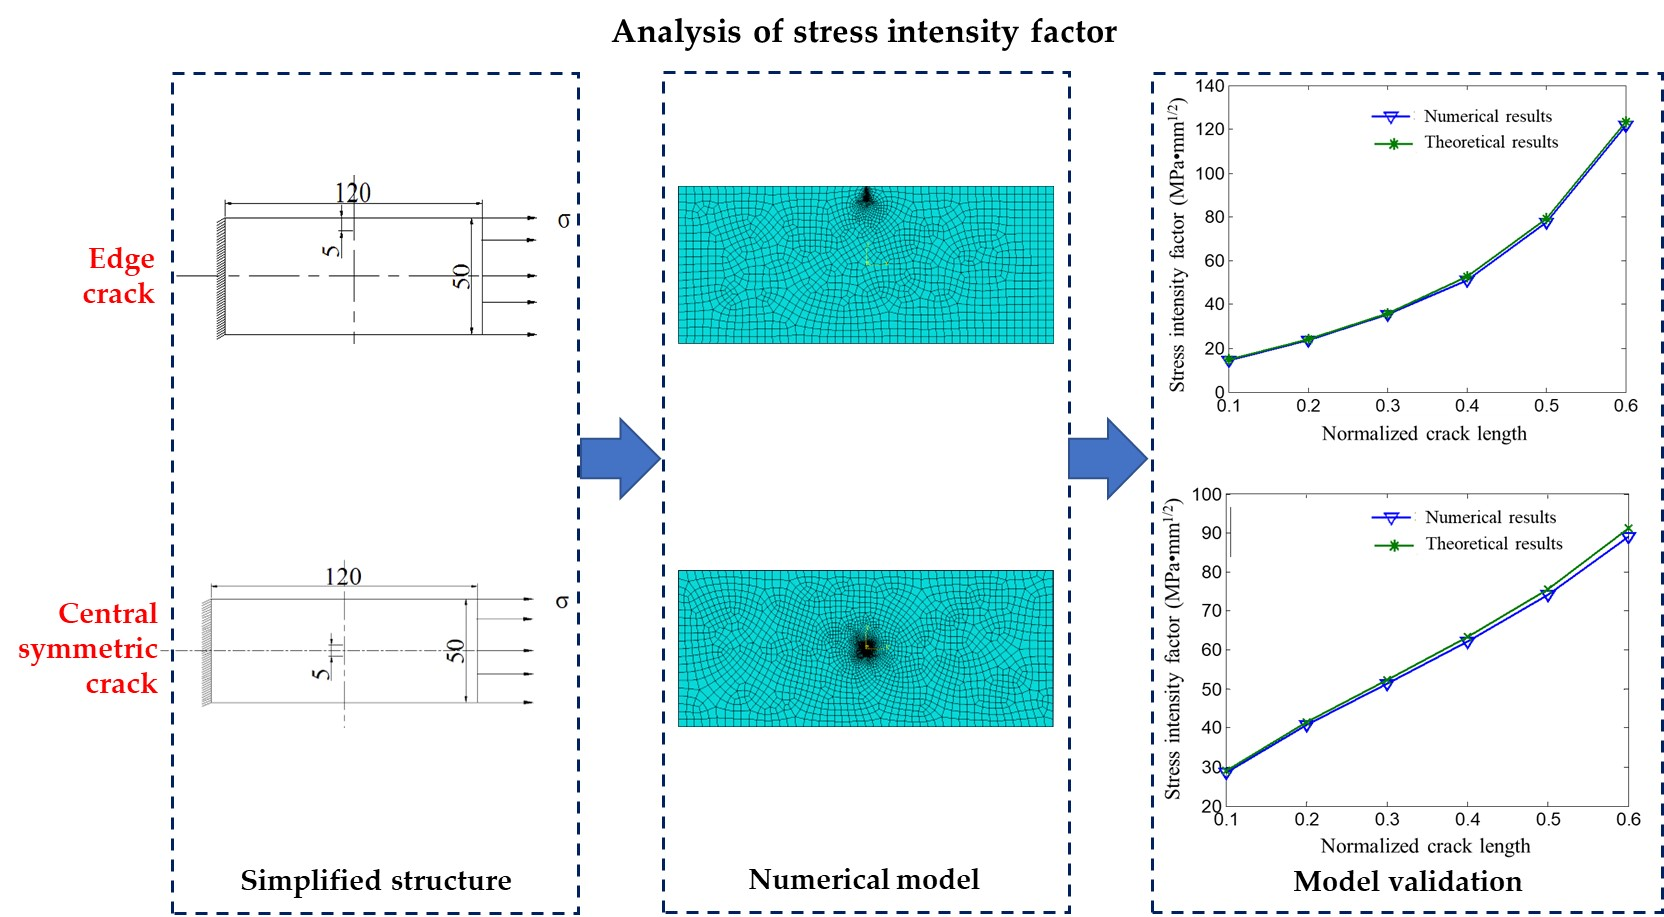
3.2. Effect of Crack Tip Mesh Size and Overall Element Size on Stress Intensity Factor

This section delves into the impact of mesh size in the vicinity of the crack tip and the extent of the integral region on the computation of the stress intensity factor. The objective was to determine the optimal mesh size at the crack tip and the optimal unit size to obtain the most accurate stress intensity factor calculation results for unilateral edge cracks under optimal finite element analysis conditions.
The overall element size was set to six levels of 3.5 mm, 3 mm, 2.5 mm, 2 mm, 1.5 mm, and 1 mm, respectively, and the crack tip mesh sizes of 2 mm, 1 mm, 0.5 mm, 0.25 mm, 0.1 mm, and 0.0 5 mm were considered, so that 36 calculations were carried out to study the effect of the overall mesh size and crack tip mesh size on the crack stress intensity factor. In order to facilitate the comparison to determine the correct results, the stress intensity factor value of the NASGRO model, which is widely adopted by large airlines such as Boeing and Airbus, K N S = 14 . 83 Mpa m 0.5 , was selected as the standard value for reference and comparison. The calculation results of ABAQUS are shown in Figure 2 and Figure 3, respectively.
The conclusion drawn from the examination of Figure 2 and Figure 3 indicates that the mesh size at the crack tip has a much greater impact on the stress intensity factor as compared to the overall element size. In fact, the impact of the mesh size at the crack tip dominates the stress intensity factor, while the impact of the overall element size is only about 5.7%. The significance of the overall element size is reduced by the independence of the J-integral on the path and also due to the already small size of the overall element. When the overall element size is as low as 2 mm, its impact on the stress intensity can be considered negligible. However, the influence of the mesh size near the crack tip decreases as the mesh size decreases, and when the mesh size reaches 0.25 mm, the impact can be disregarded. In the given example, the maximum impact difference is approximately 29.4%. To obtain results closest to NASGRO, the optimal mesh size was found to be 2 mm for the overall element size and 0.25 mm for the crack tip mesh size.

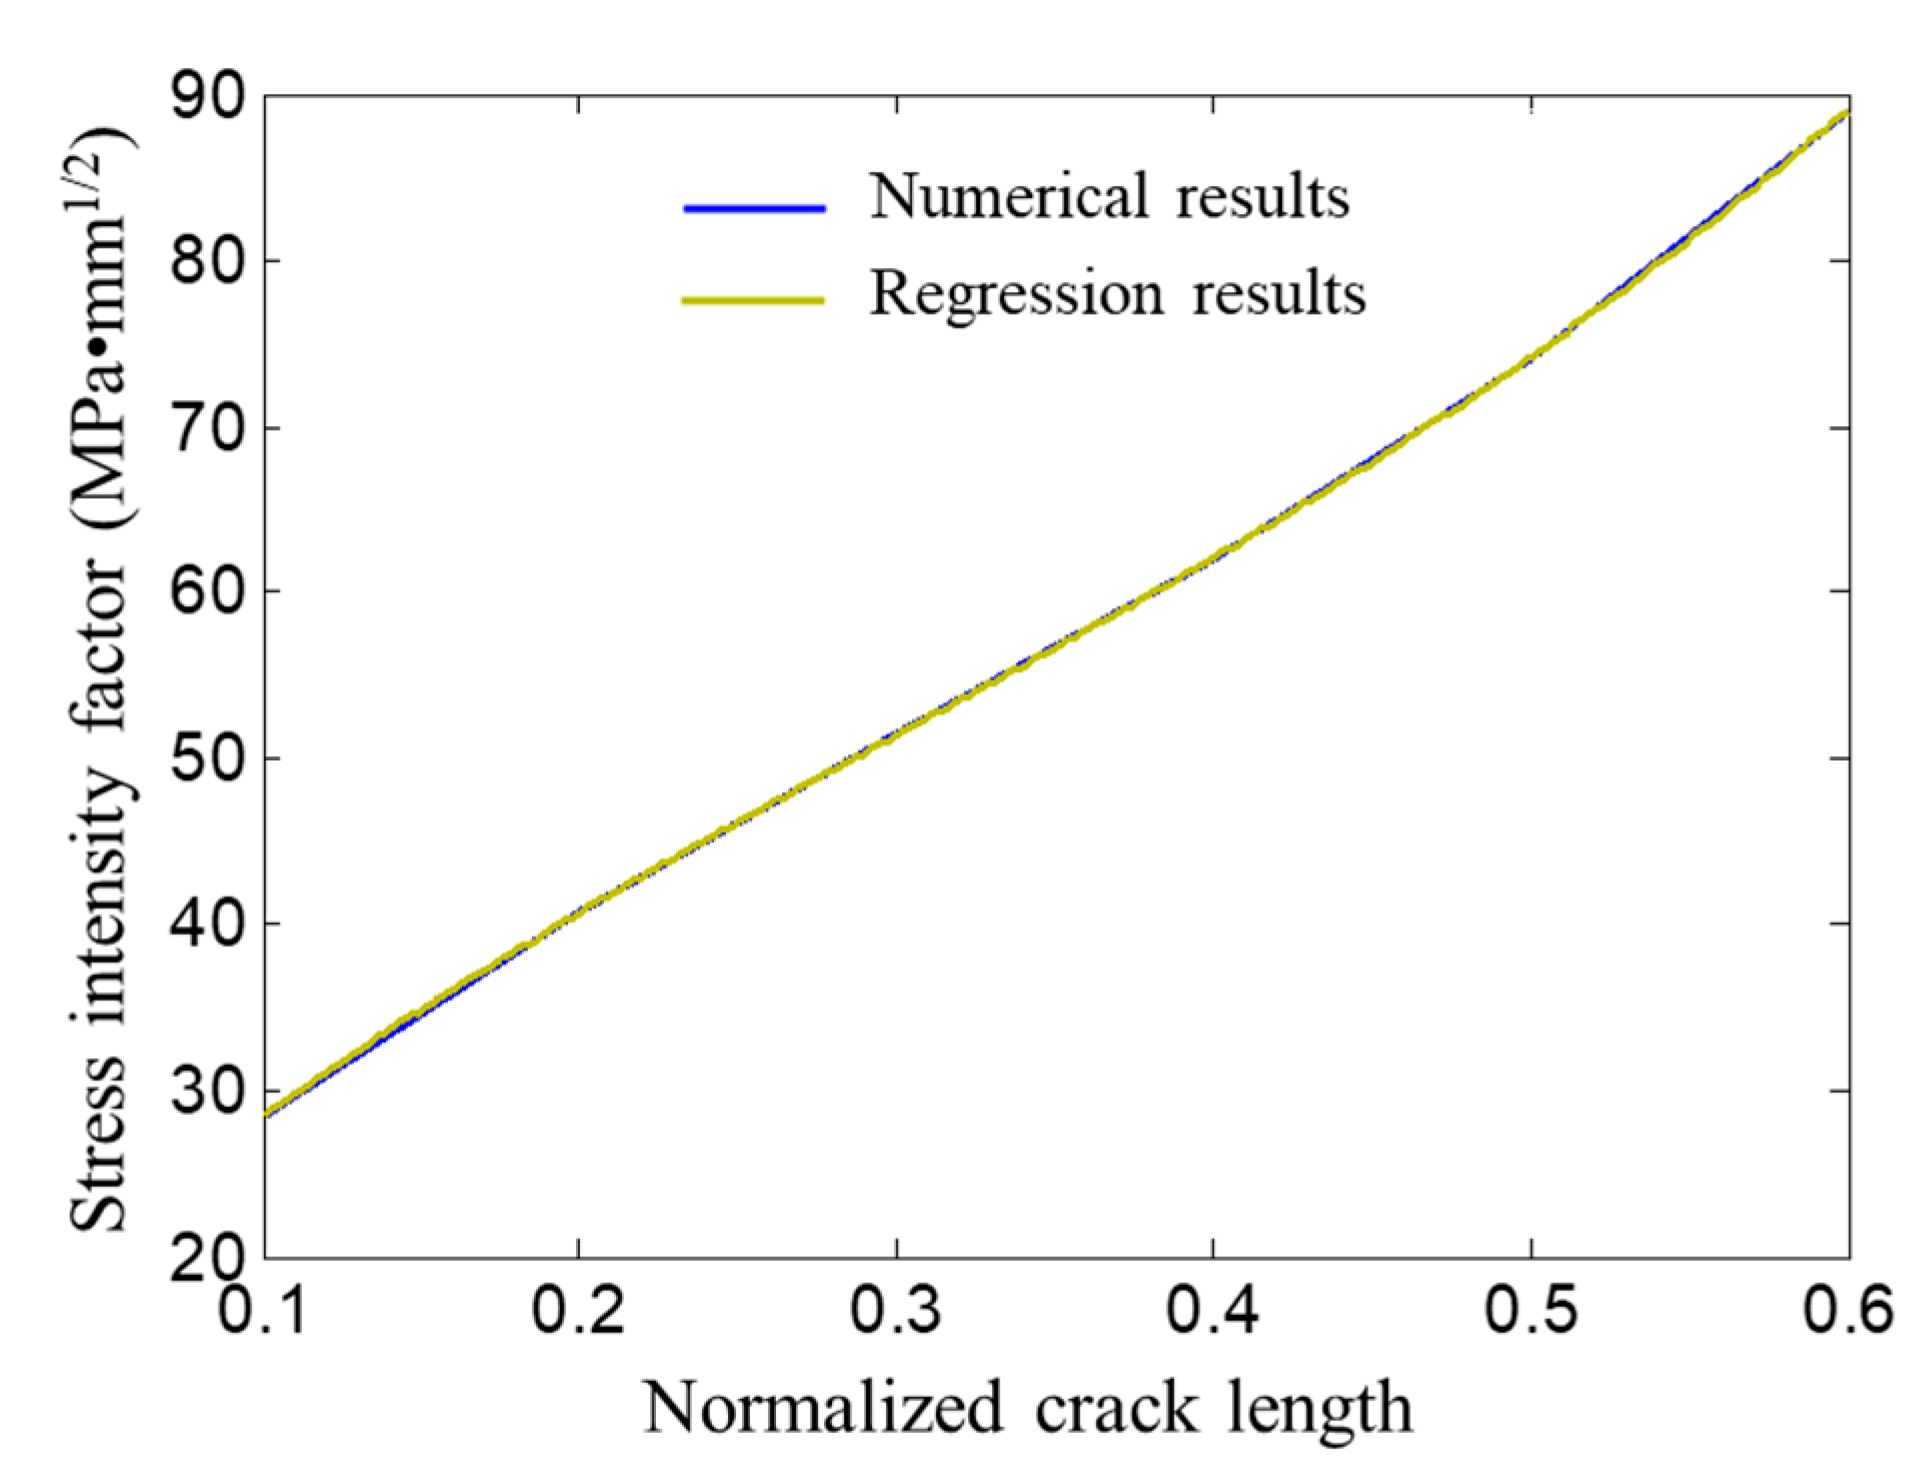
3.3. Stress Intensity Factor Calculation Results and Regression Model

In order to decipher the effect that both the crack length, 2a, and plate width, W, have on the stress intensity factor, the crack length was normalized by dividing it by the plate width, resulting in the ratio x = 2a/W. The range of normalized crack lengths tested were 0.1, 0.2, 0.3, 0.4, 0.5, and 0.6, and the corresponding crack lengths were found to be 5 mm, 10 mm, 15 mm, 20 mm, 25 mm, and 30 mm, respectively. The applied load was kept constant at 100 MPa, and the crack tip mesh size was set to 0.25 mm with an overall element size of 2 mm. The stress intensity factors at the crack tip were calculated using ABAQUS with both the XFEM method and NASGRO. The final results, depicted in Figure 4, reveal that the stress intensity factor for the single edge crack displays a parabolic relationship with the normalized crack length. The results of the XFEM method were found to be in line with the theoretical solution of NASGRO, albeit slightly smaller, thereby confirming the accuracy of the numerical calculations.
The numerical calculation results were fitted by the fourth-order polynomial using MATLAB software. The fitting results were compared with the numerical results as shown in Figure 5. The fitting residual is 0.022, and the fitted polynomial is as follows:
K 100 = 1216 . 7 x 4 818 . 89 x 3 + 301 . 92 x 2 + 40 . 44 x + 8 . 13
From the results shown in Figure 5 and the the fact that the residual error obtained by fitting analysis is only 0.022, it can be seen that the fitting effect is very good, and the fitting formula is also reliable, and it meets the requirements of engineering applications. However, it should be noted that this formula is only applicable to the calculation of the stress intensity factor of 7075T6 aluminum alloy sheet with a single edge crack under the load of 100 Mpa. In practical engineering applications, the load of structural parts changes, and according to the theory of fracture mechanics, the stress is linearly related to the stress intensity factor. The stress intensity factor should be expressed as a correction function of the stress value and the stress intensity factor about the normalized crack length x, which is supposed as the function of f(x):
K = σ f ( x )
Thus, Equation (7) can be written as:
K 100 = 100 × ( 12.167 x 4 8.1889 x 3 + 3.0192 x 2 + 0.4044 x + 0.0813 )
According to Equation (9), the expression of the stress intensity factor function under 100 MPa can be obtained as follows:
f 100 ( x ) = 12.167 x 4 8.1889 x 3 + 3.0192 x 2 + 0.4044 x + 0.0813
Considering that the geometric model of the structure is the same, but the correction function of the stress intensity factor should be the same under different loads, which is f ( x ) = f 100 ( x ) , Equation (9) can be transformed as follows:
K = σ ( 12.167 x 4 8.1889 x 3 + 3.0192 x 2 + 0.4044 x + 0.0813 )

3.4. Model Validation

In Section 3.3, a novel stress intensity factor prediction model is presented, which is primarily based on a load of 100 MPa. To test its validity under varying loads, the loads were increased to 200 MPa and 300 MPa. The stress intensity factor at the crack tip was then calculated utilizing both the XFEM method and Equation (11) under different normalized crack lengths. The results of these calculations are illustrated in both Figure 6 and Figure 7, with corresponding residuals of 0.178 and 0.095. The comparison of the model predictions with the numerical results, as shown in the figures, confirms the effectiveness of the prediction model, as the agreement between them is substantial.

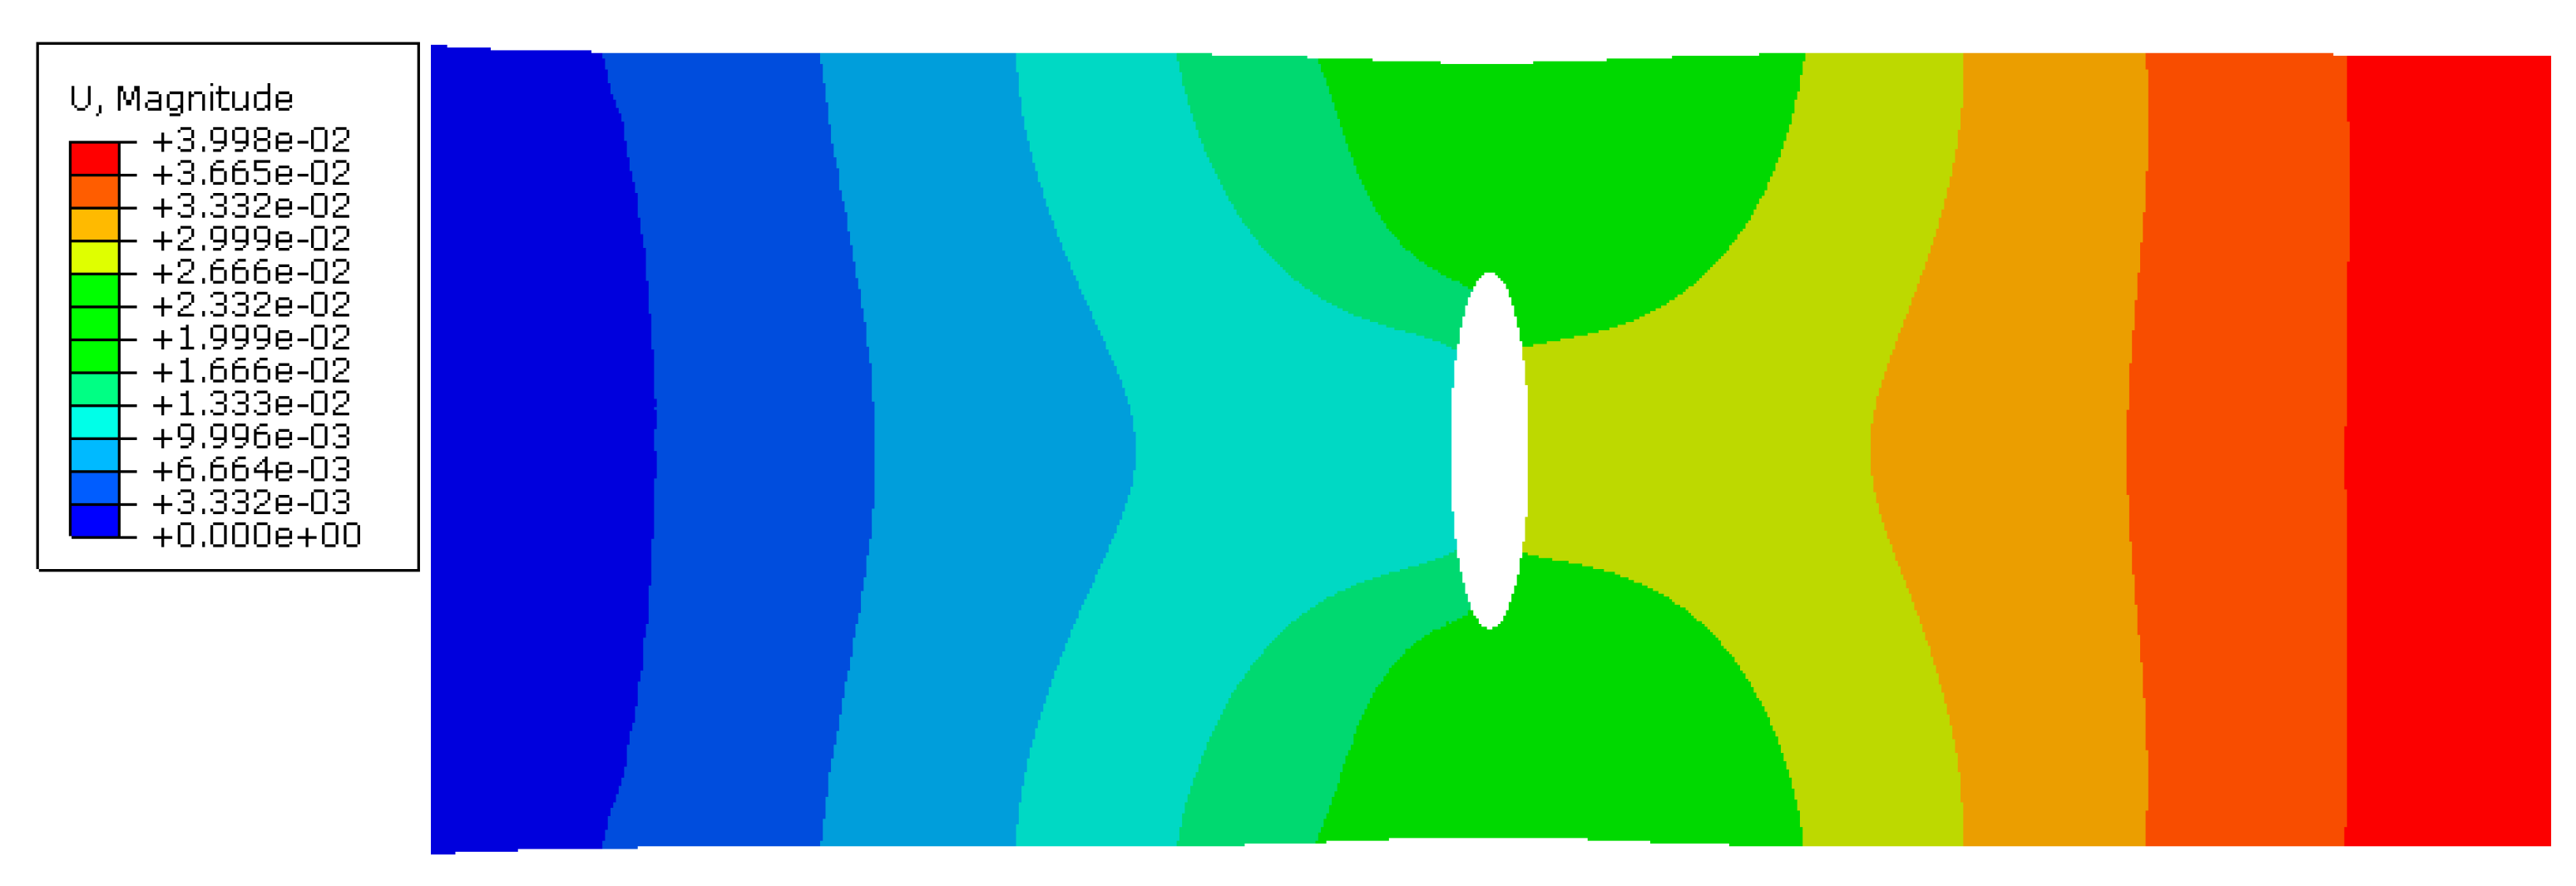
4. Prediction Model of Central Symmetric Crack Stress Intensity Factor

A central symmetric crack is one of the most common crack forms in structural components. The propagation form of the crack is similar to that of the edge crack, but there are also differences. It has also attracted much attention because it is an important factor leading to failure based on the stress of the component.

4.1. Development of Numerical Model for Crack Calculation

The geometry of the cracked component model is defined as a 120 mm × 50 mm × 2 mm structure with an initial crack, measurements of 2a and 5 mm are preset at the center of the component, which is placed symmetrically at its center along a 90° angle parallel to the width direction, as depicted in Figure 8a. The midpoint of the crack coincides with the center of the thin-walled plate, with one end fixed and the other subjected to tensile stress. The numerical model, shown in Figure 8b, uses an eight-node hexahedral element mesh with a matrix element size of 2 mm and a crack tip mesh size of 0.25 mm. The material properties utilized in the calculation can be found in Table 1. The development of the numerical model is illustrated in Figure 8b.

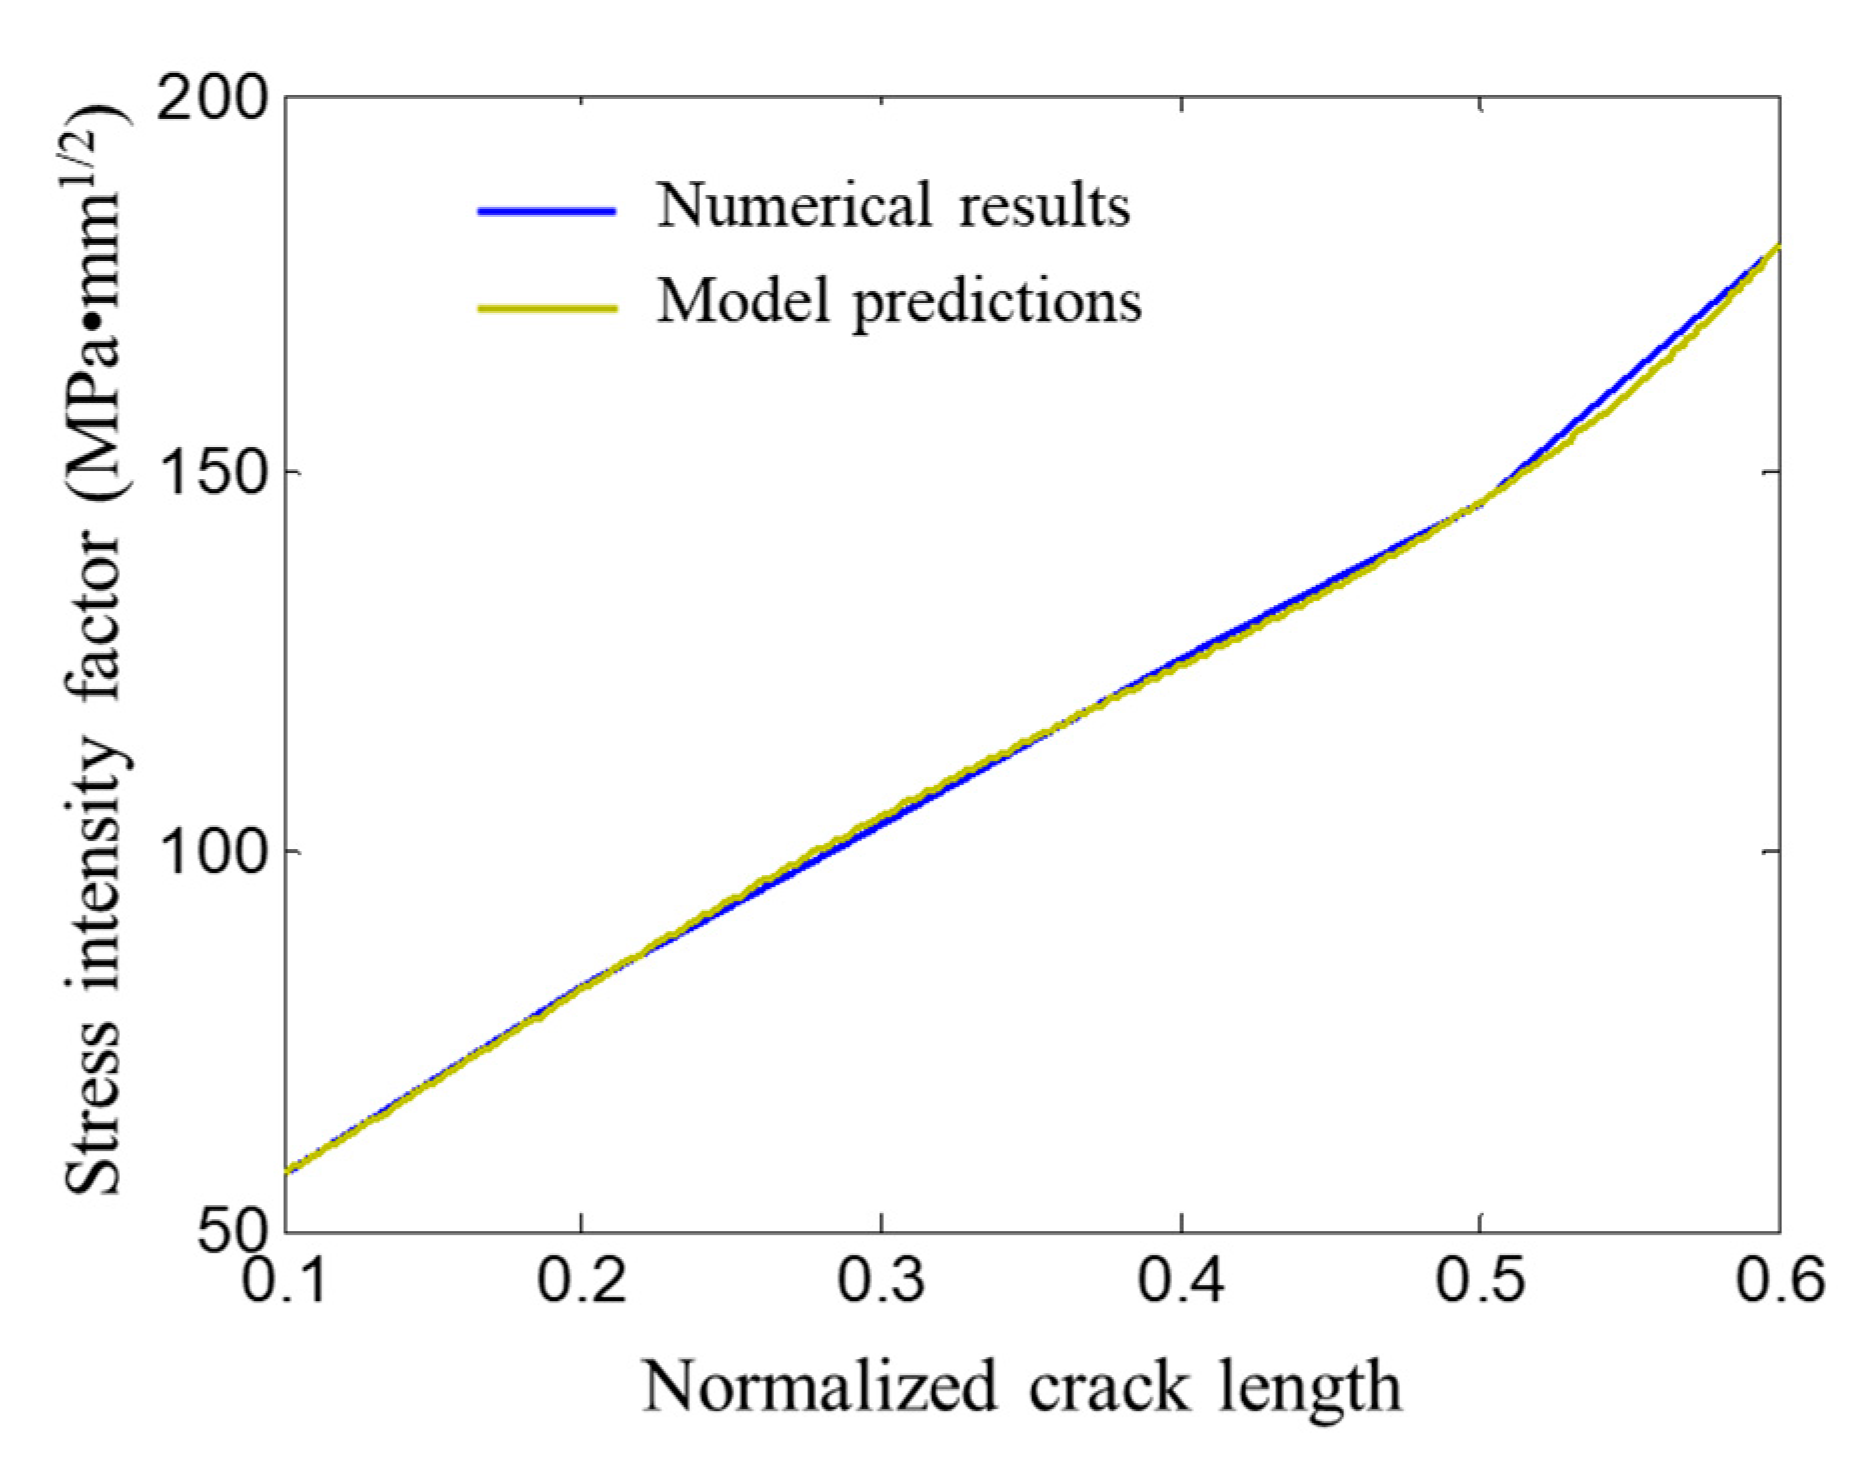
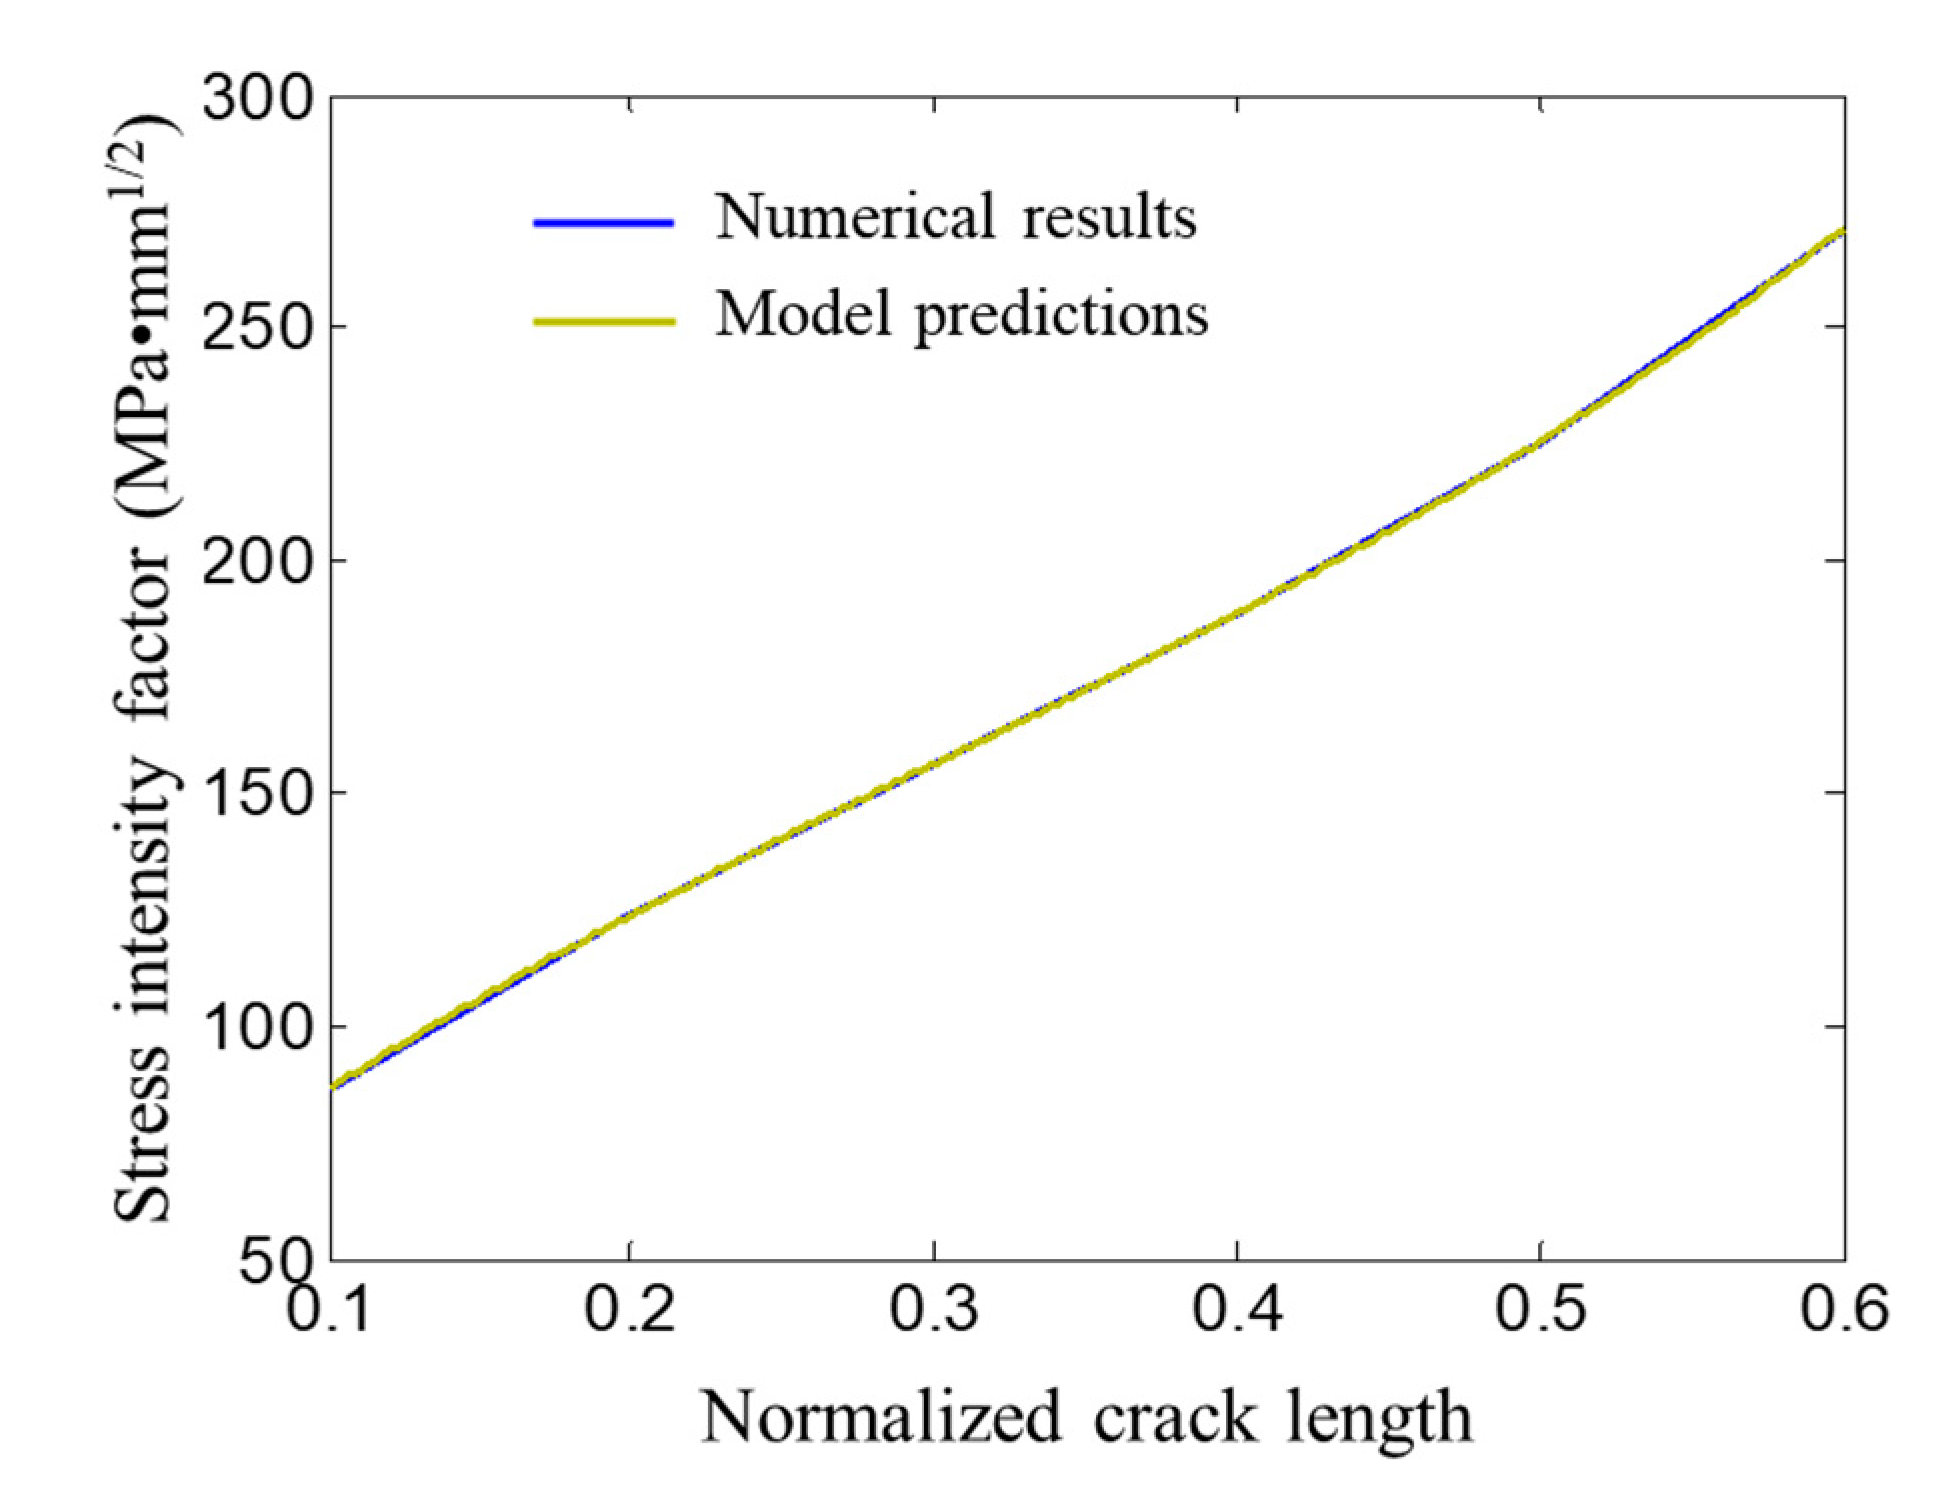
4.2. Calculation Results and Regression Model

To delve into the impact of crack length 2a (a is the crack at half-length) and plate width W on the stress intensity factor, a normalization process was performed by determining the ratio of crack length to plate width, represented as x = 2a/W. Varying normalized crack lengths of 0.1, 0.2, 0.3, 0.4, 0.5, and 0.6 were considered, translating to crack lengths of 5 mm, 10 mm, 15 mm, 20 mm, 25 mm, and 30 mm, respectively, while maintaining a constant load of 100 MPa. ABAQUS, utilizing the XFEM method, was employed to calculate the stress field, displacement field, and stress intensity factor at the crack tip. Figure 9 and Figure 10 display the stress field and displacement field, respectively, at the crack tip. The calculations of stress intensity factor were cross-checked with Narous, with the results depicted in Figure 11, showing consistency with ABAQUS’ XFEM method, but slightly less in magnitude.
The findings as depicted in Figure 9 and Figure 10 indicate a significant impact of the presence of a crack on the stress field distribution across the component, resulting in a concentration of stress at the crack tip, which is depicted in red. The crack is symmetrical in nature, leading to a symmetrical distribution of stress near the crack, and the high stress state at the crack tip is balanced by the release of stress on both sides of the crack opening surface, which exhibits a low stress state. Unlike a single edge crack model, the stress field of a central symmetric crack component follows a symmetrical parabolic distribution along the crack surface.
As can be seen from Figure 11, the stress intensity factor of the central symmetric crack tip (within the calculation range of this model) is approximately linear. The XFEM calculation results are basically consistent with the NASGRO calculation results, but slightly smaller than the NASGRO calculation results, which verifies the accuracy of the finite element model. The finite element calculation results are fitted by the fourth-order polynomial using MATLAB software according to Equation (8). The fitting results are compared with the finite element results as shown in Figure 12. From the results shown in the figure and the residual error obtained by fitting analysis of only 0.059, it can be seen that the fitting formula has good stability and high agreement with the original data, which can meet the requirements of engineering application. The polynomial obtained by fitting is taken from:
K 100 = 100 × ( 0.45833 x 4 + 3.0935 x 3 2.5474 x 2 + 1.7853 x + 0.12813 )
According to the research results in Section 3.3, it can also be assumed that:
K = σ ( 0.45833 x 4 + 3.0935 x 3 2.5474 x 2 + 1.7853 x + 0.12813 )

4.3. Model Validation

In a groundbreaking move, Section 4.2 unveils the prediction model of the coveted stress intensity factor, depicted by Equation (13). This innovative model primarily leverages the numerical structure under the stress-inducing 100 MPa load. To further validate its efficacy with varying loads, it was subjected to the stress-inducing conditions of 200 MPa and 300 MPa. Utilizing both the XFEM method and Equation (13), the stress intensity factor at the crack tip was calculated across different normalized crack lengths. The results of these calculations are presented in Figure 13 and Figure 14, with residuals of 0.240 and 0.166, respectively. A visual inspection of the results shown in Figure 13 and Figure 14 conclusively demonstrates the exceptional accuracy of the model’s predictions, which align with the numerical calculations. Thus, Equation (13) can be relied upon as a precise method for calculating stress intensity factor for any load, fulfilling the project’s practical requirements.
Therefore, further analysis, conducted through MATLAB’s regression analysis, results in the development of the empirical models with respect to the edge crack and central symmetric crack, respectively, and these empirical models have been validated by the associated numerical simulation and theoretical calculation results. These empirical models are found to be both simple and reliable, making them ideal tools for engineering applications.

5. Conclusions

In conclusion, the calculation of the stress intensity factor is a crucial aspect of linear elastic fracture mechanics. It holds significant importance in understanding crack propagation and evaluating damage tolerance. The XFEM has been instrumental in overcoming the challenges associated with the calculation of this factor. The method not only enables the calculation of stress intensity factor at the crack tip and central symmetric position, but it also provides a way to compare it with results obtained from the NASGRO method. The comparison confirmed the accuracy of the results obtained through the XFEM simulation results. The optimal mesh sizes for both the crack elements and overall units were established, and a simple and reliable empirical model was developed through regression analysis. This empirical model is expected to be useful for various engineering applications and serve as a valuable tool for further studies in the field. In summary, XFEM proves to be a robust and effective approach for calculating the stress intensity factor, which is a crucial parameter for the evaluation of crack propagation and damage tolerance; furthermore, these empirical models are found to be both simple and reliable, making them ideal tools for engineering applications.

Author Contributions

Conceptualization, H.Y.; Data curation, W.Y.; Formal analysis, L.Z.; Investigation, W.Y.; Project administration, L.Z.; Supervision, T.H.; Writing—original draft, H.Y.; Writing—review and editing, T.H. All authors have read and agreed to the published version of the manuscript.

Funding

This research was funded by the Key Research and Development Program of Zhejiang Province (2021C04011), the National Natural Science Foundation of China (51575493), the Open Foundation of the State Key Laboratory of Fluid Power and Mechatronic Systems (GZKF-202216), and the Lishui Science and Technology Plan Project (2022ZDYF04, 2022SJZC002).

Institutional Review Board Statement

Not applicable.

Informed Consent Statement

Not applicable.

Data Availability Statement

The data presented in this study are available on request from the corresponding author. The data are not publicly available due to personal privacy.

Conflicts of Interest

The authors declare that the research was conducted in the absence of any commercial or financial relationships that could be construed as a potential conflicts of interest.

References

  1. Qi, H.; Qin, S.; Cheng, Z.; Zou, Y.; Cai, D.; Wen, D. DEM and experimental study on the ultrasonic vibration-assisted abrasive finishing of WC-8Co cemented carbide cutting edge. Powder Technol. 2021, 378, 716–723. [Google Scholar] [CrossRef]
  2. Charee, W.; Qi, H.; Saetang, V. Underwater laser micromachining of silicon in pressurized environment. Int. J. Adv. Manuf. Technol. 2022, 122, 3161–3169. [Google Scholar] [CrossRef]
  3. Lei, Y.; Wang, Z.; Qi, H. Strengthening Performance Optimization of Single Ball Impact Treatment by Evaluating Residual Stress. Materials 2022, 15, 3719. [Google Scholar] [CrossRef] [PubMed]
  4. Tangwarodomnukun, V.; Kringram, S.; Zhu, H.; Qi, H.; Rujisamphan, N. Fabrication of superhydrophobic surface on AISI316L stainless steel using a nanosecond pulse laser. Proc. Inst. Mech. Eng. Part B J. Eng. Manuf. 2022, 236, 680–693. [Google Scholar] [CrossRef]
  5. Ji, R.; Qi, Z.; Chen, J.; Zhang, L.; Lin, K.; Lu, S.; Li, Y. Numerical and Experimental Investigation on the Abrasive Flow Machining of Artificial Knee Joint Surface. Crystals 2023, 13, 430. [Google Scholar] [CrossRef]
  6. Xie, X.D.; Zhang, L.; Zhu, L.L.; Li, Y.B.; Hong, T.; Yang, W.B.; Shan, X.H. Sate of the art and perspectives on surface strengthening process and associated mechanisms by shot peening. Coatings 2023, 13, Submitted. [Google Scholar]
  7. Wu, B.; Li, D.R.; Zhou, Y.; Zhu, D.; Zhao, Y.P.; Z.K., Q.; Chen, B.; Wang, X.L.; Lin, Q. Construction of a calibration field of absolute gravity in a cave using the Cold Atom Gravimeter. Sensors 2023, 23, Submitted. [Google Scholar]
  8. Qi, H.; Xing, W.; Tan, W.; Lin, H.; Guo, H.J.; Chen, M.Z.; Tang, H.P. Effect of the sintering process on mechanical behaviors of Zirconia ceramics by NanoParticle Jetting. Ceram. Int. 2023, Submitted. [Google Scholar]
  9. Qian, H.; Chen, M.; Qi, Z.; Teng, Q.; Qi, H.; Zhang, L.; Shan, X. Review on Research and Development of Abrasive Scratching of Hard Brittle Materials and Its Underlying Mechanisms. Crystals 2023, 13, 428. [Google Scholar] [CrossRef]
  10. Qi, H.; Wen, D.; Lu, C.; Li, G. Numerical and experimental study on ultrasonic vibration-assisted micro-channelling of glasses using an abrasive slurry jet. Int. J. Mech. Sci. 2016, 110, 94–107. [Google Scholar] [CrossRef]
  11. Qi, H.; Wen, D.; Yuan, Q.; Zhang, L.; Chen, Z. Numerical investigation on particle impact erosion in ultrasonic-assisted abrasive slurry jet micro-machining of glasses. Powder Technol. 2017, 314, 627–634. [Google Scholar] [CrossRef]
  12. Li, H.N.; Yang, Y.; Zhao, Y.J.; Zhang, Z.; Zhu, W.; Wang, W.; Qi, H. On the periodicity of fixed-abrasive planetary lapping based on a generic model. J. Manuf. Process. 2019, 44, 271–287. [Google Scholar] [CrossRef]
  13. Elmhaia, O.; Belaasilia, Y.; Askour, O.; Braikat, B.; Damil, N. Numerical analysis of frictional contact between crack lips in the framework of Linear Elastic Fracture Mechanics by a mesh-free approach. Theor. Appl. Fract. Mech. 2023, 124, 103749. [Google Scholar] [CrossRef]
  14. Ongaro, G.; Bertani, R.; Galvanetto, U.; Pontefisso, A.; Zaccariotto, M. A multiscale peridynamic framework for modelling mechanical properties of polymer-based nanocomposites. Eng. Fract. Mech. 2022, 274, 108751. [Google Scholar] [CrossRef]
  15. Shojaei, A.; Hermann, A.; Cyron, C.J.; Seleson, P.; Silling, S.A. A hybrid meshfree discretization to improve the numerical performance of peridynamic models. Comput. Methods Appl. Mech. Eng. 2022, 391, 114544. [Google Scholar] [CrossRef]
  16. Shojaei, A.; Mudric, T.; Zaccariotto, M.; Galvanetto, U. A coupled meshless finite point/Peridynamic method for 2D dynamic fracture analysis. Int. J. Mech. Sci. 2016, 119, 419–431. [Google Scholar] [CrossRef]
  17. Ongaro, G.; Seleson, P.; Galvanetto, U.; Ni, T.; Zaccariotto, M. Overall equilibrium in the coupling of peridynamics and classical continuum mechanics. Comput. Methods Appl. Mech. Eng. 2021, 381, 113515. [Google Scholar] [CrossRef]
  18. Kamaya, M.; Sugamura, K.; Okada, H. Stress intensity factors of rectangular shape cracks for crack growth prediction. Int. J. Press. Vessel. Pip. 2023, 201, 104864. [Google Scholar] [CrossRef]
  19. Calvín, G.; Escalero, M.; Zabala, H.; Muñiz-Calvente, M. A new effective stress intensity factor approach to determine thickness-independent fatigue crack growth rate curves. Theor. Appl. Fract. Mech. 2022, 121, 103505. [Google Scholar] [CrossRef]
  20. Belytschko, T.; Black, T. Elastic crack growth in finite elements with minimal remeshing. Int. J. Numer. Methods Eng. 1999, 45, 601–620. [Google Scholar] [CrossRef]
  21. Hu, C.; Ling, D.; Ren, X.; Gong, S.; Wang, L.; Huang, Z. An improved crack-tip element treatment for advanced FEMs. Theor. Appl. Fract. Mech. 2020, 108, 102587. [Google Scholar] [CrossRef]
  22. Melenk, J.M.; Babuška, I. The partition of unity finite element method: Basic theory and applications. Comput. Methods Appl. Mech. Eng. 1996, 139, 289–314. [Google Scholar] [CrossRef] [Green Version]
  23. Nakasone, Y.; Yoshimoto, S.; Stolarski, T.A. Chapter 3—Application of ANSYS to stress analysis. In Engineering Analysis with ANSYS Software; Nakasone, Y., Yoshimoto, S., Stolarski, T.A., Eds.; Butterworth-Heinemann: Oxford, UK, 2006; pp. 51–142. [Google Scholar]
  24. Wang, Y.Y.; Wang, Z.; Ni, P.C.; Wang, D.J.; Guo, S.H.; Chen, Z.Z. Experimental and numerical study on regulation of cutting temperature during the circular sawing of 45 steel. Coatings 2023, 13, Submitted. [Google Scholar]
  25. Yu, T.T. Numerical simulation of a body with cracks. Chin. J. Rock Mech. Eng. 2005, 24, 4434–4439. [Google Scholar]
  26. Suman, S.; Khan, M.K.; Pathak, M.; Singh, R.N. 3D simulation of hydride-assisted crack propagation in zircaloy-4 using XFEM. Int. J. Hydrogen Energy 2017, 42, 18668–18673. [Google Scholar] [CrossRef]
  27. Suman, S.; Khan, M.K.; Pathak, M.; Singh, R.N. Effects of Hydride on Crack Propagation in Zircaloy-4. Procedia Eng. 2017, 173, 1185–1190. [Google Scholar] [CrossRef]
  28. Kumar, S.; Singh, I.V.; Mishra, B.K. A homogenized XFEM approach to simulate fatigue crack growth problems. Comput. Struct. 2015, 150, 1–22. [Google Scholar] [CrossRef]
  29. Maierhofer, J.; Pippan, R.; Gänser, H.P. Modified NASGRO equation for physically short cracks. Int. J. Fatigue 2014, 59, 200–207. [Google Scholar] [CrossRef] [Green Version]
  30. Ji, P.J.; Zhang, J.J.; Xie, X.D.; Ying, R.M.; Zhang, L. Review on Wear Characteristics of Artificial Hip Joint and Associated Physical Training. Front. Mater. 2023, 10. [Google Scholar]
  31. Kumar, M.; Singh, I.V.; Mishra, B.K. Fatigue crack growth simulations of plastically graded materials using XFEM and J-integral decomposition approach. Eng. Fract. Mech. 2019, 216, 106470. [Google Scholar] [CrossRef]
  32. Galić, I.; Čular, I.; Vučković, K.; Tonković, Z. Comparison of SIF solutions obtained by XFEM and conventional FEM for cracks in complex geometries like valve body. Procedia Struct. Integr. 2018, 13, 2109–2113. [Google Scholar] [CrossRef]
  33. Nasri, K.; Abbadi, M.; Zenasni, M.; Ghammouri, M.; Azari, Z. Double crack growth analysis in the presence of a bi-material interface using XFEM and FEM modelling. Eng. Fract. Mech. 2014, 132, 189–199. [Google Scholar] [CrossRef]
  34. Cruz, F.; Roehl, D.; Vargas, E.d.A. An XFEM implementation in Abaqus to model intersections between fractures in porous rocks. Comput. Geotech. 2019, 112, 135–146. [Google Scholar] [CrossRef]
  35. Qi, H.; Wang, Y.; Qi, Z.; Shi, L.; Fang, Z.; Zhang, L.; Riemer, O.; Karpuschewski, B. A Novel Grain-Based DEM Model for Evaluating Surface Integrity in Scratching of RB-SiC Ceramics. Materials 2022, 15, 8486. [Google Scholar] [CrossRef] [PubMed]
  36. Cheng, Z.; Qin, S.; Fang, Z. Numerical Modeling and Experimental Study on the Material Removal Process Using Ultrasonic Vibration-Assisted Abrasive Water Jet. Front. Mater. 2022, 9. [Google Scholar] [CrossRef]
Figure 1. (a) Edge crack mode, and (b) developed numerical model.
Coatings 13 00581 g001
Figure 2. Effect of overall element size on stress intensity factor.
Coatings 13 00581 g002
Figure 3. Effect of crack tip mesh size on stress intensity factor.
Coatings 13 00581 g003
Figure 4. Comparison between numerical and NARSGROW theoretical results.
Coatings 13 00581 g004
Figure 5. Comparison between numerical and regression results.
Coatings 13 00581 g005
Figure 6. Comparison between numerical results and model predictions under load of 200 MPa.
Coatings 13 00581 g006
Figure 7. Comparison between numerical results and model predictions under load of 300 MPa.
Coatings 13 00581 g007
Figure 8. (a) The 90° central symmetric crack mode, and (b) 90° central symmetric crack developed with numerical model.
Coatings 13 00581 g008
Figure 9. Distribution of stress in crack tip.
Coatings 13 00581 g009
Figure 10. Distribution of strain with cracked components.
Coatings 13 00581 g010
Figure 11. Comparison between numerical and NARSGROW theoretical results.
Coatings 13 00581 g011
Figure 12. Comparison between numerical and regression results.
Coatings 13 00581 g012
Figure 13. Comparison between numerical results and model predictions under load of 200 MPa.
Coatings 13 00581 g013
Figure 14. Comparison between numerical results and model predictions under load of 300 MPa.
Coatings 13 00581 g014
Table 1. Major material properties of 7057T6 high strength aluminum alloy.
Elastic Modulus, E (MPa)Poisson Ratio, νDensity, ρ (kg/m3)Fracture Toughness, K (MPa•mm1/2)
71,0000.332740917
Disclaimer/Publisher’s Note: The statements, opinions and data contained in all publications are solely those of the individual author(s) and contributor(s) and not of MDPI and/or the editor(s). MDPI and/or the editor(s) disclaim responsibility for any injury to people or property resulting from any ideas, methods, instructions or products referred to in the content.

