Abstract
This article presents the results of a study on the laser cladding of metal matrix composite coatings using an experimental custom-made powder composed of NiCrBSi matrix with 65 wt.% reinforcing hard particles of eutectic WC + W2C. The chemical and phase composition of the powder was designed to ensure high hardness, abrasion wear resistance at moderate dynamic loads and corrosion resistance at high temperature of the coatings. The influence of the basic processing parameters of the laser cladding, especially energy input, on the quality and single bead geometry, the dilution, share of the massive carbides in the matrix, and the fraction share of reinforcing carbides particles on cross-section of the clads, as well as hardness profiles and abrasive wear resistance, were analysed and presented. The microstructure of test coatings, chemical and phase composition were analysed by optical and scanning electron microscopes (OM, SEM), EDS and XRD spectrometers. It was found that the differences in the wear resistance of the coatings produced at different energy inputs of laser cladding were directly related to the share of the massive carbides WC + W2C in the metal matrix NiCrBSi. The tribological characteristics of the coatings were also studied and described. The test results indicate that the coefficient of friction for carbides is slightly higher than for the metal matrix, and therefore the greater the share of carbides, the higher the value of the coefficient of friction of the coating.
1. Introduction
Constant striving to improve the operational parameters of machine parts and tools and to increase their durability has led to the development of surface treatment and coating methods. One advanced modern method of coatings is laser cladding (LC), which shows several advantages when compared to other conventional methods of surfacing and coating [1,2,3]. Laser beams are a heat source used during the cladding process, providing a high value of power density, precise heating of a small material volume, higher processing speeds, and therefore limited heat input, as well as limited penetration depth and low dilution. The technology of laser cladding can be applied for the manufacturing of wear or corrosion resistant metallic and metal matrix composite (MMC) coatings. Usually, Ni-based or Co-based alloys are used as the metal matrix for composite coating, due to their possessing high resistance to oxidation, including at high temperature [4,5].
Kołodziejczak, P. et al. found that if 6.0% of Re (rhenium) is added to the Ni-Cr alloy, the resistance to corrosion and oxides formation of coatings operated at elevated temperature can be increased significantly [6].
Hulka, I. et al. investigated the laser deposition process in terms of optimisation of the travel speed and power density to provide defect-free coatings composed of NiCrBSi matrix with WC-Co carbides. The coatings were produced on a substrate consisting of a low-carbon mild steel [7]. They found that optimising the travel speed could significantly increase the sliding wear resistance and corrosion resistance of the coatings thanks to controlling the amount of Fe (iron) in the coatings.
Vostrak, M. et al. studied the impact of technological conditions and processing parameters on structure and abrasive wear resistance of the composite coatings of NiCrBSi matrix reinforced by WC carbides and produced by laser cladding [8]. They related the heat input with amount of dissolved WC carbides and found that the dilution of the coating by Fe (iron), as well as the decomposition and dissolution of tungsten carbides, had a significant influence on the structure and properties of the coating. They proved that choosing the processing parameters is critical, because the parameters strongly affect the characteristics of the coating, especially the resistance to wear. Moreover, they pointed out that the microstructure inhomogeneity of the coatings in the overlapping regions was the main reason for significant selective and excessive wear caused by abrasion.
Amado, J., M. et al. investigated the influence of Cr content in Ni-Cr matrix of metal matrix composite coating reinforced by WC spherical particles and produced by laser cladding [9]. They tested Ni-Cr-type alloys with three different contents of chromium (Cr), ranging from 6.0% to 14.0%. They reported that the susceptibility for cracking was related with the amount of Cr in the Ni-Cr type metal matrix. They found that the test coatings with Cr content below 8 wt.% were crack free. Moreover, they observed that under dry sliding wear test, the decrease in hardness of the matrix caused by lowering the content of chromium (Cr) did not strongly affect the wear rate.
Makarov, A.V. et al. studied the process of laser deposition of NiCrBSi and NiBSi-WC metal matrix composite coatings [10]. They pointed out that the conditions of solidification of the melt pool during laser cladding lead to formations of structures that are nonequilibrium. This is related mainly to the rapid heating and subsequent rapid cooling and rapid solidification. Therefore, the structure depends on the thermal conditions, thus heat input of the process of laser cladding. In addition to the direct influence on the structure, higher heat input leads usually to higher penetration depth, and therefore to higher dilution rate. This phenomenon is unfavourable because it changes the chemical composition of the clad material and leads to changes in the phase composition and thus the structure of the coating. Makarov et al. also found that the annealing of NiCrBSi coating at 1025 °C leads to formation of large chromium carbides and borides, which in turn provides increase in hardness and wear increase [10]. In turn, in the case of composite coatings the reaction of WC tungsten carbides with B (boron) during the cladding leads to the creation of relatively large reinforcing particles of carboborides W(C,B), which are harder when compared to the carbides in the composite powder.
Wei, Z. et al. [11] investigated laser deposition of nanometric size WC tungsten carbides powder on the substrate of Cr-rich stainless steel by means of 7.0 kW gaseous CO2 laser. The authors indicated that the composite coatings reinforced by nanometric WC particles exhibited advantageous mechanical characteristic and provided 3.5 times higher abrasion wear resistance than the substrate material [11].
Leech, P.W and Li X.S. [12] investigated diamond and tungsten carbide WC-reinforced metal matrix composites produced by different methods. It has been shown that the mass loss due to abrasive wear decreases significantly with the increase in the average particle size as the reinforcing phase and with the increase in the volume fraction of the hard reinforcing phase. The same relationship was found for both diamond and WC particles. In turn, the wear resistance was not directly correlated with the values and distribution of hardness in the matrix of the composite coating [12].
Radionova, L.V. et al. [13] proposed a method of coating the working surfaces and edges of die rollers designed for manufacturing wires made of titanium and its alloys. They pointed out that the initial coating of WC10Co4Cr alloy with a thickness of 600 μm and subsequently remelted by a laser beam provided an increase in coating hardness of over 1050 HV (>67 HRC). Such coatings exhibit resistance to wear under such conditions more than seven times higher than for conventional heat treatment of Kh12MF steel [13].
Bergant, Z. et al. [14] studied laser deposition of composite coatings based on metal matrix of NiCrBSi and cemented tungsten carbides WC-12Co with a solid-state Nd:YAG laser. They used a coaxial multi-jet nozzle for powder feeding. The content of cemented WC-12Co carbides in relation to the NiCrBSi matrix was 30 wt%, 40 wt% and 50 wt%. The authors indicated that the addition of cemented tungsten carbide WC-12Co into the matrix of NiCrBSi composite coatings increased the wear resistance under the investigated conditions. Moreover, the wear mechanism was changed from adhesion wear typical for to NiCrBSi coating to fatigue assisted abrasion.
In industrial production conditions, the NiCr type coatings are deposited mainly by thermal spraying processes, while the composite coatings with Ni-based matrix reinforced by WC carbides mainly by Plasma Tungsten Arc cladding (PTA) [13,14,15,16,17,18].
There are few articles in the world literature about laser cladding of NiCrBSi-WC composite coatings. Typically, the tungsten carbide content in this type of composite powders with metal matrix component reaches 50% or a maximum of 60%. Therefore, an experimental powder composed of NiCrBSi metal matrix with 65 wt.% of WC reinforcing carbides was prepared, to ensure high hardness, abrasion wear resistance at moderate dynamic loads and corrosion resistance at high temperature of the coatings.
The goal of this study was to determine the possibility of laser deposition such composite coatings and the influence of the basic laser processing parameters on quality, geometry of a single bead, dilution rate, structure and microstructure, and massive carbide particles share and distribution on cross-sections of the clads.
2. Materials and Methods
The composite powder used in the study of laser cladding (Figure 1) was NiCrBSi powder mixed with 65 wt.% of WC + W2C powder. The chemical composition of the nickel-based powder used as the metal matrix is given in Table 1. The chemical composition of the matrix powder was selected so as to ensure good technological properties during laser cladding, especially reduction of surface tension and fluidity of the melt pool in order to ensure good wettability of the carbide particles and thus good bonding of the metal matrix with the carbides [1,7,8,9,10,18]. The powder was gas atomised in argon atmosphere and the spherical particle size range was mainly 45 ÷ 150 µm (Durum, Willich, Germany). In turn, the WC + W2C powder was prepared by melting and crushing of eutectic tungsten carbides (Durum, Willich, Germany). The size of irregular-shaped particles of tungsten carbides was in the range 80 ÷ 160 µm, Figure 2. The sieve test of the mixed experimental powder composed of metal matrix powder and tungsten carbides was conducted according to the standard PN-EN 24497/ISO 4497. Sieve shaker with sieve diameter 300 mm was used. The analysed individual batches of powder weight from 100 to 120 g. The mass fraction share and cumulative particle size distribution curve are presented in Figure 3. The morphology, EDS and phase composition of the experimental powder are presented in Figure 2 and Figure 3.
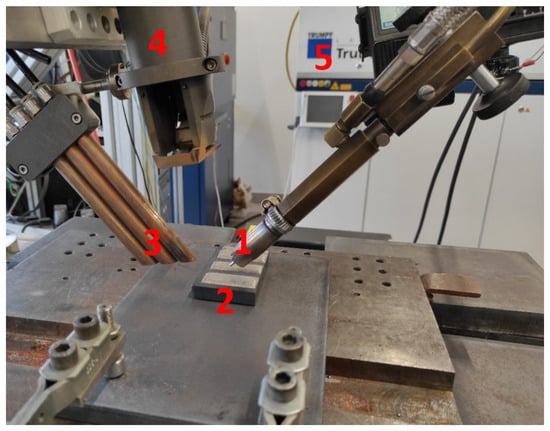
Figure 1.
The experimental setup for laser cladding of composite powder: 1—nozzle for powder delivery, 2—coated sample, 3—shielding nozzles, 4—laser head, 5—laser generator.

The substrate used for laser cladding tests was commercially available low carbon steel S235 (EN 10025-2) with a thickness of 5.0 mm (0.08% C, 0.6% Mn, 0.1% Si, Fe-bal.). The dimensions of the samples prepared for tests were 80 mm × 80 mm. Prior to testing the laser deposition, the samples were sandblasted. The purpose of this procedure was to ensure repeatable conditions and roughness of the surface.
The mean value of the roughness was in the range Ra 30 ÷ 60 μm. Additionally, the surface was cleaned and degreased by acetone prior to laser cladding tests. The laser cladding tests were conducted on an automatic stand with a solid state Yb:YAG Disk laser (Trumpf, Ditzingen, Germany). The laser emits in continuous wave mode, and the wavelength is 1.03 μm. The maximum output power of the laser beam is 3.3 kW. The BPP parameter of the laser beam is 8.0 mm·mrad, with a beam focus diameter of 200 μm. However, the laser beam was defocused in order to provide a larger area of laser beam heating on the surface of sample (substrate). Therefore, the laser head was lifted so that the focal plane was 70 mm above the upper surface of the substrate, and the diameter of the laser beam on the surface of the sample was 2.5 ÷ 2.8 mm.
For powder delivery into the melt pool, a cylindrical nozzle was applied with a diameter of 1.0 mm. The powder feeding rate of 6.5 g/min was kept constant. The nozzle for powder delivery into the melt pool was set in front of the melt pool, and the angle of inclination was approximately 40 ÷ 45°, providing minimalised powder loss. The carrying gas for powder delivery was high-purity argon (purity 99.999%) set at a flow rate of 1.5 L/min. The cladding zone was protected by shielding inert gas (also high-purity argon) flow by three nozzles 8.0 mm in diameter each. Nozzles were set at an angle of 45° to the surface of the substrate sample. The flow of shielding argon was kept at approximately 8.0 ÷ 10.0 L/min. The experimental setup is show in Figure 1.
The single clads were deposited as stringer beads at different energy input, as a result of different laser output power at constant scanning speed. The laser output power was in the range from 0.5 kW to 2.0 kW, while the scanning speed was 300 mm/min, chosen on the basis of previous tests.
In addition to the single stringer clads, comparative samples were prepared by multi-bead cladding of the discs intended for the tribological tests. The discs 45.0 mm in diameter were produced by laser cladding multi-bead coatings with an overlap of approximately 25%. The entire disc surface was coated. The comparative coatings were produced at the parameters LC2, LC3 and LC4 (Table 2). It was decided that the laser cladding parameters with the lowest laser output power and thus the lowest energy input provide too narrow bead for cladding entire disc. Therefore, these parameters were omitted during multi-pass coating of discs. The surfaces of the coated discs were grinded, providing a roughness Ra of 0.8 ÷ 1.1 μm.
Table 2.
Parameters of laser cladding of experimental composite NiCrBSi/WC + W2C powder, Figure 2.
After completing the laser cladding tests, firstly, a rough visual quality assessment was performed, and then metallographic examinations were carried out. The samples for metallographic examinations were cut perpendicularly in the middle of the bead length, away from the initiation and completion of cladding.
The samples were mounted using thermosetting phenol resin having additional graphite filler Electro-WEM (Metalogis, Warsaw, Poland). Then, the mounted samples were wet grinded by means of water papers with grit 120 to 2500 by the automatic grinding/polishing machine Struers Labopol-2 (Struers, Rodovre, Denmark). Finally, the samples were polished using 1 µm diamond suspension Metkon Diapat-M (Metkon Instruments Inc., Bursa, Turkey). After that, the samples were etched with the HNO3 + 3HCL reagent to disclose the microstructure.
Macrostructure observations were performed by means of an OLYMPUS SZX9 microscope (Olumpus Corporation, Tokyo, Japan). In turn, the microstructure observations were performed by means of NIKON Eclipse MA100 inverted microscope (Nikon Corporation, Tokyo, Japan). A thorough study of the microstructure was performed by scanning electron microscopy SEM (Carl Zeiss, Oberkochen, Germany), equipped with the Energy Dispersive Spectrometer EDS (Oxford Instruments, Abingdon, GB, USA). The phase composition was determined by X-Ray diffraction (Panalitycal, Almelo, Netherlands) with a CuKα source of radiation, with a scanning range of the diffraction angle 2θ from 0° to 140°.
The hardness distribution was determined on the cross-section of the test individual beads by hardness tester WILSON WOLPERT 401 MVD (Wolpert Wilson Instruments, Aachen, Germany) at the load 5 N and the dwell time 10 s.
Measurements were taken in the middle of the bead width, along the vertical axis, starting from the under surface region of the clad (face of the clad). The first measuring point was placed 0.15 mm under the top surface, and then the distance between successive points was kept constant at 0.2 mm.
The tribological tests of coatings were conducted by a ball-on-disc tribometer T-01M under room temperature of 22 °C, and dry sliding conditions according to the ASTM G99 standard. The relative humidity was about 40% ± 5%. The discs were 45.0 mm in diameter, while balls 10.0 mm in dimeter and made of bearing steel (EN 100Cr6, AISI 5210) were used as the counterface material. The normal load of 20 N was set for the tests. The number of revolutions was set to 1500. In turn, the radius of the wear track was set to 15 mm. Therefore, the total sliding distance resulted in 141.3 m. The sliding speed was set to 0.157 m/s. The tangential force of friction and displacement value were continuously measured and recorded during tests using a data acquisition system with PC computer. The coefficient of friction µ was calculated by dividing the value of tangential force of friction by the value of normal load used:
where:
µ = T/Fn,
Fn—normal load, T—tangential force of friction.
3. Results and Discussion
3.1. Characteristics of the Experimental Powder
The general morphology of the experimental powder is shown in Figure 2. As can be seen in the SEM micrograph, the spherical particles of the metallic powder have a diameter not exceeding 100 µm, while irregularly shaped carbide particles have larger dimensions. The mass fraction share and cumulative particle size distribution curve, presented in Figure 3, show that the largest share belongs to particles with a size between 100 and 150 µm (approximately 31%). In turn, the share of particles with a size of approximately 45 µm is at a level of just 2.5%.
The EDS spectra taken from the irregular particles confirmed the presence of only tungsten (W) and carbon (C), Figure 4a,c. However, the content of carbon was not determined quantitatively, due to the uncertainty of the results. In turn, EDS spectra taken from the irregular particles showed presence of nickel (73 wt.%), chromium (15 wt.%), silicon (6.4 wt.%) and also iron (5 wt.%), Figure 4a,b. Boron was not identified by EDS, for the same reason as carbon was not quantitatively determined. However, an interesting finding is the confirmed content of approximately 5 wt.% of iron, which was originally intended not to be present in the matrix powder.

Figure 2.
Morphology of the experimental composite powder NiCrBSi/WC + W2C; mixture of irregular WC particles and spherical metallic Ni-based particles, Table 1.

Figure 3.
The mass fraction share (a) and cumulative particle size distribution curve (b) of the experimental composite powder NiCrBSi/WC + W2C, Table 1.

Figure 4.
(a) SEM image of the analysed particles of the composite powder (Table 1); (b) EDS spectra of the spherical particle of matrix component, and (c) EDS spectra of the irregular WC particle.
3.2. Macrostructure and Single Bead Geometry
The macrographs of the cross-section of the stringer beads are presented in Figure 5. The stringer beads were produced at constant scanning speed and different laser output powers, and thus the influence of energy input (the product of laser output power and scanning speed: P/v, J/mm) on the bead geometry can also be considered. If the heat transfer efficiency is also taken into consideration, the parameter is referred to as heat input. A clear interface line between the clads and the substrate can be observed, as well as the heat affected width can be determined, as can be seen in Figure 5. As the laser output power increases, the penetration depth, height and width of the clad also increase. The shape of the fusion line also changes. The detailed features of the geometry and dilution rates are given in Table 3 and Figure 5 and Figure 6. The size of the stringer bead, i.e., width and height, but also the shape of the face, is important from the point of view of the possibility of making coatings on various elements of various sizes (e.g., with a large mass, size and cladding surface or small and precise), as well as on the efficiency of the cladding process. On the other hand, one of the most important features of the clad is the dilution rate. As can be seen from the data in Table 3 and Figure 6, as the stringer bead size increases, the dilution also increases. For example, the lowest dilution rate was determined for the clad CL1 approximately 5%. However, this clad is characterised by the smallest dimensions, and its width is less than 2.0 mm. Meanwhile, the height of the clad is only 0.6 mm. Such a stringer bead shape is preferable for cladding precise elements with a small surface area for coating. The increase in laser output power, with other processing parameters remaining constant, increases the height of the stringer bead.
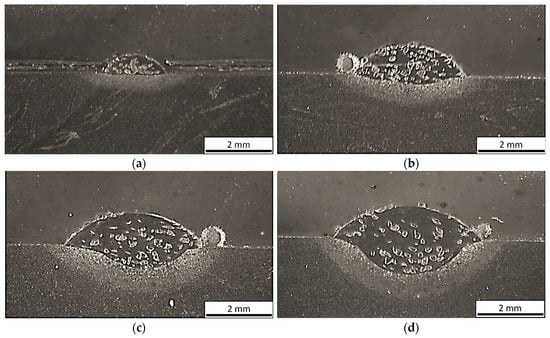
Table 3.
Results of geometry determining for the stringer beads produced by laser cladding of experimental composite NiCrBSi/WC + W2C powder, Figure 5.
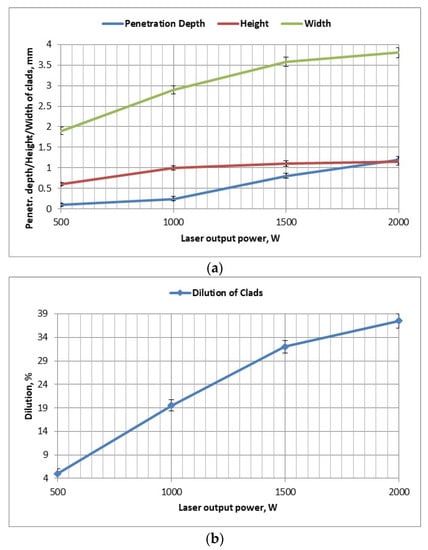
However, the difference in height at laser output power between 1.0 and 2.0 kW is insignificant, reaching a limit at approximately 1.1 ÷ 1.15 mm, Figure 6a. This phenomenon is related to the spreading of the melt pool of increasing volume to the sides and increasing the width of the solidified stringer bead, as illustrated in Figure 5.
The increase in power to above 1.0 kW in the examined range of parameters and technological conditions also led to excessive penetration depth, and thus a large dilution. As can be seen in Figure 6b, the dilution is over 30% in the case of the clad LC3, and as much as 37% for the LC4, Table 3, Figure 6b. It should be pointed that such a large dilution is not beneficial from the point of view of ensuring the desired chemical composition of the coating and the energy consumption, and efficiency of the laser cladding process.
Preliminary visual examination and analysis of cross-sections morphology of the stringer beads revealed no cracks, and no large voids or porosity. Only single pores of small size were identified on the cross-section of bead LC2. Moreover, the stringer bead LC3 is slightly asymmetrical, as seen in Figure 5c. The reason for this is the displacement or unproper set of the powder feeding nozzle relative to the laser beam. However, this is most probably a human fault resulting from incorrect positioning of the laser head, rather than from the instability of the processing parameters or conditions. In addition, general observation of the cross-sections revealed a significant difference in the share of carbide particles on the cross-section of the stringer beads. The smallest share of carbides can be observed in the case of the bead LC4, produced at the highest laser output power and thus the highest energy input. As can be expected, the higher energy input leads to dissolution of the carbides and also increases the dilution. Therefore, the share of carbides in the clad decreases with increasing laser output power of the cladding.
3.3. Microstructure and Phase Composition
The comparative microstructures of the chosen representative clads produced at the laser output power of 1.0 kW (energy input 120 J/mm) and produced at the maximum laser output power of 2.0 kW (energy input 240 J/mm) are presented on optical micrographs in Figure 7. Comparing Figure 7a,c, it is evident that the number and size of the massive carbides are different on the cross-sections. The share of massive carbides on the cross-section of individual clads was calculated and the quantitative data are presented in Figure 8a. As can be seen, the highest share of massive carbides particles (42.3%) was determined for the clad LC1 produced at minimum laser output power and energy input (1.0 kW, 60 J/mm). The share of massive carbides on the cross-sections decreases with the increase in laser output power, and thus the increase in dilution and the degree of carbides degradation and dissolution, Figure 8a. The share of massive carbides for the clad LC4 produced at maximum laser output power and energy input is reduced to 18.4%. The energy input during laser cladding affects the degree of degradation and dissolution of the massive carbides, which also causes the size in clads made at higher energy input to be smaller. This relationship was investigated quantitatively by determining the fraction share of carbides on the cross-section of clads produced at different energy input, as shown in Figure 8b.
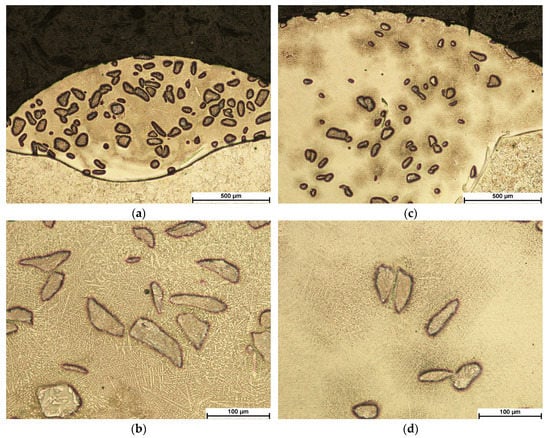
Figure 7.
Microstructure of the comparative stringer beads LC2 and LC4 produced by laser cladding of experimental composite NiCrBSi/WC + W2C powder; (a,b) view of the entire single clad and the middle region respectively (laser output power 1.0 kW, scanning speed 300 mm/min, energy input 120 J/mm); and (c,d) view of the entire clad layer and the middle region of the clad respectively (laser output power 2.0 kW, scanning speed 300 mm/min, energy input 240 J/mm).
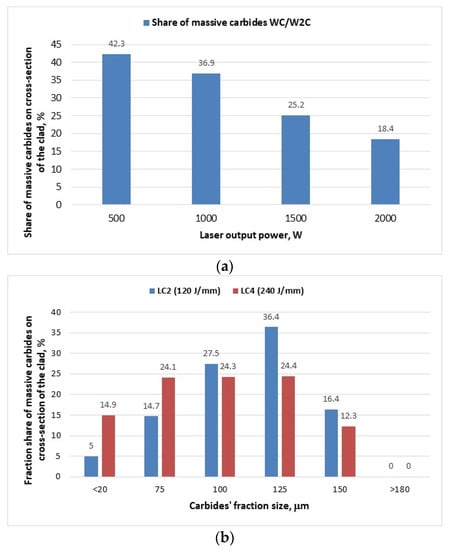
Figure 8.
Influence of laser output power during the process of laser cladding of experimental composite NiCrBSi/WC + W2C powder on the share of massive carbides relative to the matrix (a) and the fraction share of particles (WC-based carbides) on the cross-section of the clads produced at different energy inputs (b).
As can be concluded from Figure 8b, the share of massive carbides fractions with maximum sizes in the range of 100 ÷ 150 µm is clearly greater in the case of the clad LC2, produced at lower energy input (120 J/mm), than for the clad LC4, produced at maximum energy input. The share of the massive carbides fraction with a size of 125 µm for the clad LC2 was 36.4%, while for the clad LC4 this was just 24.4%, Figure 8b. These observations confirm that with the increase in energy input, the intensity of carbides disintegration and dissolution also increases, which means that their fraction size in the clad also decreases. A closer examination of the microstructure in the regions between massive carbides (matrix) of both analysed clads (LC2 and LC4) reveals the presence of dendrites that reaching more than 100 µm in length, Figure 7b,d.
However, the dendritic microstructure of the matrix in the case of the clad LC4 is more fine-grained than the matrix of the clad LC2 (energy input 120 J/mm), despite the fact that the clad LC4 was produced with higher energy (240 J/mm). The explanation for this phenomenon may be the difference in the chemical composition of the matrix caused by both the higher dilution and higher degree of dissolution of WC carbides in the melt pool during the cladding process, which then enriched the metal matrix with carbon and tungsten. In addition, the growth of dendrites in the matrix of the LC4 clad can also be inhibited by the precipitation of fine dispersion carbides. However, it was not possible to confirm the presence of such precipitations on the optical micrographs at moderate magnifications, Figure 7b,d.
The comparative SEM micrographs of clads LC2 and LC4 are presented in Figure 9. Additionally, the EDS spectra with quantitative results taken from different regions of the clads are presented. In turn, the XRD patterns taken from the steel substrate and the comparative clads are presented in Figure 10. The SEM micrographs at higher magnifications confirm the previous findings regarding differences in matrix morphology in both analysed clads, Figure 9a,e. The XRD spectra, as well as the results of EDS analysis of the massive particles, indicate the presence of eutectic WC + W2C tungsten carbides in both of the analysed clads, as expected, Figure 10, Table 4.
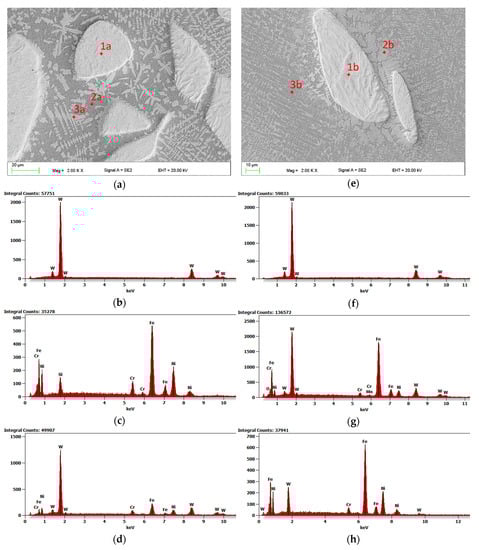
Figure 9.
SEM micrographs of the comparative stringer beads produced by laser cladding of experimental composite NiCrBSi/WC + W2C powder: (a) at laser output power 1.0 kW, energy input 120 J/mm; (e) at laser output power 2.0 kW, energy input 240 J/mm, and representative EDS spectra taken from different regions; (b–d) and (f–h).
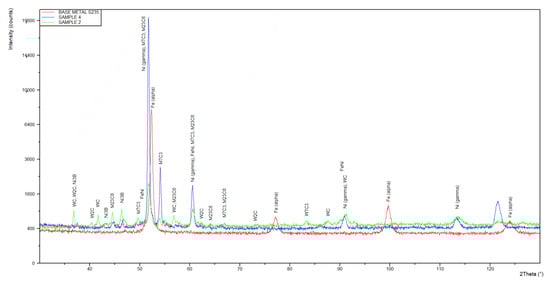
Figure 10.
XRD patterns of the comparative coatings produced by laser cladding of experimental composite NiCrBSi/WC + W2C powder.
As can be seen in Figure 10, there are clear peaks from the γ-Ni for both clads, as the main component of the metal matrix. However, the results of EDS analysis taken from the regions of matrix (grey regions in Figure 9a,e; points 2a and 3b) indicate the presence of primary γ-(Fe,Ni) solid solution. Additionally, the EDS results of the matrix region of the clad LC4 indicate the presence of MC carbides. This may be related to its having a more fine-grained structure compared to the clad LC2. Therefore, the EDS analysis shows average results, also from regions of fine carbides, perhaps located under the tested surface. In turn, the EDS analysis from the regions of dendrites in the matrix of the LC2 clad (light grey dendrites in the matrix) indicates the presence of Ni/Ni3B eutectic and M2C carbides, Figure 9, Table 4. Meanwhile, the EDS results obtained from the of dendrites in the matrix of the LC4 clad (light grey dendrites in the matrix) indicate the presence of primary γ-(Fe,Ni) and M2C carbides, which is related to the much higher degree of dilution of this clad (37.5%) and affects the chemical and phase composition of the matrix, Figure 9, Table 4.
3.4. Hardness Distribution
The profiles of hardness distribution were determined on the cross-section of the stringer beads along the symmetry axis as shown Figure 11. A relatively large load of 5 N was chosen for the Vickers tests to provide a large area of impression on the composite clad. This approach makes it possible to determine the average hardness value of the matrix and reinforcing particles, avoiding a large scatter of results coming from relatively soft metal matrix and hard carbides.
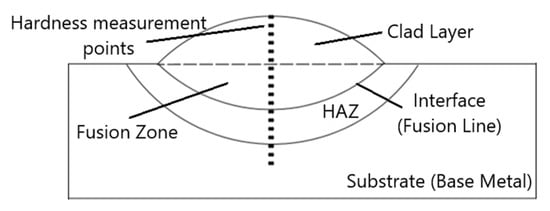
Figure 11.
Scheme of hardness measurements on the cross-section of a single stringer bead, Figure 12.
However, the profiles of Vickers HV0.5 hardness presented in Figure 12 show a clear difference in values of hardness and profile distribution for the individual clads produced with different laser output power levels. The highest value of hardness, of around 860HV0.5, was determined for the clad LC2 in the under-surface region. The average hardness in the clad LC2 was also higher than in the other clads. The hardness in under surface region for the LC1 clad was around 660HV0.5, and thus significantly lower than the value determined for LC2 clad. However, in the case of composite materials with reinforcing particles, hardness is not a direct indicator of wear resistance. The lowest hardness of the LC1 clad may be related to the lowest value of dilution (5.1%), and thus the original properties of the Ni-based matrix, providing higher plasticity and lower hardness. In turn, in the case of the LC2 clad, the dilution rate and the extent of carbide dissolution is clearly greater, so the metal matrix is enriched by alloying elements (W,C) and contains more carbide precipitations.
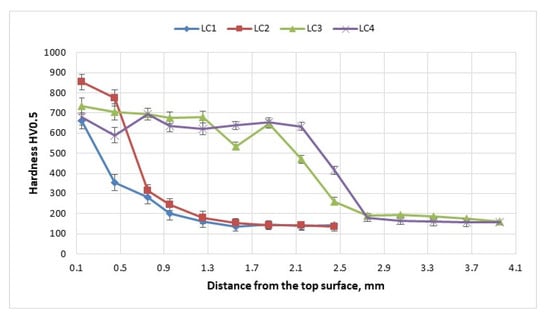
Figure 12.
Hardness distribution on cross-sections of the representative clad layers produced by laser cladding of experimental composite NiCrBSi/WC + W2C powder with different processing parameters (Table 2).
In the case of clads of greater thickness (LC3 and LC4), the hardness on the cross-section remains at a similar level, at around 620 ÷ 700 HV0.5, Figure 12. On the other hand, in the HAZ region, there is a steady decrease in hardness until it reaches the hardness of the substrate, which is associated with changes in the microstructure in HAZ as a result of the thermal cycle of the laser cladding process. However, microstructure change in the HAZ of the mild steel substrate (S235) is not the subject of the study.
3.5. Tribological Tests
Although the main purpose of this research is not a comprehensive analysis of the wear mechanisms of the coatings, basic comparative tests of tribological characteristics of the coatings produced at significantly different parameters were performed at a normal load of 20 N and a sliding speed of 0.157 m/s. The volume loss of the tested coatings was determined by measuring the cross-section area of wear track profiles on three planes around the circumference of the wear tracks. All the values presented in the graphs are mean values taken from at least three individual measurements.
Comparison of the wear tracks for representative coatings produced by laser cladding at the lower laser output power of 1000 W (energy input 120 J/mm) and at double that laser output power, 2000 W (energy input 240 J/mm), are shown in Figure 13. It is planned to present wider range of tribological test results and analysis of wear mechanisms in subsequent publications. As can be seen in Figure 13, the wear track of the sample LC2 produced at lower energy input shows a clearly lower width, compared to the width of a wear track of the sample LC4 produced at double the energy input. In turn, the volume loss of the coating LC2 was the lowest (0.134 mm3) among the tested samples, as shown in Figure 14a. For comparison, the mean volume loss of the sample LC3 was 0.225 mm3 and 0.283 mm3 for the sample LC4.
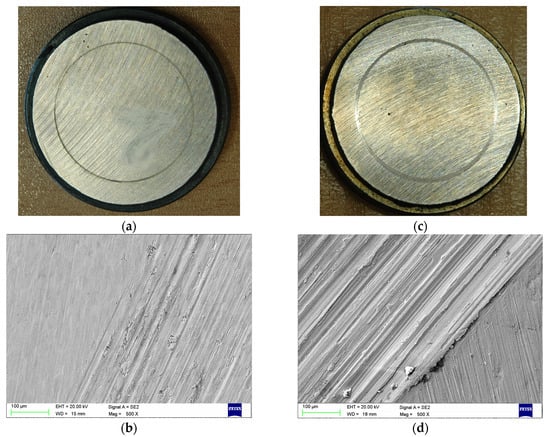
Figure 13.
A view of the discs after the tribological ball-on-disc wear tests and SEM micrographs of wear tracks; (a,b) the disc with a coating LC2 type, and (c,d) the disc with a coating LC4 type (Table 2).
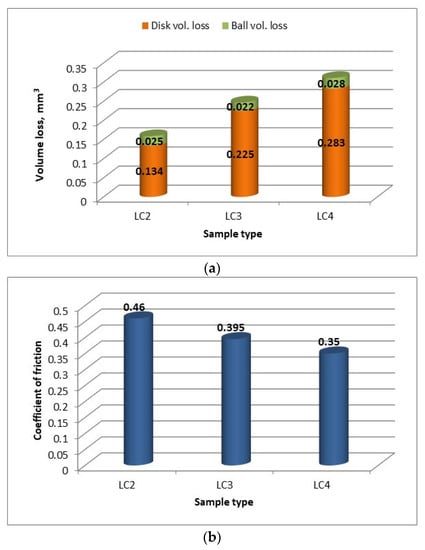
Figure 14.
Volume loss of the counter body steel ball and the disc specimens with coatings made by laser cladding of NiCrBSi/WC + W2C powder with different processing parameters (Table 3) after sliding for a distance of 188.4 m at a normal load of 30 N (a); and comparison of the coefficient of friction of the disc specimens sliding with a steel ball during ball-on-disc wear tests (b).
Lower volume loss of the sample means higher wear resistance under the dry sliding conditions of the experiment. These differences in wear resistance are directly related to the share of massive carbides in the matrix of the coatings produced at different parameters, especially the different levels of energy input, as shown in Figure 8b. The share of massive eutectic carbides WC+W2C in the NiCr-based matrix of the coating LC2 (energy input 120 J/mm) was approximately 37%, while in the case of the coating LC4 (energy input 240 J/mm), this figure was just 18.4%, Figure 8a. Therefore, based on the result of tribological tests, it can be concluded that the wear resistance of the composite coatings NiCrBSi/WC + W2C is proportional to the content of massive carbides (eutectic WC + W2C) in the matrix.
An interesting relationship was also found in the case of the ball volume loss. The volume loss of the counterface material of the steel ball was not directly proportional to the volume loss of the disc samples, as can be seen in Figure 14a. An explanation for this phenomenon can be found in Figure 14b, which shows the mean values of coefficient of friction of the disc specimens sliding with a steel ball during ball-on-disc tests. As can be seen, the coefficient of friction determined for the sample LC2, with the coating produced at low laser output power and thus low energy input (120 J/mm), has the highest value, at 0.46, Figure 14b. In turn, the coefficient of friction decreases for successive samples with coatings produced at higher energy input. This phenomenon can be attributed to the share of carbides (eutectic WC + W2C) in the coatings, whose coefficient of friction is higher than that of the NiCrBSi metal matrix. Therefore, the higher the share of massive carbides in the coatings, the higher the coefficient of friction, Figure 14b. In turn, the wear resistance of tungsten carbides is significantly higher than that of the NiCrBSi metallic matrix. Therefore, a higher proportion of carbides in the coating provides a higher wear resistance of this composite coating.
An observation of the wear tracks of the discs on SEM micrographs indicated that the wear mechanism was combined adhesion and abrasion in general. However, the surface wear of coating LC2 exhibits shallow ploughed grooves occupying most of the wear track area. The wear resistance of the sample LC2 was the highest. Additionally, some areas of steel debris pressed into the wear track of the sample LC2 may be observed, Figure 13b. In turn, the wear track on the surface of the analysed coating LC4, produced at the highest laser output power and lower wear resistance, showed deeper and wider ploughed grooves, which indicate more severe abrasive wear, Figure 13b. Some evident traces of steel debris pressed into the wear track and pulled along the grooves can also be observed. However, there were no observed clear craters across the wear track or plastically deformed regions of the substrate for both tested samples with composite coatings.
4. Conclusions
Laser cladding using a solid-state Yb:YAG disk laser and the experimental powder composed of NiCrBSi matrix with the addition of 65 wt.% reinforcing hard particles of eutectic WC + W2C was demonstrated. The influence of the laser cladding conditions of the geometry, microstructure and tribological characteristic of clads was studied. The share of massive tungsten carbides was 42% for the clad produced with minimum energy input, dropping to only 18.4% for the clad produced with maximum energy input. It was found that the energy input of the laser cladding and the dilution rate affect not only the structure of the composite coating, especially the share of massive eutectic WC+W2C tungsten carbides in the coating, but also the microstructure of the metal matrix. The matrix consists mainly of γ-(Fe,Ni) solid solution. However, depending on the energy input and dilution rate, the dendritic carbides precipitations (MC, M2C) and Ni/Ni3B eutectic are also present in different proportions.
The hardness of the coatings ranged from 660HV0.5 to 860HV0.5. However, the mean hardness of the composite coatings is not an indicator of wear resistance. It was found that the wear resistance of the composite coatings is proportional to the content of massive carbides (eutectic WC + W2C) in the matrix.
The highest wear resistance was shown by the coating produced at the lowest energy input within the analysed range, and the lowest dilution, and thus the highest share of tungsten carbides.
Author Contributions
Conceptualisation, methodology, investigation, formal analysis, validation, supervision, writing—review, A.L.; editing, elaboration of results, microstructure analysis, A.K.-L. All authors have read and agreed to the published version of the manuscript.
Funding
This research received no external funding.
Institutional Review Board Statement
Not applicable.
Informed Consent Statement
Not applicable.
Data Availability Statement
Not applicable.
Acknowledgments
The authors thank W. Kwaśny for his help with the phase analysis, W. Pakieła for his help with the SEM observations, M. Żuk for his help in refreshing the samples, and all who assisted in the laboratory tests.
Conflicts of Interest
The authors declare no conflict of interest.
References
- Kusinski, J.; Kac, S.; Kopia, A.; Radziszewska, A.; Rozmus-Górnikowska, M.; Major, B.; Major, L.; Marczak, J.; Lisiecki, A. Laser modification of the materials surface layer—A review paper. Bull. Pol. Acad. Sci.-Tech. 2012, 60, 711–728. [Google Scholar] [CrossRef]
- Lisiecki, A. Tribology and surface engineering. Coatings 2019, 9, 663. [Google Scholar] [CrossRef]
- Lisiecki, A. Development of laser welding and surface treatment of metals. Materials 2022, 15, 1765. [Google Scholar] [CrossRef] [PubMed]
- Lisiecki, A. Titanium matrix composite Ti/TiN produced by diode laser gas nitriding. Metals 2015, 5, 54–69. [Google Scholar] [CrossRef]
- Lisiecki, A.; Kurc-Lisiecka, A. Erosion wear resistance of Titanium-Matrix Composite Ti/TiN produced by diode-laser gas nitriding. Mater. Technol. 2017, 51, 29–34. [Google Scholar] [CrossRef]
- Kołodziejczak, P.; Golański, D.; Chmielewski, T.; Chmielewski, M. Microstructure of rhenium doped Ni-Cr deposits produced by laser cladding. Materials 2021, 14, 2745. [Google Scholar] [CrossRef] [PubMed]
- Hulka, I.; Utu, I.D.; Avram, D.; Dan, M.L.; Pascu, A.; Stanciu, E.M.; Roat, I.C. Influence of the laser cladding parameters on the morphology, wear and corrosion resistance of WC-Co/NiCrBSi composite coatings. Materials 2021, 14, 5583. [Google Scholar] [CrossRef] [PubMed]
- Vostřák, M.; Houdková, S.; Bystrianský, M.; Česánek, Z. The influence of process parameters on structure and abrasive wear resistance of laser clad WC-NiCrBSi coatings. Mater. Res. Express 2018, 5, 096522. [Google Scholar] [CrossRef]
- Amado, J.; Tobar, M.; Yáñez, A.; Amigó, V.; Candel, J. Crack Free Tungsten Carbide Reinforced Ni(Cr) layers obtained by laser cladding. Phys. Procedia 2011, 12, 338–344. [Google Scholar] [CrossRef]
- Makarov, A.; Korobov, Y.; Soboleva, N.; Khudorozhkova, Y.; Vopneruk, A.; Balu, P.; Barbosa, M.M.; Malygina, I.; Burov, S.; Stepchenkov, A. Wear-resistant nickel-based laser clad coatings for high-temperature applications. Lett. Mater. 2019, 9, 470–474. [Google Scholar] [CrossRef]
- Wei, Z.; Hua, Y.J.; Li, Z.Q.; Zhi, K.F. Microstructure and mechanical characteristic of Nano-WC composite coating prepared by laser cladding. SSP 2006, 118, 579–584. [Google Scholar] [CrossRef]
- Leech, P.W.; Li, X.S. Comparison of abrasive wear in diamond composites and WC-based coatings. Wear 2011, 71, 1244–1251. [Google Scholar] [CrossRef]
- Radionova, L.V.; Samodurova, M.N.; Sarafanov, A.E.; Bykov, V.A.; Glebov, L.A.; Pashkeev, K.Y. Elevation of the wear resistance of roller dies for the production of wires from titanium alloys. Metallurgist 2021, 64, 1188–1197. [Google Scholar] [CrossRef]
- Bergant, Z.; Batič, B.Š.; Felde, I.; Šturm, R.; Sedlaček, M. Tribological properties of solid solution strengthened laser cladded NiCrBSi/WC-12Co metal matrix composite coatings. Materials 2022, 15, 342. [Google Scholar] [CrossRef] [PubMed]
- Lisiecki, A.; Ślizak, D. Hybrid laser deposition of Fe-based metallic powder under cryogenic conditions. Metals 2020, 10, 190. [Google Scholar] [CrossRef]
- Tomków, J.; Czupryński, A.; Fydrych, D. The abrasive wear resistance of coatings manufactured on high-strength low-alloy (HSLA) offshore steel in wet welding conditions. Coatings 2020, 10, 219. [Google Scholar] [CrossRef]
- Lisiecki, A.; Ślizak, D. Hybrid laser deposition of composite WC-Ni layers with forced local cryogenic cooling. Materials 2021, 14, 4312. [Google Scholar] [CrossRef] [PubMed]
- Poloczek, T.; Lont, A.; Górka, J. The structure and properties of laser-cladded inconel 625/TiC composite coatings. Materials 2023, 16, 1265. [Google Scholar] [CrossRef] [PubMed]
Disclaimer/Publisher’s Note: The statements, opinions and data contained in all publications are solely those of the individual author(s) and contributor(s) and not of MDPI and/or the editor(s). MDPI and/or the editor(s) disclaim responsibility for any injury to people or property resulting from any ideas, methods, instructions or products referred to in the content. |
© 2023 by the authors. Licensee MDPI, Basel, Switzerland. This article is an open access article distributed under the terms and conditions of the Creative Commons Attribution (CC BY) license (https://creativecommons.org/licenses/by/4.0/).