Abstract
Seed coating is used to improve seed handling or target the delivery of different active ingredients: (micro)nutrients and biofortifying minerals, plant biostimulants, and plant protection compounds. One type of coating is based on using film-forming biopolymers. The coating could be applied using various equipment, including the Wurster fluidized-bed coater. Deterministic models have been proposed to predict the coating process performance in the Wurster fluidized-bed coater. However, such deterministic models do not closely match real behavior. This paper proposes a statistical model approach to optimize the mung bean seed coating with a mixture of alginate/glycerol in a Wurster fluidized bed coating process. The process was optimized for a specific case through a factorial experimental design for the following parameters: the liquid flow rate, the mass of seeds, the backpressure period, and the nozzle pressure. The statistical analysis was done using Design-Expert 11®. The formed film was analyzed by scanning electron microscopy. Finally, the germination percentage (GP), germination energy (GE), germination rate (GR), mean germination time (MGT), and vigor index (VI) were determined for the coated mung bean seeds. An algorithm is proposed to identify the optimal coating conditions in a bottom-spray Wurster fluidized-bed coater for any coating solution or seed pair.
1. Introduction
The Wurster coating process was invented in the 1950s by Dr. Dale E. Wurster when he was working with the Wisconsin Alumni Research Foundation (WARF) at the University of Wisconsin. His initial invention was to apply coatings to particles and tablets using an air-suspension chamber and was dedicated to the pharmaceutical industry [1,2]. Nowadays, the Wurster process is applied in several other industries because it is one of the most efficient ways of coating tablets, particles, granules, seeds, etc., which makes it very well suited to reduce costs and consumption of raw materials, especially when the active ingredients are expensive [3]. This technology is found in three forms: the bottom, top, or side spraying processes [2,4].
One of the earliest mentions of coating seeds to improve crop performance in agricultural conditions is from 1965, when clover seed inoculation was improved and plant growth was possible in the dry Australian climate [5]. Since then, the seed coating process has been used in many different situations to improve plant growth or other important aspects of agricultural performance [6,7,8]. In each case, the focus was on obtaining an agricultural function: plant biostimulant effects [9,10,11,12], plant protection against pathogens [13,14,15], insects [16,17,18], weed control [18,19], or improving crop performance in water deficit conditions [20]. All studies involving seed coating for agricultural applications aim at finding the right combination of the active compound and film-forming agent to produce a beneficial effect on a target seed and solve specific problems or needs.
The use of environmentally friendly polymers and/or biopolymers for seed coating has been investigated for decades [21,22,23,24,25]. Hydrocolloids are ideal as film-forming agents, with the added benefit of becoming hydrogels that are not washed away by rain [20,26]. Alginate and chitosan are the most widely used as film-forming agents in seed coating applications, either separately or in combination [24,27,28,29,30,31]. These two polysaccharides from marine sources have both film-forming properties and additional beneficial effects as biostimulant agents [32].
The Wurster seed coating process can be run successfully if the air fluidization is stable and the thermal conditions inside the unit are adequately controlled in accordance with the evaporation rate and the vaporization enthalpy of the coating liquid while reducing the mechanical and thermal stress on the seeds. Such a combination of parameters makes the process complex, which can be tedious to optimize and control at both lab and industrial levels. Most approaches to describing this process are based on simulations, including deterministic models that are slow to build due to the high number of parameters that need to be determined precisely [3,4,33,34,35]. In practical terms, each combination of seed, coating agent, and active ingredients must be understood in a very detailed manner to be optimally run. Process optimization in seed coating applications using statistical models has been attempted; however, the optimized process did not cover the Wurster seed coating process [36,37,38].
Alginate coating on mung beans has several benefits for the food industry and agriculture. The food industry benefits are related to the production of mung bean sprouts with a lower enteropathogen contamination risk and enhanced content of phytochemicals. In the last decades, the consumption of mung bean (Vigna radiata L.) and mung bean sprouts/microgreens has increased significantly, driven by the health benefits of the phytochemicals from this Asian pulse. The health benefits of mung bean consumption are high because the germination process significantly increases the antioxidant content of the edible parts. However, several outbreaks of enteropathogens (Salmonella spp., Shiga toxin-producing Escherichia coli -STEC, e.g., O157:H7, and Listeria monocytogenes) have been related to mung bean sprout consumption [39,40,41]. Recently, it was demonstrated that seed coating with alginate film significantly reduces the population of the inoculated Listeria monocytogenes V7 and Salmonella enterica ser. typhimurium ATCC 13311 on alfalfa seeds and sprouts [42]. Besides the antimicrobial effects, the alginate film releases oligosaccharides elicitors [43,44,45]. The application of elicitors to seeds increases the accumulation of bioactive compounds in sprouts [46,47], including in mung bean sprouts [48]. This is due to the activation of the metabolic pathway related to plant defense that leads to the accumulation of bioactive compounds, including polyphenols [49,50].
Alginate and its oligosaccharides activate several plant metabolic pathways: the salycilic acid-dependent pathway for plant defense against plant pathogens; the abscisic acid-dependent pathway for increased tolerance to abiotic stress; nutrient and water use efficiency, leading to enhanced growth and development due to stimulation of photosynthesis and increased gibberellins and auxin contents [51]. Therefore, the alginate coating of the mung bean could also have plant biostimulant effects, including enhanced tolerance to abiotic stress and improved accumulation of bioactive compounds, besides the antimicrobial activity. The biostimulant effects of alginate/seaweed extracts enriched in polysaccharides on mung beans have already been reported [52,53,54]. Alginate has been used in mung seed coating studies as well [55,56], related to the usual seed coating agricultural functions: plant biostimulation and plant protection against arthropods.
The goal of this study is to provide a rapid method of assessing the Wurster seed coating process performance with an alginate film, using statistical methods, further applied for process optimization. The integrity of the seeds and their viability following the coating process is demonstrated by statistically analyzed biological tests on the coated seeds.
The system proposed has a multifunctional role. The first role is related to the well-known ability of sodium alginate to act as a biostimulant or as a plant growth promoting agent, considering all related biological effects. The second role of sodium alginate is to act as a film-forming agent, modulated by glycerol, which acts as a plasticizer. Overall, the coating is proposed as an efficient delivery system for other active ingredients in future studies.
2. Materials and Methods
2.1. Materials and Equipment for Seed Coating
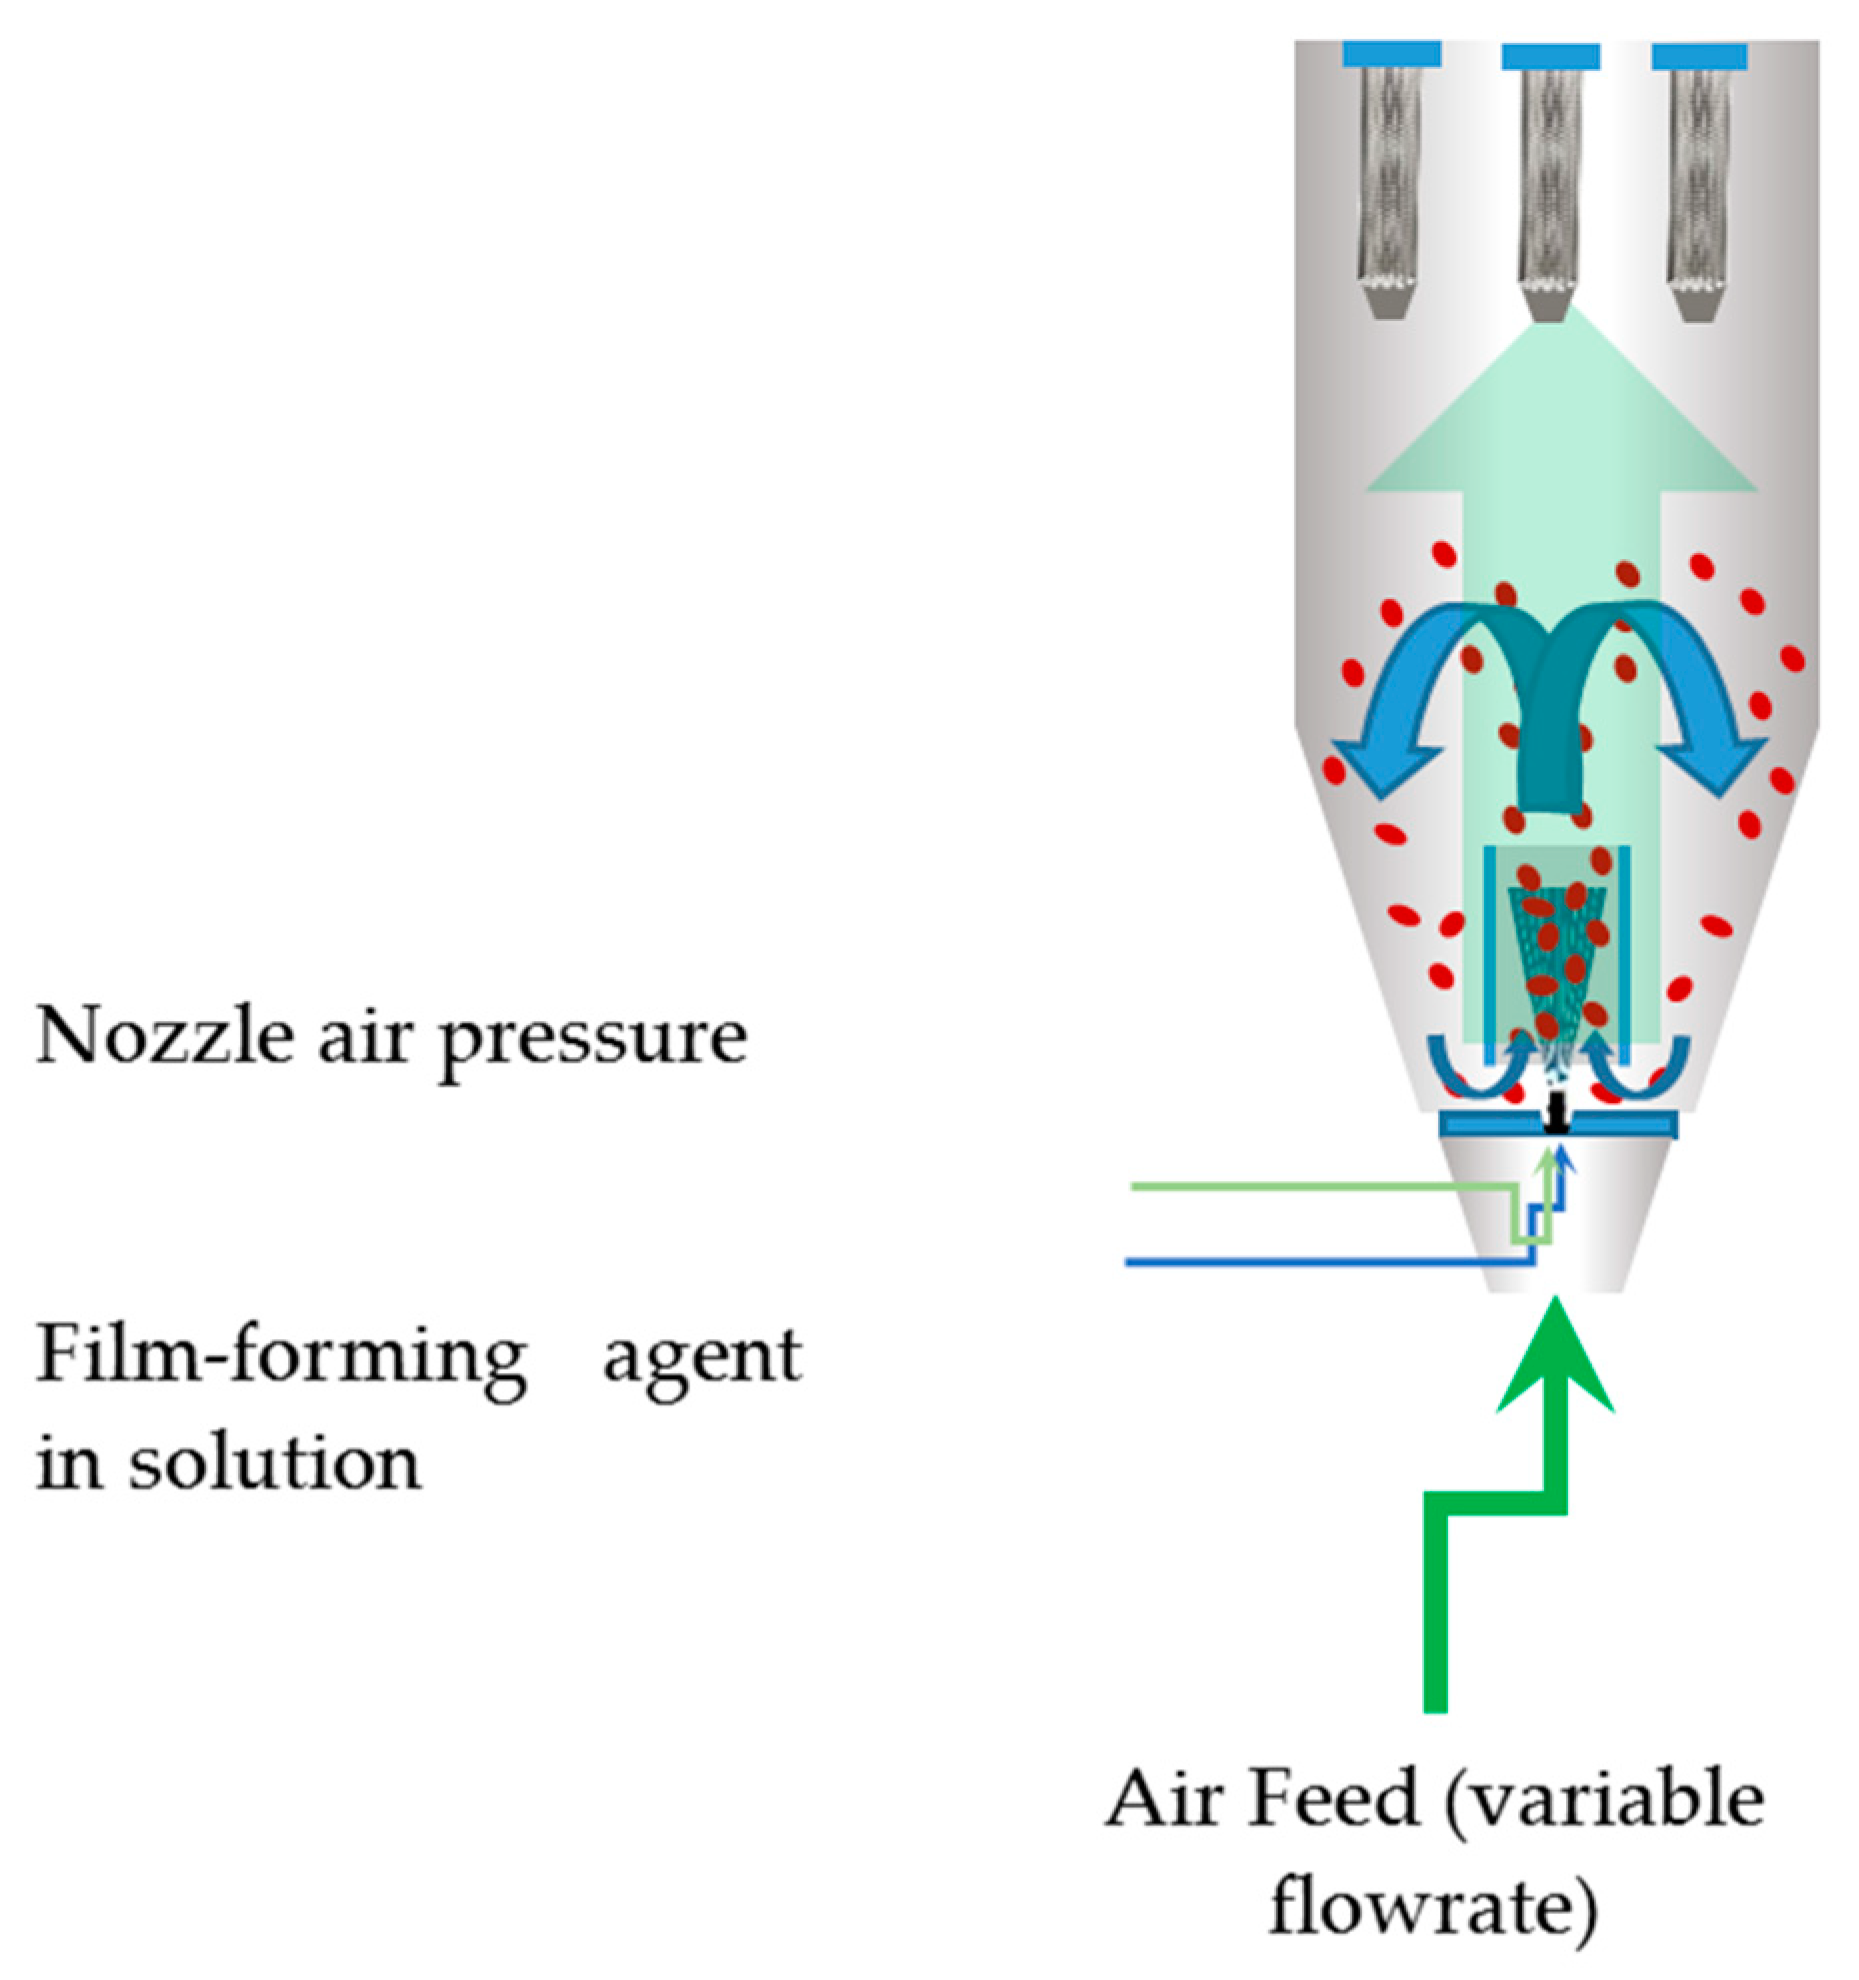
Sodium alginate and other chemicals were purchased from Sigma Aldrich (Merck Group, Darmstadt, Germany). Mung bean (V. radiata) seeds were supplied by a local distributor of Vilmorin (Vilmorin, La Ménitré, France) t. The seed coating process was carried out using a Mini Glatt fluidized bed lab unit (Glatt, Binzen, Germany), operated in the bottom spray coating mode. A manometer was mounted where the temperature sensor would go inside the chamber. Air was fed from a feed tank at a pressure of 10 atm and connected to two large oil-free compressors. A calibrated peristaltic pump was used to feed the coating solution. The Wurster coating process is graphically represented in Figure 1.
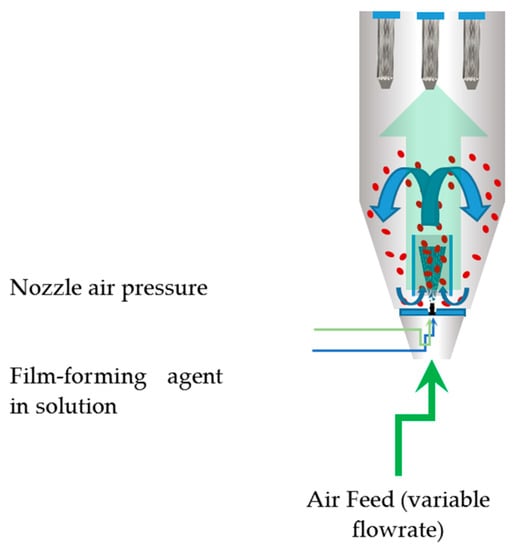
Figure 1.
Graphical representation of the Wurster coating process.
2.2. Optimization of Process Parameters
Four factors were considered for the reduced two-factor interactions in the two-level factorial design, namely: (1) the liquid flow rate, (2) the mass of seeds, (3) the backpressure period, and (4) the nozzle pressure. Table 1 gives the two levels for each factor that was considered for this plan.

Table 1.
Factor limits and coding.
The corresponding coding is presented in the last two columns. The dimensionless or orthogonal coding is done using Equation (1), where Fi is the coded value of factor i (where i can be A, B, C or D), Xi is the real or actual value of factor i, Xmed,i is the median value of factor i and ΔXi is the step of factor i (or distance from the median value to the limit values) [57].
The temperature of the fluidization air was kept constant at 40 °C. The liquid temperature was kept at room temperature (~25 °C). The concentration of sodium alginate and glycerol in the coating solution was also fixed at 10 g/L each.
Table 2 shows the experimental plan generated by Design-Expert 11 (Stat-Ease, Minneapolis, MN, USA) with a random order of experiments. The factor values are given in actual and coded units (the latter between the brackets).

Table 2.
Experimental plan with coded factor values in brackets.
Three response variables were considered: (1) the final relative pressure inside the unit, (2) the final time, and (3) the final volume of the coating solution introduced. Termination conditions were also defined: the maximum pressure was 0.9 bar, the maximum time was 1h, and the maximum volume of the coating solution was 100 mL. The optimum is found when pressure and time are minimal and the total volume of the coating solution is maximal.
2.3. Apparent Film Density Determination and Measurement of Seed Dimensions
A known volume of feed coating solution was added in five replicates to plastic trays and dried for 24 h at 60 °C in ventilated conditions (ED115 Dryer, Binder, Tuttlingen, Germany). From the formed film upon solution drying rectangle pieces of 6 mm × 30 mm dimensions were cut and weighted. The thickness of the film was measured. The apparent density of each piece of film was determined as the ratio between the mass and the apparent volume of the same piece of film. Three pieces were measured for each of the five replicate films to determine the mean apparent density of the sodium alginate/glycerol film.
The dimensions of ten uncoated mung seeds were measured as ellipsoids by determining the length (L), the height (H), and the width (W) using Image J from photos taken from above and from the sides of the seeds. An estimate of the mean value was made for the mean values of the whole batch. An estimate was made for L, H, and W. The same could not be done for the coated seeds considering the significant error in the measurements using this method. 20 seeds from each treatment were weighted individually.
The mean apparent density and the seed dimensions were used to model the actual thickness of the coating on the mung bean seeds.
2.4. Determination of Minimal Fluidization Air Flow/Air Speed
The minimal fluidization air flow was determined by identifying the flow rate at which a certain mass of seeds achieves stable fluidization. After loading the weighted mass of seeds, the air flow knob was turned until stable fluidization was observed. The measurement was done at no nozzle air pressure (Pnozzle = 0 bar) and at optimum nozzle pressure (Pnozzle = 1.2 bar). The measurements were done with no backpressure applied at 40 °C and with no liquid intake.
2.5. Seed Coating at Optimal Conditions
After determining the optimal parameters, 3 independent batches were produced using these parameters, with different final times (20 min, 1 h, and 3 h) and another three independent batches of seeds were treated in the same conditions but with distilled water introduced instead of the coating solution. The seed coating was carried out under optimum conditions. The relative pressure inside was measured using a manometer mounted on the exterior of the unit. The feed solution flask was kept on a fast-responding scale, which allowed to measure the coating solution intake in time.
2.6. Scanning Electron Microscopy (SEM)
Seeds from each batch were carefully cut with a scalpel knife longitudinally and applied to SEM stubs. The samples were analyzed using a TM4000 Tabletop SEM (Hitachi, Japan) at 15 kV. The backscattered electron (BSE) detector was used for all micrographs. The thickness of the coating was measured 20 times at random positions for each of the three samples, i.e., at 20 min, 1 h, and 3 h of processing time, in Image J.
2.7. Evaluation of the Quality of Coated Seeds
Ten Mung bean seeds of each experimental variant were placed on sterile gauze in Petri dishes of 60 mm diameter, to which 5 mL of sterile double-distilled water was added. Each variant was run in quadruplicate. The plates were placed in a growth chamber (ALGAETRON AG230, Photon Systems Instruments, Drásov, Czech Republic) with the following parameters: 8 h dark, 22 °C/16 h light, 26 °C cycle, 1340 μE.
Seed morphology was examined using a stereomicroscope (Optika SZM-2, Ponteranica, Italy) equipped with a digital camera (OptikamB16).
Seed germination was monitored at different time intervals, i.e., 24, 36, 48, and 72 h.
The germination percentage (GP, %) was calculated at 72 h using the following formula [58]:
The germination energy (GE, %) was determined at 1/2 of the time set for GP [59]:
For germination rate (GR, % day−1), and mean germination time (MGT, day) we used the following formulas [58]:
After 72 h, the radicle and hypocotyl lengths were determined using the ImageJ software [60] in order to calculate the vigor index (VI) by applying the following formula [58]:
The results were statistically analyzed by analysis of variance (one-way ANOVA) using the SPSS 21 software package (IBM, Armonk, NY, USA). The pairwise comparisons were done by Tukey HSD, which produced homogeneous subsets of the groups regarding significant differences.
2.8. The Mean Seed Volume and Mean Seed Density Estimated Using the Pycnometric Method
20 seeds selected at random were weighted on an analytical balance and placed inside a 25 mL volumetric flask. Water was added up to the 25 mL mark calibrated at 20 °C. The mass of added water was weighted on the same analytical balance and equivalates the volume of added water considering the density to be 1 g/mL. The mean seed volume was determined as the difference between 25 mL and the added volume of water, divided by 20. The measurement was done in triplicate. The simultaneous measurement of the seed mass and seed volume gives a measurement of the mean seed density.
3. Results
3.1. Optimization of Process Parameters
Table 3 shows the response variables, namely the final pressure, final time, and final volume for each experimental line out of the eight in the fractional design. The process limits were defined in relation to the response variables to specifically represent the process performance under various conditions. The final time condition was never reached since all experiments were stopped either because of the final volume condition or the final pressure condition. The final volume condition (exp. no. 3, 4, 6, and 7 in Table 3) indicated a positive outcome when it occurred, but an experiment stopped because a final pressure condition (exp. no. 1, 2, 5, and 8 in Table 3) is associated with a negative outcome in which the air filters clogged before the successful coating of the seeds occurred.

Table 3.
Experimental design and response variables.
Table 4 describes the p-values of all statistically significant terms corresponding to all three response variables. All models are strongly significant since the model p-values are lower than 0.0005 in all cases.

Table 4.
P-values of statistical models and significant terms for the three response variables.
The models explain a large part of the variation since the corresponding coefficients of determination (especially Adjusted R2 and Predicted R2) are higher than 0.9 for all response variables (Table 5). All significant terms identified are strongly significant with p-values lower than 0.01.

Table 5.
Coefficient of determination for each statistical model.
The results show that the final pressure depends on the liquid flow rate, the mass of seeds used, and the interaction term between them; the final time depends solely on the liquid flow rate; and the final volume depends on the liquid flow rate, the backpressure period, and the interaction term between the two.
Since the vaporization process depends on temperature, these two factors have an expected effect on the outcome of the experiment. However, by keeping them constant, the number of experiments was reduced considerably. The 40 °C temperature was chosen as an adequate temperature to maintain the viability of the seeds upon coating. This specific limitation explains the compromise made to not add it as a factorial term. The fluidization air flow (U) could be another independent factor. However, its value directly affects the seed fluidization conditions. If we assume that fluidization happens at minimal fluidization rate conditions, then the value of U is a direct consequence of the mass of seeds that are covered.
Table 6 shows model coefficients in coded terms for all significant terms in the case of each response variable.

Table 6.
Model coefficients in coded terms for each response variable.
A statistical model can be established for each response variable and can be represented equivalently as a function depending on the coded value of the corresponding significant factors. These functions are represented in Equations (7)–(9).
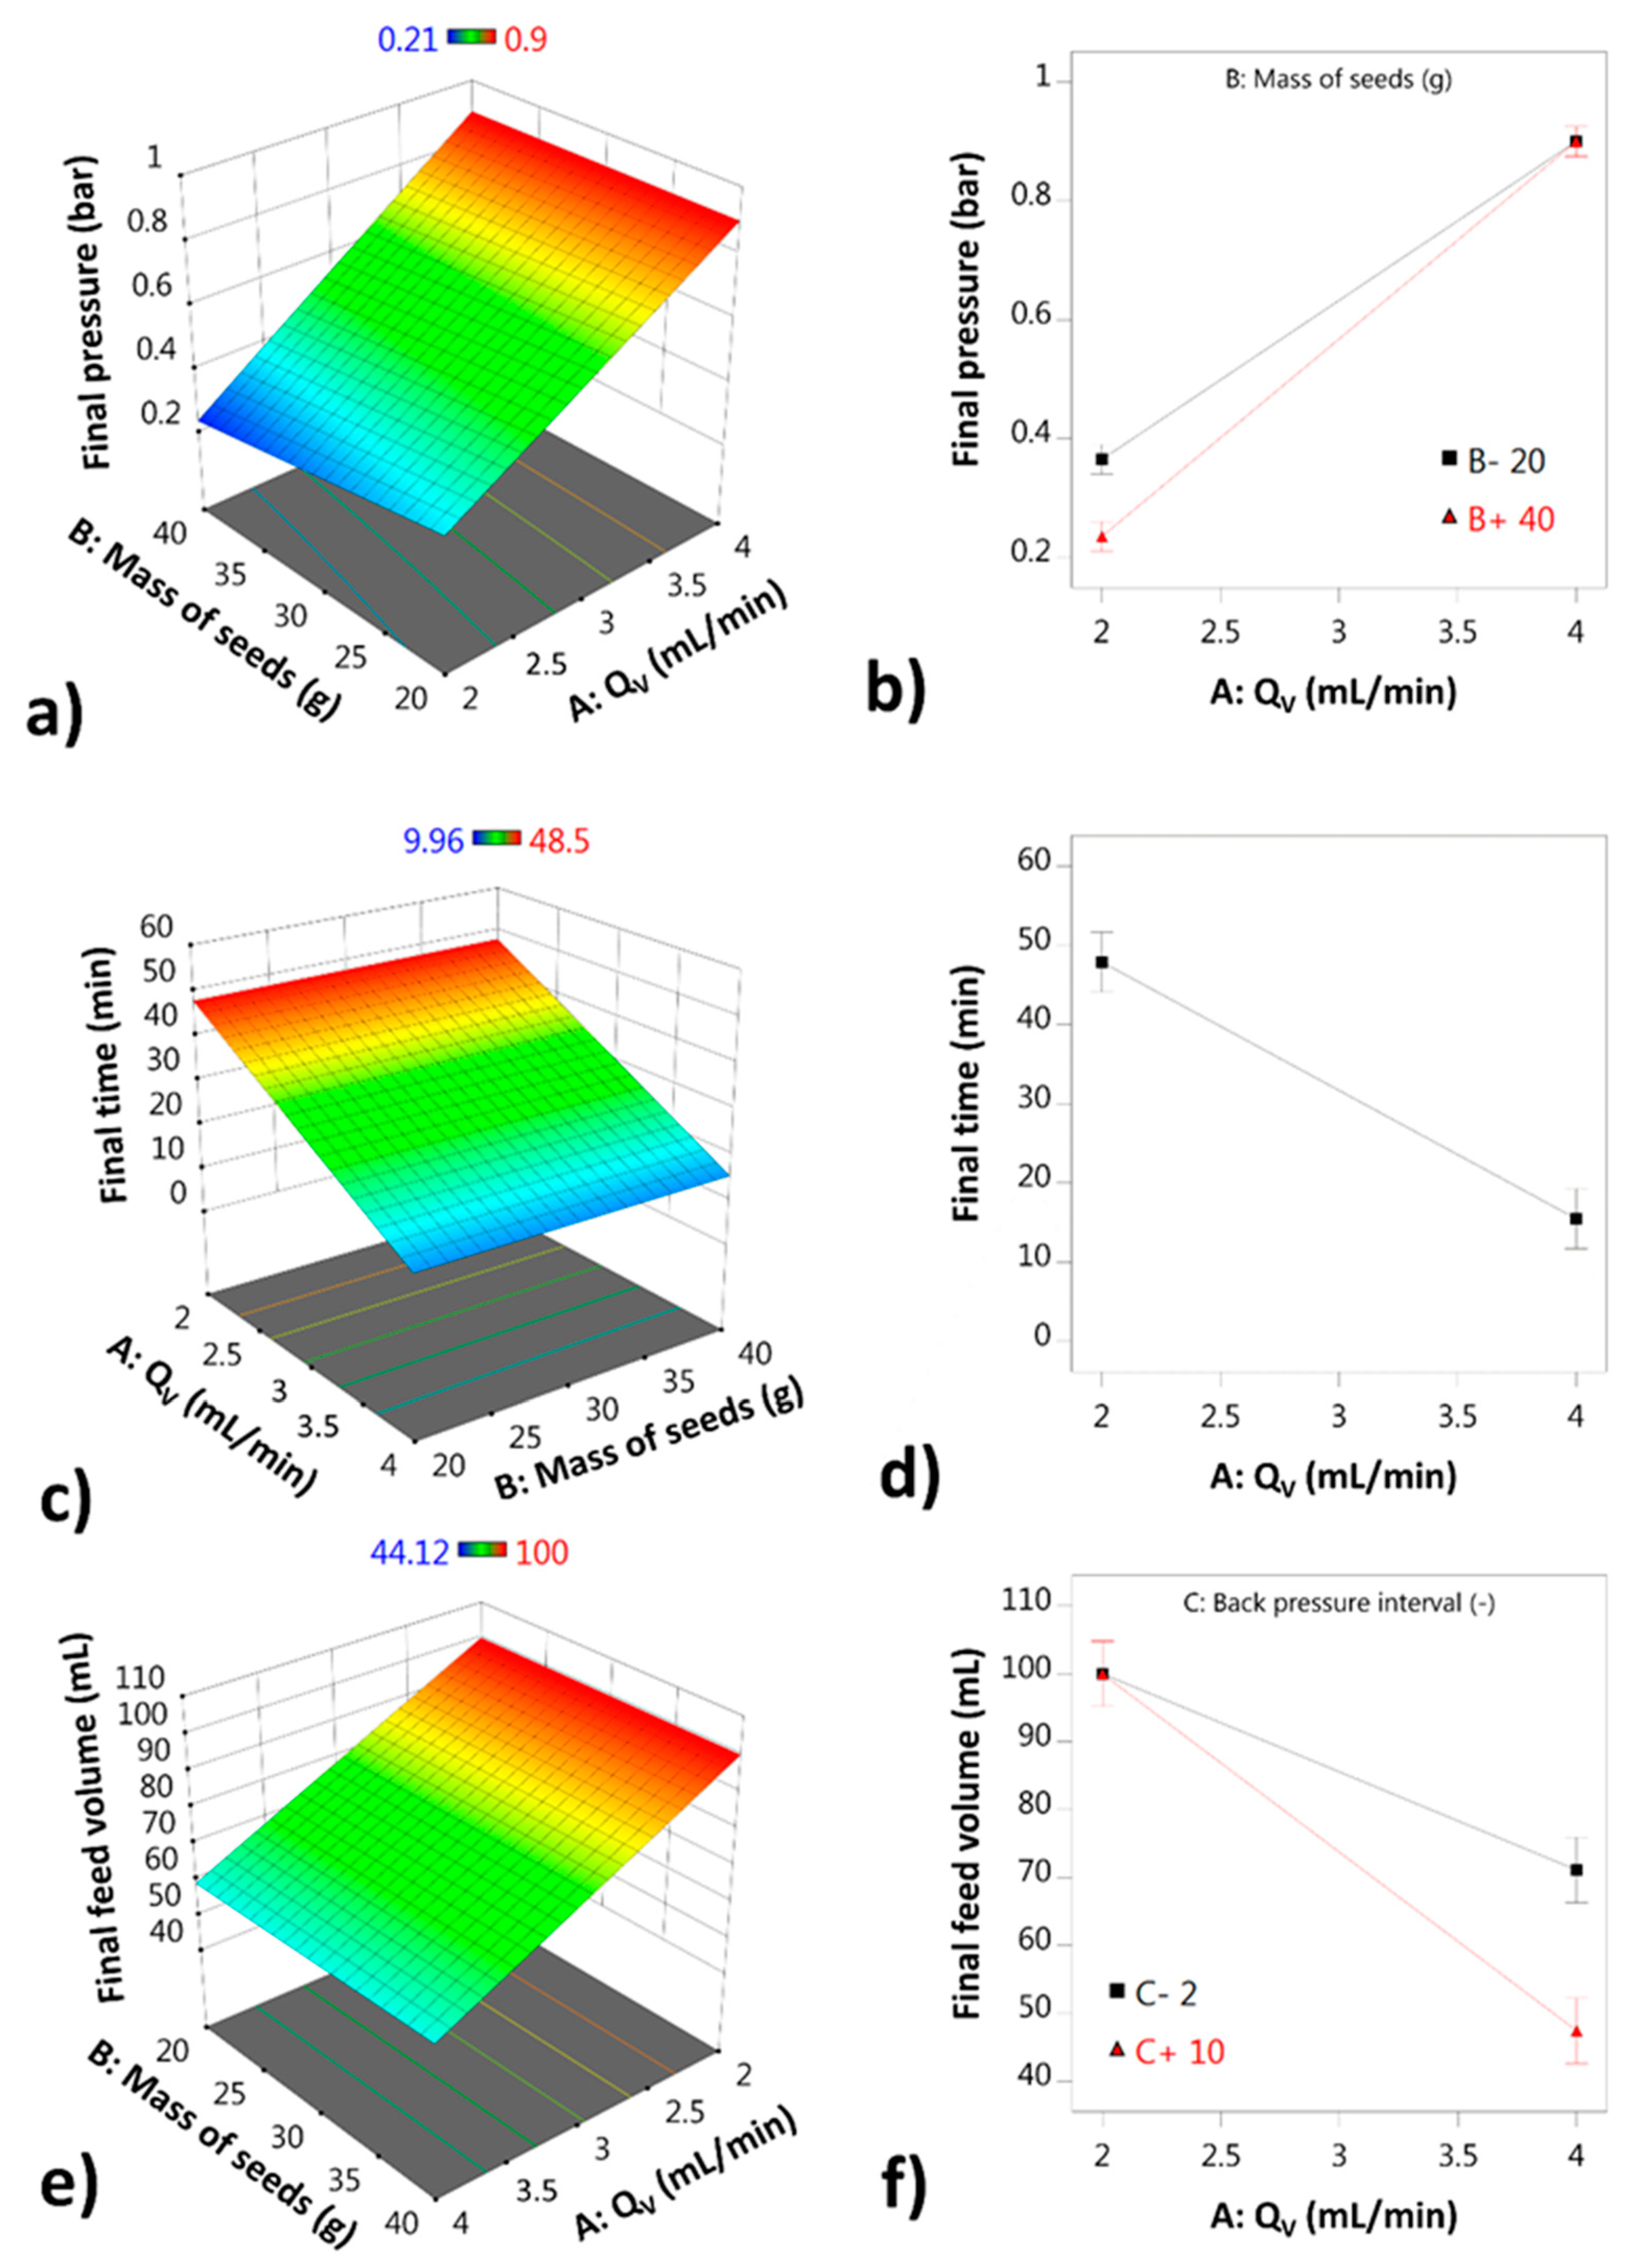
Figure 2a,c,e show the response surfaces in 3D, and the same statistical models are represented to the right in Figure 2b,d,f as interaction plots. The liquid flow rate has the strongest effect of all independent variables on all response variables. It is part of the interaction terms detected for the final pressure and the final time, and it is the only term which has a significant effect on the final time. The size and direction of the interaction terms give qualitative information about the process.
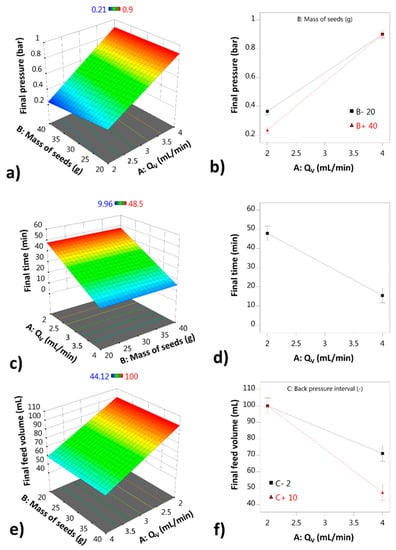
Figure 2.
Statistical models represented as response surfaces and interaction plots: (a) final pressure (3D); (b) interaction plot for the final pressure model; (c) final time (3D); (d) interaction plot for the final time model; (e) final feed volume (3D); (f) interaction plot for the final feed volume model.
For the AB interaction, the final pressure seems to be smaller if a larger mass of seeds is used, which suggests that the process works better in terms of air filter clogging if a sufficient quantity of seeds are fluidized. The other interaction term (AC), which affects the final feed volume, shows that the period of the backpressure application is most useful if a larger liquid flow rate is used. If the backpressure is applied more frequently (value of 2), the final volume improves in comparison to when the backpressure is used less frequently (value of 10) at Qv higher than 2 mL/min. At Qv of 2 mL/min, the backpressure does not have an impact within the interval tested.
The optimal conditions determined were a 2 mL/min liquid flow rate, a 1.2 bar nozzle pressure, a 10 s backpressure interval, and 100 g the mass of seeds.
3.2. Apparent Film Density and Seed Dimensions
Film density is an intensive property of the coating that can be measured accurately, and it is valid for the coating film on the seeds, which has microscopic dimensions. The experimental values for the apparent density of the film are given in Table 7. The mean value of the apparent density was determined as 1.19 ± 0.12 g·cm−3 (CI95).

Table 7.
Determining the apparent density of the dry sodium alginate/glycerol coating.
Besides the apparent density, the dimensions of the seeds are needed to estimate the seed coating thickness by measuring the volume of coated and uncoated seeds. The mean mass values could also give a measure of the yield of the coating process, which can be verified by SEM. However, the mean mass values are very close between the three coating time intervals, and it could be difficult to accurately determine the differences if only 20 seeds are measured.
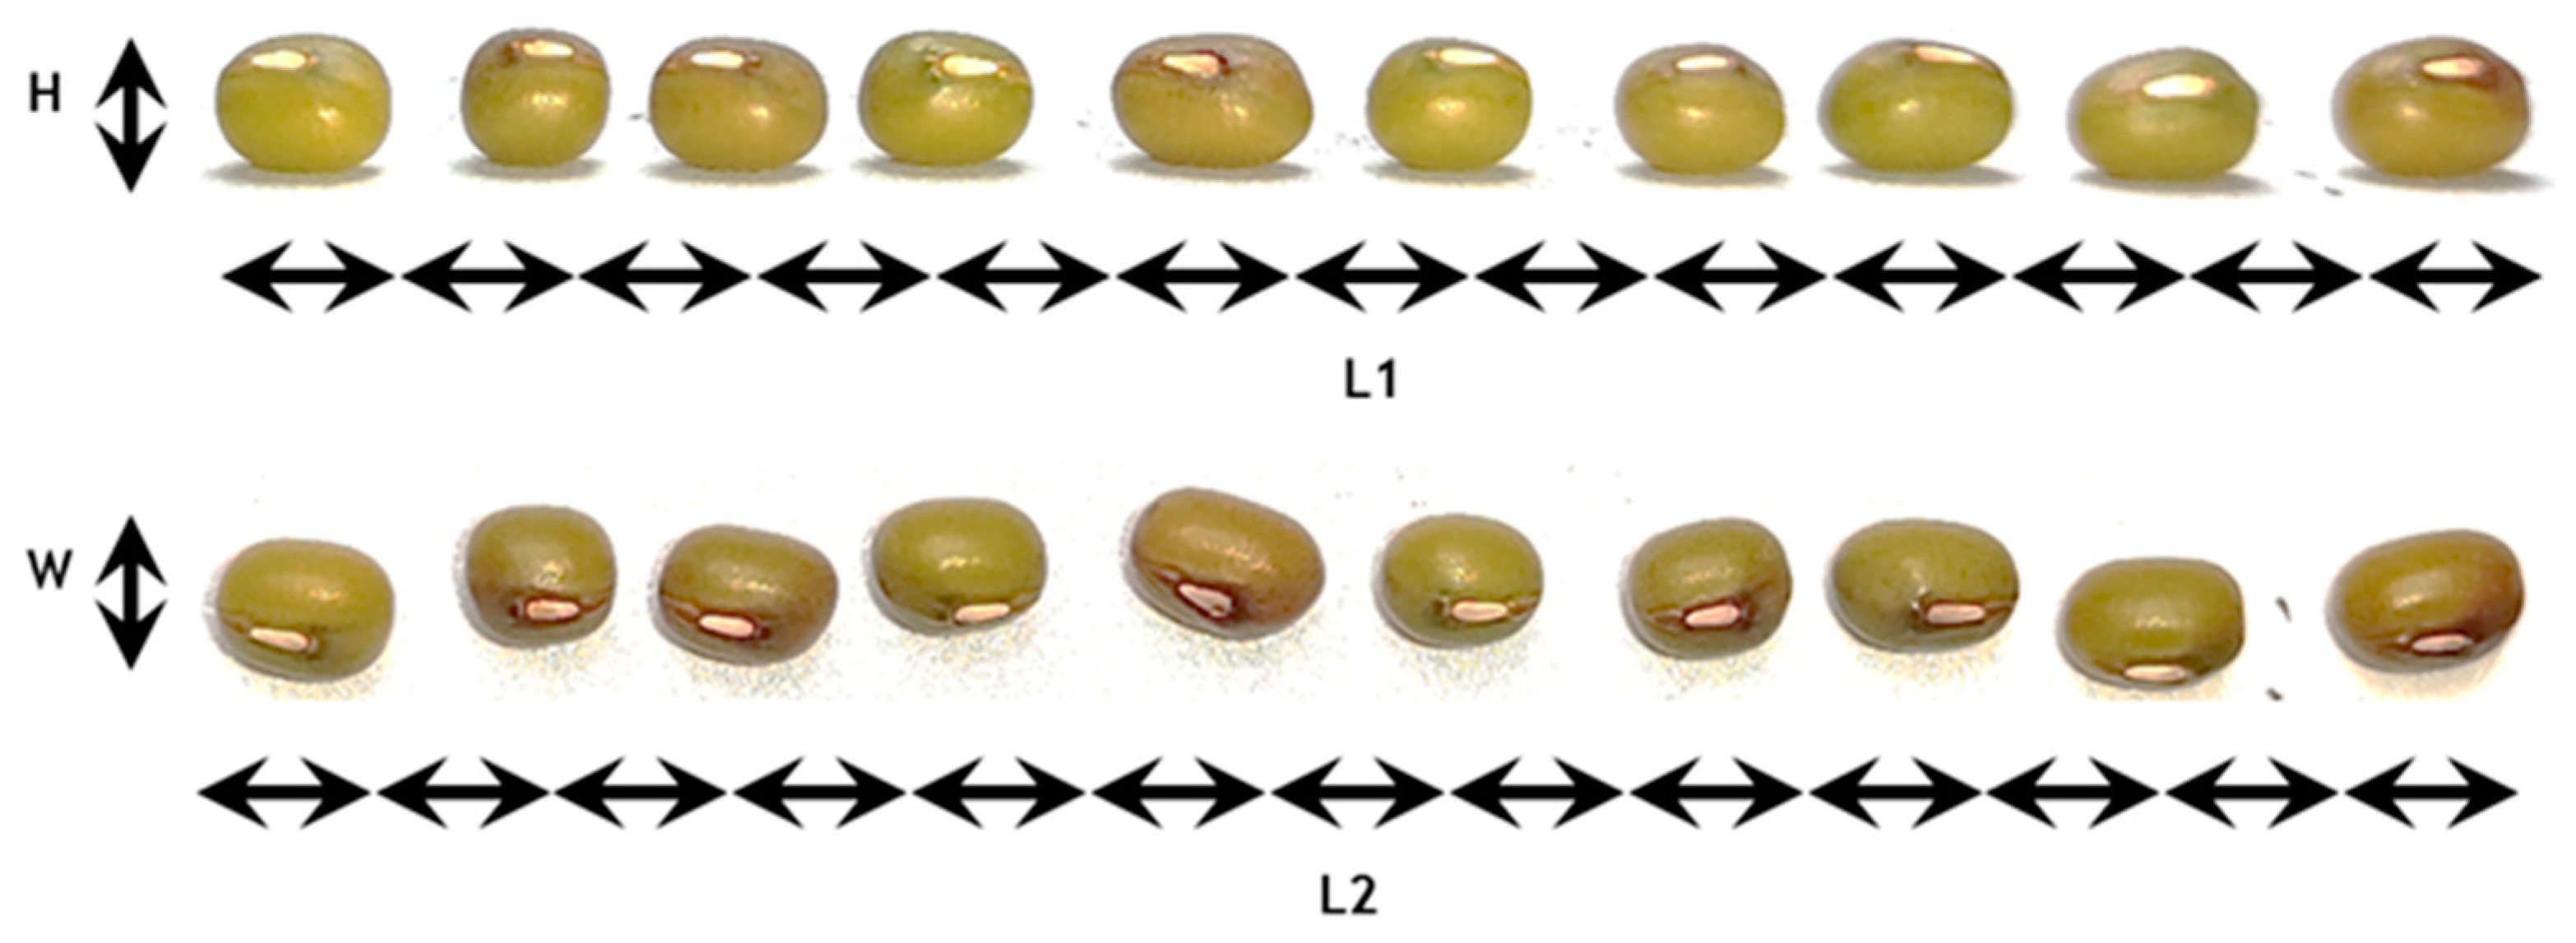
Figure 3 shows the photos that were used to estimate the mean dimensions of the seeds as approximated by an ellipsoid. Descriptive statistics are presented for the three dimensions in Table 8.
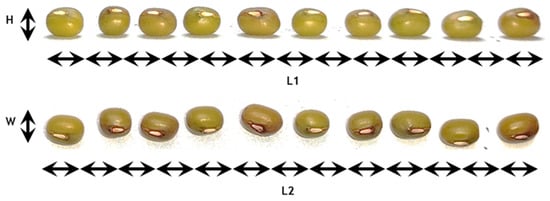
Figure 3.
Measurement of mean seed dimensions in terms of Height (H), Width (W) and Length (L).

Table 8.
Descriptive statistics of mung seeds considering shape approximation to be an ellipsoid.
The dimensions follow a normal distribution in each case since the Shapiro-Wilk test gave strongly non-significant p-values. The null hypothesis could not be rejected for any dimension, which allows considering a normal distribution as a good approximation for all dimensions. The mean dimensions of the seeds can be considered as L = 5.3 ± 0.29 mm, H = 4 ± 0.06 mm and W = 4.1 ± 0.07 mm.
In terms of mass, all batches, coated and uncoated, are normally distributed given the non-significant results of the Shapiro-Wilk normality tests as seen in Table 9.

Table 9.
Descriptive statistics of uncoated versus coated seeds in terms of mass distribution.
3.3. Determination of Minimal Fluidization Air Flow/Air Speed
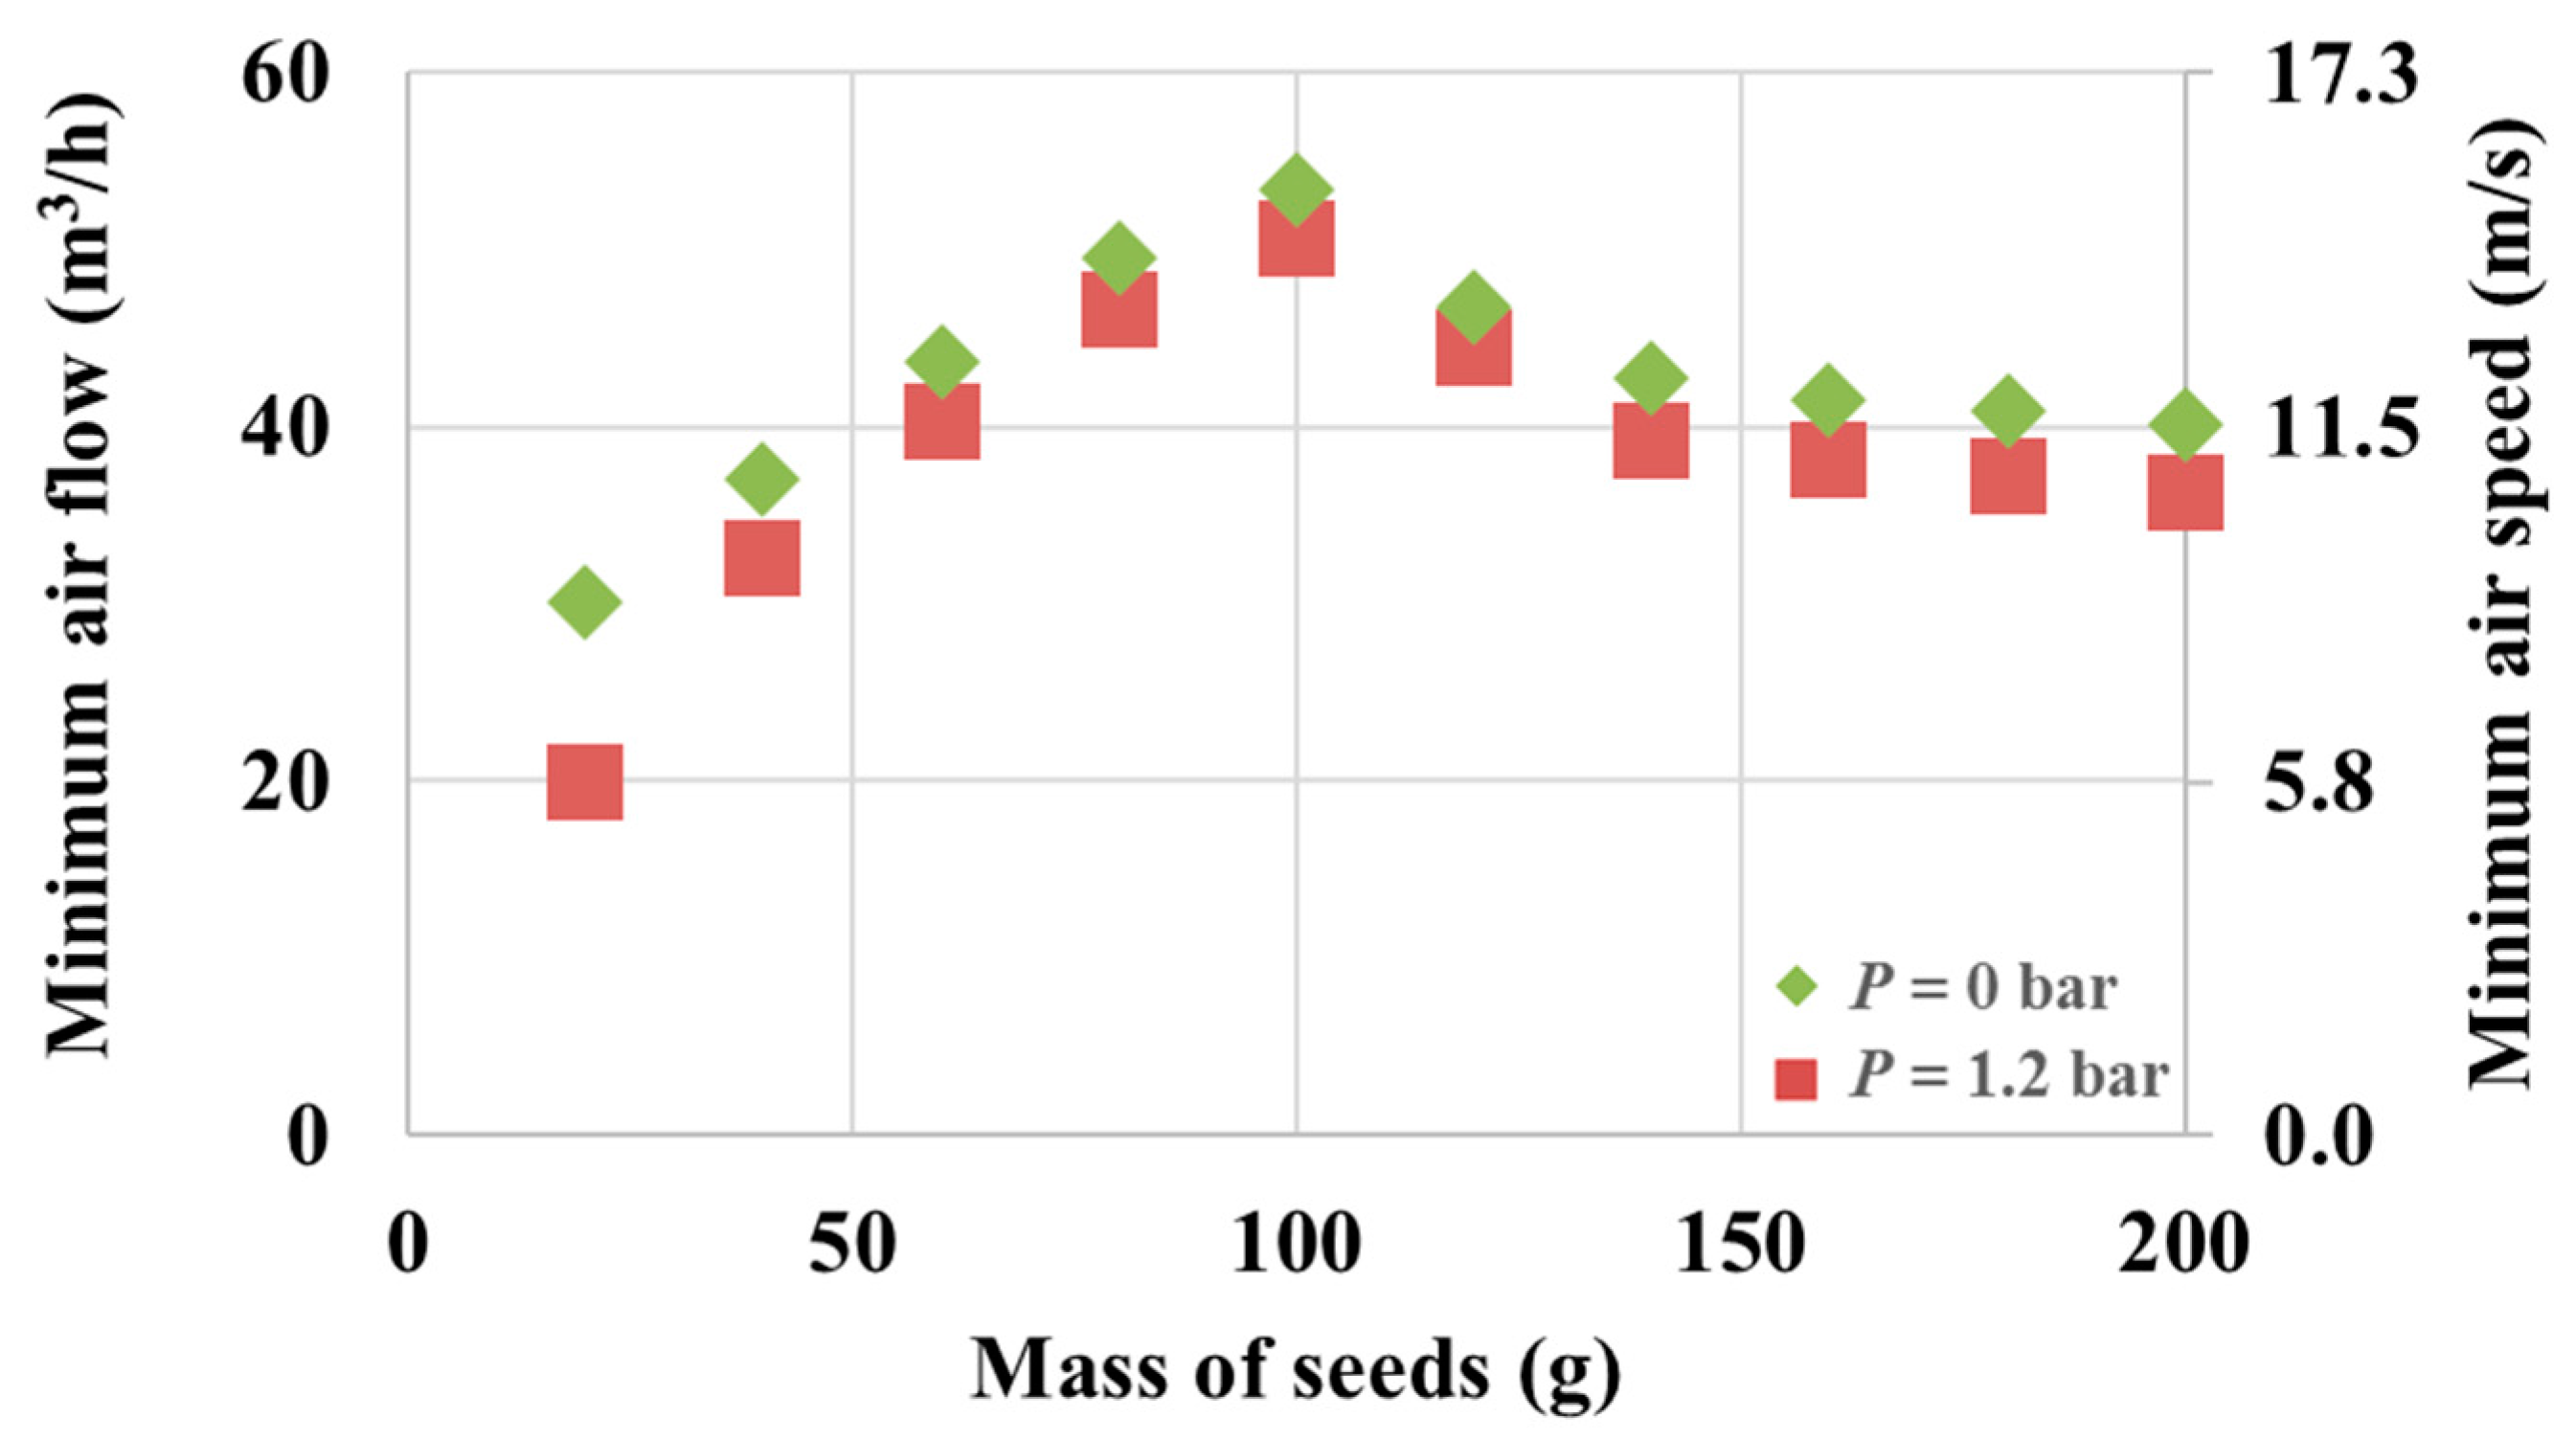
Figure 4 presents the minimal fluidization air flow required to fluidize Mung seeds at different masses ranging from 20 g to 200 g.
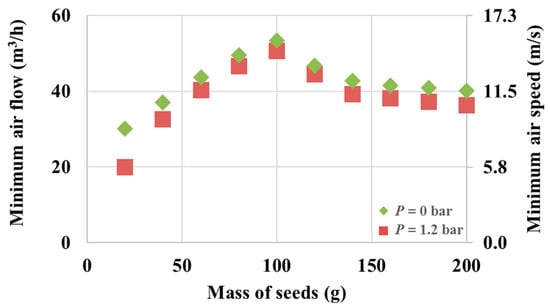
Figure 4.
Minimal fluidization speed for different fluidized seed quantities.
The geometrical shape of the cone and the Wurster tube is such that the minimal fluidization air flow steadily increases with the increase in seed mass up to a maximum value, which is achieved with 100 g of seeds (53.2 m3/h with no nozzle pressure). This shows a dynamical condition in which the tube becomes saturated with Mung seeds beyond which the cycle of fluidization/drying/refluidization no longer depends on the mass of seeds. Beyond this point, the minimal fluidization air flow becomes constant with respect to any added seed mass. The minimal air speed can be determined knowing that the tube has a diameter of 3.5 cm. The secondary axis in Figure 4 represents the corresponding air speed value. A slight decrease in the required air flow is observed if the nozzle pressure is at the optimal 1.2 bar.
3.4. Seed Coating at Optimal Conditions
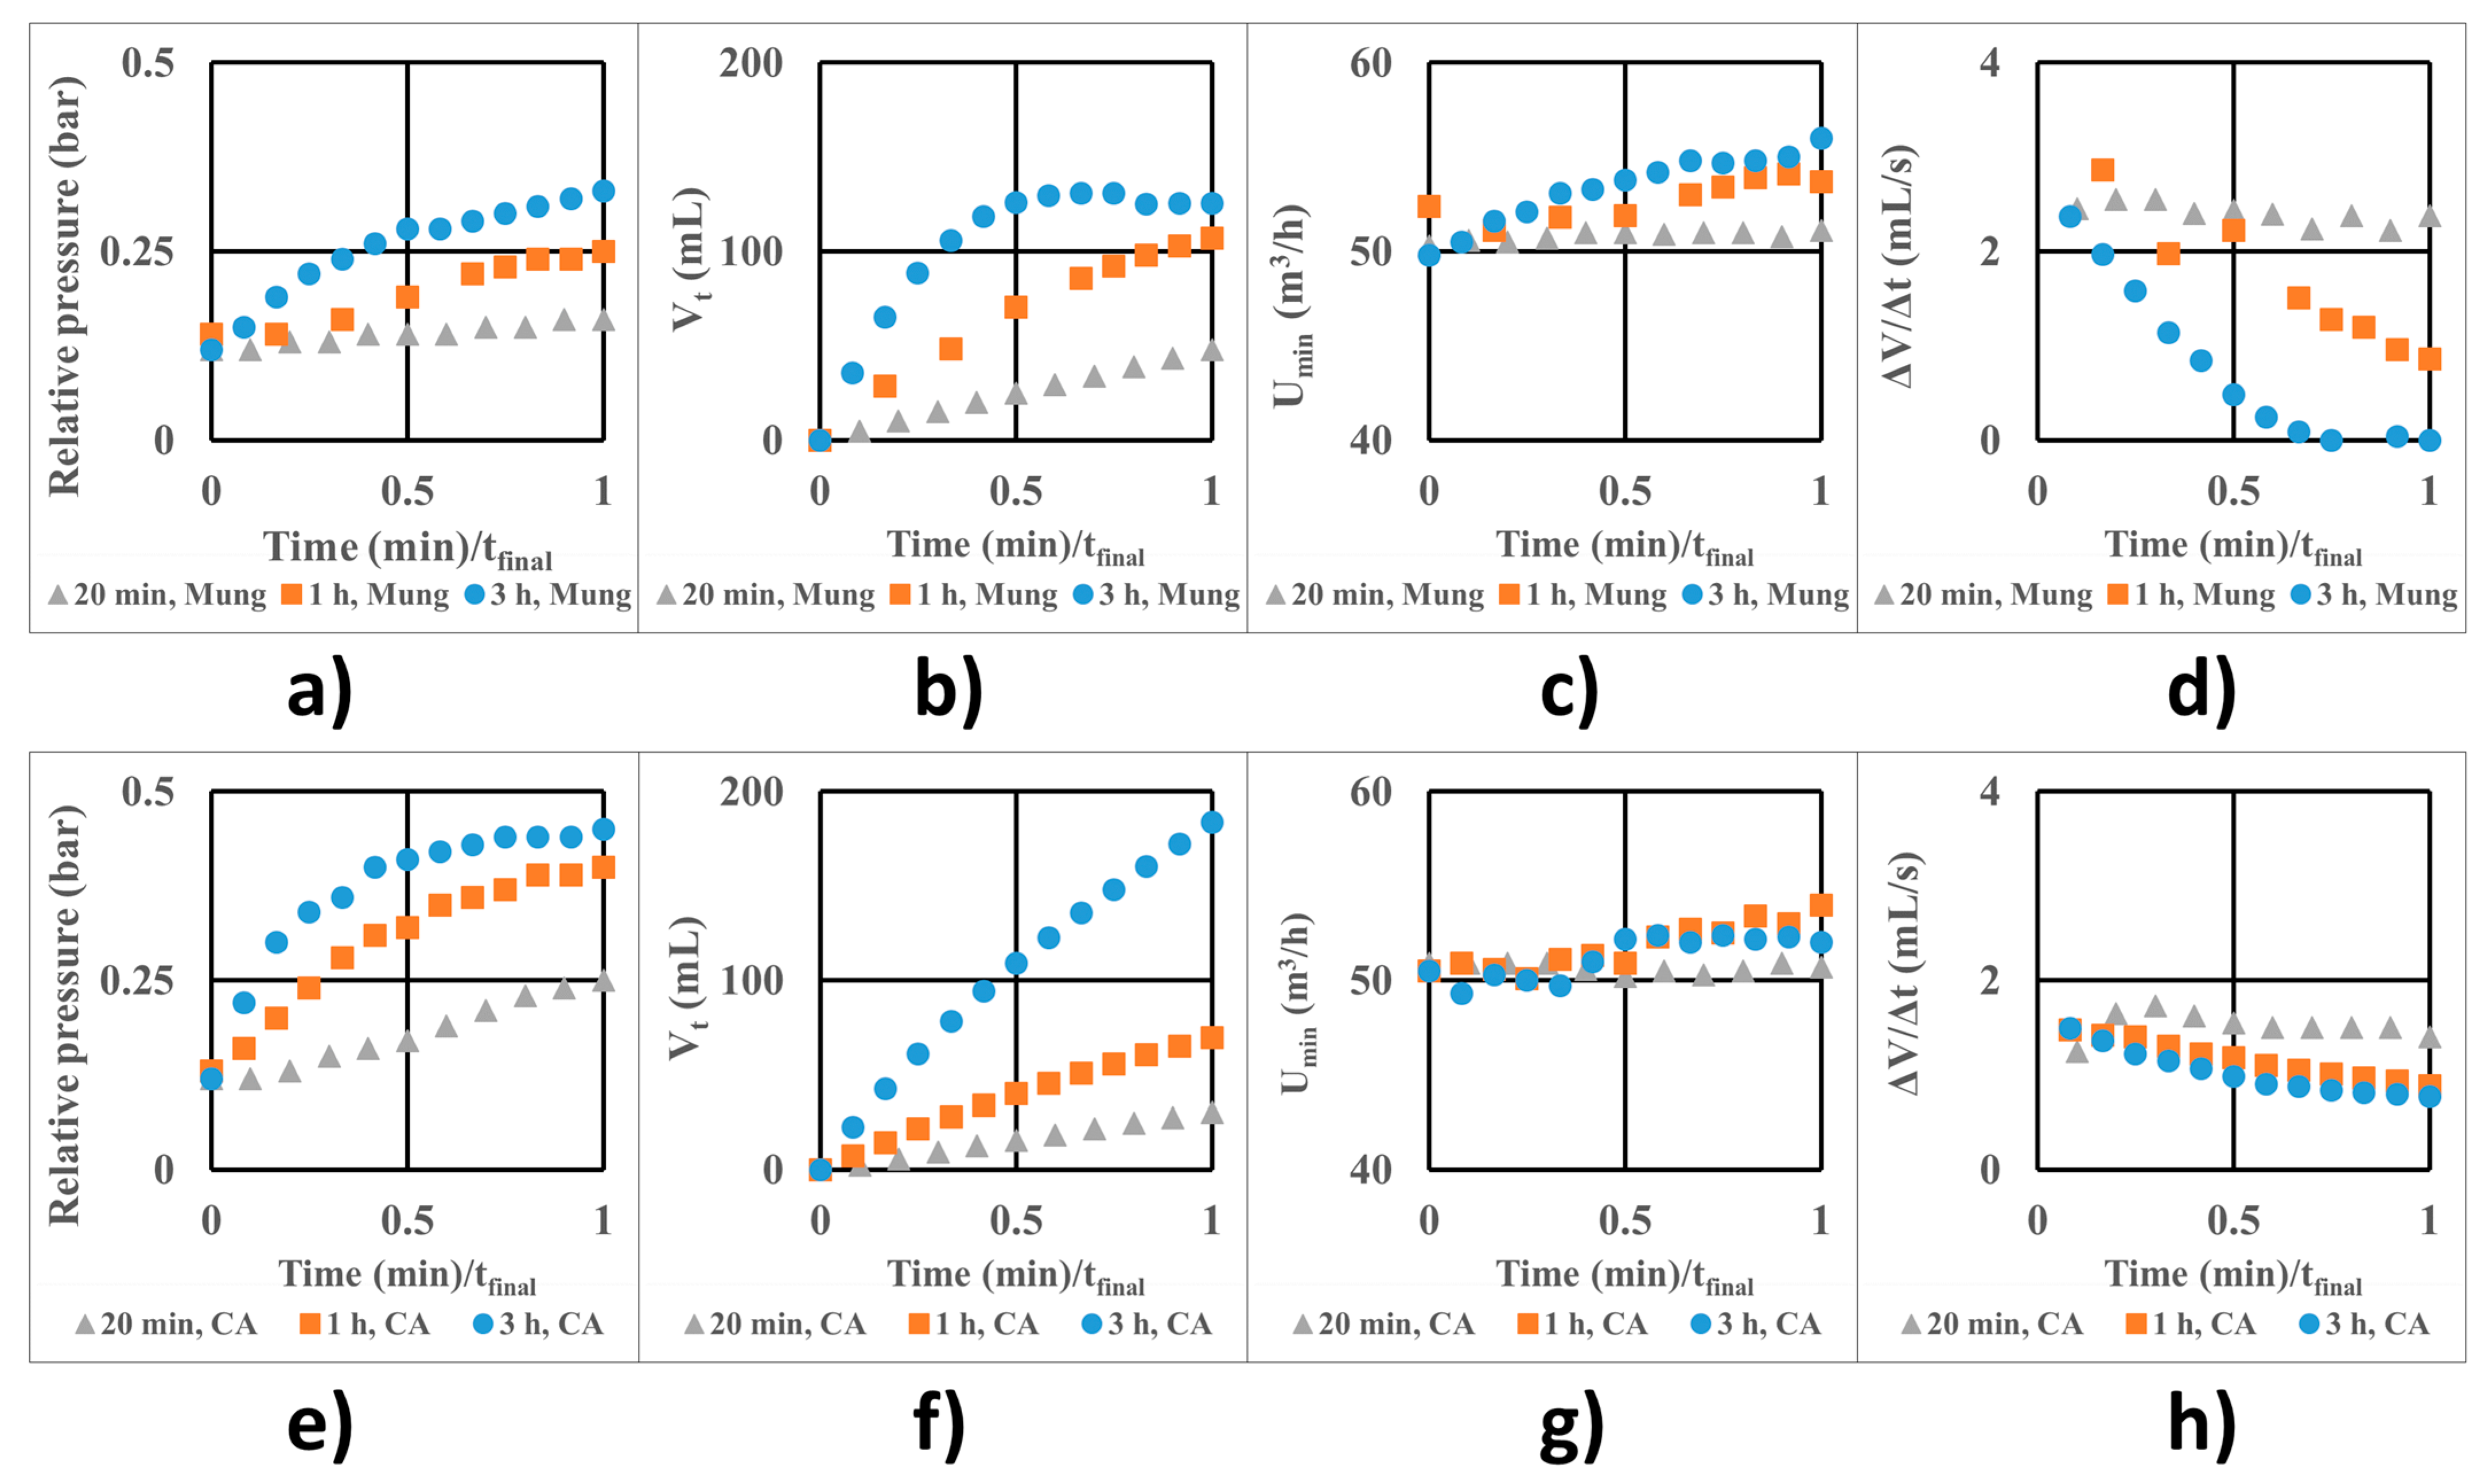
Figure 5 shows the variation of relative pressure (Figure 5a,e), total liquid intake (Vt) (Figure 5b,f), minimal fluidization air flow (U) (Figure 5c,g), and the instantaneous liquid flow (Figure 5d,h) for the control batches (Figure 5a–d) which were fluidized with water instead of coating solution, and the treated batches (Figure 5e–h), which were coated. The X-axis is expressed as the ratio between the actual process time and the final time for each case.
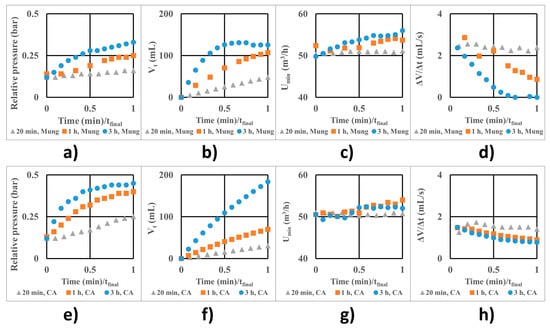
Figure 5.
Process parameters at optimal conditions for fluidized Mung seeds with water feed (a–d) and coated with the sodium alginate/glycerol film (e–h): (a,e) relative pressure; (b,f) total volume; (c,g) minimal fluidization air flow; (d,h) instantaneous liquid flow rate.
The fluidization process is much less stable for the control batches than for the coated batches. The pressure increases more slowly for the uncoated seeds. The fluidization air flow steadily increases but not too much, as seen in Figure 5c. The instantaneous flow rate reduces as the air filters begin to clog slightly (from 20 min to 3 h process) but tends to a constant value given the profile of the curve at 3h in Figure 5d, even if it is less than half of the initial value.
The decrease in the instantaneous liquid flow rate impacts the volume of the final coating solution intake, which is 183.7 mL (3.674 g total coating mass) after 3 h. After the first 20 minutes, a volume of 30.4 mL coating solution (0.608 g total coating mass) enters the unit, and after the first hour, 69.7 mL of coating solution (1.394 g) enters the unit. In each case, this mass distributes over the entire batch of seeds.
3.5. Scanning Electron Microscopy of Coated Seeds
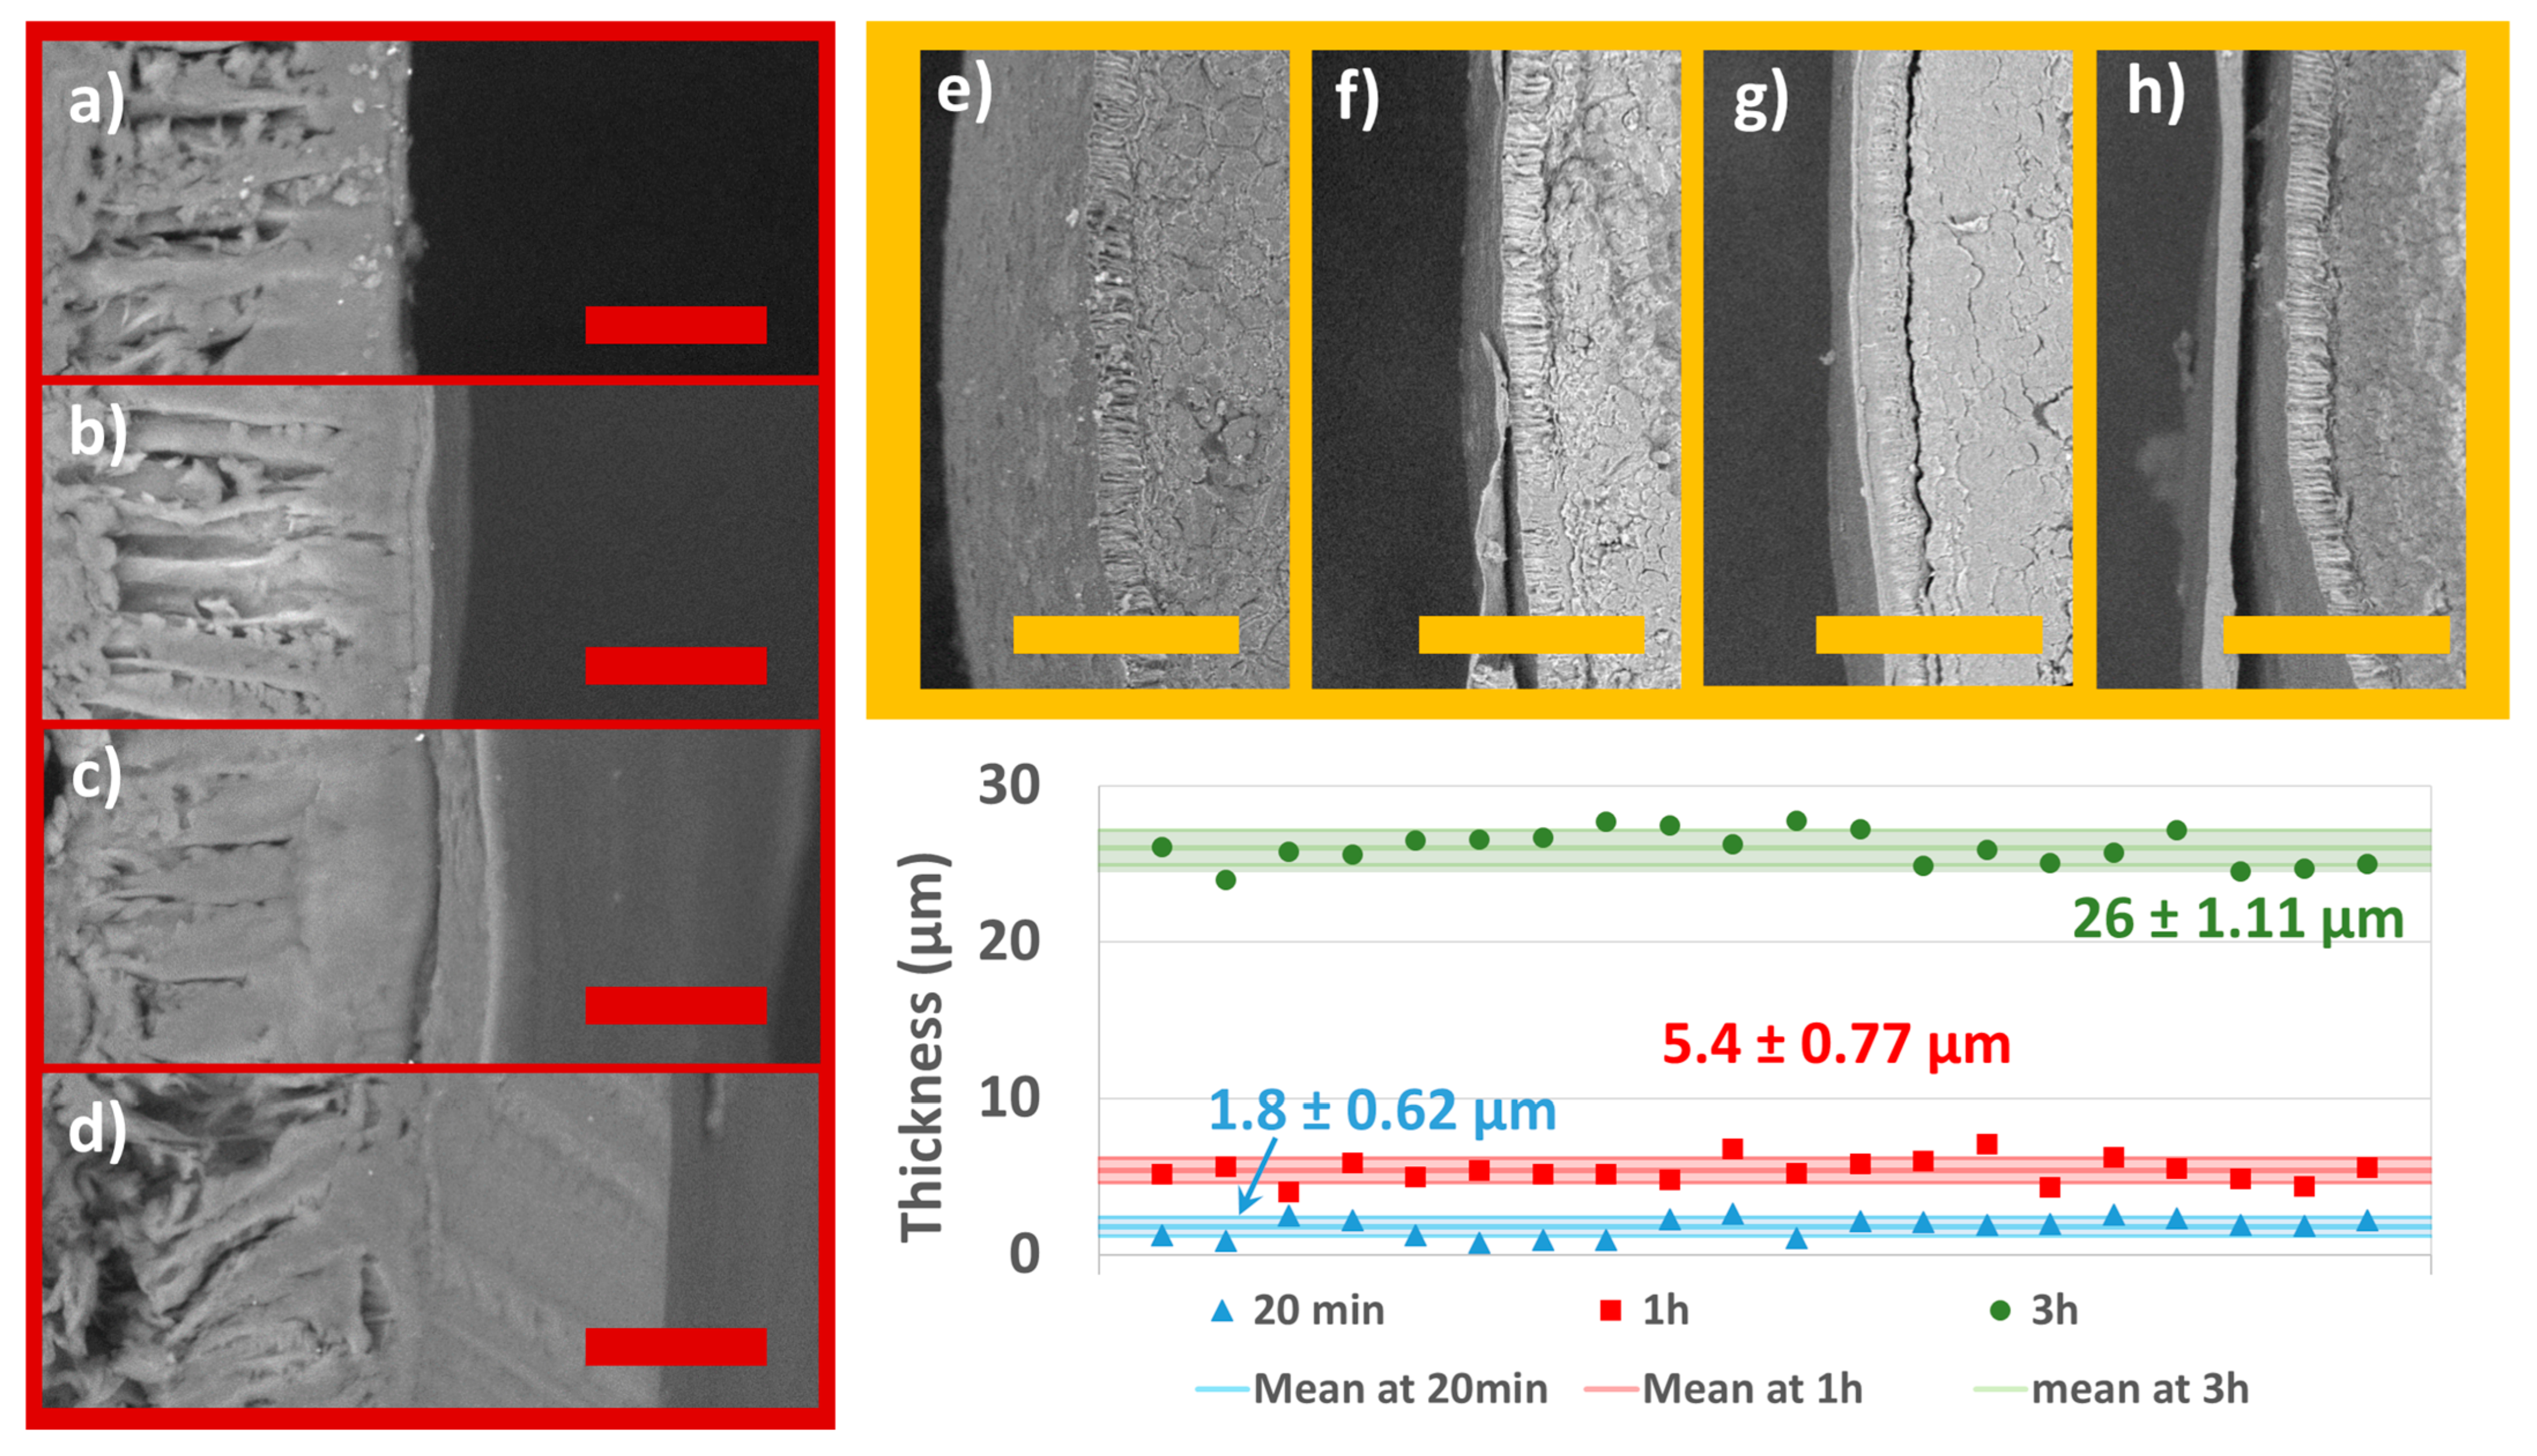
The SEM micrographs (Figure 6) show the morphology and local thickness of the coatings as a function of total processing time. In terms of appearance, the coating appears continuous and additive in Figure 6a–d since the three situations represent three different process times (20 min, 1 h, and 3 h) with growing total quantity of coating solution in comparison to Figure 6a. The film at 1000× magnification was measured in Image J at random positions. The values obtained from each image show a consistent thickness that does not vary very much. The coating reaches 1.8± 0.62 µm, 5.4 ± 0.77 µm, and 26 ± 1.11 µm thicknesses on average after 20 min, 1 h, and 3 h, respectively. Figure 6e–h also shows a broader perspective (at 100×) of the coating at various thicknesses. The apparently slack coating in Figure 6f,h is a consequence of cutting the seed halfway using a scalpel. The coating on the seeds is not expected to be loose at all since the process is additive and the dimensions of the seeds remain constant throughout the process.
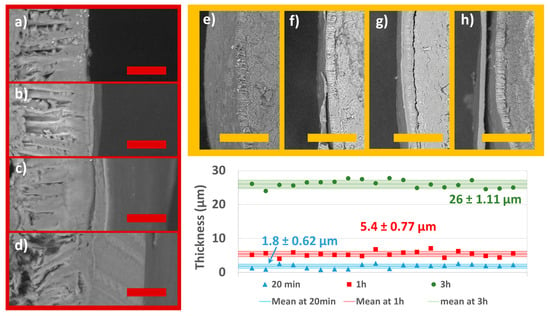
Figure 6.
SEM micrographs at different process times and different magnifications: (a) control (1000×); (b) 20 min (1000×); (c) 1 h (1000×); (d) 3 h (1000×); (e) blank (100×); (f) 20 min (100×); (g) 1 h (100×); (h) 3 h (100×); and graphical representation of the mean coating thickness with standard deviation intervals as measured 20 times each film at random positions in the depicted micrographs. The red scale bar is at 20 µm. The yellow scale bar is at 200 µm.
3.6. Assessment of Seed Quality
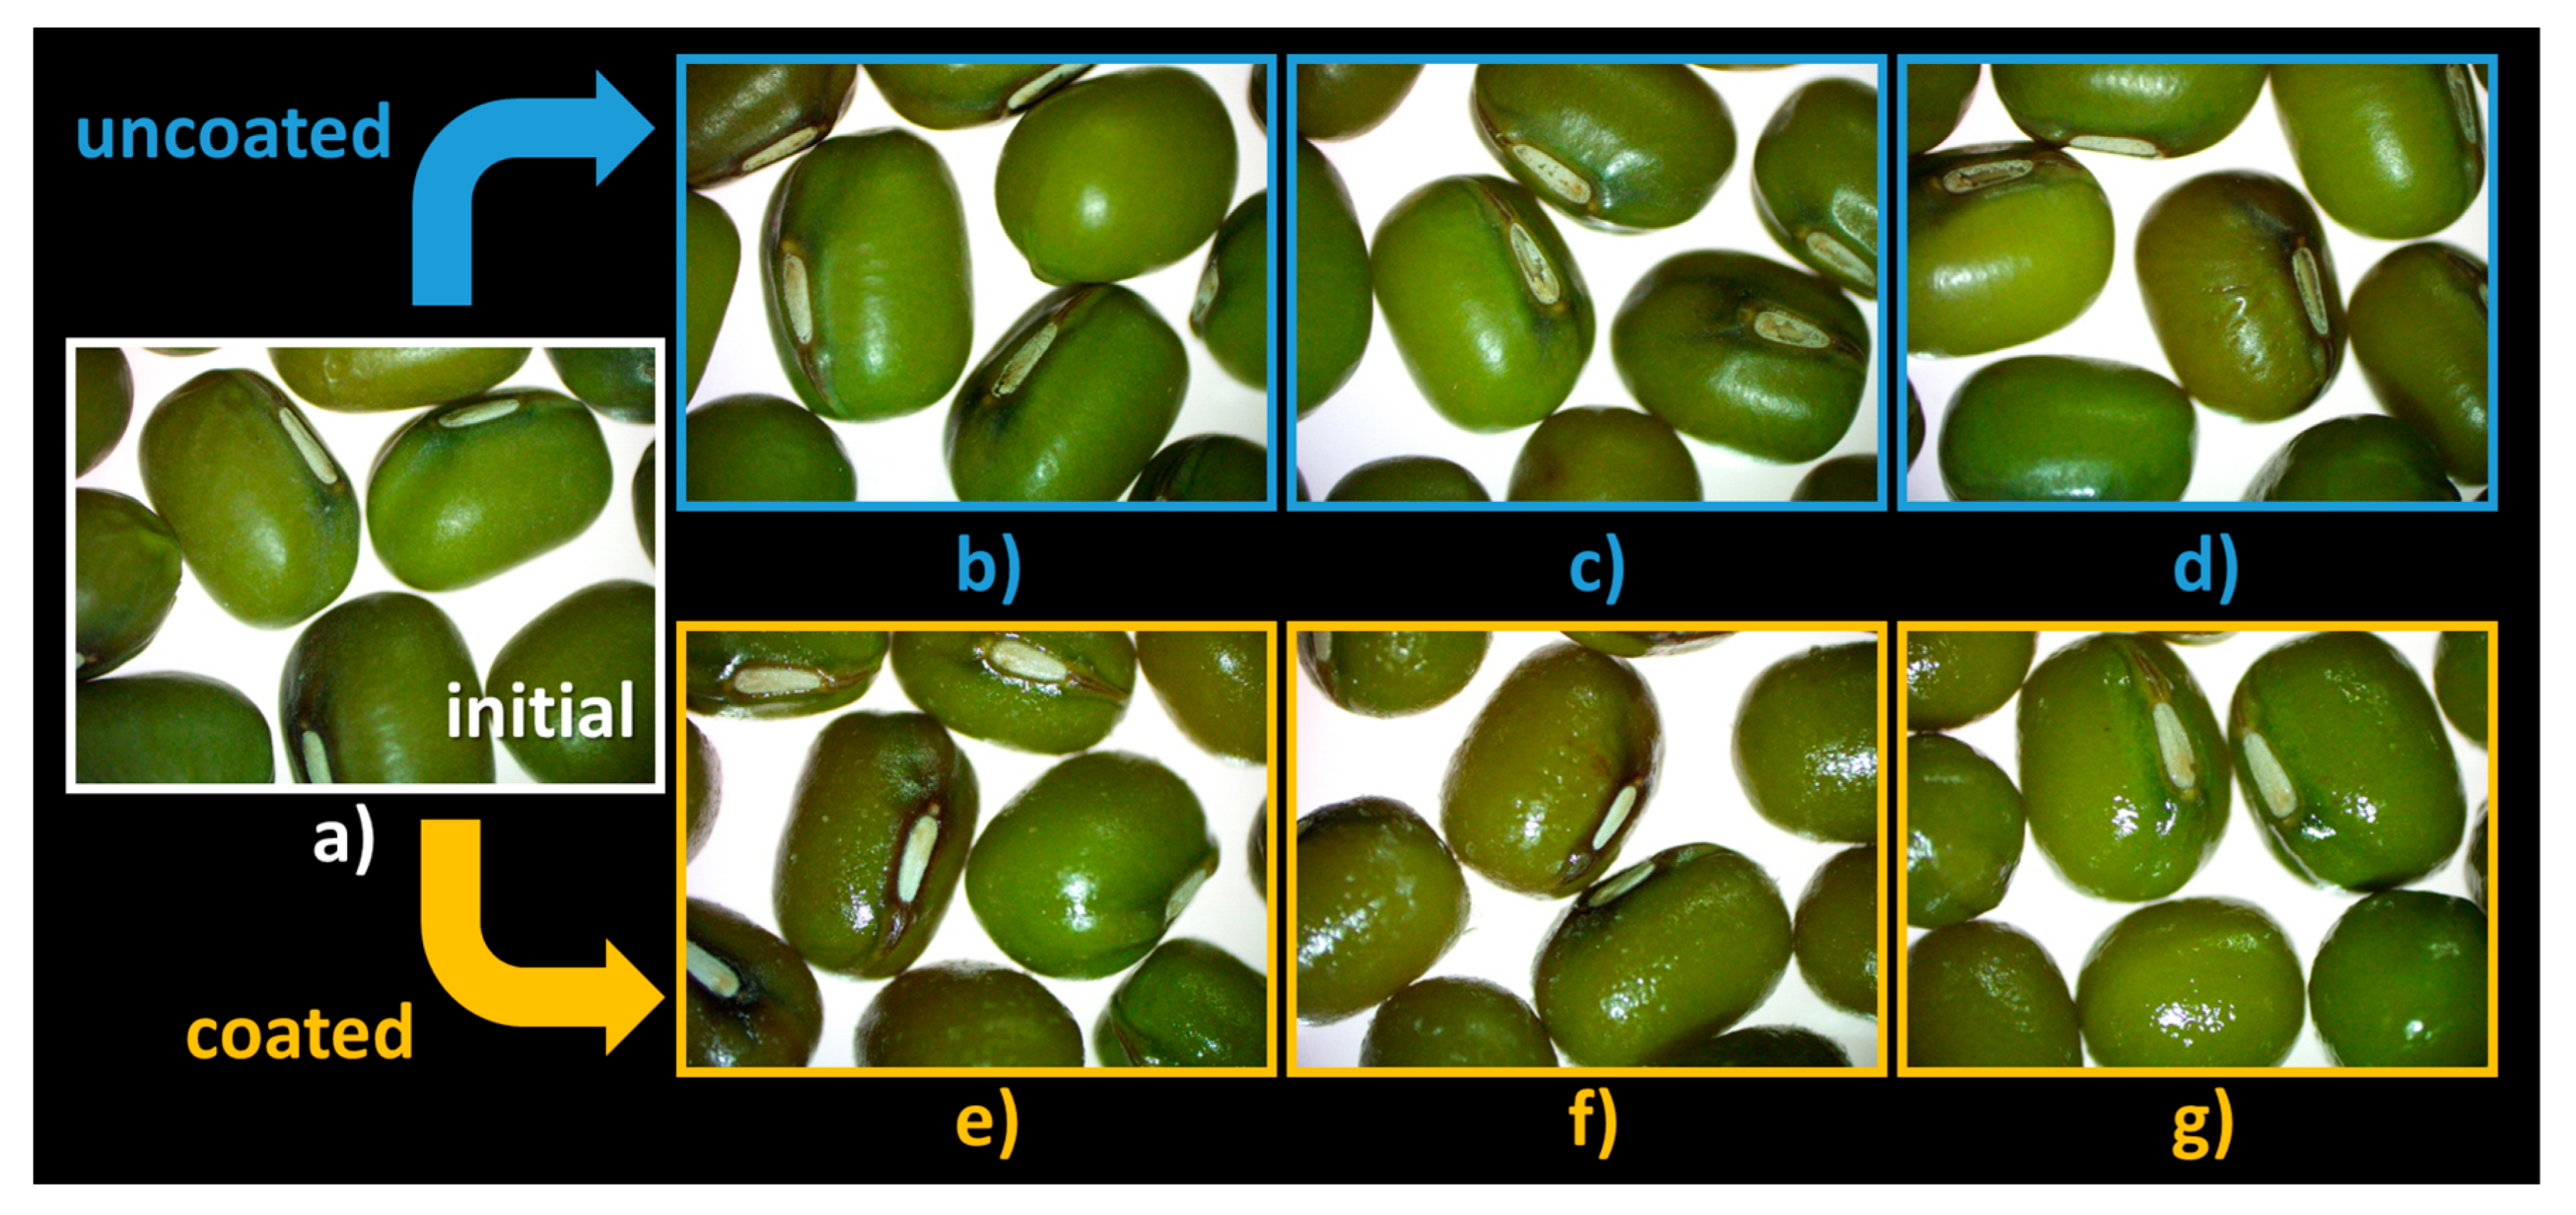
The steromicroscopy images (Figure 7) reveal that there is a degradation of the hilum in the absence of coating, more evident in the case of seeds kept in the granulator for 1 h and 3 h (Figure 7c,d) compared with the initial seeds (Figure 7a). This effect is not observed when the coating solution is introduced into the unit (Figure 7e–g).
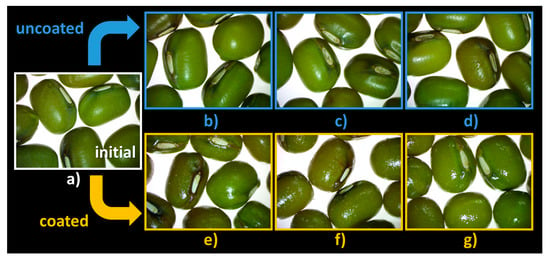
Figure 7.
Seed morphology: (a) C0′ = initial, untreated seeds control; (b) C20′ = water fluidized seeds for 20 min, uncoated seeds control; (c) C60′ = water fluidized seeds for 1 h, uncoated seeds control; (d) C180′ = water fluidized seeds for 3 h, uncoated seeds control; (e) V20′ = coated seeds for 20 min, (f) V60′ = coated seeds for 1 h; (g) V180′ = coated seeds for 3 h.
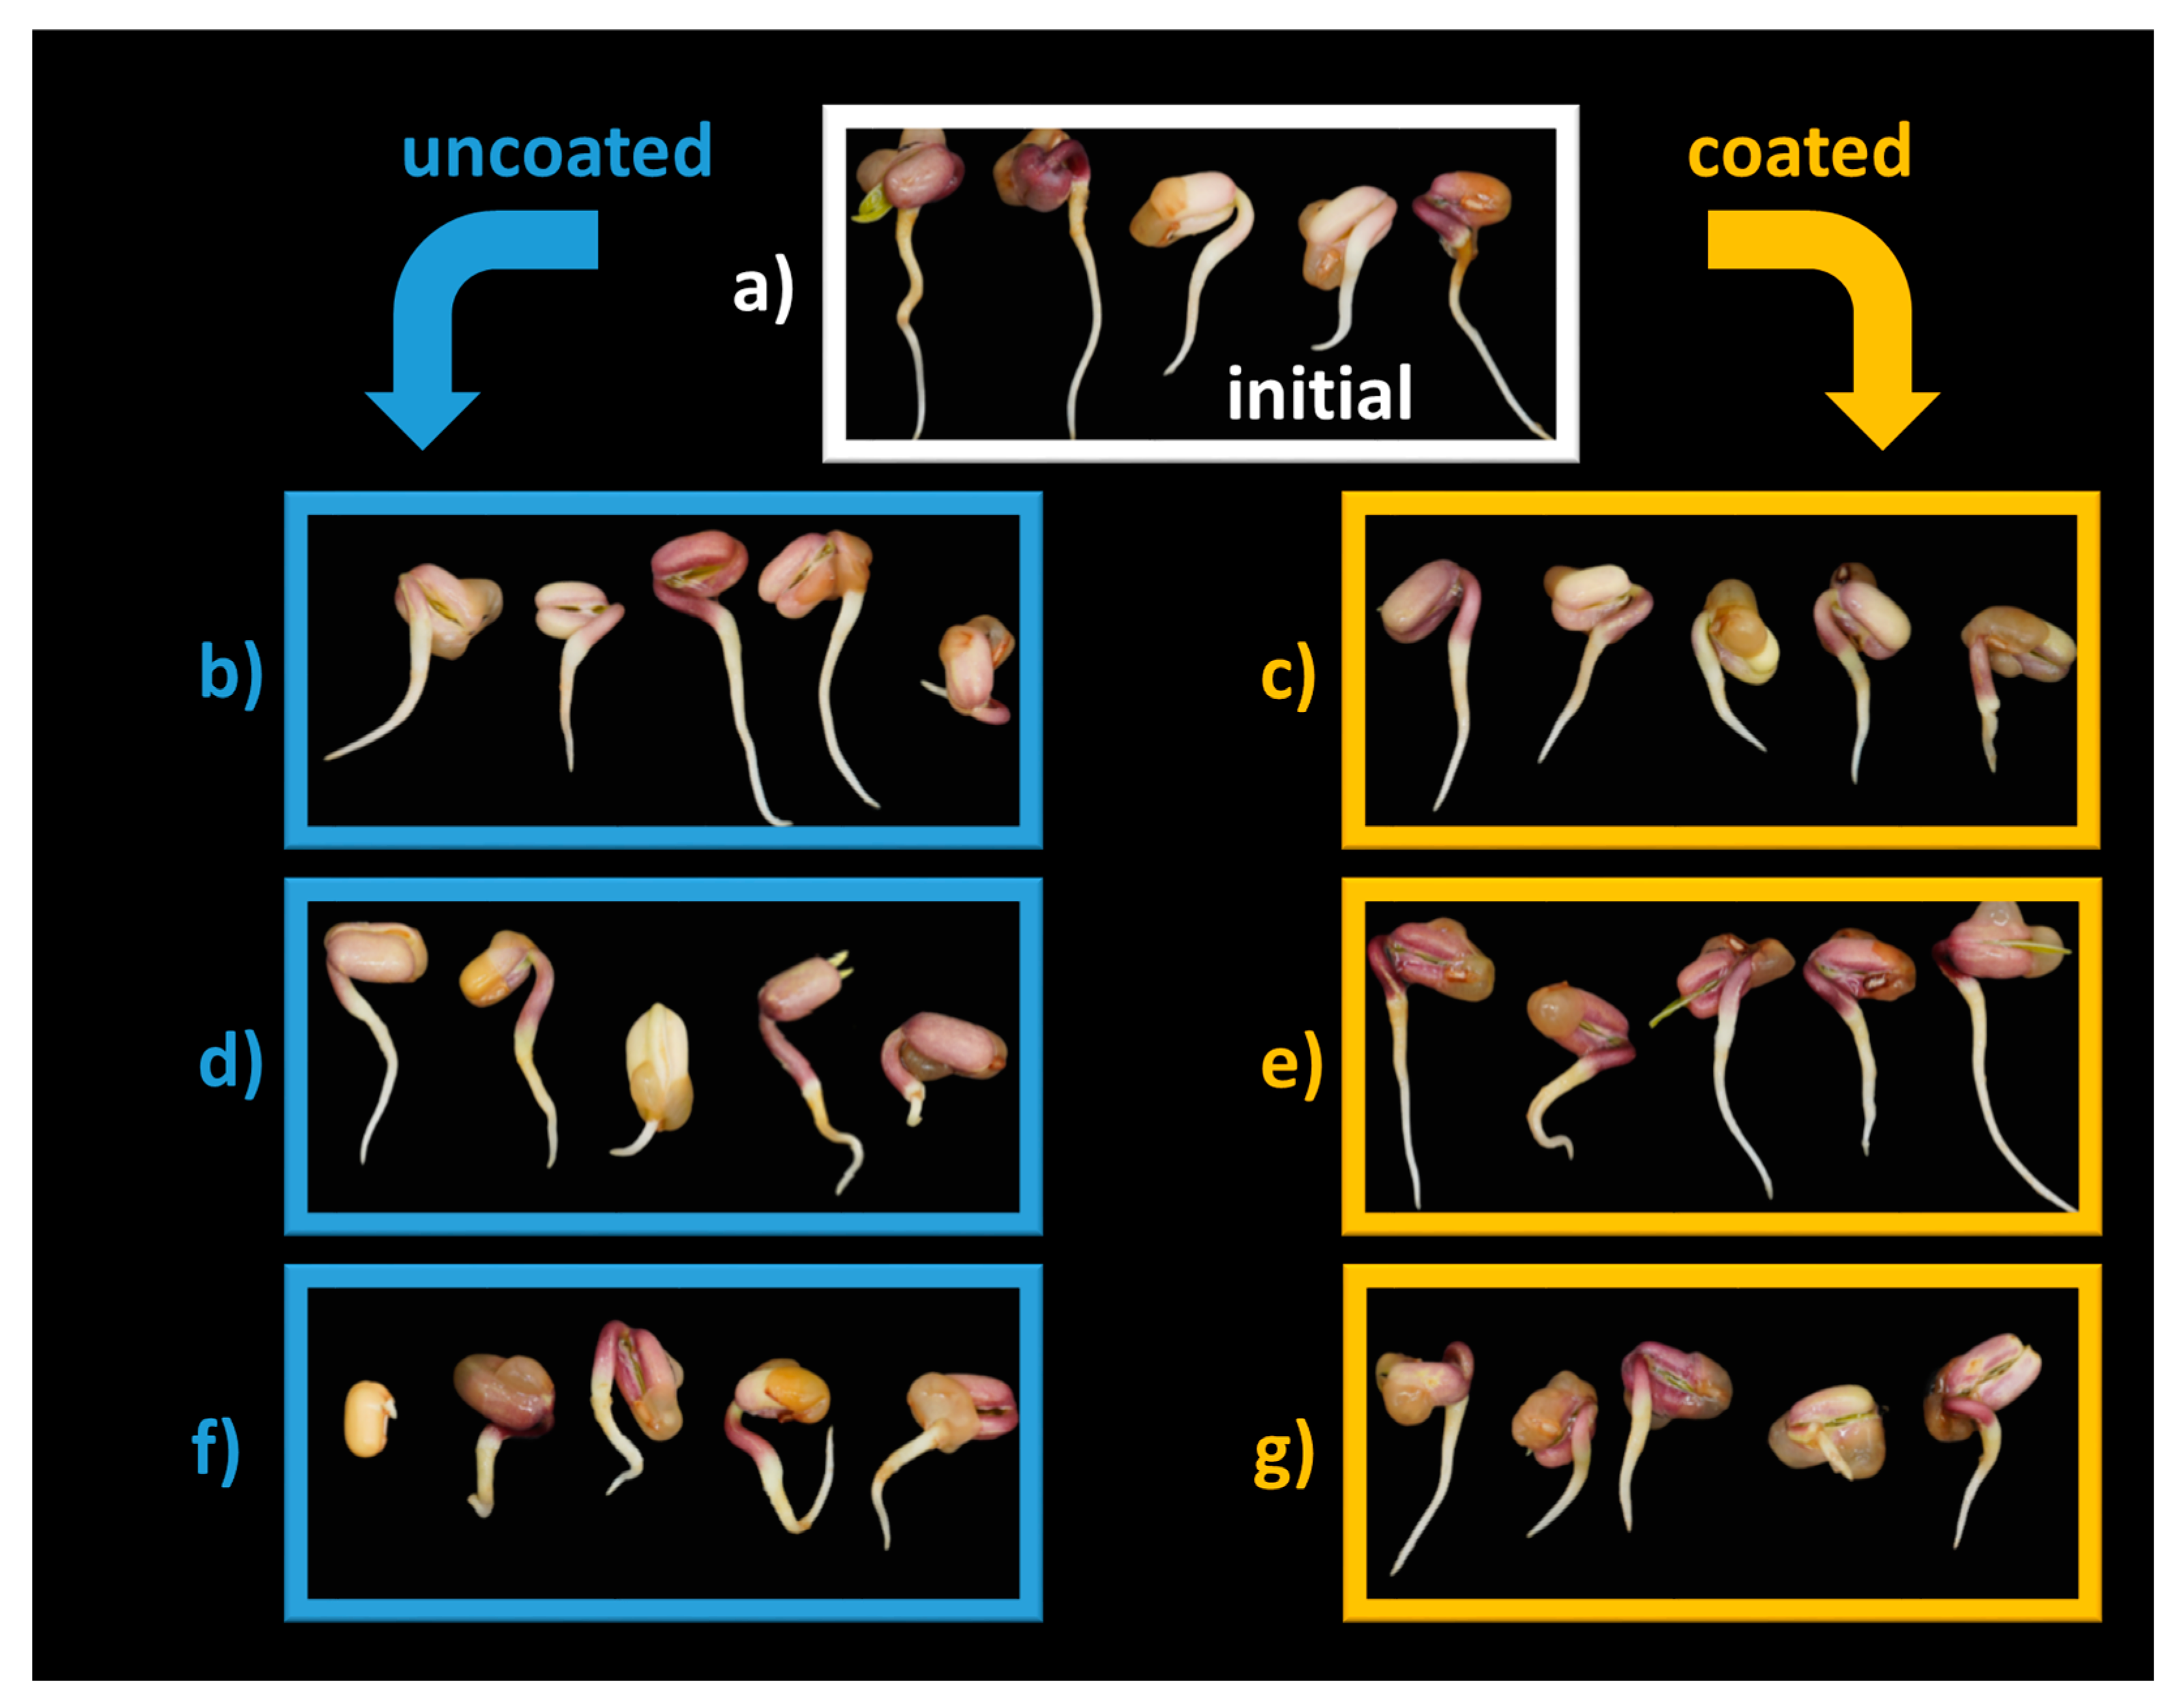
The morphology of Mung bean seedlings shown in Figure 8 indicates small changes in radicle orientation when seeds are not coated, which are more pronounced for C180′ (Figure 8f).
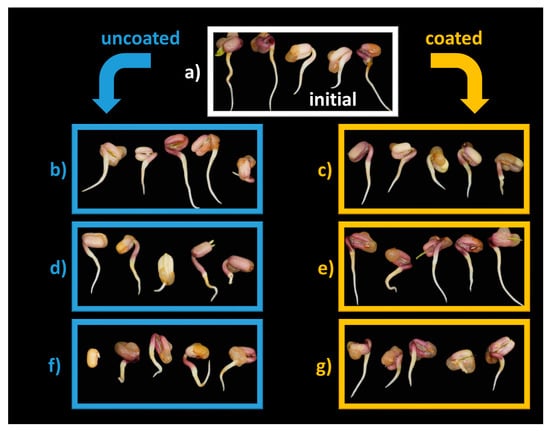
Figure 8.
Seed morphology: (a) C0′ = initial, untreated seeds control; (b) C20′ = water fluidized seeds for 20 min, uncoated seeds control; (c) C60′ = water fluidized seeds for 1 h, uncoated seeds control; (d) C180′ = water fluidized seeds for 3 h, uncoated seeds control; (e) V20′ = coated seeds for 20 min, (f) V60′ = coated seeds for 1 h; (g) V180′ = coated seeds for 3 h.
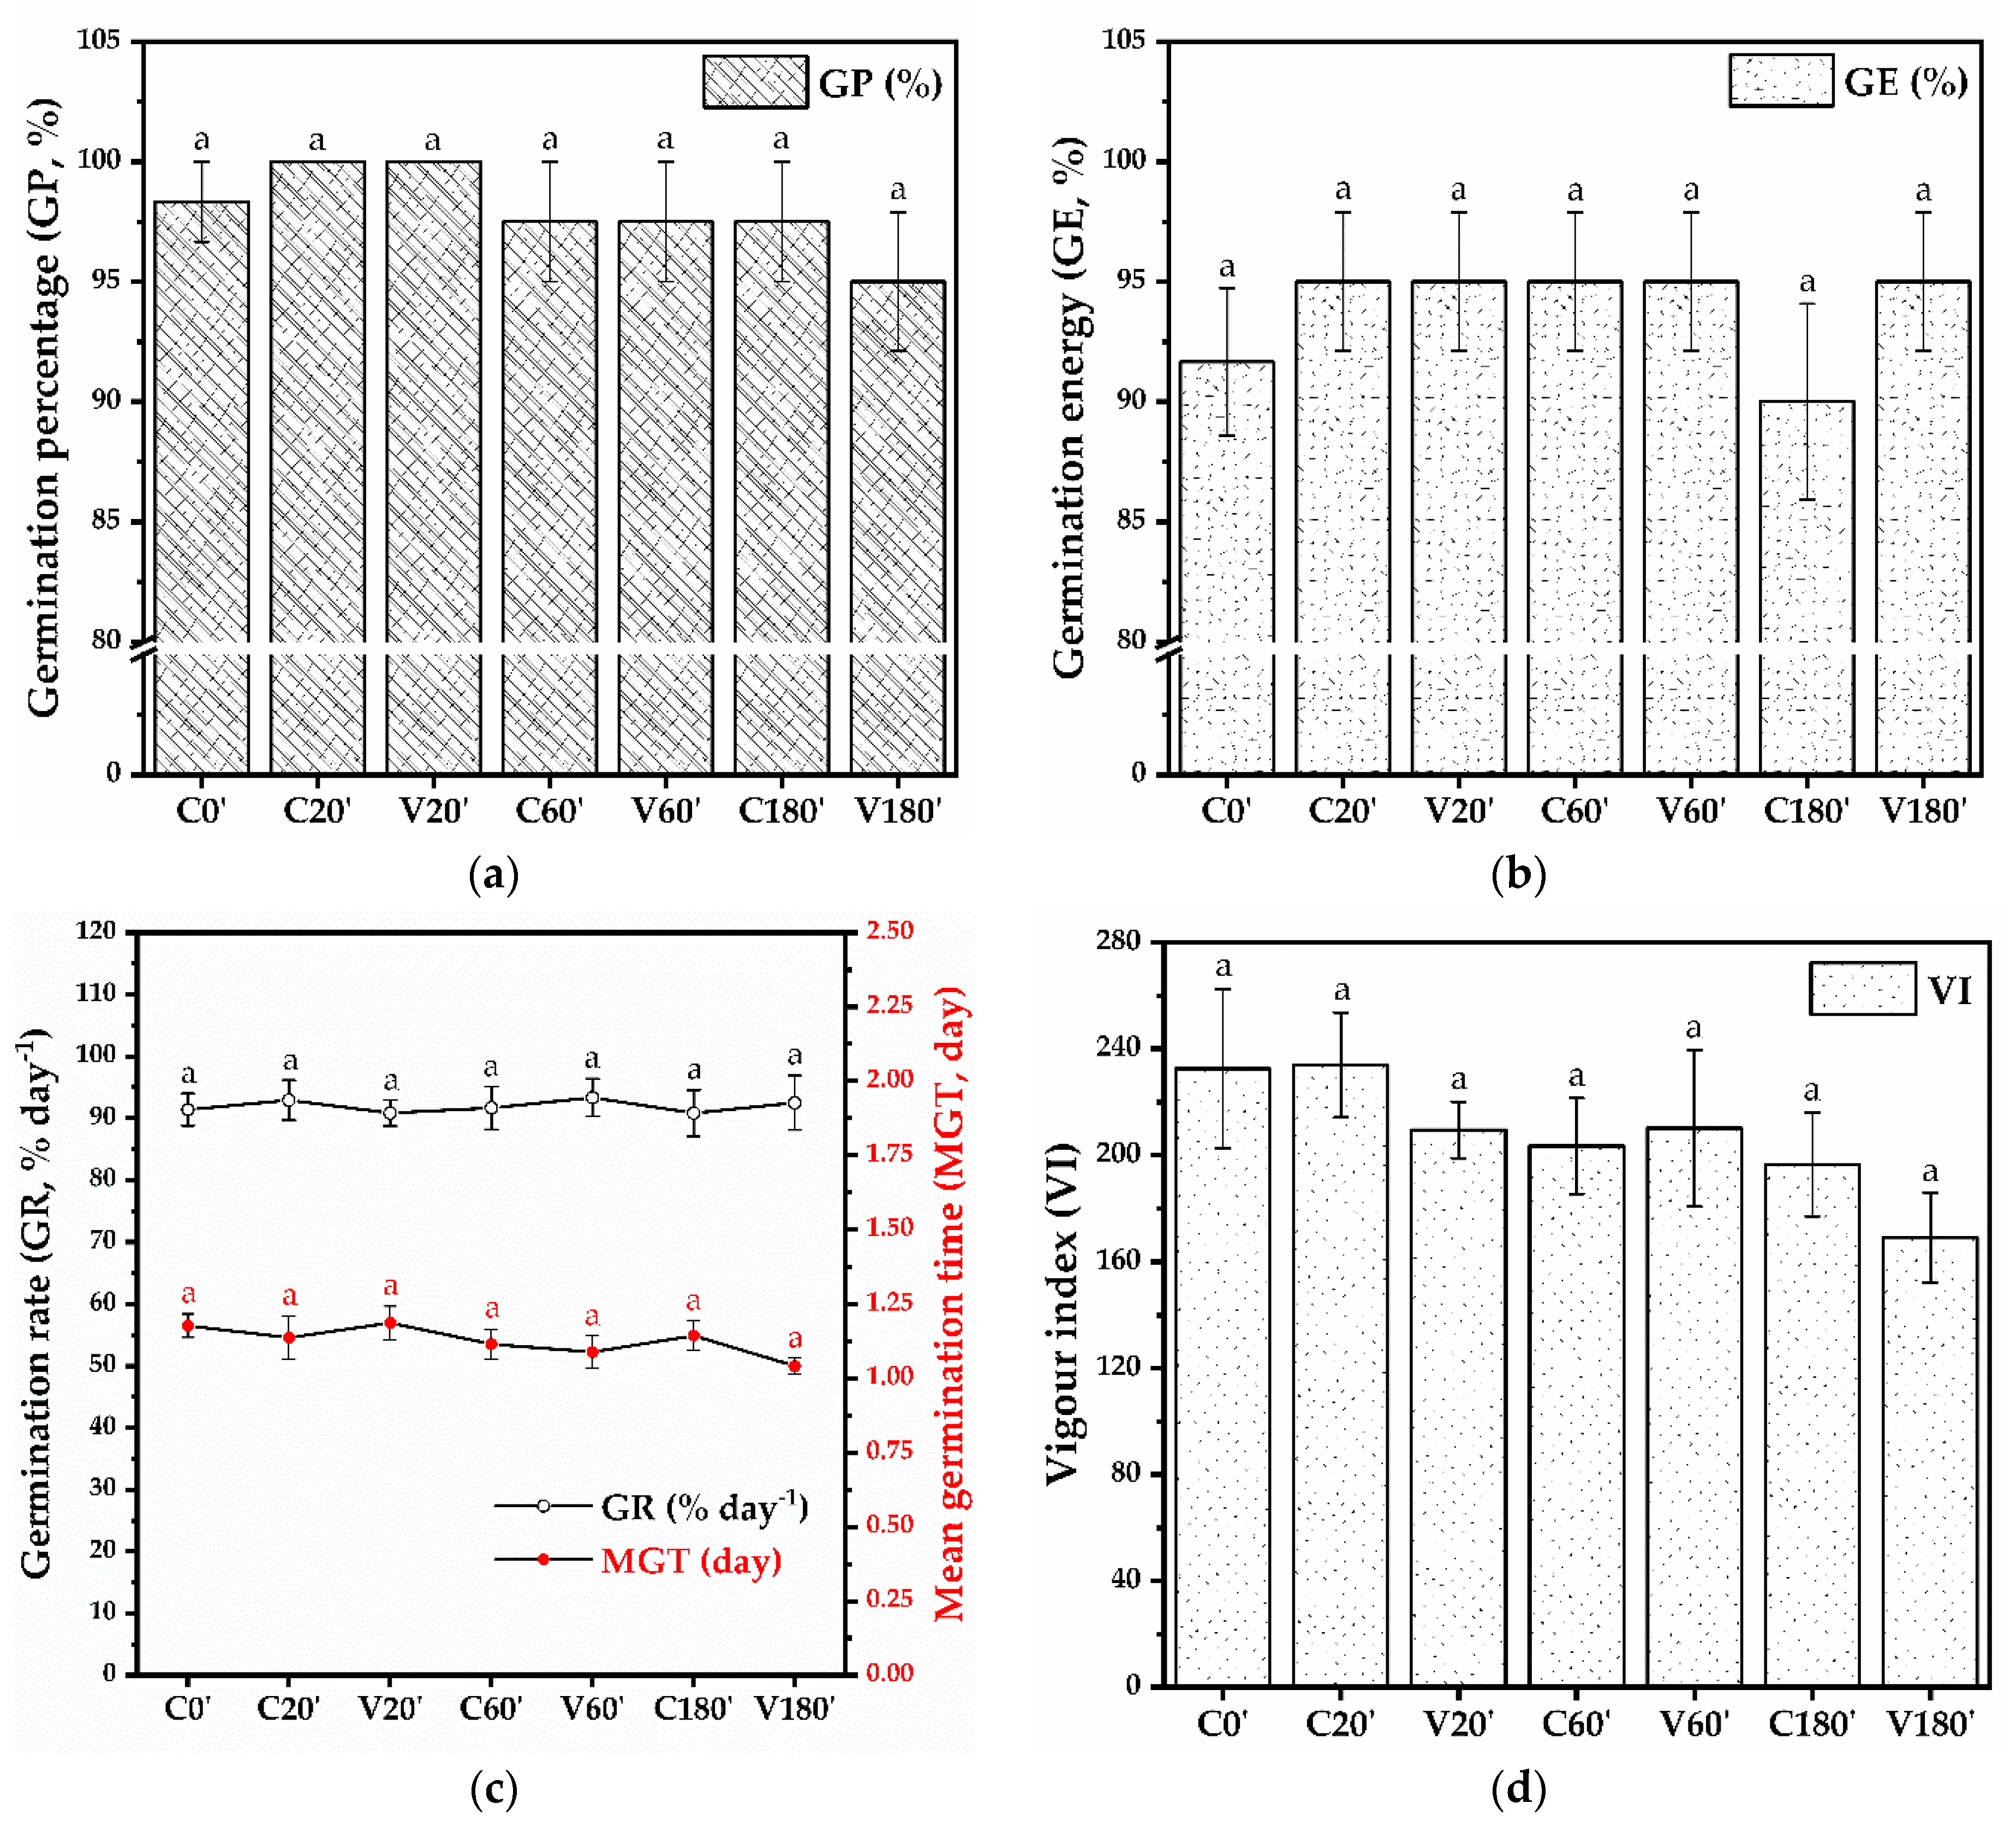
No statistically significant differences were observed between the germination parameters evaluated for the tested variants (Figure 9). The germination percentage shown in Figure 9a varies between 95% and 100% (98.33 ± 1.66% for C0′, 100% for C20′, V20′, 97.5 ± 2.5% for C60′, V60′, and C180′, and 95 ± 2.88% for V180′). The germination energy at 1/2 of the time set for the germination percentage (Figure 9b) ranges from 90 to 95% (91.66 ± 3.07% for C0′, 95 ± 2.88% for C20′, V20′, C60′, V60′, V180′ and 90 ± 4.08% for C180′). The germination rate expressed as a percentage of germinated seeds per day ranges between 90.83 and 93.33% a day and can be correlated with the mean germination time (day), which varies between 1.04 and 1.18 days (Figure 9c). The vigor index, based on radicle length, hypocotyl length, and germination percentage, indicates small but not statistically significant differences (Figure 9d). The vigor index is 232.53 ± 29.93 for C0′, 233.95 ± 19.72 for C20′, 209.48 ± 10.6 for V20′, 203.49 ± 18.04 for C60′, 210.15 ± 29.47 for V60′, 196.57 ± 19.5 for C180′, and 169.06 ± 16.82 for V180′. Table 10 presents the statistical analysis to determine the occurrence of significant differences between the different variants of mung bean seeds.
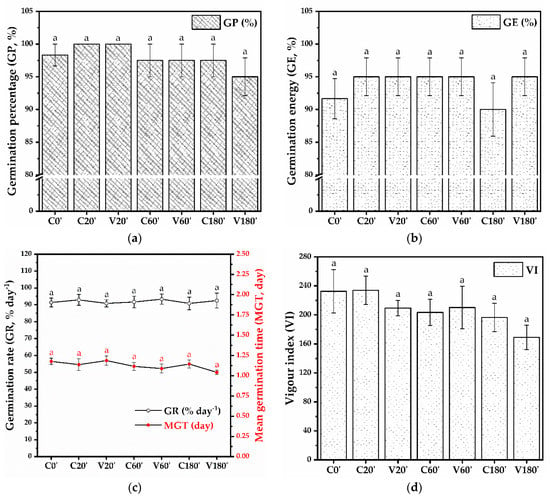
Figure 9.
Seed germination parameters: (a) Germination percentage (GP, %), (b) Germination energy (GE, %), (c) Germination rate (GR, % day−1), and Mean germination time (MGT, day), (d) Vigour index (VI); C0′ = initial, untreated seeds control; C20′ = water fluidized seeds for 20 min, uncoated seeds control; C60′ = water fluidized seeds for 1 h, uncoated seeds control; C180′ = water fluidized seeds for 3 h, uncoated seeds control; V20′ = coated seeds for 20 min, V60′ = coated seeds for 1 h; V180′ = coated seeds for 3 h; (±error bars, n = 4, α = 0.05).

Table 10.
One-way ANOVA to assess differences between coated and uncoated mung bean seeds.
4. Discussion
4.1. Optimization of the Coating Process Parameters
The performance of the coating process is affected differently by the different parameters in the bottom spray fluidized bed process. Seven parameters are shown in Table 11 along with the expected impact on the process performance when the values are too low or too high.

Table 11.
Qualitative remarks on the drawbacks observed for factors at too high or too low values.
Some of these parameters have been kept constant in this process for various reasons. Air temperature is a critical parameter for seed viability, but it is also the main parameter controlling the vaporization of water from the coating solution. A compromise was made in this case keeping it at constant value of 40 °C. The air flow is critical to ensure fluidization, but it can also have a negative impact if it is too high. For this reason, it was kept manually at the minimal fluidization value during the process. The air flow is not an independent factor because it is a consequence of the mass of seeds. For reasons of process simplicity, the coating solution temperature was left at room temperature (25 °C). The coating solution flow or liquid feed flow is critical for ensuring drying conditions. The mass ratio between the solution flow and the air flow needs to ensure the equilibrium relative humidity such that dew point conditions are never obtained. In a practical sense, in this setup, a liquid flow rate of 2 mL/min to air flow values > 50 m3/h seems to be ideal to ensure that the seeds are in contact with the coating solution and also that they dry during fluidization. The nozzle pressure is important to effectively break the liquid into droplets. If the value is too low, the spraying is insufficient or non-uniform. If it is too high, the droplets tend to have too much inertia and have higher chances of being transported in the upper part of the device, at the air filters. The backpressure can be applied more or less frequently. Even if it is beneficial to keep it and use it at high frequencies to reduce filter clogging, it has a negative temporary impact on the liquid feed flow, which reduces the overall performance in terms of overall liquid intake. It can also negatively affect fluidization as it can temporarily reduce the air flow, which takes the whole system into sub-minimal fluidization conditions.
In this setup, a fractional factorial design was used to reduce the number of experiments required to evaluate the relative importance of the factors, which are described in Table 1 and Table 2. The term coefficients presented in Table 6 are very useful for assessing the relative importance of the varied factors. The liquid flow rate is the term that is of the highest importance with respect to all response variables, and its optimum value is chosen to be at the minimal level as it leads to minimal filter clogging. Even if the process is overall slower at low than at high liquid flow rated, the fact that the volume condition is achieved at this setting is equivalent to running the process under stable conditions. The variation in nozzle pressure is not seen to have any significant impact on the measured variables. For this reason, the minimal level is considered optimal in accordance with the qualitative observation presented in Table 11. The backpressure interval variation affects the process significantly only at the highest coating solution flow of 4 mL/min (Figure 2f). This is why this condition is set to an optimal interval of 10 s, which maximizes the stability of fluidization and the observable flow of liquid. Finally, the seed mass (Figure 2b) must be maximized since it is useful to maintain a stable fluidization behavior and it also affects the yield of coverage considerably. Upon a separate assessment, 100 g mass of seeds are considered sufficient to ensure stable conditions.
All in all, the optimal conditions require 100 g of seeds to be treated with the coating solution consisting of 10 g/L of sodium alginate and 10 g/L of glycerol at 25 °C and a flow rate of 2 mL/min, a nozzle pressure of 1.2 bar, a backpressure interval of 10 s, and an air flow temperature of 40 °C. The significance of the terms measured, estimated by the p-values presented in Table 4, and the high adjusted and predicted coefficients of determination in Table 5 contribute to the validity of these conclusions. The model coefficients for the coded factors are comparable and show the relative importance of each term. A useful observation is that the liquid flow rate is the most significant term with respect to all response variables.
Table 12 presents the fact that the interaction terms are aliased in each case with a different interaction term.

Table 12.
Aliased terms for the fractional factorial design.
The final time depends only on the liquid flow rate and is not affected significantly by any of the aliased terms. For the final pressure, there is an interaction between the liquid flow rate (term A) and the seed mass (term B), which could be aliased with terms C (backpressure interval) and D (nozzle pressure). Given the fact that both nozzle pressure and the backpressure interval have a low impact on all response variables and that the main terms are not found to be significant with respect to the final pressure, it is considered that AB is the interaction term that manifests in the case of the final pressure response variable. A similar argument can be built concerning the final volume for which the significant interaction term AC is aliased with the BD term, which is also composed of non-significant main terms.
The shape of the curve in Figure 4 shows changes in the fluidization regime in the Wurster tube. This brings qualitative information about how the cycling of seeds happens inside the coating volume. Since the fluidization air speed is proportional to a certain gap volume, we notice that a higher air speed is necessary to fluidize a smaller mass of seeds that will cycle back at the bottom of the Wurster tube. This air speed is correlated with higher kinetic energy collisions, which result in scratches on the exterior of seeds. Therefore, at seed masses higher than 100 g, a lower minimal air speed is required.
The curves presented in Figure 5 give qualitative and quantitative information about the coating process. The curves represented are obtained from independent batches that follow the same general trend. They were represented in relative time to describe the evolution of the curves gradually from 20 min to 1 h to 3 h. The process for the uncoated seeds acted as a control for the coated ones in order to try separating the effect of the coating unit on the seeds without actually coating them during the process. The chaotic behavior observed in the case of the uncoated seeds indicates that a different phenomenon takes place if the seeds do not become coated. Given the rate of seed-to-seed impacts, it is possible that the native exterior of the seed gradually fragments and begins to accumulate at the nozzle since the air coming in at 1.2 bar will create a low-pressure region around the nozzle, thus restricting the liquid from being pulled by the same low pressure. The batches that involve the coating solution are much more stable, probably because the developing coating layer mechanically absorbs the kinetic energy of the impacts. This process of coating has given new information showing that the coating actively protects the seeds during the coating process, both from impacts between seeds and from dehydration. The observation is sustained by the images of the seeds at the end of the process that show some degradation of the hilum only in the absence of coating (Figure 7). This implies that the coating at even longer times is not expected to have a significant negative effect on the seeds. This is important information if upscaling of the process is desired.
Quantitatively, the amount of coating depends on the flow rate, as expected, but is also affected by other conditions in the coating unit. Similarly, in this case a constant flow approach was desired, but this setup is not sufficient to achieve this. In a broader sense, this process can be controlled by either regulating the flow so as to maintain a constant pressure inside the unit during the coating process or by controlling (or imposing) the liquid input and measuring the pressure. In industrial situations, a constant pressure would be the desired way of controlling the process, and the process performance would be maximized in relation to this behavior. An alternative to this is to control the process by controlling the pressure (keeping it constant). SEM is a very useful analysis that allows one to observe the coating directly, especially from a qualitative point of view. The measurements of the thickness of the coating do not have statistical value unless they are done with a large number of replicates. Nevertheless, the films appear to be continuous, with a relative variability that decreases as the amount of final coating solution increases. The variability can be related to the spraying process, which has an intrinsic variability regarding the size of the droplets, but also because of the intrinsic variability of the seeds and their dimensions. Another possibility is that the coating can plastically deform during the process by a given amount that can remain constant and become relatively insignificant if the coating layer passes a certain threshold.
4.2. Theoretical Estimation of the Coating Layer Thickness
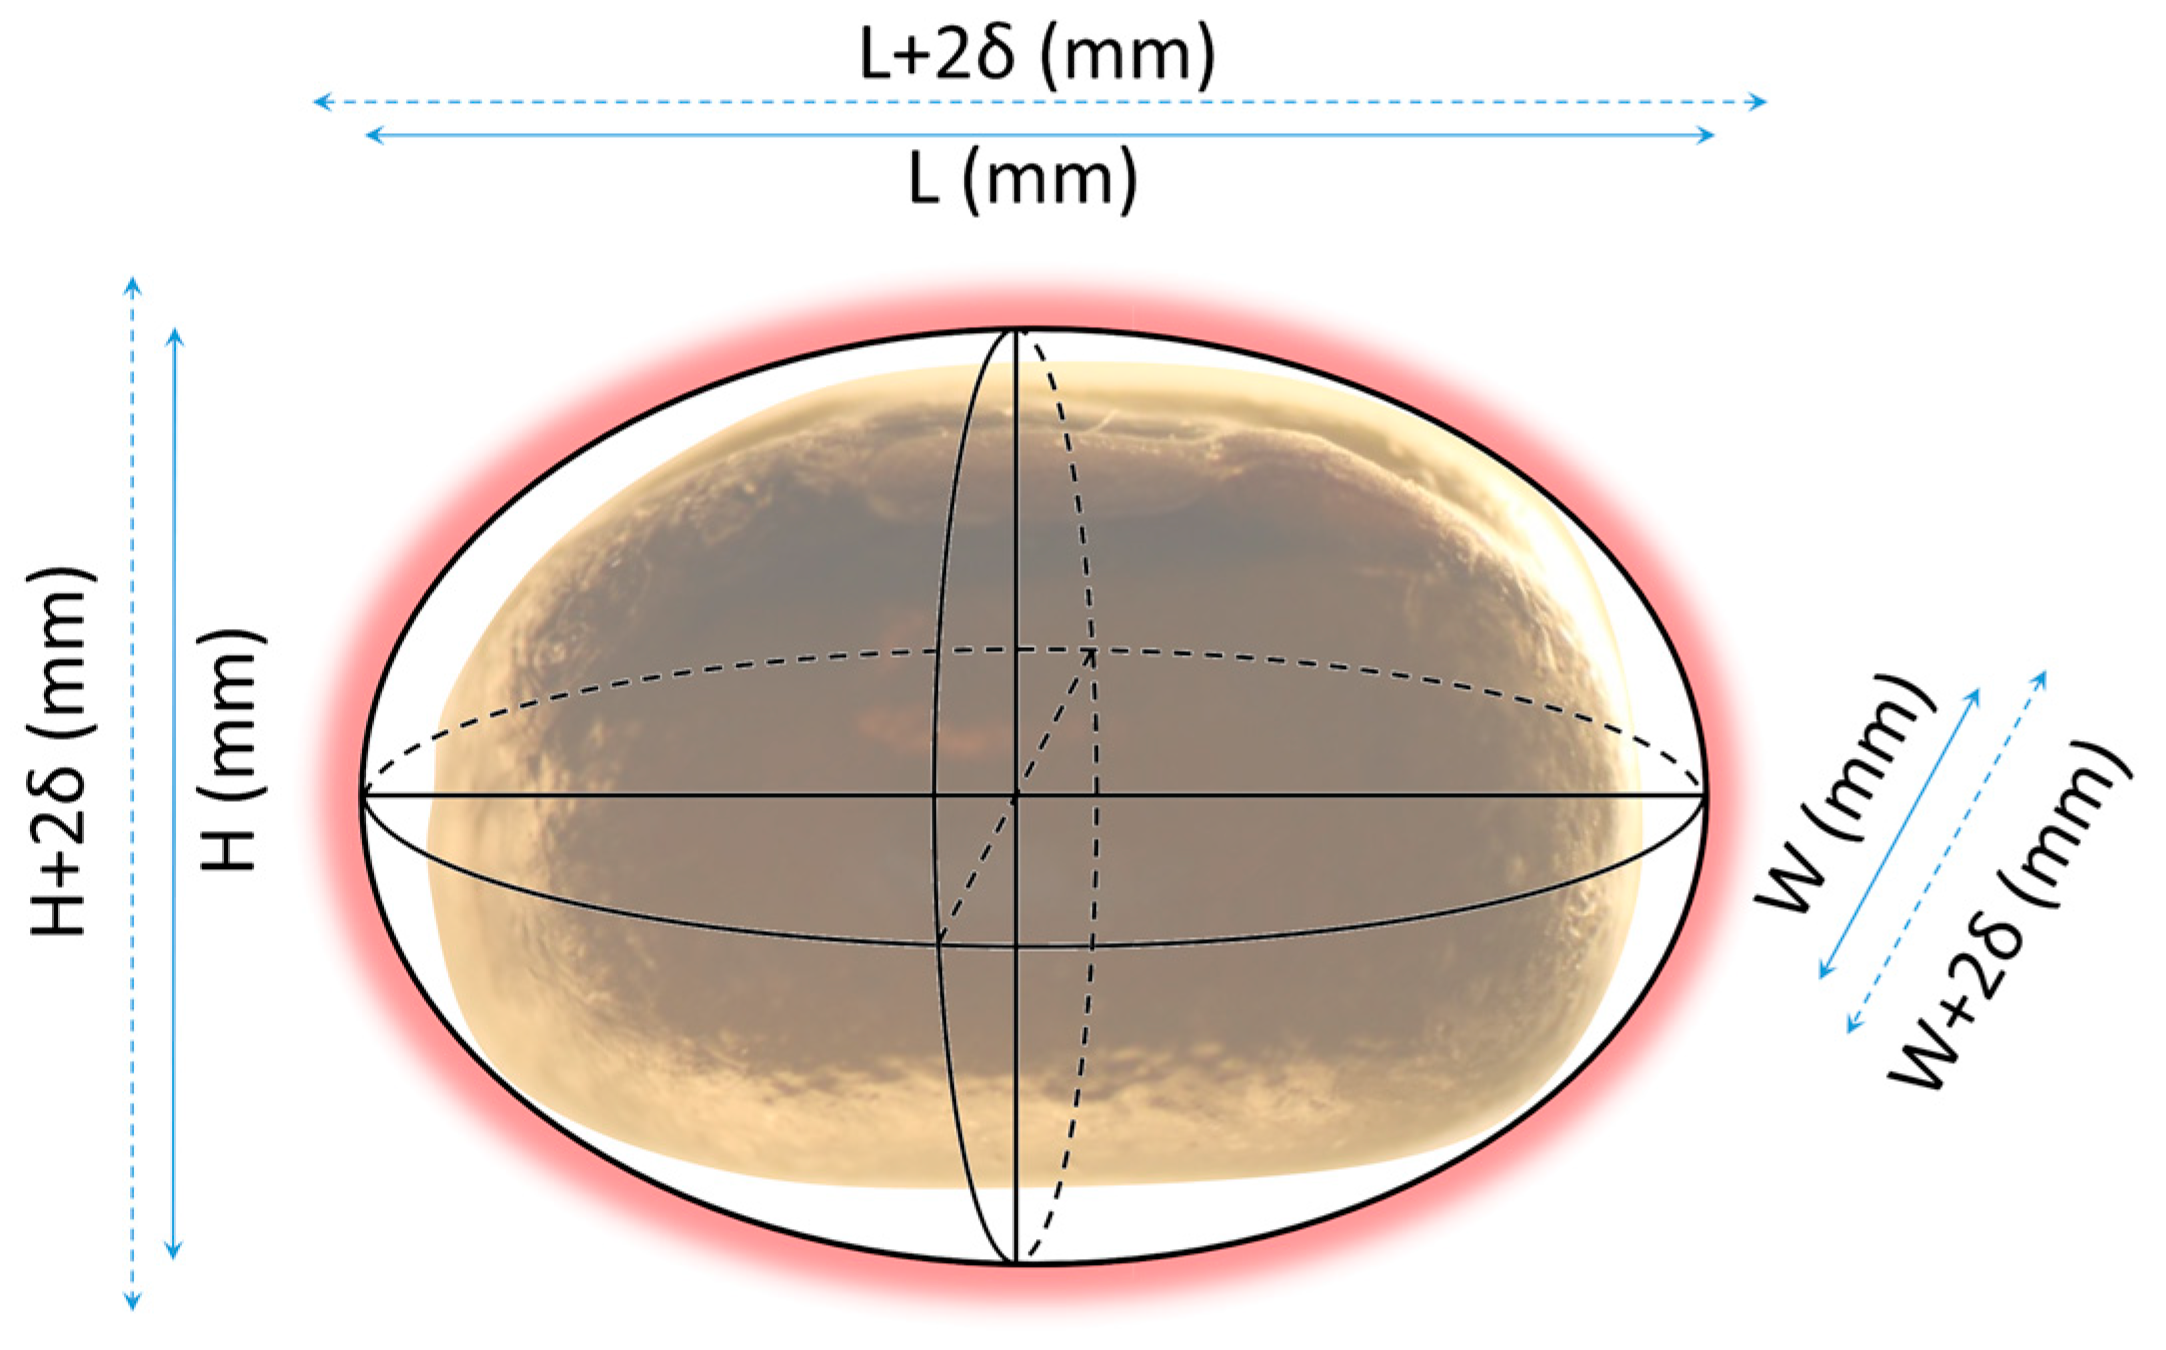
To check the assumption that the coating layer applies consistently over all seeds and that it has the same intrinsic properties as seen at larger scales, a theoretical approach is proposed to estimate the coating layer as a function of seed shape and mass, film properties (especially density), and the amount of coating solution introduced during the process. This approach is illustrated in Figure 10, where one mung bean seed is apparently approximated by an ellipsoid with dimensions L, H, and W, which is then coated by a film with a thickness of δ on all sides.
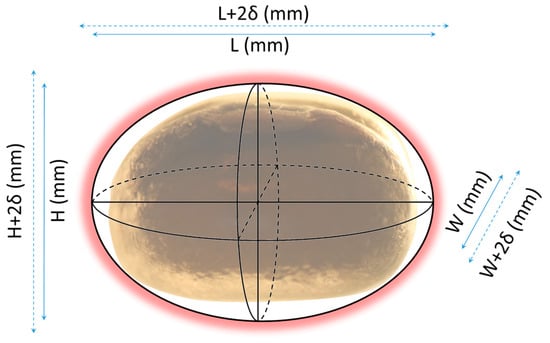
Figure 10.
Depiction of the geometrical estimation of film thickness.
If the Mung seed is assumed to be an ellipsoid with dimensions L, H and W, then its volume should be calculated using Equation (10). If the volume of the seed increases as a coating layer of thickness δ is applied, then the volume of the coated seed is calculated using Equation (11). It can then be theoretically estimated that the volume of the film for one seed should be Vseed+film—Vseed (Equation (12)).
At larger scales, for identical seeds, the number of seeds should be calculated by dividing the mass of seeds by the mass of one seed (Equation (15)). If the mass of coating applied to all seeds is known and the density of the film is known, then the volume of coating applied to all seeds is the ratio between the mass and the density of the film (Equation (14)). To find the volume of coating applied to one seed, the total volume of coating should be divided by the number of seeds (Equation (13)). If the volume of coating applied to one seed derived at small scales is made equal to the volume of coating derived at large scales, the theoretical thickness of the film can be calculated (Equation (16)).
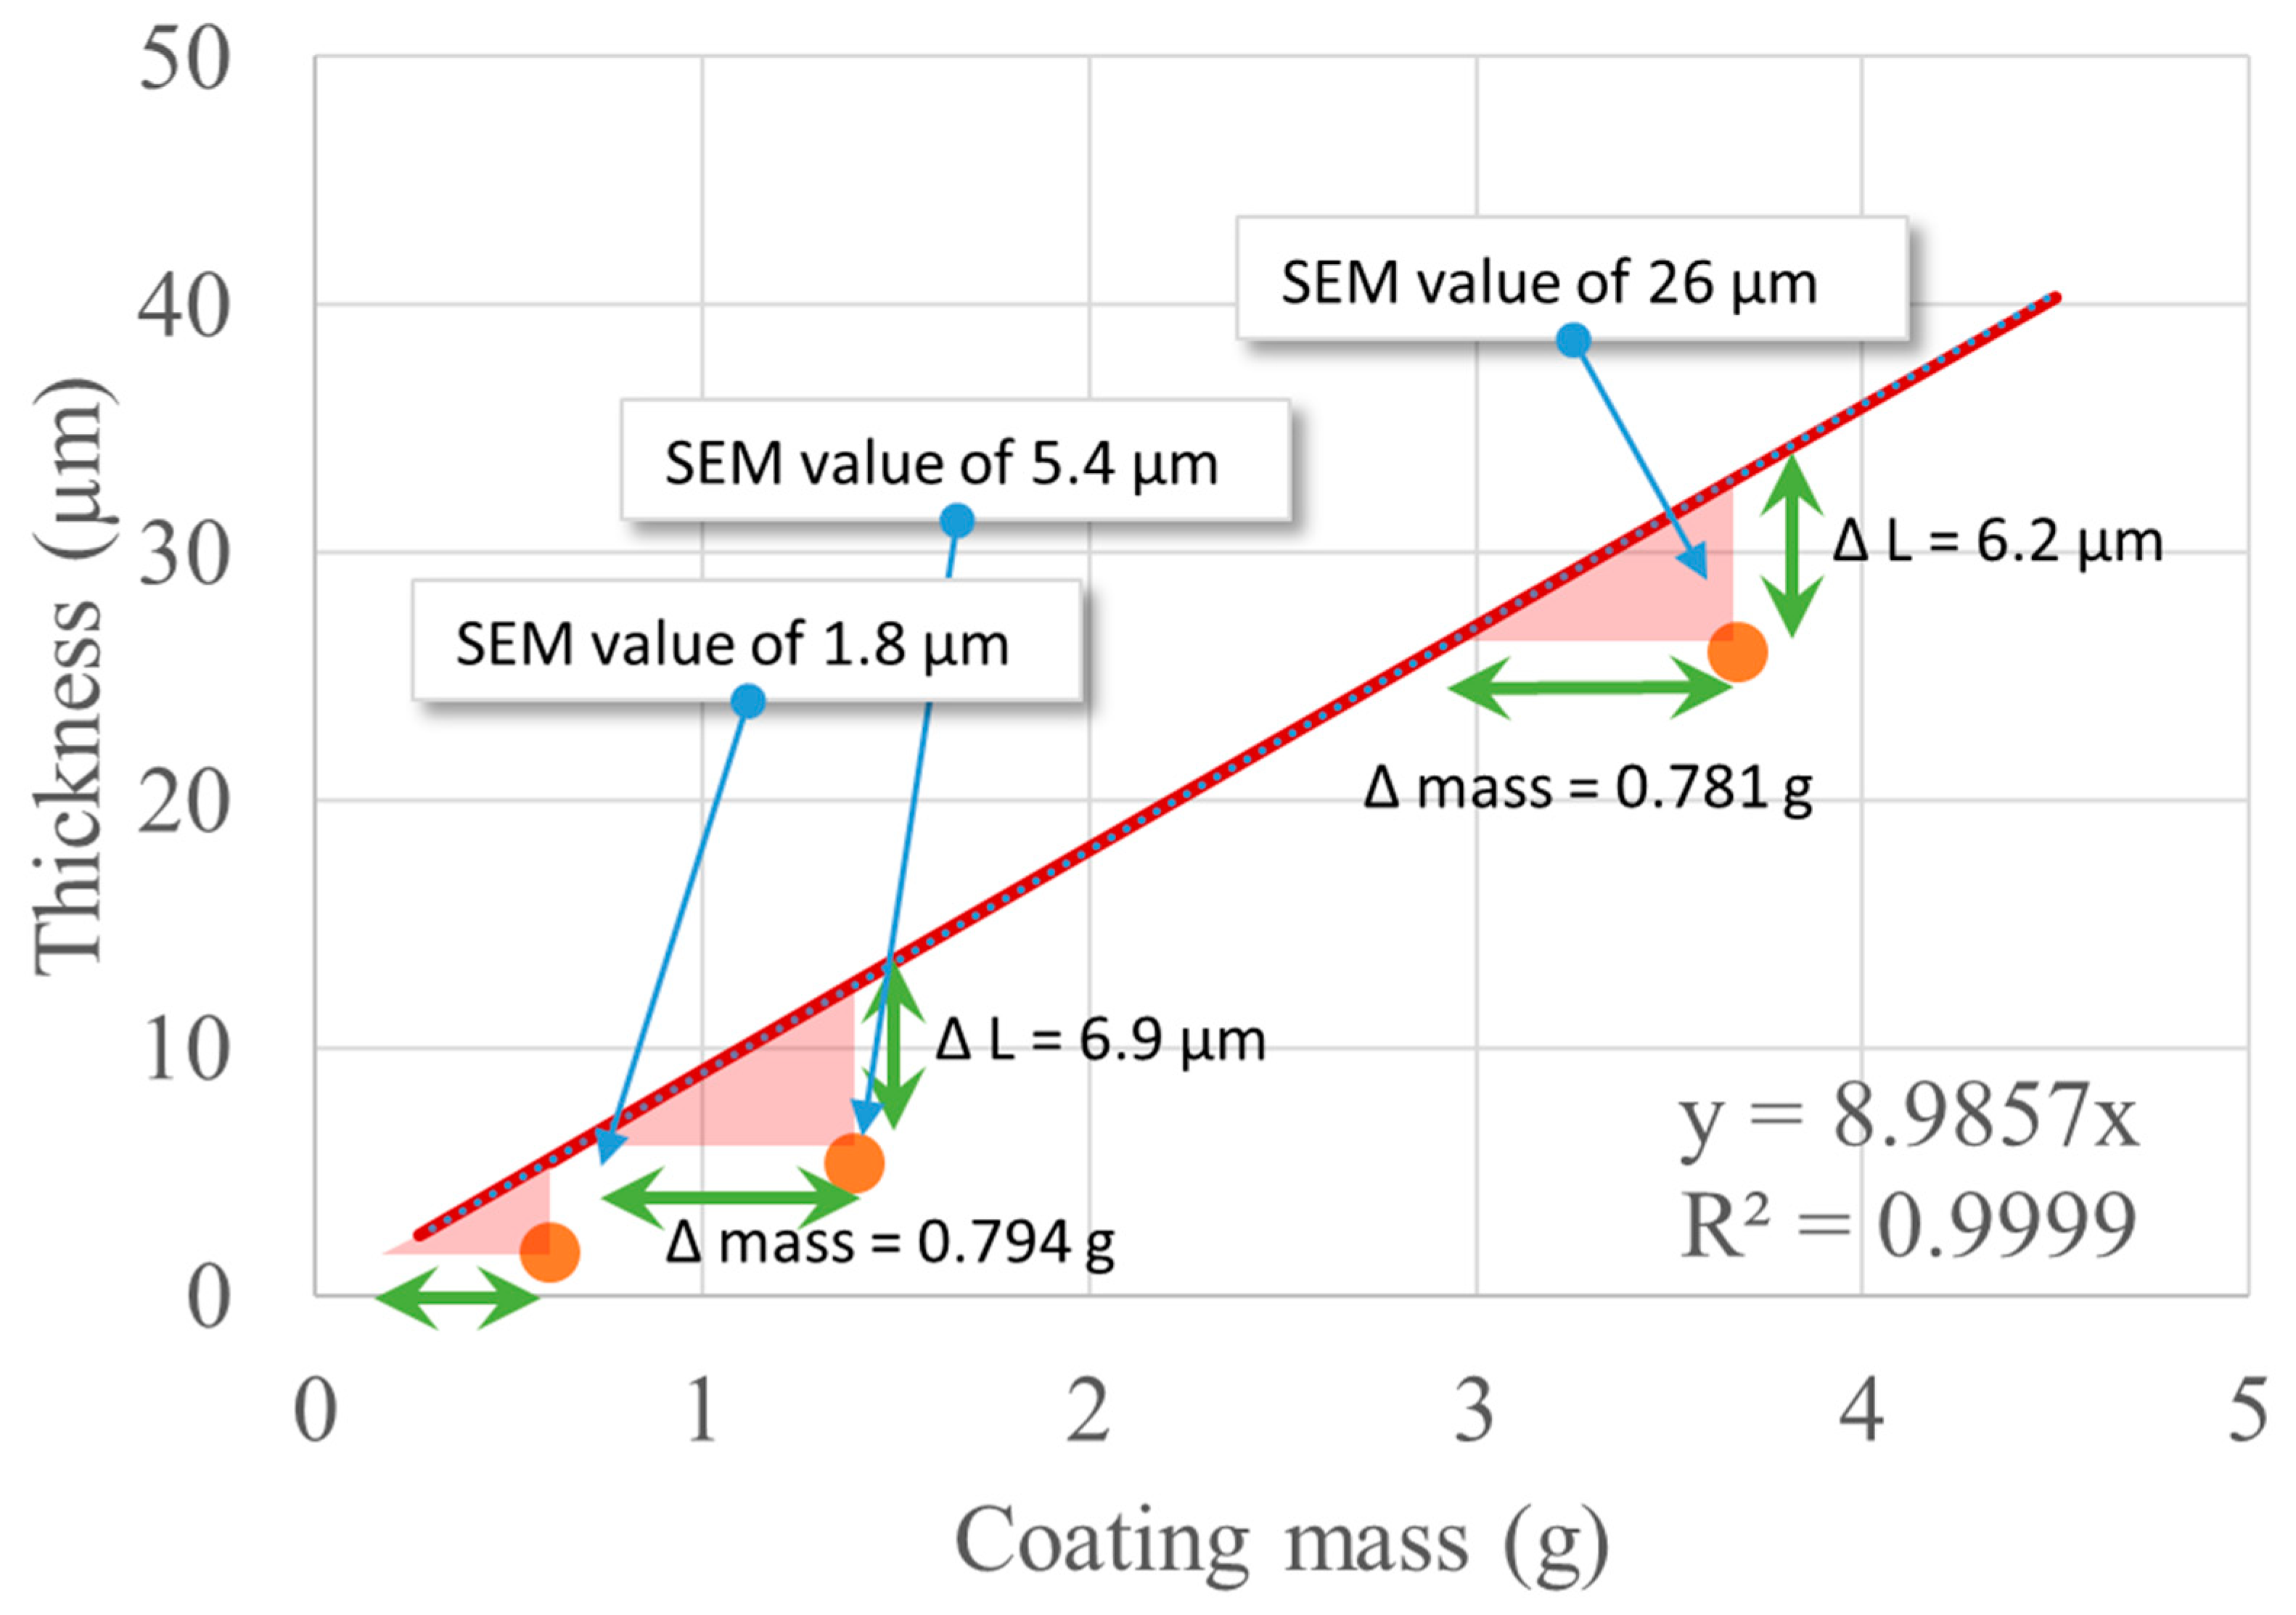
The ellipsoid model was used to estimate the film thickness starting from known information, namely the volume of coating solution that was fed to the unit and the apparent density of the alginate/glycerol coating (Table 7). The mass of the alginate/glycerol coating is directly known if the volume of coating solution is known, and using the equations above, the estimated thickness is found for each case. The values from this estimation and the values found by SEM are compared in Table 13. Figure 11 represents these estimations as well as the continuous values predicted by the ellipsoid model for thicknesses up to 50 µm.

Table 13.
Comparison between the ellipsoid seed model estimations for coating thickness and the values measured from SEM micrographs.
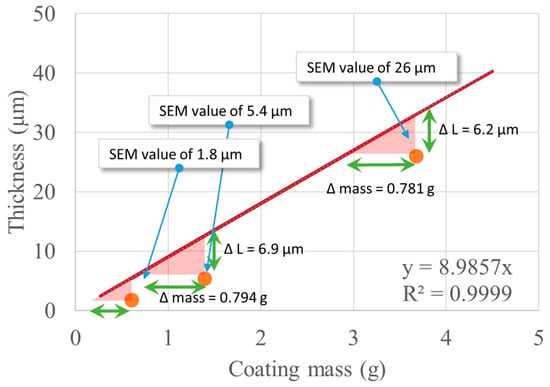
Figure 11.
Theoretical variation of the thickness of film as a function of coating mass and comparison with experimental data.
The geometrical dimensions of the seeds and the apparent density of the alginate/glycerol coating link the coating thickness to the mass of alginate and glycerol, which are introduced into the Wurster coater by a curve that, analytically, is not a line but can be very well approximated by a line for these small values (δ < 100 μm) with a slope of 8.99 μm/g. The values determined by SEM have the same order of magnitude as the theoretical values and are always below the ideal case, which is the ellipsoid model of the Mung seed. One hypothesis is that there is an inherent loss of material in these conditions, which would suggest a yield of 78% for the coating process (with respect to the 3 h process). Another explanation would be that the ellipsoid model overestimates the thickness of the film or that the statistical variability of all the experimentally determined parameters is high enough and needs to be accounted for if a more accurate model is necessary. Both explanations can just as well occur simultaneously.
Seed coating with the alginate-glycerol film prevents the damage to the seed structure induced by the fluidization process (Figure 7e–g compared with Figure 7b–d), even in the case of prolonged coating, which supports the upkeep of hilum functions under various stress conditions [61].
The parameters determined for the estimation of germination capacity following seed coating for different time intervals indicated that the coating protected the seeds during the whole process, which is an important detail when considering applying varying doses of beneficial compounds from the early stages of seed development.
The fluidized bed coaters are less used for seed coating in the research area [6]. The Wurster fluidized bed coating has the potential to be applied for seed coating for various purposes, including preparing seeds for ecological reconstruction. The algorithm for optimal coating conditions in a bottom-spray Wurster fluidized-bed coater is useful for any coating solution/seed pair and further supports the application of this efficient film seed coating in new areas, such as seed treatment for increased safety and improved quality of sprouts and microgreens.
Another perspective is to consider the development of the coating in relation to the specific surface of the seed that is coated. This leads to the legitimate question of asking if the ellipsoid is indeed the shape which models the actual shape of the seed in the most accurate way.
For this, Equation (17) (deduced in the Supplementary Materials: Table S1) holds as long as the ratio between the volume of the seeds (Vs) and surface of the seeds (As) is considered constant up to a certain practical value for the coating. In other words, the thickness of the coating is negligible with respect to the dimensions of the seeds to be coated.
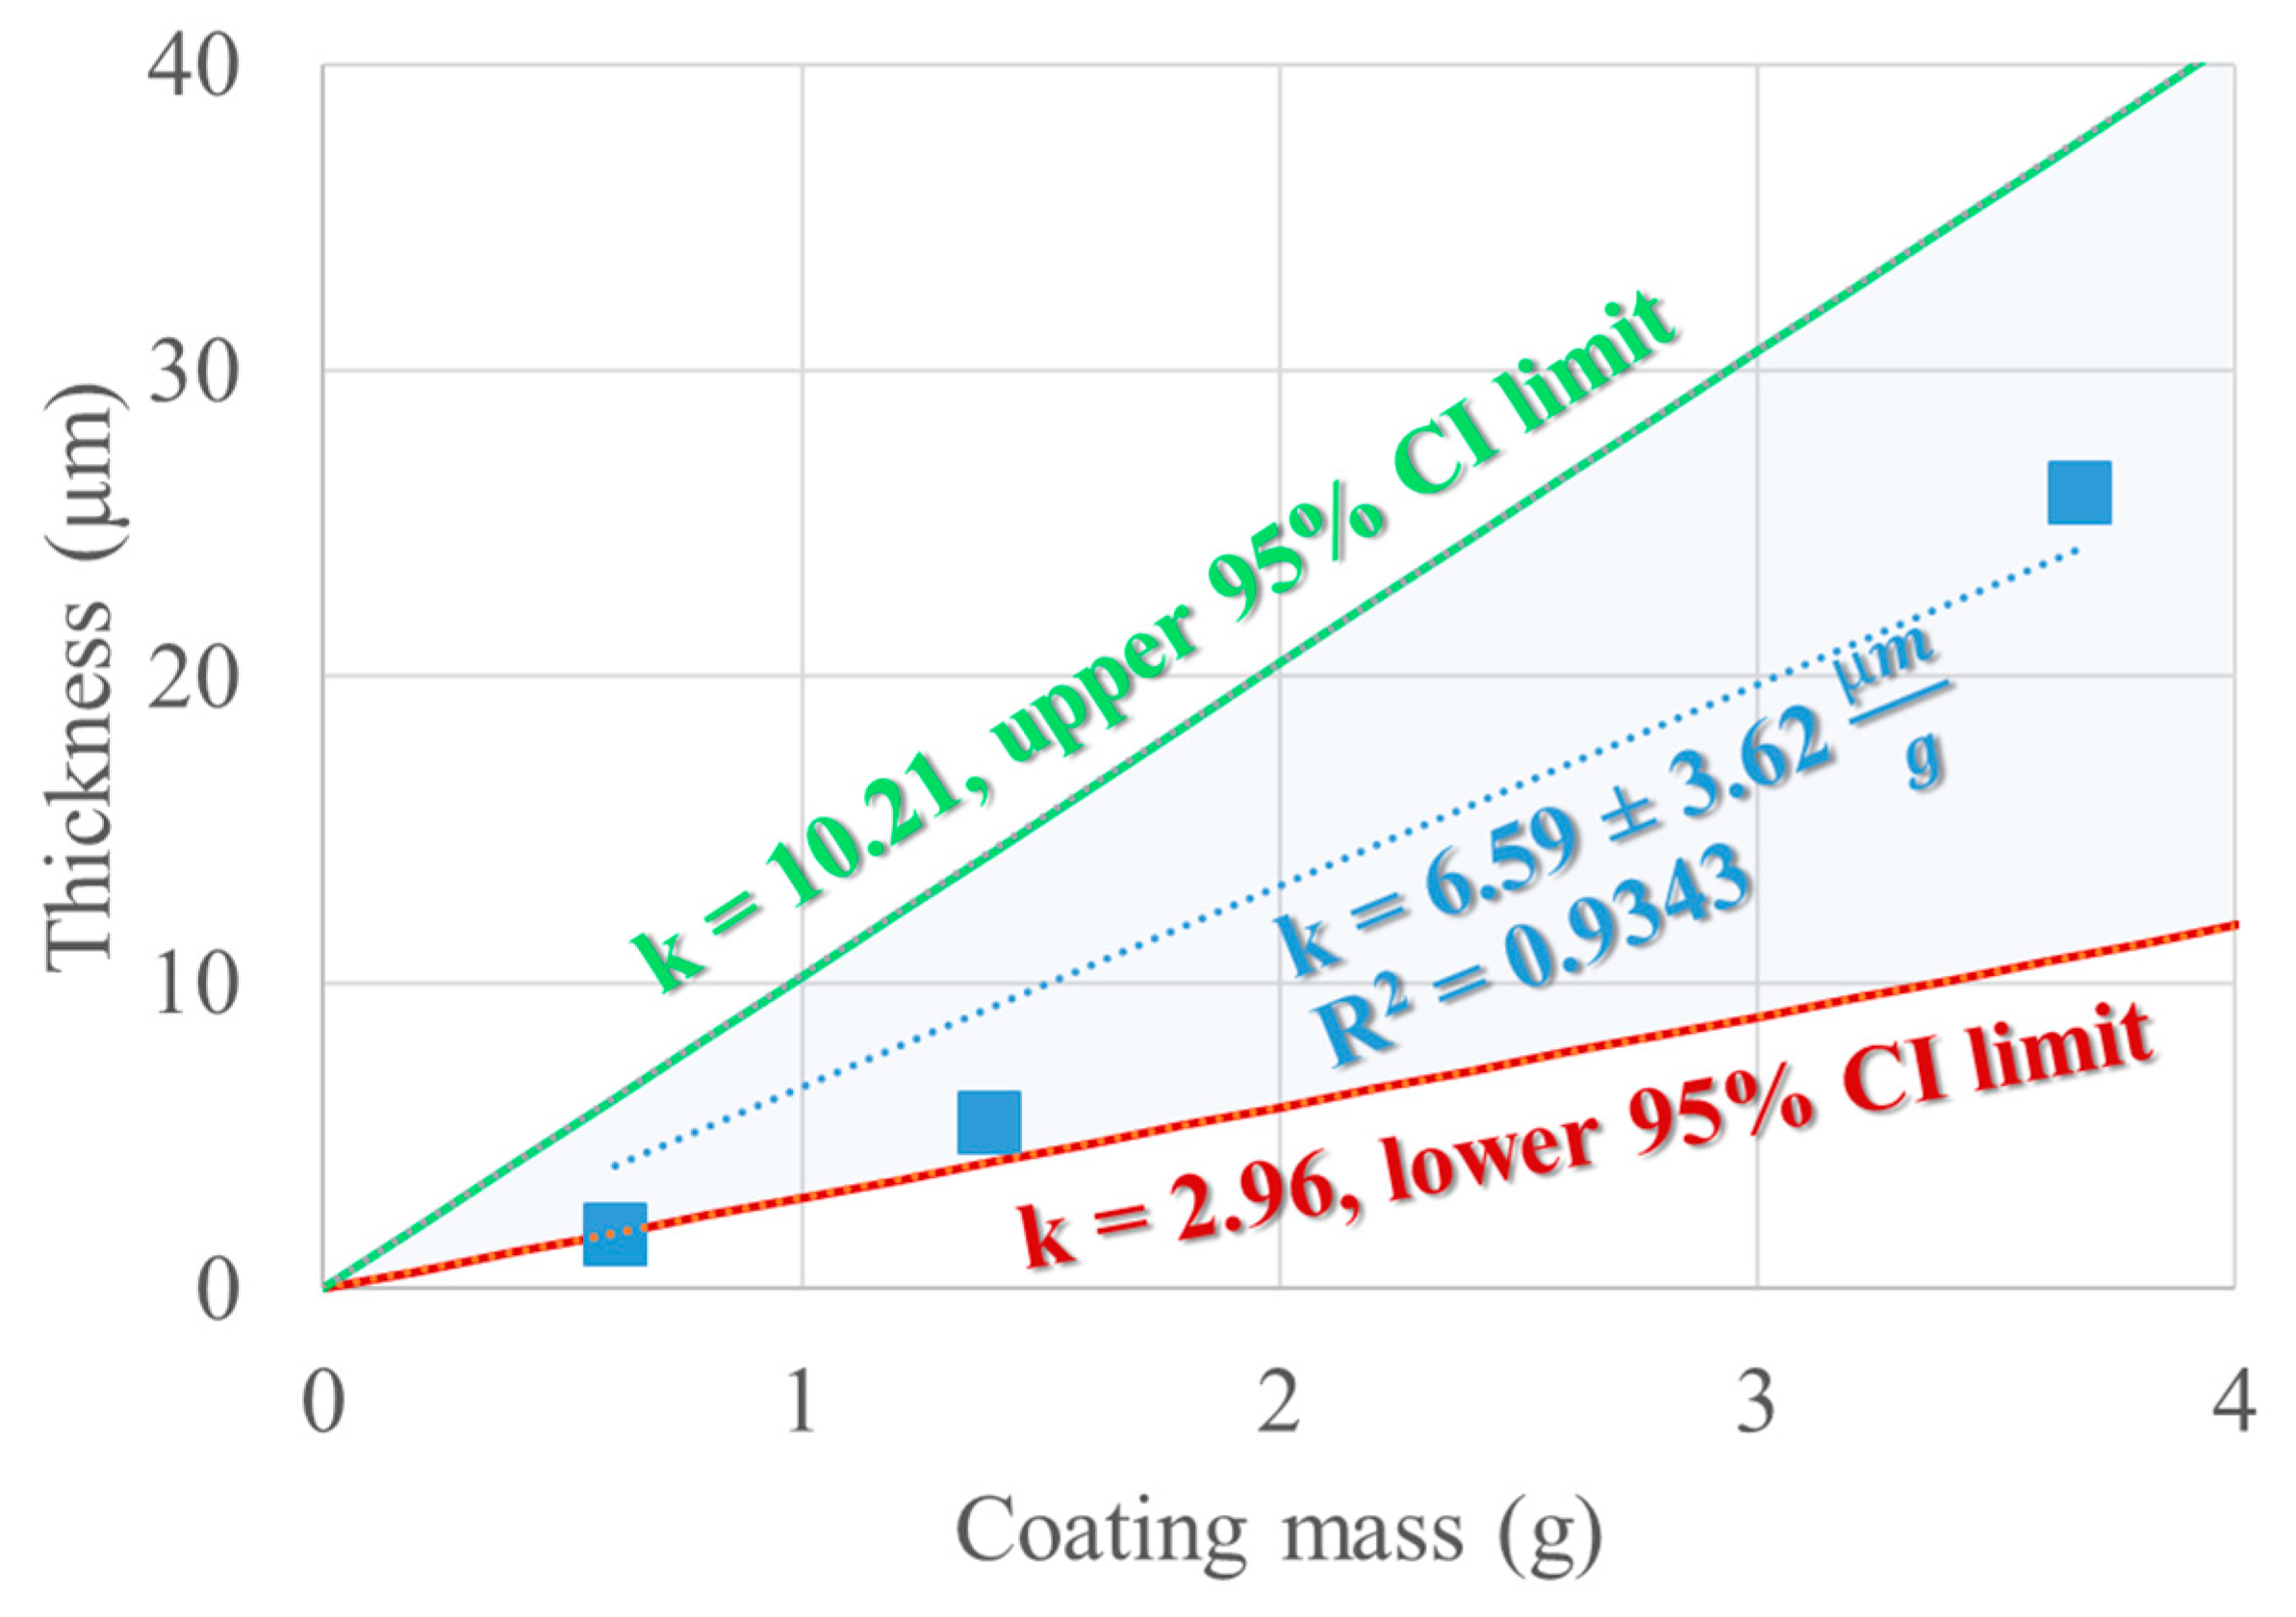
By linear regression, the best curve that fits the experimental values of the SEM-determined coating thickness values corresponding to the known theoretical mass of coating (assuming no loss) will be estimated by the line with no intercept term that best describes the thickness observed by the coating mass, which, in this case, has a value of 6.59 μm/g. The coefficient of determination (R2) has a value of 0.9343 for the three experimental points. By removing the intercept, only the slope (kexp) remains as a predictive term. To account for the experimental variability, for kexp upper and lower confidence intervals can be estimated and are depicted in Figure 12. The unexplained variability could be attributed to the process but also to the thickness measurement, which does not establish a measure for the variability of the coating thickness on one seed or between different seeds.
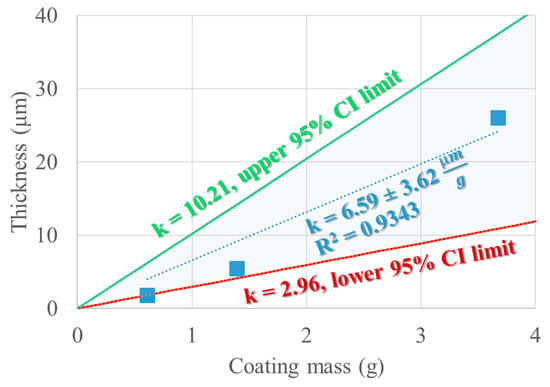
Figure 12.
Confidence interval (95%) and expected value of the slope describing δ = f (mcoating).
ρseeds (the density of the seeds) is determined to be 1.29 ± 0.13 g.cm−3 and the coating density is already known to have a value of 1.19 g.cm−3. The mass of the seeds is also known to be 100 g. This leads to the assumption that Vs × As−1 × η = 0.608 mm, where η is the yield of the coating process. The yield could be determined experimentally, but it is less practical and very prone to errors. On the other hand, Vs is a value that can be determined experimentally by the pycnometric method [62]. By reinterpreting the seed dimensions measured in Table 8 as maximum and minimum feret diameters, several seed shape models are possible [62], such as the oblate spheroid and the 2 sphere segments model. Table 14 compares the three models with respect to the experimentally determined seed volume and the corresponding ratio between Vs and As. The expected yield is also estimated such that the value of k is true (6.59 μm/g).

Table 14.
Predicted values for the Vs to As ratio and corresponding expected yields for k = 6.59 μm/g.
The experimentally determined value for the mean seed volume is 51.2 ± 6.6 mm3, which is also presented in Table 14 in comparison to the mean seed volumes considered if the maximum and minimum feret diameters account for parameters in different types of shapes. The general ellipsoid predicts a 45.09 mm3 volume, while the oblate spheroid predicts a higher value at 59.12 mm3. The closest value is predicted by the 2-sphere segment shape at 52.70 mm3, which is the closest value to the mean seed volume determined experimentally, 51.2 mm3. Vs × As−1 × η = 0.608 m, and the yield can be estimated to completely explain the slope value of k, which is shown in Figure 11 of 6.59 μm/g. If the 2-sphere segments are used, the yield should be 79%, which is credible.
5. Conclusions
The Wurster seed coating process was optimized using a partial factorial design, which allowed the evaluation of four process parameters: the coating solution feed flow, the nozzle pressure, the backpressure interval, and the mass of fluidized seeds. Using this approach, the interaction terms were aliased but could be separated and quantified in terms of statistical significance with respect to the response variables that were imposed. The optimal solution was defined as the combination that maximizes the process time and the total volume of the coating solution while minimizing the pressure in the fluidization chamber. The optimal solution was found at a liquid flow of 2 mL/min, a nozzle pressure of 1.2 bar, a backpressure interval of 10 s, and a mass of seeds of 40 g. Qualitative information regarding the fluidization of the seeds showed that a mass of 100 g and above presents a more stable fluidization regime at the given conditions. The performance of the coating process in terms of coating thickness was estimated as a function of the total alginate/glycerol coating solution introduced during the process, the apparent density of the alginate/glycerol film, and the geometrical dimensions best approximating the mung seed, which were approximated ideally in this case by an ellipsoid. The estimations of this model were compared with the coating thickness values observed by SEM. The real values were close to the ideal estimations. The difference between the model and the coating thickness values measured by SEM could be a consequence of material and process variability or an inaccurate enough estimation of the yield of the coating process. The mung seeds were coated for 20 min, 1 h and 3 h at 40 °C in minimal fluidization conditions with the following optimal parameters: a coating solution flow rate of 2 mL/min, which gradually decreased as the air filters became more and more clogged, a backpressure interval of 10 s with a nozzle pressure of 1.2 bar, in batches of 100 g of seeds, which resulted in batches of coated mung seeds with coating thicknesses of 1.8 μm, 5.4 μm, and 26 μm for 20 min, 1 h, and 3 h process times, respectively, as determined by SEM. The viability of the coated seeds was demonstrated by assessing specific biological parameters such as germination percentage, germination energy, germination rate, mean germination time, and the vigor index. There were no statistically significant differences in terms of seed viability between the variants.
Supplementary Materials
The following supporting information can be downloaded at: https://www.mdpi.com/article/10.3390/coatings13030562/s1, Step 1 to 10 for Equation (17) deduction.
Author Contributions
Conceptualization, F.O. and B.T.; methodology, B.T., N.T. and D.C.-A.; validation, B.T. and N.T.; formal analysis, B.T. and N.T.; investigation, B.T. and N.T.; resources, F.O.; writing—original draft preparation, B.T. and N.T.; writing—review and editing, F.O. and D.C.-A.; visualization, B.T., N.T. and D.C-A.; supervision, F.O.; project administration, F.O. and B.T.; funding acquisition, F.O. All authors have read and agreed to the published version of the manuscript.
Funding
This work was funded by project POC-A1-A1.2.3-G-2015-P_40_352-SECVENT, Sequential processes to close bioeconomy side stream and innovative bioproducts resulted from these, contract 81/2016, SMIS 105684, funded by cohesion funds of the European Union, subsidiary project 1230/2020. The APC was paid from project POC-A1-A1.2.3-G-2015-P_40_352-SECVENT.
Institutional Review Board Statement
Not applicable.
Informed Consent Statement
Not applicable.
Data Availability Statement
Data sharing is not applicable to this article, because no more data than those presented in this articles were produced.
Acknowledgments
For the SEM images the infrastructure created in the frame of the project 15PFE/2021 NeXT-BExcel was used, and it is acknowledged.
Conflicts of Interest
The authors declare no conflict of interest.
References
- Coating Place, Inc. History. Available online: https://www.coatingplace.com/our-history/our-history.html (accessed on 10 January 2023).
- Frey, C. Fluid bed coating-based microencapsulation. In Microencapsulation in the Food Industry: A Practical Implementation Guide; Elsevier: Amsterdam, The Netherlands, 2014; pp. 65–79. [Google Scholar]
- Jones, D.; Godek, E. Development, optimization, and scale-up of process parameters: Wurster coating. In Developing Solid Oral Dosage Forms: Pharmaceutical Theory and Practice, 2nd ed.; Elsevier: Amsterdam, The Netherlands, 2017; pp. 997–1014. [Google Scholar]
- Heinrich, S.; Dosta, M.; Antonyuk, S. Multiscale analysis of a coating process in a wurster fluidized bed apparatus. In Mesoscale Modeling in Chemical Engineering Part I, 2015; Marin, G.B., Li, J., Eds.; Academic Press Inc.: Cambridge, MA, USA, 2015; Volume 46, pp. 83–135. [Google Scholar]
- Hely, F.W. Survival studies with Rhizobium trifolii on seed of Trifolium incarnatum L. Inoculated for aerial sowing. Aust. J. Agric. Res. 1965, 16, 575–589. [Google Scholar] [CrossRef]
- Pedrini, S.; Merritt, D.J.; Stevens, J.; Dixon, K. Seed coating: Science or marketing spin? Trends Plant Sci. 2017, 22, 106–116. [Google Scholar] [CrossRef]
- Afzal, I.; Javed, T.; Amirkhani, M.; Taylor, A.G. Modern seed technology: Seed coating delivery systems for enhancing seed and crop performance. Agriculture 2020, 10, 526. [Google Scholar] [CrossRef]
- Ehsanfar, S.; Modarres-Sanavy, S.A. Crop protection by seed coating. Commun. Agric. Appl. Biol. Sci. 2005, 70, 225–229. [Google Scholar] [PubMed]
- Rocha, I.; Ma, Y.; Souza-Alonso, P.; Vosátka, M.; Freitas, H.; Oliveira, R.S. Seed coating: A tool for delivering beneficial microbes to agricultural crops. Front. Plant Sci. 2019, 10, 1357. [Google Scholar] [CrossRef]
- Paravar, A.; Piri, R.; Balouchi, H.; Ma, Y. Microbial seed coating: An attractive tool for sustainable agriculture. Biotechnol. Rep. 2023, 37, e00781. [Google Scholar] [CrossRef]
- Ma, Y. Seed coating with beneficial microorganisms for precision agriculture. Biotechnol. Adv. 2019, 37, 107423. [Google Scholar] [CrossRef]
- Amirkhani, M.; Mayton, H.S.; Netravali, A.N.; Taylor, A.G. A seed coating delivery system for bio-based biostimulants to enhance plant growth. Sustainability 2019, 11, 5304. [Google Scholar] [CrossRef]
- Yuliar; Nion, Y.A.; Toyota, K. Recent trends in control methods for bacterial wilt diseases caused by Ralstonia solanacearum. Microbes Environ. 2015, 30, 1–11. [Google Scholar]
- Ren, X.-X.; Chen, C.; Ye, Z.-H.; Su, X.-Y.; Xiao, J.-J.; Liao, M.; Cao, H.-Q. Development and application of seed coating agent for the control of major soil-borne diseases infecting wheat. Agronomy 2019, 9, 413. [Google Scholar] [CrossRef]
- Zhang, Y.; Li, Y.; Liang, S.; Zheng, W.; Chen, X.; Liu, J.; Wang, A. Study on the preparation and effect of tomato seedling disease biocontrol compound seed-coating agent. Life 2022, 12, 849. [Google Scholar] [CrossRef]
- Ester, A.; de Putter, H.; van Bilsen, J.G.P.M. Filmcoating the seed of cabbage (Brassica oleracea L. Convar. Capitata L.) and cauliflower (Brassica oleracea L. Var. Botrytis L.) with imidacloprid and spinosad to control insect pests. Crop Prot. 2003, 22, 761–768. [Google Scholar]
- Pumnuan, J.; Sarapothong, K.; Sikhao, P.; Pattamadilok, C.; Insung, A. Film seeds coating with hexane extracts from Illicium verum Hook.F. and Syzygium aromaticum (L.) merrill & perry for controlling Callosobruchus maculatus (F.) and Callosobruchus chinensis L. Pest. Manag. Sci. 2021, 77, 2512–2521. [Google Scholar]
- Friuli, M.; Nitti, P.; Cafuero, L.; Prete, A.; Zafar, M.S.; Madaghiele, M.; Demitri, C. Cellulose acetate and cardanol based seed coating for intraspecific weeding coupled with natural herbicide spraying. J. Polym. Environ. 2020, 28, 2893–2904. [Google Scholar] [CrossRef]
- Lee, N.; Thierfelder, C. Weed control under conservation agriculture in dryland smallholder farming systems of southern africa. A review. Agron. Sustain. Dev. 2017, 37, 48. [Google Scholar] [CrossRef]
- Patra, S.K.; Poddar, R.; Brestic, M.; Acharjee, P.U.; Bhattacharya, P.; Sengupta, S.; Pal, P.; Bam, N.; Biswas, B.; Barek, V.; et al. Prospects of hydrogels in agriculture for enhancing crop and water productivity under water deficit condition. Int. J. Polym. Sci. 2022, 2022, 4914836. [Google Scholar] [CrossRef]
- McGee, D.; Burris, J.; Lach, J.; Grover, P.; Bilous, R. Seed Coating with Environmentally Acceptable Polymers as an Alternative to Fungicide Treatment of Corn and Soybeans; Iowa State University: Ames, IA, USA, 1993. [Google Scholar]
- Korbecka-Glinka, G.; Piekarska, K.; Wiśniewska-Wrona, M. The use of carbohydrate biopolymers in plant protection against pathogenic fungi. Polymers 2022, 14, 2854. [Google Scholar] [CrossRef]
- Raj, S.N.; Lavanya, S.; Sudisha, J.; Shetty, H.S. Applications of biopolymers in agriculture with special reference to role of plant derived biopolymers in crop protection. In Biopolymers: Biomedical and Environmental Applications; John Wiley and Sons: Hoboken, NJ, USA, 2011; pp. 459–481. [Google Scholar]
- Thobunluepop, P.; Pawelzik, E.; Vearasilp, S. The perspective effects of various seed coating substances on rice seed variety khao dawk mali 105 storability i: The case study of physiological properties. Pak. J. Biol. Sci. 2008, 11, 2291–2299. [Google Scholar] [CrossRef]
- Xu, T.; Ma, C.; Aytac, Z.; Hu, X.; Ng, K.W.; White, J.C.; Demokritou, P. Enhancing agrichemical delivery and seedling development with biodegradable, tunable, biopolymer-based nanofiber seed coatings. ACS Sustain. Chem. Eng. 2020, 8, 9537–9548. [Google Scholar] [CrossRef]
- Elshafie, H.S.; Camele, I. Applications of absorbent polymers for sustainable plant protection and crop yield. Sustainability 2021, 13, 3253. [Google Scholar] [CrossRef]
- Chandrika, K.S.V.P.; Prasad, R.D.; Godbole, V. Development of chitosan-peg blended films using trichoderma: Enhancement of antimicrobial activity and seed quality. Int. J. Biol. Macromol. 2019, 126, 282–290. [Google Scholar] [CrossRef]
- Jarecki, W. Soybean response to seed coating with chitosan + alginate/peg and/or inoculation. Agronomy 2021, 11, 1737. [Google Scholar] [CrossRef]
- Kappel, L.; Kosa, N.; Gruber, S. The multilateral efficacy of chitosan and trichoderma on sugar beet. J. Fungi 2022, 8, 137. [Google Scholar] [CrossRef]
- Peña-Datoli, M.; Hidalgo-Moreno, C.M.I.; González-Hernández, V.A.; Alcántar-González, E.G.; Etchevers-Barra, J.D. Maize (Zea mays L.) seed coating with chitosan and sodium alginate and its effect on root development. Agrociencia 2016, 50, 1091–1106. [Google Scholar]
- Prasad, R.D.; Chandrika, K.S.V.P.; Godbole, V. A novel chitosan biopolymer based trichoderma delivery system: Storage stability, persistence and bio efficacy against seed and soil borne diseases of oilseed crops. Microbiol Res. 2020, 237, 126487. [Google Scholar] [CrossRef] [PubMed]
- Di Filippo-Herrera, D.A.; Muñoz-Ochoa, M.; Hernández-Herrera, R.M.; Hernández-Carmona, G. Biostimulant activity of individual and blended seaweed extracts on the germination and growth of the mung bean. J. Appl. Phycol. 2019, 31, 2025–2037. [Google Scholar] [CrossRef]
- Dos Santos Rocha, S.C.; Taranto, O.P. Granulation and particle coating. In Spouted and Spout-Fluid Beds: Fundamentals and Applications; Cambridge University Press: Cambridge, UK, 2010; Volume 9780521517973, pp. 222–237. [Google Scholar]
- Jones, D.M. Coating processes and equipment. In Pharmaceutical Dosage Forms—Tablets; CRC Press: Boca Raton, FL, USA, 2016; pp. 373–397. [Google Scholar]
- Szafran, R.G. Fluid-bed technology for encapsulation and coating purposes. In Encapsulation Nanotechnologies; John Wiley and Sons: Hoboken, NJ, USA, 2013; pp. 71–105. [Google Scholar]
- Pasha, M.; Hare, C.; Ghadiri, M.; Gunadi, A.; Piccione, P.M. Inter-particle coating variability in a rotary batch seed coater. Chem. Eng. Res. Des. 2017, 120, 92–101. [Google Scholar] [CrossRef]
- Wang, J.; Xie, H.; Hu, Z.; Hu, L.; Peng, B.; Liu, M. Parameter optimization on mechanical coating processing of rotary table-roller coating machine for peanut seeds. Nongye Gongcheng Xuebao 2017, 33, 43–50. [Google Scholar]
- Prihatiningsih, N.; Erminawati; Djatmiko, H.A. Shelf-life of bacillus subtilis b298 inclusion in biopesticide microencapsule formula and its efficacy in suppressing anthracnose disease on chili. In Proceedings of the Southeast Asia Plant Protection Conference 2019, SEAPPRO 2019, Bogor, Indonesia, 14 August 2019; Institute of Physics Publishing: Bristol, UK, 2020. [Google Scholar]
- Bayer, C.; Bernard, H.; Prager, R.; Rabsch, W.; Hiller, P.; Malorny, B.; Pfefferkorn, B.; Frank, C.; De Jong, A.; Friesema, I. An outbreak of salmonella newport associated with mung bean sprouts in germany and the netherlands, october to November 2011. Eurosurveillance 2014, 19, 20665. [Google Scholar] [CrossRef] [PubMed]
- Mohle-Boetani, J.; Farrar, J.; Bradley, P.; Barak Cunningham, J.; Miller, M.; Mandrell, R.; Mead, P.; Keene, W.; Cummings, K.; Abbott, S. Salmonella infections associated with mung bean sprouts 2000–2002: Epidemiological and environmental investigations. Epidemiol. Infect. 2008, 2, 1–10. [Google Scholar]
- Iacumin, L.; Comi, G. Microbial quality of raw and ready-to-eat mung bean sprouts produced in Italy. Food Microbiol. 2019, 82, 371–377. [Google Scholar] [CrossRef]
- Fu, Y.; Bhunia, A.K.; Yao, Y. Alginate-based antimicrobial coating reduces pathogens on alfalfa seeds and sprouts. Food Microbiol. 2022, 103, 103954. [Google Scholar] [CrossRef]
- Aitouguinane, M.; Bouissil, S.; Mouhoub, A.; Rchid, H.; Fendri, I.; Abdelkafi, S.; Ould El-Hadj, M.D.; Boual, Z.; Dubessay, P.; Gardarin, C.; et al. Induction of natural defenses in tomato seedlings by using alginate and oligoalginates derivatives extracted from moroccan brown algae. Mar. Drugs 2020, 18, 521. [Google Scholar] [CrossRef]
- Bouissil, S.; El Alaoui-Talibi, Z.; Pierre, G.; Michaud, P.; El Modafar, C.; Delattre, C. Use of alginate extracted from moroccan brown algae to stimulate natural defense in date palm roots. Molecules 2020, 25, 720. [Google Scholar] [CrossRef] [PubMed]
- Salachna, P. Effects of depolymerized gellan with different molecular weights on the growth of four bedding plant species. Agronomy 2020, 10, 169. [Google Scholar] [CrossRef]
- Liu, H.; Kang, Y.; Zhao, X.; Liu, Y.; Zhang, X.; Zhang, S. Effects of elicitation on bioactive compounds and biological activities of sprouts. J. Funct. Foods 2019, 53, 136–145. [Google Scholar] [CrossRef]
- Toro, M.T.; Ortiz, J.; Becerra, J.; Zapata, N.; Fierro, P.; Illanes, M.; López, M.D. Strategies of elicitation to enhance bioactive compound content in edible plant sprouts: A bibliometric study. Plants 2021, 10, 2759. [Google Scholar] [CrossRef]
- Randhir, R.; Lin, Y.-T.; Shetty, K. Stimulation of phenolics, antioxidant and antimicrobial activities in dark germinated mung bean sprouts in response to peptide and phytochemical elicitors. Process. Biochem. 2004, 39, 637–646. [Google Scholar] [CrossRef]
- Ampofo, J.O.; Ngadi, M. Stimulation of the phenylpropanoid pathway and antioxidant capacities by biotic and abiotic elicitation strategies in common bean (phaseolus vulgaris) sprouts. Process. Biochem. 2021, 100, 98–106. [Google Scholar] [CrossRef]
- Yu, J.; Lee, H.; Heo, H.; Jeong, H.S.; Sung, J.; Lee, J. Sucrose-induced abiotic stress improves the phytochemical profiles and bioactivities of mung bean sprouts. Food Chem. 2023, 400, 134069. [Google Scholar] [CrossRef]
- Moenne, A.; González, A. Chitosan-, alginate- carrageenan-derived oligosaccharides stimulate defense against biotic and abiotic stresses, and growth in plants: A historical perspective. Carbohydr. Res. 2021, 503, 108298. [Google Scholar] [CrossRef] [PubMed]
- Briceño-Domínguez, D.; Hernández-Carmona, G.; Moyo, M.; Stirk, W.; van Staden, J. Plant growth promoting activity of seaweed liquid extracts produced from macrocystis pyrifera under different ph and temperature conditions. J. Appl. Phycol. 2014, 26, 2203–2210. [Google Scholar] [CrossRef]
- Hernández-Herrera, R.M.; Santacruz-Ruvalcaba, F.; Zañudo-Hernández, J.; Hernández-Carmona, G. Activity of seaweed extracts and polysaccharide-enriched extracts from ulva lactuca and padina gymnospora as growth promoters of tomato and mung bean plants. J. Appl. Phycol. 2016, 28, 2549–2560. [Google Scholar] [CrossRef]
- Sharma, S.H.S.; Lyons, G.; McRoberts, C.; McCall, D.; Carmichael, E.; Andrews, F.; Swan, R.; McCormack, R.; Mellon, R. Biostimulant activity of brown seaweed species from strangford lough: Compositional analyses of polysaccharides and bioassay of extracts using mung bean (Vigno mungo L.) and pak choi (Brassica rapa chinensis L.). J. Appl. Phycol. 2012, 24, 1081–1091. [Google Scholar] [CrossRef]
- Liang, X.; Li, H.; Ciien, Y.; Ju, S.; Fang, S. Effects of seed coating agent on the morphological indexes and photosynthetic characteristics of mung bean plant. Agric. Res. Arid Areas 2020, 38, 39–42. [Google Scholar]
- Pumnuan, J.; Namee, D.; Sarapothong, K.; Doungnapa, T.; Phutphat, S.; Pattamadilok, C.; Thipmanee, K. Insecticidal activities of long pepper (Piper retrofractum Vahl) fruit extracts against seed beetles (Callosobruchus maculatus Fabricius, Callosobruchus chinensis Linnaeus, and Sitophilus zeamais Motschulsky) and their effects on seed germination. Heliyon 2022, 8, e12589. [Google Scholar] [CrossRef]
- Mongomery, D.C. Montgomery: Design and Analysis of Experiments; John Willy & Sons: Hoboken, NJ, USA, 2017. [Google Scholar]
- Khalaki, M.; Ghorbani, A.; Dadjou, F. Influence of nano-priming on festuca ovina seed germination and early seedling traits under drought stress, in laboratory condition. Ecopersia 2019, 7, 133–139. [Google Scholar]
- Begum, N.; Hasanuzzaman, M.; Li, Y.; Akhtar, K.; Zhang, C.; Zhao, T. Seed germination behavior, growth, physiology and antioxidant metabolism of four contrasting cultivars under combined drought and salinity in soybean. Antioxidants 2022, 11, 498. [Google Scholar] [CrossRef]
- Schindelin, J.; Arganda-Carreras, I.; Frise, E.; Kaynig, V.; Longair, M.; Pietzsch, T.; Preibisch, S.; Rueden, C.; Saalfeld, S.; Schmid, B.; et al. Fiji: An open-source platform for biological-image analysis. Nat. Methods 2012, 9, 676–682. [Google Scholar] [CrossRef]
- Miano, A.C.; Pereira, J.d.C.; Castanha, N.; Júnior, M.D.d.M.; Augusto, P.E.D. Enhancing mung bean hydration using the ultrasound technology: Description of mechanisms and impact on its germination and main components. Sci. Rep. 2016, 6, 38996. [Google Scholar] [CrossRef]
- Firatligil-Durmuş, E.; Šárka, E.; Bubník, Z.; Schejbal, M.; Kadlec, P. Size properties of legume seeds of different varieties using image analysis. J. Food Eng. 2010, 99, 445–451. [Google Scholar] [CrossRef]
Disclaimer/Publisher’s Note: The statements, opinions and data contained in all publications are solely those of the individual author(s) and contributor(s) and not of MDPI and/or the editor(s). MDPI and/or the editor(s) disclaim responsibility for any injury to people or property resulting from any ideas, methods, instructions or products referred to in the content. |
© 2023 by the authors. Licensee MDPI, Basel, Switzerland. This article is an open access article distributed under the terms and conditions of the Creative Commons Attribution (CC BY) license (https://creativecommons.org/licenses/by/4.0/).

