Article

Influence of the Compression Molding Temperature on VOCs and Odors Produced from Natural Fiber Composite Materials

1
URCOM, Université Le Havre Normandie, 76600 Le Havre, France
2
Ecotechnilin SAS-ZA Caux Multipôles, RD 6015, 76190 Valliquerville, France
*
Author to whom correspondence should be addressed.
Coatings 2023, 13(2), 371; https://doi.org/10.3390/coatings13020371
Submission received: 30 December 2022 / Revised: 23 January 2023 / Accepted: 30 January 2023 / Published: 6 February 2023
(This article belongs to the Special Issue Natural Fiber Based Composites II)

Abstract

:
In the automotive sector, the use of nonwoven preforms consisting of natural and thermoplastic fibers processed by compression molding is well known to manufacture vehicle interior parts. Although these natural fiber composites (NFCs) have undeniable advantages (lightweight, good life cycle assessment, recyclability, etc.), the latter release volatile organic compounds (VOCs) and odors inside the vehicle interior, which remain obstacles to their wide deployment. In this study, the effect of the compressing molding temperature on the VOCs and odors released by the flax/PP nonwoven composites was examined by heating nonwoven preforms in a temperature range up to 240 °C. During the hot-pressing process, real-time and in situ monitoring of the composite materials’ core temperature has been carried out using a thermocouples sensor. A chemical approach based on headspace solid-phase microextraction (HS-SPME) coupled with gas chromatography—mass spectrometry (GC-MS) was used for the VOCs analysis. The olfactory approach is based on the odor intensity scale rated by expert panelists trained in olfaction. The results demonstrate marked changes in the VOCs composition with temperature, thus making it possible to understand the changes in the NFCs odor intensity. The results allow for optimizing the molding temperature to obtain less odorous NFC materials.

Graphical Abstract

1. Introduction

Facing the challenges of climate change [1], the car manufacturers are forced by the European Union (EU) to reduce CO2 emissions by 55% among new cars placed on the market by 2030 and by 100% by 2035 [2]. In the EU, cars represent 12% of total CO2 emissions [3]. Consequently, manufacturers will have to drastically reduce the CO2 emissions of their new thermal vehicles and quickly switch to electric vehicles. In order to reduce the carbon footprint both in manufacturing and in use, switching from thermal to electric motorization is not enough, so it is also necessary to lighten the vehicles [4,5,6]. Beyond making less powerful vehicles [7], car manufacturers actually have two action levers for reducing vehicle weight. The first is by compacting the vehicle as much as possible in order to reduce the consumption of materials. The second is by manufacturing lighter parts by optimizing and reducing the thickness, surface and density of its components notably by using lighter materials. Usually, vehicle interior parts are made from polymer or glass fibers and polypropylene nonwoven composites. Many original equipment manufacturers (OEMs) and researchers seek to substitute glass fibers with natural fibers [8,9]. Such a substitution is initially motivated by the low density (around 40% lower than that of glass fibers) and the interesting specific mechanical properties for a relatively competitive price [10] compared to glass or synthetic fibers. Then, the use of natural fibers is advantageous because of their availability, their accessibility and their stable supply chain thanks to a fully structured sector, particularly for flax and hemp [11]. Finally, their renewability and low environmental impact are considered overall. In a life cycle assessment, the climate change indicator of hackled flax fibers production is lower than that of the glass fibers, and it is also established to be beneficial to acidification, abiotic depletion, terrestrial ecotoxicity, ozone layer depletion, human toxicity as well as non-renewable energy consumption indicators [12]. With their low density, good specific strength and stiffness, low carbon footprint [13,14], good acoustic properties [15,16,17], proven recyclability [18,19] and reasonable cost of raw materials [20], the use of natural fiber (NF) and polypropylene (PP) nonwoven composites as lightweight materials for vehicle interior parts is increasingly widespread in the automotive sector [21]. There are two types of polymers: thermo-plastic and thermosetting polymers. Thermo-plastic polymers are largely used for car interior parts due to their processability and their recyclability. In the car interiors, the main parts made from NF-PP nonwoven composites are: headliners, parcel shelfs, door panels, dashboards and trunk floors. For a door panel made from NFPP nonwoven composites, a weight gain of 20% can be achieved compared to a petro-sourced door panel with iso-mechanical performance [14].
Although these NFPP nonwoven composites have undeniable advantages in being used in vehicle interiors, the latter release volatile organic compounds (VOCs) that are potentially odorous and can affect the vehicle interior air quality (VIAQ). The World Health Organization (WHO) has indicated that vehicle interiors are a potential threat to people’s health [22], as some vehicle interiors may contain up to 250 different VOCs. Among these VOCs, some can be harmful, causing serious pathologies during long and/or regular exposure in confined spaces and/or at high concentrations [23,24]. A variety of symptoms may occur, including, for example, fatigue, headaches or nasal, ocular and respiratory irritations. Moreover, air quality is also affected by unpleasant and/or intense odors, causing nausea, insomnia, discomfort and asthma [25]. The main sources of VOCs/odors are plastics, textiles, leathers, coatings and glues used to make vehicle interior parts. In the literature, some studies have shown that the lignocellulosic fibers used in NFPP composites are sources of both VOCs and odors. These VOCs/odors depend on the pre-treatment of lignocellulosic fibers. Fischer et al. [26] established that the odor concentration of lignocellulosic fibers is related to the fineness of the fibers. They also showed that raw fibers contaminated with molds exhibit a higher odor concentration compared to uncontaminated ones. Finally, they demonstrated that the wide range of textile finishes greatly increases the odor concentration of the fibers. Moreover, Savary et al. [27] showed that the chemical composition and the olfactory profile of flax fibers change as a function of temperature. At 80 °C, the olfactory profile is characterized by fatty, green, acid, flowery and sweet notes, and beyond 215 and 230 °C, odors of the roasted, burnt and phenolic type appear, which can be perceived as unpleasant. Other researchers and original equipment manufacturers (OEMs) have been interested in reducing the emission of VOCs/odors emitted by NFPP composites based on lignocellulosic fibers by using different VOCs/odors removal techniques.
The easier VOCs/odors removal technique consists of decreasing the number of lignocellulosic fibers in composites, often to the detriment of the mechanical properties. Bledzki et al. [28] showed that the higher the abaca fiber content, the higher the odor concentration emitted by PP-abaca fiber composites. Nevertheless, the identification of the VOCs sources for the corresponding odors was not carried out. Badji et al. [24] showed that the higher the hemp fiber content in a composite, the greater the quantity of VOCs—in particular, VOCs from the alcohols, carboxylic acids, aldehydes, ketones and azines families. Unfortunately, no odor analysis was carried out to establish a link between VOCs and odors. In order to less significantly deteriorate or increase the mechanical properties of the composites, the second VOCs/odors removal technique consists of substituting lignocellulosic fibers with similar fibers emitting less VOCs/odors. Bledzki et al. [28] also showed that substituting abaca fibers in composites (made by injection molding) with jute or flax fibers allows for a much lower odor concentration. Fischer et al. [27] have also shown this in the case of composites made by the compression molding of nonwovens. Indeed, they showed that substituting contaminated lignocellulosic fibers with non-contaminated ones (or with contaminated fibers treated with soda and enzymatic treatment) in NFPP composites can reduce the odor concentration, whether for composites made in a laboratory or on an industrial scale. Fischer et al. [26] also showed that substituting contaminated lignocellulosic fibers with the same fibers treated with soda and enzymatic treatment allows for reducing the odor concentration threefold. Again, for composites made by compression molding, Li et al. [29] established that substituting hemp fiber with natural freezing-mechanical degumming hemp fiber decreases the VOCs monitored in vehicle interiors in China. Morin et al. [30] showed that substituting flax fibers with flax fibers pre-treated with deep eutectic solvent (DES) followed by ultrasound treatment efficiently allowed for reducing the odor intensity, as established through olfactory quality evaluation, as assessed via a panel following the D42 3109-C standard; in the same study, the authors were able to demonstrate a decrease in the number of VOCs. Nevertheless, in most of these studies [26,28,29,30], the VOCs causing the odor were not identified. The third VOCs/odors removal technique is to add VOCs/odors adsorbents. As an illustration, Courgneau et al. [31] prepared a low-odor-emissive cellulose fibers/PLA composite with PMPS as an adsorbent agent. The results indicate that the odor concentration decreases twofold by adding the adsorbents, while the odor intensity is only very slightly decreased. Again, no study of VOCs has been carried out in parallel to identify odorous VOCs. Additionally, Kim et al. [32] showed that porous inorganic materials were able to reduce the amount of Furfural, 5-methyl Furfural and hexanal emitted by composite materials based on PBS and PLA reinforced with bamboo flour or wood floor. Contrary to the previous study, the odor emitted by these composites was not investigated. The fourth VOCs/odors removal technique consists of changing the process of shaping the composite materials based on lignocellulosic fibers. This remediation strategy has the advantage of not requiring changing the constituents of the composite or adding any compounds such as odor adsorbents, unlike the previous removal techniques. This is a preventive method for limiting the formation of odorous or non-odorous VOCs. Faruk et al. [33] investigated the odor concentration of PP-abaca fiber composites as a function of three shaping processes. The study shows that the odor concentration emitted by PP-abaca fiber composites shaped by compression molding is significantly lower than that in the case of injection molding. Fischer et al. [26] showed that, in moving from a laboratory scale to an industrial scale, the hot-pressing process reduced the odor concentration of NFPP nonwoven composites. The laboratory scale thermocompression parameters have been defined (15 min and 180 °C). but those used on the industrial scale have not, which are probably at higher temperatures (around 200–220 °C) and a shorter time (no more than a few minutes) to ensure a good production rate. One can observe that only very few studies are interested in both odors and VOCs emitted by NFPP composite materials and the potential link that could unite them. Moreover, although studies have shown that the odor concentration or odor intensity of NFPP composite materials could decrease by using different VOCs/odors removal techniques, no one was interested in optimizing the shaping process of NFPP composites, especially from NFPP nonwovens.
In this study, the effect of the compressing molding temperature on both the VOCs and odors released by the NFPP nonwoven composites was examined by heating nonwoven preforms from 200 °C to 240 °C. This temperature range corresponds to the temperatures of the industrial shaping processes for fiber-reinforced composite materials. The heat press time has been defined according to the time needed to reach very specific temperatures at the core of the composite during the hot pressing. The first core temperature, 180 °C, corresponds to a temperature above the melting point (163–170 °C) of the polypropylene fibers (PP), allowing it to have the necessary minimum viscosity for the PP to coat and correctly bind the natural fibers. The second core temperature, 200 °C, is a temperature well above the melting point of PP fibers, ensuring (for sure) the necessary viscosity to produce composite materials corresponding to automotive specifications. Further core temperatures correspond to one of a hot plate whose temperature is between 200 and 240 °C. In each configuration, the heat press time is similar to the time of the industrial shaping processes; therefore, the effect of the exposure temperature on the NFC materials could be evaluated. In each configuration, the VOCs were identified and quantified, and the odor intensity was assessed using a panel of expert olfaction assessors. Finally, a link was established between the odor intensity and the VOCs emitted by the composites for all configurations.

2. Materials and Methods

2.1. Materials

Flax (Linum usitatissimum L.) tows and scutched fiber from France were used in this study. The flax was cultivated under normal weather conditions and then dew-retted in fields and, finally, mechanically scutched. Flax fibers were used as reinforcement in the nonwoven material combined with PP fibers. Industrial flax/PP commingled nonwovens were manufactured according to the carding-overlapping-needle-punching technology of Ecotechnilin SAS (Valliquerville, France). For the nonwovens, the flax/PP ratio is about 50/50 w%, with a mass per unit area around 1500 g/m2.

2.2. Methods

2.2.1. Composite Manufacturing

Flax/PP nonwovens were processed by hot-compression molding on a Dolouets (Soustons, France) laboratory hydraulic press, with a system of double plates, to obtain 21 × 30 cm2 and 7 × 7 cm2 plates. This press allows for a pressing of the material in two successive cycles—the first at a high temperature (up to 250 °C) and the second at a low temperature (room temperature). The 7 × 7 cm2 Flax/PP nonwovens were used to determine the time required to obtain the core temperatures of the different configurations given in Table 1. Once this time was determined, 21 × 30 cm2 Flax/PP nonwovens were thermocompressed under the same conditions, without a thermocouple. The sample size is larger in order to have enough samples to perform further analysis. In order to be consistent with industrial molding cycles and obtain mechanical properties in accordance with the specifications of car interior parts, nonwovens were hot pressed at 200, 210, 220, 230 and 240 °C under the pressure of 100 bars, with Teflon™ fabric on each side, using a set of shims whose thickness is 3 mm. The hot pressing is carried out until well-defined temperatures are obtained at the core of the composite materials. The temperature is measured using a type K thermocouple whose characteristics are described in Section 2.2.2. The target core temperatures for nonwovens, hot pressed at 200, 210, 220, 230 or 240 °C, are 180 °C, 200 °C and that at which the temperature at the core of the composite material is equal to the temperature of the heating plates of the hot press compression molding. The temperature parameters and the different configurations are presented in Table 1. Then, the hot-pressed nonwovens were placed directly between two cooled plates at room temperature under the same pressure for 40s, with a set of shims whose thickness is 2 mm.

2.2.2. Temperature Measurement System

During the hot-pressing process, real-time and in situ monitoring of the composite materials’ core temperature was carried out using a thermocouple coupled to an HH74K Digital Thermometer (Oméga, Manchester, UK). The Type K thermocouple is widely used in industry due to the robustness and the simple working principle based on the Seebeck effect. The temperature measurement range is from −75 °C to 250 °C. The small size of the wire allows it to be a non-invasive sensor and induces a very low disturbance of the manufacture of the composite. The probe has been embedded in the center of nonwoven samples of 7 × 7 cm2 (Figure 1). In order to measure and display the evolution of the average core temperature of the nonwovens in real time during the hot-pressing process, three core temperature measurements are carried out on three different samples for each configuration.

2.2.3. Samples Preparation and Conditioning

From 21 × 30 cm2 plates of flax/PP nonwoven composites, samples of around 1 × 1 cm2 and 150 ± 1 mg were prepared. For the chemical and odor analyses, these specimens were stored in a climatic oven (Memmert IPP 110, Schwabach, Germany) at 23 °C/50% RH for 24 h.

2.2.4. Extraction of Volatile Organic Compounds by the HS-SPME Method

The extraction of volatile organic compounds (VOCs) was performed using the headspace–solid phase microextraction (HS-SPME) technique for all samples, as described in Section 2.2.3. Before the GC-MS analysis, the samples were placed into a 20 mL headspace-vial (HS-vial) and closed with caps integrating a PTFE/Silicone septum (Chromoptic, Courteboeuf, France). HS-vials were placed into a sampler tray of the MultiPurpose Sampler (MPS) robot (GERSTEL GmbH & Co. KG, Mülheim an der Ruhr, Germany). By a robotic arm, the vial is picked up from the sampler tray and moved into the MPS Agitators/Incubators (GERSTEL GmbH & Co. KG, Mülheim an der Ruhr, Germany). The HS-Vial was heated to 80 °C for an incubation period of 15 min—to release VOCs into the headspace—and for an extraction period of 30 min—to extract VOCs into the headspace—with SPME fiber inserted into the vial. For the extraction period, a silica-based SPME fiber coated with a 50/30 thickness film of DVB/CAR/PDMS (50/30 μm film thickness, needle size 23 ga, 2 cm length, Stableflex, Supelco Chromoptic, Courteboeuf, France) was used. Before using the DVB/CAR/PDMS SPME fiber, the latter was conditioned in the injector port of the GC at 270 °C for 1 h. For each kind of sample described in Section 2.2.3, the VOCs analysis was carried out in triplicate for three distinct samples.

2.2.5. GC-MS Analysis

VOCs coming from the flax/PP nonwoven composite sample and extracted on the SPME fiber were desorbed at 250 °C for 5 min into a Gestel CIS inlet in a splitless configuration. Then VOCs were analyzed—i.e., separated, identified and quantified—by gas chromatography (GC-2010 Plus, Shimadzu, Kyoto, Japan) coupled with mass spectrometry with a simple quadrupole mass analyzer (GCMS-QP2010 SE, Shimadzu, Kyoto, Japan). The gas chromatography oven was equipped with an SLB-5MS fused silica capillary column: 5% diphenyl/95% dimethylpolysiloxane phase, 30 m × 0.25 mm i.d., 0.25 μm film thickness (Supelco, Sigma-Aldrich, St. Louis, MO, USA). The oven temperature was programmed as follows: initial hold at 40 °C for 3 min, ramp at 10 °C/min to 100 °C, at 4 °C/min to 190 °C and, finally, at 15 °C/min to 250 °C, held for 5 min. Thus, the total program time was 40.5 min. The carrier gas was helium gas at a constant flow rate of 1.0 mL/min. Mass spectrometry (MS) was operated in the electron impact positive ionization (ionization energy 70 eV; source temperature 200 °C). Full-scan data acquisition was registered over a mass range of 35–550 a.m.u. The instrument was calibrated using standard solutions of C6 through C16 n-alkanes diluted in ethanol. The standard solution was injected using a syringe with the same operating conditions. This calibration allows for identifying VOCs by comparing the MS spectra to the mass spectral coming from the NIST library and also by calculating the Kovats indices. On the chromatogram, only the peaks with a mass spectra similarity (similarity index) greater than or equal to 90% and a retention (Kovats) index difference of less than 50 were retained for identification. For each sample, three GC-MS analyses were conducted. The quantification of each VOC is expressed as the peak area units from the chromatograms.

2.2.6. Odor Analysis

For the odor analysis, a panel of six voluntary formed assessors (5 women/1 man) from 23 to 57 years old (average age: 31) was composed. The sensory analysis took place in a sensory laboratory composed of a sensory analysis cabin providing optimum analysis conditions. The assessors evaluated the odor intensity with an n-butanol odor intensity referencing scale of six levels (from 0 to 5), as described in Table 2 and inspired by the NF ISO 12219-7 standard. Moreover, the assessors could score with half-levels. Before the evaluation, the odor intensity scale was smelled by dipping an odorless sniffing paper stick in each level. The odor intensity scale could be smelled several times by the assessor during the evaluation.
Once the results of all the assessors are collected, the average value of the odor intensity is calculated. Since the average odor intensity value does not give any information on the distribution of values, the results are also presented in a box-plot diagram.
Regarding the sample preparation of the flax/PP nonwoven composite sample, the preparation and conditioning were described in Section 2.2.3. Afterwards, the samples were placed into a 20 mL amber glass-vial and heated in an oven at 80 °C for 45 min; the same temperature and time compared to the samples were used for the chemical analysis. Once removed from the oven, the samples were cooled to room temperature for one hour. Then, the assessors could evaluate them. The vials containing the flax/PP nonwoven composite samples were presented in different random orders to each assessor. On each vial, a three-digit number is inscribed. Each sample is smelled twice, on two different days, in order to characterize the repeatability of the evaluation of the odor intensity by the assessors.

2.2.7. Statistical Analysis

The experimental results of odor intensity are expressed by the mean value and box plots representation. Three-way analysis of variance (ANOVA)—for the factor materials, judge and session—was performed with XLSTAT 2016 to examine the difference between the NFC materials produced from different heat press temperatures and core temperatures regarding odor intensity. Each mean was compared with each other, and two results were considered statistically different if a p-value of less than 0.05 was observed. As ANOVA is a linear model, assumptions about the residual are verified or assumed: independence: no obvious relationship between measurements (assumed); normality: verified by Shapiro–Wilk’s test and the Q-Q plot; equal variance: verified by Levene’s test and not too many outliers observed among the residual value, i.e., 95% of the residuals are in an interval (−1.96, +1.96). Finally, the three-way ANOVA was followed by Fisher’s post hoc test, which is used to determine significant differences between group means in an ANOVA. To help identify the significant differences between group means, letters are used. If the means share at least one letter in common, the means are not significantly different. Conversely, if the means have no letter in common, the means are significantly different.

3. Results and Discussion

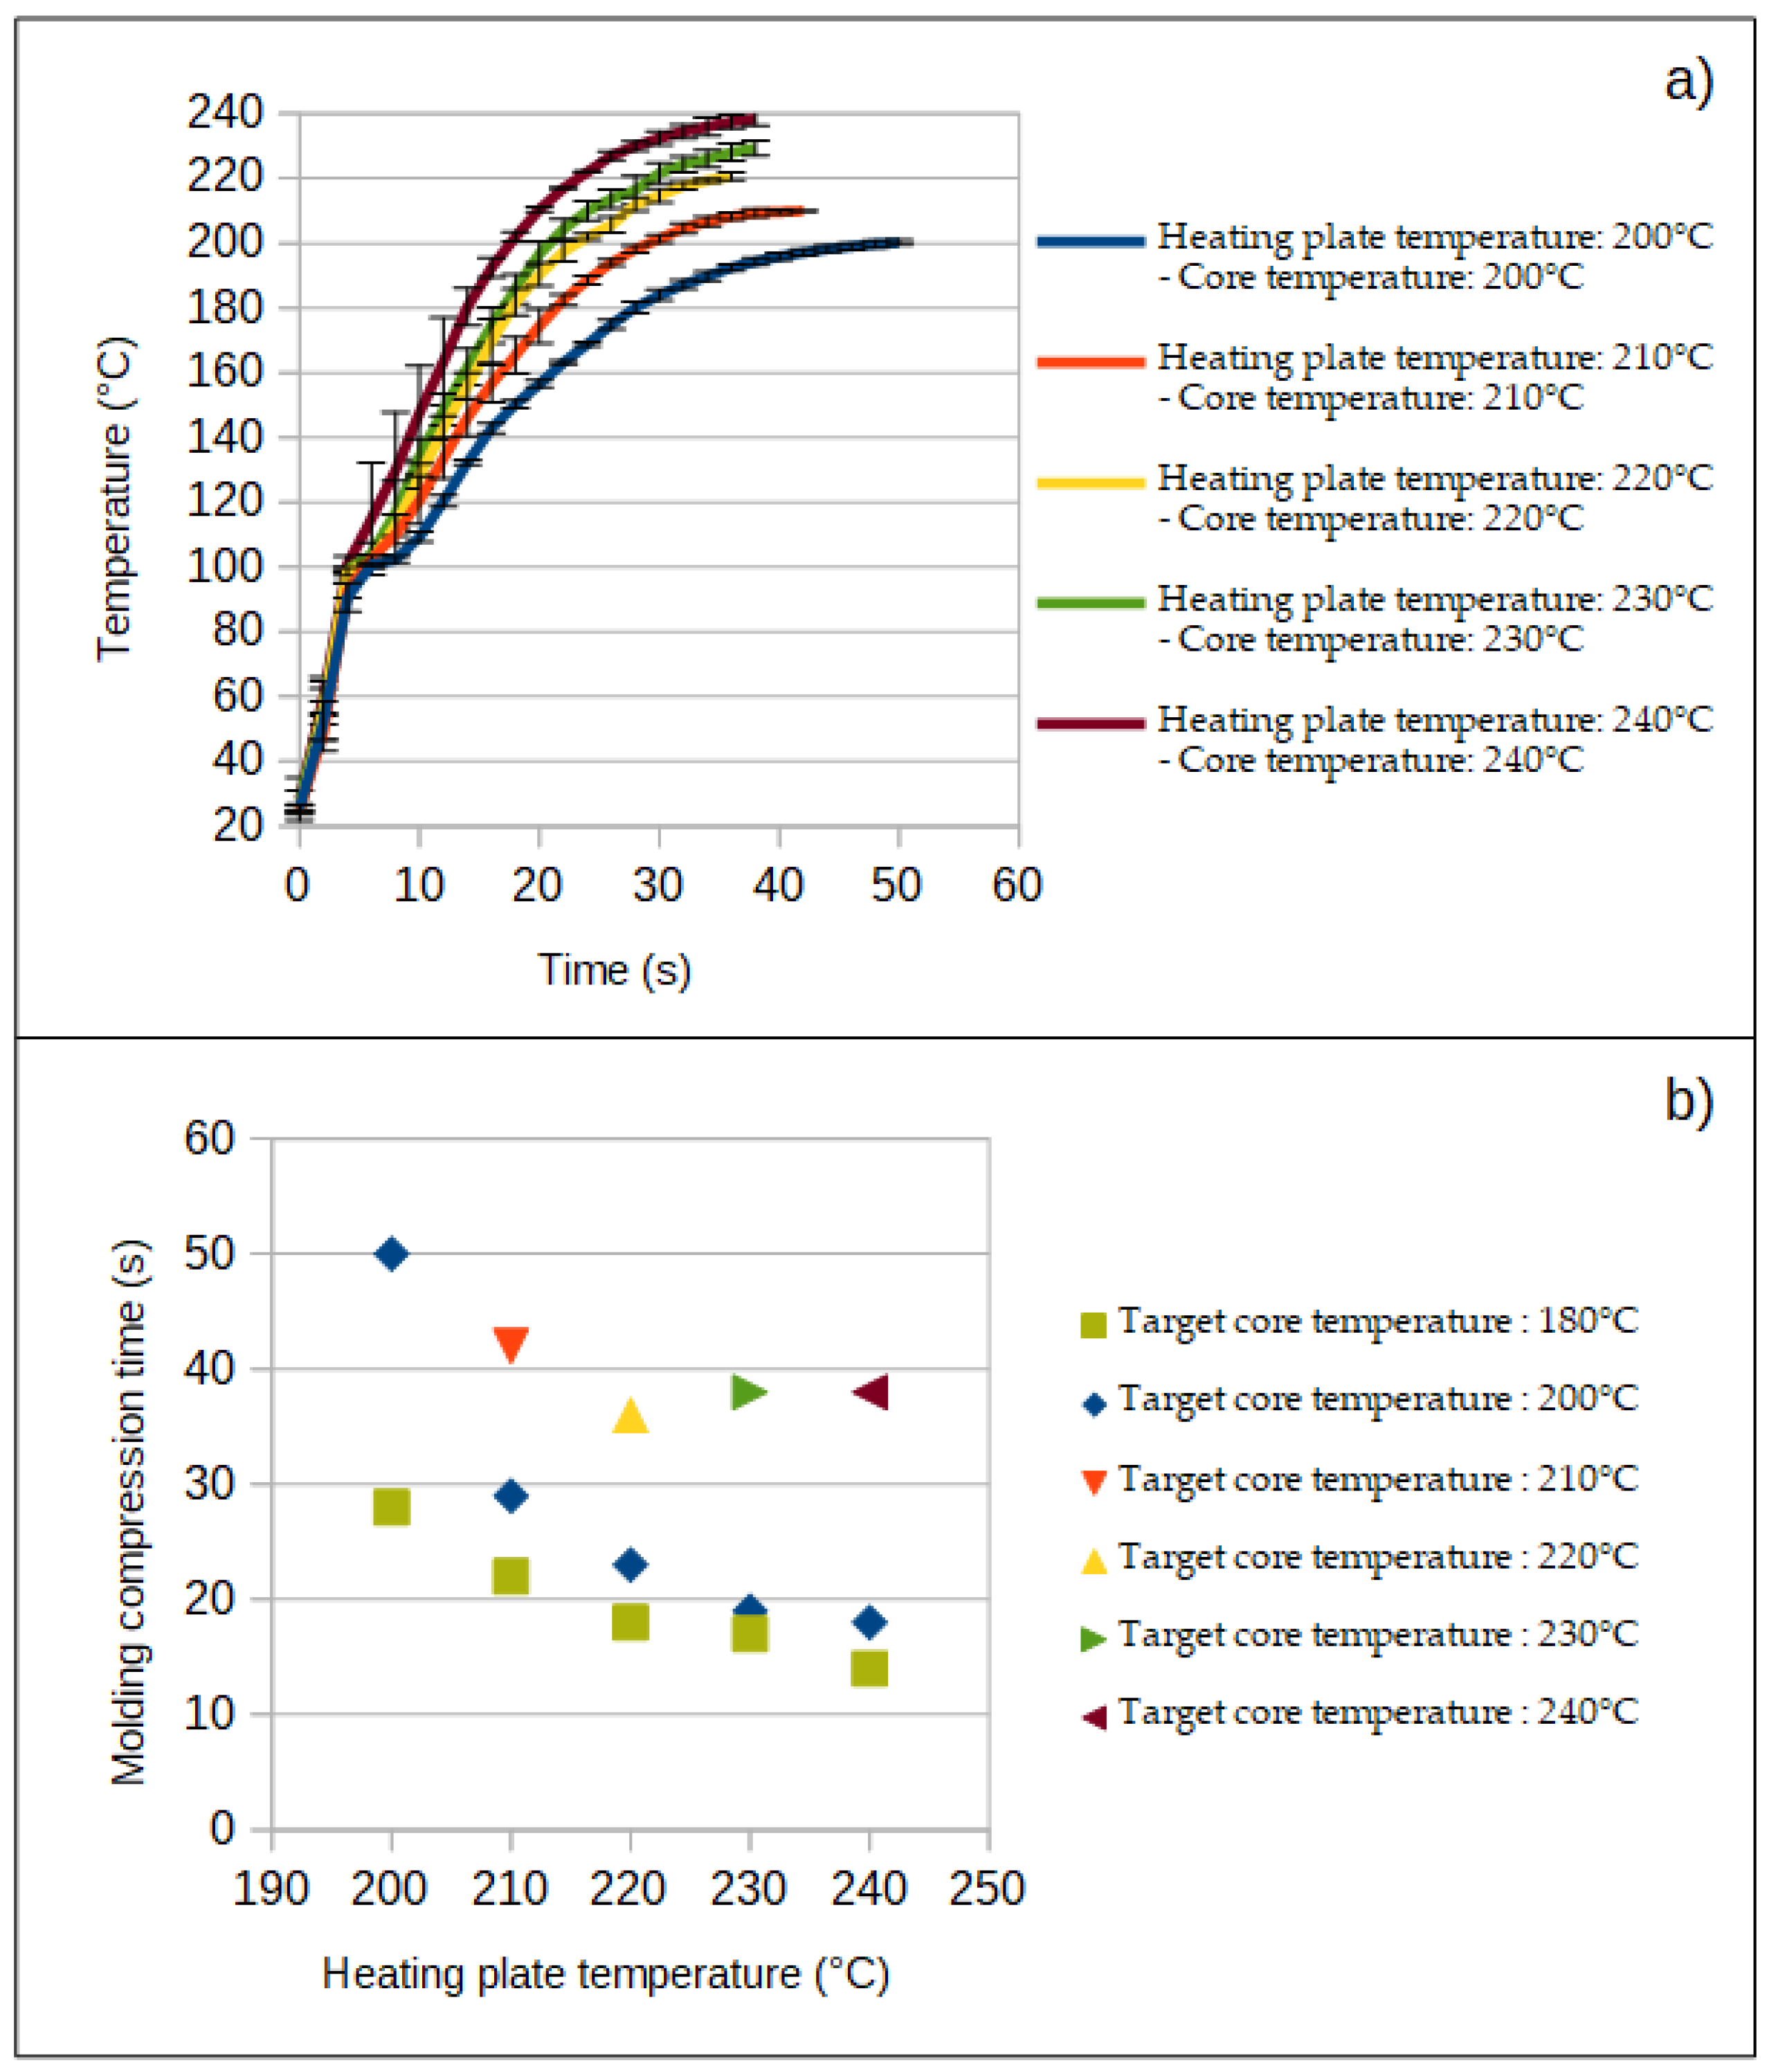
3.1. Evolution of the Temperature of the Nonwoven In Situ and in Real Time during the Compression Molding Process

The evolution of the temperature of the nonwoven in situ and in real time during the hot-pressing process is presented in Figure 2. Depending on the configuration, the nonwoven is hot pressed between two heating plates at 200, 210, 220, 230 or 240 °C until the core reaches the same temperature as that of the hot plates. In Figure 2a, for each configuration, one can observe that the evolution of the temperature is linear for the first four seconds, with a slope around 20 °C/s. Once a temperature of 100 °C at the core of the nonwoven is reached, an inflection of the curves is observed, which is more or less pronounced depending on the configuration. The higher the heat press temperature, the lower the inflection of the curve. This inflection point around 100 °C may be explained by the residual water contained in the lignocellulosic fibers [34] and, more generally, in the lignocellulosic fiber nonwovens [35] that passes from a liquid state to a gaseous state. This phenomenon is more commonly called the vaporization/evaporation stage and is also reported for other lignocellulosic materials during thermocompression [36]. This vapor slows down the increase in temperature. This point of inflection of the temperature evolution was reported elsewhere during the hot pressing of the board of the beech veneer produced at a temperature of 250 °C, 4 MPa and 280 s from the thermocouples in the core of the material [37].
The higher the heat press temperature, the faster this vapor forms and the quicker it escapes from the lignocellulosic fiber nonwoven, which would explain the less significant inflection of the curve when the temperature of the hot plates is increased during thermocompression. This phenomenon of vaporization is well known in the literature [38] and by the industrial sector. It is not uncommon in the industry to have one or more degassing cycles in order to prevent the water naturally contained in the lignocellulosic fibers from passing too quickly in the form of vapor and generating defects (blisters and/or cracks) within the material. Another way to limit vapor generation during the hot pressing of lignocellulosic matter consists of drying materials prior to hot pressing [39].
Figure 2b is obtained from the curves of Figure 2a. This figure represents the molding compression time that is necessary to obtain at core 180, 200, 210, 220, 230 and 240 °C, depending on the temperature of the hot plates. As expected, it is observed that the higher the heat press temperature, the faster the temperatures of 180 °C and 200 °C are reached at the core. To reach 180 °C at the core of the nonwoven, a time of 28, 22, 18, 17 and 14 s is needed for heat press temperatures of 200, 210, 220, 230 and 240 °C, respectively. Then, to reach 200 °C at the core of the nonwoven, a time of 50, 29, 23, 19 and 18 s for the same heat press temperatures is needed, respectively. It should be noted that the time difference in reaching 180 or 200 °C at the core decreases sharply from 22 s to 4 s when going from an initial temperature of the hot plates of 200 °C to 240 °C. Finally, to reach core temperatures of 200, 210, 220, 230 and 240 °C for identical heat press temperatures, it takes 50, 42, 36, 38 and 38 s, respectively. In addition, to see the heat press time decrease, it is also observed that, from 220 °C, the heat press time stabilizes around 36/38 s. In all the configurations, once 180 °C is reached at the core, the more the temperature increases, the more the slope of the curve decreases and tends to be zero.
As a first conclusion, the results make it possible to accurately control the time of thermocompression necessary to produce an NFC composite according to the heat press temperature and the target core temperature. Overall, the results show that the higher the heat press temperature and the lower the target core temperature, the shorter the heat press time. Whatever the configuration, the thermocompression time remains less than 60 s.

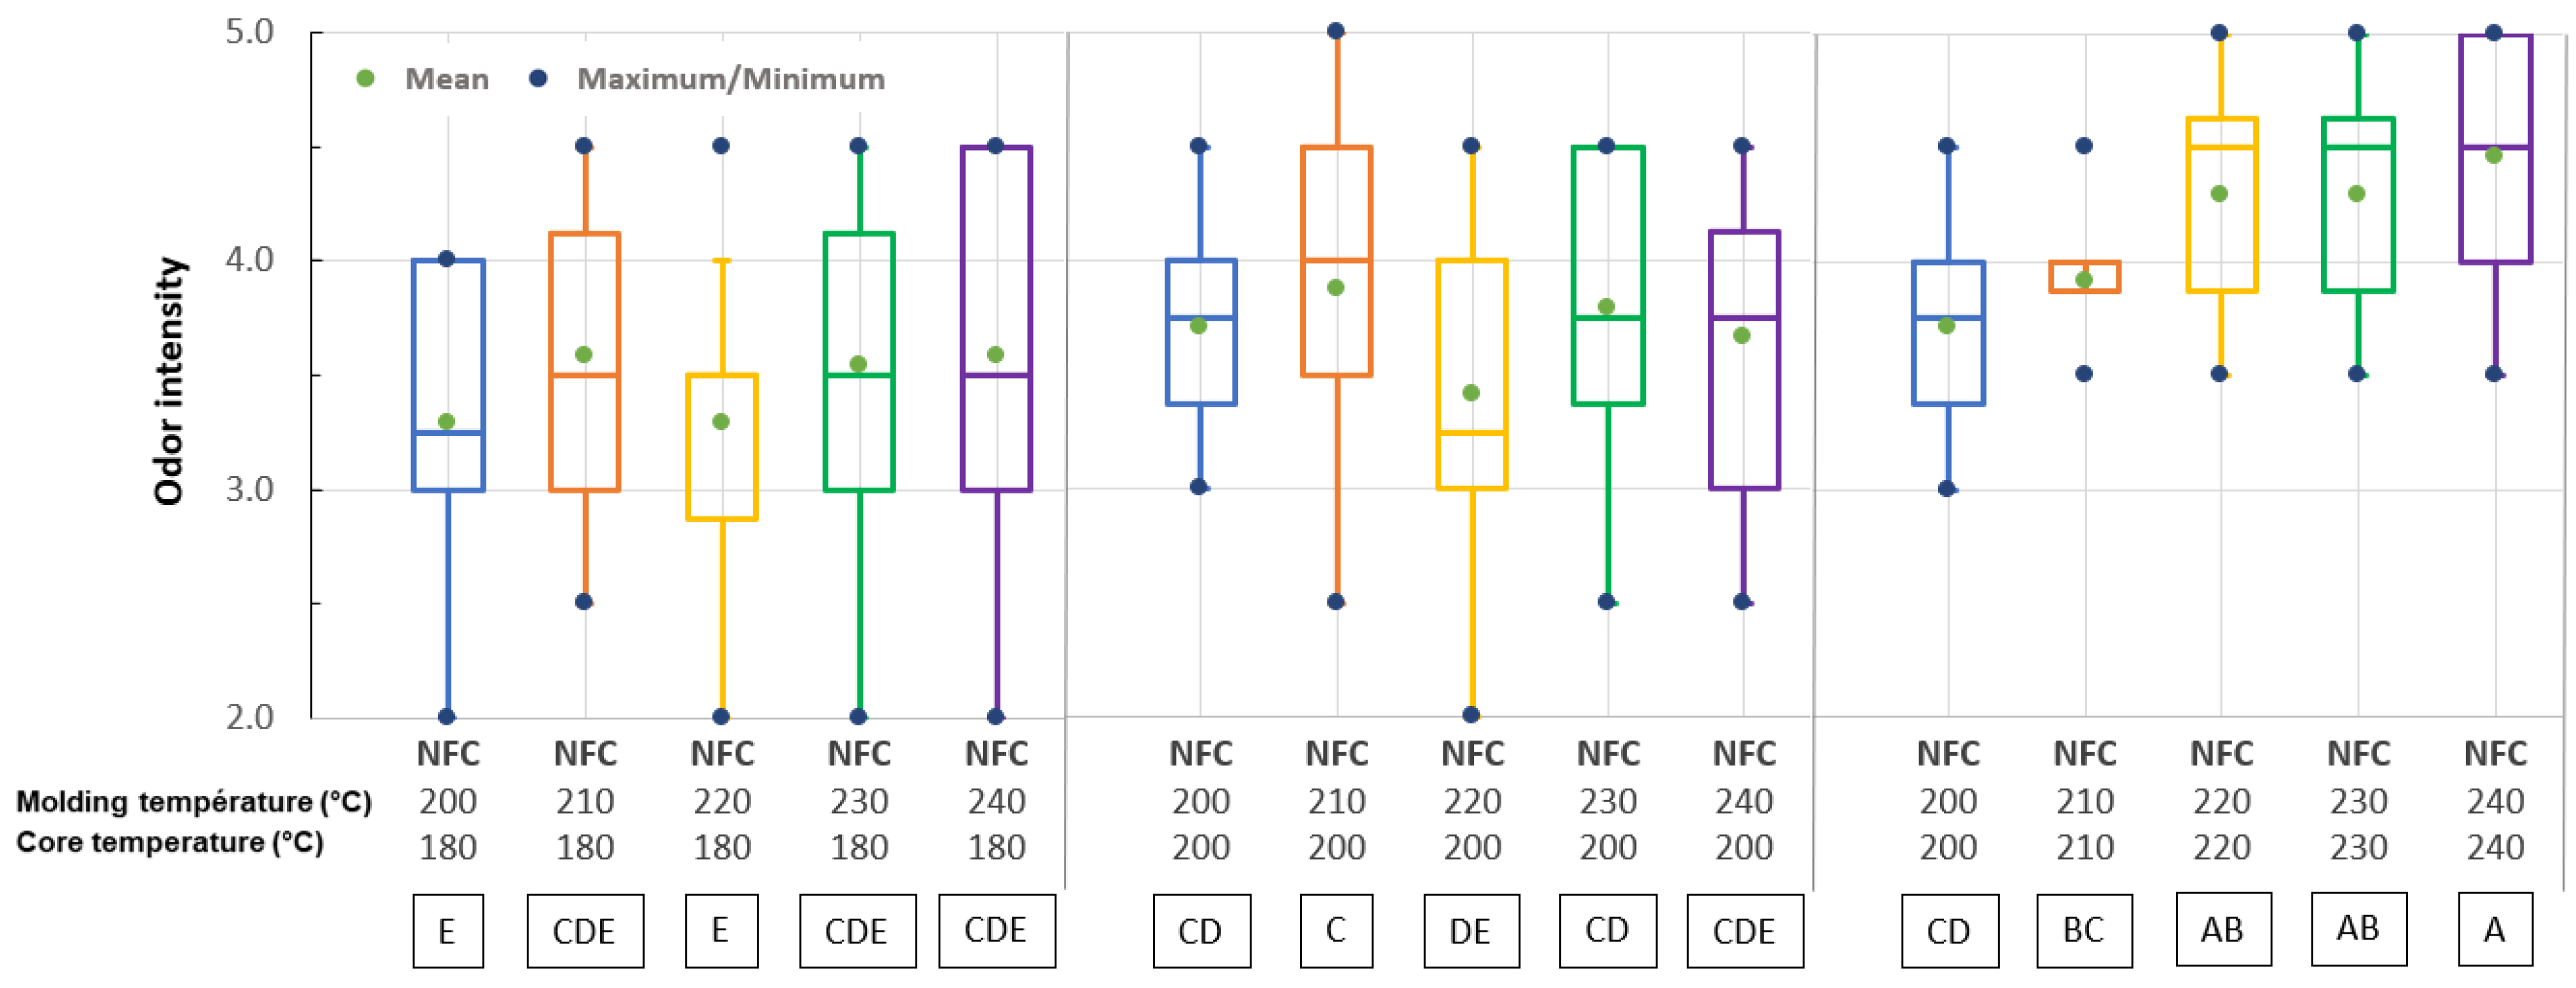
3.2. Evolution of the Odor Intensity Coming from the NFC According to the Molding Temperature and Core Temperature of the Nonwoven In Situ during the Compression Molding Process

The evolution of the odor intensity coming from the NFC according to the molding temperature and core temperature of the nonwoven in situ during the compression molding process is presented with box-pots in Figure 3. A three-way analysis of variances was performed on the scores given by the assessors. According to Table 3, the “NFC material” factor has a highly significant effect (p < 0.0001). Therefore, the assessors smelled marked differences between the intensities of the samples. Notably, the “Judge” factor also has a significant effect (p < 0.0001). Although formed and trained, it is common to have a “Judge” effect in sensory analysis. Finally, the “Session” factor has no significant effect (p = 0.50); this means that there is no difference between the evaluations in session 1 and in session 2. Still, according to Table 3, the interaction “NFC material × Judge” has a p-value close to 0.05, whereas the “NFC material × session” and “Judge × session” interactions have no significant effect (p > 0.05).
As a result, significant differences were perceived between NFC materials. The assessors were repeatable between both sessions, even if some differences are observed in the use of the intensity scale due to various sensibilities. This may explain the standard deviations in Figure 3. Fisher’s post hoc test was used to determine which samples were different from each other from distinct groups. The results from Figure 3 show that NFC materials with a core temperature of 180 and 200 °C (regardless of the heat press temperature between 200 and 240 °C) do not have significantly different means, with odor intensity means between 3.3 and 3.8. The lowest average odor intensity was obtained for the material hot pressed at 200 °C, with a core temperature of 180 °C. In contrast, NFC 220-220, NFC 230-230 and NFC 240-240 were perceived with the highest intensities, with means between 4.3 and 4.5. NFC 210-210 showed an intermediary odor intensity.
Consequently, to avoid a high odor intensity (>4), the heat press temperature and targeted core temperature should not exceed 210 °C.

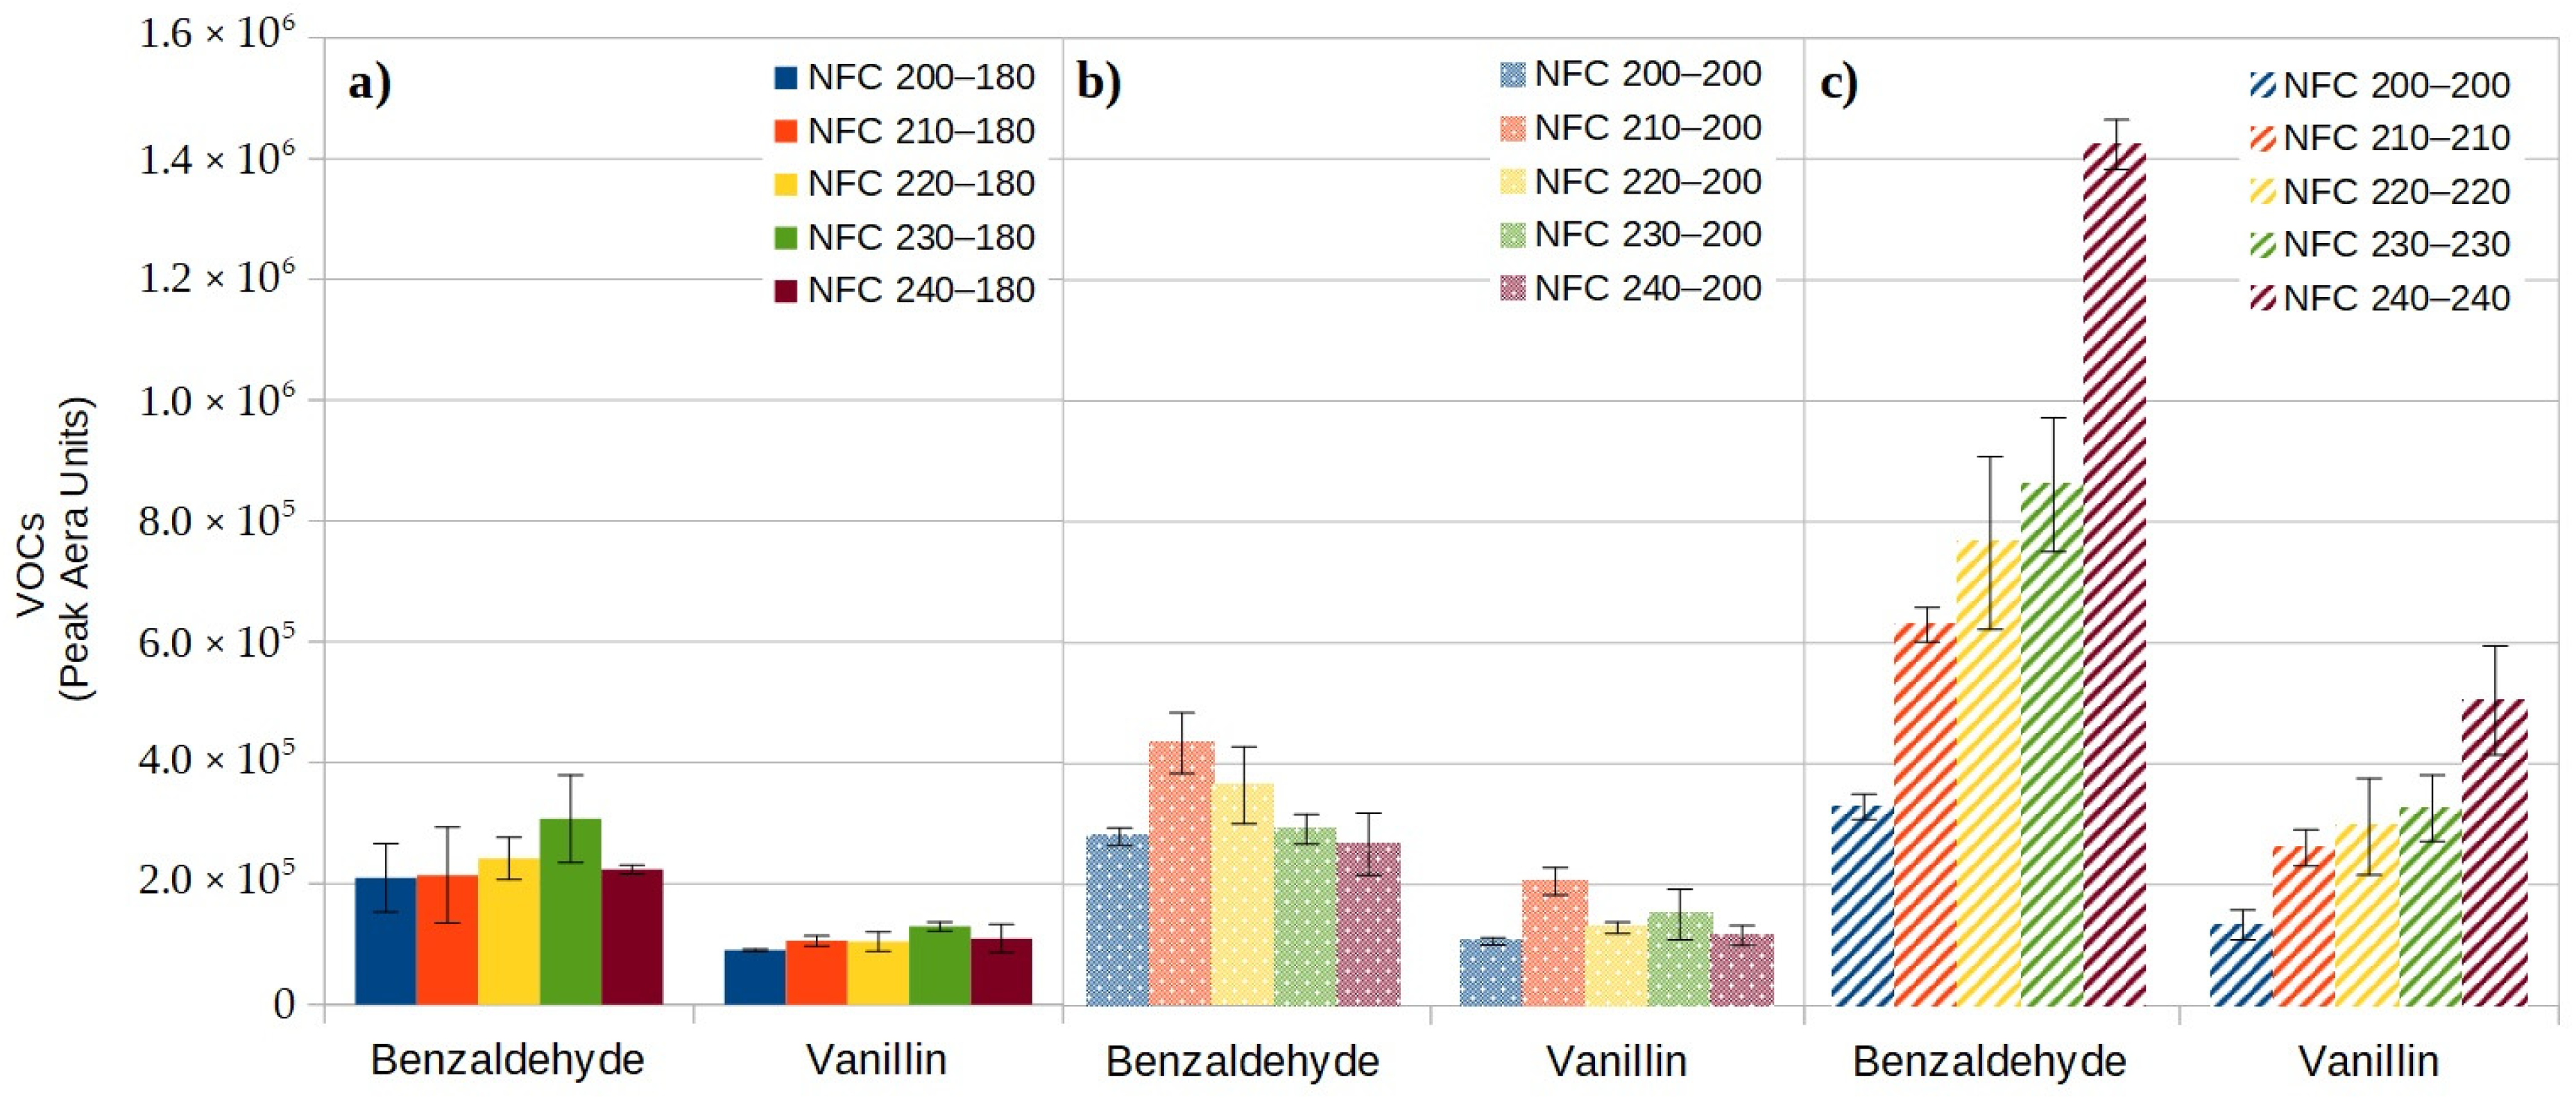
3.3. Evolution of VOCs Emission Coming from Fibers of NFC According to the Molding Temperature and Core Temperature

A large number of VOCs of different natures coming from NFC were detected, identified and quantified by HS-SPME-GC-MS analysis. Both Table 4 and Table A1 and Table A2 (tables in Appendix A, which is more detailed) summarize the main identified VOCs coming from flax fibers-reinforced hot-pressed NFC, which have also been identified in other scientific works [24,27]. The study specifically focuses on VOCs from the thermal degradation of flax fibers, as numerous studies have shown that the odors of composite materials based on lignocellulosic fibers mainly come from the latter [24,26,27,28,30].
It is well known that flax fibers consist of cellulose, hemicellulose, lignin and also a small quantity of lipophilic extractives [40,41,42], which are mainly present on the fibers’ surface [43,44]. First of all, the evolution of VOCs from the thermal degradation of lipophilic extractives located mainly on the surface of flax fibers (Section 3.3.1) is presented as a function of the molding temperature and the targeted core temperature. Then, the evolution of VOCs from the thermal degradation of holocelluloses, i.e., cellulose and hemicelluloses, (Section 3.3.2) and lignin (Section 3.3.3), which constitute the main chemical constituents of flax fibers, was again evaluated depending on the molding temperature and the targeted core temperature.

3.3.1. VOCs Coming from Lipophilic Extractives of Flax Fibers

Among the 15 identified compounds (Table 4) coming from the flax fibers of hot-pressed NFC, most are aldehydes, including: aliphatic aldehydes (hexanal, heptanal, octanal and decanal), unsaturated aldehydes (2-heptenal, 2-nonenal) and aromatic aldehydes (benzaldehyde, vanillin) and others (furfural and 5-methylfurfural). According to Figure 4a, for a targeted core temperature of 180 °C, the molding temperatures ranging from 200 °C to 240 °C do not drastically change the quantity of aliphatic and unsaturated aldehydes released by NFC. The same observation was made in the case of thermocompression, in which the targeted core temperature was 200 °C (Figure 4b). Nevertheless, the change in the core temperature from 180 °C to 200 °C induced a greater release of each aldehyde, except for hexanal and 2-heptanal. Finally, when the core temperature and the heat press temperature are the same, going from 200 °C to 240 °C (Figure 4c), no change was observed in the quantity of heptanal, 2-heptanal and decanal. Nevertheless, in the case of octanal and 2-nonenal, the quantity in the headspace increased with the heat press temperature. In the case of hexenal, the quantity unexpectedly decreased when the heat press temperatures increased. It can therefore be assumed that a greater quantity of hexanal was released at the moment of the hot-pressing process; thus, they are not found in greater quantities in the final composite. This can be justified because hexanal is the more volatile compound among the aldehydes of this study.
Aliphatic aldehydes (hexanal, heptanal, octanal and decanal), unsaturated aldehydes (2-heptenal, 2-nonenal) and 2-pentylfuran are well known as secondary lipid oxidation/degradation products, especially for unsaturated fatty acid. Flax fibers mostly consist of cellulose, hemicellulose, lignin and also lipophilic extractives up to 1.8% [40,41,42], mainly on the surface of the fibers [43,44]. The main constituents of lipophilic extractives (i.e., lipid) are long chain fatty acids, long chain aldehydes, fatty alcohols and wax esters. Among the fatty acids, unsaturated fatty acids are found, such as 9-octadecenoic acid (oleic acid) and 9,12-octadecadienoic acid (linoleic acid) [41,42]. Hexanal is a secondary degradation product of linoleic acid generally formed due to the β-cleavage of the first degradation product (hydroperoxides) [54,55,56]. Hexanal can be used as an indicator of the degradation of lipid oxidation [54]. Hexanal can be described by green, fatty, aldehyde odorous facets (Table 4). Heptanal is also well known to be a secondary degradation product of fatty acid [57,58]. Nevertheless, the fatty acid source of heptanal has not been clearly identified. Some authors suggested that it is a breakdown product of oleic acid [59]. Heptanal was also detected as a volatile oxidation compound from linoleic acid [60,61], as in the case of 2-pentylfuran [60,62,63]. Grebenteuch et al. [57] showed that 2-pentylfuran and 2-nonenal can be precursors of heptanal. These two compounds have been identified in this article. Heptanal can be described by fatty, citrus, rancid odorous facets (Table 4). 2-nonenal is derived from linoleic acid acyl group oxidation [64], whose fragrant facets can be described as cucumber and green. Octanal, nonanal (not quantified in this study because its peak was co-eluted with a peak of VOC from PP) and decanal can be produced from oleic acid oxidation [55,64]. The odor descriptors of octanal, nonanal and decanal are in Table 4.
Therefore, aliphatic and unsaturated aldehyde compounds from lipophilic extractives of flax fibers globally increase with the temperature and give globally fatty, green, aldehyde odor facets of the NFC odor profile.

3.3.2. VOCs Coming from the Dehydration of the Primary Holocellulose Decomposition Products

Among the identified compounds (Table 4) coming from flax fibers of hot-pressed NFC, furan compounds such as furfural, 2-furanmethanol and 5-methylfurfural were identified. Such compounds have already been identified elsewhere as decomposition products of lignocellulosic fibers in NFC [24,27,65]. According to Figure 5a, in the case of thermocompression in which the targeted core temperature is 180 °C, a switch from a temperature of 200 °C to 240 °C does not change the emitted quantity of furfural and 2-furanmethanol. The same observation was made in the case of thermocompression in which the targeted core temperature is 200 °C (Figure 5b). However, one can note the appearance of 5-methylfurfural in small quantities. It should also be emphasized that furfural and 2- furanmethanol were released 1.5 to 2 times more when the temperature increased from 180 °C to 200 °C.
Finally, when the core temperature is at the heat press temperatures, going from a temperature of 200 °C to 240 °C, the results in Figure 5c show that the higher the heat press temperatures, the greater the presence of 2-methylfurfural, 2-furanmethanol and furfural. Between a thermocompression at 200 °C and one at 240 °C, the quantities of 2-methylfurfural, 2-furanmethanol and furfural emitted by the NFC were multiplied by 8.7, 8.8 and 4.8, respectively. One can also notice that the amounts of furfural and 2-furanmethanol at 210 °C are close to the amount of decanal, which is the aliphatic aldehyde in the largest quantity. Then, from 220 °C, the amount of furfural and 2-furanmethanol is well beyond the decanal. Qualitatively, the odor of 5-methylfurfural is described by notes of caramel, almond or even burnt sugar. Furfural is described by notes of almond, baked bread, sweet, woody and nut. Finally, 2-furanmethanol is described by sweet, burnt, caramel, baked bread and coffee notes (Table 4). Consequently, the increase in these VOCs may cause an increase in these different olfactory notes. The odor profile of hot-compressed NFC is more complex, with a pyrogenic (burnt smell) and phenolic smell. This evolution of odor has also been observed in the case of flax fibers heated between 200 and 230 °C [30]. Therefore, there seems to be a strong correlation between the increase in odor intensity and the increase in VOCs coming from the degradation of holocelluloses when NFPP nonwovens are thermocompressed at temperatures above 200 °C and up to 240 °C.
Flax fibers are lignocellulosic fibers composed of 60 to 85% cellulose, 14 to 20.6% hemicelluloses and 1 to 3% lignin [66]. It is well established that the thermal degradation of holocelluloses [67], i.e., cellulose [67,68,69,70,71] and hemicelluloses [68,69,70,72,73], genders thermal decomposition products such as furfural, 2-furanmethanol and 5-methylfurfural. A great difference was shown between the pyrolysis behaviors of hemicellulose, cellulose and lignin [70,73,74]. The pyrolysis TGA and DTG curves [70] show that the thermal degradation of hemicelluloses mainly occurred in the temperature range from 200 to 340 °C, with a maximum degradation temperature from 240 to 285 °C, while cellulose degradation is more pronounced between 300 and 400 °C, with a maximum degradation temperature at 355 °C. Finally, the thermal degradation of lignin mainly occurred between 138 and 780 °C and takes place in three stages (first step: <138 °C; second step: from 138 to 285 °C; third step: from 285 to 780 °C), with very low thermal degradation compared to hemicelluloses and cellulose. The primary products issued from the thermal decomposition of hemicelluloses and cellulose are considered here, whereas the products from lignin will be studied in the next section. The cell walls of flax fibers are made up of different types of hemicelluloses depending on the cell walls. The middle lamella and primary cell wall, lying on the surface, contain xyloglucans and xylans hemicelluloses, while the secondary/G-layer cell walls contain mannans/heteromannans hemicelluloses [75]. Xyloglucans (hexosans) are polysaccharides made up of a D-glucose main chain with pendant xylose residues. Xylans (pentosans) are also polysaccharides whose main chain consists of D-xylose monomers linked to each other by the β-(1,4)-glycosidic bonds, on which short-side chains are grafted. Furfural formation can be described in the literature as a simple, successive two-step reaction. The first step is the xylans hemicelluloses (acid-catalyzed) hydrolysis into xyloses (pentose sugars), and the second step is the dehydration of xyloses [76,77,78]. The evaporation of water (moisture content in NFC) in the beginning of thermocompression must be attributed to the xylans (contained in hemicelluloses) hydrolysis into xylose [78] and the byproduct acetic acid [74,77,79]. Under uncontrolled conditions such as pH and temperature, water can act as a weak acid and engender the acid-catalyzed hydrolysis of xylans into xylose. In parallel, water reacts with acetyl groups of hemicelluloses (xylans) and product acetic acid, which is present in our study [77]. The dehydration reaction within xylans takes place between 150 and 240 °C (breaking of a less stable linkage) and becomes significant from 200 °C [80]. Nitu et al. [81] showed, by the chemical analysis of a jute stick particleboard thermocompressed between 180 and 220 °C, that the higher the heat press temperatures, the greater the degradation of hemicellulose. Additionally, the decrease in pentosans and xylose may indicate their conversion to furfural. Cristescu et al. [37] showed that furfural appears after a thermocompression of pressed lignocellulosic boards at 200, 225 and 250 °C. Moreover, both 2-furanmetanol and 5-methylfurfural can be obtained by the thermal dehydration of cellulose [82]. Beyond heat press temperatures of 200 °C, the water (in a subcritical state) content in cellulose fibers migrates, and hydrolysis amorphizes cellulose. During thermocompression, compression (pressure) decreases the degree of polymerization (DP) of cellulose fibers due to the harsh friction between cellulose fibers and engenders the cleavage of the β-1,4-glycosidic bonds binding the D-glucopyranose monomer [77,82,83]. The dehydration of D-glucopyranose generates furfural and 2-furanmethanol, and two successive dehydrations generate 5-methyl-furfural [84].
Therefore, furan compounds (Furfural, 2-Furanmethanol and 5-methylfurfural) coming from the dehydration of the primary holocellulose decomposition products of flax fibers increase when the heat press temperature increases. Furan compounds give globally burnt sugar, baked bread, caramel and woody odor facets of the NFC odor profile.

3.3.3. VOCs Coming from the Primary Degradation of Lignin

Among the identified compounds (Table 4) coming from the flax fibers of hot-pressed NFC, aromatic aldehydes such benzaldehyde and vanillin were identified. These aromatic aldehydes have already been identified as lignocellulosic fibers decomposition products [24,27] in NFC. According to Figure 6, in the case of thermocompression with a targeted core temperature of 180 °C, increasing the temperature from 200 °C to 240 °C does not drastically change the emitted quantity of benzaldehyde and vanillin. The same result was observed in the case of thermocompression with a targeted core temperature of 200 °C. However, it should be underlined that the switch from a core temperature of 180 °C to 200 °C induced a more important release of benzaldehyde and vanillin from the composite in the headspace. As previously established in the case in which the core temperature is the same as the heat press temperature, going from 200 °C to 240 °C, the results reported in Figure 6 indicate that the higher the heat press temperature, the greater the released quantities of benzaldehyde and vanillin. Indeed, the amount of benzaldehyde and vanillin is almost four times higher for NFC 240-240 compared to that for NFC 200-200. On average, there is 2.6 times more benzaldehyde emitted compared to vanillin for each thermocompression temperature. A comparison of these results was made with the results of 2-furanmethanol (Figure 5). This compound is the most important VOC originating from the degradation of holocelluloses. This analysis underlined much smaller quantities of benzaldehyde and vanillin compared to 2-furanmethanol. Therefore, VOCs from the thermal degradation of holocelluloses may play a much more important role in the increase in NFC odor than VOCs issued from the thermal degradation of lignin. This may be explained by the amount of lignin in flax fibers being between 1 and 3% [66], with a complex aromatic polymer structure composed of three phenylpropane units (H, G and S) cross-linked to each other with a variety of chemical bonds. Therefore, lignin has a much wider thermal degradation temperature range of 138–780 °C, with a maximum degradation temperature around 350 °C [70], which is far from the heat press temperature range used in the present work. Additionally, it should be noted that, in the nonwoven, there always remains a residual quantity of flax shives (the central part of a flax stem) with a significant amount of lignin (around 25%) [39]. Thus, some of the VOCs from lignin degradation may also come from flax shives.
Benzaldehyde and substituted benzaldehydes are commonly evidenced as degradation products from the pyrolysis of lignin [85]. Vanillin has already been identified as a compound emitted from composite materials reinforced with lignin and hot pressed at 235 °C [86]. According to Badji et al. [24], two distinct pathways could allow for the release of vanillin from ferulic acid. One pathway is the decarboxylation of ferulic acid, forming 4-vinylguaiacol, followed by the oxidation of 4-vinylguaiacol. Another pathway is the hydrolysis of ferulic acid, followed by deacetylation. According to Badji et al., the latter pathway seems to be more likely than the first one.
Therefore, aromatic aldehyde compounds, such as benzaldehyde and vanillin, coming from the dehydration of the primary holocellulose decomposition of lignin increase when the heat press temperature increases. Benzaldehyde and vanillin globally give the almond, burnt sugar and vanilla odor facets of the NFC odor profile.

4. Conclusions

In this study, the effects of compressing molding temperature on VOCs and odors released from the NFPP nonwoven composites were examined by heating nonwoven preforms from 180 °C to 240 °C. Moreover, during the thermocompression process, different core temperatures were targeted: 180 °C, 200 °C and until the temperature at the core of the composite material was equal to the temperature of the heating plates of hot press compression molding. The measurements of the core temperature of the nonwoven in situ and in real time during the thermocompression allowed for evidencing that the time required to reach 180 °C or 200 °C at the core decreased from 200 °C to 240 °C. The time difference needed to reach 180 or 200 °C at the core sharply decreased, from 22 s to 4 s, when going from an initial temperature of the hot plates of 200 °C to 240 °C. The results demonstrated a change in the odor intensity and VOCs composition with temperature. The odor approach based on the odor intensity scale rated by a trained panel allowed for establishing that:
-
For a target core temperature of 180 and 200 °C, heat nonwovens from 200 °C to 240 °C did not drastically change the odor intensity of NFCs. It is noteworthy that the lowest average odor intensity was obtained for material hot pressed at 200 °C.
-
For a target core temperature equal to the temperature of the heating plates of the hot press compression molding, heating nonwovens from 200 °C to 240 °C increased the odor intensity of NFCs. The lowest odor intensity is obtained for the heat press temperature of 200 °C and the targeted core temperature of 180 °C. Moreover, to avoid a high odor intensity (>4), the heat press temperature and targeted core temperature should not exceed 210 °C.
In addition, the chemical approach based on headspace solid-phase microextraction (HS-SPME) coupled with gas chromatography–mass spectrometry (GC-MS) revealed that:
-
Some VOCs come from lipophilic extractives of flax fibers and are mainly aliphatic aldehydes (hexanal, heptanal, octanal and decanal) and unsaturated aldehydes (2-heptenal, 2-nonenal) associated with fatty and green odors.
-
Some VOCs come from the dehydration of the primary holocellulose decomposition products and are furan compounds (2-furanmethanol, furfural and 5-methylfurfural) associated with burnt sugar, baked bread and burnt odors.
-
Some VOCs come from the primary degradation of lignin, which are aromatic aldehydes (benzaldehyde and vanillin) associated with almond, burnt sugar and vanilla odors.
-
Switching from a target core temperature of 180 to 200 °C and heat nonwovens from 200 °C to 240 °C slightly increases all VOCs coming from flax fibers of NFC.
-
For a target core temperature equal to the temperature of the heating plates of hot press compression molding, heat nonwovens from 200 °C to 240 °C do not change the VOCs quantity coming from the lipophilic extractives of flax fibers but drastically increase the VOCs coming from the degradation of holocellulose and lignin.
Finally, on the basis of the original results obtained in the present work, a correlation between the increase in odor intensity and the increase in VOCs coming from the degradation of holocelluloses and lignin was established. To go further, analyses by gas chromatography–mass spectrometry (GC-MS) coupled with an olfactometer (O) would make it possible to clearly identify odorous VOCs and to follow their evolution according to the compression molding temperature.

Author Contributions

Conceptualization, K.B., M.G. and G.S.; methodology, B.B.-M., M.H., K.B., M.G. and G.S.; validation, B.B.-M., M.H., K.B., M.G. and G.S.; investigation, B.B.-M.; original draft preparation, B.B.-M.; writing—review and editing, B.B.-M., M.H., M.G. and G.S.; visualization, B.B.-M., M.H., K.B., M.G. and G.S.; supervision, K.B., M.G. and G.S.; funding acquisition, K.B., M.G. and G.S. All authors have read and agreed to the published version of the manuscript.

Funding

This research was funded by the National Research and Technology Association (ANRT).

Institutional Review Board Statement

The study was conducted in accordance with the Declaration of Helsinki and approved by the Ethics Committee of Université Le Havre Normandie (18 April 2022).

Informed Consent Statement

Informed consent was obtained from all subjects involved in the study.

Data Availability Statement

The data presented in this study are available on request from the corresponding author.

Acknowledgments

First of all, the authors would like to thank the National Research and Technology Association (ANRT) for funding Benjamin BARTHOD-MALAT’s PhD thesis. The authors would also like to thank the formed panel of six voluntary assessors. Finally, the authors would also like to thank the laboratory technicians of URCOM for their invaluable assistance.

Conflicts of Interest

The authors declare no conflict of interest.

Appendix A

Table A1. Volatile organic compounds coming from flax fibers of NFC shaped for heat press temperatures between 200 and 240 °C for different core temperatures (1/2).
Odor DescriptorsQuantification
(Mean Peak Area Units × 103 ± SD)
Core Temperature: 180 °C
VOCs FamiliesCompounds a,bMSS(%)RT exp.LRI exp.LRI lit.NFC
200-180
NFC
210-180
NFC
220-180
NFC
230-180
NFC
240-180
AldehydeHexenal986.37806804Green, fatty, aldehyde, herb c,d,e,f,g,h,i2142 ± 2882383 ± 1542466 ± 1742253 ± 922233 ± 229
Furfural987.00831836Almond, baked bread, woody, nut c,j,k,l,i1349 ± 1161349 ± 116834 ± 1911912 ± 419856 ± 115
Heptanal908.33905904Fatty, citrus, rancid, green c,g,h583 ± 98581 ± 93522 ± 56631 ± 94496 ± 185
2-Heptenal, (Z)-929.38913960Fatty, fruit/mushroom, soapy h,i161 ± 38195 ± 59162 ± 28215 ± 53154 ± 39
5-Methylfurfural949.46920964Caramel, almond, burnt sugar c/////
Benzaldehyde969.52982967Almond, burnt sugar, sweet, caramel c,h,k,i209 ± 56214 ± 79241 ± 35307 ± 72223 ± 7
Octanal9710.2410051005Fatty, lemon, green, rancid, soap c,d,e,j,f,g,h908 ± 76802 ± 115950 ± 461105 ± 491031 ± 82
2-Nonenal, (E)-9513.7411121162Cucumber, green, fatty c,d,j,f,gh251 ± 42254 ± 34244 ± 39384 ± 38259 ± 29
Decanal9614.8812041208Fatty, soapy, orange peel, sugar c,e,g,h2071 ± 2001680 ± 571750 ± 801801 ± 1281873 ± 53
Vanillin9120.2313921402Vanilla c,e,f,l90 ± 2105 ± 9104 ± 16129 ± 7109 ± 23
Alcohol2-Furanmethanol987.43885858Burnt, sweet, caramel, bread, coffee c,k,l860 ± 59860 ± 591118 ± 1381873 ± 2491466 ± 72
CarboxylicacidAcetic acid983.44656576Sour, acid, sunflower seed, cheesy c,e,k7545 ± 6777480 ± 11197584 ± 9778800 ± 21771761 ± 214
Octanoic acid9414.2711831173Sweat, cheese, rancid c,k3318 ± 3973106 ± 5903585 ± 6324555 ± 814099 ± 450
FuranFuran, 2-pentyl-979.999921040Fruity, green, earthy, orange c,g3006 ± 703136 ± 3543137 ± 4613605 ± 2033215 ± 130
Compounds identified by: a Mass Spectra Similarity ≥ 90%; b Retention Index obtained experimentally not exceeding ± 50 of the NIST library standard. “/” signifies no quantified compounds. Odor description was obtained from: c [28], d [46], e [47], f [48], g [49], h [50], i [51], j [52], k [53] and l [54], respectively.
Table A2. Volatile organic compounds coming from flax fibers of NFC shaped for heat press temperatures between 200 and 240 °C for different core temperature (2/2).
Compounds a,bQuantification
(Mean Peak Area Units × 103 ± SD)
Core Temperature: 200 °CCore Temperature: From 210 to 240 °C
NFC
200-200
NFC
210-200
NFC
220-200
NFC
230-200
NFC
240-200
NFC
210-210
NFC
220-220
NFC
230-230
NFC
240-240
Hexenal1735 ± 1022198 ± 1652319 ± 1321910 ± 2611891 ± 1171983 ± 521148 ± 104942 ± 128898 ± 261
Furfural1814 ± 5072847 ± 4042731 ± 5532419 ± 5312118 ± 1734518 ± 2326898 ± 10257586 ± 67213,777 ± 572
Heptanal656 ± 52809 ± 108790 ± 102712 ± 74611 ± 65707 ± 130592 ± 122543 ± 39584 ± 34
2-Heptenal, (Z)-170 ± 11244 ± 65225 ± 50196 ± 10150 ± 48314 ± 5247 ± 68260 ± 53376 ± 36
5-Methylfurfural104 ± 9138 ± 33131 ± 47119 ± 24109 ± 15296 ± 55536 ± 132507 ± 661230 ± 65
Benzaldehyde279 ± 14434 ± 50434 ± 50291 ± 25267 ± 51630 ± 29765 ± 143861 ± 1111424 ± 41
Octanal1445 ± 1061557 ± 1021420 ± 791353 ± 1191355 ± 1311663 ± 331843 ± 1871678 ± 1582045 ± 422
2-Nonenal, (E)-398 ± 51490 ± 61452 ± 83415 ± 78279 ± 83580 ± 29923 ± 67772 ± 1691104 ± 102
Decanal3343 ± 3322788 ± 2132692 ± 1952629 ± 2893288 ± 5192726 ± 1363702 ± 2083054 ± 201944 ± 194
Vanillin107 ± 6205 ± 23205 ± 23151 ± 42116 ± 16261 ± 30296 ± 80326 ± 55505 ± 90
2-Furanmethanol2214 ± 3522596 ± 3773063 ± 3122531 ± 1632123 ± 4824744 ± 15910,918 ± 102415,019 ± 59820,480 ± 2001
Acetic acid8523 ± 17199880 ± 2198895 ± 18457893 ± 7616458 ± 6828579 ± 27510,664 ± 12408,748 ± 129713,552 ± 1545
Octanoic acid5986 ± 6375821 ± 4225078 ± 11885590 ± 20525678 ± 7827059 ± 2758378 ± 10317228 ± 99514,051 ± 2381
Furan, 2-pentyl-3375 ± 2494148 ± 24640,153 ± 813908 ± 1213618 ± 3484675 ± 1494096 ± 5304263 ± 6194639 ± 324
Compounds identified by: (a) Mass Spectra Similarity ≥90%; (b) Retention Index obtained experimentally not exceeding ± 50 of the NIST library standard. “/” signifies no quantified compounds.

References

  1. Paris Agreement, United Nations. 2015. Available online: https://unfccc.int/sites/default/files/english_paris_agreement.pdf (accessed on 16 April 2020).
  2. CO2 Emission Performance Standards for Cars and Vans. Available online: https://climate.ec.europa.eu/eu-action/transport-emissions/road-transport-reducing-co2-emissions-vehicles/co2-emission-performance-standards-cars-and-vans_en (accessed on 7 November 2022).
  3. Proposal for a Regulation of the European Parliament and of the Council Amending Regulation (EU) 2019/631 as Regards Strengthening the CO2 Emission Performance Standards for New Passenger Cars and New Light Commercial Vehicles in Line with the Union’s Increased Climate Ambition; European Commission: Brussels, Belgium, 2021.
  4. La Transition Bas Carbone: Une Opportunité Pour l’industrie Automobile Française? The Shift Project: Paris, France, 2021; Rapport Final.
  5. Meilhan, N. Comment faire enfin baisser les émissions de CO2 des voitures. La Note D’analyse 2019, 78, 1–12. [Google Scholar] [CrossRef]
  6. Li, Y.; Ha, N.; Li, T. Research on Carbon Emissions of Electric Vehicles throughout the Life Cycle Assessment Taking into Vehicle Weight and Grid Mix Composition. Energies 2019, 12, 3612. [Google Scholar] [CrossRef]
  7. Ducreux, B.O.; Dore, N. AVIS de l’ADEME: Voitures Électriques et Bornes de Recharges. ADEME 2022, 1–10. [Google Scholar]
  8. Huda, M.K.; Widiastuti, I. Natural Fiber Reinforced Polymer in Automotive Application: A Systematic Literature Review. J. Phys.: Conf. Ser. 2021, 1808, 012015. [Google Scholar] [CrossRef]
  9. Issa, A.; Salihi, A.; Aliyu, A.B. Automotive Applications of Animal and Plant Fiber Based Thermoplastic Composite: A Review. Am. J. Eng. Res. 2022, 12. [Google Scholar]
  10. Thakur, V.K.; Thakur, M.K.; Gupta, R.K. Review: Raw Natural Fiber–Based Polymer Composites. Int. J. Polym. Anal. Charact. 2014, 19, 256–271. [Google Scholar] [CrossRef]
  11. Meirhaeghe, C.; Bewa, H. Evaluation de la disponibilité et de l’accessibilité de fibres végétales à usages matériaux en France. ADEME-FRD 2011, 84. [Google Scholar]
  12. Le Duigou, A.; Davies, P.; Baley, C. Environmental Impact Analysis of the Production of Flax Fibres to Be Used as Composite Material Reinforcement. J. Biobased Mater. Bioenergy 2011, 5, 153–165. [Google Scholar] [CrossRef]
  13. de Beus, N.; Barth, M.; Carus, M. Carbon Footprint and Sustainability of Different Natural Fibres for Biocomposites and Insulation Material. Nova Inst. 2019, 56. [Google Scholar]
  14. Gueudet, A. Analyse Du Cycle de Vie Comparative de Panneaux de Porte Automobiles Biosourcé (PP/Fibres de Lin et de Chanvre) et Petrosource (ABS). Quantis Frs Ecotechnilin 2016, 119. [Google Scholar]
  15. Merotte, J.; Le Duigou, A.; Bourmaud, A.; Behlouli, K.; Baley, C. Mechanical and Acoustic Behaviour of Porosity Controlled Randomly Dispersed Flax/PP Biocomposite. Polym. Test. 2016, 51, 174–180. [Google Scholar] [CrossRef]
  16. Zhang, J.; Khatibi, A.A.; Castanet, E.; Baum, T.; Komeily-Nia, Z.; Vroman, P.; Wang, X. Effect of Natural Fibre Reinforcement on the Sound and Vibration Damping Properties of Bio-Composites Compression Moulded by Nonwoven Mats. Compos. Commun. 2019, 13, 12–17. [Google Scholar] [CrossRef]
  17. Hadiji, H.; Assarar, M.; Zouari, W.; Pierre, F.; Behlouli, K.; Zouari, B.; Ayad, R. Damping Analysis of Nonwoven Natural Fibre-Reinforced Polypropylene Composites Used in Automotive Interior Parts. Polym. Test. 2020, 89, 106692. [Google Scholar] [CrossRef]
  18. Renouard, N.; Mérotte, J.; Kervoëlen, A.; Behlouli, K.; Baley, C.; Bourmaud, A. Exploring Two Innovative Recycling Ways for Poly-(Propylene)-Flax Non Wovens Wastes. Polym. Degrad. Stab. 2017, 142, 89–101. [Google Scholar] [CrossRef]
  19. Bourmaud, A.; Fazzini, M.; Renouard, N.; Behlouli, K.; Ouagne, P. Innovating Routes for the Reused of PP-Flax and PP-Glass Non Woven Composites: A Comparative Study. Polym. Degrad. Stab. 2018, 152, 259–271. [Google Scholar] [CrossRef]
  20. Shah, D.U. Developing Plant Fibre Composites for Structural Applications by Optimising Composite Parameters: A Critical Review. J. Mater. Sci. 2013, 48, 6083–6107. [Google Scholar] [CrossRef]
  21. Engel, L. Biocomposites Performing Great—Not Only for Lightweight Construction. Nova-Institute. Renew. Carbon News 2019. [Google Scholar]
  22. Chen, X.; Zhang, G.; Chen, H. Controlling Strategies and Technologies of Volatile Organic Compounds Pollution in Interior Air of Cars. In Proceedings of the 2010 International Conference on Digital Manufacturing & Automation, Changcha, China, 18–20 December 2010; Volume 1, pp. 450–453. [Google Scholar]
  23. Faber, J. Air Quality inside Passenger Cars. AIMS Environ. Sci. 2017, 4, 112–133. [Google Scholar] [CrossRef]
  24. Badji, C.; Beigbeder, J.; Garay, H.; Bergeret, A.; Bénézet, J.-C.; Desauziers, V. Under Glass Weathering of Hemp Fibers Reinforced Polypropylene Biocomposites: Impact of Volatile Organic Compounds Emissions on Indoor Air Quality. Polym. Degrad. Stab. 2018, 149, 85–95. [Google Scholar] [CrossRef]
  25. Guidelines on Odour Pollution and Its Control. Central Pollution Control Board; Ministry of Environment & Forests, Govt. of India: New Delhi, India, 2008; 57p. [Google Scholar]
  26. Fischer, H.; Knittel, D.; Opwis, K. Verbesserung Der Geruchseigenschaften von Naturfasern Zur Öffnung Neuer Märkte in Den Bereichen Technische Textilien Und Verbundwerkstoffe.; University of Bremen: Bremen, Germany, 2008; ISBN 978-3-8370-7213-6. [Google Scholar]
  27. Savary, G.; Morel, A.; Picard, C.; Grisel, M. Effect of Temperature on the Release of Volatile and Odorous Compounds in Flax Fibers. J. Appl. Polym. Sci. 2016, 133, 43497. [Google Scholar] [CrossRef]
  28. Bledzki, A.; Al-Mamun, A.; Faruk, O. Abaca Fibre Reinforced PP Composites and Comparison with Jute and Flax Fibre PP Composites. Express Polym. Lett. —Express Polym Lett. 2007, 1, 755–762. [Google Scholar] [CrossRef]
  29. Li, Z.; Wei, X.; Liu, J.; Han, H.; Jia, H.; Song, J. Mechanical Properties and VOC Emission of Hemp Fibre Reinforced Polypropylene Composites: Natural Freezing-Mechanical Treatment and Interface Modification. Fibers Polym. 2021, 22, 1050–1062. [Google Scholar] [CrossRef]
  30. Morin, S.; Richel, A. Study of Chemical and Enzymatic Functionalization of Lignocellulosic Natural Fibers: Designing Natural Fibers for Biocomposites; Liège Université Gembloux Agro-Bio Tech: Liège, Belgium, 2021. [Google Scholar]
  31. Courgneau, C.; Rusu, D.; Henneuse, C.; Ducruet, V.; Lacrampe, M.F.; Krawczak, P. Characterisation of Low-Odour Emissive Polylactide/Cellulose Fibre Biocomposites for Car Interior. Express Polym. Lett. 2013, 7, 787. [Google Scholar] [CrossRef]
  32. Kim, H.-S.; Lee, B.-H.; Kim, H.-J.; Yang, H.-S. Mechanical–Thermal Properties and VOC Emissions of Natural-Flour-Filled Biodegradable Polymer Hybrid Bio-Composites. J. Polym. Environ. 2011, 19, 628–636. [Google Scholar] [CrossRef]
  33. Faruk, O.; Bledzki, A.; Al-Mamun, A. Influence of Compounding Processes and Fibre Length on the Mechanical Properties of Abaca Fibre-Polypropylene Composites. Polymery 2008, 53, 35–42. [Google Scholar] [CrossRef]
  34. Mahir, F.; Keya, K.N.; Sarker, B.; Nahiun, K.; Khan, R. A Brief Review on Natural Fiber Used as a Replacement of Synthetic Fiber in Polymer Composites. Mater. Eng. Res. 2019, 1, 88–99. [Google Scholar] [CrossRef] [Green Version]
  35. Radkar, S.; Amiri, A.; Ulven, C. Tensile Behavior and Diffusion of Moisture through Flax Fibers by Desorption Method. Sustainability 2019, 11, 3558. [Google Scholar] [CrossRef]
  36. Pintiaux, T.; Viet, D.; Vandenbossche, V.; Rigal, L.; Rouilly, A. Binderless Materials Obtained by Thermo-Compressive Processing of Lignocellulosic Fibers: A Comprehensive Review. BioResources 2015, 10, 1915–1963. [Google Scholar]
  37. Cristescu, C. Self-Bonding of Beech Veneers; Luleå Tekniska Universitet: Luleå, Sweden, 2015. [Google Scholar]
  38. Gager, V.; Le Duigou, A.; Bourmaud, A.; Pierre, F.F.; Behlouli, K.; Baley, C. Comportement Hygromécanique Des Biocomposites Non-Tissés Soumis à Des Variations d’humidité. In Proceedings of the JNC 21: 21ème Journées Nationales sur les Composites 2019; École Nationale Supérieure d’Arts et Métiers (ENSAM)-Bordeaux, Bordeaux, France, 1–3 July 2019. [Google Scholar]
  39. Evon, P.; Barthod-Malat, B.; Gregoire, M.; Vaca-Medina, G.; Labonne, L.; Ballas, S.; Véronèse, T.; Ouagne, P. Production of Fiberboards from Shives Collected after Continuous Fiber Mechanical Extraction from Oleaginous Flax. J. Nat. Fibers 2018, 16, 453–469. [Google Scholar] [CrossRef]
  40. Acera Fernández, J.; Le Moigne, N.; Caro-Bretelle, A.S.; El Hage, R.; Le Duc, A.; Lozachmeur, M.; Bono, P.; Bergeret, A. Role of Flax Cell Wall Components on the Microstructure and Transverse Mechanical Behaviour of Flax Fabrics Reinforced Epoxy Biocomposites. Ind. Crops Prod. 2016, 85, 93–108. [Google Scholar] [CrossRef]
  41. Gutiérrez, A.; del Río, J.C. Lipids from Flax Fibers and Their Fate in Alkaline Pulping. J. Agric. Food Chem. 2003, 51, 6911–6914. [Google Scholar] [CrossRef]
  42. Marques, G.; del Río, J.C.; Gutiérrez, A. Lipophilic Extractives from Several Nonwoody Lignocellulosic Crops (Flax, Hemp, Sisal, Abaca) and Their Fate during Alkaline Pulping and TCF/ECF Bleaching. Bioresour. Technol. 2010, 101, 260. [Google Scholar] [CrossRef] [PubMed]
  43. Csiszár, E.; Fekete, E.; Tóth, A.; Bandi, E.K.; Koczka, B.; Sajó, I. Effect of Particle Size on the Surface Properties and Morphology of Ground Flax. Carbohydr. Polym. 2013, 94, 927–933. [Google Scholar] [CrossRef]
  44. Sachs, R.; Ihde, J.; Wilken, R.; Mayer, B. Treatment of Flax Fabric with AP-DBD in Parallel Plane Configuration. Plasma 2019, 2, 272–282. [Google Scholar] [CrossRef]
  45. Majcher, M.A.; Scheibe, M.; Jeleń, H.H. Identification of Odor Active Compounds in Physalis peruviana L. Molecules 2020, 25, 245. [Google Scholar] [CrossRef]
  46. Brattoli, M.; Cisternino, E.; Dambruoso, P.R.; de Gennaro, G.; Giungato, P.; Mazzone, A.; Palmisani, J.; Tutino, M. Gas Chromatography Analysis with Olfactometric Detection (GC-O) as a Useful Methodology for Chemical Characterization of Odorous Compounds. Sensors 2013, 13, 16759–16800. [Google Scholar] [CrossRef]
  47. Schreiner, L.; Bauer, P.; Buettner, A. Resolving the Smell of Wood-Identification of Odour-Active Compounds in Scots Pine (Pinus sylvestris L.). Sci. Rep. 2018, 8, 8294. [Google Scholar] [CrossRef] [PubMed] [Green Version]
  48. Ma, R.; Liu, X.; Tian, H.; Han, B.; Li, Y.; Tang, C.; Zhu, K.; Li, C.; Meng, Y. Odor-Active Volatile Compounds Profile of Triploid Rainbow Trout with Different Marketable Sizes. Aquac. Rep. 2020, 17, 100312. [Google Scholar] [CrossRef]
  49. Villavicencio, J.D.; Zoffoli, J.P.; Plotto, A.; Contreras, C. Aroma Compounds Are Responsible for an Herbaceous Off-Flavor in the Sweet Cherry (Prunus avium L.) Cv. Regina during Fruit Development. Agronomy 2021, 11, 2020. [Google Scholar] [CrossRef]
  50. Nie, C.; Gao, Y.; Du, X.; Bian, J.; Li, H.; Zhang, X.; Wang, C.; Li, S. Characterization of the Effect of Cis-3-Hexen-1-Ol on Green Tea Aroma. Sci. Rep. 2020, 10, 15506. [Google Scholar] [CrossRef]
  51. Lin, H.; Liu, Y.; He, Q.; Liu, P.; Che, Z.; Wang, X.; Huang, J. Characterization of Odor Components of Pixian Douban (Broad Bean Paste) by Aroma Extract Dilute Analysis and Odor Activity Values. Int. J. Food Prop. 2019, 22, 1223–1234. [Google Scholar] [CrossRef]
  52. Wang, H.; Yang, P.; Liu, C.; Song, H.; Pan, W.; Gong, L. Characterization of Key Odor-Active Compounds in Thermal Reaction Beef Flavoring by SGC×GC-O-MS, AEDA, DHDA, OAV and Quantitative Measurements. J. Food Compos. Anal. 2022, 114, 104805. [Google Scholar] [CrossRef]
  53. Casassa, L.; Ceja, G.; Vega-Osorno, A.; Fresne, F.; Llodrá, D. Detailed Chemical Composition of Cabernet Sauvignon Wines Aged in French Oak Barrels Coopered with Three Different Stave Bending Techniques. Food Chem. 2020, 340, 127573. [Google Scholar] [CrossRef]
  54. Fereidoon, S.; Pegg, R.B. Hexanal as an Indicator of Meat Flavor Deterioration. J. Food Lipids 1994, 1, 177–186. [Google Scholar] [CrossRef]
  55. Clarke, H.J.; McCarthy, W.P.; O’Sullivan, M.G.; Kerry, J.P.; Kilcawley, K.N. Oxidative Quality of Dairy Powders: Influencing Factors and Analysis. Foods 2021, 10, 2315. [Google Scholar] [CrossRef]
  56. Grebenteuch, S.; Kroh, L.W.; Drusch, S.; Rohn, S. Formation of Secondary and Tertiary Volatile Compounds Resulting from the Lipid Oxidation of Rapeseed Oil. Foods 2021, 10, 2417. [Google Scholar] [CrossRef] [PubMed]
  57. Kastrup Dalsgaard, T.; Sørensen, J.; Bakman, M.; Vognsen, L.; Nebel, C.; Albrechtsen, R.; Nielsen, J.H. Light-Induced Protein and Lipid Oxidation in Cheese: Dependence on Fat Content and Packaging Conditions. Dairy Sci. Technol. 2010, 90, 565–577. [Google Scholar] [CrossRef] [Green Version]
  58. Snyder, J.M.; Frankel, E.N.; Selke, E.; Warner, K. Comparison of Gas Chromatographic Methods for Volatile Lipid Oxidation Compounds in Soybean Oil. J. Amer. Oil Chem Soc. 1988, 65, 1617–1620. [Google Scholar] [CrossRef]
  59. Lipid Oxidation-2nd Edition. Available online: https://www.elsevier.com/books/lipid-oxidation/frankel/978-0-9531949-8-8 (accessed on 11 November 2022).
  60. Yang, S.; Lee, J.; Lee, J.; Lee, J. Effects of Riboflavin-Photosensitization on the Formation of Volatiles in Linoleic Acid Model Systems with Sodium Azide or D2O. Food Chem. 2007, 105, 1375–1381. [Google Scholar] [CrossRef]
  61. García-Martínez, M.C.; Márquez-Ruiz, G.; Fontecha, J.; Gordon, M.H. Volatile Oxidation Compounds in a Conjugated Linoleic Acid-Rich Oil. Food Chem. 2009, 113, 926–931. [Google Scholar] [CrossRef]
  62. Min, D.B.; Callison, A.L.; Lee, H.O. Singlet Oxygen Oxidation for 2-Pentylfuran and 2-Pentenyfuran Formation in Soybean Oil. J. Food Sci. 2003, 68, 1175–1178. [Google Scholar] [CrossRef]
  63. Krishnamurthy, R.G.; Smouse, T.H.; Mookherjee, B.D.; Reddy, B.R.; Chang, S.S. Identification of 2-Pentyl Furan in Fats and Oils and Its Relationship to the Reversion Flavor of Soybean Oil. J. Food Sci. 1967, 32, 372–374. [Google Scholar] [CrossRef]
  64. Cao, J.; Deng, L.; Zhu, X.-M.; Fan, Y.; Hu, J.-N.; Li, J.; Deng, Z.-Y. Novel Approach to Evaluate the Oxidation State of Vegetable Oils Using Characteristic Oxidation Indicators. J. Agric. Food Chem. 2014, 62, 12545–12552. [Google Scholar] [CrossRef] [PubMed]
  65. Domenek, S.; Berzin, F.; Ducruet, V.; Plessis, C.; Dhakal, H.; Richaud, E.; Beaugrand, J. Extrusion and Injection Moulding Induced Degradation of Date Palm Fibre-Polypropylene Composites. Polym. Degrad. Stab. 2021, 190, 109641. [Google Scholar] [CrossRef]
  66. Bourmaud, A.; Beaugrand, J.; Shah, D.; Placet, V.; Baley, C. Towards the Design of High-Performance Plant Fibre Composites. Prog. Mater. Sci. 2018, 97, 347–408. [Google Scholar] [CrossRef]
  67. Paczkowski, S.; Paczkowska, M.; Dippel, S.; Schulze, N.; Schütz, S.; Sauerwald, T.; Weiß, A.; Bauer, M.; Gottschald, J.; Kohl, C.-D. The Olfaction of a Fire Beetle Leads to New Concepts for Early Fire Warning Systems. Sens. Actuators B: Chem. 2013, 183, 273–282. [Google Scholar] [CrossRef]
  68. González Martínez, M.; Anca Couce, A.; Dupont, C.; da Silva Perez, D.; Thiéry, S.; Meyer, X.; Gourdon, C. Torrefaction of Cellulose, Hemicelluloses and Lignin Extracted from Woody and Agricultural Biomass in TGA-GC/MS: Linking Production Profiles of Volatile Species to Biomass Type and Macromolecular Composition. Ind. Crops Prod. 2022, 176, 114350. [Google Scholar] [CrossRef]
  69. Zhao, C.; Jiang, E.; Chen, A. Volatile Production from Pyrolysis of Cellulose, Hemicellulose and Lignin. J. Energy Inst. 2017, 90, 902–913. [Google Scholar] [CrossRef]
  70. Chen, W.-H.; Wang, C.-W.; Ong, H.C.; Show, P.L.; Hsieh, T.-H. Torrefaction, Pyrolysis and Two-Stage Thermodegradation of Hemicellulose, Cellulose and Lignin. Fuel 2019, 258, 116168. [Google Scholar] [CrossRef]
  71. Scheirs, J.; Camino, G.; Avidano, M.; Tumiatti, W. Origin of Furanic Compounds in Thermal Degradation of Cellulosic Insulating Paper. J. Appl. Polym. Sci. 1998, 69, 2541–2547. [Google Scholar] [CrossRef]
  72. Shen, D.K.; Gu, S.; Bridgwater, A.V. Study on the Pyrolytic Behaviour of Xylan-Based Hemicellulose Using TG–FTIR and Py–GC–FTIR. J. Anal. Appl. Pyrolysis 2010, 87, 199–206. [Google Scholar] [CrossRef]
  73. Liu, Q.; Zhong, Z.; Wang, S.; Luo, Z. Interactions of Biomass Components during Pyrolysis: A TG-FTIR Study. J. Anal. Appl. Pyrolysis 2011, 90, 213–218. [Google Scholar] [CrossRef]
  74. Dorez, G.; Ferry, L.; Sonnier, R.; Taguet, A.; Lopez-Cuesta, J.-M. Effect of Cellulose, Hemicellulose and Lignin Contents on Pyrolysis and Combustion of Natural Fibers. J. Anal. Appl. Pyrolysis 2014, 107, 323–331. [Google Scholar] [CrossRef]
  75. Chabi, M.; Goulas, E.; Leclercq, C.C.; de Waele, I.; Rihouey, C.; Cenci, U.; Day, A.; Blervacq, A.-S.; Neutelings, G.; Duponchel, L.; et al. A Cell Wall Proteome and Targeted Cell Wall Analyses Provide Novel Information on Hemicellulose Metabolism in Flax*. Mol. Cell. Proteom. 2017, 16, 1634–1651. [Google Scholar] [CrossRef] [PubMed]
  76. Luo, Y.; Li, Z.; Li, X.; Liu, X.; Fan, J.; Clark, J.H.; Hu, C. The Production of Furfural Directly from Hemicellulose in Lignocellulosic Biomass: A Review. Catal. Today 2019, 319, 14–24. [Google Scholar] [CrossRef]
  77. Weil, J.; Dien, B.; Bothast, R.; Hendrickson, R.; Mosier, N.; Ladisch, M. Removal of Fermentation Inhibitors Formed during Pretreatment of Biomass by Polymeric Adsorbents. Ind. Eng. Chem. Res. 2002, 41, 132–6138. [Google Scholar] [CrossRef]
  78. Fahm, T.Y.A.; Mobarak, F. Advanced Binderless Board-like Green Nanocomposites from Undebarked Cotton Stalks and Mechanism of Self-Bonding. Cellulose 2013, 20, 1453. [Google Scholar] [CrossRef]
  79. Wakushie, N.; Woldeyes, B.; Demsash, H.; Jabasingh, S. An Insight into the Valorization of Hemicellulose Fraction of Biomass into Furfural: Catalytic Conversion and Product Separation. Waste Biomass Valorization 2021, 12, 531–552. [Google Scholar] [CrossRef]
  80. Collard, F.-X.; Blin, J. A Review on Pyrolysis of Biomass Constituents: Mechanisms and Composition of the Products Obtained from the Conversion of Cellulose, Hemicelluloses and Lignin. Renew. Sustain. Energy Rev. 2014, 38, 594–608. [Google Scholar] [CrossRef]
  81. Nitu, I.P.; Islam, M.N.; Ashaduzzaman, M.; Amin, M.K.; Shams, M.I. Optimization of Processing Parameters for the Manufacturing of Jute Stick Binderless Particleboard. J. Wood Sci. 2020, 66, 65. [Google Scholar] [CrossRef]
  82. Wang, S.; Dai, G.; Yang, H.; Luo, Z. Lignocellulosic Biomass Pyrolysis Mechanism: A State-of-the-Art Review. Prog. Energy Combust. Sci. 2017, 62, 33–86. [Google Scholar] [CrossRef]
  83. Pintiaux, T.; Heuls, M.; Vandenbossche Maréchal, V.; Murphy, T.; Wuhrer, R.; Castignolles, P.; Gaborieau, M.; Rouilly, A. Cellulose Consolidation under High-Pressure and High-Temperature Uniaxial Compression. Cellulose 2019, 26, 2941–2954. [Google Scholar] [CrossRef]
  84. Badji, C.; Sotiropoulos, J.-M.; Beigbeder, J.; Garay, H.; Bergeret, A.; Bénézet, J.-C.; Desauziers, V. Under Glass Weathering of Hemp Fibers Reinforced Polypropylene Biocomposites: Degradation Mechanisms Based on Emitted Volatile Organic Compounds. Front. Mater. 2020, 7, 162. [Google Scholar] [CrossRef]
  85. Nowakowski, D.J.; Bridgwater, A.V.; Elliott, D.C.; Meier, D.; de Wild, P. Lignin Fast Pyrolysis: Results from an International Collaboration. J. Anal. Appl. Pyrolysis 2010, 88, 53–72. [Google Scholar] [CrossRef]
  86. Sallem-Idrissi, N.; Vanderghem, C.; Pacary, T.; Richel, A.; Debecker, D.P.; Devaux, J.; Sclavons, M. Lignin Degradation and Stability: Volatile Organic Compounds (VOCs) Analysis throughout Processing. Polym. Degrad. Stab. 2016, 130, 30–37. [Google Scholar] [CrossRef]
Figure 1. Composite manufacturing process by thermocompression and the placement of the thermocouple in the NFPP nonwoven to measure the core temperature in the nonwoven during the hot-pressing process.
Coatings 13 00371 g001
Figure 2. Evolution of the temperature of the non-woven in situ and in real time during the compression molding process: (a) temperature versus time and (b) molding compression time versus heating pate temperature for different target core temperatures.
Coatings 13 00371 g002
Figure 3. Box-plots of odor intensity coming from the NFC according to the molding temperature and the core temperature of the nonwoven in situ during the compression molding process. Letters A, B, C, D and E on the box-plot diagrams are the result of ANOVA analyses (Fisher’s test). NB: Two means with at least one letter in common are not significantly different/two means with no letter in common are significantly different.
Coatings 13 00371 g003
Figure 4. VOCs coming from lipophilic extractives of flax fibers: aliphatic and unsaturated aldehydes as a function of molding temperature conditions for a core temperature of (a) 180 °C, (b) 200 °C and (c) going from 200 °C to 240 °C.
Coatings 13 00371 g004
Figure 5. VOCs coming from the dehydration of the primary holocellulose decomposition products, Furfural, 2-Furanmethanol and 5-methylfurfural, as a function of molding temperature conditions for a core temperature of (a) 180 °C, (b) 200 °C and (c) going from 200 °C to 240 °C.
Coatings 13 00371 g005
Figure 6. VOCs coming from the degradation of lignin: benzaldehyde and vanillin methylfurfural as a function of molding temperature conditions for a core temperature of (a) 180 °C, (b) 200 °C and (c) going from 200 °C to 240 °C.
Coatings 13 00371 g006
Table 1. Temperature parameters and the different configurations of the natural fiber composite (NFC) manufactured.
ConfigurationMolding Temperature (°C)Core Temperature (°C)
NFC 200-180200180
NFC 210-180210180
NFC 220-180220180
NFC 230-180230180
NFC 240-180240180
NFC 200-200200200
NFC 210-200210200
NFC 220-200220200
NFC 230-200230200
NFC 240-200240200
NFC 210-210210210
NFC 220-220220220
NFC 230-230230230
NFC 240-240240240
Table 2. n-butanol odor intensity referencing scale.
LevelOdor Intensityn-butanol Aqueous Solution (g/L)
0No odor0
1Very weak1 × 10−2
2Weak5 × 10−2
3Strong5 × 10−1
4Very Strong2.5
5Very strong and insupportable10
Table 3. Results of the three-way analysis of variance (ANOVA) with interaction.
Factors of Variation and InteractiondFMSFp-Value (Pr > F)
Natural Fiber Composite (NFC) material131.636.26<0.0001
Judge53.8814.87<0.0001
Session10.120.460.50
NFC material × Judge650.421.620.03
Session × NFC130.170.660.80
Judge × Session50.311.190.33
dF = degree of freedom; MS = mean square; F = MS factor/MS residual; p-value = statistical significance.
Table 4. Volatile organic compounds coming from flax fibers of NFC shaped for heat press temperatures between 200 and 240 °C for different core temperature.
VOCs FamiliesCompounds a,bLRI exp.Odor Descriptors
AldehydeHexenal806Green, fatty, aldehyde, herb c,d,e,f,g,h,i
Furfural831Almond, baked bread, woody, nut c,j,k,l,i
Heptanal905Fatty, citrus, rancid, green c,g,h
2-Heptenal, (Z)-913Fatty, fruit/mushroom, soapy h,i
5-Methylfurfural920Caramel, almond, burnt sugar c
Benzaldehyde982Almond, burnt sugar, sweet, caramel c,h,k,i
Octanal1005Fatty, lemon, green, rancid, soap c,d,e,j,f,g,h
2-Nonenal, (E)-1112Cucumber, green, fatty c,d,j,f,g,h
Decanal1204Fatty, soapy, orange peel, sugar c,e,g,h
Vanillin1392Vanilla c,e,f,l
Alcohol2-Furanmethanol885Burnt, sweet, caramel, bread, coffee c,k,l
Carboxylic acidAcetic acid656Sour, acid, sunflower seed, cheesy c,e,k
Octanoic acid1183Sweat, cheese, rancid c,k
FuranFuran, 2-pentyl-992Fruity, green, earthy, orange c,g
Compounds identified by: (a) Mass Spectra Similarity ≥ 90%; (b) Retention Index obtained experimentally not exceeding ± 50 of the NIST library standard. Odor description was obtained from: (c) [27], (d) [45], (e) [46], (f) [47], (g) [48], (h) [49], (i) [50], (j) [51], (k) [52] and (l) [53], respectively.
Disclaimer/Publisher’s Note: The statements, opinions and data contained in all publications are solely those of the individual author(s) and contributor(s) and not of MDPI and/or the editor(s). MDPI and/or the editor(s) disclaim responsibility for any injury to people or property resulting from any ideas, methods, instructions or products referred to in the content.

