Article

Improving the Surface Properties of an API 5L Grade B Pipeline Steel by Applying the Boriding Process. Part I: Kinetics and Layer Characterization

by
Laura Montserrat Alcantar-Martínez
1,
Pablo Alfredo Ruiz-Trabolsi
2,
Raúl Tadeo-Rosas
3,
José Guadalupe Miranda-Hernández
4,
Gerardo Terán-Méndez
5,
Julio César Velázquez
1,* and
Enrique Hernández-Sánchez
2,*
1
Departamento de Ingeniería Química Industrial, ESIQIE, Instituto Politécnico Nacional, UPALM Edif. 7, Zacatenco, Mexico City 07738, Mexico
2
Unidad Profesional Interdisciplinaria de Biotecnología, Instituto Politécnico Nacional, Departamento de Bioingeniería, Avenida Acueducto s/n Barrio La Laguna Ticomán, Mexico City 07340, Mexico
3
Unidad Torreón, Facultad de Ingeniería Mecánica y Eléctrica, Universidad Autónoma de Coahuila, Carretera Torreón-Matamoros, km 7.5, Ciudad Universitaria, Ejido el Águila, Torreón 27276, Mexico
4
Centro Universitario UAEM Valle de México, Laboratorio de Investigación y Desarrollo de Materiales Industriales, Universidad Autónoma del Estado de México, Atizapán de Zaragoza 54500, Mexico
5
Departamento de Metalurgia, IPN-CECYT 2, Av. Casa de La Moneda 133, Lomas de Sotelo, Mexico City 11200, Mexico
*
Authors to whom correspondence should be addressed.
Coatings 2023, 13(2), 298; https://doi.org/10.3390/coatings13020298
Submission received: 24 December 2022 / Revised: 14 January 2023 / Accepted: 17 January 2023 / Published: 28 January 2023

Abstract

:
Although the use and promotion of renewable energies have increased in recent years, it is evident that the use of fossil fuels such as oil and gas continues to be of great importance. Likewise, pipelines are widely recognized as the most reliable and profitable means of transportation for liquid and gaseous hydrocarbons. Nevertheless, due to the nature of hydrocarbons, oil and gas pipelines are continually exposed to deterioration by corrosion and mechanical damage. In this context, this research focuses on the improvement of the surface properties of API 5L grade B pipeline steel by applying a surface hardening process. Samples of an API 5L grade B pipeline steel were exposed to boriding to form a layer of high hardness (from 2.60 GPa for the non-treated material to 14.12 GPa for the samples exposed to 1000 °C for 6 h). The treatment time was set at 2, 4, and 6 h, at temperatures of 850, 900, 950, and 1000 °C. Due to the saw-tooth morphology of the layers and the random nature of the process, it was possible to fit their thicknesses to a probability density function in all the experimental conditions. The crystalline structure of the layers was analyzed by X-ray diffraction and the morphology was observed using SEM and optical microscopy. The layer’s thickness ranged between 26.6 µm to 213.9 µm showing a close relationship with the experimental parameters of time and temperature. Finally, it is studied the changes undergone in the pipeline steel after the thermochemical process, observing an increase in the grain size as a function of the temperature.

1. Introduction

In recent years, the use and promotion of renewable energies have increased due to the global warming crisis [1]. Nevertheless, the use of oil and gas remains important; this came to the fore most notably after the start of the war between Russia and Ukraine [2,3]. For example, in the European Union, there is great uncertainty regarding the reliable supply of gas [4]. This fact alters the economic scenario in the 2020s. Likewise, the oil and gas demand will reach around 100 million barrels per day in the following years, according to the International Energy Agency [5]. For this reason, further study of the equipment involved in oil and gas extraction, transportation, storage, and processing will continue to be necessary. In this context, pipelines are widely recognized as the most reliable and profitable means of transportation for liquid and gaseous hydrocarbons [6,7]. Another piece of evidence that shows the importance of the means of transportation is that there is currently 1.18 million kilometers of oil and gas pipelines (30 times the Earth’s circumference) [8]. One of the main threats to oil and gas pipelines is deterioration by corrosion and mechanical damage. The European Gas pipeline Incident data Group (EGIG) has indicated that the corrosion damage in pipelines has risen from 16.7% to 26.6% of the total failures detected [9]. Other research works have obtained similar conclusions regarding corrosion damage in Russian and Mexican pipelines [10,11].
Corrosion is an electrochemical process that occurs spontaneously, involving a negative change in Gibbs free energy, and it is not possible to stop it using natural methods [12]. There are four methods that are well-recognized to manage corrosion: material selection, coatings, inhibitors, and cathodic protection. Pipelines are usually manufactured from carbon steel following the standard API 5L titled “Specification for Line Pipe” [13]. Following this specification allows the material to have certain ductility and resistance to corrosion, useful for transporting hydrocarbons. However, in some cases, these pipelines transport oil sands from extraction wells to separation units, refineries, or petrochemical plants [14]. In this way, the structural integrity of the pipe results from the combination of a corrosive fluid that can cause erosion–corrosion, in which the mechanical process of metal removal by erosion is present, and the electrochemical corrosion process [14,15,16,17]. Therefore, increasing the mechanical resistance on the surface could diminish this type of damage.
As mentioned previously, coatings and protective layers could reduce the damage caused by corrosion. Steel pipelines can be corroded externally or internally [18,19,20], even if the transmitted fluid contains inhibitors [21]. One method used to improve the mechanical characteristics of the metallic surface is the boriding process [22,23,24]. Boriding is a thermochemical treatment commonly used to obtain hard layers. The relatively small size of the boron atom plays a key role in the capacity of boron to diffuse into alloys such as low-carbon steel because of its very high mobility at high temperatures [25]. In carbon steel, the boriding process is typically carried out at temperatures between 800 and 1050 °C, in 1 to 12 h of treatment [25]. After the boriding process occurs over carbon steel, the produced layer usually has a sawtooth-like shape and could contain one iron boride phase (Fe2B) or have a dual phase (FeB + Fe2B) [26]. The contour diagrams described in reference [25] detail the behavior of the iron of boride layers as a function of the experimental conditions. Likewise, J.C. Velázquez and colleagues [27] described the random behavior of the layer thickness as a function of the time of treatment. On the other hand, boriding in carbon steel must take into consideration the amount of matter involved, so as to optimize the process [28].
The main goal of the present research is to study, for the first time, the API 5L grade B pipeline steel under the boriding process to enhance the surface mechanical resistance to erosion without considerably altering the material’s ductility. This issue could lead to an increase in the pipeline’s service lifetime. The recommendation should be to apply the boriding process in pipe sections or fittings that undergo erosion–corrosion damage, such as elbows, tees, reductions, etc. In this research work, the API 5L grade B pipeline steel was selected because it is used frequently in the oil and gas industry and because it has comparable characteristics to ASTM A106 grade B steel, which is typically used in oil refineries [29,30]. This means that the results obtained in this study can potentially be extended to ASTM A106 grade B steel. Typically, API 5L series or equivalent materials are steels that contain Cu and Cr to enhance the corrosion resistance; P and S as impurities; and Si and Mn that tend to increase the hardness, yield strength, and ultimate tensile strength [13]. Therefore, studying the kinetics and growth of the boride layers in steels under the interaction of these alloy elements is a novelty that could lead to an interesting industrial application.
This research work is divided into two parts. The first part, presented here, describes and analyzes only the following aspects:
  • Boriding treatment. We describe the characteristics of the materials used as substrates and the conditions under which the boriding process was carried out;
  • Kinetics. We analyze the Arrhenius-type behavior of the boriding process;
  • Layer thickness. We describe the methodology of layer thickness measurement after the boriding treatment, and this characteristic is studied from the perspective of a random process;
  • X-ray and SEM analysis. We analyze the crystalline structures found after the boriding process for different treatment conditions and the morphology of the generated boride layers; and
  • Grain size analysis. We characterize the pipeline steel microstructure and the changes in the grain size provoked by the boriding treatment conditions.

2. Materials and Methods

2.1. Boriding Treatment

All specimens were manufactured from a new API 5L grade B pipeline steel (Tubos de acero de México S.A, Veracruz, México). The chemical composition of this steel was obtained by Spark Atomic Emission Spectroscopy (SAES), using a spark spectrometer (SPECTRO Analytical Instruments GmbH, Kleve, Germany) and the values are shown in Table 1.
Twelve rectangular-prism specimens (10 × 10 × 4 mm3) were manufactured to subject them to the boriding process under different conditions after the appropriate surface finishing. A thirteenth specimen was also manufactured only as a material reference.
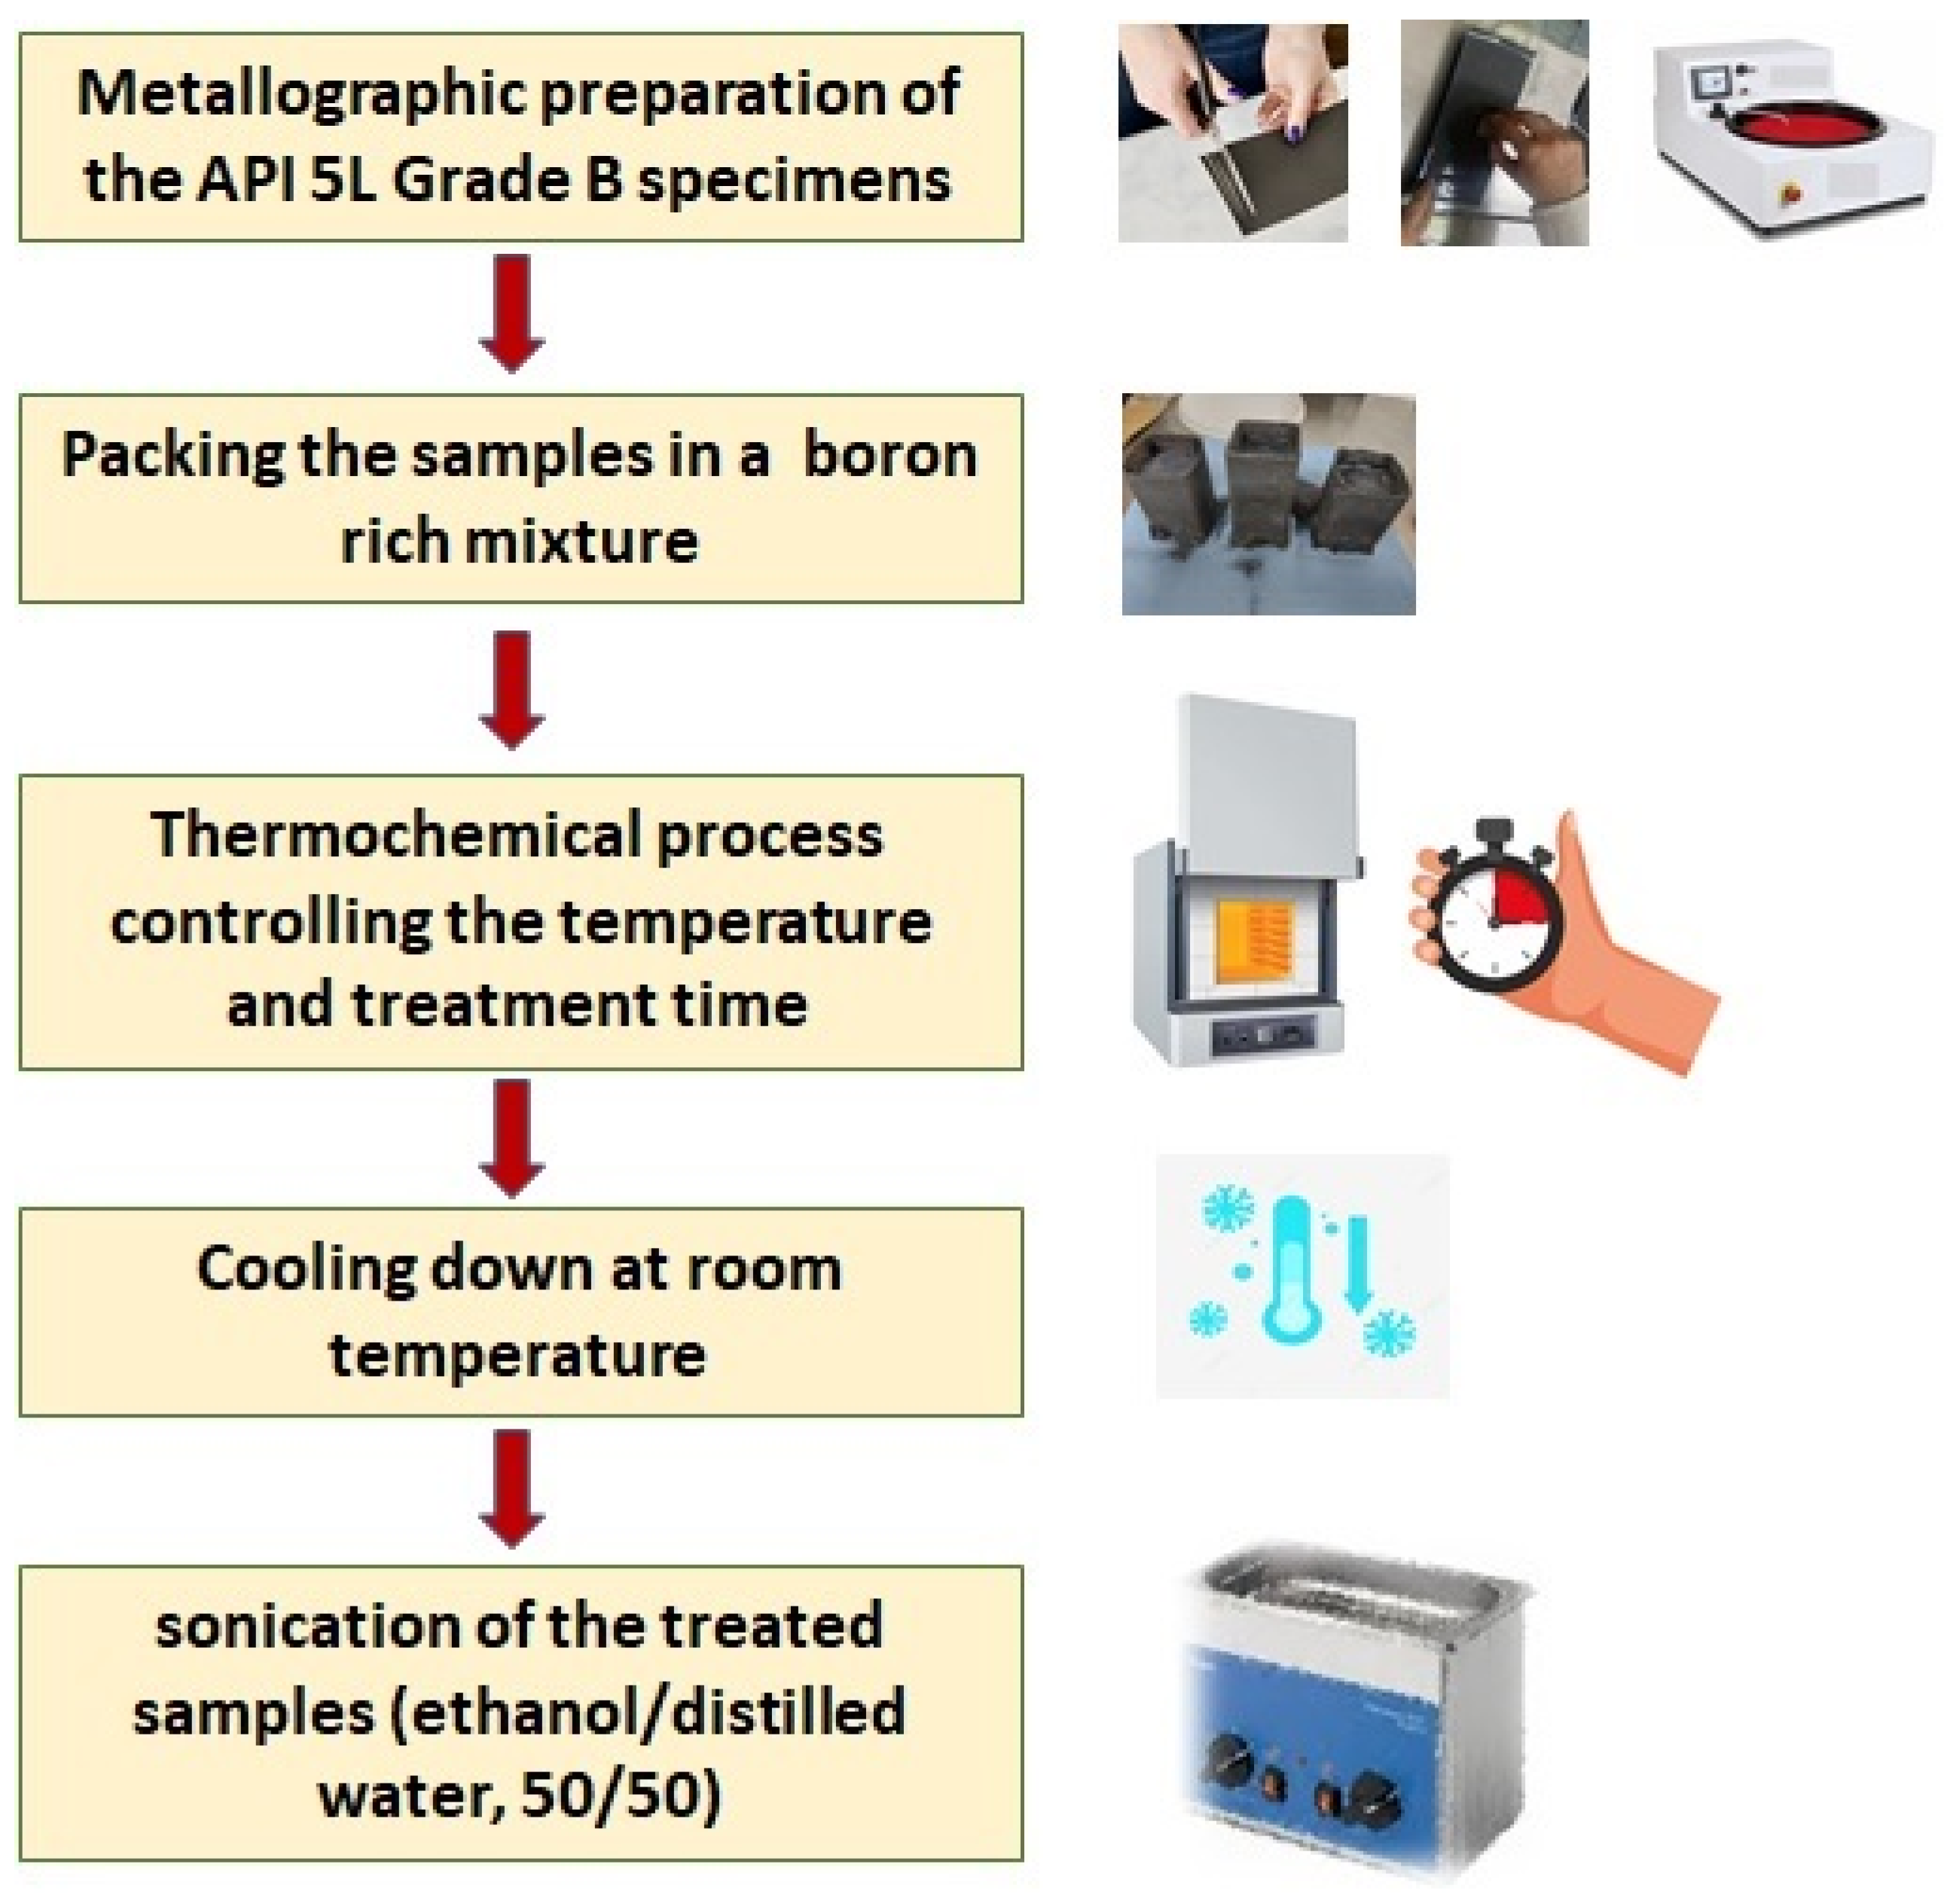
For the appropriate surface finishing, the samples were sequentially polished with 80–1000 SiC paper (EXTEC CORPORATION, Enfield, CT, USA). After this metallographic finishing, the samples were cleaned in an ultrasonic bath for 5 min in a mixture of ethanol and distilled water (50/50). After cleaning, the samples were introduced into a stainless-steel crucible with the boriding agent containing 5% wt. of B4C as boron donor, 5% wt. of KBF4 as activator, and 90% wt. of SiC as diluent, with a powder size of 50 μm, Hef-Durferrit (DURFERRIT, GmbH, Mannheim, Germany).
The boriding process was carried out at four different temperatures (850, 900, 950, and 1000 °C) for 2, 4, and 6 h each, under atmospheric air conditions. After boriding, samples were allowed to cool outside the furnace at room temperature and were cleaned again in an ultrasonic bath with ethanol/deionized water (50/50). To facilitate the handling and identification, the thirteen rectangular-prism specimens were numbered in sequential order, as indicated in Table 2.
For the sake of outlining, Figure 1 portrays a flowchart that explains the surface finishing process and the boriding treatment.

2.2. Kinetics of Growth

The kinetics of boride layer growth is controlled by boron diffusion, so that the growth of layers is a consequence of boron diffusion perpendicular to the surfaces of the treated material [31,32]. Likewise, by considering a given distance from the surface (x), for any treatment time (t), the relation between the boron concentration and the diffusion coefficient tends to be constant, and the growth of the boride layers can be described as follows:
x 2 = K t
thus, it can be said that the growth of the boride layers obeys a parabolic law.
Here, ( x ) is the thickness of the boride layers (m), ( K ) is a constant of parabolic growth (m2/s) and is related to the coefficient of diffusion of the boride layers, and ( t ) is the treatment time (s). The parabolic law is especially followed in the case of low-carbon steels such as AISI 1018 [33]. However, it can be observed that the boride layers formed on alloyed and stainless steel also obey a parabolic law [34,35,36].
The constant of parabolic growth ( K ) can be estimated from the slopes of the square of the thickness ( x 2 ) versus the treatment time graphs. Likewise, ( K ) has Arrhenius-type behavior, as follows:
K = K 0 exp Q / R T
where ( K 0 ) is a pre-exponential constant that reflects the frequency with which boron atoms collide with the substrate, ( Q ) is the activation energy (kJ∙mol−1) required for the reaction to occur, ( T ) is the absolute temperature (K), and ( R ) is the universal constant of ideal gases (8.3144 J∙mol−1∙K−1).
The value of the activation energy can be estimated by plotting Equation (2) in logarithmic form as follows:
ln K = ln K 0 exp Q R 1 T
On the other hand, by substituting the value of the parabolic constant ( K ) (Equation (2)) in Equation (1), it is possible to obtain a practical equation that allows the estimation of the thickness of the layer ( X ) as a function of the treatment conditions (time and temperature):
x 2 = K 0 exp Q R T t
X = K 0 exp Q R T t

2.3. Layer’s Thickness

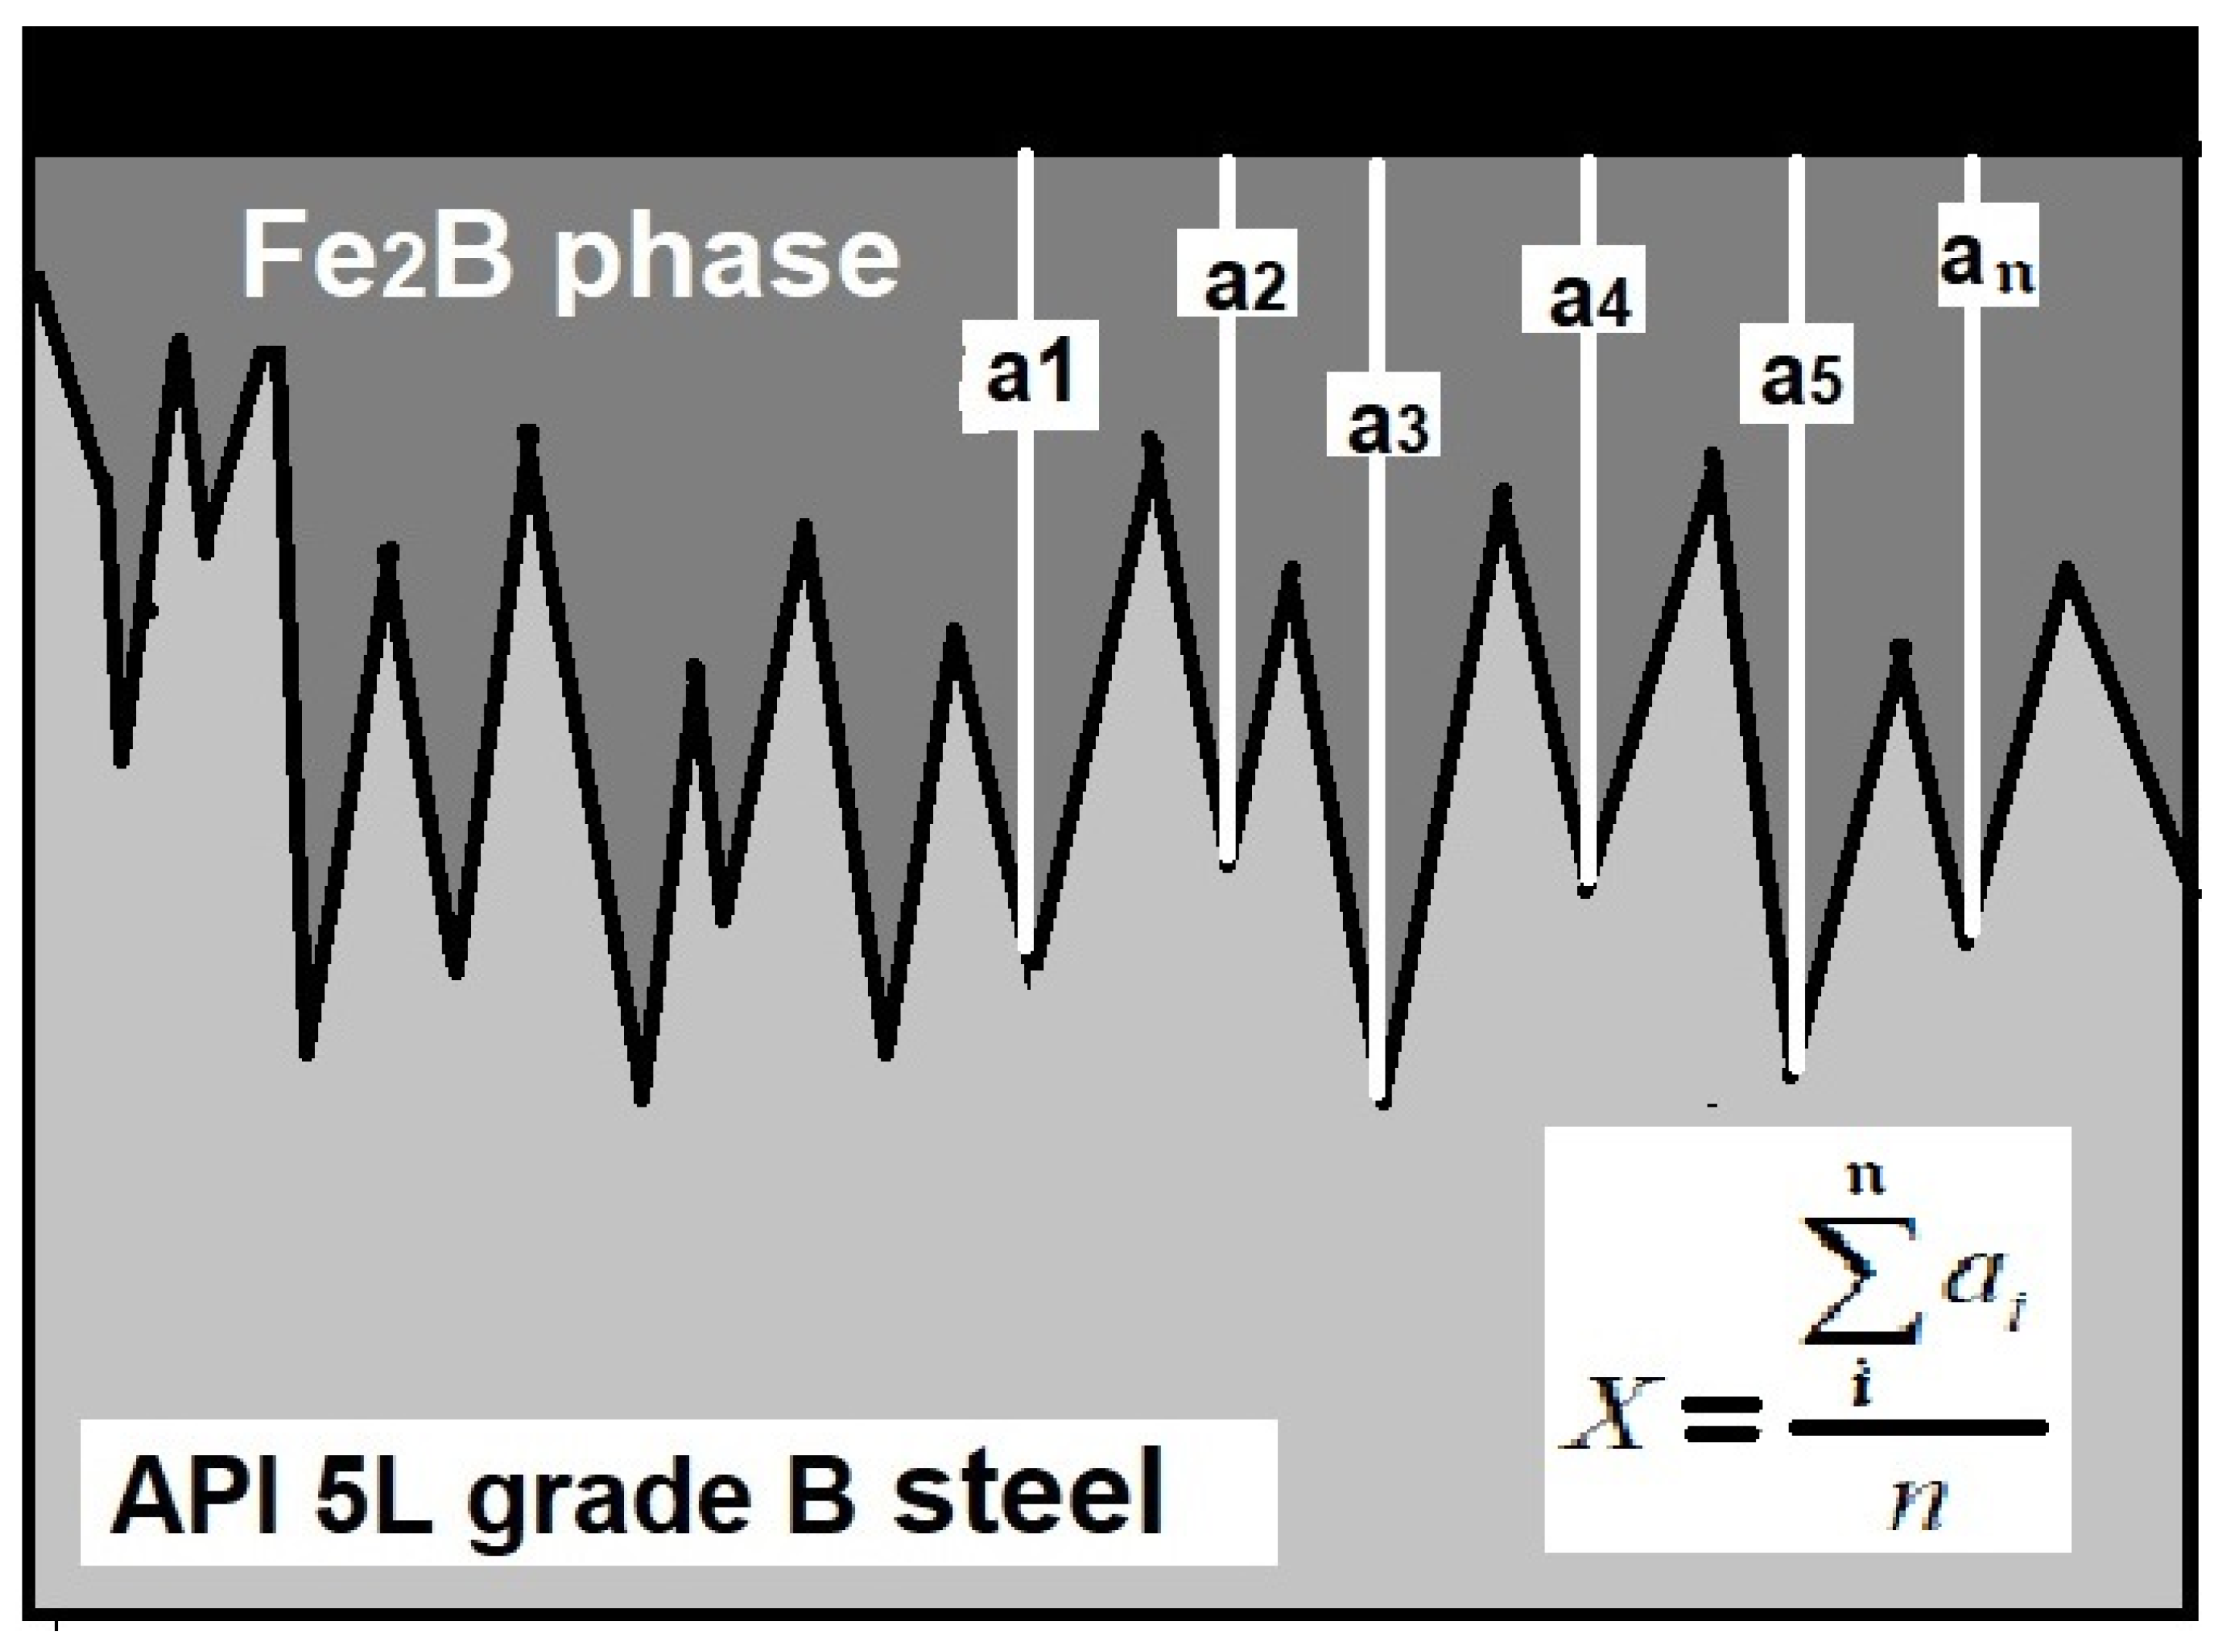
Standard metallographic techniques were used to prepare the samples for microscopic examination. The boride layers’ thicknesses were measured from the rectangular-prism specimens by optical examination using a GX-51 optical microscope (Olympus, Center Valley, PA, USA). At least 50 measurements were performed to establish a mean value of the layer thickness. Figure 2 illustrates the methodology used to establish the mean value of the layer thickness.

2.4. Physical and Structural Characterization by X-ray Diffraction and SEM

The presence of the boride layers was observed by means of optical microscopy (OM) with the aid of an Olympus GX- 51 optical microscope (Olympus, Center Valley, PA, USA) and scanning electron microscopy (SEM) (JOEL, JSM-6360LV, JEOL, Ltd., Akishima, Japan). Before the OM and SEM examination, one sample of each treatment condition was cross-sectioned and prepared via a conventional metallographic procedure.
The nature and the crystallographic structure of the layers were corroborated by X-ray diffraction (XRD) with the aid of a D8 FOCUS diffractometer, using Cu–Kα radiation at a wavelength of 1.5418 Å (Bruker, Billerica, MA, USA).

2.5. Mechanical Characterization

The hardness and the elastic modulus of the boride layer obtained at the surface of the API 5L grade B steel were evaluated by the instrumented indentation technique with the aid of a nanohardness tester (TTX-NHT, CSM Instruments, Needham Heights, MA, USA), using a Berkovich indenter and following the methodology established by Oliver and Pharr [37]. A set of ten indentations was realized on the surface of the borided sample. The distance between indentation prints was established by following the limits of the ISO instrumented indentation standards [38] to avoid the interaction between the stress fields of the indentations [39]. The indentation load was established at 350 mN, based on the contact depth of the indentations and the measured layer’s thickness.

2.6. Grain Size Estimation

Another characteristic that typically is used when a pipeline steel is studied is the grain size. In this work, the grain size was determined following the process indicated in the Standard ASTM E112-13 titled “Standard Test Methods for Determining Average Grain Size” [40]. All the samples, including the non-treated sample, were analyzed to determine the effect of the temperature and boriding treatment on the grain size of the API 5L grade B steel.

3. Results and Discussion

3.1. Boriding Treatment

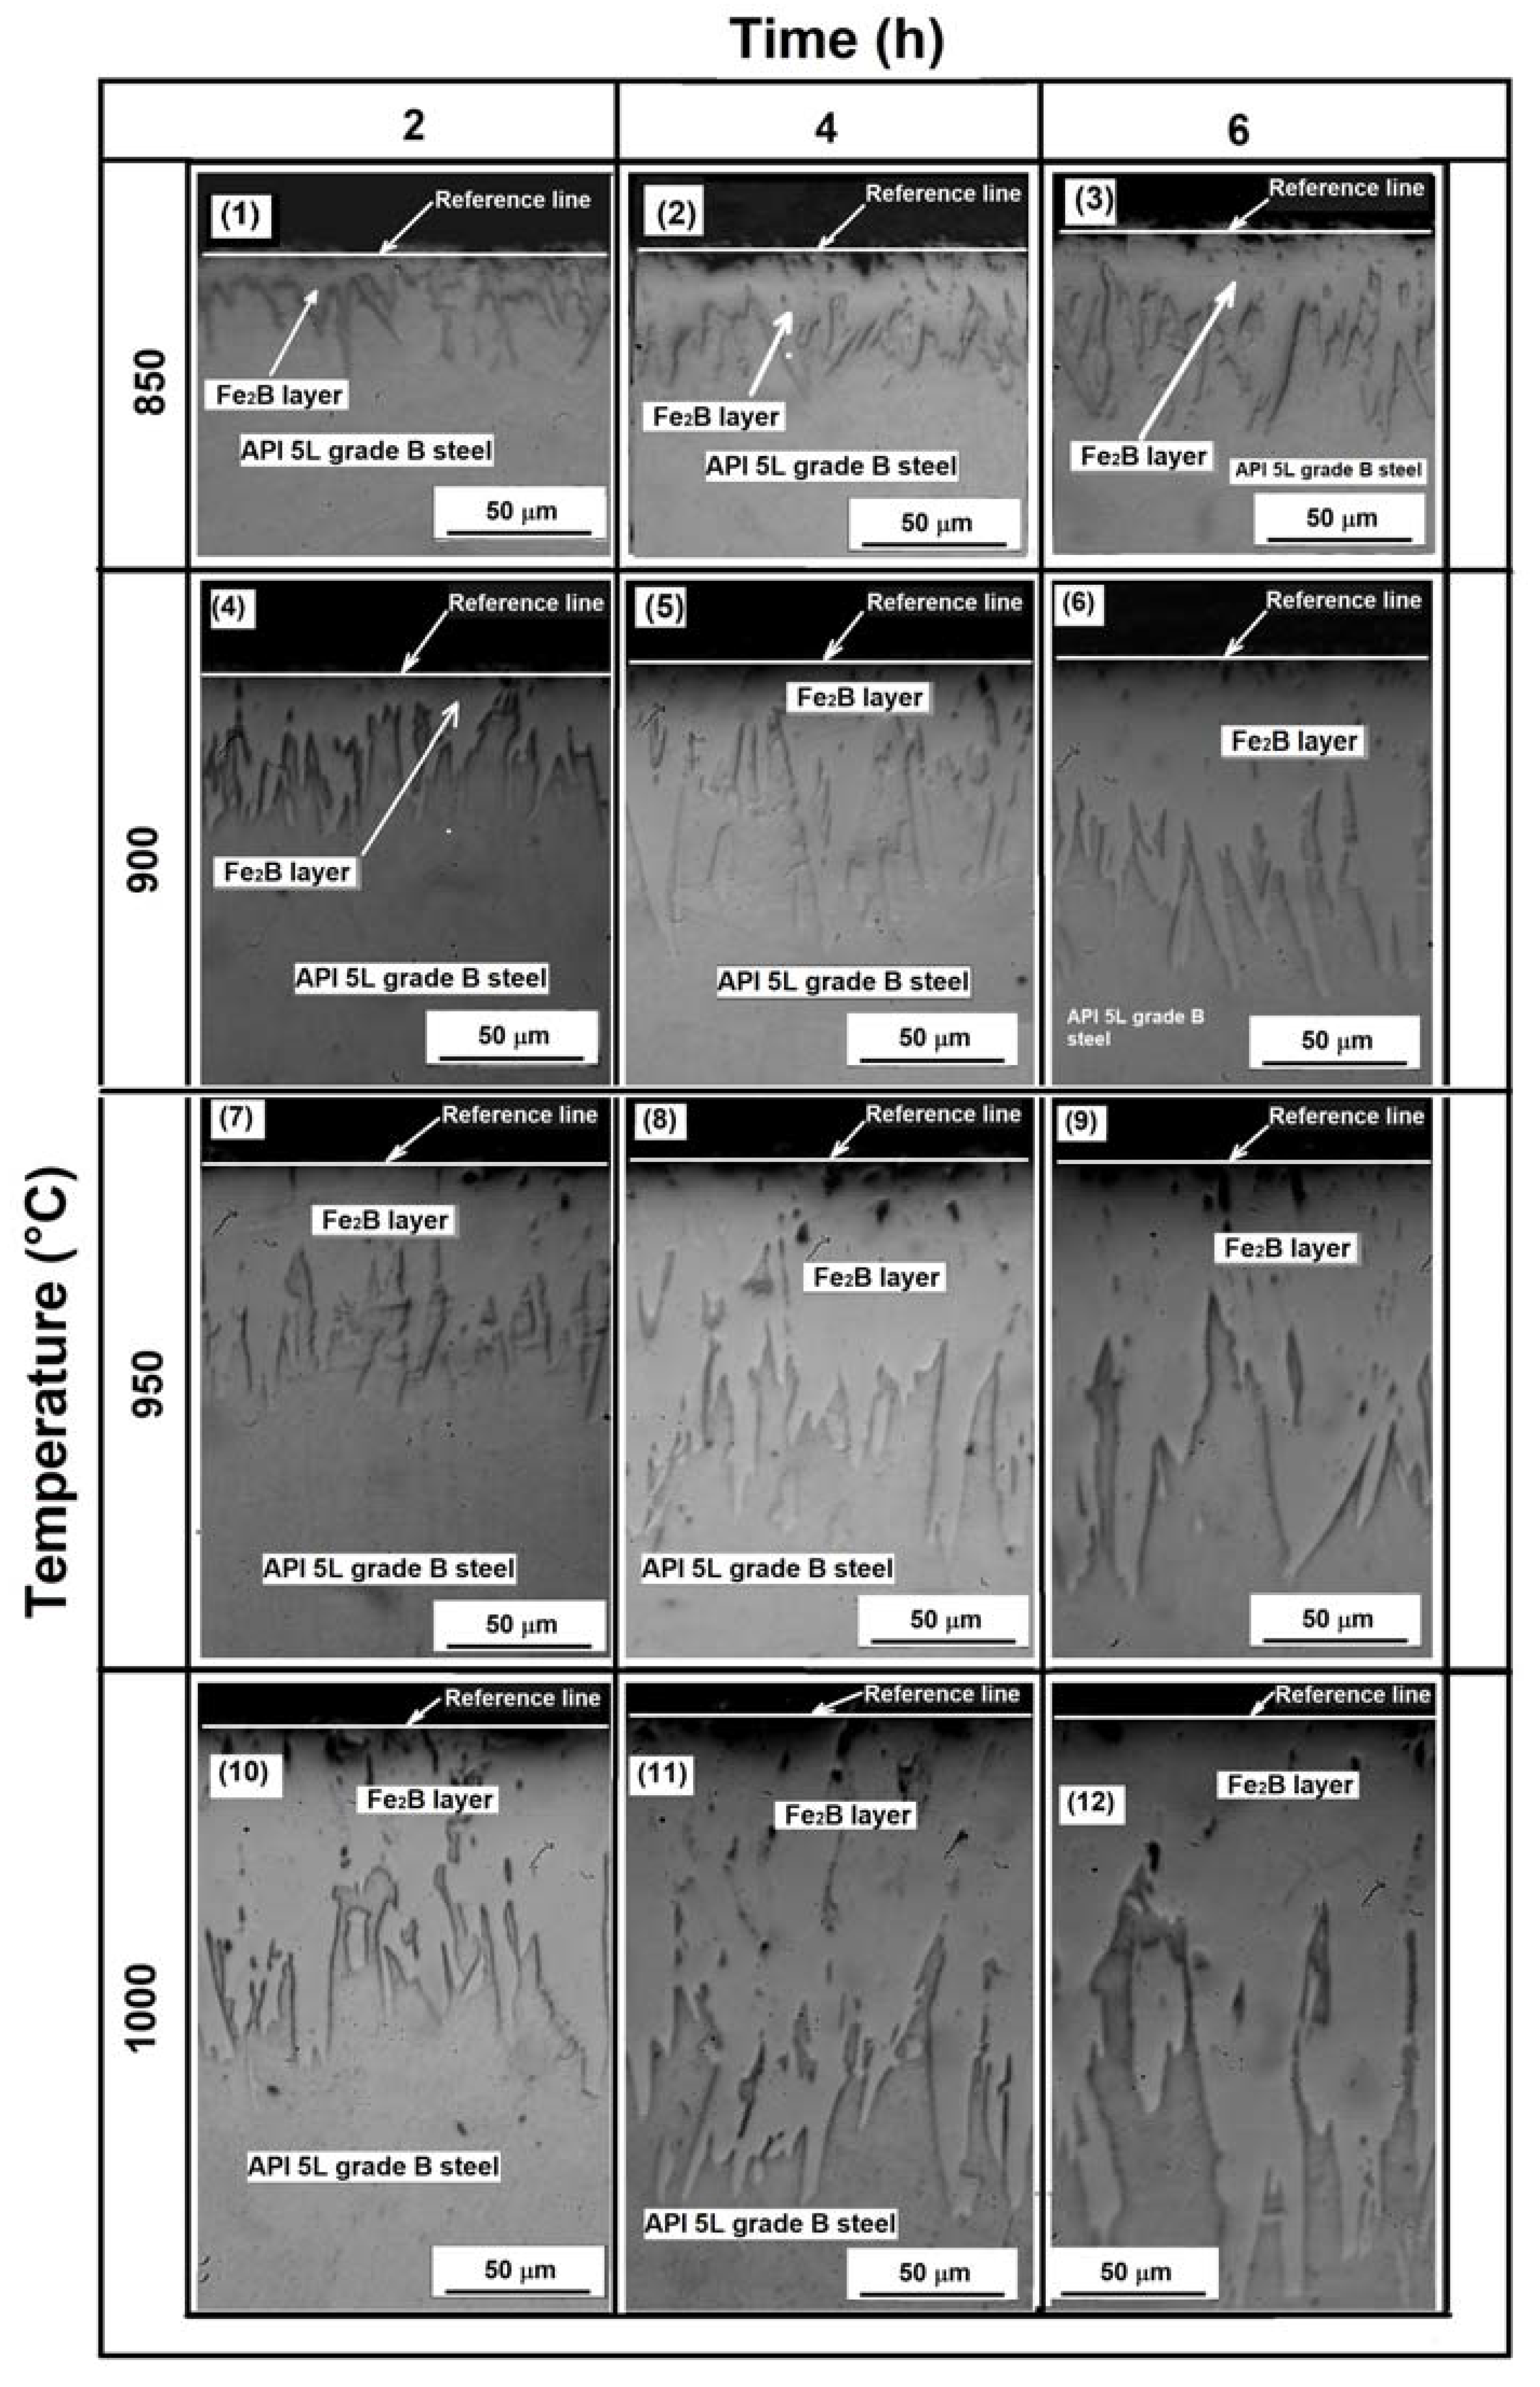
Both optical and SEM examinations of the cross-sections of borided samples revealed the presence of well-formed layers, assumed to be a layer containing only the Fe2B phase with a saw-toothed morphology (Figure 3). This is the typical morphology formed on low-carbon steels when they are exposed to the boriding process [24,25].
Different researchers have reported that the characteristic saw-tooth boride layer morphology is seen in low-alloy steels, unalloyed low-carbon steels, and pure iron [27,41,42]. The layers’ thickness ranged from approximately 30 to 218 µm for the samples exposed to 850 °C for 2 h and the samples exposed to 1000 °C and 6 h, respectively. The average thickness, standard deviation, and coefficient of variation of layer thickness values are summarized in Table 3, Table 4 and Table 5.
Comparing the resulting layers’ thicknesses with those reported in the literature [27,28], one can notice that they are within the same range, indicating that the process was applied appropriately.

3.2. Kinetics of Growth

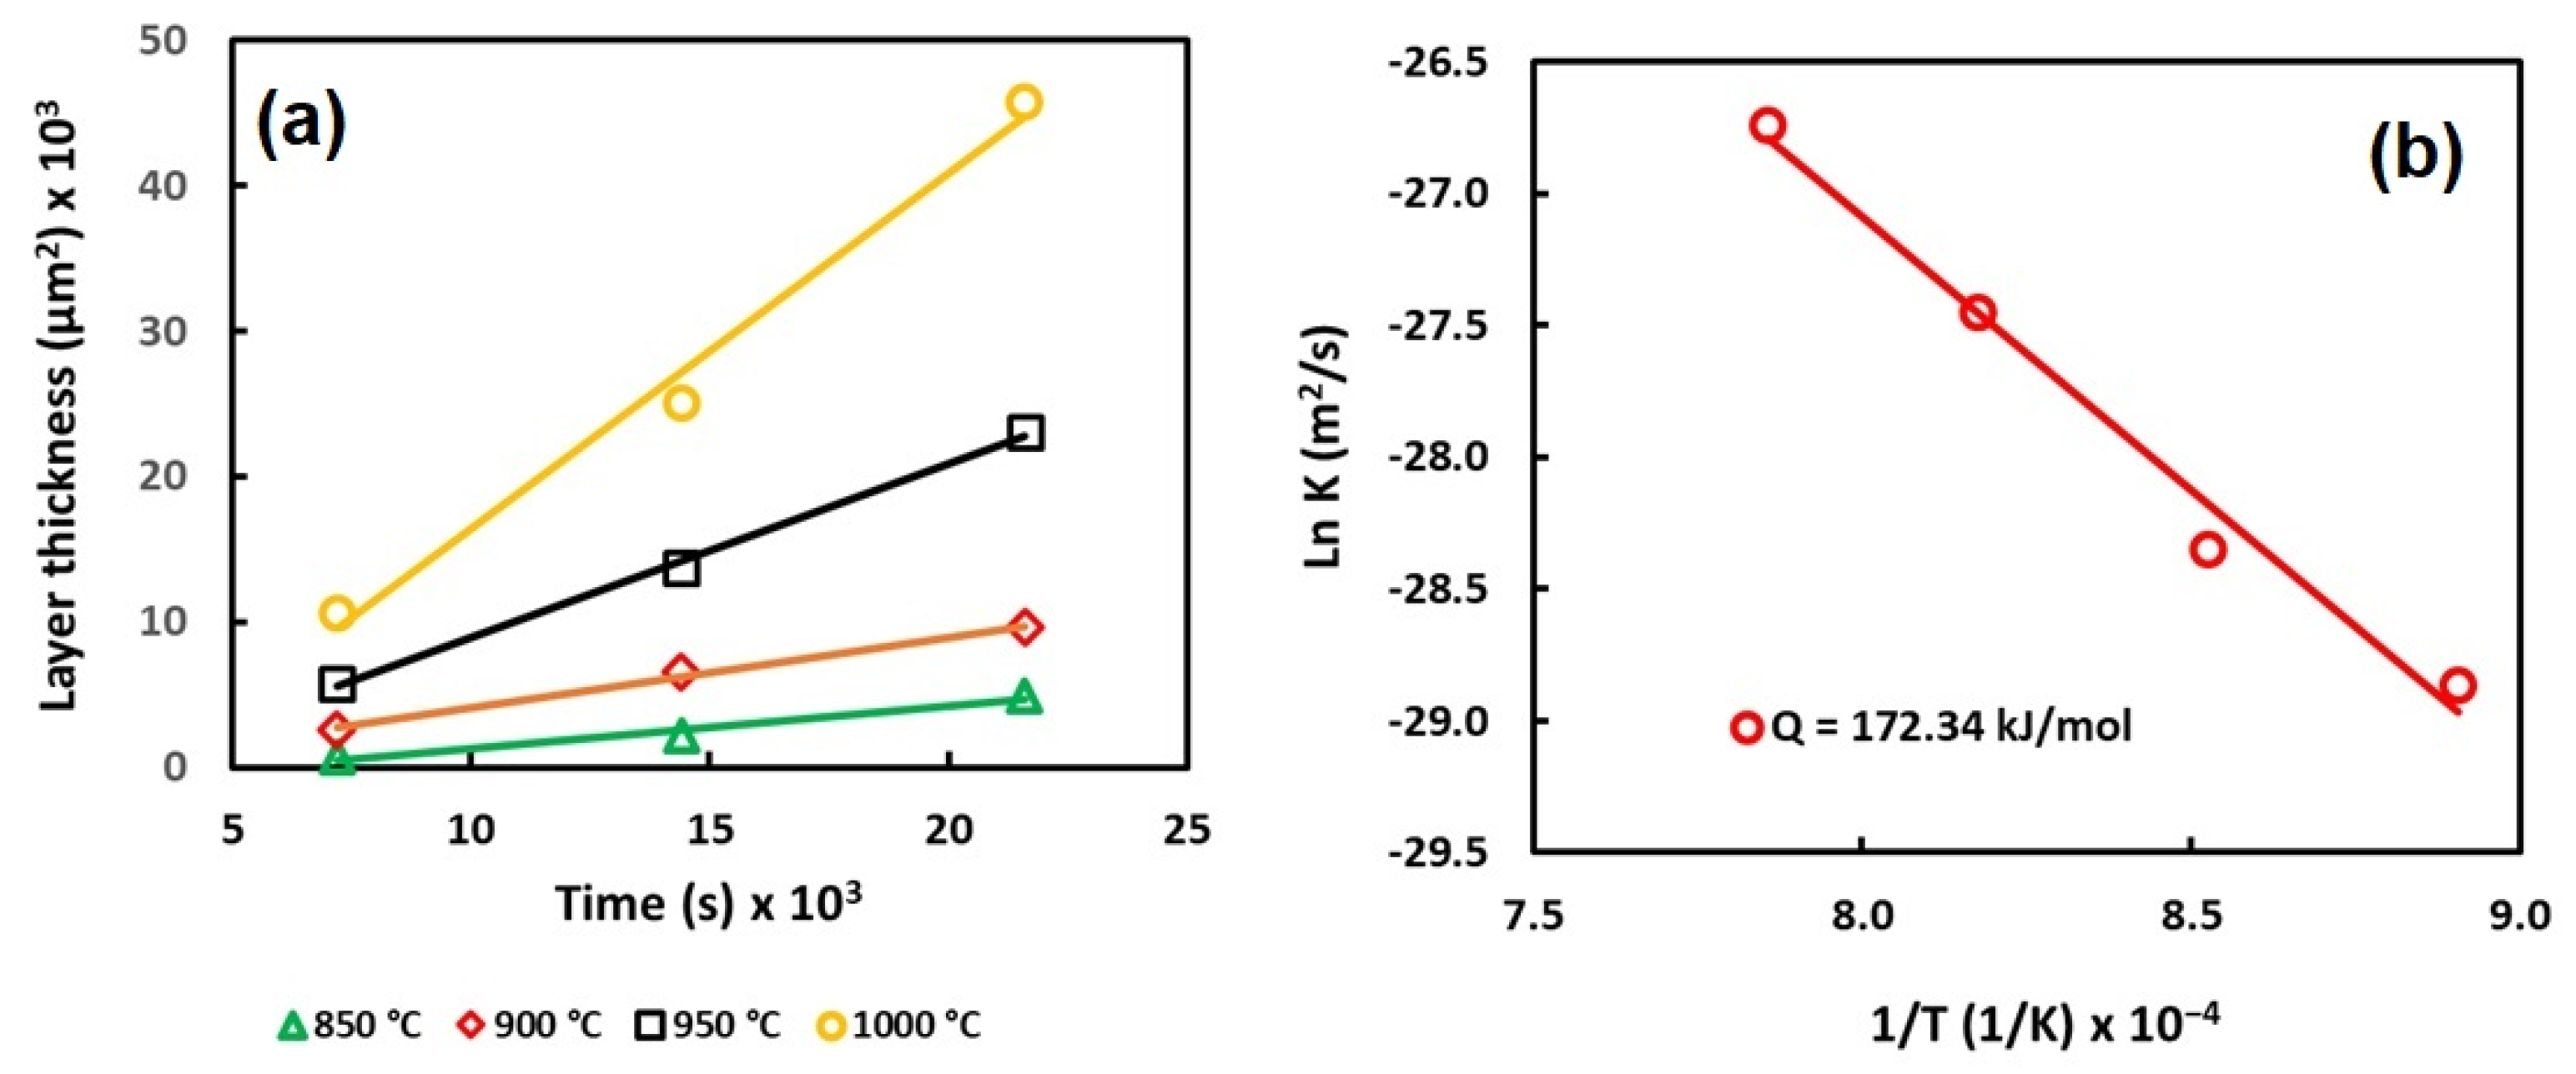
Figure 4 shows the evolution of the boride layers and the activation energy as a function of the treatment parameters.
According to the results, it is possible to observe that the thickness of the layer increases as a function of the experimental parameters. However, the most relevant parameter seems to be the temperature, because the constant of parabolic growth increases as the temperature increases.
The values of the constant of parabolic growth ( K ) were estimated using the slope of the curves (Figure 4).
The pre-exponential constant ( K 0 ) was estimated through the intersection of the ordinated axis, and it was evaluated as 2.7235 × 10⁻⁵ m2s−1. The values of ( Q ) an ( K 0 ) determined from the experimental results can be used to propose a particular solution to the diffusion process applied to the API 5L grade B steel. Thus, Equation (5) can be rewritten as
x = 2.7235   ×   10 - 5   exp 1.234   ×   10 5 8 . 3144 T t
The values of ( K ) and ( K 0 ) are summarized in Table 6.
Table 7 shows a comparison of the layer thicknesses obtained with the model presented in Equation (6) and the experimental results.
According to the data presented in Table 6, the values of the constant of parabolic growth, obtained by the mean values of the layer thickness, show a good correlation. However, when the data of ( K 0 ) and ( Q ) were substituted into Equation (6), the resulting values did not match well with the results of the experimental procedure. Additionally, the % error was estimated, indicating unsatisfactory results between the experimental and the calculated data. In this sense, the layer thicknesses were re-calculated using the MODE values instead of mean values.
The estimated layer thicknesses obtained using the MODE values instead of the mean values are depicted in Table 8.
The values of the constant of parabolic growth ( K ) the activation energy ( Q ) and the pre-exponential constant ( K 0 ) based on the MODE values were re-calculated following the same procedure as that described for the mean values and are depicted in Table 9.
The re-calculated data depicted in Table 9 were substituted into Equation (5) to obtain a new model describing the behavior of the layer’s thickness as a function of the MODE values of the experimental measurements. Thus, Equation (5) can be re-written as follows:
x = 6 . 1295   ×   10 - 5   exp 1.8171   ×   10 5 8 . 3144 T t
The estimated values of the layer’s thickness as a function of the MODE data (Equation (7)) are summarized in Table 10, where it is possible to corroborate the best fit when the MODE data were applied instead of the mean values.
The values described in Table 10 show a better fit between the values measured from the experimental conditions and the calculated ones than those obtained using the mean values of the experimental measurements. This indicates that in the case of the API 5L grade B steel exposed to the boriding treatment, the best data for the application of the Arrhenius equation are those represented by the MODE because the layer’s growth is highly saw-toothed in comparison to that obtained in the low-carbon steels.
The activation energy necessary for the boron’s mobility on the API 5L grade B steel was estimated at 181.711 kJ/mol. The value of activation energy was compared to the value reported in the literature for low-carbon steel and for alloyed steels. For example, Pablo A. Ruiz-Trabolsi et al. reported an activation energy of 148.3 kJ mol−1, for an AISI 1018 steel exposed to boriding in solid media, with a saw-toothed morphology [28]. Sen S. et al. reported an activation energy of 218.4 kJ mol−1 for an AISI 4140 steel exposed to boriding in molten salt with a saw-toothed morphology [43]. Likewise, Genel K. et al. reported values of activation energy of 171.2 kJ mol−1 for AISI W1 exposed to boriding in solid media with a flat morphology [44]. The results indicate that the activation energy necessary for the boron’s mobility in the API 5L grade B pipeline steel more closely reflects that of an alloyed steel than a low-carbon steel. This is probably because of its high content of alloy elements, such as Cr, Mn, Mo, and Ti, which act as diffusion barriers [24].
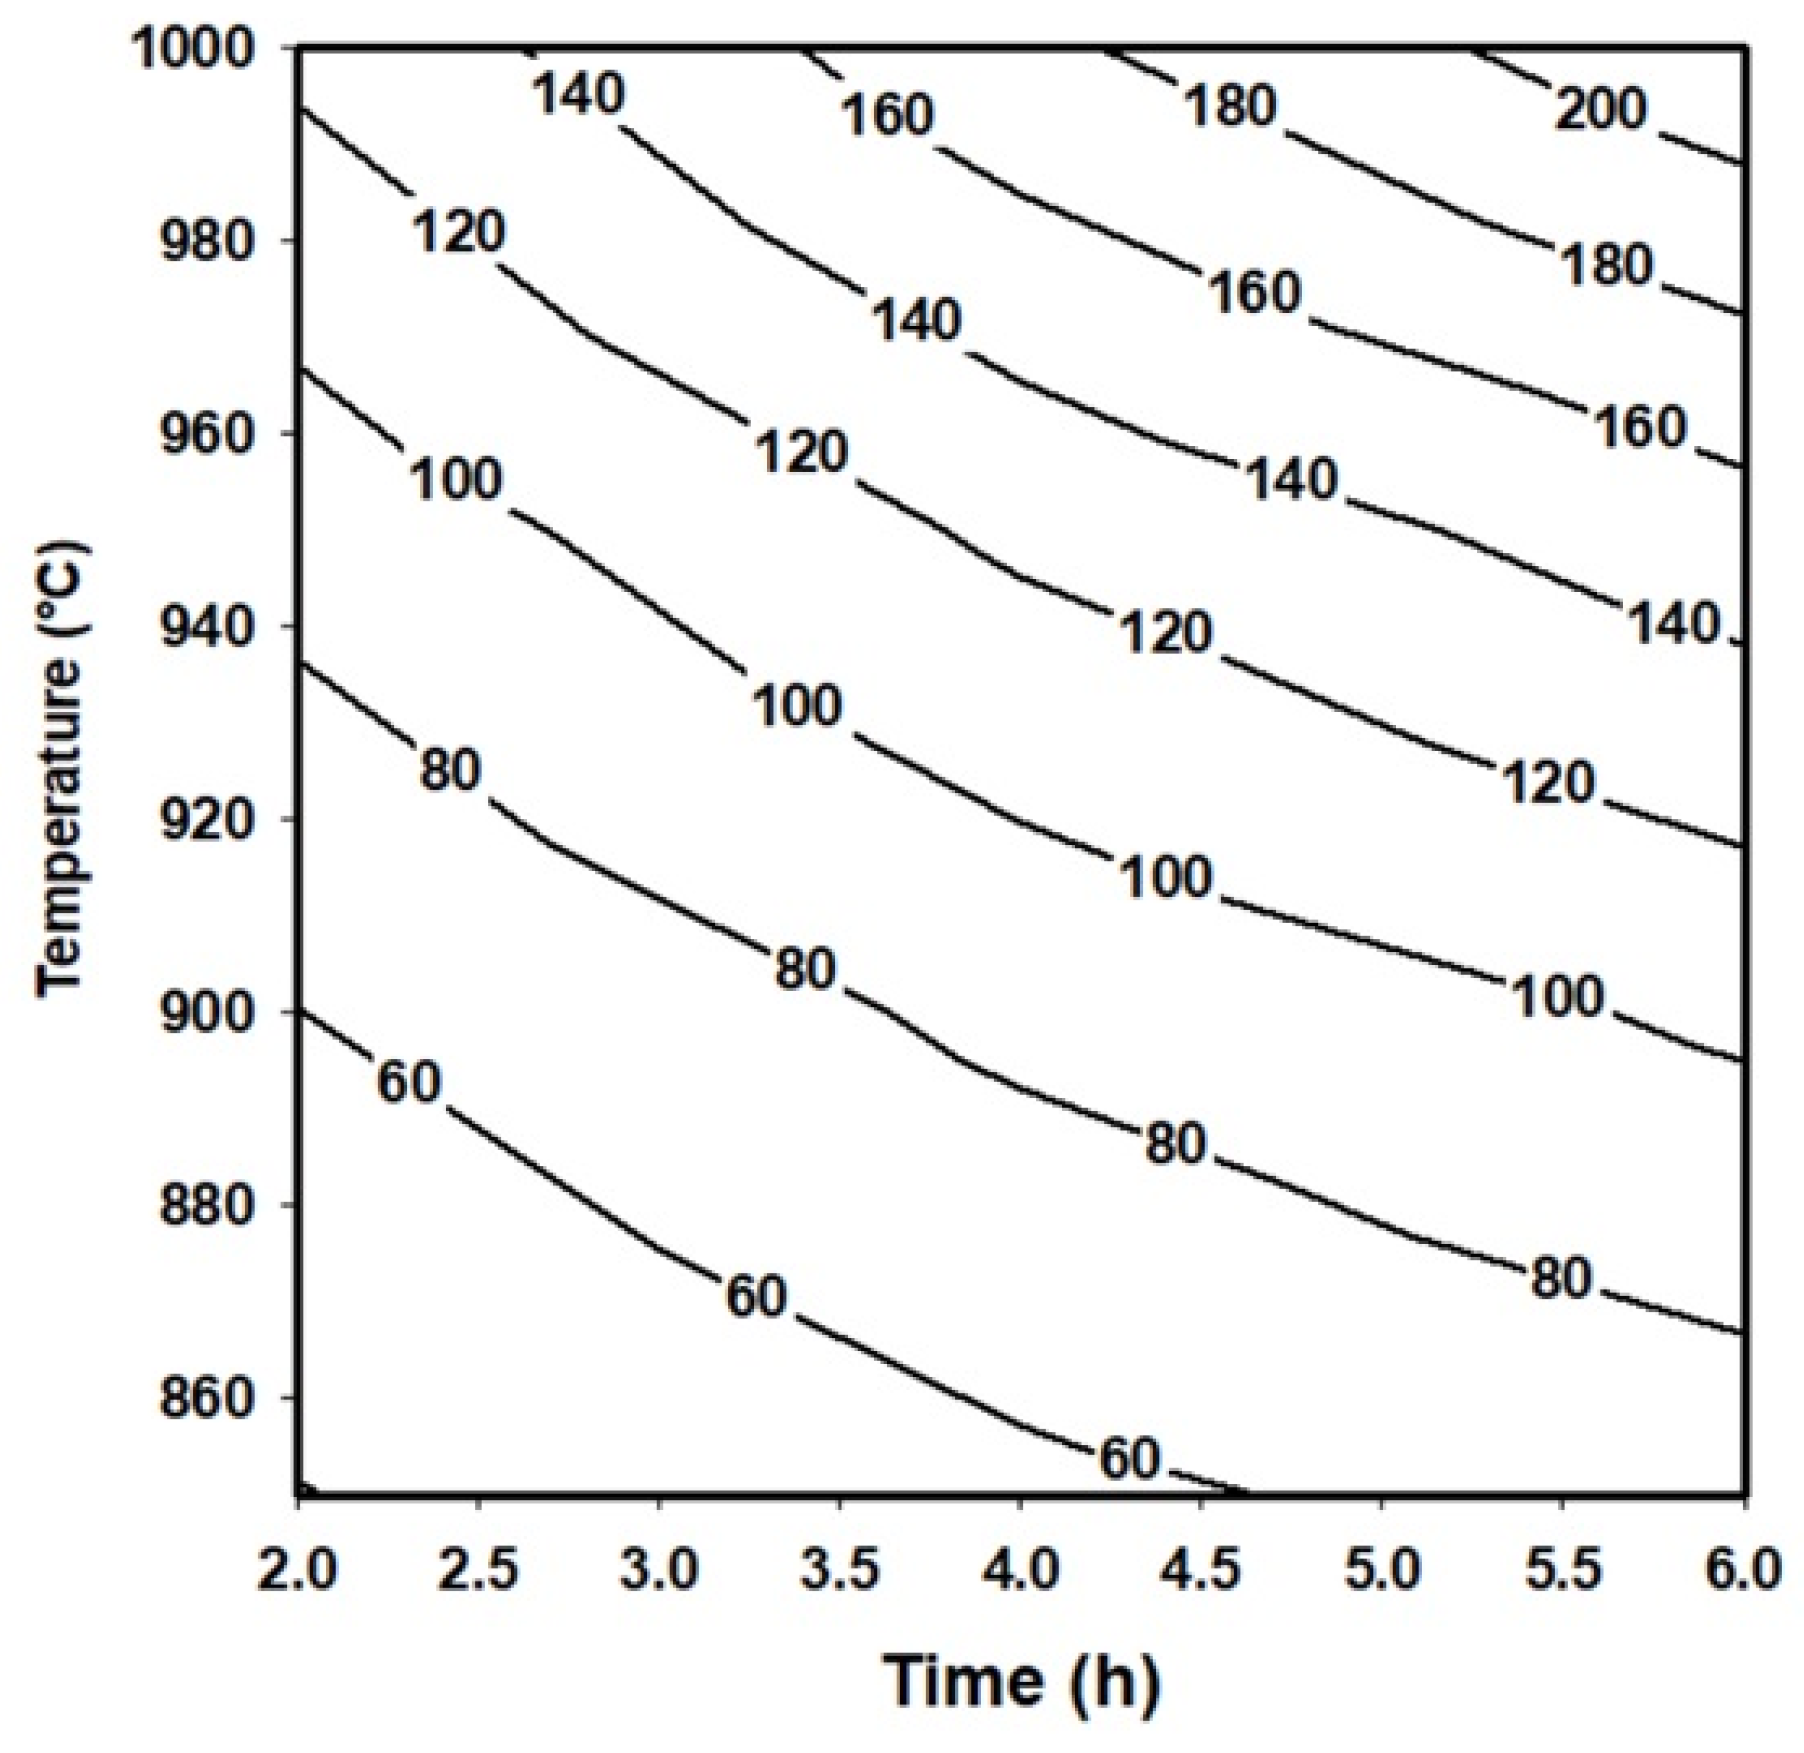
On the other hand, the layer’s thickness values obtained by Equation (9) can be used to generate a contour map that describes the behavior of the boride layers as a function of the treatment conditions. Contour maps are especially useful in industrial applications where a specific thickness of the layer can be required.
Figure 5 shows a contour map describing the behavior of the boride layers obtained on the surface of an API 5L grade B steel exposed to the boriding process.

3.3. Layer Thickness Measurements

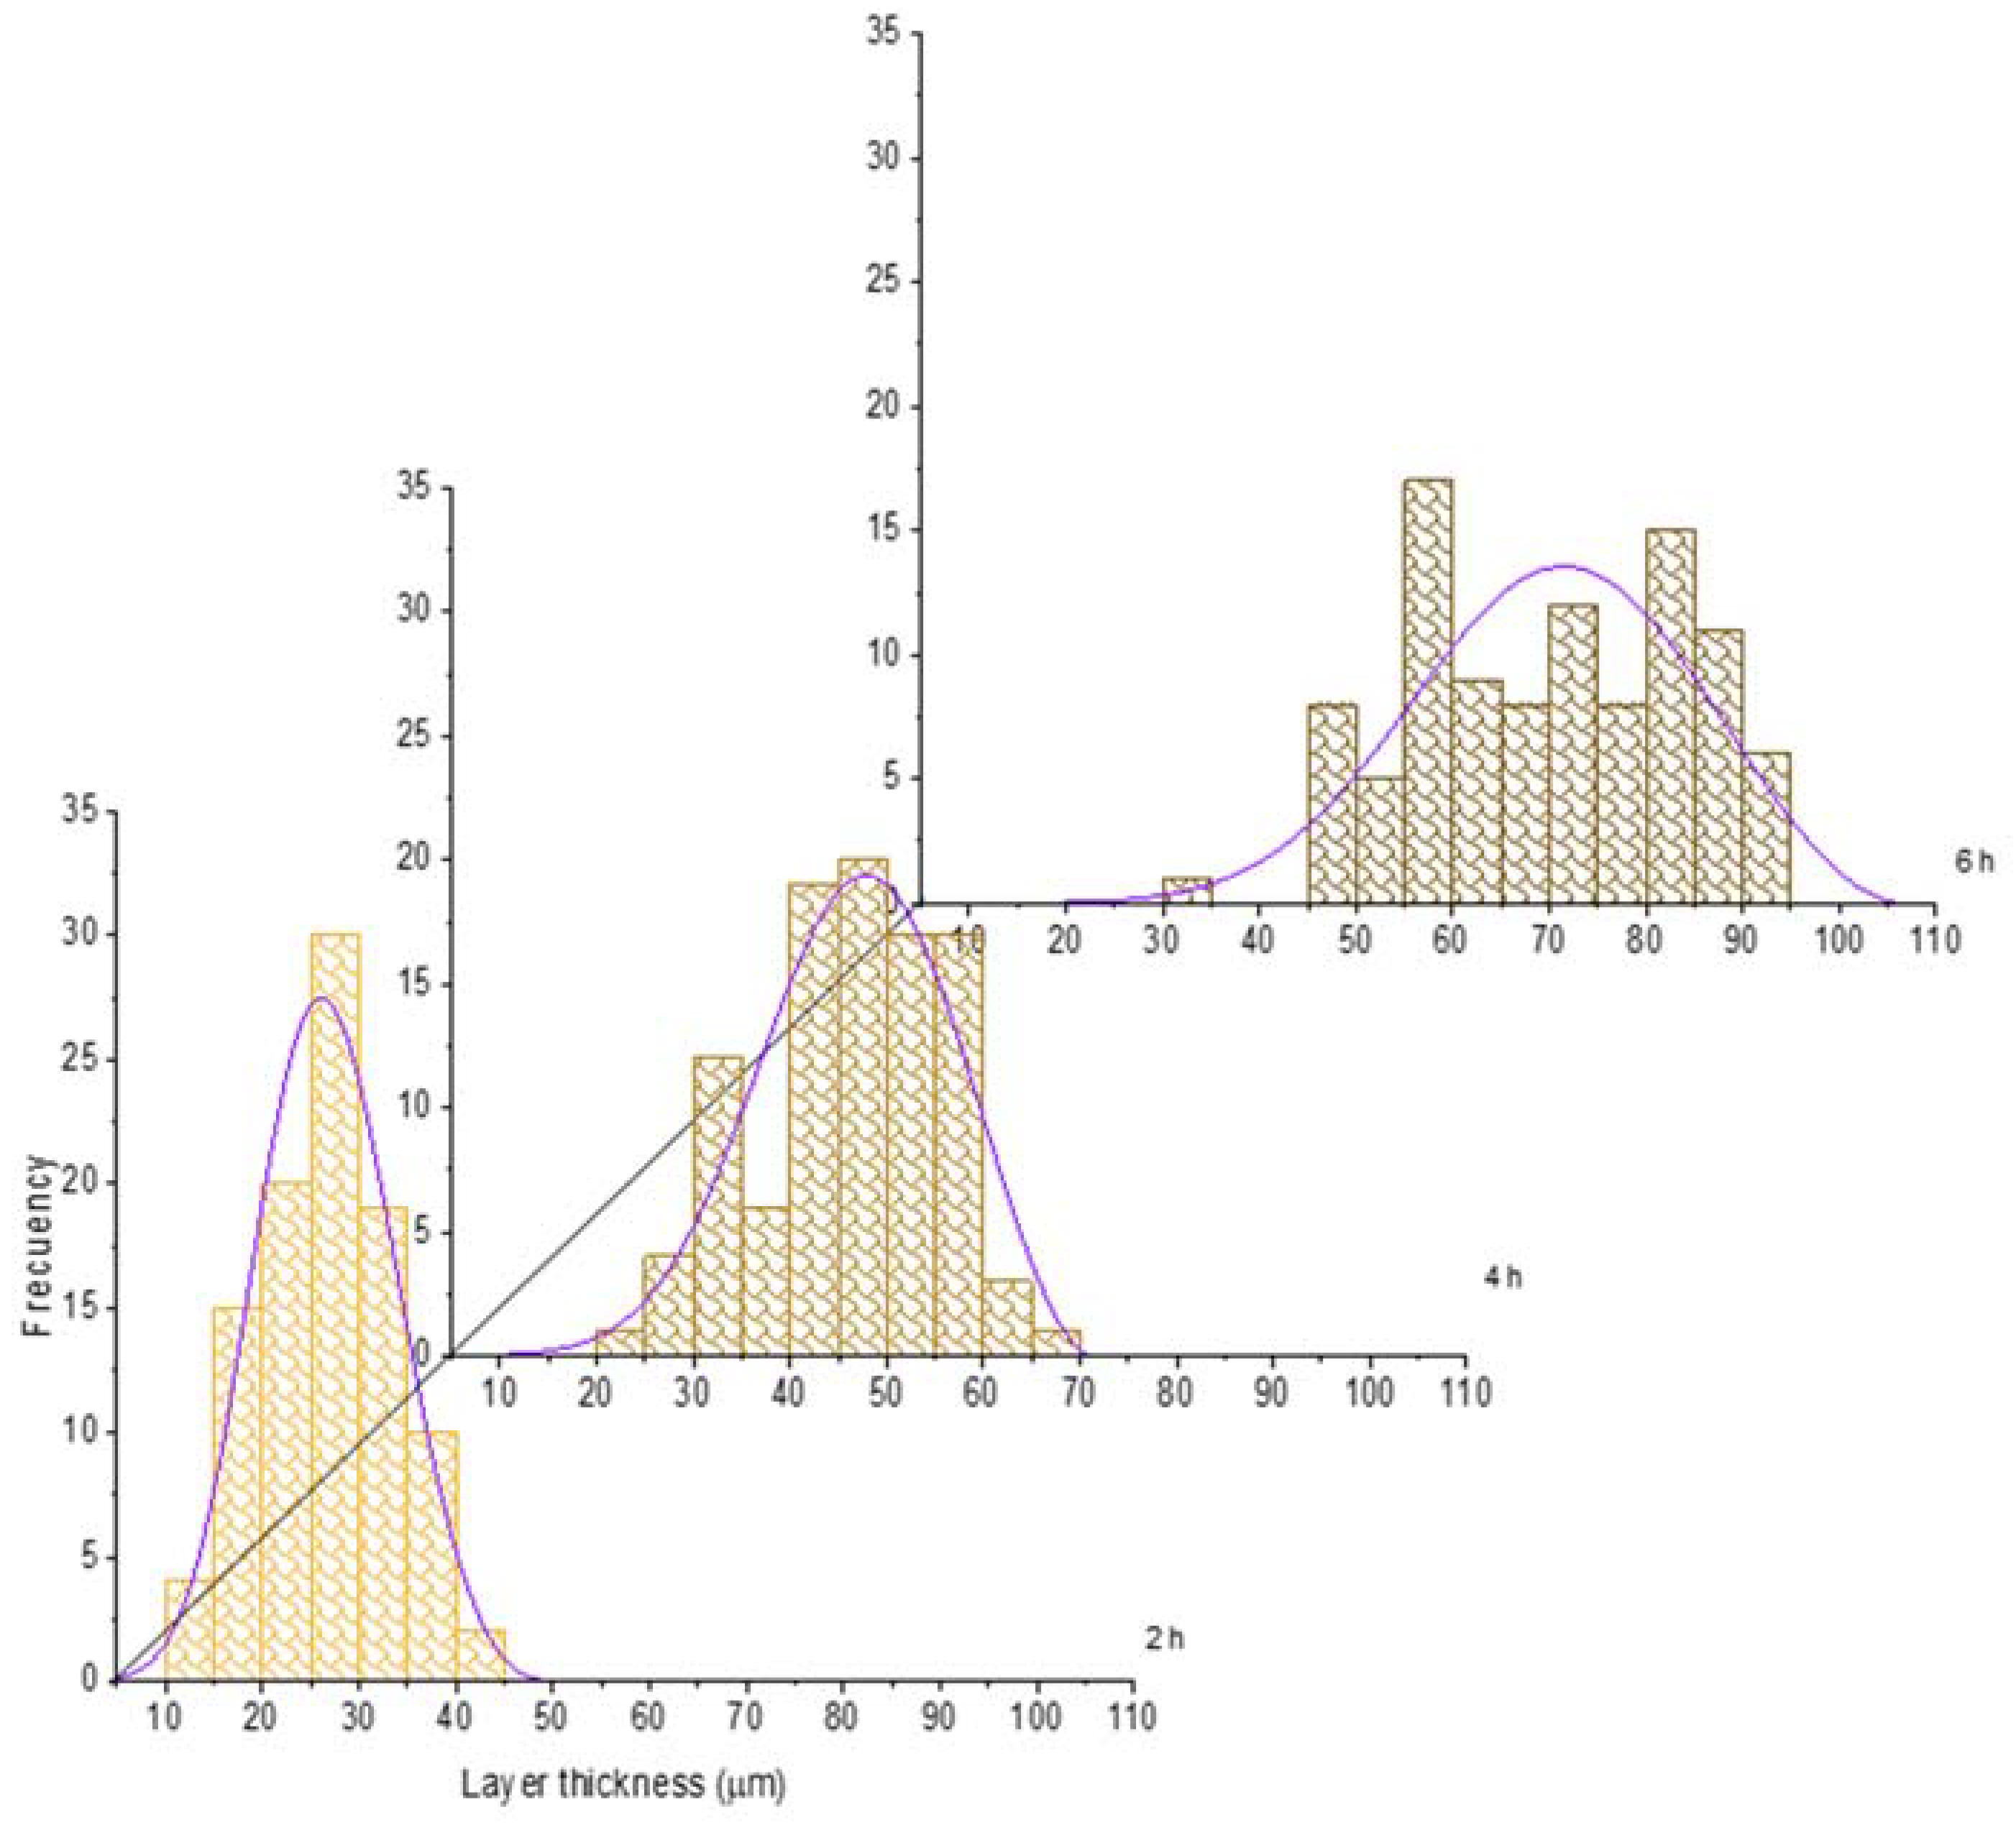
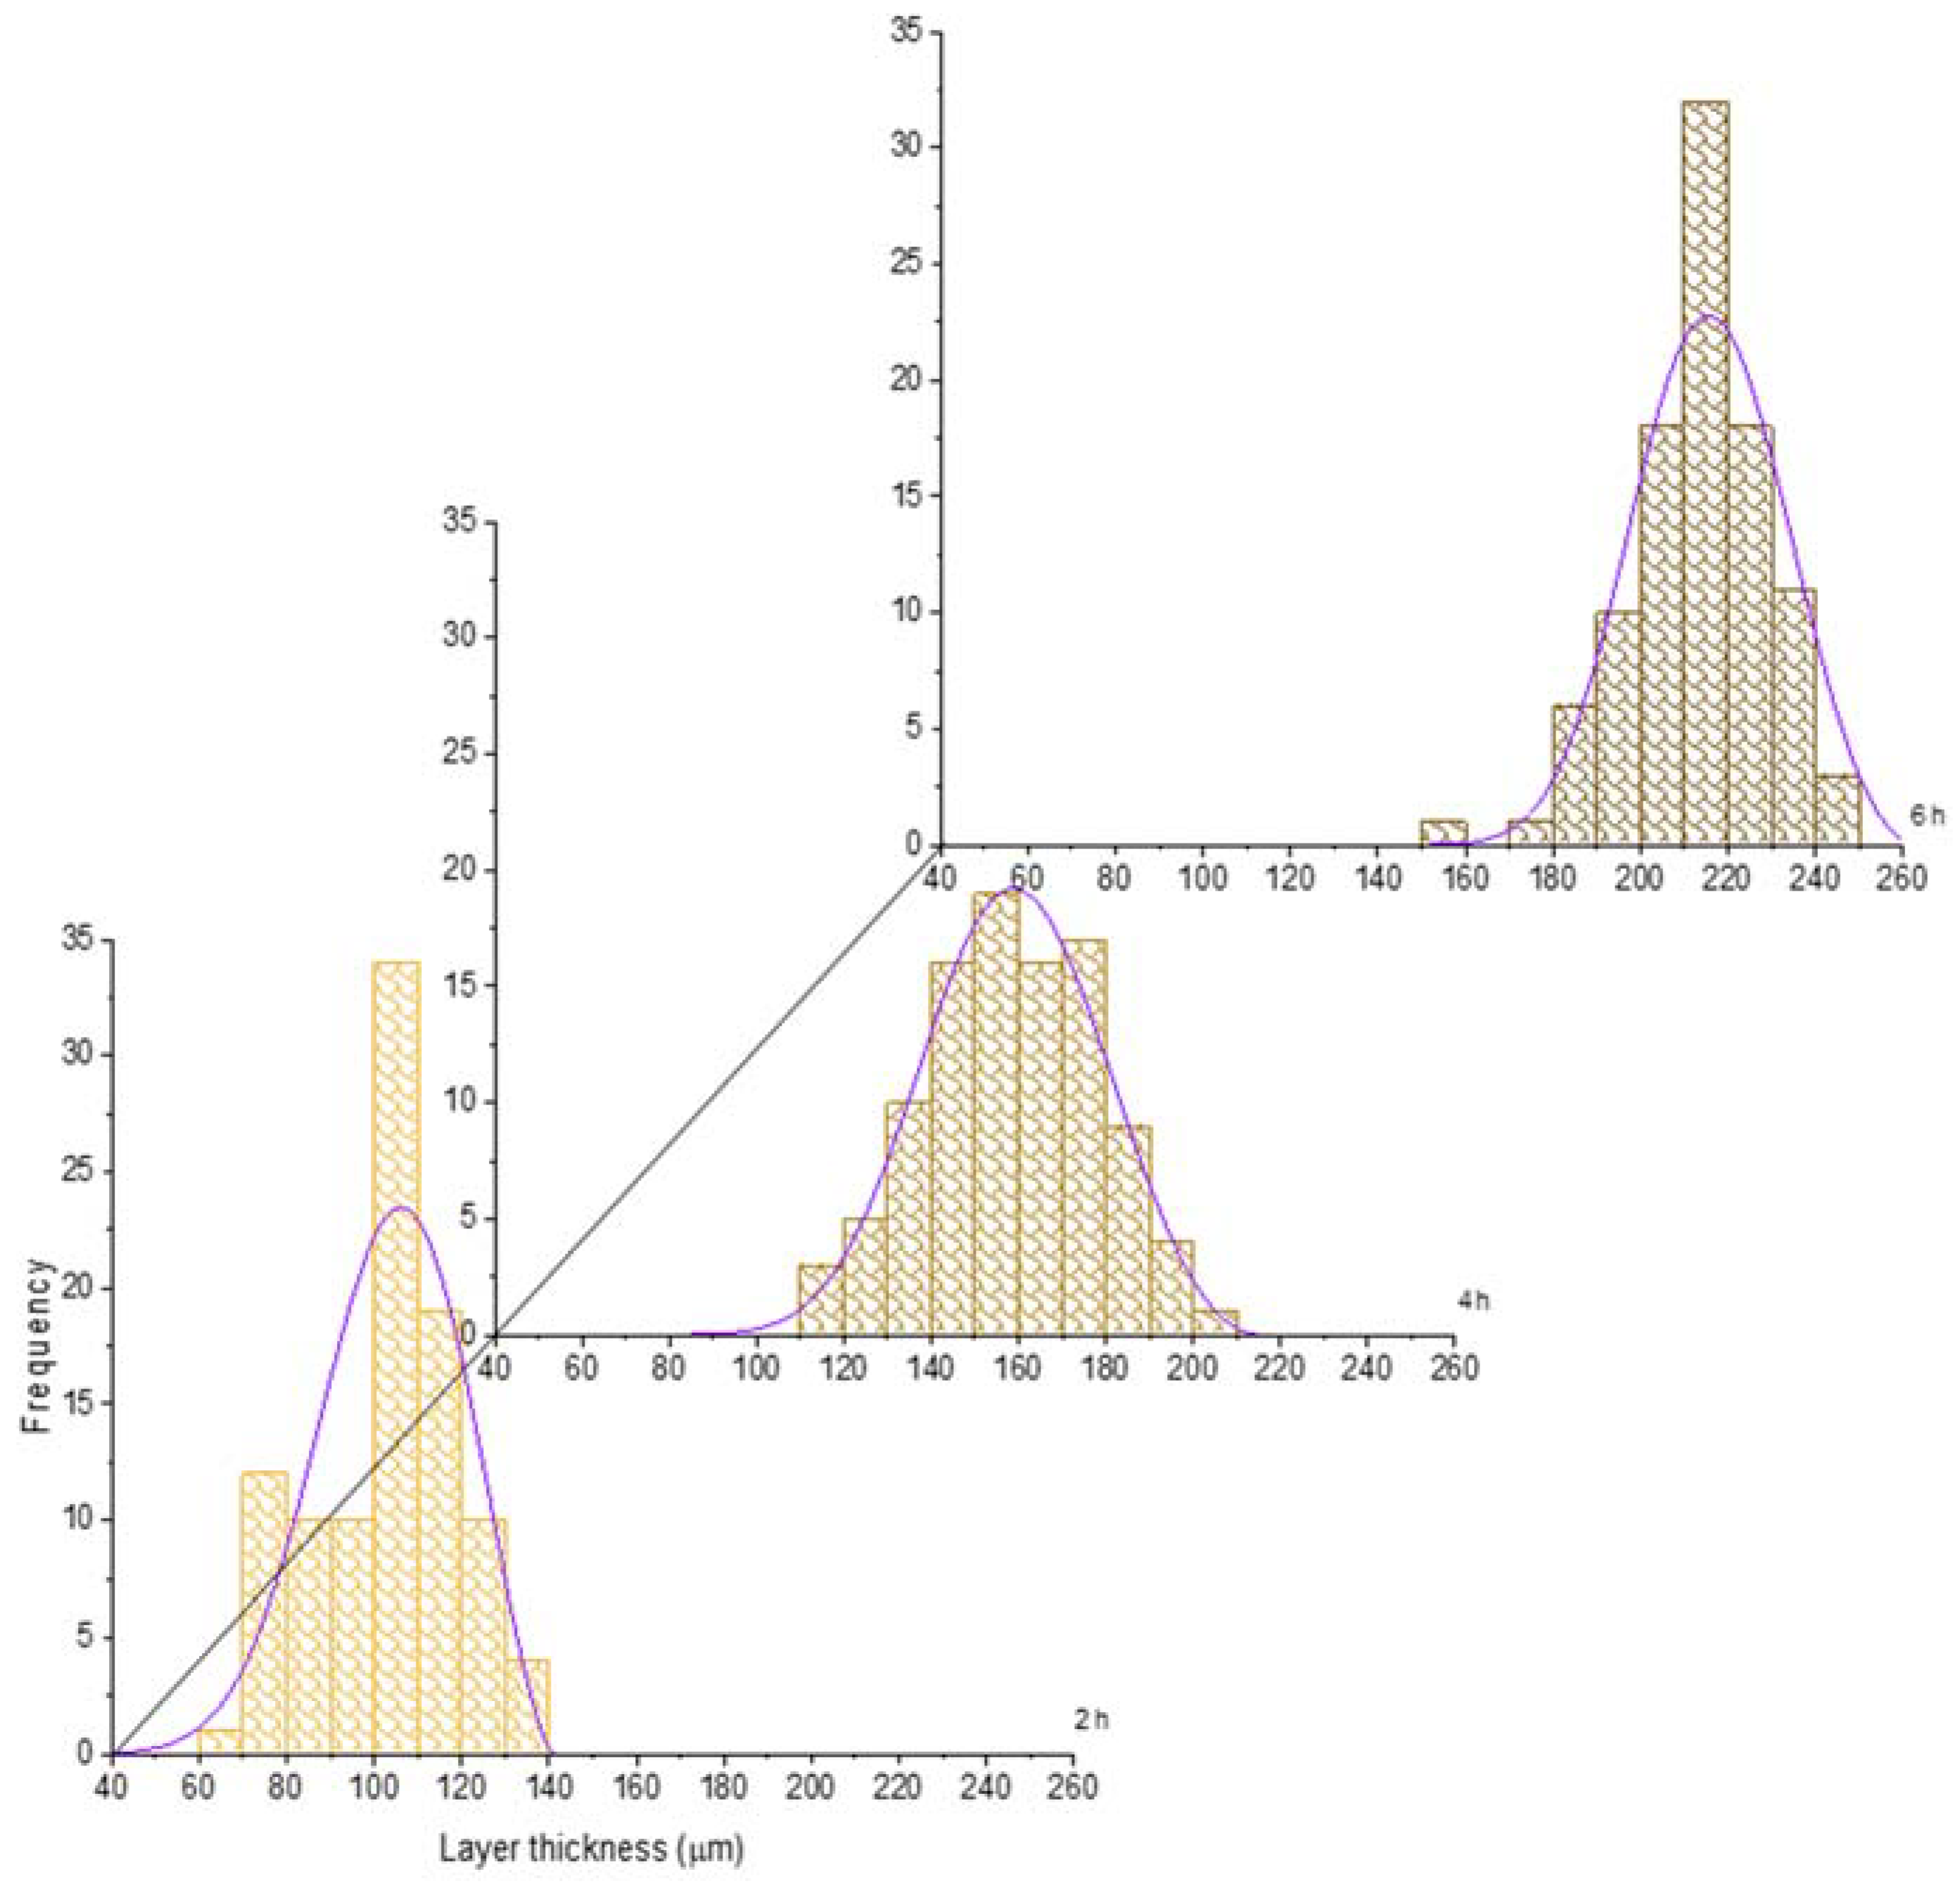
Due to the observed saw-toothed morphology of the boride layer formed on the carbon steel, it can be studied as a random process. This issue was demonstrated for the first time by J.C. Velázquez et al. [27] in 2019 in 1018-carbon steel. In this context, one hundred measurements of the maximum layer thickness were carried out. All these results were used to plot a histogram for each treatment condition. After this process, all the histograms were fitted to a Generalized Extreme Value Distribution (GEVD) that is represented by Equation (8) [45]:
f x = 1 β exp 1 + k z 1 / k 1 + k z 1 1 / k
where z = x α / β , α is the location parameter, β is the scale parameter, and k is the shape parameter.
For the sake of illustration, the histograms of the boride layer thickness obtained at 850 °C and 1000 °C treatment were plotted jointly with the fitted GEVD obtained (see Figure 6 and Figure 7). In these plots, it is feasible to observe that the mean and the variance tend to increase as time increases (see also Table 2 and Table 3).
After fitting all histograms obtained in all the experiments proposed in this research work, in all cases, the GEVD can be accepted with sufficient confidence according to the Kolmogorov–Smirnov test [46]. The GEVD parameters obtained after fitting are shown in Table 11, Table 12 and Table 13.
In the case of the shape parameter, it tends to be more negative as the treatment time increases. This issue shows that the probability distribution tends to be more left-skewed as the treatment time increases. It is worth noticing that at 1000 °C, the shape parameter does not change significatively in time, which means that a high temperature could provoke the generation of thicker and more stable layers, even at a low treatment time. This is confirmed with the standard deviation evolution (see Table 4); at 1000 °C, this statistical characteristic does not change significatively.

3.4. Physical and Structural Characterization by X-ray Diffraction and SEM

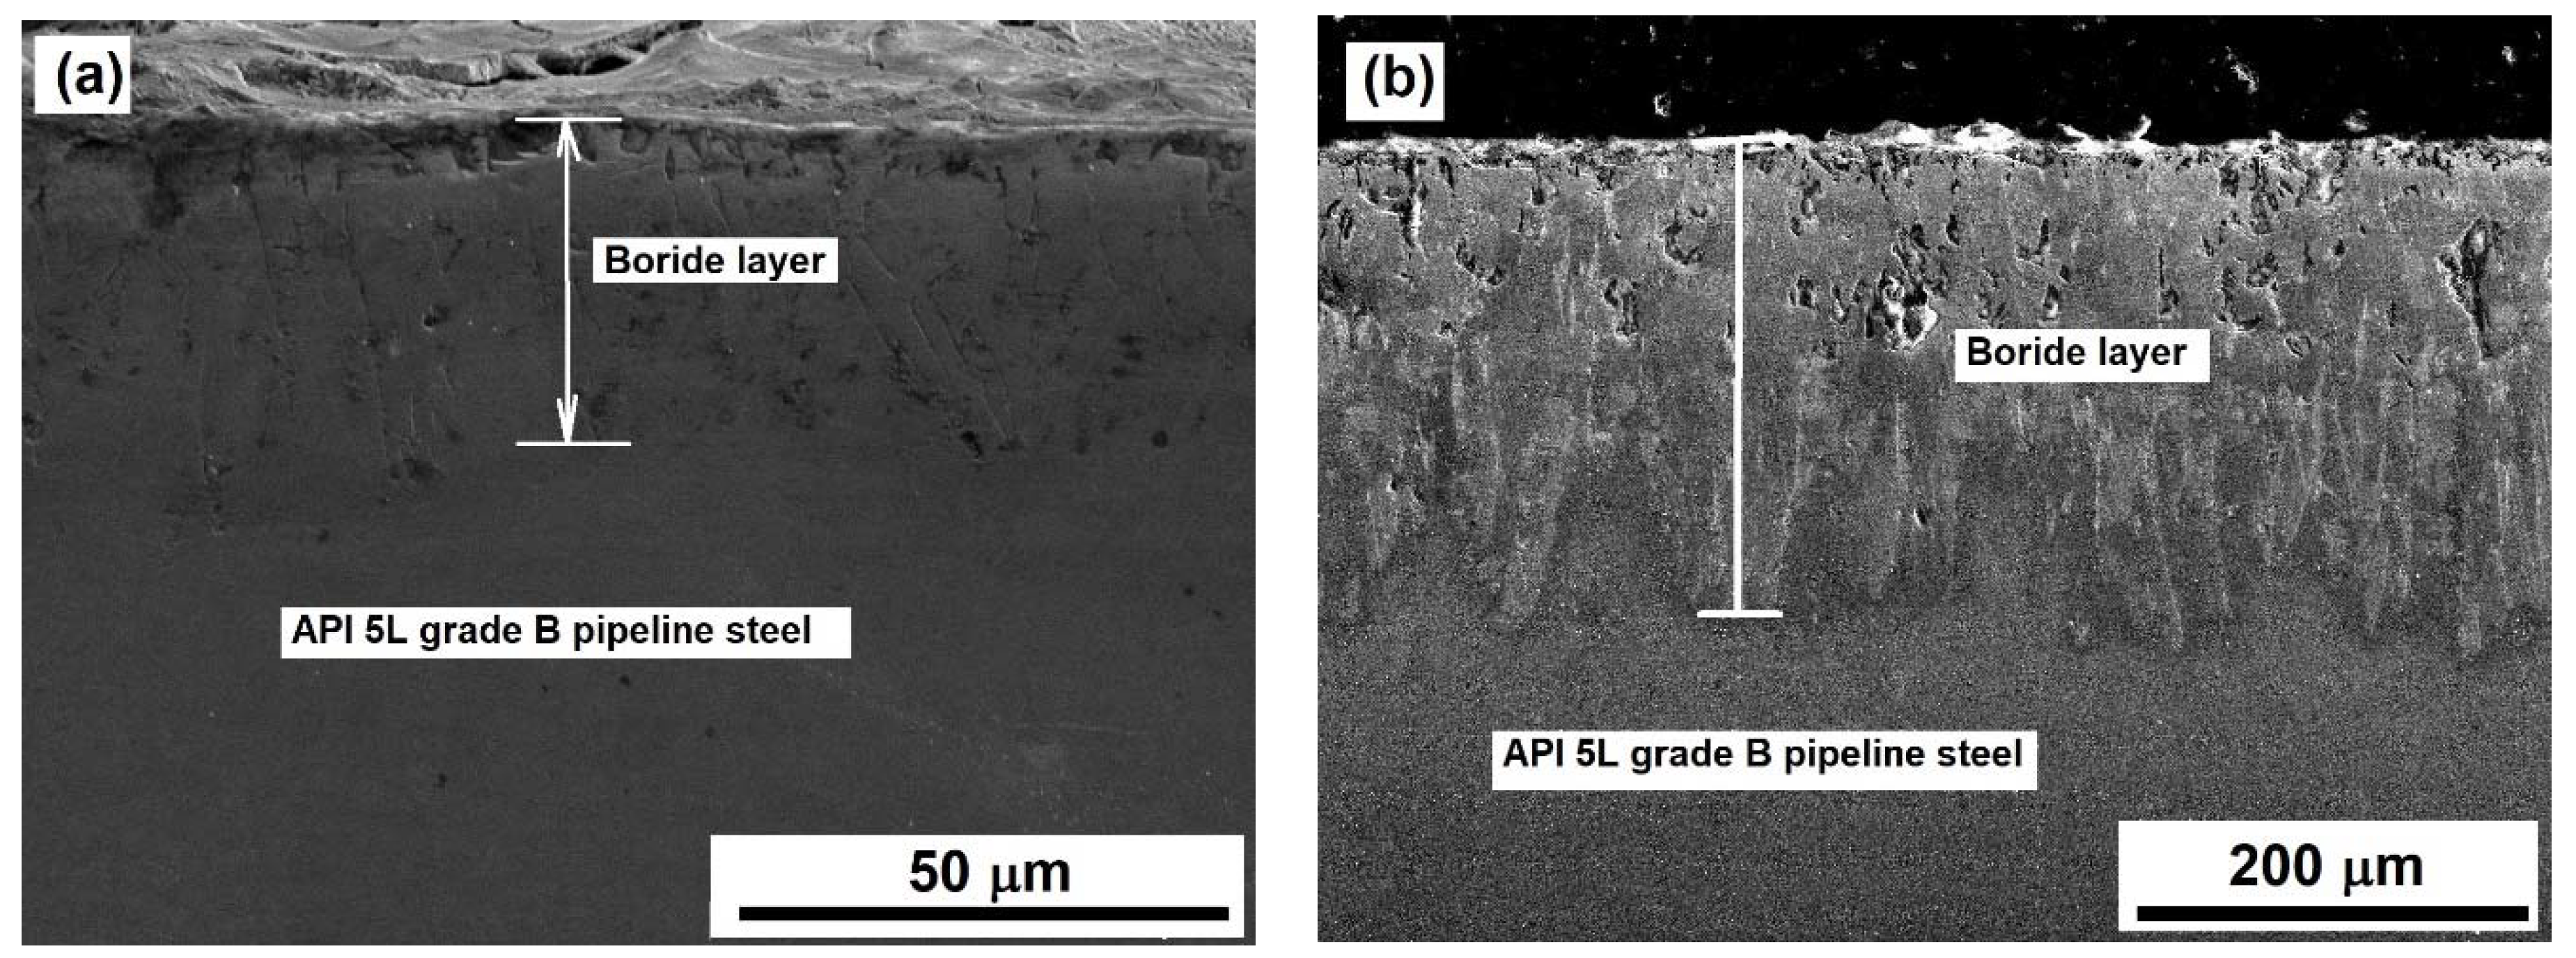
The SEM examination revealed the presence of a well-formed layer of the Fe2B phase. Apparently, no FeB phase was formed in any sample independently of the treatment conditions (see Figure 3 and Figure 8).
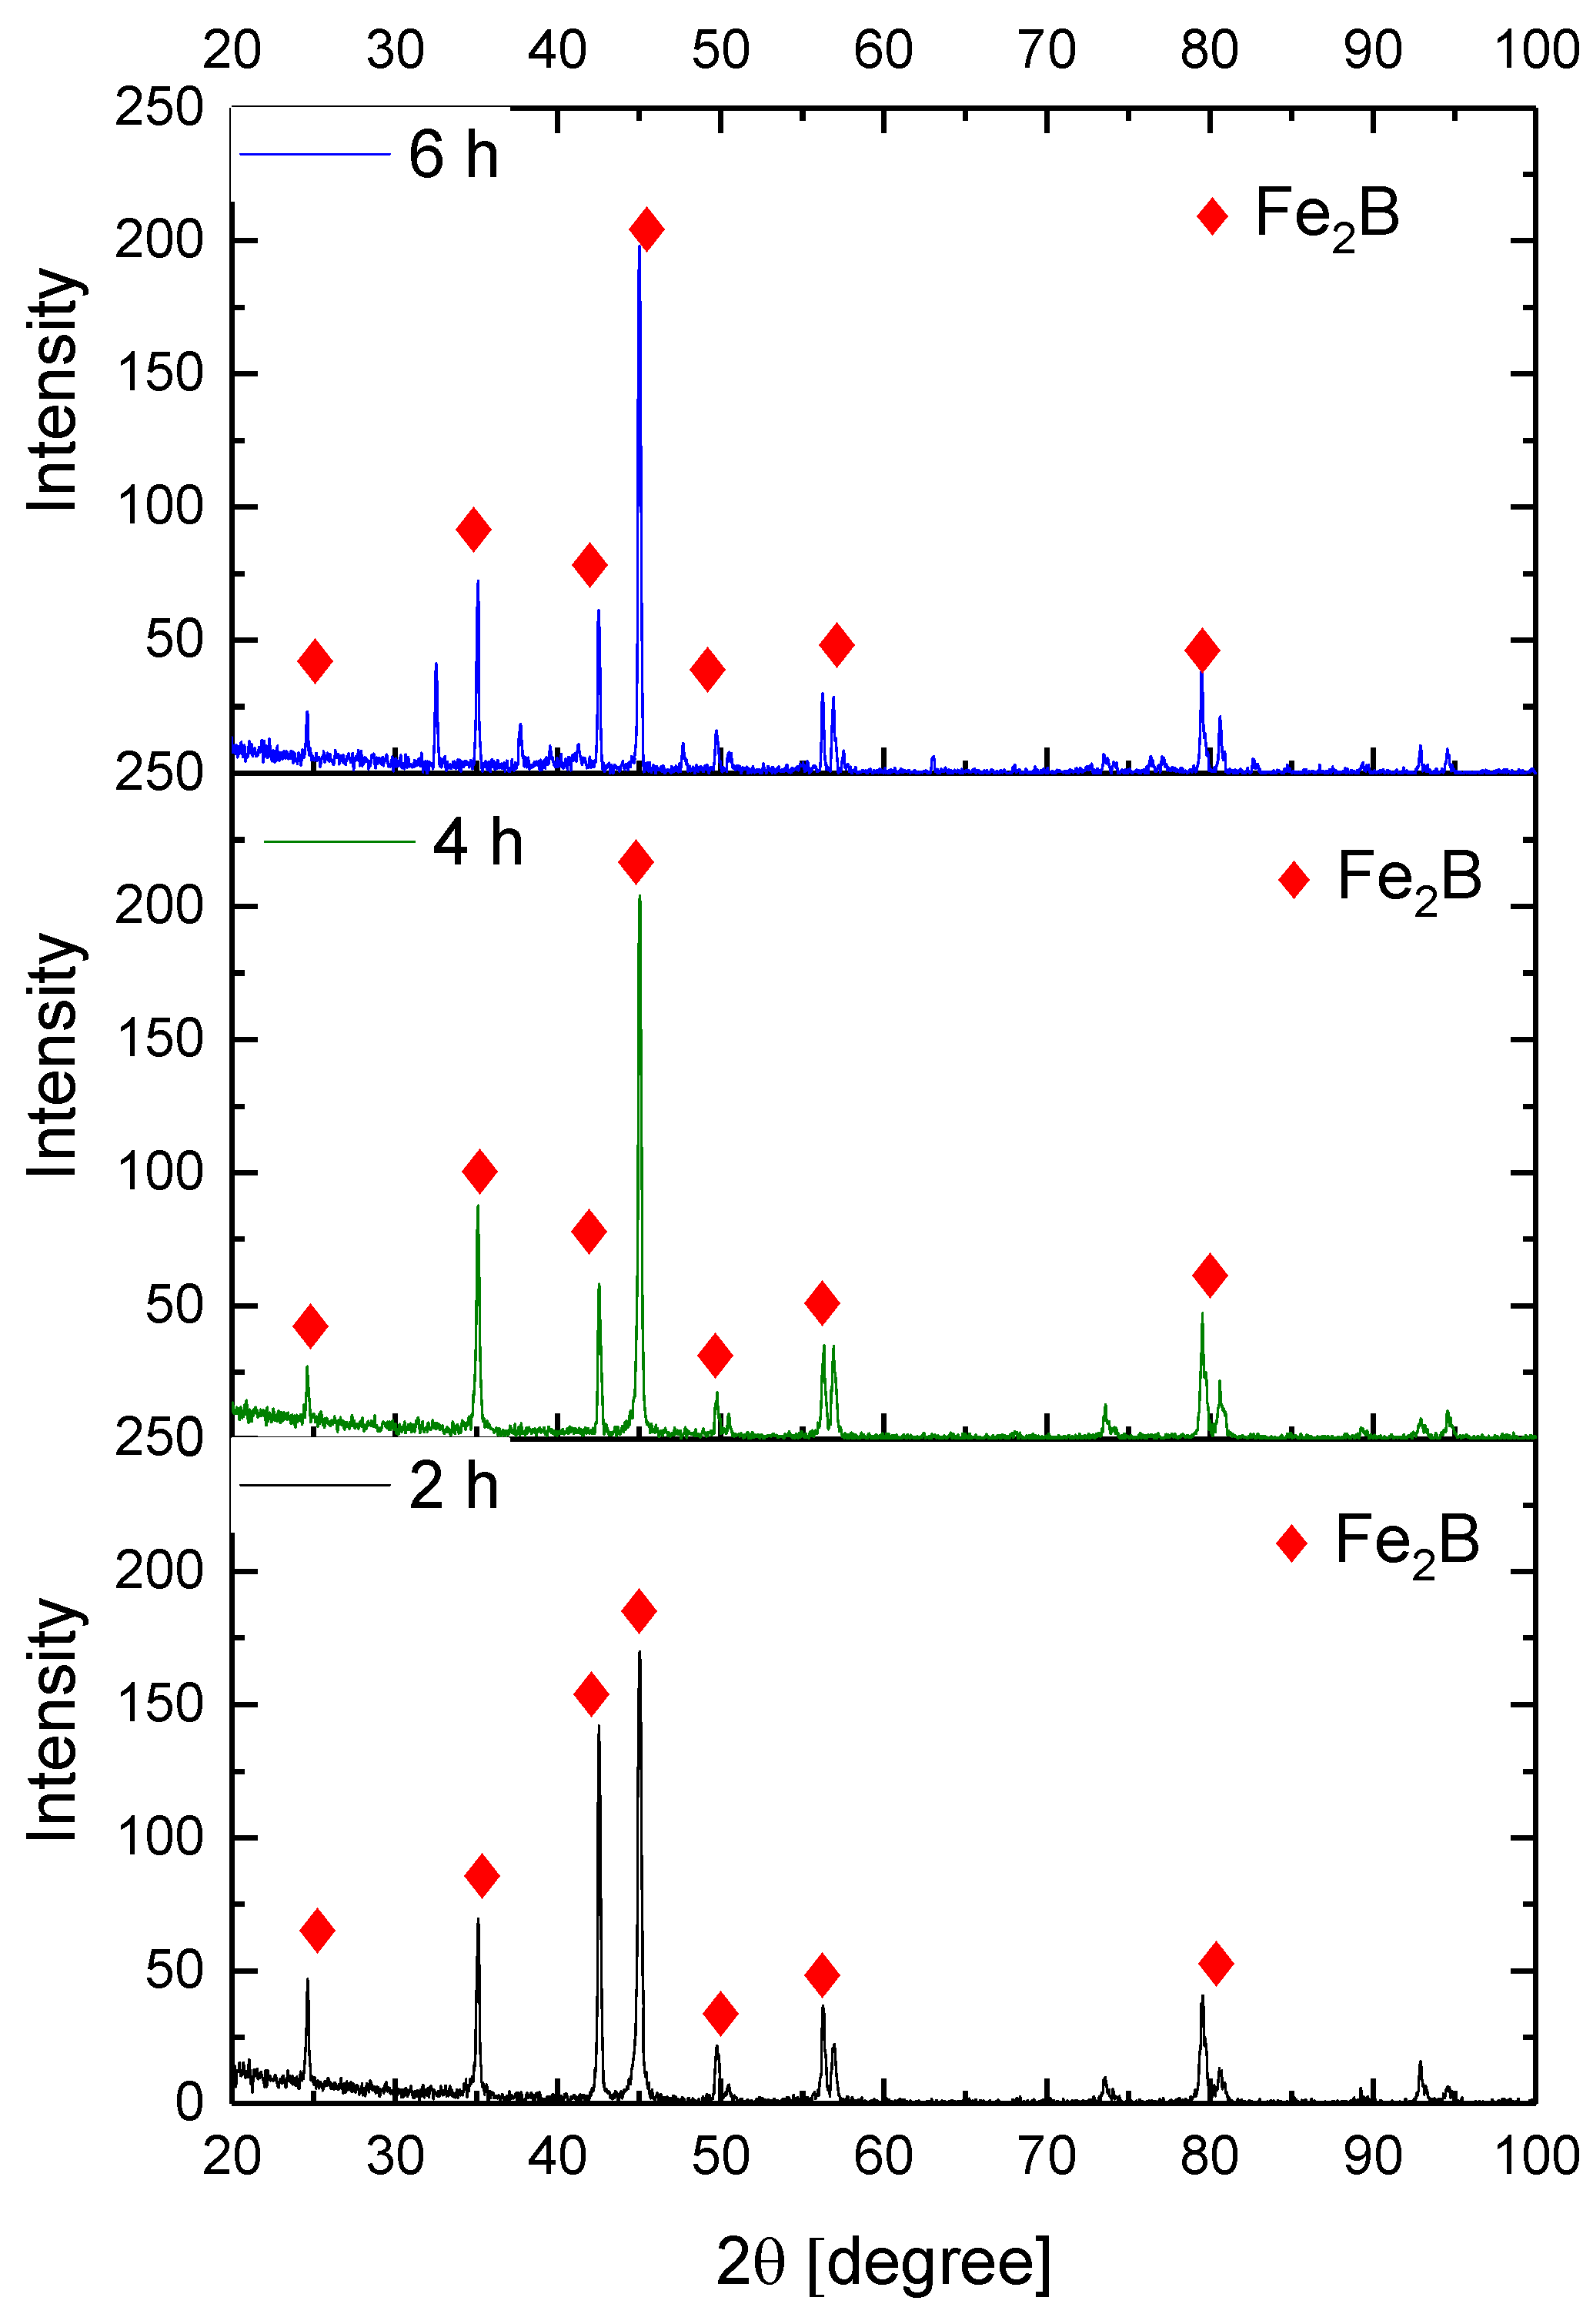
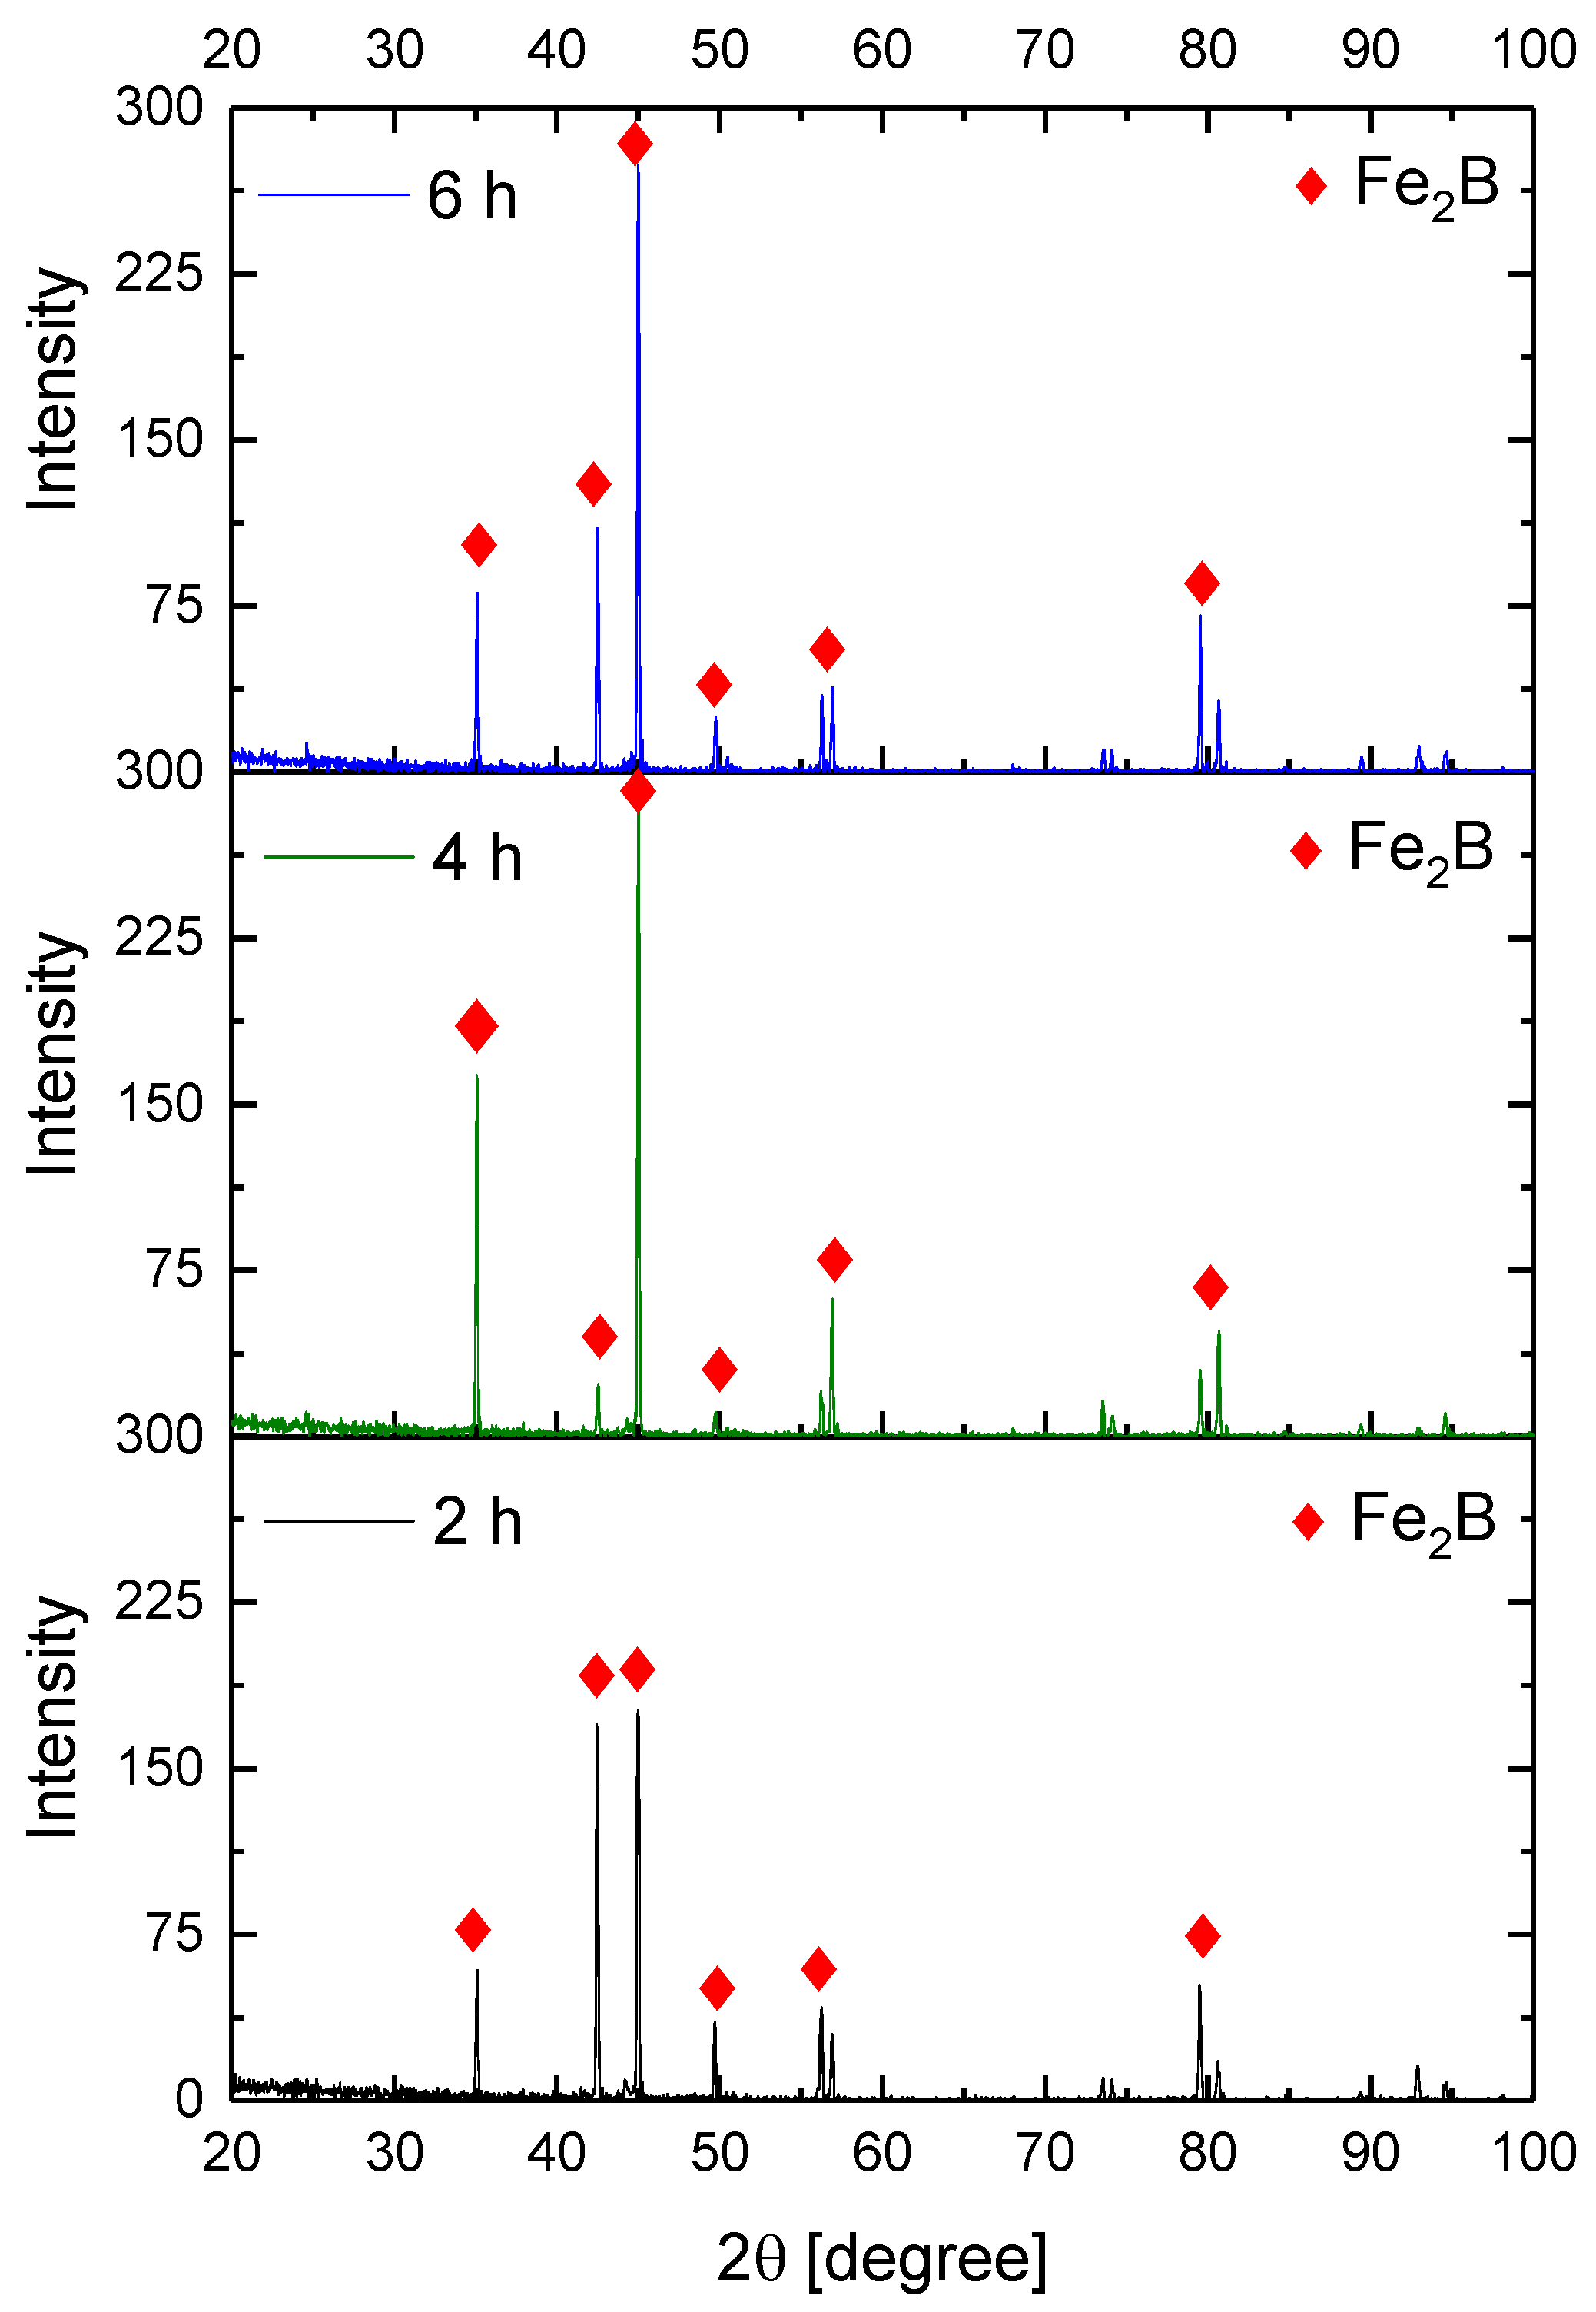
The XRD assays corroborated the assumption made when observing the images of optical and SEM. No FeB phase was formed in any treatment condition. This was probably because the alloy elements of the substrate inhibited the formation of the FeB, since this phase requires more energy for its formation [24,47,48].
Figure 9, Figure 10, Figure 11 and Figure 12 show the diffractograms obtained from the XRD analysis for all the treatment conditions.
The XRD patterns indicate the presence of a well-consolidated phase of Fe2B borides with an orthorhombic crystalline structure. The intensity of the predominant peaks (45, 42, and 35 degrees) changed as a function of the treatment conditions. However, their position did not change, indicating the presence of the Fe2B phase, under the first treatment conditions (850 °C for 2 h). According to the diffractograms shown in Figure 9, it is feasible to confirm the assumption that the only phase formed at the surface of the API 5L grade B steels corresponds to the Fe2B, as there is a complete correlation between the diffraction peaks observed and those found in PANalytical’s HighScore software (version: 3.0e (3.0.5), Date: 30-01-2012, Almelo, The Netherlands).

3.5. Mechanical Characterization

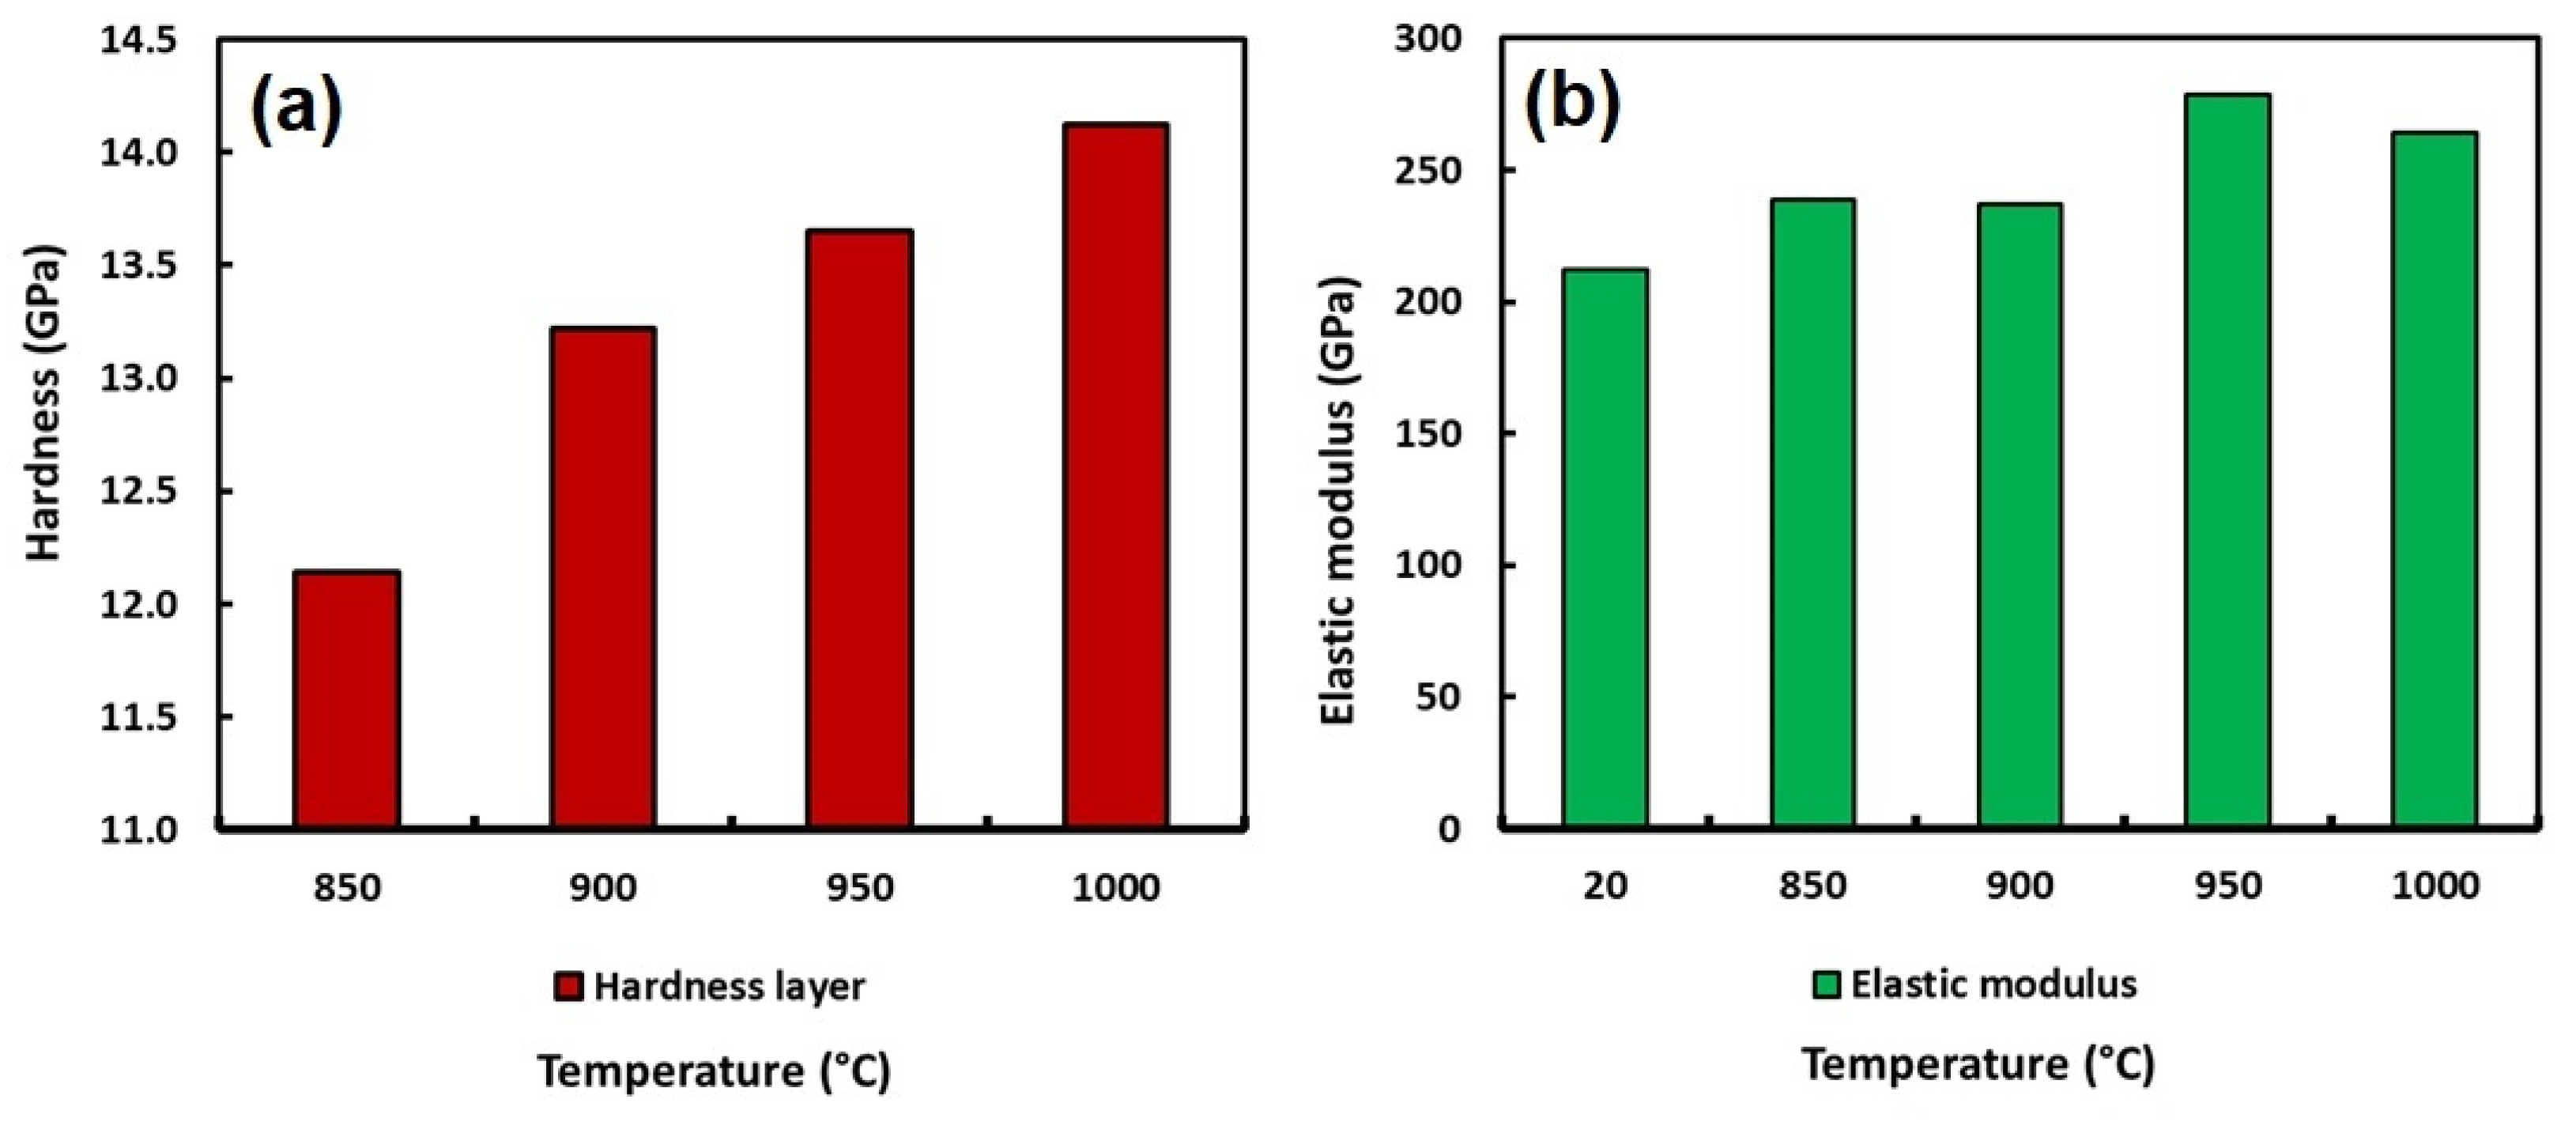
The hardness and the elastic modulus of the boride layers formed at the surface of the API 5L grade B steel were achieved by instrumented indentation. Table 14 summarizes the values of the hardness and the elastic modulus and Figure 13 shows the behavior of the boride layers obtained by instrumented indentation.
According to the values shown in Table 14, the hardness of the boride layers achieved at the surface of the API 5L grade B steel by boriding increased from 2.68 GPa for the non-treated material to 14.12 GPa for the samples exposed to 1000 °C during 6 h of treatment. The increase in hardness is approximately five times with respect to the untreated specimen. It indicates a considerable improvement in the surface properties of the API 5L grade B steel. This improvement in the surface hardness of this type of steel probably indicates an important advantage due to its main application, where wear resistance is a key property required, because it could represent the lifetime of the pipeline.

3.6. Grain Size Estimations after Boriding Treatment

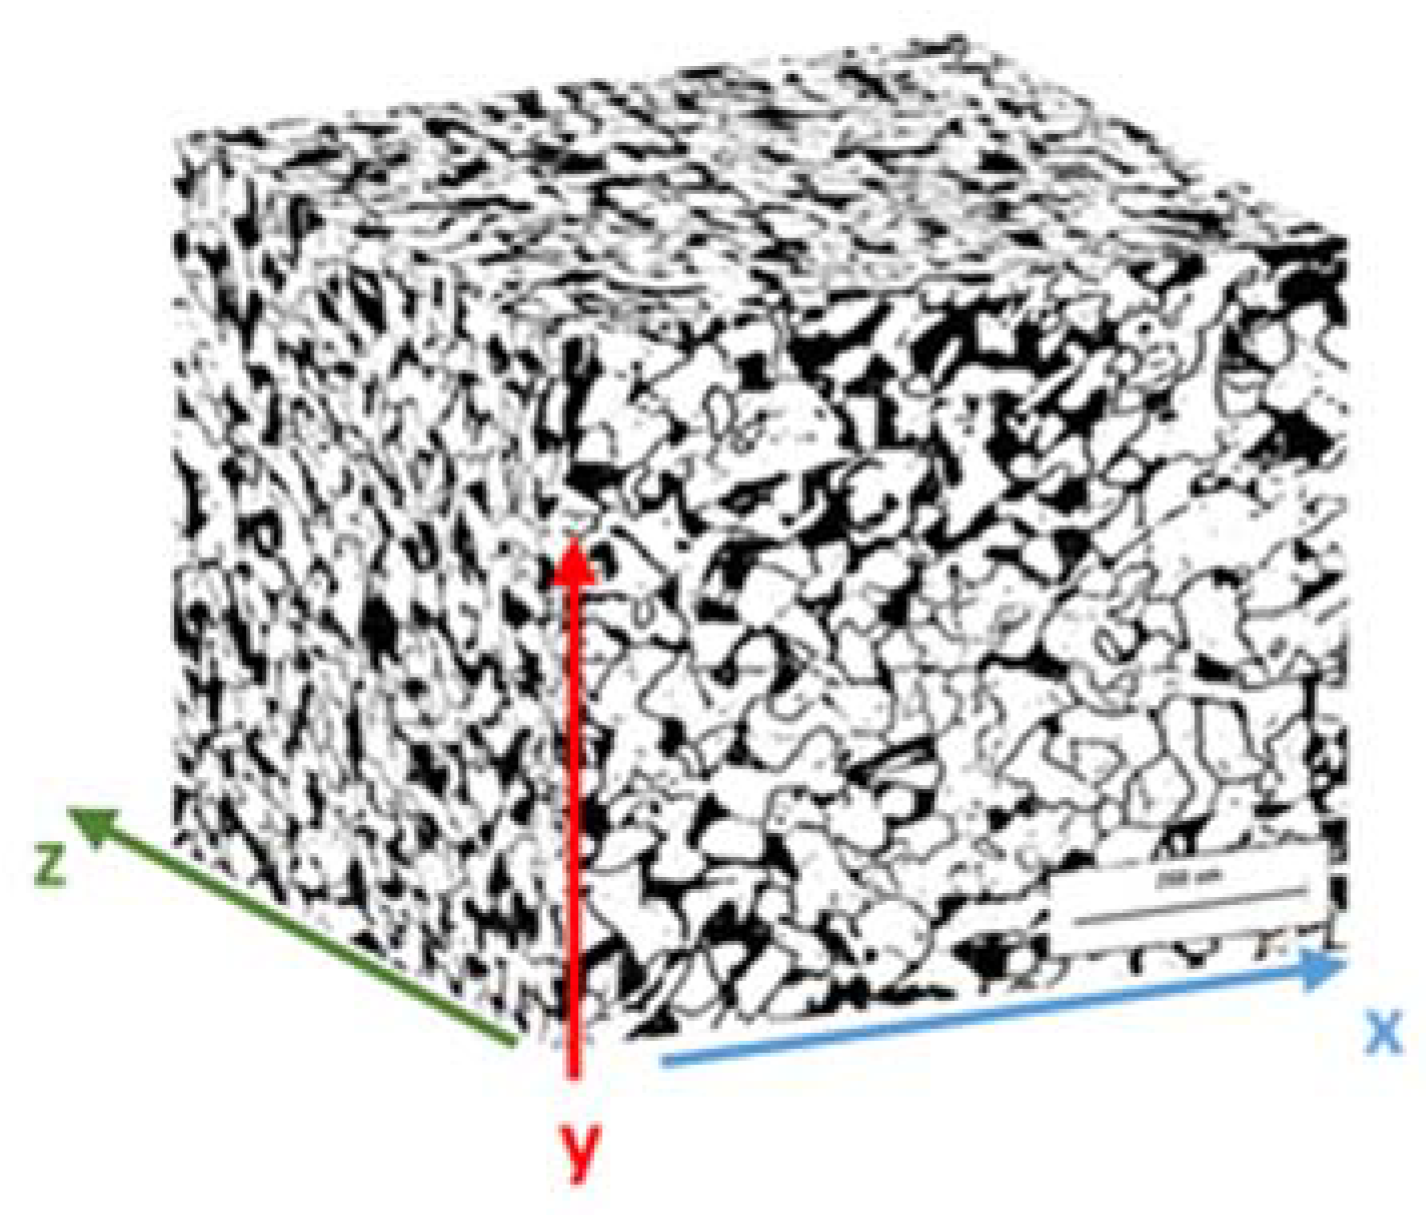
The first step in this steel grain size analysis was to characterize an API 5L grade B sample using an optical microscope. Figure 14 shows the microstructure of the API 5L grade B steel in three directions, and Table 15 shows the grain size estimated in each direction.
It is possible to observe that the grain size is slightly different in the three directions. This is because of the seamless pipe manufacturing process, typically performed in a rotatory hearth furnace [49,50].
Another issue that is necessary to study is the microstructural change that occurs in the substrate (API 5L grade B) after the boriding process. Usually, researchers only study the layer properties, without taking into consideration the changes that can be carried out due to the heat treatment applied on the steel piece. Table 16 shows the grain size estimation for the substrate after the boriding process for the different conditions studied. Likewise, for illustration purposes, Figure 15 shows the changes in the microstructure in the API 5L grade B steel after being treated for six hours at different temperatures. After analyzing the results, one can notice that the grain size increases (ASTM number decreases) considerably. For example, the grain size of the API 5L grade B steel treated at 1000 °C is between two and three times the size of the untreated material. According to the information found in the literature [51,52], the changes in the grain size modify some of the mechanical properties, but this is discussed later in Part II of this research work. Nonetheless, when this steel is treated at a moderated temperature (e.g., 850 °C), it seems that the grain does not undergo considerable changes in its size. This is an important result because it means that when the pipeline steel is subjected to the boriding process at moderate temperatures, it is less likely to experience changes in its microstructure.
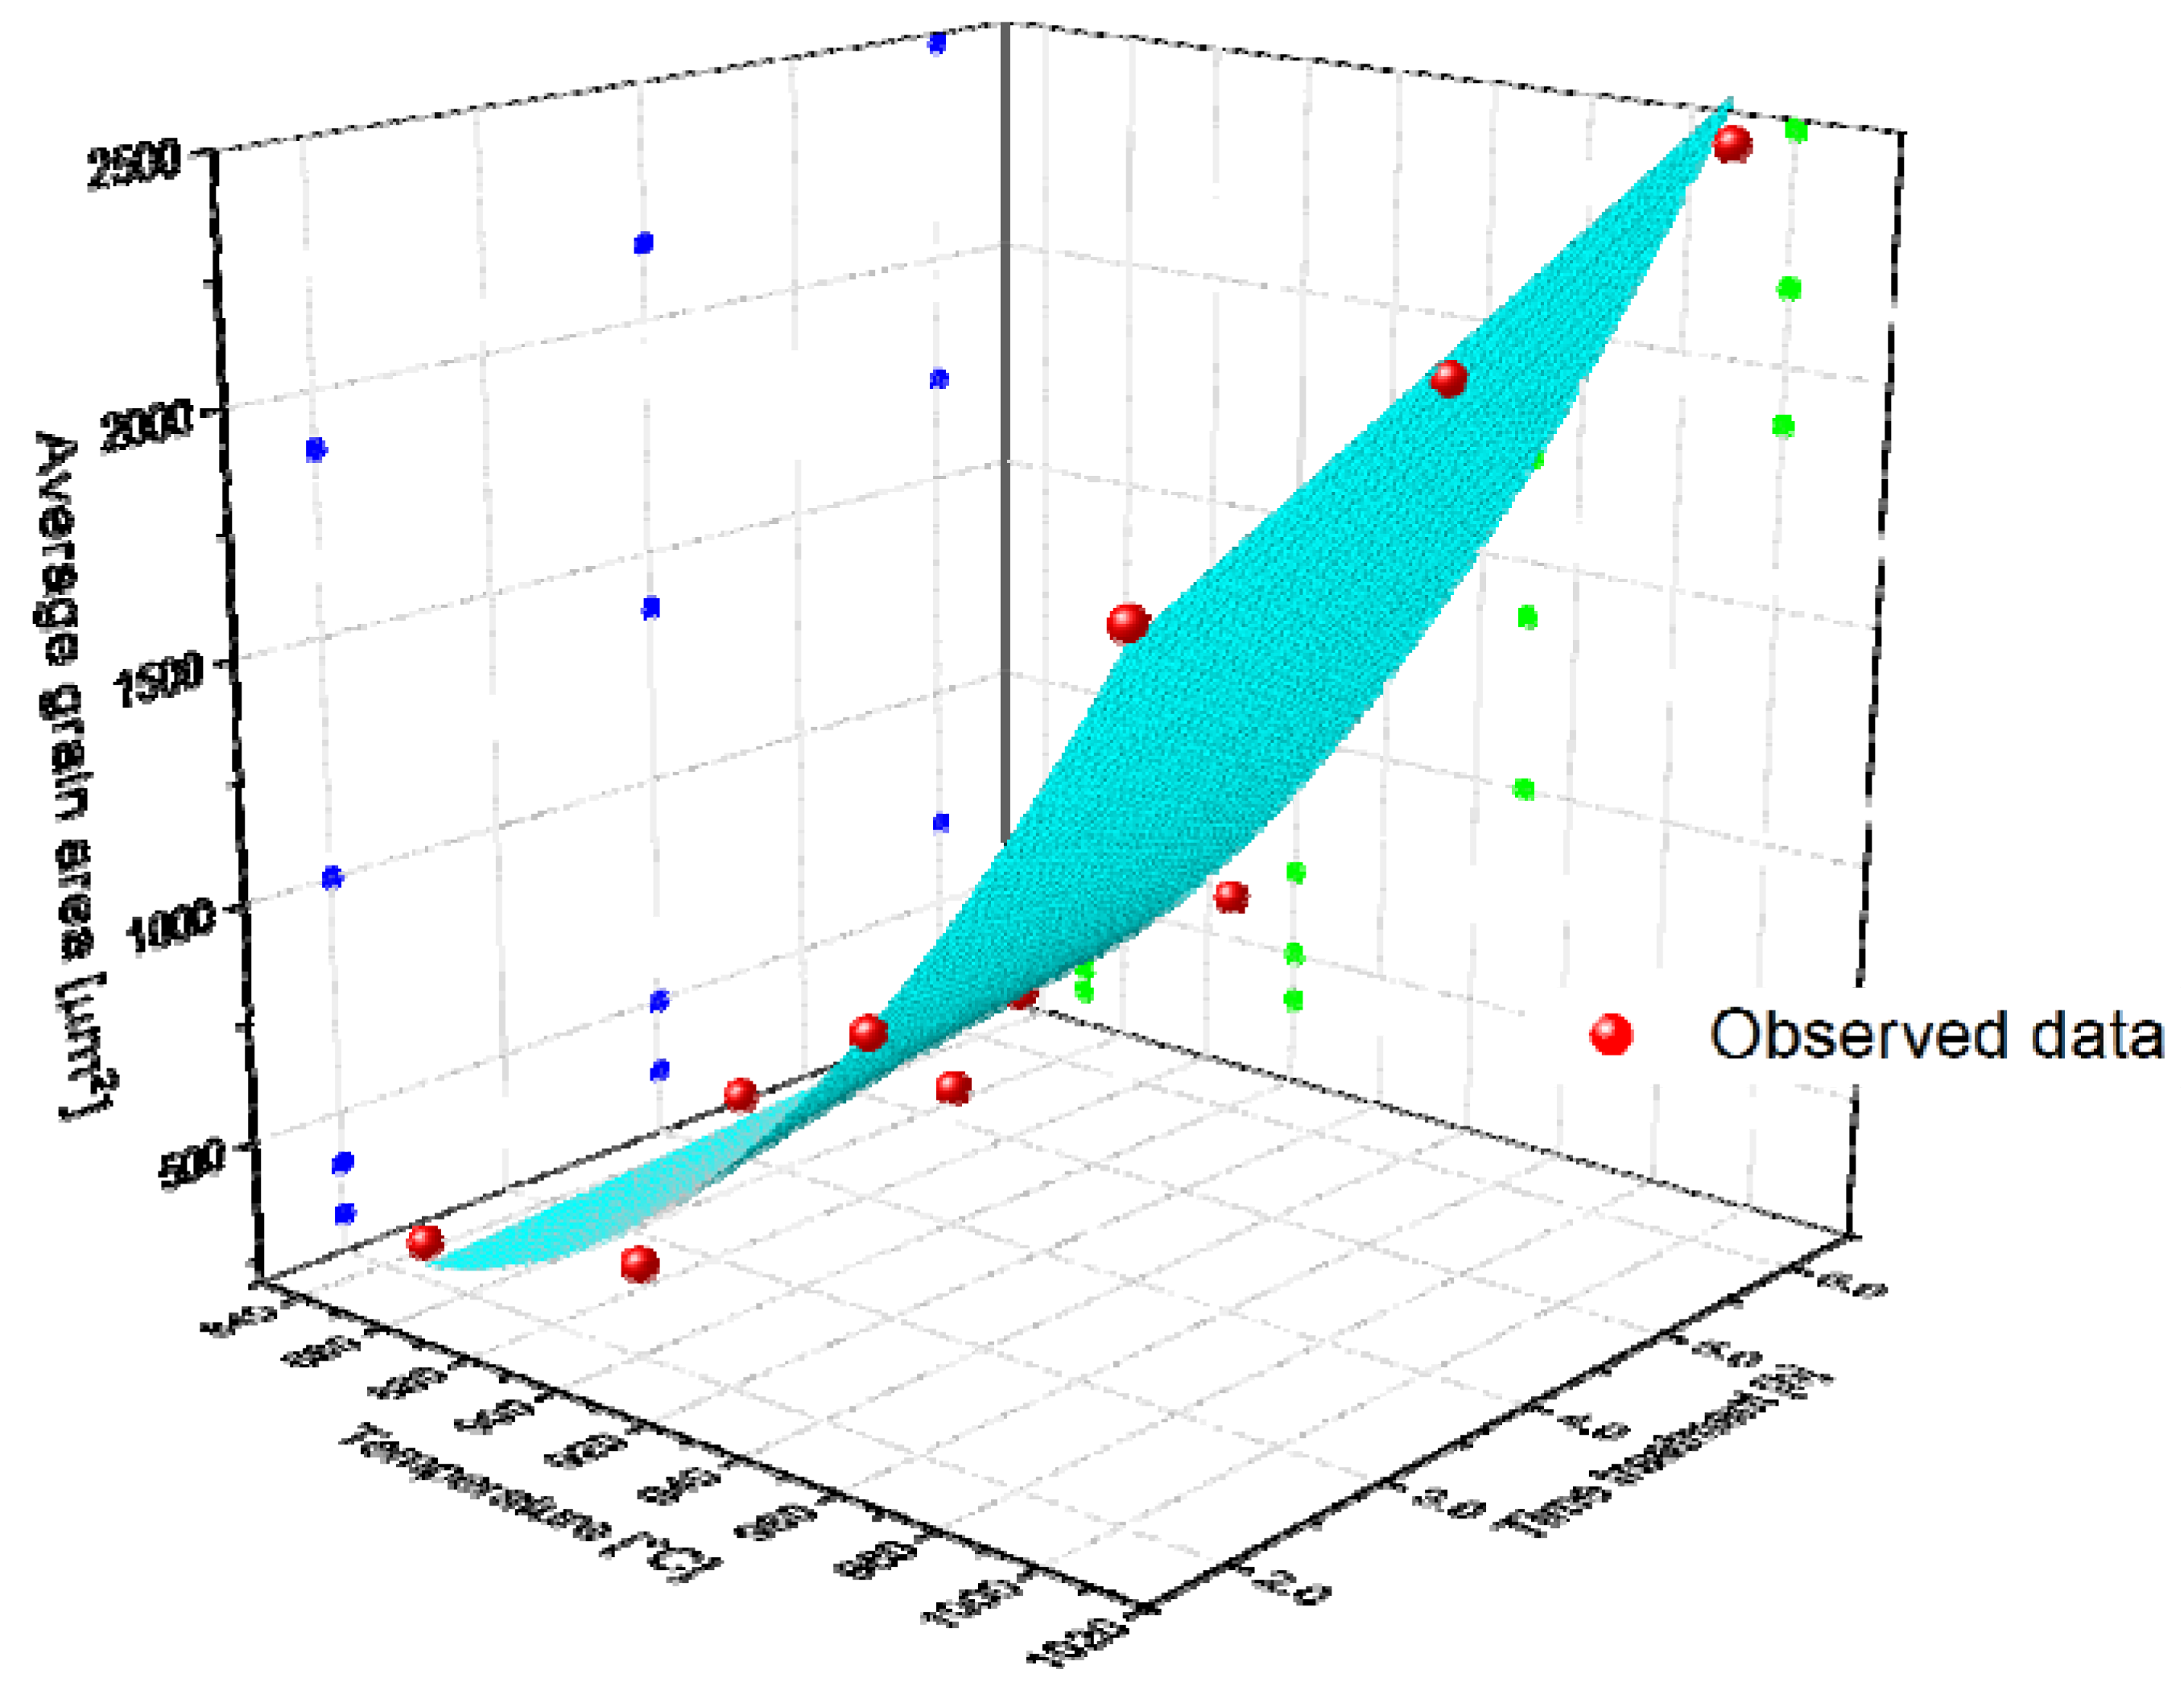
For the sake of a more in-depth study, a non-linear regression analysis was carried out. Equation (9) describes the empirical model proposed in this case:
g a = z 0 + a T + b t + c T 2 + d t 2 + f T t
where ( g a ) is the average grain area in µm2, (T) is the treatment temperature (°C), (t) is the treatment time (h), (z0), (a,b,c,d and f) are regression parameters to be determined. Table 17 shows the parameter values and the coefficient of determination (R2). Moreover, a 3D scatter plot is included for schematization purposes (see Figure 16), where it is possible to observe that the greater the temperature, the greater the average grain area. We also plotted the surface that is represented by Equation (9) with the parameters indicated in Table 17. On this surface, one can observe that the slope of the average grain area–temperature is greater than the average grain area–time, which means that the temperature exerts a stronger influence on grain growth. In addition, when it is analyzed via Spearman correlation, the correlation between the average grain area and temperature is much higher than that between the average grain area and time. This information is given in Table 18.

3.7. Analysis of the Results

First of all, one important result is that the boride layer formed over API 5L grade B steel is only composed of Fe2B. This result is typically unusual for carbon steels and ductile iron, because these materials tend to facilitate the formation of a biphasic layer (Fe2B + FeB). Due to the mechanical characteristics of the Fe2B layer, the formation of this layer is more desirable because it is less brittle [53,54,55]. Boron reacts with Fe2B at the B–Fe2B interface, producing FeB depending on the alloy elements of the substrate, the temperature, and the treatment time [28]. Fe2B is much more stable than FeB, and the growth of Fe2B takes place earlier. Therefore, it seems that the formation of Fe2B is ideal to protect the oil and gas pipeline composed of API 5L grade B steel because it does not require a large amount of activation energy, it is not too brittle, and it increases the hardness and wear resistance.
In other research works [25,28], the mean value of layer thickness is used to model layer growth. This research shows that the mode could reduce the error obtained when we model the growing layer. This point could be helpful in developing more reliable contour diagrams.
Due to the changes provoked in the substrate grain size, it is necessary to consider studying the changes in the mechanical properties. However, this point will be studied and presented later, in the second part of this research work.

4. Conclusions

  • It is possible to enhance the surface properties such as hardness and young modulus of a pipeline steel, API 5L grade B steel, via a thermochemical process called packed powder boriding;
  • The boride layer formed on API 5L grade B steel tends to be thicker and tougher as the time and temperature of treatment increase;
  • Unlike other boron layers formed on other carbon steels, the boron layer formed on API 5L grade B steel is only composed of Fe2B. This is probably a consequence of the microalloys of the steel studied;
  • The Generalized Extreme Value Distribution fits well with the histogram of the boride layer thickness obtained at different treatment times and temperatures;
  • In the API 5L grade B steel, the Arrhenius equation can be used to model boride layer growth. However, in lieu of using the average values of layer thickness, the mode, which represents the most probable value, was used to reduce the model error; and
  • The grain size of the substrate (API 5L grade B steel) tends to increase as the time and temperature increase, as the temperature is the variable that exerts a stronger influence on this change. These changes may modify other properties of the steel; therefore, it is important to take into consideration this parameter.

Author Contributions

Conceptualization, J.C.V. and E.H.-S.; methodology, G.T.-M., P.A.R.-T. and R.T.-R.; validation, G.T.-M., J.C.V., E.H.-S. and L.M.A.-M.; formal analysis, J.C.V. and E.H.-S.; investigation, J.G.M.-H.; resources, G.T.-M., J.C.V. and E.H.-S.; data curation, L.M.A.-M.; writing—original draft preparation, J.C.V.; writing—review and editing, J.C.V. and E.H.-S.; visualization, J.C.V.; supervision, E.H.-S.; project administration, J.C.V. and E.H.-S.; funding acquisition, E.H.-S. All authors have read and agreed to the published version of the manuscript.

Funding

This work was supported by research Grant 20210181 of Instituto Politécnico Nacional in Mexico.

Institutional Review Board Statement

Not applicable.

Informed Consent Statement

Not applicable.

Data Availability Statement

The data that support the findings of this study are available from the corresponding author upon reasonable request.

Acknowledgments

The authors wish to thank the Center of Nanosciences and Micro-Nano Technologies of the Instituto Politécnico Nacional for the cooperation. Additionally, they would like to thank Instituto Tecnológico de Estudios Superiores Monterrey in Mexico for its collaboration in developing this work.

Conflicts of Interest

The authors declare no conflict of interest.

References

  1. Bilgen, S.; Keleş, S.; Kaygusuz, A.; Sarı, A.; Kaygusuz, K. Global Warming and Renewable Energy Sources for Sustainable Development: A Case Study in Turkey. Renew. Sustain. Energy Rev. 2008, 12, 372–396. [Google Scholar] [CrossRef]
  2. Fattouh, B.; Economou, A.; Mehdi, A. Russia-Ukraine Crisis: Implications for Global Oil Markets; Oxford Institute for Energy Studies. Available online: www.oxfordenergy.org/publications/russia-ukraine-crisis-implications-for-global-oil-markets (accessed on 1 November 2022).
  3. Menon, S. Ukraine Crisis: Who is Buying Russian Oil and Gas? Available online: https://www.bbc.com/news/world-asia-india-60783874 (accessed on 1 September 2022).
  4. Petrequin, S.; Casert, R. EU Leaders Divided on Gas Price Cap at Energy Crisis Summit. AP NEWS. Available online: https://apnews.com/article/russia-ukraine-zelenskyy-putin-kyiv-business-057533d7720d663460683631313fd2f2 (accessed on 21 November 2022).
  5. IEA. Analysis and Forecast to 2026. IEA. Available online: https://www.iea.org/reports/oil-2021 (accessed on 30 November 2022).
  6. Cremer, H.; Gasmi, F.; Laffont, J.J. Access to Pipelines in Competitive Gas Markets. J. Regul. Econ. 2003, 24, 5–33. [Google Scholar] [CrossRef]
  7. Pootakham, T.; Kumar, A. Bio-Oil Transport by Pipeline: A Techno-Economic Assessment. Bioresour. Technol. 2010, 101, 7137–7143. [Google Scholar] [CrossRef]
  8. Hussein, M. Mapping the World’s Oil and Gas Pipelines. Aljazeera. Available online: https://www.aljazeera.com/news/2021/12/16/mapping-world-oil-gas-pipelines-interactive, (accessed on 29 November 2022).
  9. EGIG. 9th Report of the European Gas Pipeline Incident Data Group. EGIG. Available online: https://www.egig.eu/reports, (accessed on 25 November 2022).
  10. Federal Environmental. Annual Reports of the Federal Environmental, Industrial and Nuclear Supervision Service of Russia. Industrial and Nuclear Supervision Service of Russia RU. Available online: http://en.gosnadzor.ru/activity/annual-report (accessed on 25 July 2022).
  11. Caleyo, F.; Alfonso, L.; Alcántara, J.; Hallen, J.M. On the Estimation of Failure Rates of Multiple Pipeline Systems. J. Press. Vessel Technol. 2008, 130, 0217041–0217048. [Google Scholar] [CrossRef]
  12. Papavinasam, S. Corrosion Control in the Oil and Gas Industry, 1st ed.; Gulf Professional Publishing, Ed.; Elsevier: Houston, TX, USA, 2014. [Google Scholar] [CrossRef]
  13. American Petroleum Institute. API 5L Specifications for Line Pipe; American Petroleum Institute API: Houston, TX, USA, 2007. [Google Scholar]
  14. Aminul Islam, M.; Farhat, Z.N.; Ahmed, E.M.; Alfantazi, A.M. Erosion Enhanced Corrosion and Corrosion Enhanced Erosion of API X-70 Pipeline Steel. Wear 2013, 302, 1592–1601. [Google Scholar] [CrossRef]
  15. Hu, X.; Neville, A. The Electrochemical Response of Stainless Steels in Liquid–Solid Impingement. Wear 2005, 258, 641–648. [Google Scholar] [CrossRef]
  16. Okonkwo, P.C.; Mohamed, A.M.A. Erosion-Corrosion in Oil and Gas Industry: A Review. Int. J. Metall. Mater. Sci. Eng. 2014, 4, 7–28. [Google Scholar]
  17. Hu, X.; Neville, A. CO2 Erosion–Corrosion of Pipeline Steel (API X65) in Oil and Gas Conditions—A Systematic Approach. Wear 2009, 267, 2027–2032. [Google Scholar] [CrossRef]
  18. Ejbouh, A.; Ech-chebab, A.; Galai, M.; Lachhab, R.; Benqlilou, H.; Ebn Touhami, M. Effects of Fly Ash and Simulation of the Natural Hot and Dry Climate of the Moroccan Desert Region on the Durability of Prestressed Concrete Cylinder Pipes. J. Pipeline Syst. Eng. Pract. 2022, 13. [Google Scholar] [CrossRef]
  19. Ejbouh, A.; Ech-chebab, A.; Galai, M.; Hassi, S.; Benqlilou, H.; Touhami, M.E. Calcined Clay Process for Durability Performance of Concrete Pipe in Simulated Semi-Arid Area in Morocco. Mater. Today Proc. 2022, 58, 1403–1407. [Google Scholar] [CrossRef]
  20. Ech-chebab, A.; Ejbouh, A.; Galai, M.; Hassi, S.; Berrami, K.; Ebn Touhami, M. Assessing the Fly Ash Effect on the Durability of Reinforced Concrete of Water Treatment Tanks Exposed to Coagulating Ferric Chloride by an Electrochemical Process. J. Bio Tribo Corros. 2021, 7, 75. [Google Scholar] [CrossRef]
  21. Galai, M.; Rbaa, M.; Ouakki, M.; Guo, L.; Dahmani, K.; Nouneh, K.; Briche, S.; Lakhrissi, B.; Dkhireche, N.; Ebn Touhami, M. Effect of Alkyl Group Position on Adsorption Behavior and Corrosion Inhibition of New Naphthol Based on 8-Hydroxyquinoline: Electrochemical, Surface, Quantum Calculations and Dynamic Simulations. J. Mol. Liq. 2021, 335, 116552. [Google Scholar] [CrossRef]
  22. Campos, I.; Bautista, O.; Ramírez, G.; Islas, M.; de La Parra, J.; Zúñiga, L. Effect of Boron Paste Thickness on the Growth Kinetics of Fe2B Boride Layers during the Boriding Process. Appl. Surf. Sci. 2005, 243, 429–436. [Google Scholar] [CrossRef]
  23. Sinha, A.K. Heat Treating-Boriding (Boronizing) of Steels. In Metals Handbook; ASM International, Ed.; ASM International: Almere, The Netherlands, 1991; Volume 4, pp. 978–999. [Google Scholar]
  24. von Matuschka, M.G. Boronizing, 1st ed.; Carl Hanser: Munich, Germany, 1980. [Google Scholar]
  25. Hernández-Sánchez, E.; Velázquez, J.C. Kinetics of Growth of Iron Boride Layers on a Low-Carbon Steel Surface. Lab. Unit Oper. Exp. Methods Chem. Eng. 2018, 10. [Google Scholar] [CrossRef] [Green Version]
  26. Milinović, A.; Krumes, D. An Investigation of Boride Layers’ Growth Kinetics on Carbon Steels. Tech. Gaz. 2012, 19, 27–31. [Google Scholar]
  27. Velázquez-Altamirano, J.C.; Torres-Avila, I.P.; Teran-Méndez, G.; Capula-Colindres, S.I.; Cabrera-Sierra, R.; Carrera-Espinoza, R.; Hernández-Sánchez, E. A Stochastic Model and Investigation into the Probability Distribution of the Thickness of Boride Layers Formed on Low-Carbon Steel. Coatings 2019, 9, 756. [Google Scholar] [CrossRef] [Green Version]
  28. Ruiz-Trabolsi, P.A.; Velázquez, J.C.; Orozco-Álvarez, C.; Carrera-Espinoza, R.; Yescas-Hernández, J.A.; González-Arévalo, N.E.; Hernández-Sánchez, E. Kinetics of the Boride Layers Obtained on AISI 1018 Steel by Considering the Amount of Matter Involved. Coatings 2021, 11, 259. [Google Scholar] [CrossRef]
  29. González-Arévalo, N.E.; Velázquez, J.C.; Díaz-Cruz, M.; Cervantes-Tobón, A.; Terán, G.; Hernández-Sanchez, E.; Capula-Colindres, S. Influence of aging steel on pipeline burst pressure prediction and its impact on failure probability estimation. Eng. Fail. Anal. 2021, 120, 104950. [Google Scholar] [CrossRef]
  30. Projectmaterials. API 5L Pipes for Pipelines Explained. Available online: https://blog.projectmaterials.com/pipes/api-5l-pipe (accessed on 1 December 2022).
  31. Ozbek, I.; Bindal, C. Kinetics of Borided AISI M2 High Speed Steel. Vacuum 2011, 86, 391–397. [Google Scholar] [CrossRef]
  32. Ozdemir, O.; Omar, M.A.; Usta, M.; Zeytin, S.; Bindal, C.; Ucisik, A.H. An Investigation on Boriding Kinetics of AISI 316 Stainless Steel. Vacuum 2008, 83, 175–179. [Google Scholar] [CrossRef]
  33. Trautmann, F. Borideing with Duferrit DURBORIT. Technical Information. H.E.F. Group. Available online: http://hef.mx/wpcontent/uploads/2017/06/Catalogo-de-sales-HEF-Durferrit.pdf (accessed on 1 December 2022).
  34. Hernández-Sánchez, E.; Domínguez-Galicia, Y.M.; Orozco-Álvarez, C.; Carrera-Espinoza, R.; Herrera-Hernández, H.; Velázquez, J.C. A Study on the Effect of the Boron Potential on the Mechanical Properties of the Borided Layers Obtained by Boron Diffusion at the Surface of AISI 316L Steel. Adv. Mater. Sci. Eng. 2014, 2014, 249174. [Google Scholar] [CrossRef]
  35. Chino-Ulloa, A.; Ruiz-Trabolsi, P.A.; Torres-Avila, I.P.; Orozco-Álvarez, C.; Tadeo-Rosas, R.; Velázquez, J.C.; Hernández-Sánchez, E. Kinetics and Mechanical Characterization of Hard Layers Obtained by Boron Diffusion in 80/20 Nickel–Chromium Alloy. Coatings 2022, 12, 1387. [Google Scholar] [CrossRef]
  36. Ruiz-Trabolsi, P.A.; Chino-Ulloa, A.; Miranda-Hernández, J.G.; Tadeo-Rosas, R.; Carrera-Espinoza, R.; Velázquez, J.C.; Hernández-Sánchez, E. A Comparative Analysis of the Tribological Behavior of Hard Layers Obtained by Three Different Hardened-Surface Processes on the Surface of AISI 4140 Steel. Crystals 2022, 12, 298. [Google Scholar] [CrossRef]
  37. Oliver, W.C.; Pharr, G.M. An Improved Technique for Determining Hardness and Elastic Modulus Using Load and Displacement Sensing Indentation Experiments. J. Mater. Res. 1992, 7, 1564–1583. [Google Scholar] [CrossRef]
  38. ISO 14577-1; Metallic Materials—Instrumented Indentation Test for Hardness and Materials Parameters—Part 1: Test Method. ISO: Geneva, Switzerland, 2002.
  39. Lawn, B.R.; Evans, A.G.; Marshall, D.B. Elastic/Plastic Indentation Damage in Ceramics: The Median/Radial Crack System. J. Am. Ceram. Soc. 1980, 63, 574–581. [Google Scholar] [CrossRef]
  40. ASTM E112-13; Standard Test Methods for Determining Average Grain Size. ASTM International: Conshohocken, PA, USA, 2013.
  41. Zhang, D.; Li, Y.; Du, X.; Fan, H.; Gao, F. Microstructure and Tribological Performance of Boride Layers on Ductile Cast Iron under Dry Sliding Conditions. Eng. Fail. Anal. 2022, 134, 106080. [Google Scholar] [CrossRef]
  42. Milinović, A.; Marušić, V.; Konjatić, P.; Berić, N. Effect of Carbon Content and Boronizing Parameters on Growth Kinetics of Boride Layers Obtained on Carbon Steels. Materials 2022, 15, 1858. [Google Scholar] [CrossRef]
  43. Sen, S.; Sen, U.; Bindal, C. The Growth Kinetics of Borides Formed on Boronized AISI 4140 Steel. Vacuum 2005, 77, 195–202. [Google Scholar] [CrossRef]
  44. Genel, K.; Ozbek, I.; Bindal, C. Kinetics of Boriding of AISI W1 Steel. Mater. Sci. Eng. A 2003, 347, 311–314. [Google Scholar] [CrossRef]
  45. Castillo, E.; Hadi, A.S.; Balakrishnan, N.; Sarabia, J.M. Extreme Value and Related Models with Applications in Engineering and Science; John Wiley & Sons: Hoboken, NJ, USA, 2005. [Google Scholar]
  46. Engineering Statistics Handbook. Kolmogorov-Smirnov Goodness-of-Fit Test. Available online: https://www.itl.nist.gov/div898/handbook/eda/section3/eda35g.htm (accessed on 21 December 2022).
  47. Hernández Sanchez, E. Propiedades Mecánicas de Aceros Borurados AISI 1018 Evaluadas por Indentación a Escala Micro y Nanométrica; Instituto Politecnico Nacional: Mexico City, Mexico, 2011. [Google Scholar]
  48. Gencer, Y. Influence of Manganese on Pack Boriding Behaviour of Pure Iron. Surf. Eng. 2011, 27, 634–638. [Google Scholar] [CrossRef]
  49. Toma, D.; Harksen, S.; Niklasch, D.; Mahn, D.; Koka, A. Development of X90 and X100 Steel Grades for Seamless Linepipe Products. In Materials and Joining; Risk and Reliability; American Society of Mechanical Engineers: Calgary, AB, Canada, 2014; Volume 3. [Google Scholar] [CrossRef]
  50. Harksen, S.; Lischewski, I.; Schneider, A.; Schmidt, T.; Mahn, D. A Modern Methodology of Materials Development for High Toughness Seamless Line Pipe Products for Offshore Applications. In The Twenty-Third International Offshore and Polar Engineering Conference; SPE International: Anchorage, Alaska, 2013. [Google Scholar]
  51. Shin, S.Y.; Hwang, B.; Lee, S.; Kim, N.J.; Ahn, S.S. Correlation of Microstructure and Charpy Impact Properties in API X70 and X80 Line-Pipe Steels. Mater. Sci. Eng. A 2007, 458, 281–289. [Google Scholar] [CrossRef]
  52. Sohn, S.S.; Han, S.Y.; Bae, J.; Kim, H.S.; Lee, S. Effects of Microstructure and Pipe Forming Strain on Yield Strength before and after Spiral Pipe Forming of API X70 and X80 Linepipe Steel Sheets. Mater. Sci. Eng. A 2013, 573, 18–26. [Google Scholar] [CrossRef]
  53. Sen, U.; Sen, S.; Yilmaz, F. Structural Characterization of Boride Layer on Boronized Ductile Irons. Surf. Coat. Technol. 2004, 176, 222–228. [Google Scholar] [CrossRef]
  54. Jiang, J.; Wang, Y.; Zhong, Q.; Zhou, Q.; Zhang, L. Preparation of Fe2B Boride Coating on Low-Carbon Steel Surfaces and Its Evaluation of Hardness and Corrosion Resistance. Surf. Coat. Technol. 2011, 206, 473–478. [Google Scholar] [CrossRef]
  55. Campos-Silva, I.; Ortiz-Domínguez, M.; Keddam, M.; López-Perrusquia, N.; Carmona-Vargas, A.; Elías-Espinosa, M. Kinetics of the Formation of Fe2B Layers in Gray Cast Iron: Effects of Boron Concentration and Boride Incubation Time. Appl. Surf. Sci. 2009, 255, 9290–9295. [Google Scholar] [CrossRef]
Figure 1. Boriding process flow chart.
Coatings 13 00298 g001
Figure 2. Methodology used for the layer thickness measurement (a1–an are the measurements of the layer thickness).
Coatings 13 00298 g002
Figure 3. Cross-section of the samples exposed to the different treatment conditions, 1–3 correspond to samples exposed to 850 °C for 2, 4 and 6 h respectively, 4–6 correspond to samples exposed to 900 °C for 2, 4 and 6 h respectively. 7–9 correspond to samples exposed to 950 °C for 2, 4 and 6 h respectively and 10–12 correspond to samples exposed to 2, 4 and 6 h respectively (see Table 2).
Coatings 13 00298 g003
Figure 4. Behavior of the layer thickness (a) and activation energy (b).
Coatings 13 00298 g004
Figure 5. Contour map that represents the behavior of the boride layers obtained on the surface of an API 5L grade B steel.
Coatings 13 00298 g005
Figure 6. Evolution of the boride layer thickness for different treatment times at 850 °C and compared with the fitted probability density function of the Generalized Extreme Value Distribution.
Coatings 13 00298 g006
Figure 7. Evolution of the boride layer thickness for different treatment times at 1000 °C and compared with the fitted probability density function of the Generalized Extreme Value Distribution.
Coatings 13 00298 g007
Figure 8. SEM images of samples exposed to (a) 850 °C for 2 h and (b) 1000 °C for 6 h.
Coatings 13 00298 g008
Figure 9. XRD patterns for the samples exposed to 850 °C during boriding process.
Coatings 13 00298 g009
Figure 10. XRD patterns for the samples exposed to 900 °C during boriding process.
Coatings 13 00298 g010
Figure 11. XRD patterns for the samples exposed to 950 °C during boriding process.
Coatings 13 00298 g011
Figure 12. XRD patterns for the samples exposed to 1000 °C during boriding process.
Coatings 13 00298 g012
Figure 13. Hardness behavior (a) and elastic modulus behavior (b) of the boride layers obtained to 6 h and 850, 900, 950 and 1000 °C.
Coatings 13 00298 g013
Figure 14. Microstructure of the studied API 5L grade B steel specimen.
Coatings 13 00298 g014
Figure 15. Micrographs of borided pipeline steel samples at (a) 850 °C, (b) 900 °C, (c) 950 °C, and (d) 1000 °C for 6 h.
Coatings 13 00298 g015
Figure 16. Average grain area evolution as a function of temperature and time. The surface represents the model obtained in the regression analysis.
Coatings 13 00298 g016
Table 1. Nominal composition of the API 5L grade B pipeline steel.
ElementContent (% Weight)
C0.28
Cr0.069
Cu0.155
Nb0.002
Ti0.003
S0.006
P0.003
Mn0.888
Ni0.04
Mo0.039
Si0.214
FeBalance
Table 2. Numerical order of the samples as a function of the treatment conditions.
Sample NumberTreatment Condition
Time (h)Temperature (°C)
0Non-treated sample
12-
24850
36-
42-
54900
66-
72-
84950
96-
102-
1141000
126-
Table 3. Average layer thickness as a function of the treatment parameters (µm).
Temperature (°C)
Time (h)8509009501000
226.650.7575.75103
446.4980.76117.28158.38
670.0697.89151.65213.91
Table 4. Standard deviation of boride layers’ thickness as a function of the treatment parameters (µm).
Temperature (°C)
Time (h)8509009501000
26.926.299.3316.38
49.7313.5114.8119.75
613.8819.2317.9516.15
Table 5. Coefficient of variation for boride layers’ thickness as a function of the treatment parameters (µm).
Temperature (°C)
Time (h)8509009501000
23.848.068.116.28
44.775.977.918.01
65.045.098.4413.24
Table 6. Constant of parabolic growth values and ( K 0 ) for the treatment conditions.
Temperature (°C)K (m2/s)K0 (m2/s)R
8502.917 × 10−132.7235 × 10−50.9897
9004.866 × 10−132.7235 × 10−50.9983
9501.199 × 10−122.7235 × 10−50.9947
10002.441 × 10−122.7235 × 10−50.9694
Table 7. Comparison of the data obtained by both experiment and model.
850 °C900 °C950 °C1000 °C
Time (s)Layer ThicknessLayer ThicknessLayer ThicknessLayer Thickness
(µm)(µm)(µm)(µm)
MeasuredCalculatedError (%)MeasuredCalculatedError (%)MeasuredCalculatedError (%)MeasuredCalculatedError (%)
720026.643.47263.42950.7564.42526.94675.75128.96970.255103128.96925.212
14,40046.4961.47932.24180.7691.11112.817117.28130.75111.487158.38182.38915.159
21,60070.0675.2967.47497.89111.58813.993151.65160.1375.597213.91223.3804.427
Table 8. Layer thicknesses based on the MODE values.
Temperature (°C)
Time (h)8509009501000
229.5157.3877.05110.66
441.8086.07140.16167.21
655.74106.65150.00218.03
Table 9. Values of ( K ), ( Q ) and ( K 0 ) as a function of the MODE data.
TemperatureKK0Q
(°C)(m2s−1)(m2s−1)(kJmol−1)
8501.5527 × 10−136.12958 × 10−5181.711
9005.5988 × 10−13
9502.4509 × 10−12
10001.1502 × 10−12
Table 10. Comparison of the data obtained by both experiment and model taking into account MODE values of each condition (see Equation (7)).
850 °C900 °C950 °C1000 °C
Time (s) Layer ThicknessLayer ThicknessLayer ThicknessLayer Thickness
(µm)(µm)(µm)(µm)
MeasuredCalculatedError (%)MeasuredCalculatedError (%)MeasuredCalculatedError (%)MeasuredCalculatedError (%)
720029.5081939.48433.80957.3859.7804.18377.0587.49013.550110.66124.27012.299
14,40041.8032755.83933.57786.0784.5401.778140.16123.73011.722167.21175.7505.107
21,60055.737768.38922.698106.56103.5402.834150151.5401.027218.03215.2501.275
Table 11. Location parameter for location parameter ( α ) of a GEVD (µm).
Temperature (°C)
Time (h)8509009501000
224.0548.8772.8298.16
443.4677.34113.01151.65
665.5793.74147.29209.52
Table 12. Scale parameter for location parameter ( β ) of a GEVD (µm).
Temperature (°C)
Time (h)8509009501000
26.946.679.6017.23
410.2814.5815.9820.25
614.5821.1919.5317.02
Table 13. Shape parameter for location parameter ( k )- of a GEVD.
Temperature (°C)
Time (h)8509009501000
2−0.26−0.39−0.36−0.40
4−0.37−0.48−0.42−0.41
6−0.35−0.56−0.500.41
Table 14. Values of the hardness and elastic modulus of the boride layers measured by instrumented indentation.
Treatment Temperature
(°C)
Hardness
(GPa)
Elastic Modulus
(GPa)
Contact Depth
(hc)
(µm)
Non-treated specimen2.68 ± 0.345212.04 ± 16.222.33 ± 0.12
85012.144 ± 2.17238.94 ± 12.281.355 ± 0.105
90013.22 ± 3.86236.83 ± 18.941.37 ± 0.326
95013.65 ± 3.98278.37 ± 32.311.28 ± 0.222
100014.12 ± 3.802264.30 ± 43.111.27 ± 0.144
Table 15. Grain size estimations in the three directions for API 5L grade B steel.
FaceASTM Number Gran Size
xy8.48
yz8.75
xz8.79
Table 16. ASTM grain size estimations for specimens after different conditions of boriding process.
Temperature
(°C)
Time
(h)
ASTM Number Grain Size
85028.8822
48.6813
68.5251
90028.4095
48.0138
67.4655
95027.1011
46.5022
66.1856
100026.0942
45.799
65.7665
Table 17. Results of regression analysis.
Coefficient
Parameter
z 0 a b c d f R2
43,352.58−101.35−856.735.94 × 10−20.621.030.97
Table 18. Spearman correlation coefficient between the variables of interest.
Variable T t
g a 0.9270.207
T 10.001
Disclaimer/Publisher’s Note: The statements, opinions and data contained in all publications are solely those of the individual author(s) and contributor(s) and not of MDPI and/or the editor(s). MDPI and/or the editor(s) disclaim responsibility for any injury to people or property resulting from any ideas, methods, instructions or products referred to in the content.