Abstract
Potato starch wastewater, a byproduct of potato processing, is an escalating environmental concern due to its high concentrations of COD (chemical oxygen demand), ammonia nitrogen, and total phosphorus (TP). Addressing this challenge, this research introduced a novel method combining chitosan-modified biochar film (CBC) adsorption with subsequent ultrafiltration. SEM (scanning electron microscope), FTIR (Fourier transform infrared spectral), XRD (X-ray diffractometer), and BET (specific surface area) analyses validated CBC’s enhanced surface characteristics, confirming successful chitosan (CS) film impregnation. CBC exhibited superior adsorption capacities, especially 40%wt-CBC, optimizing COD removal at 79.8%, ammonia nitrogen at 93.3%, and TP at 91.2%. Kinetic studies associated the adsorption process with a pseudo-second-order model, highlighting chemical adsorption. Additionally, the Langmuir isotherm model suggested monolayer adsorption with no inter-adsorbate interactions. The treated effluent, post adsorption, was directed through an ultrafiltration membrane, ensuring water quality suitable for reuse. This integrative treatment not only offers an effective solution for potato starch wastewater management but also underscores the potential for sustainable water resource recovery in the food processing sector.
1. Introduction
Potato starch processing is an indispensable industry, given the burgeoning demand for starch and its derivatives across numerous sectors, from culinary delights to the intricate realms of pharmaceuticals [1]. The industry’s massive output, however, is intertwined with the production of a substantial amount of wastewater—potato starch wastewater (PSWW). Characterized by high concentrations of organic compounds like carbohydrates, proteins, and residual starch, PSWW is an environmental predicament [2,3]. Untreated or inadequately treated PSWW contributes to water pollution, jeopardizing aquatic life, destabilizing ecosystems, and contaminating potable water sources. This has brought the efficiency and selectivity of membranes, especially those tailored from specific materials, into focus [4].
Historically, PSWW treatment revolved around conventional methodologies: biological processes, chemical oxidations, or physicochemical strategies [5]. While some of these have shown efficacy, they often grapple with incomplete treatment or residual generation requiring subsequent procedures [6]. Of late, the research trajectory has tilted towards integrating multiple techniques, optimizing the strengths of each. One such promising avenue is the utilization of biochar (BC) as an adsorbent, its efficacy further amplified when modified with chitosan (CS) film [7]. Notably, when these adsorption processes are paired with membrane technologies, especially those membranes fabricated or modified using the developed materials, the results are profoundly enhanced [8]. The selective nature of these membranes, combined with the adsorptive capacities of the developed materials, offers a promising solution to the PSWW challenge [9].
In the ensuing discourse, we examine the harmonized performance of CS-enhanced BC film adsorption meshed with advanced membrane filtration techniques for PSWW treatment [10]. Preliminary insights suggest that this combined strategy not only ensures the effective sequestration of organic pollutants but also realigns with water resource conservation benchmarks, facilitating potential reuse [11]. Embracing this multifaceted approach could redefine wastewater management strategies within the potato starch industry [12], ushering in an era of environmental sustainability interlinked with optimized material and membrane technologies.
2. Materials and Methods
2.1. Sample Preparation
2.1.1. Preparation of Corn Stover BC
Agricultural residues, namely corn stover and leaves sourced from campus farms, were initially cleansed with deionized water. After drying at 50 °C, the material was subjected to fine grinding using an FTT-2500T pulverizer, ensuring that the corn stover powder could pass through a 100-mesh sieve. Subsequently, the powder was preserved in a desiccator for further utilization. An aliquot of the pulverized corn stover was sealed in aluminum foil and placed inside an SK2-2-13 tubular furnace. Under a protective nitrogen atmosphere, the sample was uniformly heated to 700 °C and maintained at this temperature for pyrolysis over a duration of 1 h. After completion, the BC was cooled, milled once again, yielding the final product of corn stover BC.
2.1.2. Preparation of CS/BC Film
Initially, CS with a deacetylation degree of 95% was weighed into five beakers, with the respective masses detailed in Table 1, followed by the addition of 250 mL of a 2% acetic acid solution to each beaker. Subsequently, corn stover BC was incorporated into the CS/acetic acid mixture and stirred at 25 °C at 200 rpm for 30 min. To adjust the pH to 8, 2M NaOH was dropwise added, which was identified as the optimal condition [13]. Thereafter, the mixture was allowed to stand at room temperature for 12 h, after which it was rinsed with ultrapure water to remove any residual NaOH. Ultimately, the composite was dried at 70 °C and then ground to the desired granularity, resulting in chitosan/biochar film composites (CBC) with varying CS film loadings (10%, 20%, 30%, 40%, and 50%). Prior to usage, the materials were stored in a desiccator.

Table 1.
Dosage of CS and BC.
2.2. Potato Starch Wastewater Preparation
Potato starch wastewater was synthesized under laboratory conditions. Initially, potatoes were procured from a local supermarket, thoroughly washed, peeled, and then cut into small pieces. These pieces were then subjected to a juicer, utilizing a 5:1 mass ratio of distilled water to potatoes. The resultant filtrate was subsequently passed through six layers of gauze to obtain the potato starch wastewater [14,15]. The specific water quality parameters of the wastewater are presented in Table 2.
Table 2.
Analysis of the components of potato starch wastewater.
2.3. Determination of COD, NH3-N, Total Phosphorus (TP)
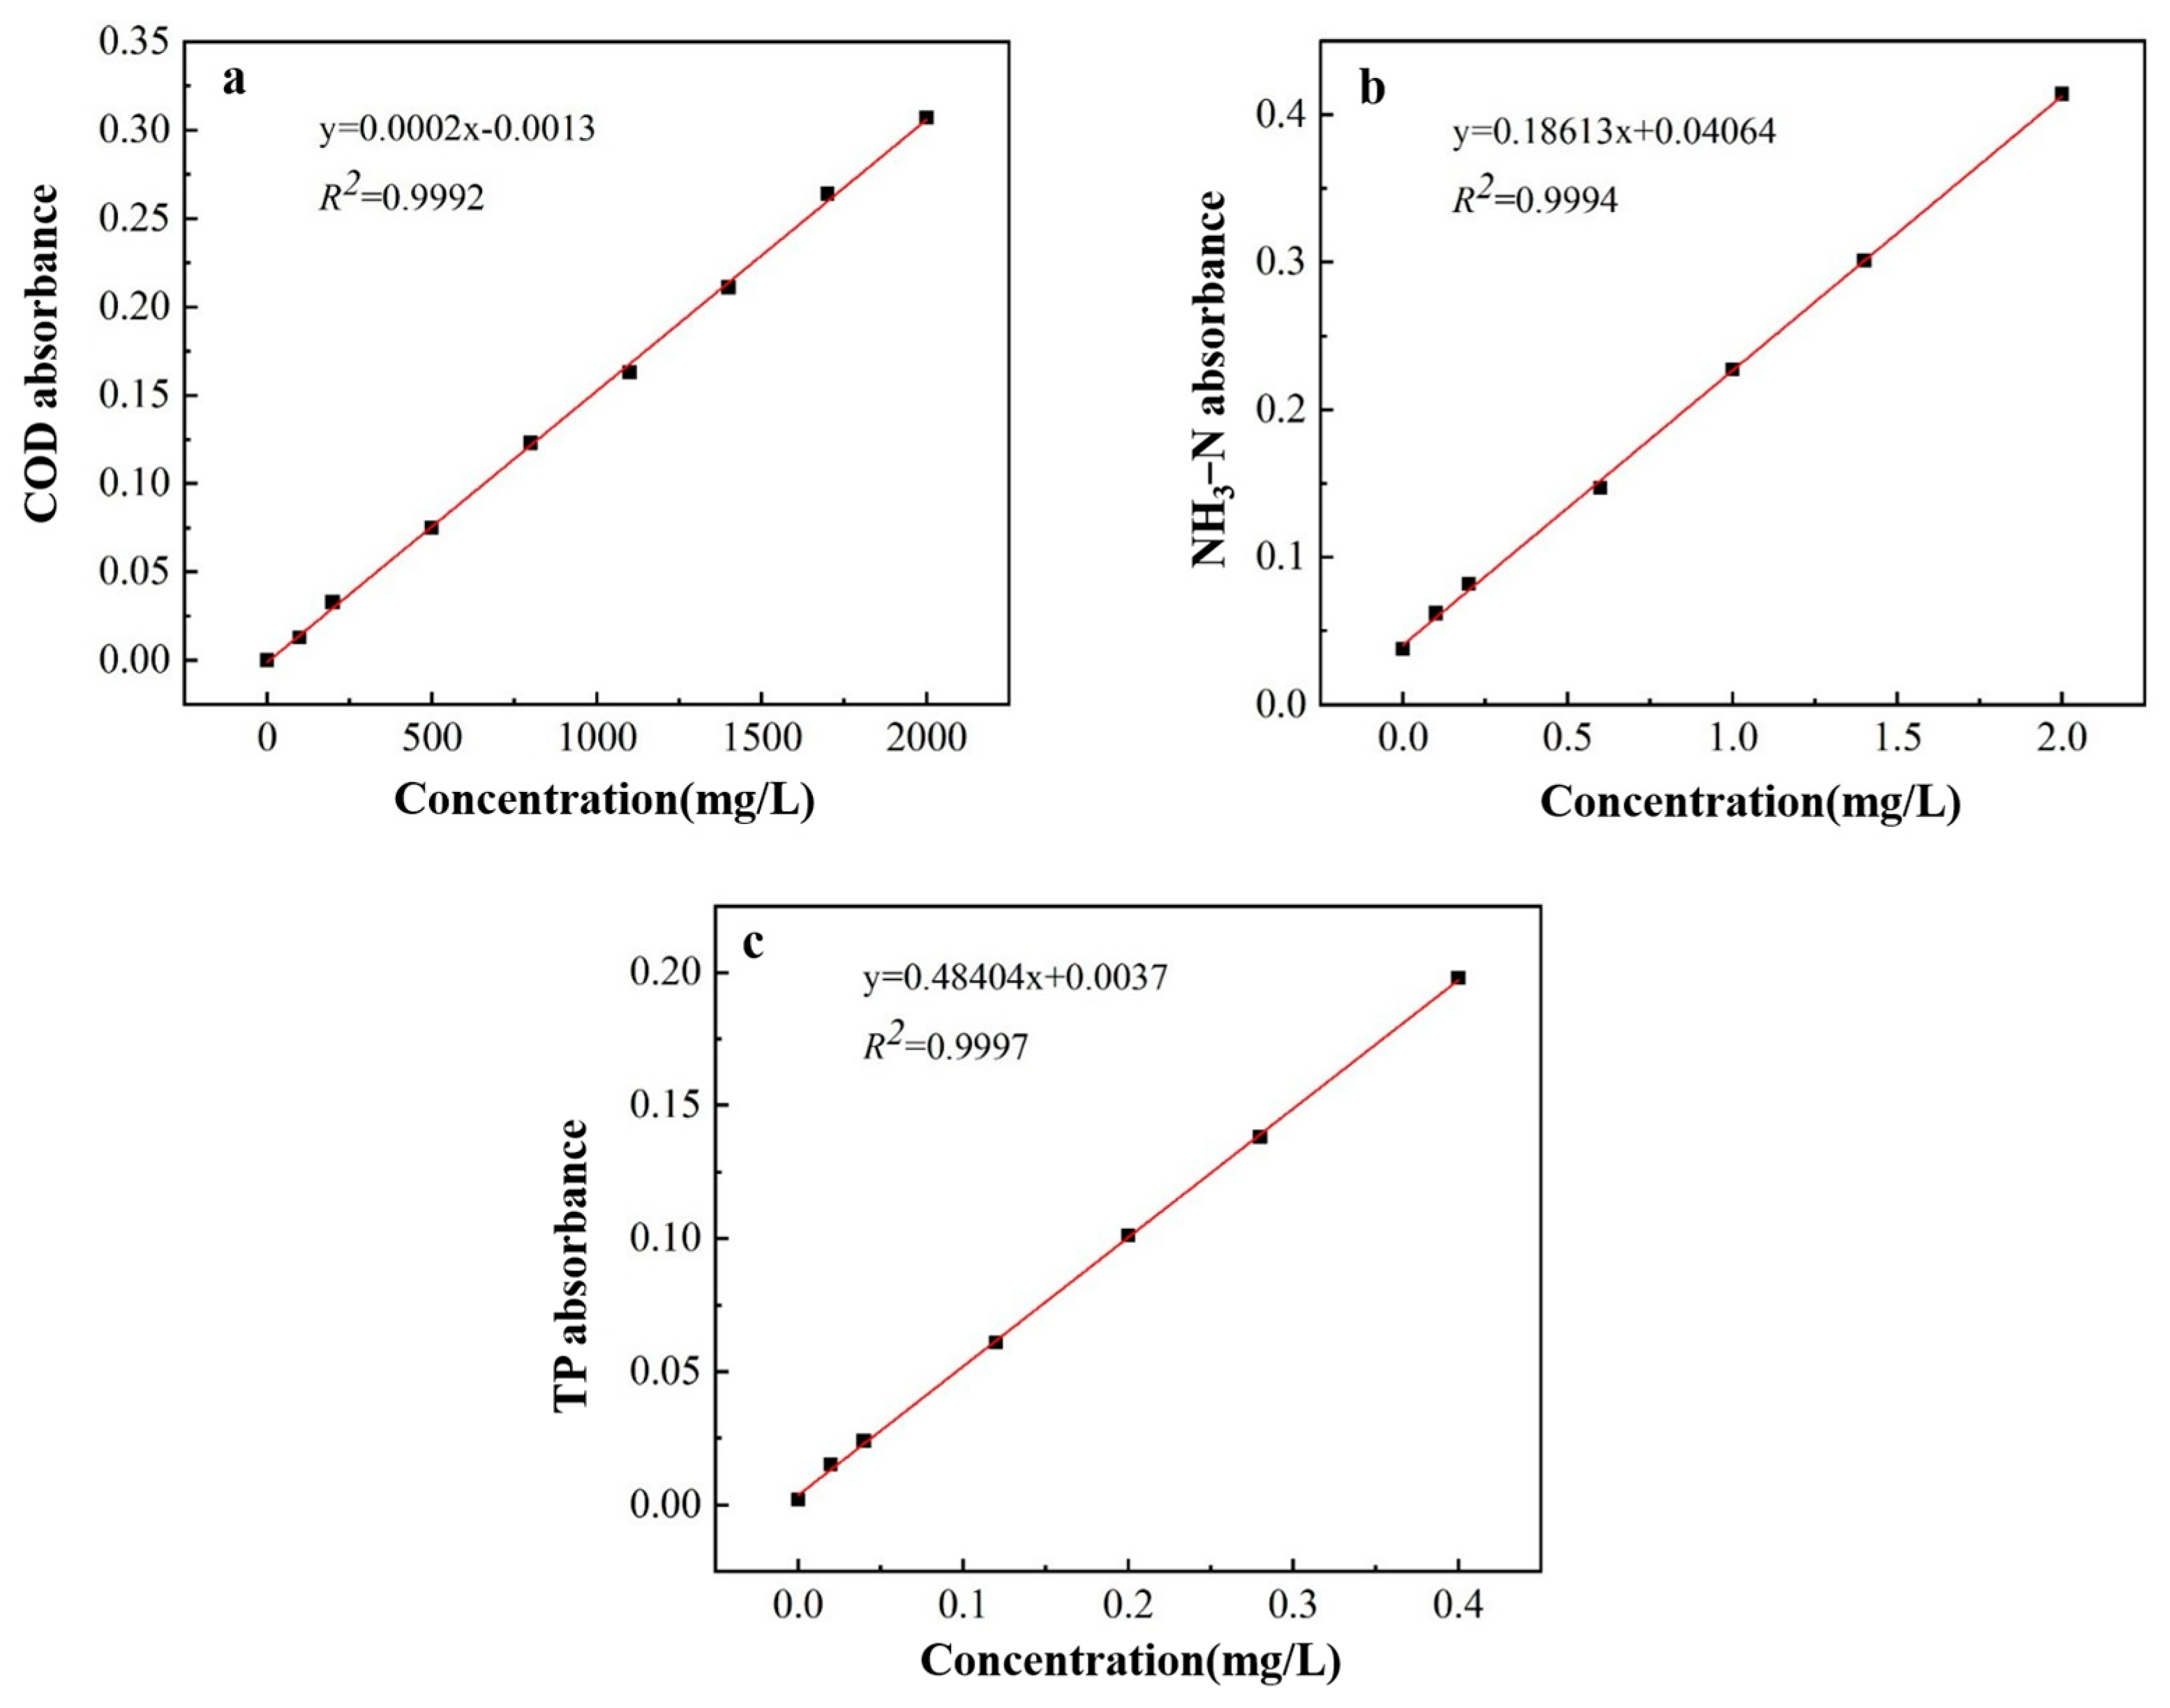
Utilizing Nessler’s reagent spectrophotometry for the quantification of ammonia nitrogen content, the ammonium molybdate spectrophotometric method for determining TP levels, and spectrophotometry for measuring the concentration of COD, standard curves were constructed as depicted in Figure 1.
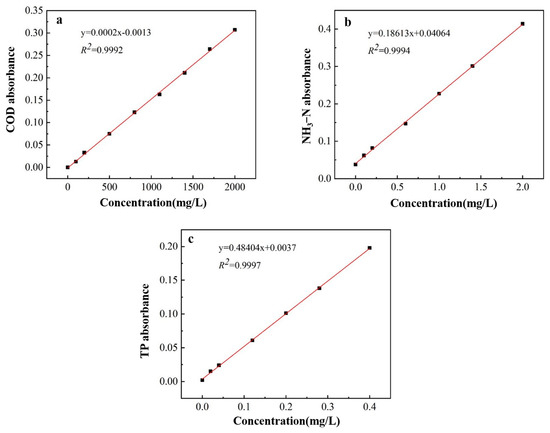
Figure 1.
Standard curve of COD (a), NH3−N (b), and TP (c).
2.4. Material Characterization Method and Principle
2.4.1. Scanning Electron Microscope Analysis (SEM)
A designated amount of chitosan quaternary ammonium salt (HTCC) and CS film samples were placed on a sample holder and sputter-coated with gold to enhance their conductivity. Subsequently, the specimens were examined using a Hitachi Regulus8100 SEM (Hitachi, Tokyo, Japan). The operational voltage for the analysis was set at 20 KV.
2.4.2. Fourier Transform Infrared Spectral Analysis (FTIR)
A designated amount of HTCC and CS film samples were dried and ground. Subsequently, under constant temperature conditions, pellets were prepared using potassium bromide. The functional groups of both samples were then characterized using a VERTEX 80 FTIR (Bruker, Billerica, MA, USA).
2.4.3. X-ray Diffractometer (XRD)
A designated amount of HTCC and CS film samples were dried and ground, and subsequently placed on a glass slide. Characterization was then carried out using a Bruker D8 Advance XRD (Bruker, Billerica, MA, USA). The testing conditions were set with a scanning speed of 4°·min−1 and a 2θ range of 5–60°.
2.4.4. Specific Surface Area Analysis (BET)
The prepared samples, namely BC, 10%wt-CBC, 20%wt-CBC, 30%wt-CBC, 40%wt-CBC, and 50%wt-CBC, were analyzed using a Micromeritics ASAP2020 Fully Automatic Surface Area and Porosity Analyzer (Micromeritics, Norcross, GE, USA) to determine their specific surface area, pore volume, and pore size distribution.
2.5. Adsorption Experiments
2.5.1. Adsorption Kinetics Experiment
Adsorption kinetics offer a comprehensive method to delve into the relationship between adsorption rate and activation. They elucidate the temporal variations in the concentration of the adsorbate, establishing the foundational theory for the adsorption mechanism of the CS/BC film. This study employed the pseudo-first-order and pseudo-second-order kinetic models to investigate the adsorption behavior of CBC towards COD, ammonia nitrogen, and TP in solutions, fitting the experimental data accordingly.
The pseudo-first-order kinetic equation primarily captures the physical adsorption mechanism [15]. It outlines the influence of solution concentration and adsorption quantity on the adsorption rate, with the internal mass transfer resistance within particles being the significant limiting factor. The equation is described as
where:
represents the adsorption time (h);
denotes the adsorption amount of COD, ammonia nitrogen, and phosphorus at time t (mg/g);
signifies the equilibrium adsorption capacity for COD, ammonia nitrogen, and phosphorus (mg/g);
is the pseudo-first-order adsorption rate constant (1/min), indicating the rate of adsorption.
In this equation, a linear regression is performed with t as the x-axis and as the y-axis. The values of and are then derived from the intercept and slope of the regression line, respectively.
The chemical adsorption mechanism is primarily characterized using the pseudo-second-order kinetic equation [16]. Its linear expression is given by
where:
represents the adsorption time (h);
denotes the adsorption amount of COD, ammonia nitrogen, and phosphorus at time t (mg/g);
signifies the equilibrium adsorption capacity for COD, ammonia nitrogen, and phosphorus (mg/g);
is the pseudo-second-order adsorption rate constant (g/mg·min), indicating the rate of adsorption.
Using Equation (2), a linear regression is performed with t as the x-axis and as the y-axis. The values of and are then derived from the intercept and slope of the regression line, respectively.
2.5.2. Isothermal Adsorption Experiment
The adsorption isotherm model provides a detailed description of the adsorption process, allowing for a precise determination of whether the adsorption reaction is of a physical or chemical nature. By quantitatively processing and applying the adsorption isotherm model, we can gain deeper insights into and enhance the characteristics of adsorbents.
The Langmuir adsorption isotherm model predominantly describes monolayer adsorption, implying no interactions between adsorbed molecules. The equation is given by
where:
represents the equilibrium concentration of COD, ammonia nitrogen, and phosphorus in the solution (mg/L);
denotes the adsorption capacity at equilibrium for COD, ammonia nitrogen, and phosphorus (mg/g);
signifies the maximum theoretical adsorption capacity (mg/g);
is the Langmuir adsorption constant (L/mg), indicating the affinity of adsorption.
Using Equation (3), a non-linear regression is performed with as the x-axis and as the y-axis. The intercept and slope derived from this regression are used to calculate and , respectively.
The Freundlich adsorption isotherm model primarily represents multilayer adsorption. The model can be expressed by the equation
where:
stands for the equilibrium concentration of COD, ammonia nitrogen, and phosphorus in the solution (mg/L);
signifies the adsorption capacity at equilibrium for COD, ammonia nitrogen, and phosphorus (mg/g);
indicates the adsorption intensity (a higher value of implies superior adsorption performance);
is the Freundlich adsorption constant, related to the maximum adsorption capacity.
Using Equation (4), a non-linear regression is executed with on the x-axis and on the y-axis. The intercept and slope derived from this regression are utilized to determine the values of and , respectively.
3. Results and Discussion
3.1. Material Characterization Method and Principle
3.1.1. XRD Analysis
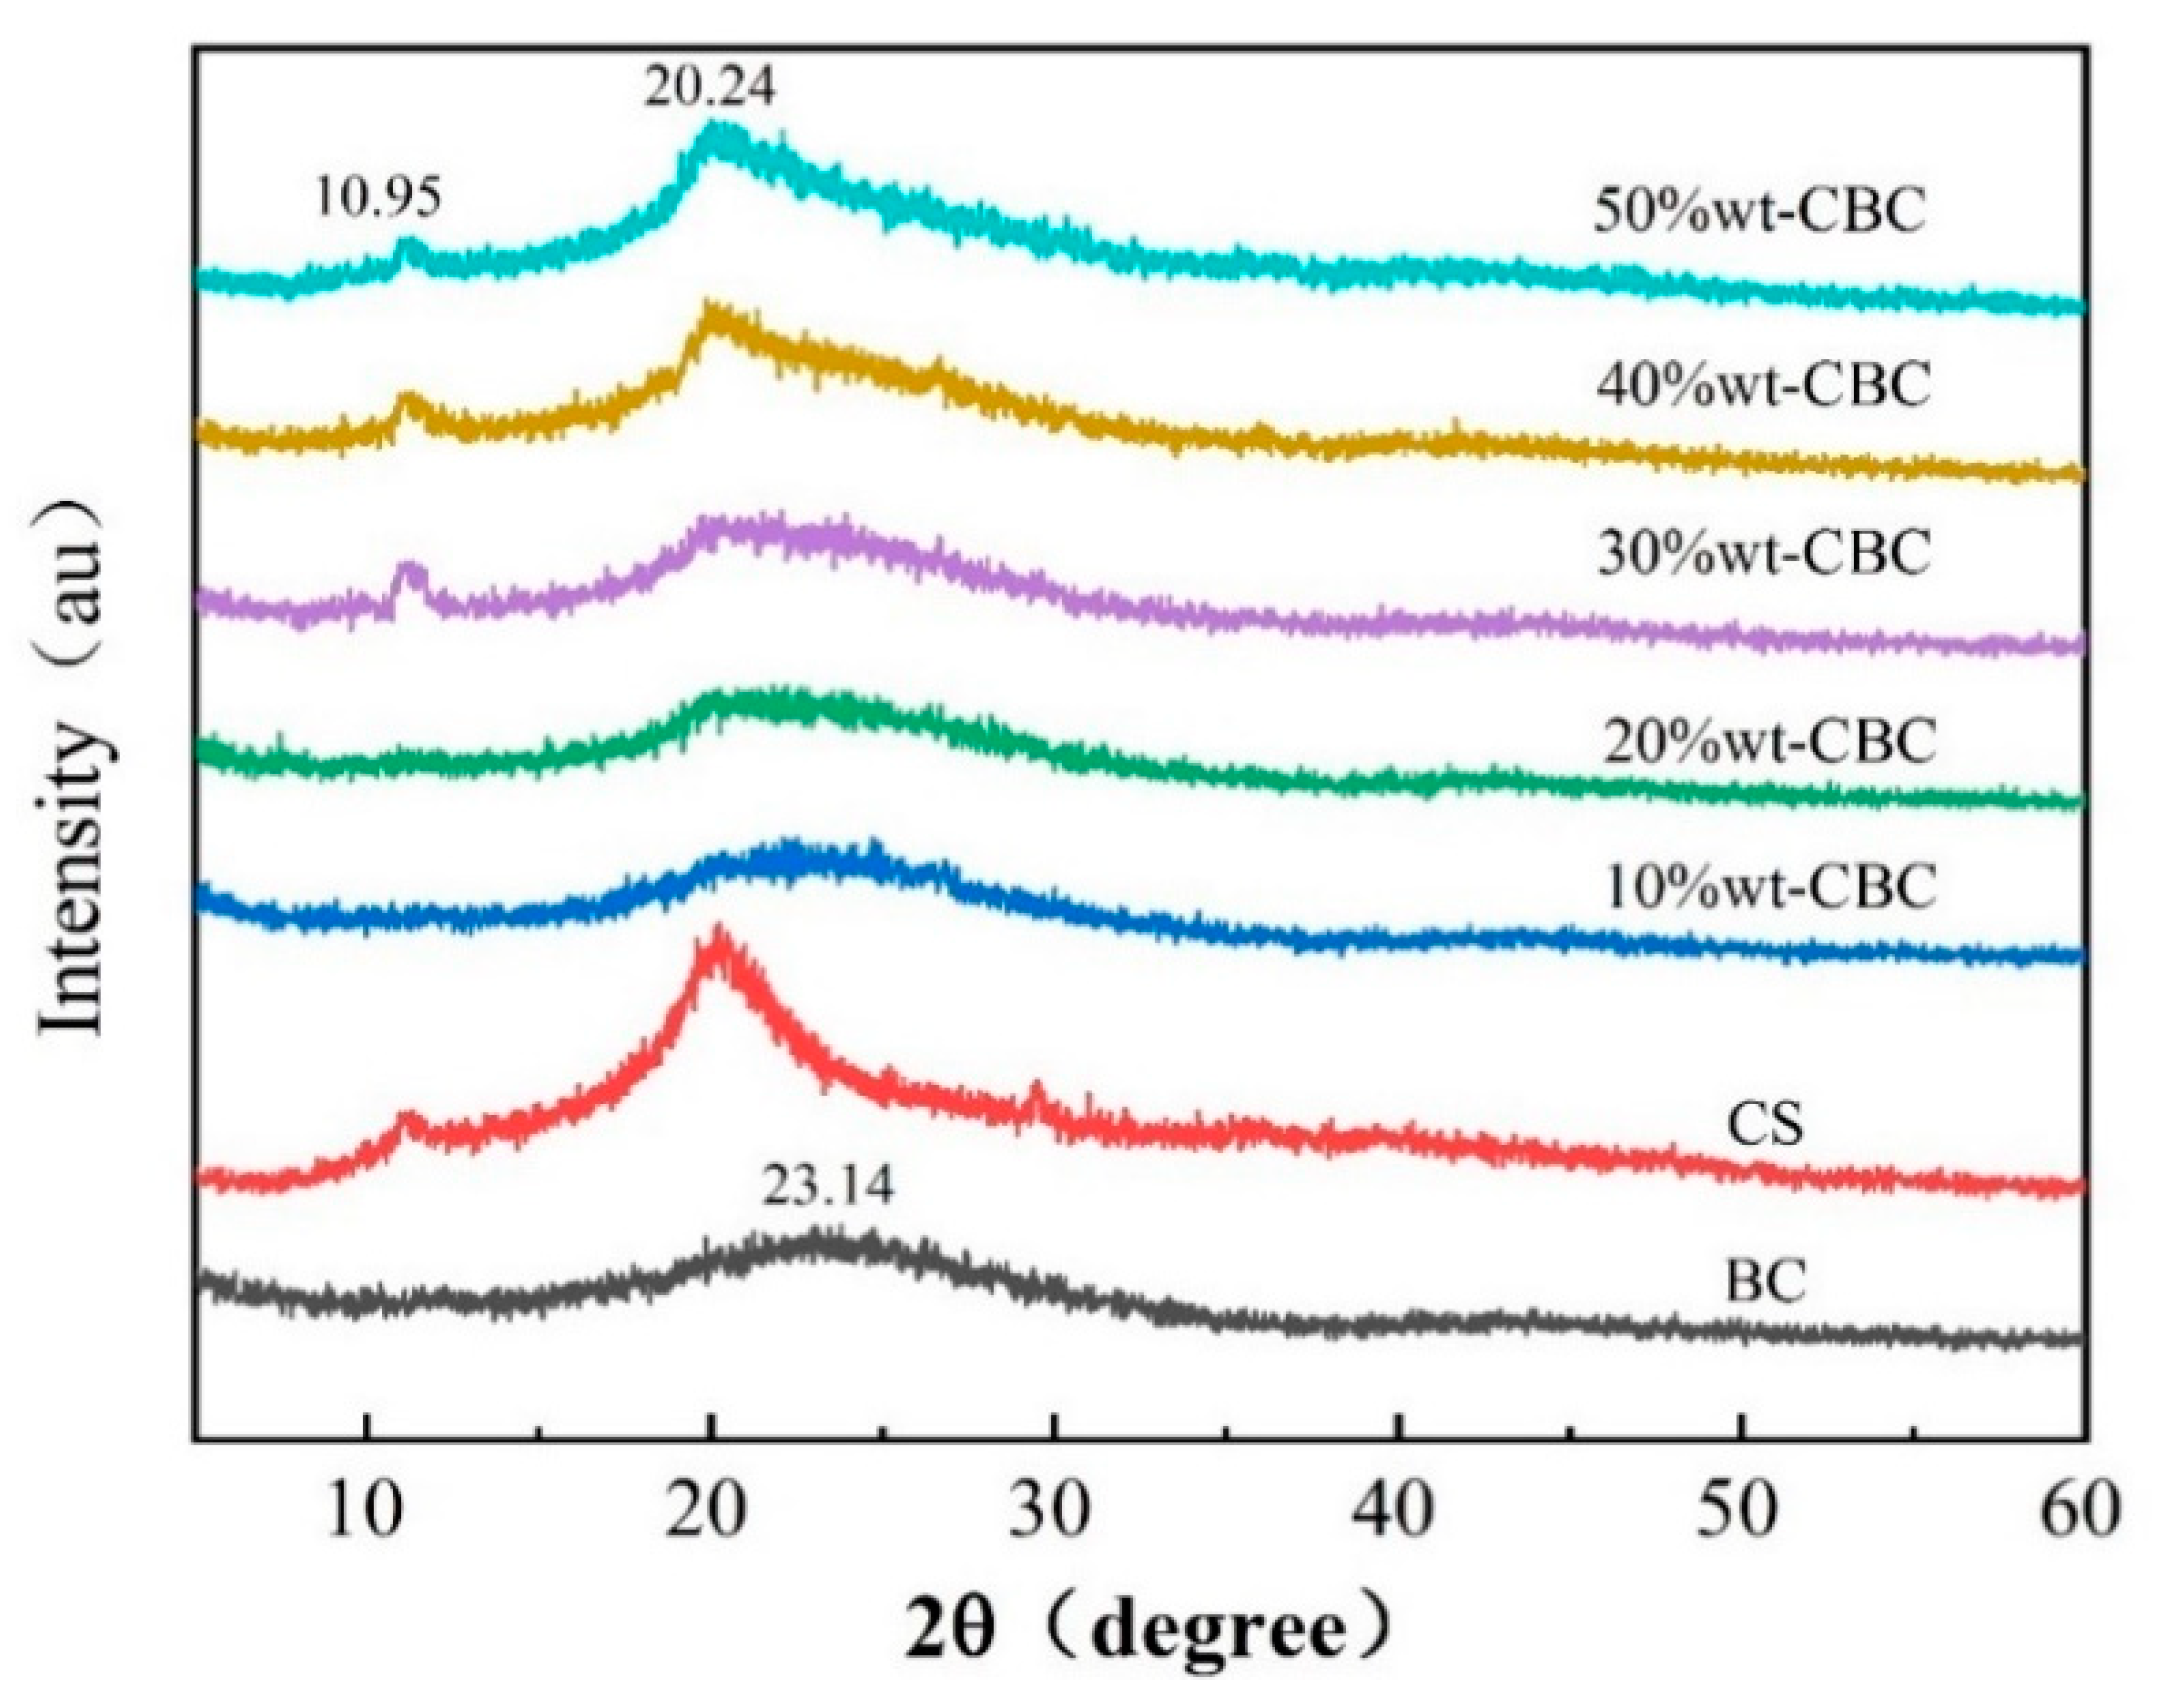
Figure 2 displays the XRD spectra of BC, CS, and CBC. The typical diffraction peaks of CS film are evident at 10.95° and 20.24°. As observed from the graph, 10%wt-CBC and 20%wt-CBC show no pronounced peak at 10.95°, and the peak at 20.24° is relatively weak, suggesting that CS film was not effectively loaded onto the BC. The diffractogram of the 50%wt-CBC reveals characteristic peaks at 10.95° and 20.24° 2θ, which are consistent with the semi-crystalline nature of chitosan, a naturally occurring polysaccharide. These peaks are generally expected near a 2θ of 20° due to the ordered arrangement of molecular chains. The biochar integration appears to modulate the peak parameters, suggesting potential impurities in the biochar or a synergistic effect between the biochar and chitosan matrix [16]. Conversely, the pristine CS sample demonstrates a distinct and acute crystalline peak at 20.24° 2θ, indicative of its crystalline integrity and enhanced crystallinity. In contrast, pure BC, derived from the thermal decomposition of biomass, presents an XRD profile lacking sharp diffraction peaks, which is emblematic of a material with reduced crystallinity or an amorphous carbon framework [17]. The diffraction peak at 23.14° 2θ observed in the biochar’s XRD could be indicative of distinct crystalline entities within the carbonaceous matrix. BC, conventionally synthesized via thermal decomposition of biomass, predominantly exhibits an amorphous structure or minimal crystallinity. Nonetheless, under specific pyrolytic regimes, discrete peaks of subdued intensity can emerge. This discrete peak might be ascribed to the residual inorganic mineral content or unique carbon structures engendered during pyrolysis. For example, biochar undergoing graphitization may exhibit characteristic diffraction peaks associated with the graphite’s (002) lattice planes, ordinarily manifesting around 26° (2θ). This manifestation, however, is subject to variability contingent upon the precursor material and the pyrolytic parameters employed. This phenomenon might be attributed to the low concentration of CS film during the reaction, resulting in an insufficient amount for BC modification [18]. In contrast, the materials 30%wt-CBC, 40%wt-CBC, and 50%wt-CBC all present two distinct diffraction peaks, indicating the successful modification of BC with CS film and an enhancement in the crystallinity of the BC.

Figure 2.
XRD diagram of BC, CS, and CBC.
3.1.2. FTIR Analysis
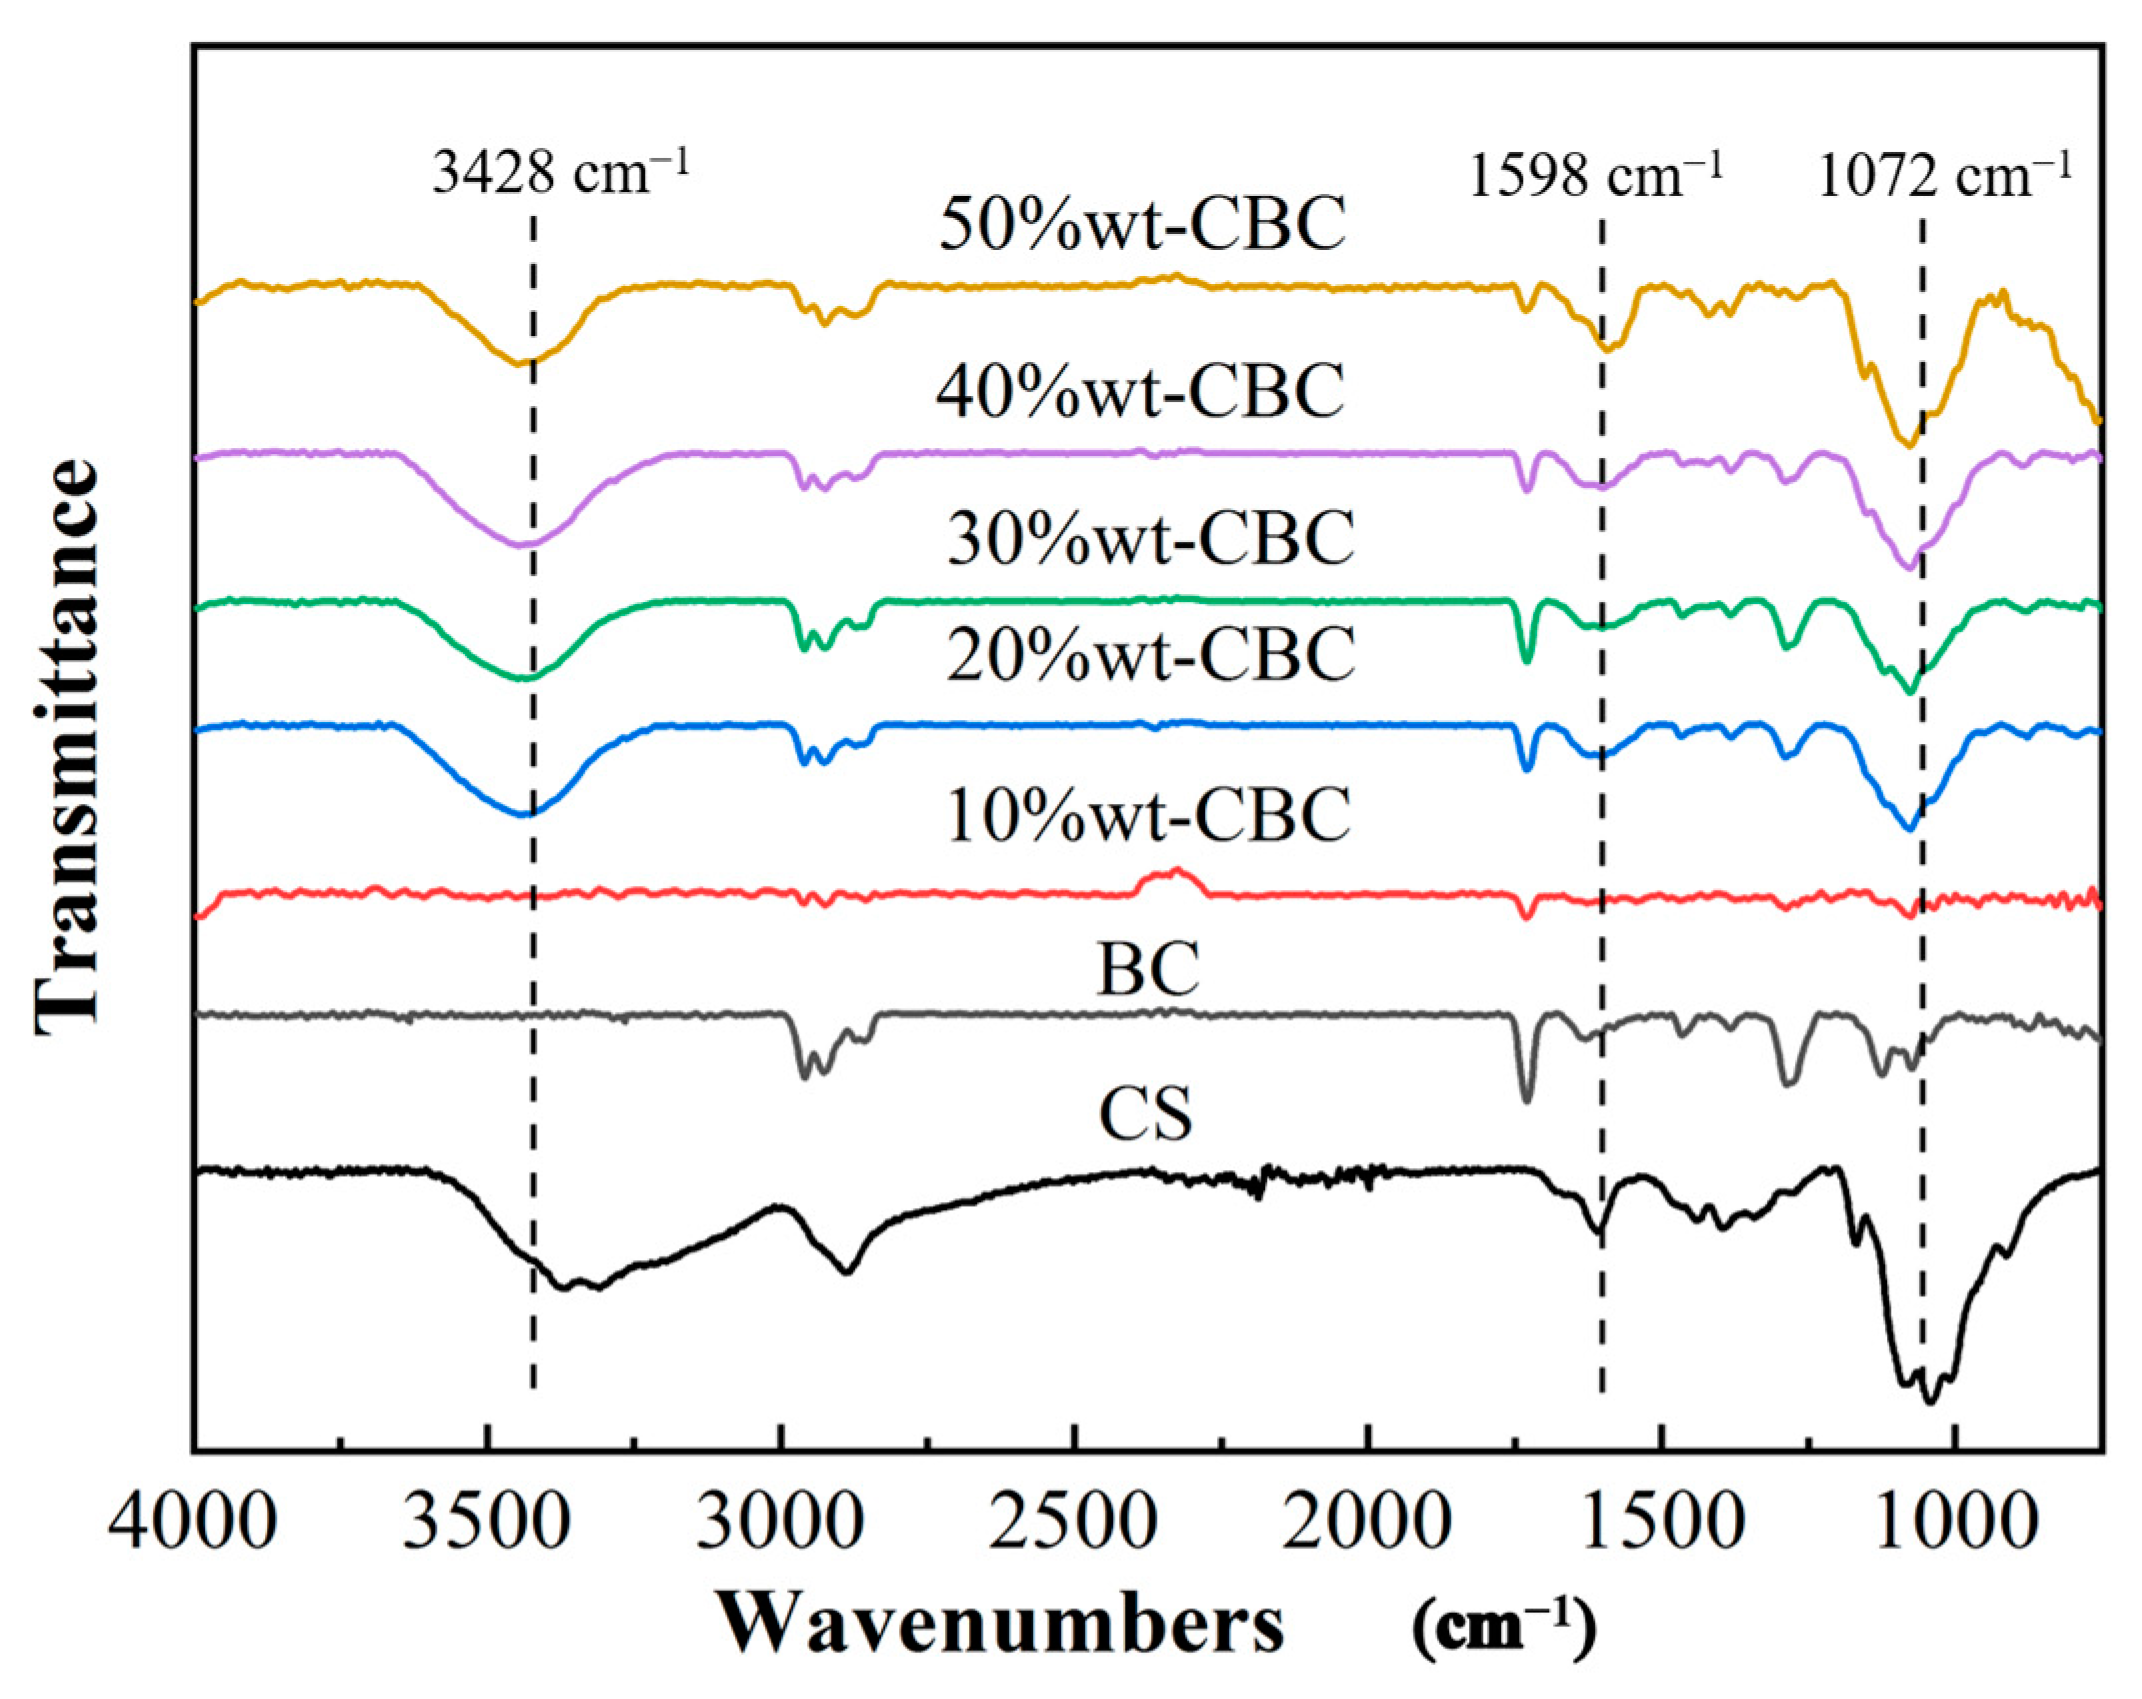
Figure 3 illustrates the infrared spectra of BC, CS, and CBC in the range of 4000–700 cm−1. Evidently, CBC retains all the characteristic peaks of the original BC. Furthermore, based on the foundation of BC, three typical CS film peaks emerge after the CS modification, located at 3428 cm−1, 1598 cm−1, and 1072 cm−1, respectively [19,20,21]. The observation that the 10%wt-CBC sample exhibits very weak characteristic peaks at 3428 cm−1, 1598 cm−1, and 1072 cm−1 can be attributed to the influence of the loading amount of CS on the BC. As the loading of CS decreases, the relative content of CS in the sample diminishes, potentially reducing the intensity of its characteristic peaks to below the detection limit. Additionally, the intrinsic absorption peaks of BC may overshadow those of CS. At lower CS loadings, the absorption characteristics of BC might become predominant, or the dispersion of CS on the BC surface might be insufficiently uniform, thereby obscuring the characteristic peaks of CS [22].
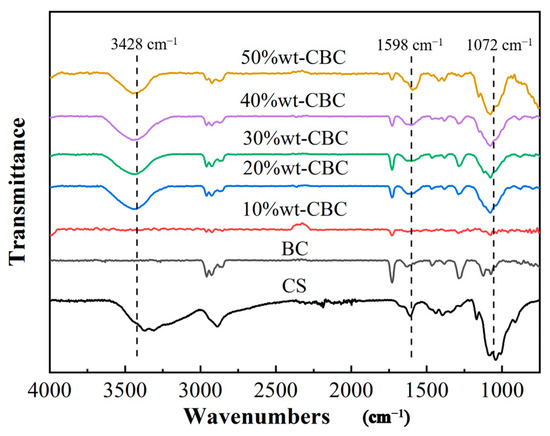
Figure 3.
FTIR diagram of BC, CS, and CBC.
The peak at 3428 cm−1 can be attributed to the stretching vibration of the amino groups in CS film, indicating the introduction of numerous amino groups into the BC. The peak suspected at 1598 cm−1 may be associated with carbonyl or hydroxyl groups, whereas the peak at 1072 cm−1 corresponds to the ether groups in the CS film [23,24,25]. In summary, the loading of CS film significantly augments the functional groups in BC, thereby potentiating its ability to effectively adsorb pollutants in water.
3.1.3. SEM Analysis
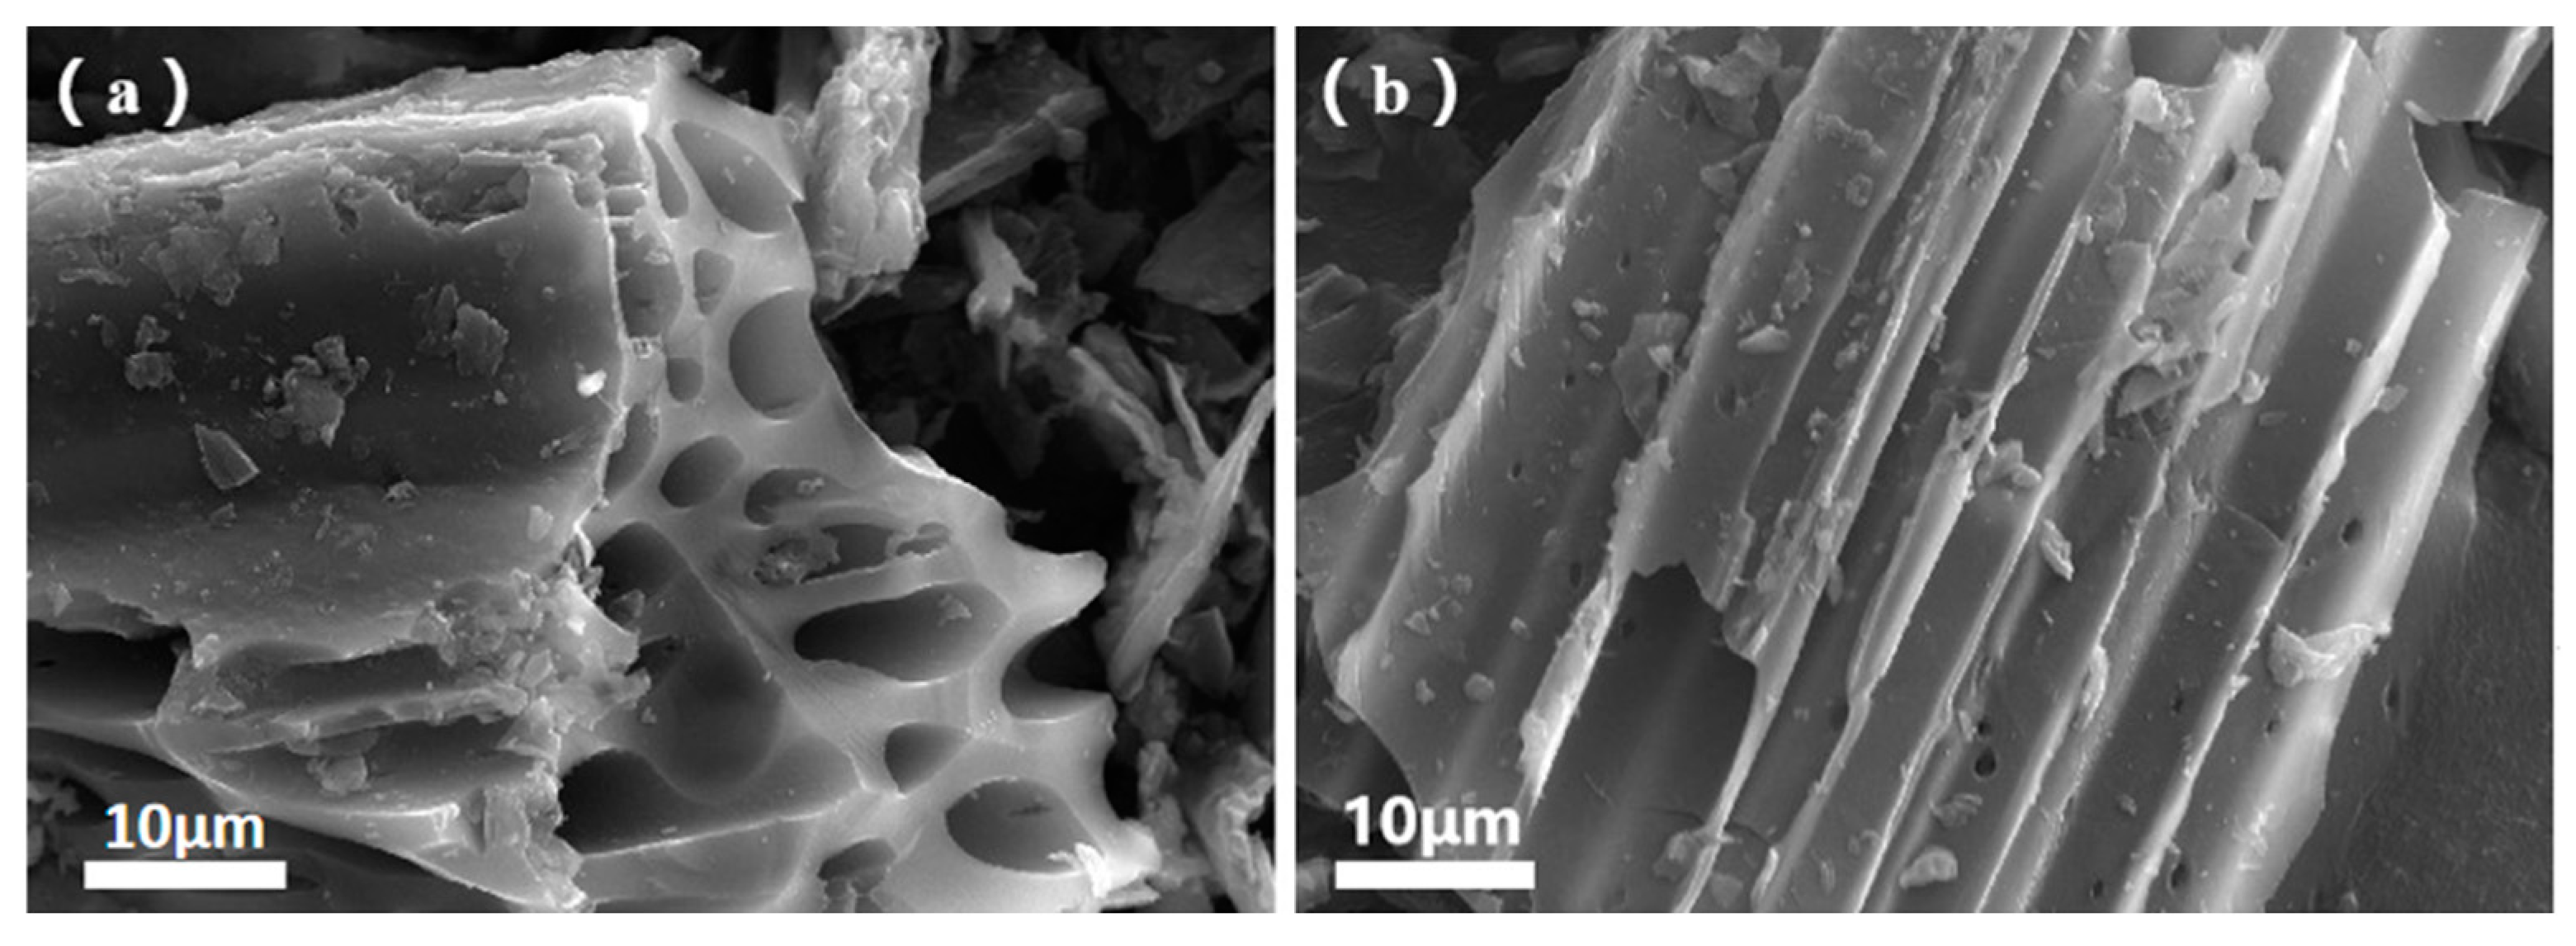
Figure 4a displays the SEM image of a section of the BC surface. A clear observation reveals that the morphology of BC exhibits a compact and irregular honeycomb-like structure, with pore sizes reaching up to 10 μm. These large pores are formed due to the pyrolysis of corn straw. Additionally, under high-temperature conditions, pyrolysis leads to the formation of aromatic structures, offering abundant sites for BC to load CS. Figure 4b illustrates the surface image of BC after CS loading. Upon careful inspection, it is evident that while the surface features dense micropores, a significant portion of them appears to be covered [26]. This suggests that the reaction with CS film resulted in the blockage of some pores. However, it simultaneously rendered the surface rougher, collectively enhancing the adsorption efficacy.
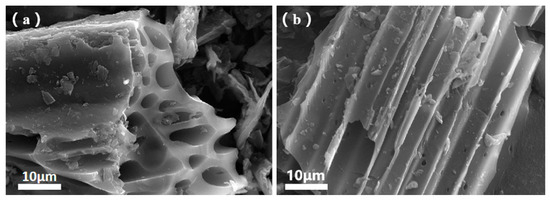
Figure 4.
SEM images of BC (a) and CBC (b).
3.1.4. BET Analysis
Table 3 delineates the specific surface area, pore volume, and pore size distribution of both BC and CBC. A prominent pore diameter around 8 nm signifies the generation of mesoporous materials. Intriguingly, the specific surface area of CBC surpasses the pristine BC when the CS film loading is within the range of (10%–40%). Yet, with augmented CS film incorporation, a diminishing trend in the specific surface area of CBC becomes evident, with a notable dip below BC at a 50% loading.
Table 3.
Surface characteristics of BC, CS, and CBC.
In addressing this phenomenon, we postulate that the escalating incorporation of CS film renders the BC surface progressively coarser and heterogeneous, culminating in the amplification of the specific surface area. However, upon further CS film augmentation, pore occlusion transpires. This suggests a predominant CS film distribution within 2.5–4 nm pores, consequently instigating the formation of 1.6–1.7 nm pores. While it is conventionally held that the molecular size of CS film precludes its infiltration into nanosized pores, potential catalytic hydrolysis, in the presence of acetic acid, might facilitate the segmentation of some CS film entities into smaller molecules, which then occlude the pores. Remarkably, when CS film coverage escalates beyond 50%, the specific surface area of BC even eclipses that of 50%wt-CBC. Ergo, our preliminary assessment advocates for the superior adsorptive prowess of (10%–40%) wt-CBC.
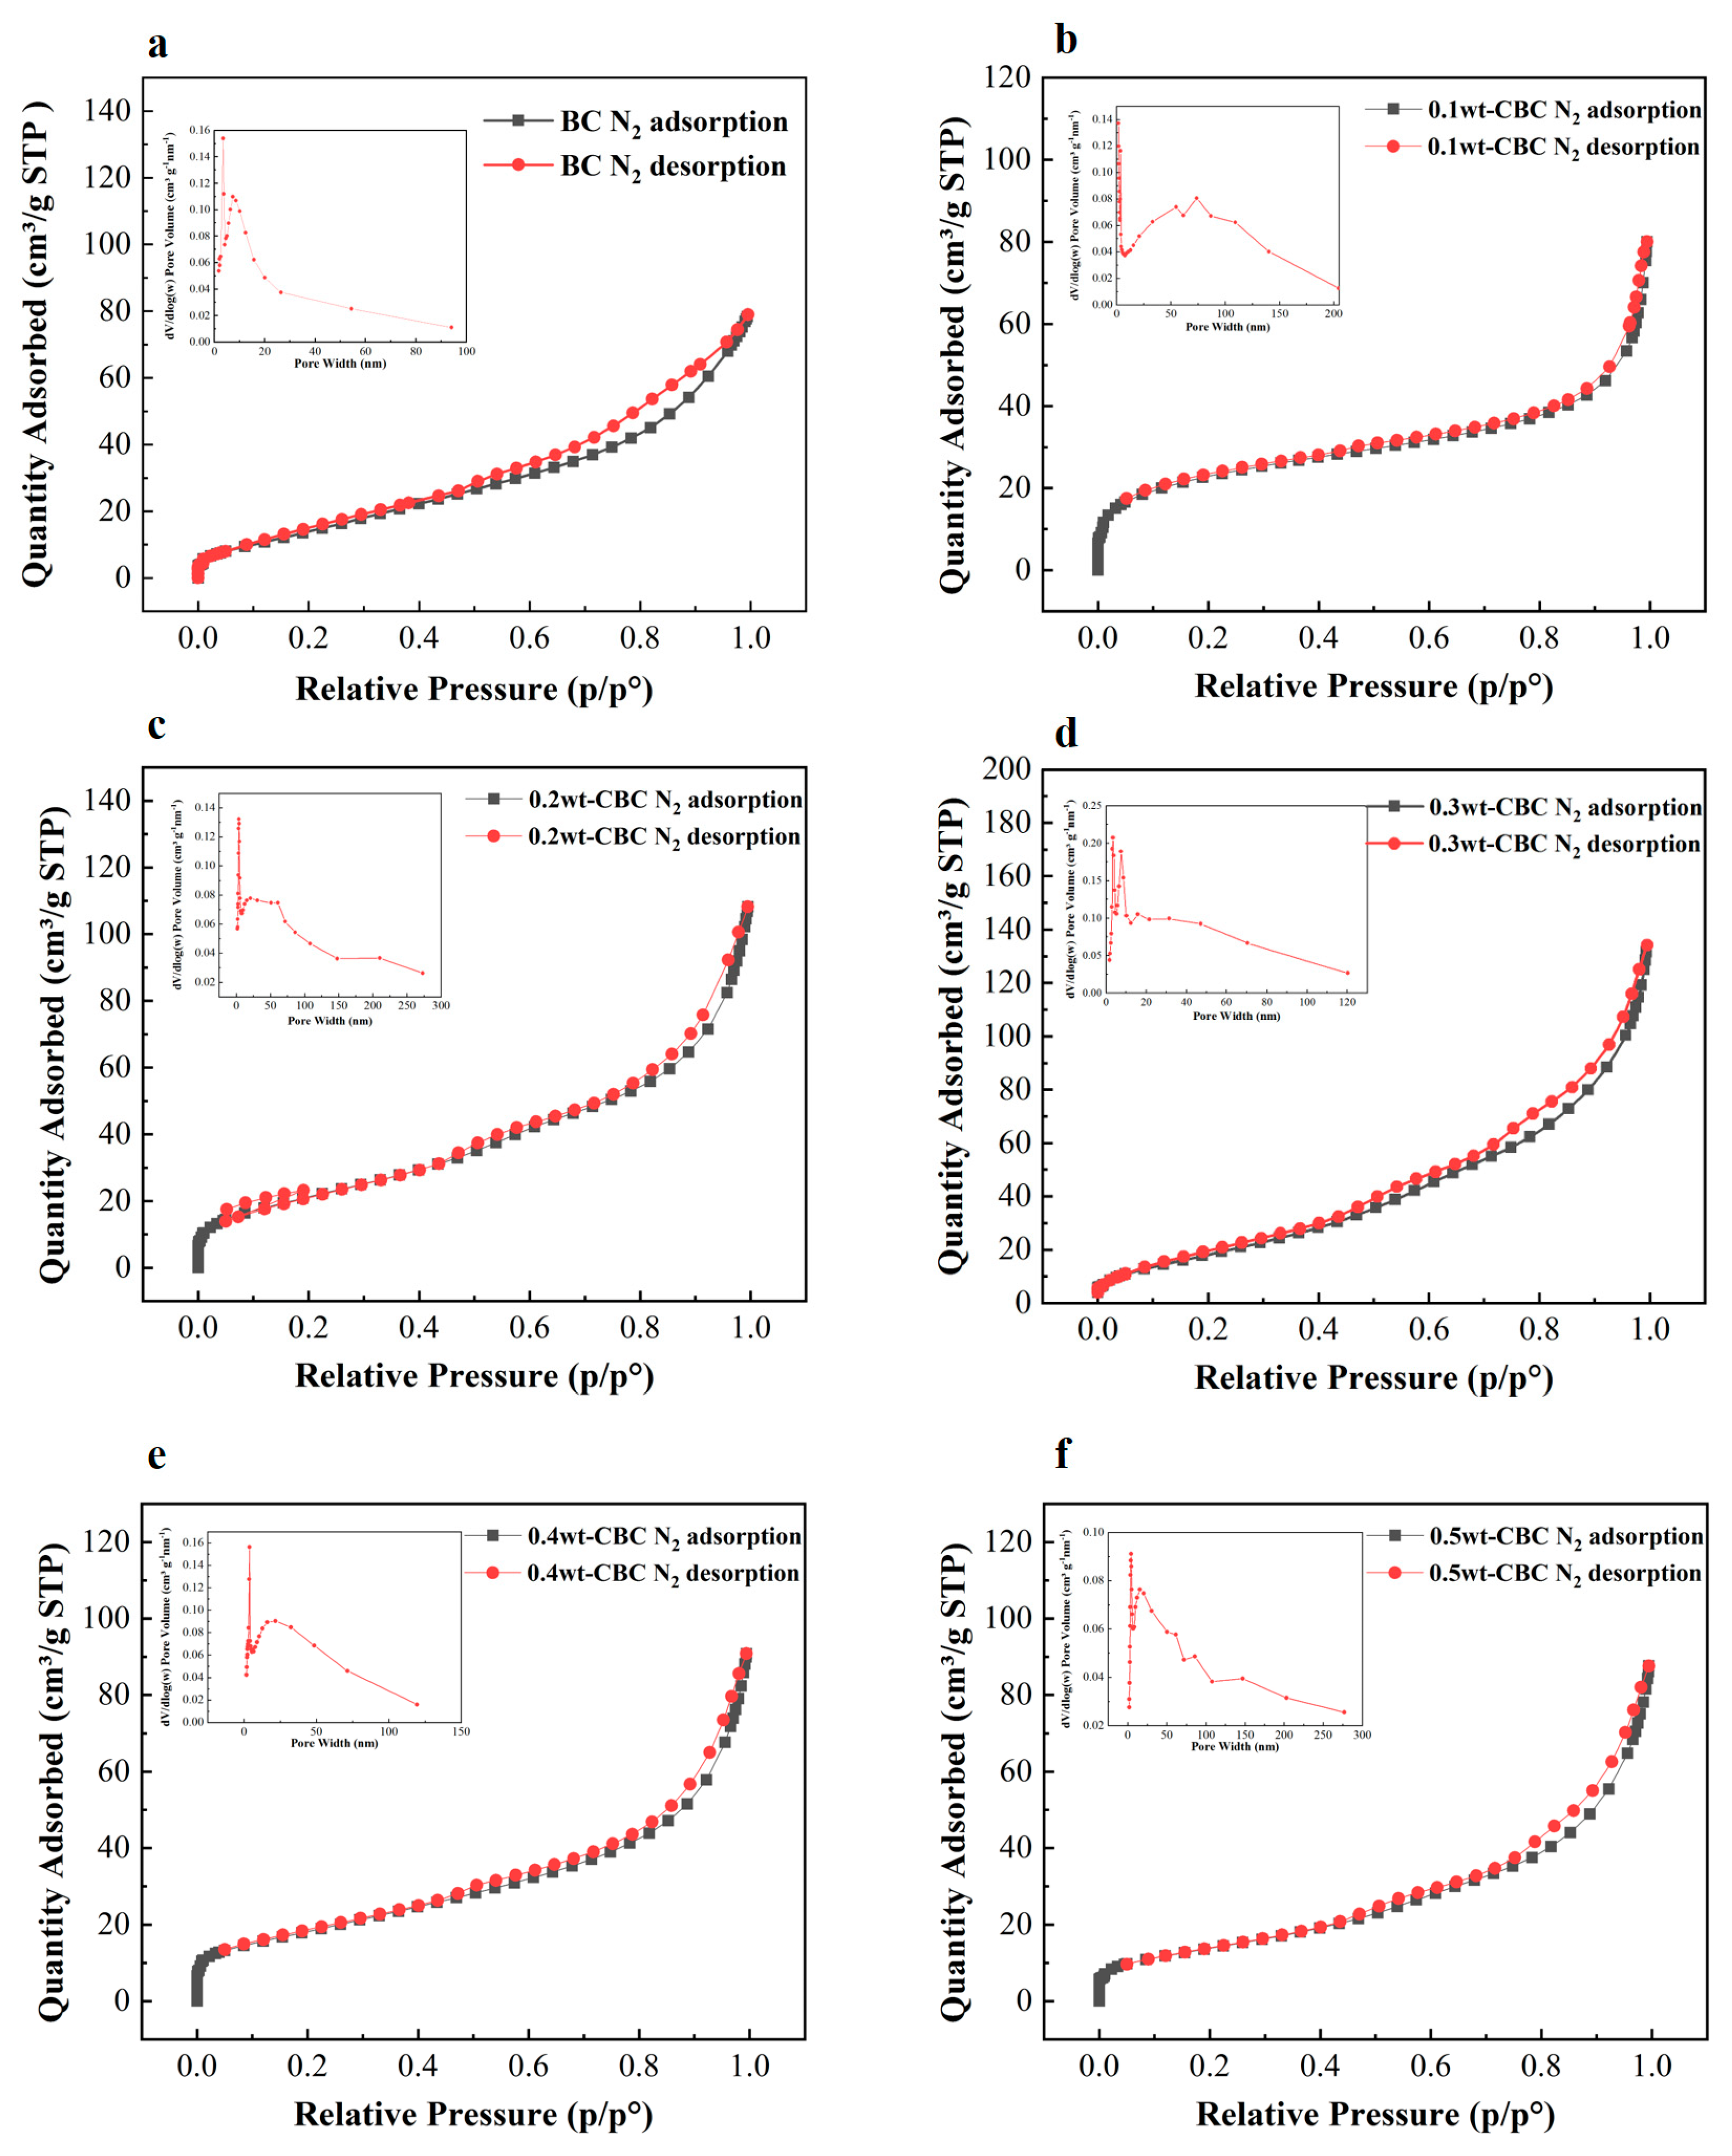
According to Figure 5, the isothermal nitrogen adsorption–desorption curve of 10%wt-CBC presents a Type II isotherm characteristic. Combined with the data from the table above, its pore diameter is 5.56 nm, which is less than 50 nm, indicating that 10%wt-CBC is a non-porous material [27]. Meanwhile, the curves for the other materials are all of Type IV, and when paired with their pore size data, they can be categorized as mesoporous materials. Upon comparison of the curves, the capillary condensation phase of the 30%wt-CBC curve has the steepest slope, suggesting the most uniform distribution of mesopores and the largest pore size, consistent with the data in the table above [28]. The pore size distribution diagram in the top left corner further demonstrates that the pore diameters are mainly within the range of 0–20 nm, indicating a blend of mesopores and micropores, which is favorable for adsorption processes [29].
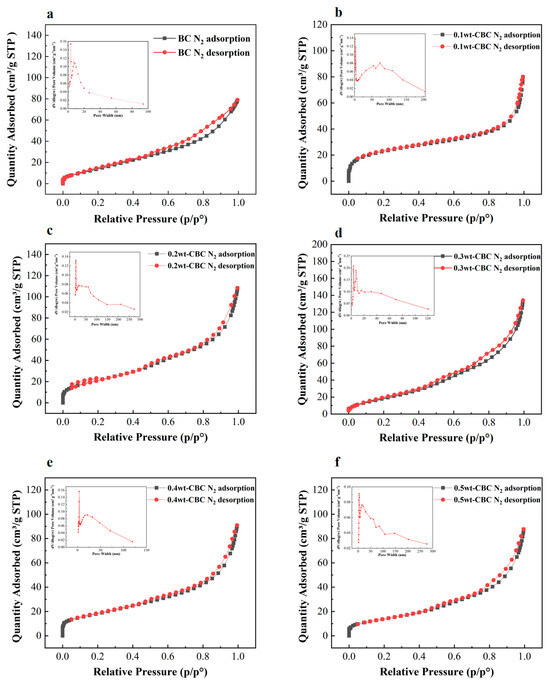
Figure 5.
Nitrogen adsorption and desorption curves of BC (a), 10% wt−CBC (b), 20%wt−CBC (c), 30% wt−CBC (d), 40%wt−CBC (e), and 50% wt−CBC (f).
3.2. Optimization of Potato Starch Wastewater Adsorption Process
3.2.1. Effect of Modification Conditions on the Adsorption Effect of Potato Starch Wastewater
Under fixed conditions, with an adsorbent dosage of 9 g, reaction pH of 6, adsorption time of 360 min, and adsorption temperature of 30 °C, we tested six adsorbents to investigate their effects on the treatment of potato starch wastewater: BC, 10%wt-CBC, 20%wt-CBC, 30%wt-CBC, 40%wt-CBC, and 50%wt-CBC.
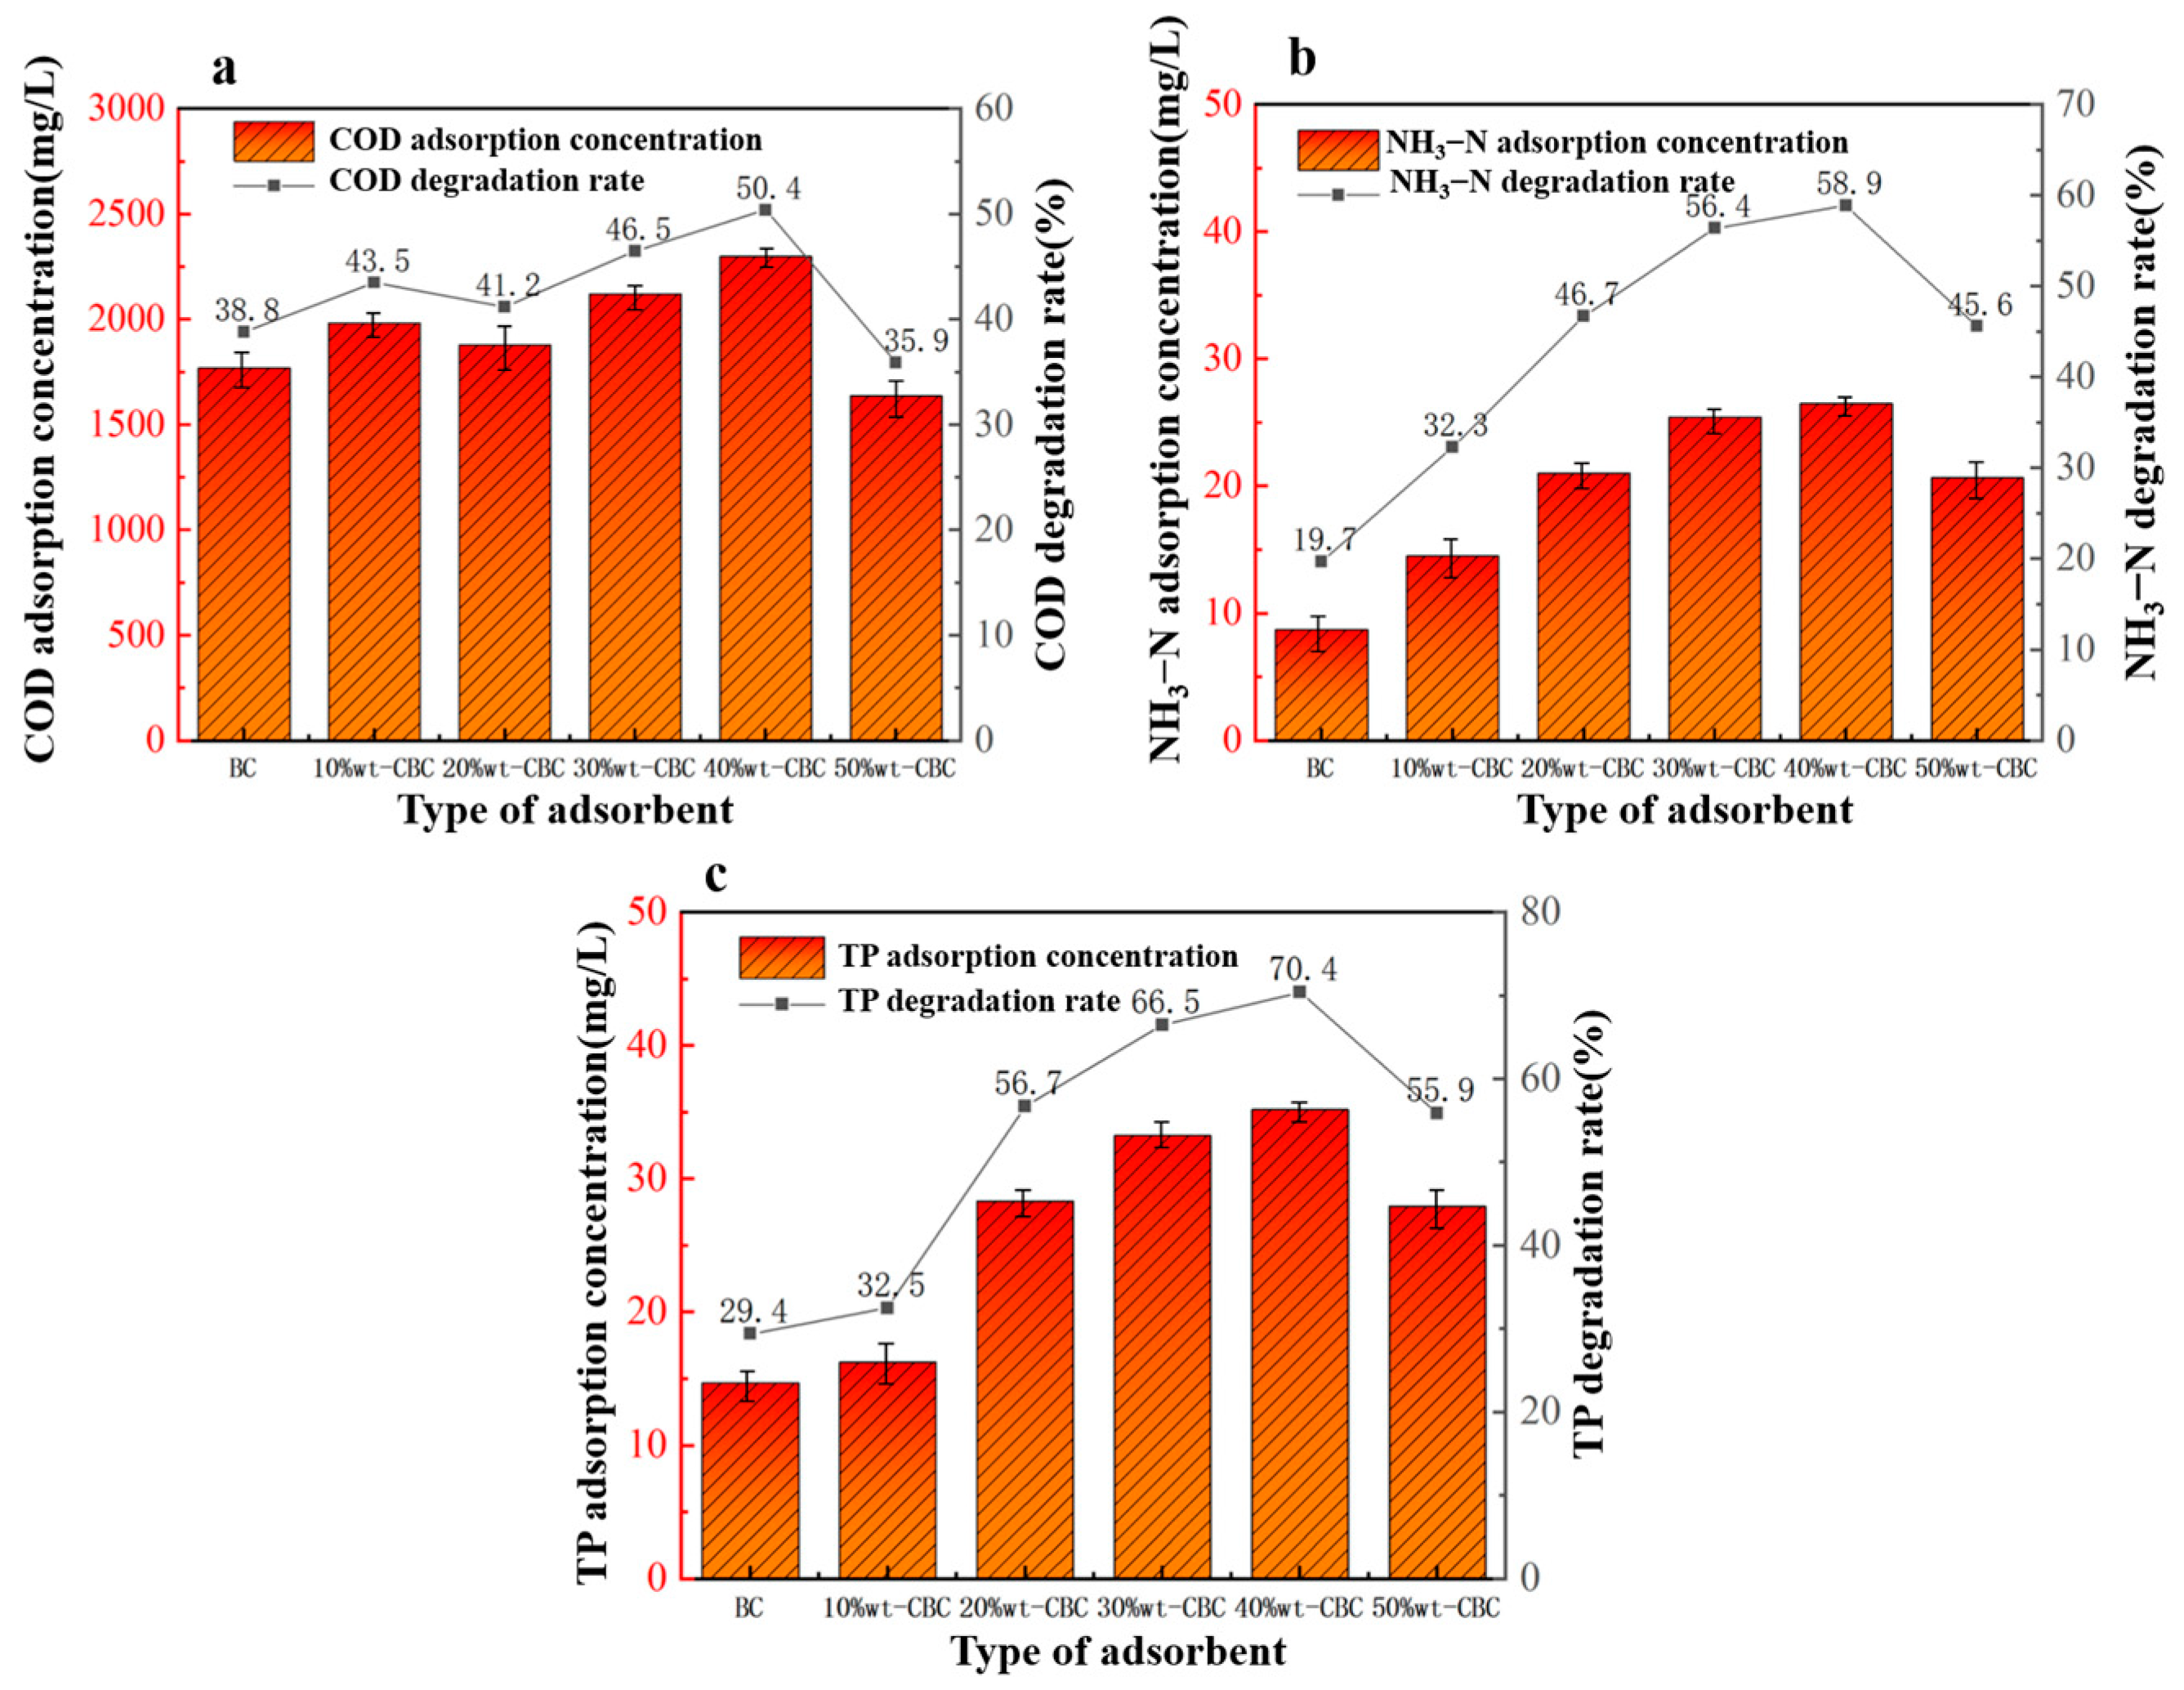
From Figure 5, it is evident that 50%wt-CBC exhibited the lowest removal rates for COD, ammonium nitrogen, and TP, indicating that excessive CS film loading has blocked a majority of the BC pores, thus diminishing its adsorptive capability. As seen from Figure 6a, as the CS film loading increased, the COD adsorption efficiency gradually improved, reaching its peak when the CS film load was at 40%. Figure 6b,c show that the pristine BC has a relatively poor adsorption efficiency for ammonium nitrogen and TP. However, after CS film loading, the adsorption performance significantly improved, displaying a parabolic trend, with 40% CS film loading achieving optimal results.

Figure 6.
Effect of adsorbent type on COD (a), ammonia nitrogen (b), TP (c) removal.
In conclusion, CS film loading enhances the BC’s removal efficiency for ammonium nitrogen and TP [30]. This can be attributed to the fact that 40%wt-CBC not only possesses high specific surface area and porous structure as physical characteristics but also boasts numerous functional groups, offering more sites for chemical adsorption.
3.2.2. Effect of Adsorption Temperature on the Adsorption Effect of Potato Starch Wastewater
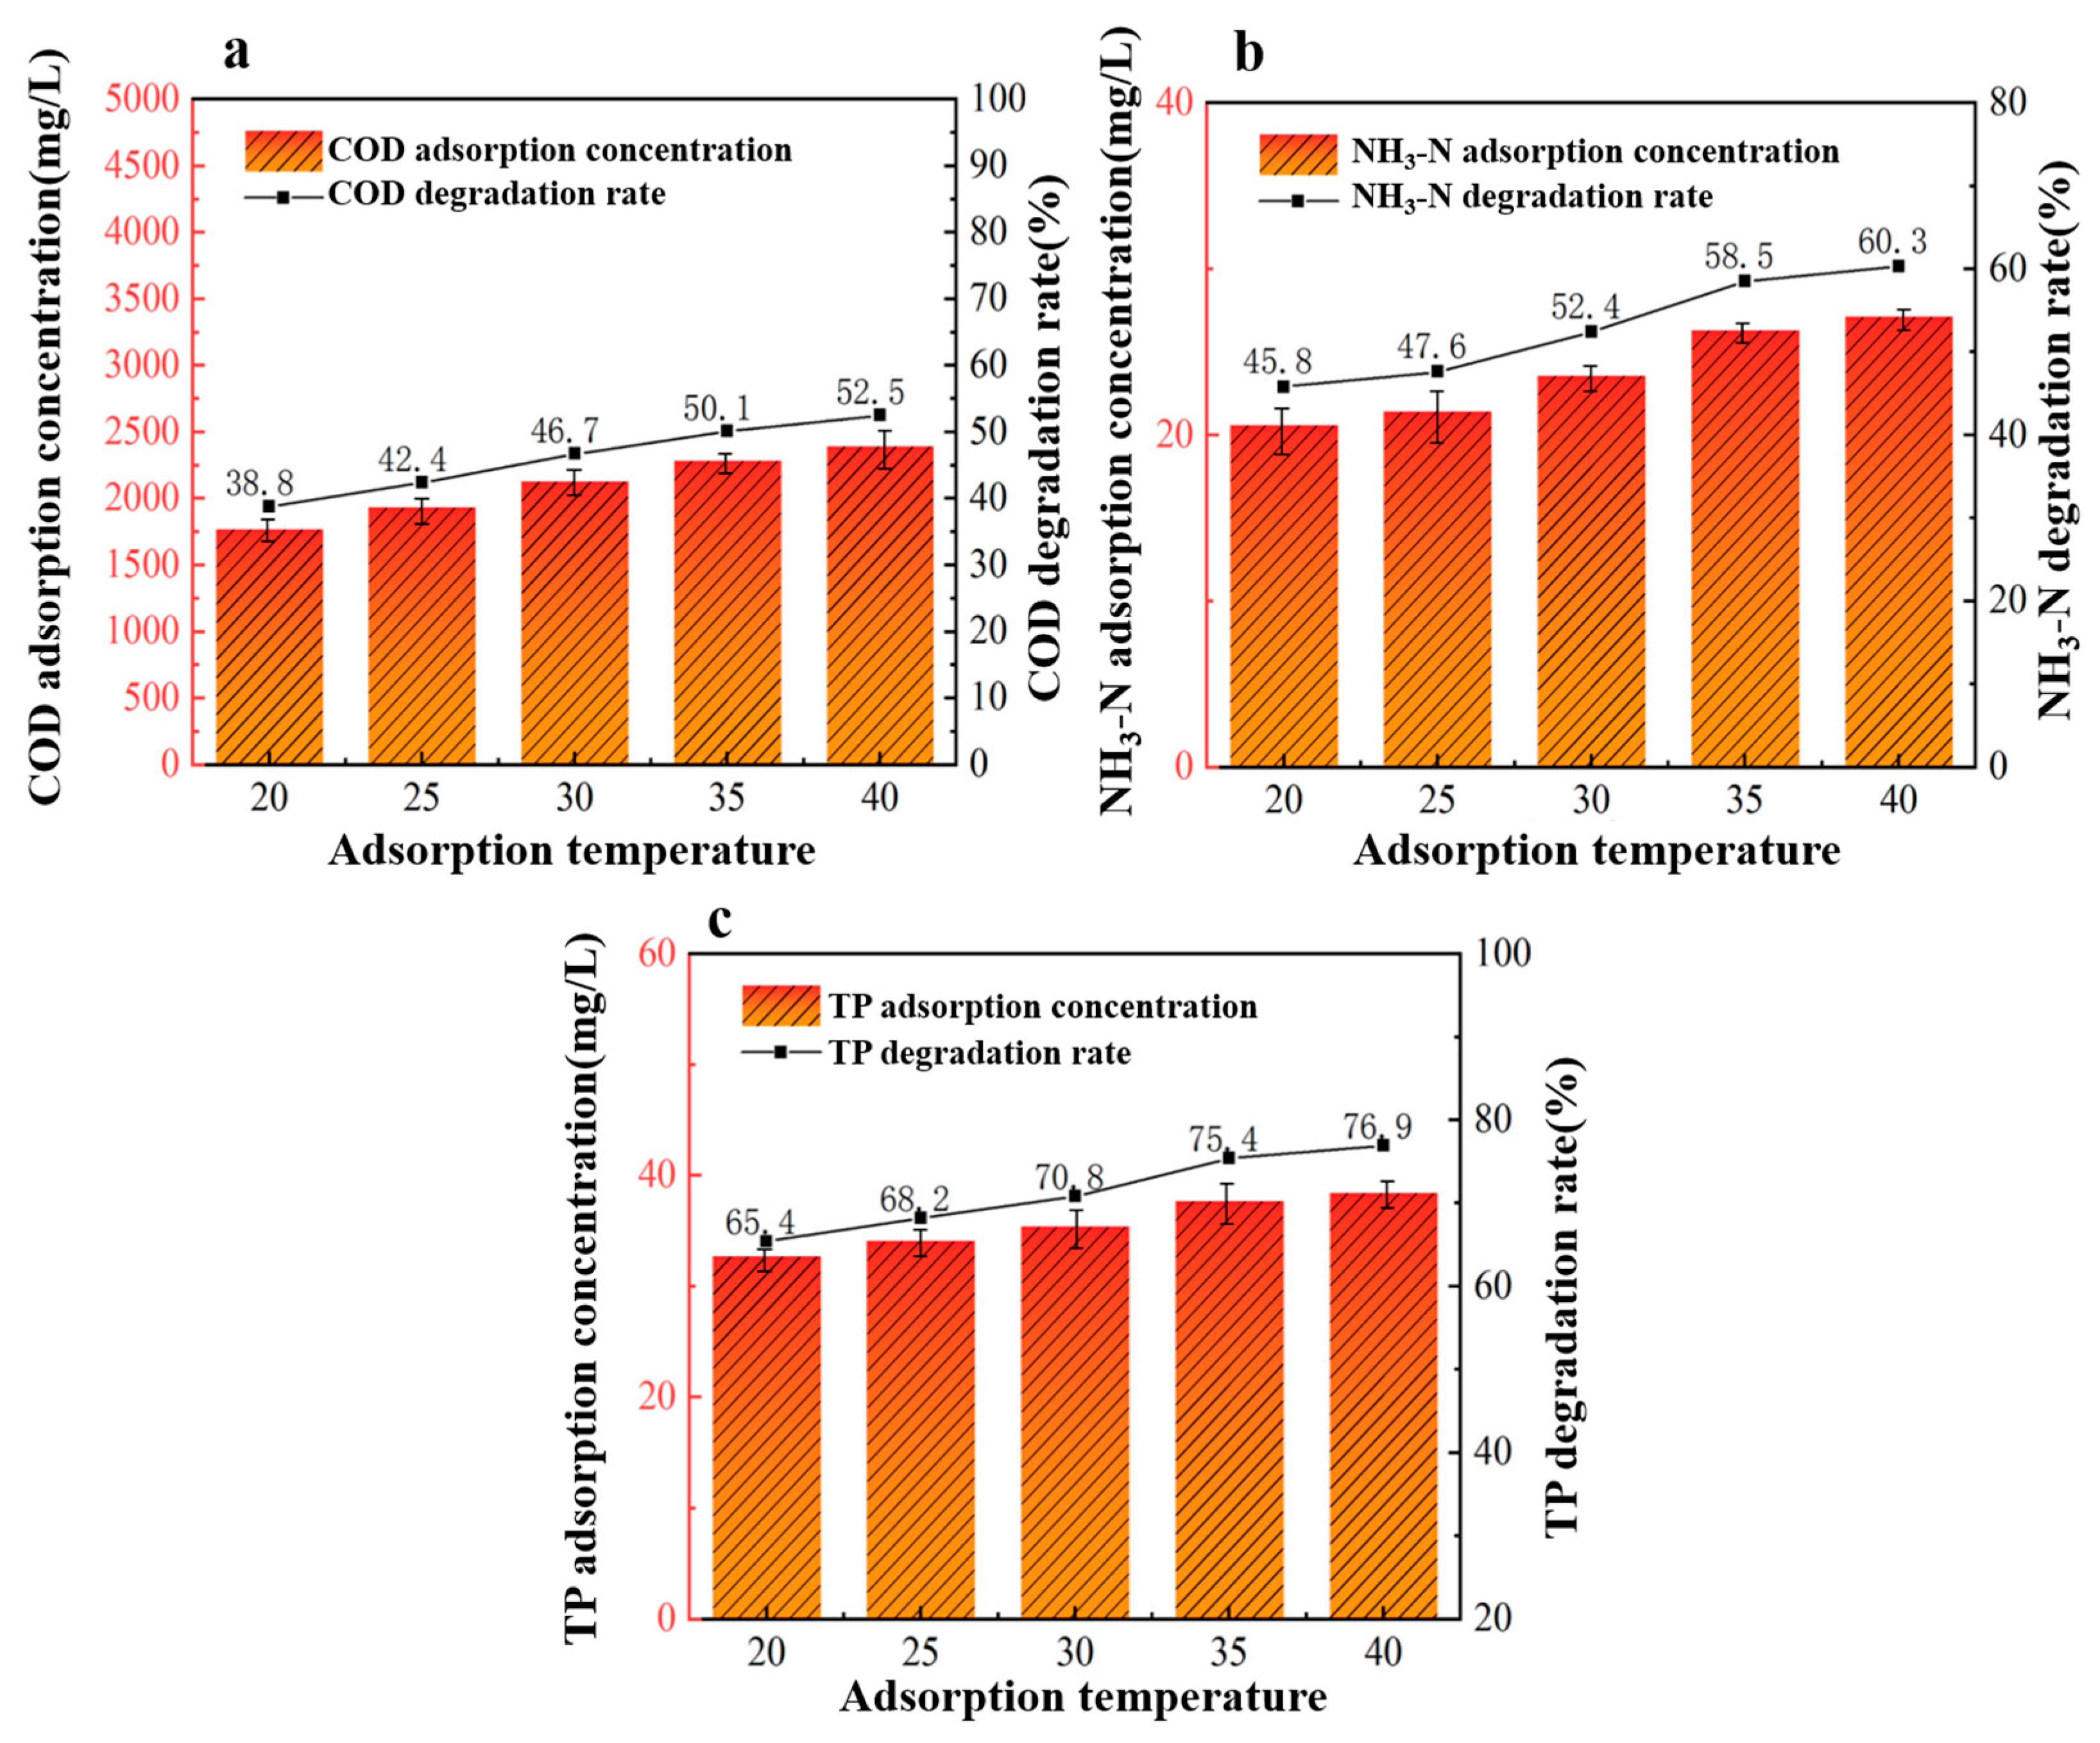
Under fixed conditions of a 40%wt-CBC dosage of 9 g, reaction pH of 6, and an adsorption time of 360 min, we investigated five different adsorption temperatures to study their effects on the treatment of potato starch wastewater: 20 °C, 25 °C, 30 °C, 35 °C, and 40 °C. Given that the objective of this research is for industrial application and maintaining high adsorption temperatures in water treatment would lead to significant energy consumption, the temperature range of 20 °C to 40 °C was chosen for this experiment.
From Figure 7, we observed that the efficiency of 40%wt-CBC in removing COD, ammonium nitrogen, and TP improved with increasing temperature, peaking at 40 °C (or 313 K). This could be attributed to the increased thermal motion of molecules at higher temperatures, which accelerates molecular diffusion rates and enhances molecular collisions, thereby improving adsorption [31]. Additionally, elevated temperatures reduce the viscosity of the solution, making it easier for pollutants to adhere to the surface of 40%wt-CBC, further enhancing the adsorption process.

Figure 7.
Effect of adsorption temperature on COD (a), ammonia nitrogen (b), TP (c) removal by 40% wt-CBC.
3.2.3. Effect of Adsorption Time on the Adsorption Effect of Potato Starch Wastewater
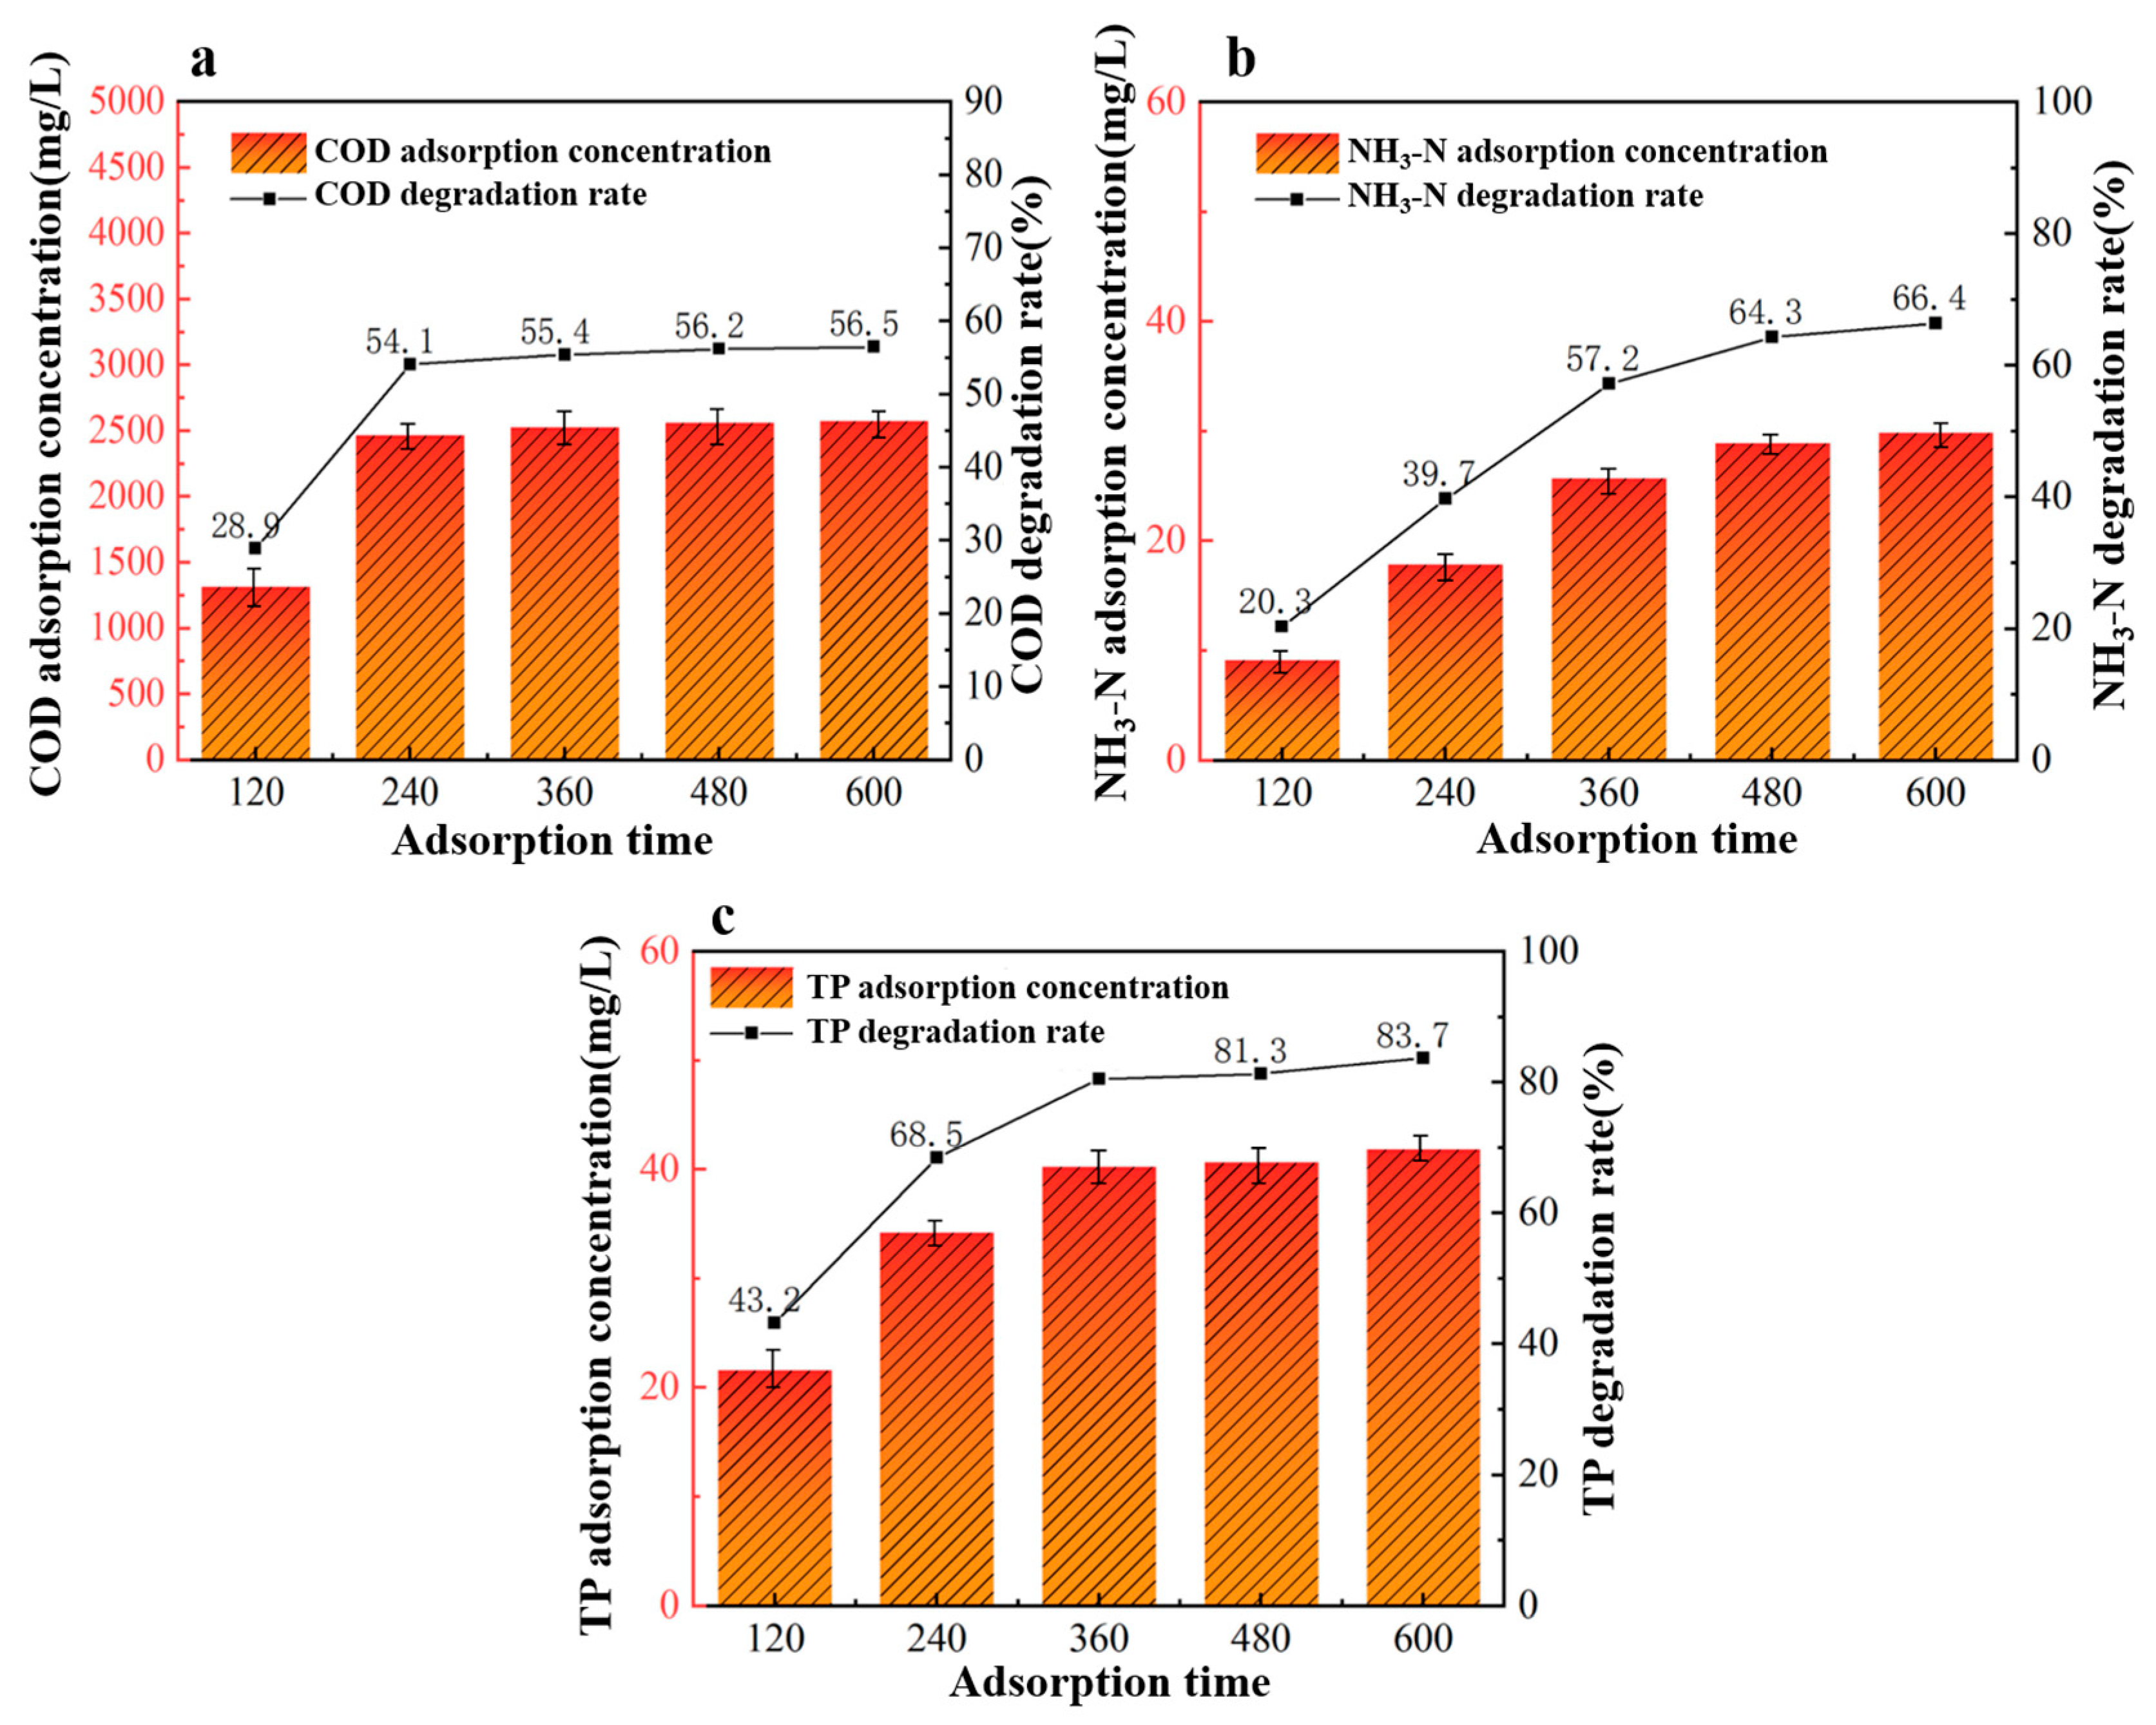
Under fixed conditions of a 40%wt-CBC dosage of 9 g, reaction pH of 6, and an adsorption temperature of 40 °C, we investigated five different adsorption durations to study their effects on the treatment of potato starch wastewater: 120 min, 240 min, 360 min, 480 min, and 600 min.
From the data in Figure 8, it is evident that the efficiency of 40%wt-CBC in removing COD, ammonium nitrogen, and TP improves with increasing adsorption time. Specifically, for COD removal by 40%wt-CBC, saturation is achieved around 240 min with a stable removal rate of 55%. For ammonium nitrogen, 40%wt-CBC reaches saturation at 480 min, with a stable removal rate of 64%. For TP, the best removal rate is achieved at 360 min, after which it remains stable at 80% [32]. Considering these optimal conditions for each parameter, an adsorption time of 360 min is determined to be the best.
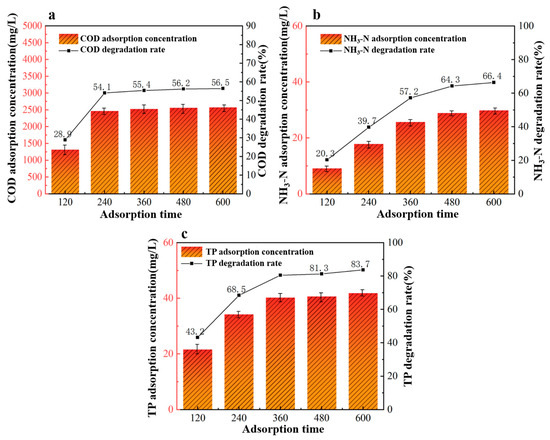
Figure 8.
Effect of adsorption time on COD (a), ammonia nitrogen (b), TP (c) removal by 40% wt-CBC.
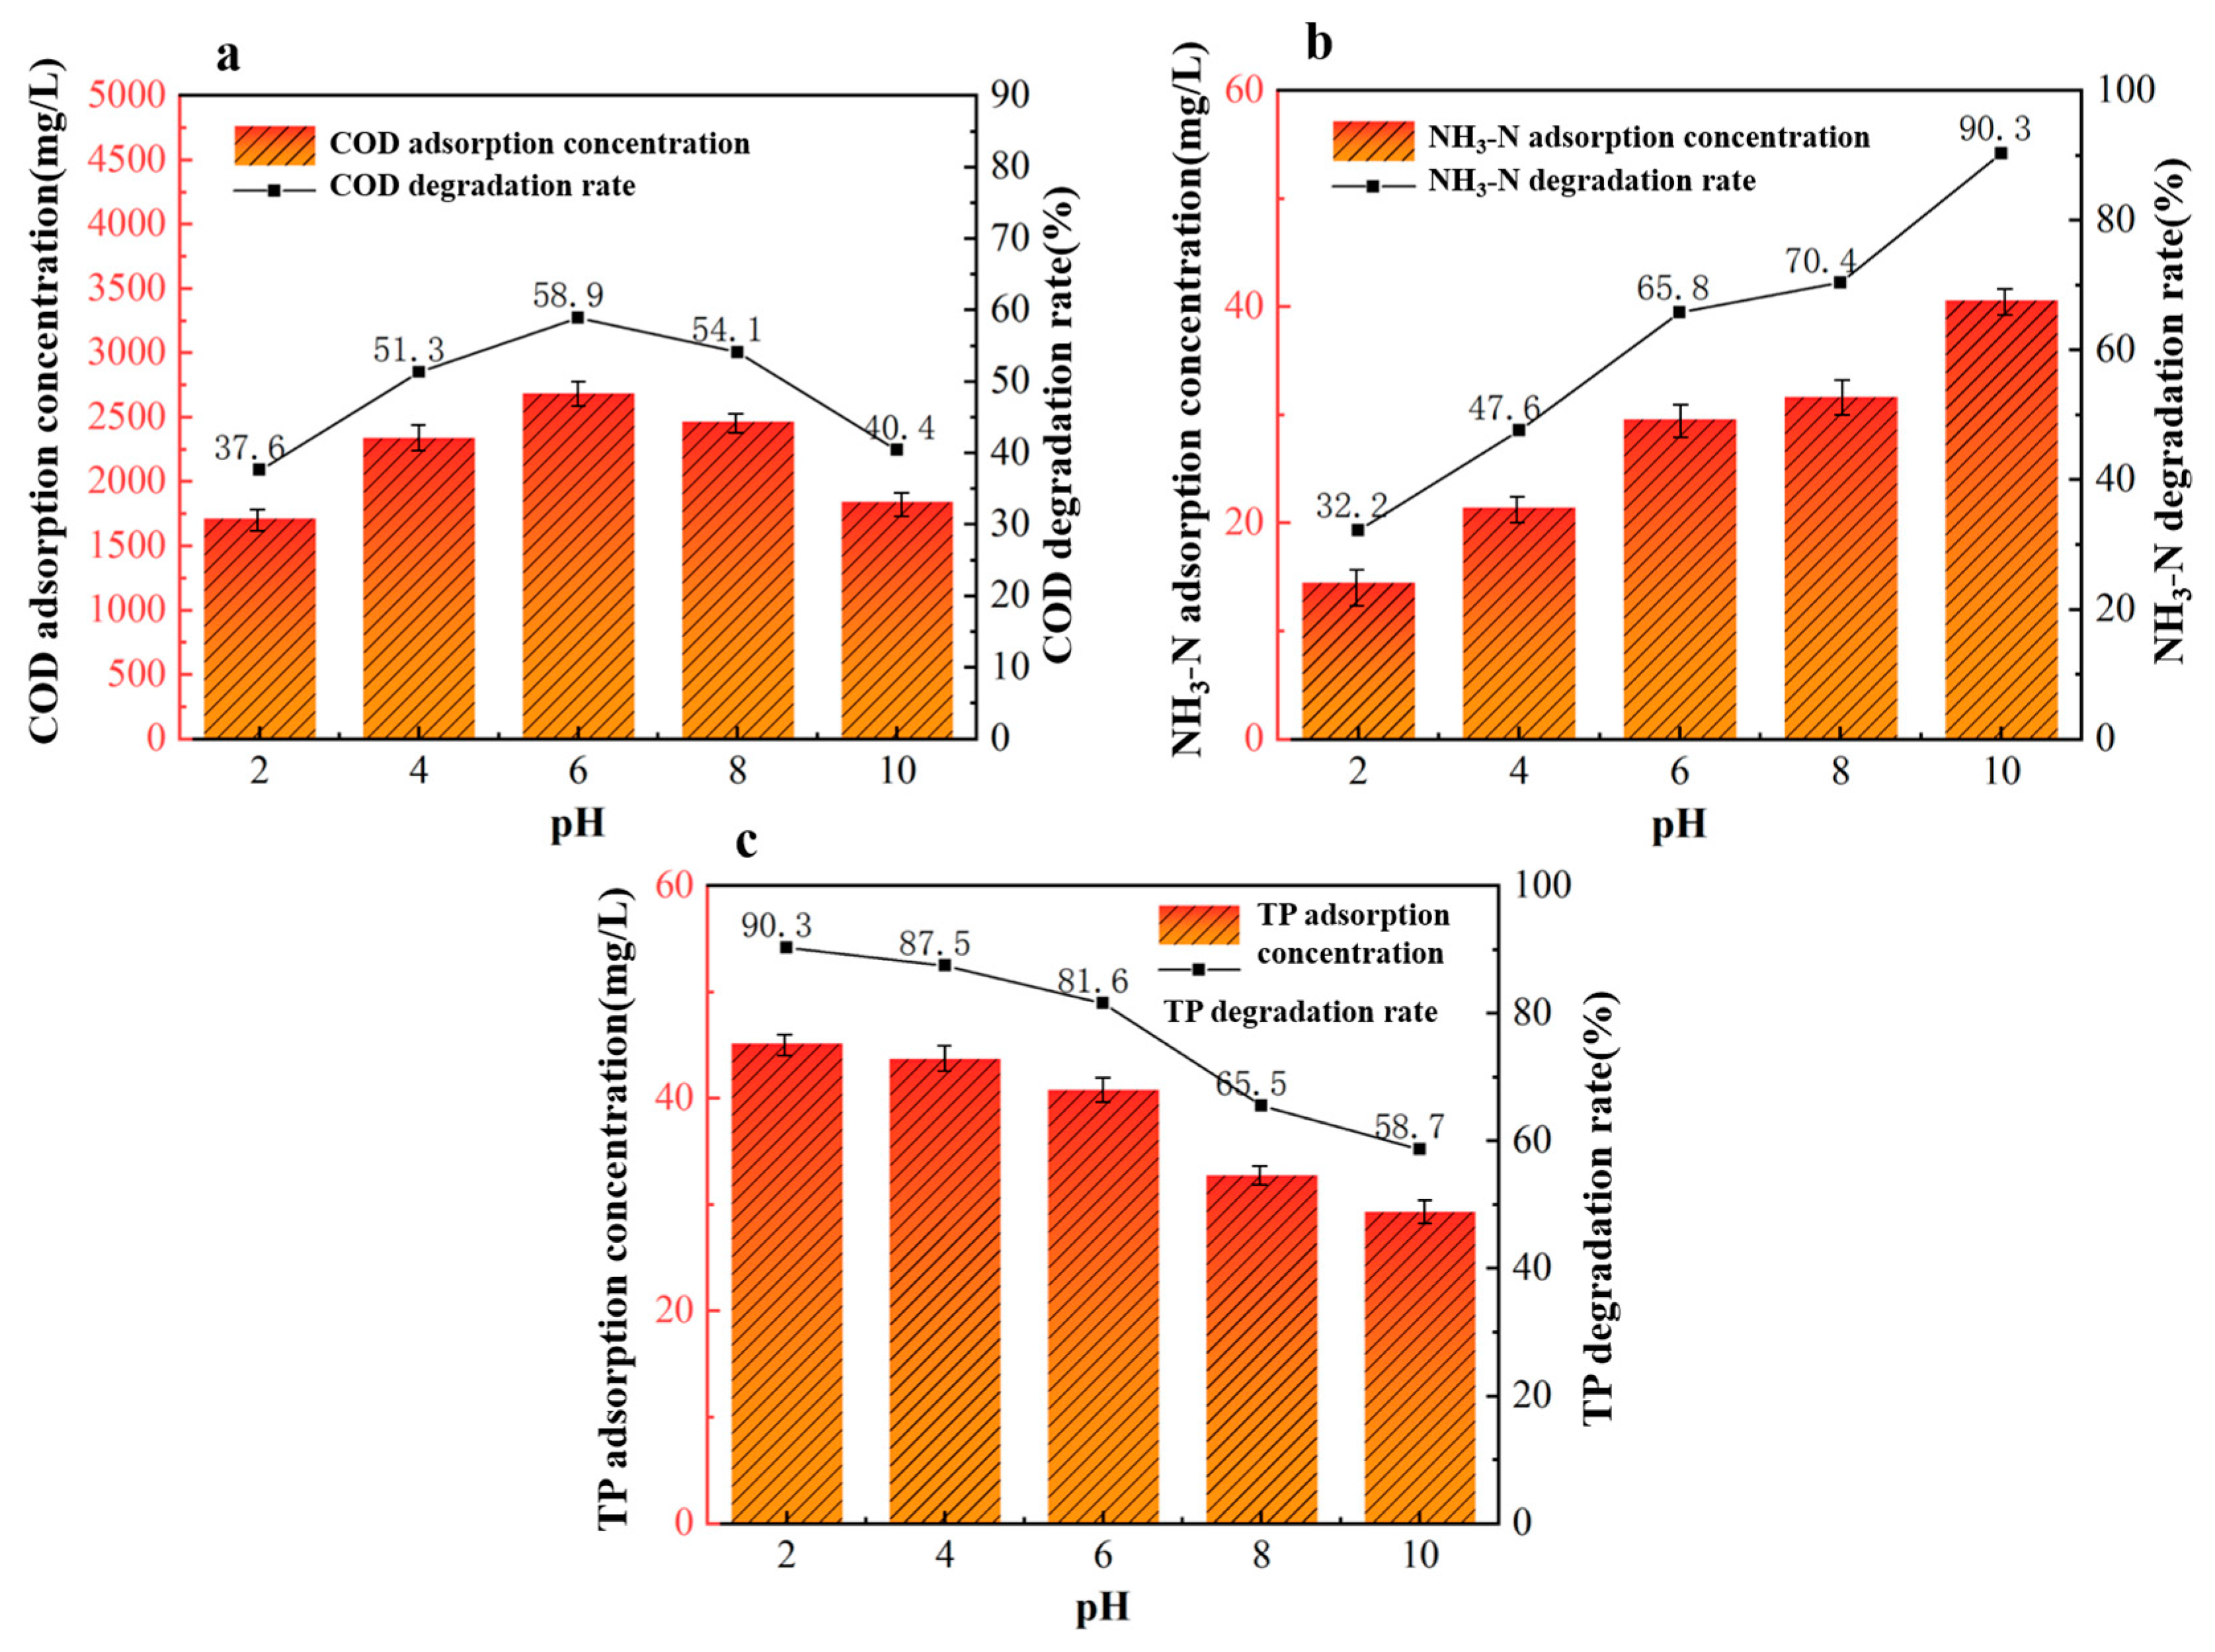
Under fixed conditions of a 40%wt-CBC dosage of 9 g, an adsorption time of 360 min, and an adsorption temperature of 40 °C, we investigated five different reaction pH levels to study their effects on the treatment of potato starch wastewater: pH levels of 2, 4, 6, 8, and 10.
From Figure 9a, we observed that the optimal pH for COD adsorption by 40%wt-CBC is 6. When the pH exceeds 6, the adsorption performance deteriorates, primarily because the increased concentration of OH- hinders the diffusion of compounds in the solution. On the other hand, as seen in Figure 9b, the removal rate of ammonium nitrogen by 40%wt-CBC increases with rising pH. This is mainly due to the reaction of NH4+ with OH- in an alkaline environment, leading to the formation and release of NH3 into the air. Conversely, the removal rate of TP by 40%wt-CBC decreases with increasing pH [33]. In acidic conditions, CS film offers numerous amino and hydroxyl functional groups, enhancing the adsorption of H2PO4− HPO42−. In alkaline conditions, the decrease in H+ and the weakening of protonation effects diminish the adsorption efficiency.

Figure 9.
Effect of reaction pH on COD (a), ammonia nitrogen (b), TP (c) removal by 40% wt-CBC.
3.2.4. Effect of Adsorbent Dosage on the Adsorption Effect of Potato Starch Wastewater
Under fixed conditions of a reaction pH of 6, an adsorption time of 360 min, and an adsorption temperature of 40 °C, we investigated five different dosages of 40%wt-CBC to study their effects on the treatment of potato starch wastewater: 3 g, 6 g, 9 g, 12 g, and 15 g. From Figure 10, we observed that as the dosage of 40%wt-CBC increases, the removal rates of COD, ammonium nitrogen, and TP also rise. When the dosage reaches 12 g/L, all removal rate curves show a stable trend. Therefore, we have chosen a dosage of 12 g 40%wt-CBC as optimal.
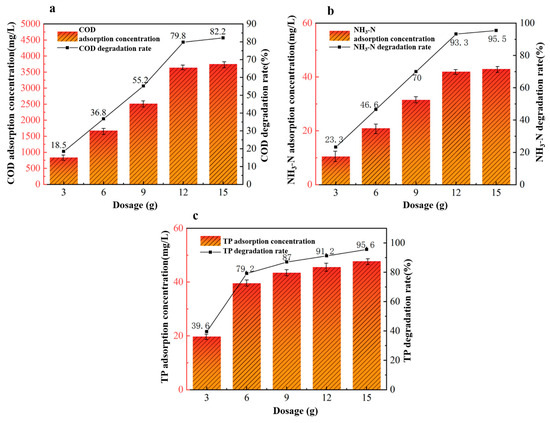
Figure 10.
Effect of 40% wt-CBC dosage on COD (a), ammonia nitrogen (b), TP (c) removal.
In summary, with a dosage of 40%wt-CBC at 12 g, a reaction pH of 6, an adsorption time of 360 min, and an adsorption temperature of 40 °C, the removal rates of COD, ammonium nitrogen, and TP in the wastewater are 79.8%, 93.3%, and 91.2%, respectively. This translates to post-treatment wastewater concentrations of 1200 mg/L for COD, 3 mg/L for ammonium nitrogen, and 4.4 mg/L for TP.
3.2.5. Treatment of Potato Starch Wastewater by Ultrafiltration Method
Under the fixed conditions of an influent temperature of 25 °C and a flow rate of 180 L/min, we studied the relationship between the transmembrane pressure difference, membrane flux, and the wastewater treatment effect.
According to the data in Figure 11, the membrane flux increased from 190 L/h to 360 L/h as the transmembrane pressure difference increased, indicating a significant influence of the pressure difference on the membrane flux. However, when the transmembrane pressure difference exceeded 0.2 MPa, its effect on the membrane flux diminished, stabilizing the flux at 360 L/h. Moreover, as the transmembrane pressure difference increased, the retention rate of the ultrafiltration membrane for COD, ammonium nitrogen, and TP slightly decreased. Yet, within a 0.2 MPa pressure difference, the retention rates remained high: around 98% for COD, 94% for ammonium nitrogen, and 95% for TP [34]. Thus, we consider a transmembrane pressure difference of 0.2 MPa to be the optimal working condition.
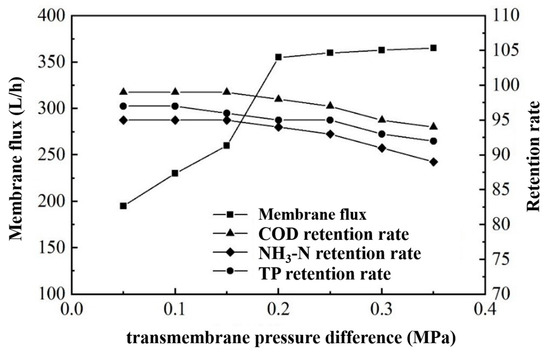
Figure 11.
Effect of transmembrane pressure difference on membrane flux and rejection.
Data from Table 4 show that the potato starch wastewater, post ultrafiltration, had a COD concentration of 24 mg/L, ammonium nitrogen concentration of 0.2 mg/L, TP concentration of 0.25 mg/L, and a turbidity of 2NTU. These values all comply with the GB/T19923-2005 standards. Consequently, this treated wastewater can be reintroduced into the front-end production process, achieving resource recycling and clean production.
Table 4.
Analysis table of reuse water index.
3.3. Adsorption Experiment
3.3.1. Adsorption Kinetics
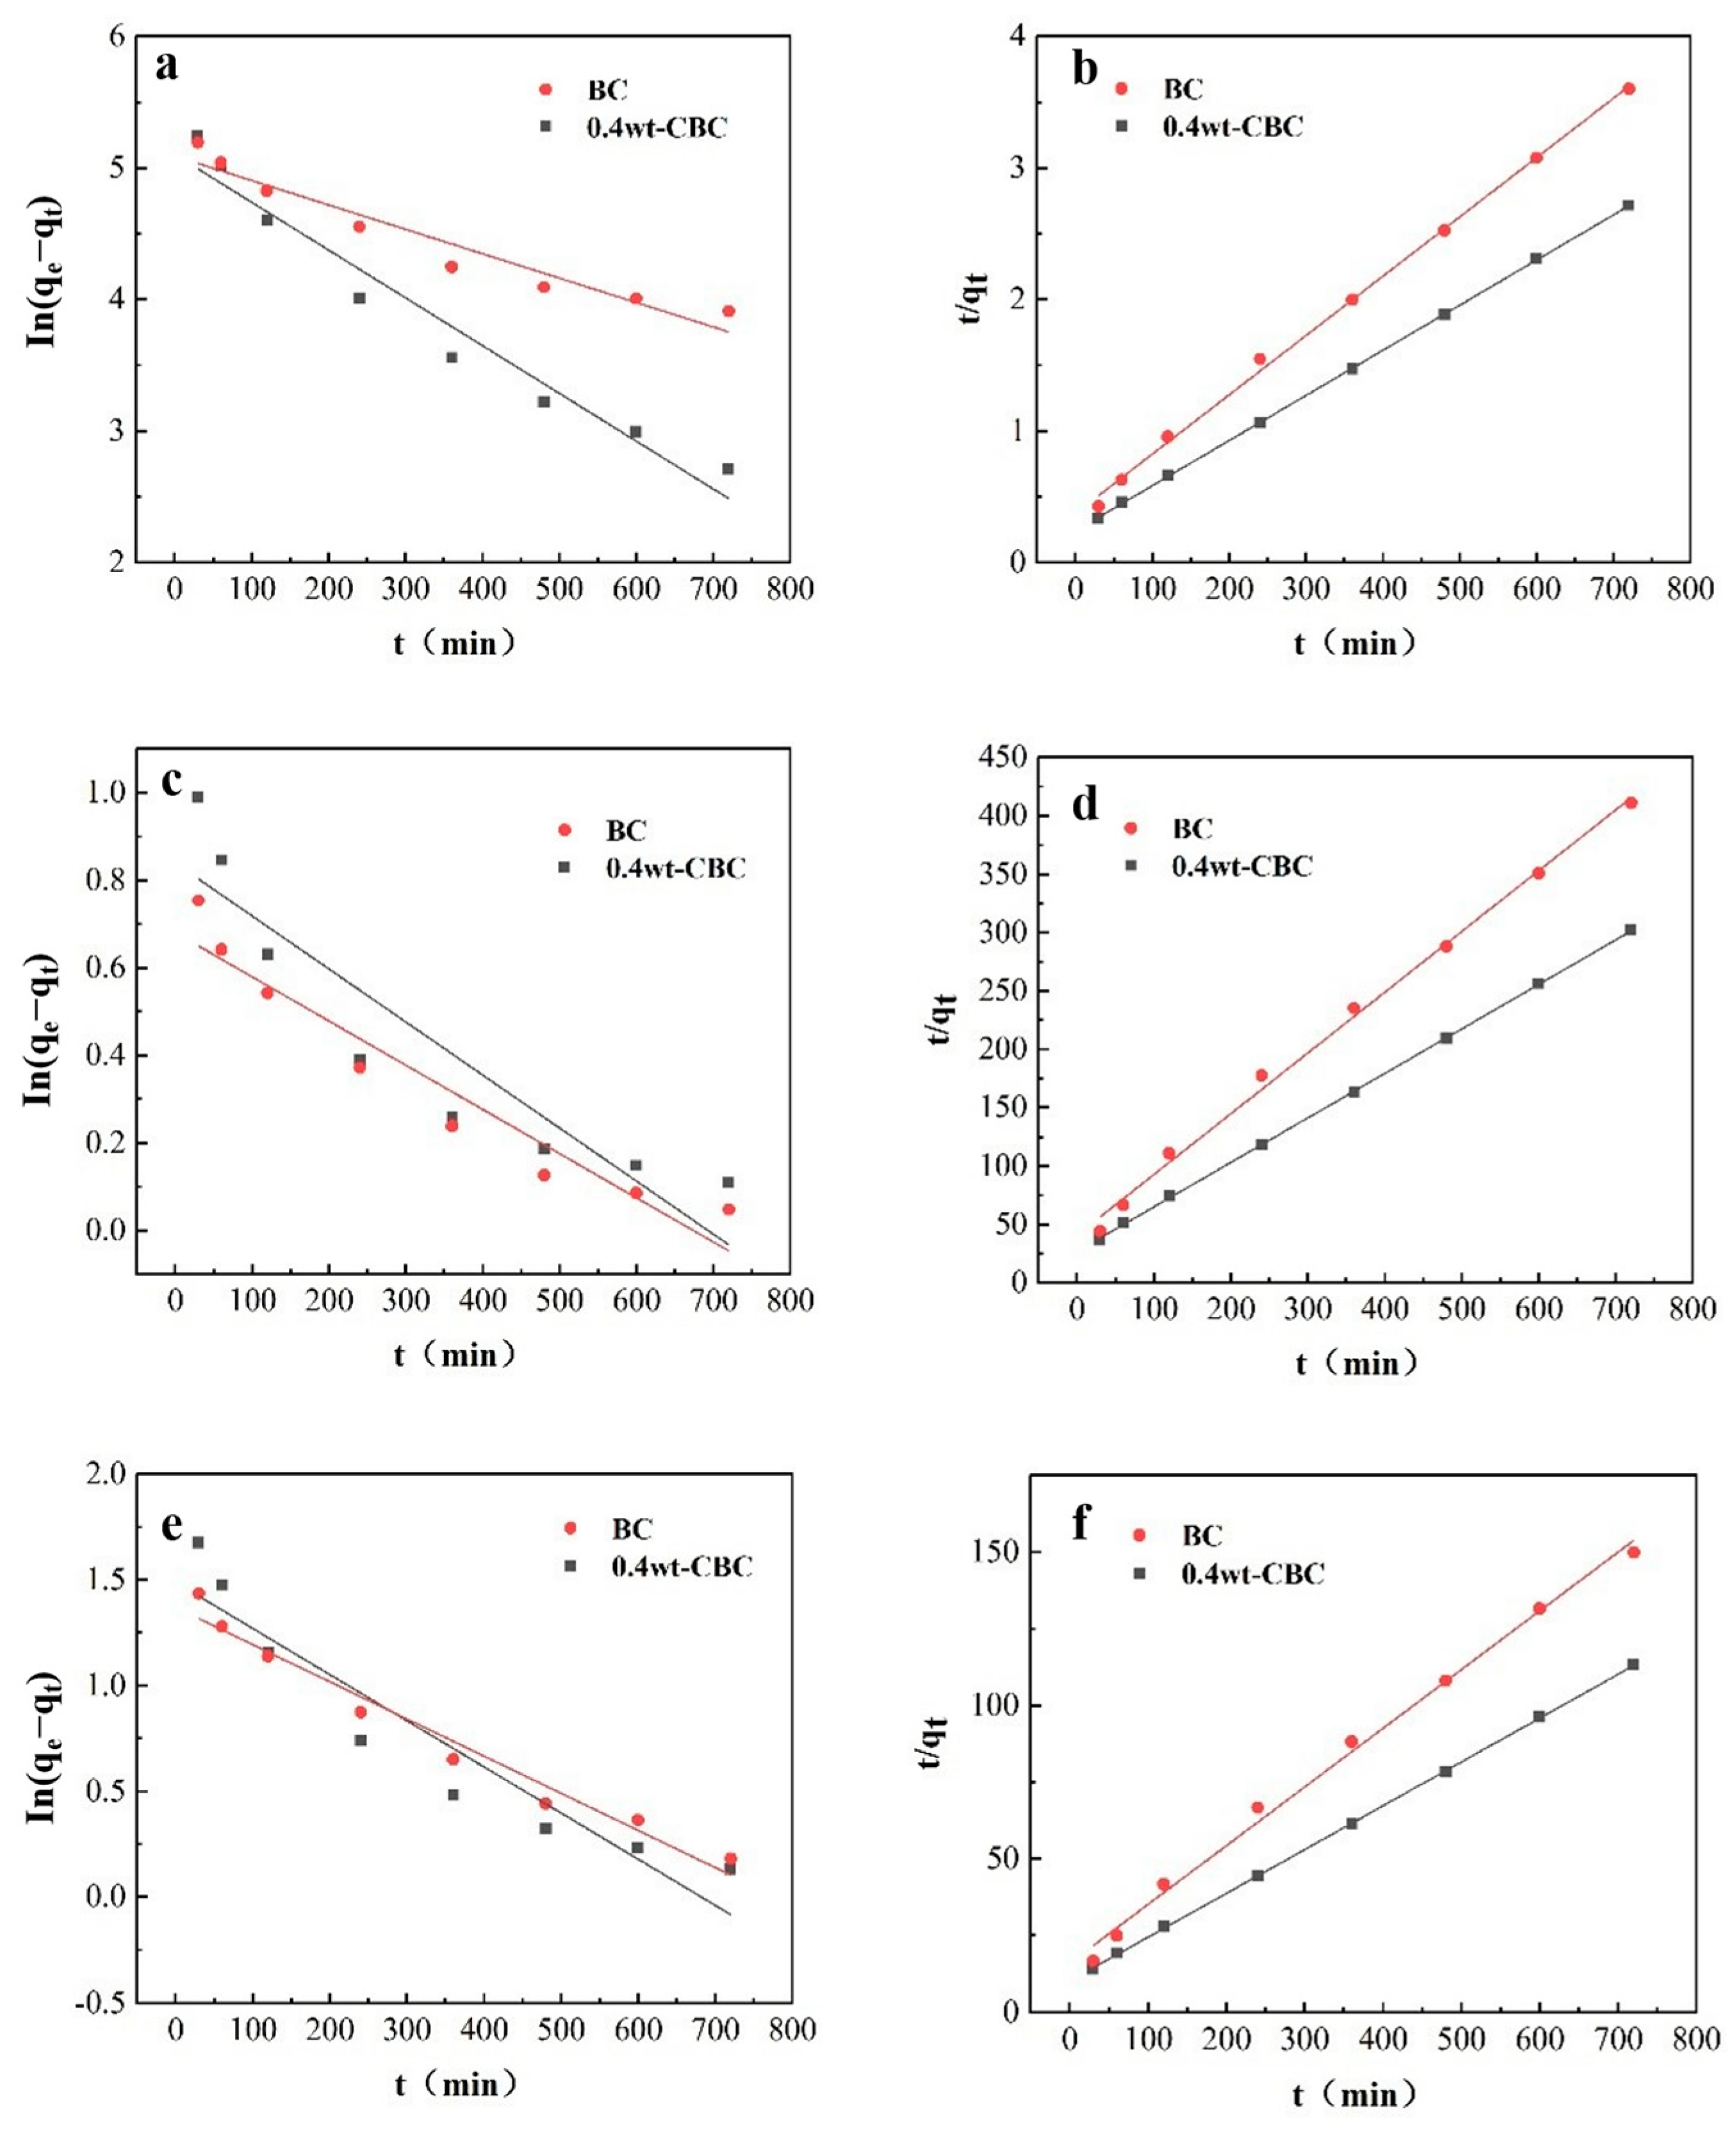
As depicted in Figure 12 and illustrated in Table 5 and Table 6, for BC adsorption of COD, the R2 values for pseudo-first-order and pseudo-second-order kinetics were 0.9272 and 0.9977, respectively. Both were greater than 0.9, but the pseudo-second-order kinetics exhibited a higher R2, indicating that the major factor affecting BC adsorption of COD is a chemical reaction. For 40%wt-CBC adsorbing COD, the R2 values for pseudo-first-order and pseudo-second-order kinetics were 0.9515 and 0.9999, respectively. With the latter having a greater value, it suggests that the primary mechanism for 40%wt-CBC’s COD adsorption is surface chemical reactions. Furthermore, the K1 and K2 values for 40%wt-CBC were higher than BC’s, demonstrating the benefits of CS-loaded BC film in enhancing COD removal.
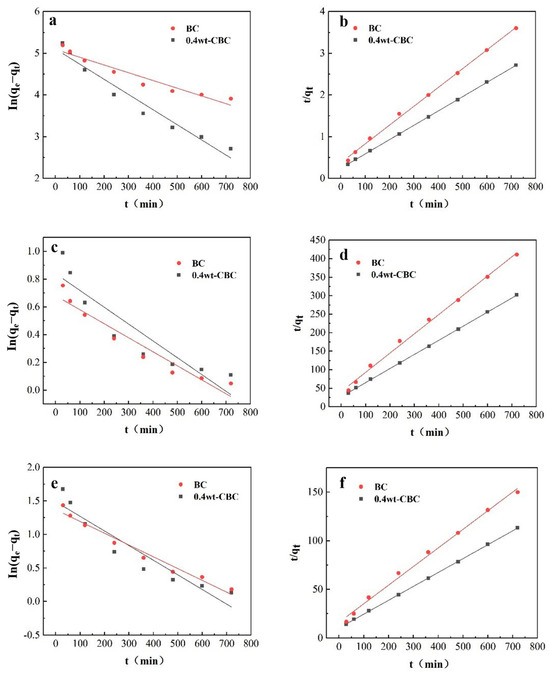
Figure 12.
Quasi−first−order (a) and quasi−second−order (b) fitting curves of COD adsorption by BC and 40%wt−CBC. Quasi−first−order (c) and quasi−second−order (d) fitting curves of adsorption of ammonia nitrogen by BC and 40%wt−CBC. Quasi−first−order (e) and quasi−second−order (f) fitting curves of BC, 40%wt−CBC adsorption of total phosphorus.
Table 5.
Quasi-first-order kinetic parameters of adsorption of COD, ammonia nitrogen and TP by BC and 40%wt-CBC.
Table 6.
Quasi-second-order kinetic parameters of adsorption of COD, ammonia nitrogen and TP by BC and 40%wt-CBC.
Similarly, Figure 12 and Table 3 and Table 4 showed that for BC adsorption of ammonia nitrogen, the pseudo-first-order kinetics R2 of 0.9173 was less than the 0.9957 of the pseudo-second-order kinetics. Yet both exceeded 0.9, which means that the main process in BC adsorption of ammonia nitrogen is a chemical reaction, with intraparticle diffusion playing a supplementary role. For 40%wt-CBC, the pseudo-first-order kinetics R2 was significantly less (0.8274) compared to the 0.9998 of the pseudo-second-order kinetics, pointing to surface chemical reactions as the primary mechanism [35]. Again, the K1 and K2 values of 40%wt-CBC surpassed those of BC, indicating an advantage of CS-loaded BC film in ammonia nitrogen removal.
For BC adsorption of TP, the R2 for pseudo-first-order kinetics was 0.9666, which was less than the 0.9941 of the pseudo-second-order kinetics, suggesting that the main influence in the BC adsorption of phosphorus is the chemical reaction, while intraparticle diffusion also contributes. For 40%wt-CBC, the R2 values were 0.8841 and 0.9998 for pseudo-first and second-order kinetics, respectively [36]. Notably, 40%wt-CBC’s K1 and K2 values were higher than BC’s, emphasizing the benefits of CS-loaded BC film in phosphorus removal.
In conclusion, both BC and 40%wt-CBC primarily undergo chemical reactions during the adsorption of COD, ammonia nitrogen, and TP, aligning with the pseudo-second-order kinetic model. For adsorption of ammonia nitrogen and TP, intraparticle diffusion mechanisms also have a role. The adsorption rates (K1 and K2) show that 40%wt-CBC possesses superior adsorption rates compared to BC, highlighting its efficacy in treating potato starch wastewater pollutants. Thus, the adsorption curves for CBC towards COD, ammonia nitrogen, and TP best fit the pseudo-second-order kinetics, with adsorption capacities closely mirroring equilibrium adsorption capacities, governed by a chemical adsorption mechanism.
3.3.2. Adsorption Isotherm Model
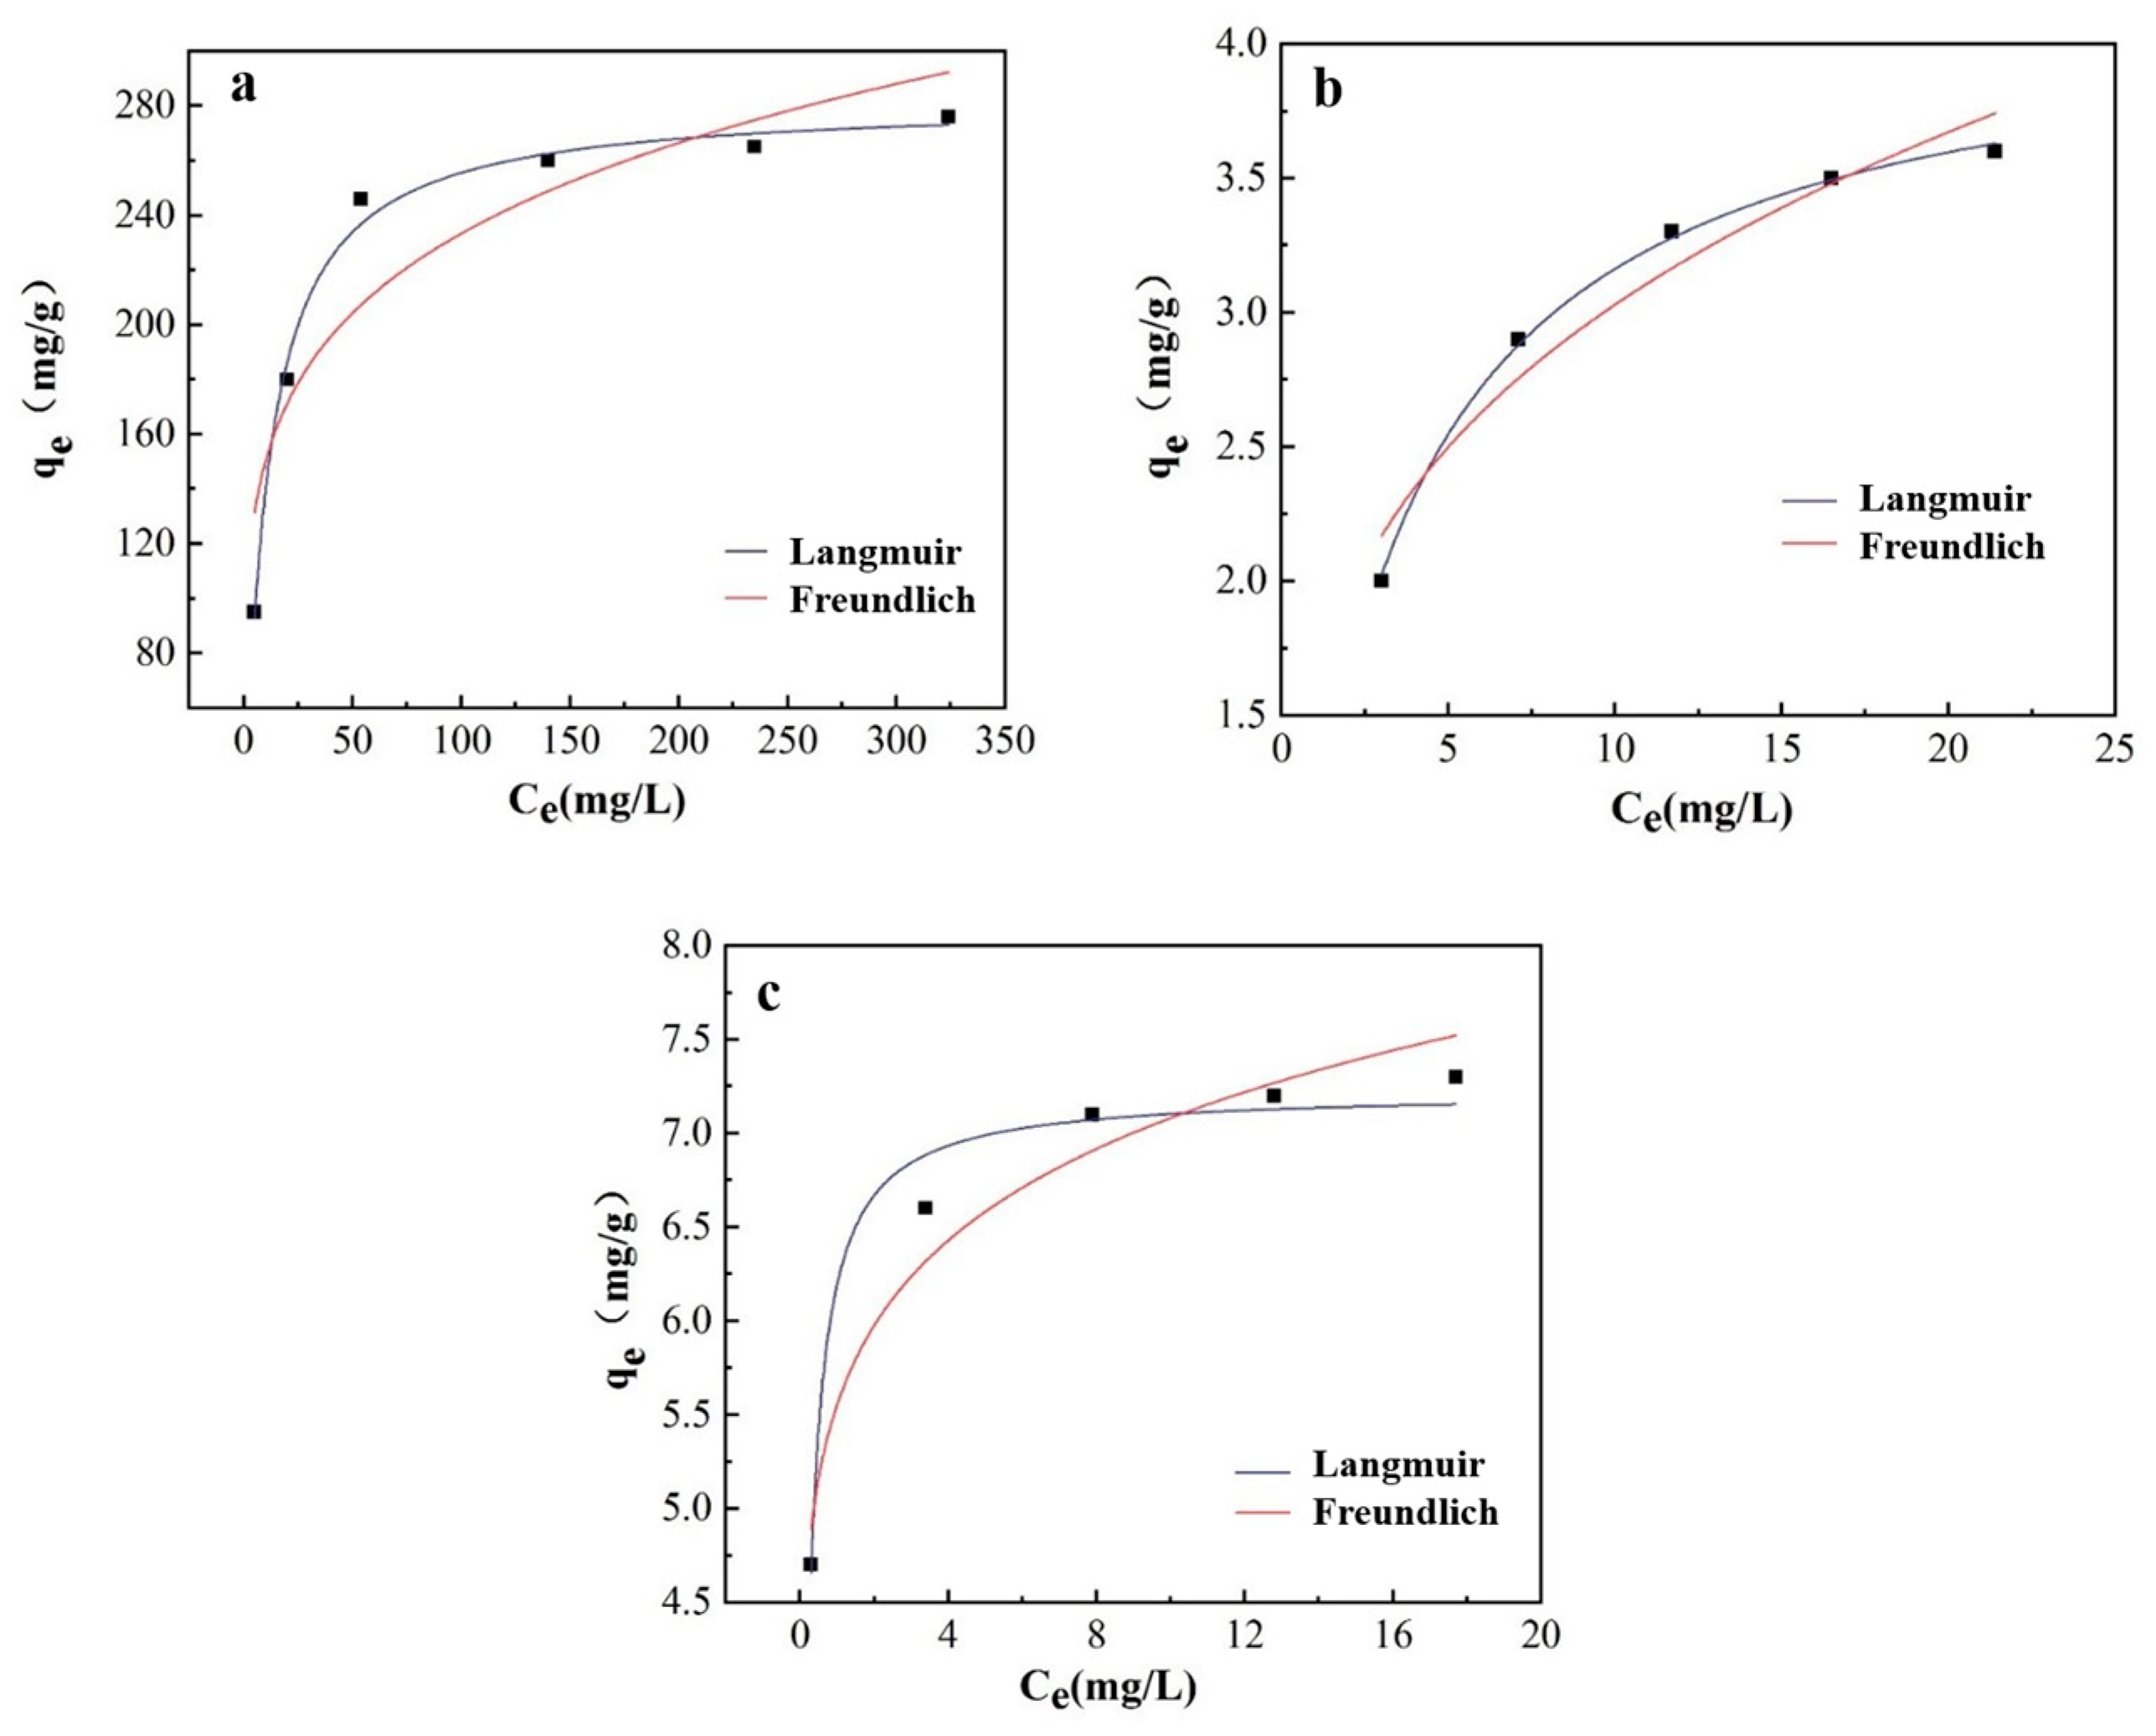
Under the constant temperature of 313K, we conducted three adsorption experiments with 40%wt-CBC for COD, ammonia nitrogen, and TP, as shown in Table 7 and Figure 13.
Table 7.
Langmuir and Freundlich parameters for 40% wt-CBC adsorption of COD, ammonia nitrogen and total phosphorus.
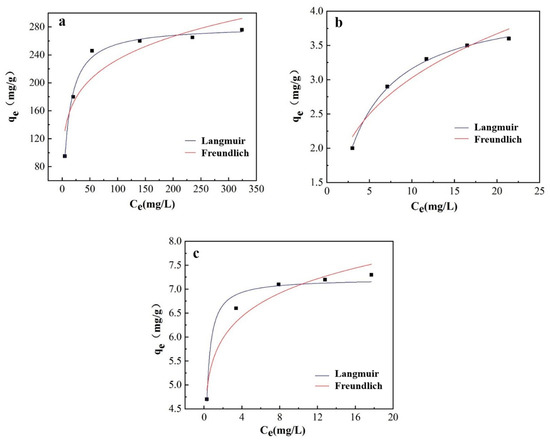
Figure 13.
(a) Langmuir and Freundlich fitting curve of 40%wt-CBC adsorption COD (a), ammonia nitrogen (b) and TP (c).
COD Adsorption Study: At this temperature, COD solutions ranging from 100 mg/L to 600 mg/L were prepared and 100 mg of 40%wt-CBC was added for oscillation experiments. The results indicated that the Langmuir model, with an R2 of 0.9914, was superior to the Freundlich model, which had an R2 value of 0.8287. Furthermore, the qm value of 281.59 mg/g closely matched the experimental data qe(exp) of 280 mg/g. This suggests that the adsorption of COD by 40%wt-CBC primarily follows the Langmuir isotherm model, indicating monolayer adsorption.
Ammonia Nitrogen Adsorption Study: Employing a similar methodology, the concentration range for ammonia nitrogen used was from 5 mg/L to 25 mg/L. The data revealed that for the adsorption of ammonia nitrogen by 40%wt-CBC, the Langmuir model with an R2 of 0.9981 was more fitting compared to the Freundlich model’s R2 value of 0.9303. Moreover, the qm value of 4.17 mg/g was in close agreement with the qe(exp) of 3.5 mg/g. This denotes that the adsorption of ammonia nitrogen also primarily adheres to the Langmuir model [37]. However, given that the Freundlich model’s R2 value exceeded 0.9, multilayer adsorption is also probable.
TP Adsorption Study: The concentration range for TP was also set from 5 mg/L to 25 mg/L. The findings suggested that for the adsorption of TP by 40%wt-CBC, the Langmuir model with an R2 of 0.9685 was preferable over the Freundlich model’s R2 value of 0.9417. In addition, the qm value of 7.22 mg/g closely paralleled the qe(exp) of 7.5 mg/g. This indicates that the adsorption of TP is more aligned with the Langmuir model. However, with the Freundlich model’s R2 value above 0.9, there’s also evidence of multilayer adsorption.
In summary, based on the experimental outcomes, it can be concluded that the adsorption of COD, ammonia nitrogen, and TP by 40%wt-CBC is best described by the Langmuir isotherm model [38]. This implies that there’s minimal interaction between the adsorbates during the CBC adsorption process, predominantly displaying monolayer adsorption.
4. Conclusions
In this study, a novel and comprehensive treatment method for potato starch wastewater was developed, combining the adsorptive properties of CS-modified BC films with subsequent ultrafiltration. The CS–BC composite film underwent thorough characterization using a suite of analytical techniques, including SEM, FTIR, XRD, and BET analysis. The results underscored the CBC’s complex and irregular surface topography, enhanced surface area, reduced pore dimensions, and improved crystallinity, indicative of the successful fusion of CS onto the BC substrate.
Notably, the 40%wt-CBC sample outshone its counterparts in pollutant mitigation, achieving impressive removal efficiencies for COD, ammonia nitrogen, and TP. Under finely tuned conditions—a 40%wt-CBC concentration, 12 g dosage, pH 6, an adsorption duration of 360 min, and a controlled temperature of 40°C—the treatment realized removal efficiencies of 79.8% for COD, 93.3% for ammonia nitrogen, and 91.2% for TP. The adsorption kinetics were primarily governed by a pseudo-second-order model, suggesting chemisorption, while the adsorption isotherm conformed to the Langmuir model, hinting at a monolayer adsorption process without intermolecular interactions between adsorbates.
Subsequent ultrafiltration, leveraging a membrane-based mechanism, efficiently lowered the effluent concentrations to levels compliant with water reuse criteria. This integrated approach, leveraging CS-modified BC film adsorption coupled with ultrafiltration, stands out as a formidable and sustainable solution, bolstering environmental stewardship in the potato starch industry and reinforcing the protection of aquatic ecosystems.
Author Contributions
Conceptualization, J.Z. and T.Z.; methodology, J.Z.; software, T.Z.; validation, S.Y., C.T. and Z.X.; formal analysis, Z.X.; investigation, J.Z.; resources, J.Z.; data curation, J.L.; writing—original draft preparation, J.L.; writing—review and editing, T.Z. and Y.W.; visualization, T.Z.; supervision, J.Z.; project administration, J.Z.; funding acquisition, J.Z. All authors have read and agreed to the published version of the manuscript.
Funding
This research was funded by 2023 Heilongjiang Natural Science Foundation Joint Guidance Project (LH2023E029).
Institutional Review Board Statement
Not applicable.
Informed Consent Statement
Not applicable.
Data Availability Statement
The data presented in this study are available in this article.
Conflicts of Interest
The authors declare no conflict of interest.
References
- Wu, D. Recycle Technology for Waste Residue in Potato Starch Processing: A Review. Procedia Environ. Sci. 2016, 31, 108–112. [Google Scholar] [CrossRef]
- Ahmed, M.A.; Mohamed, A.A. The use of chitosan-based composites for environmental remediation: A review. Int. J. Biol. Macromol. 2023, 242 Pt 2, 124787. [Google Scholar] [CrossRef]
- Ren, Y.; Ma, Y.; Min, G.; Zhang, W.; Lv, L.; Zhang, W. A mini review of multifunctional ultrafiltration membranes for wastewater decontamination: Additional functions of adsorption and catalytic oxidation. Sci. Total Environ. 2021, 762, 143083. [Google Scholar] [CrossRef]
- Luo, K.; Pang, Y.; Wang, D.; Li, X.; Wang, L.; Lei, M.; Huang, Q.; Yang, Q. A critical review on the application of biochar in environmental pollution remediation: Role of persistent free radicals (PFRs). J. Environ. Sci. 2021, 108, 201–216. [Google Scholar] [CrossRef]
- Spoială, A.; Ilie, C.I.; Ficai, D.; Ficai, A.; Andronescu, E. Chitosan-Based Nanocomposite Polymeric Membranes for Water Purification—A Review. Materials 2021, 14, 2091. [Google Scholar] [CrossRef]
- Cheng, N.; Wang, B.; Wu, P.; Lee, X.; Xing, Y.; Chen, M.; Gao, B. Adsorption of emerging contaminants from water and wastewater by modified biochar: A review. Environ. Pollut. 2021, 273, 116448. [Google Scholar] [CrossRef]
- Zhang, Z.; Li, X.; Liu, H.; Zamyadi, A.; Guo, W.; Wen, H.; Gao, L.; Nghiem, L.D.; Wang, Q. Advancements in detection and removal of antibiotic resistance genes in sludge digestion: A state-of-art review. Bioresour. Technol. 2022, 344 Pt A, 126197. [Google Scholar] [CrossRef]
- Wang, J.; Wang, L.; Yu, H.; Zain-Ul-Abdin Chen, Y.; Chen, Q.; Zhou, W.; Zhang, H.; Chen, X. Recent progress on synthesis, property and application of modified chitosan: An overview. Int. J. Biol. Macromol. 2016, 88, 333–344. [Google Scholar] [CrossRef]
- Ko, J.A.; Park, H.J.; Hwang, S.J.; Park, J.B.; Lee, J.S. Preparation and characterization of chitosan microparticles intended for controlled drug delivery. Int. J. Pharm. 2002, 249, 165–174. [Google Scholar] [CrossRef]
- Wang, X.; Guo, Z.; Hu, Z.; Zhang, J. Recent advances in biochar application for water and wastewater treatment: A review. PeerJ 2020, 8, e9164. [Google Scholar] [CrossRef]
- Vardhan, K.H.; Kumar, P.S.; Panda, R.C. A review on heavy metal pollution, toxicity and remedial measures: Current trends and future perspectives. J. Mol. Liq. 2019, 290, 111197. [Google Scholar] [CrossRef]
- Ahmed, S.F.; Kumar, P.S.; Rozbu, M.R.; Chowdhury, A.T.; Nuzhat, S.; Rafa, N.; Mahlia, T.M.I.; Ong, H.C.; Mofijur, M. Heavy metal toxicity, sources, and remediation techniques for contaminated water and soil. Environ. Technol. Innov. 2022, 25, 102114. [Google Scholar] [CrossRef]
- Gao, N.; Du, W.; Zhang, M.; Ling, G.; Zhang, P. Chitosan-modified biochar: Preparation, modifications, mechanisms and applications. Int. J. Biol. Macromol. 2022, 209, 31–49. [Google Scholar] [CrossRef]
- Li, M.; Zhu, X.; Yang, H.; Xie, X.; Zhu, Y.; Xu, G.; Hu, X.; Jin, Z.; Hu, Y.; Hai, Z.; et al. Treatment of potato starch wastewater by dual natural flocculants of chitosan and poly-glutamic acid. J. Clean. Prod. 2020, 264, 121641. [Google Scholar] [CrossRef]
- Li, H.; Zeng, X.; Shi, W.; Zhang, H.; Huang, S.; Zhou, R.; Qin, X. Recovery and purification of potato proteins from potato starch wastewater by hollow fiber separation membrane integrated process. Innov. Food Sci. Emerg. Technol. 2020, 63, 102380. [Google Scholar] [CrossRef]
- Liu, Q.; Wang, Y.; Sun, S.; Tang, F.; Chen, H.; Chen, S.; Zhao, C.; Li, L. A novel chitosan-biochar immobilized microorganism strategy to enhance bioremediation of crude oil in soil. Chemosphere 2023, 313, 137367. [Google Scholar] [CrossRef]
- Xu, H.; Li, X.; Gao, M.; Hu, X.; Zhang, X.; Li, Y.; Xu, X.; Hu, J.; Tang, C.; Hu, X. Chitosan and biochar synergize the efficient elimination of lead from wastewater by sulfidised nano-zero-valent iron. J. Environ. Chem. Eng. 2022, 10, 107101. [Google Scholar] [CrossRef]
- Zhang, X.; Zheng, H.; Wu, J.; Chen, W.; Chen, Y.; Gao, X.; Yang, H.; Chen, H. Physicochemical and adsorption properties of biochar from biomass-based pyrolytic polygeneration:effects of biomass species and temperature. Biochar 2021, 3, 657–670. [Google Scholar]
- Wysokinski, A.; Kalembasa, S.; Kuziemska, B. The content of chromium and copper in plants and soil fertilized with sewage sludge with addition of various amounts of CaO and lignite ash. Soil Sci. Annu. 2016, 67, 117. [Google Scholar] [CrossRef]
- Wang, Y.; Xiao, X.; Xu, Y.; Chen, B. Environmental Effects of Silicon within Biochar (Sichar) and Carbon-Silicon Coupling Mechanisms: A Critical Review. Environ. Sci. Technol. 2019, 53, 13570–13582. [Google Scholar] [CrossRef]
- Quy, D.V.; Hieu, N.M.; Tra, P.T.; Nam, N.H.; Hai, N.H.; Thai Son, N.; Nghia, P.T.; Anh, N.T.V.; Hong, T.T.; Luong, N.H. Synthesis of silica-coated magneticnanoparticles and application in the detection of patho-genic viruses. J. Nanomater. 2013, 2013, 603940. [Google Scholar] [CrossRef]
- Liu, L.; Yang, X.; Ahmad, S.; Li, X.; Ri, C.; Tang, J.; Ellam, R.M.; Song, Z. Silicon (Si) modification of biochars from different Si-bearing precursors improves cadmium remediation. Chem. Eng. J. 2023, 457, 141194. [Google Scholar] [CrossRef]
- Zhang, S.; Yang, X.; Liu, L.; Ju, M.; Zheng, K. Adsorption behavior of selective recognition functionalized biochar to Cd (II) in wastewater. Materials 2018, 11, 299. [Google Scholar] [CrossRef]
- Ngo, H.H.; Guo, W.; Nguyen, T.H.; Luong, T.M.L.; Nguyen, X.H.; Phan, T.L.A.; Nguyen, M.P.; Nguyen, M.K. New chitosan-biochar composite derived from agricultural waste for removing sulfamethoxazole antibiotics in water. Bioresour. Technol. 2023, 385, 129384. [Google Scholar]
- Mistar, E.M.; Ahmad, S.; Muslim, A.; Alfatah, T.; Supardan, M.D. Preparation and characterization of a high surface area of activated carbon from Bambusa vulgaris—Effect of NaOH activation and pyrolysis temperature. In IOP Conference Series: Materials Science and Engineering; IOP Publishing: Bristol, UK, 2018; Volume 334, p. 012051. [Google Scholar]
- Fan, H.; Ma, X.; Zhou, S.; Huang, J.; Liu, Y.; Liu, Y. Highly efficient removal of heavy metal ions by carboxymethyl cellulose-immobilized Fe3O4 nanoparticles prepared via high-gravity technology. Carbohydr. Polym. 2019, 213, 39–49. [Google Scholar] [CrossRef]
- Riaz, M.; Yasmeen, T.; Arif, M.S.; Ashraf, M.A.; Hussain, Q.; Shahzad, S.M.; Rizwan, M.; Mehmood, M.W.; Zia, A.; Mian, I.A.; et al. Variations in morphological and physiological traits of wheat regulated by chromium species in long-term tannery effluent irrigated soils. Chemosphere 2019, 222, 891–903. [Google Scholar] [CrossRef]
- Bazrafshan, E.; Mohammadi, L.; Ansari-Moghaddam, A.; Mahvi, A.H. Heavy metals removal from aqueous environments by electrocoagulation process—A systematic review. J. Environ. Health Sci. Eng. 2015, 13, 74. [Google Scholar] [CrossRef]
- Xia, D.; Li, H.; Mannering, J.; Huang, P.; Zheng, X.; Kulak, A.; Baker, D.; Iruretagoyena, D.; Menzel, R. Electrically Heatable Graphene Aerogels as Nanoparticle Supports in Adsorptive Desulfurization and High-ressure CO2 Capture. Adv. Funct. Mater. 2020, 30, 2002788. [Google Scholar] [CrossRef]
- Kolya, H.; Kang, C.W. Synthesis of starch-based smart hydrogel derived from rice-cooked wastewater for agricultural use. Int. J. Biol. Macromol. 2023, 226, 1477–1489. [Google Scholar] [CrossRef]
- Choque-Quispe, D.; Ligarda-Samanez, C.A.; Choque-Quispe, Y.; Solano-Reynoso, A.M.; Ramos-Pacheco, B.S.; Zamalloa-Puma, M.M.; Álvarez-López, G.J.; Zamalloa-Puma, A.; Choque-Quispe, K.; Alzamora-Flores, H. Multimetal removal in aqueous medium using a potato starch/nopal mucilage copolymer: A study of adsorption kinetics and isotherms. Results Eng. 2023, 18, 101164. [Google Scholar] [CrossRef]
- Zhang, T. Starch wastewater treatment and resource reuse research. J. Energy Environ. Prot. 2021, 4, 173–177+182. [Google Scholar]
- Zong, J.; Yuan, F.; Zhan, M.; Xu, W.; Cheng, G.; Yu, A. Numerical simulation of a mechanical flocculation process with multi-chambers in series. Water Sci. Technol. 2023, 87, 1945–1960. [Google Scholar] [CrossRef] [PubMed]
- Wang, X.; Huang, X.; Pan, Y. Quaternary ammonium salt of modified chitosan film preparation research progress and application. J. Chem. Eng. Equip. 2021, 8, 226–227. [Google Scholar]
- Sharifnia, S.; Khadivi, M.A.; Shojaeimehr, T.; Shavisi, Y. Characterization, isotherm and kinetic studies for ammonium ion adsorption by light expanded clay aggregate (LECA). J. Saudi Chem. Soc. 2016, 20 (Suppl. 1), S342–S351. [Google Scholar] [CrossRef]
- Rajahmundry, G.K.; Garlapati, C.; Kumar, P.S.; Alwi, R.S.; Vo, D.N. Statistical analysis of adsorption isotherm models and its appropriate selection. Chemosphere 2021, 276, 130176. [Google Scholar] [CrossRef]
- Wang, J.; Guo, X. Adsorption isotherm models: Classification, physical meaning, application and solving method. Chemosphere 2020, 258, 127279. [Google Scholar] [CrossRef]
- Hu, Q.; Lan, R.; He, L.; Liu, H.; Pei, X. A critical review of adsorption isotherm models for aqueous contaminants: Curve characteristics, site energy distribution and common controversies. J. Environ. Manag. 2023, 329, 117104. [Google Scholar] [CrossRef]


Disclaimer/Publisher’s Note: The statements, opinions and data contained in all publications are solely those of the individual author(s) and contributor(s) and not of MDPI and/or the editor(s). MDPI and/or the editor(s) disclaim responsibility for any injury to people or property resulting from any ideas, methods, instructions or products referred to in the content. |
© 2023 by the authors. Licensee MDPI, Basel, Switzerland. This article is an open access article distributed under the terms and conditions of the Creative Commons Attribution (CC BY) license (https://creativecommons.org/licenses/by/4.0/).