
Oil Extracted from Spent Coffee Grounds as a Green Corrosion Inhibitor for Copper in a 3 wt% NaCl Solution


Abstract
:1. Introduction
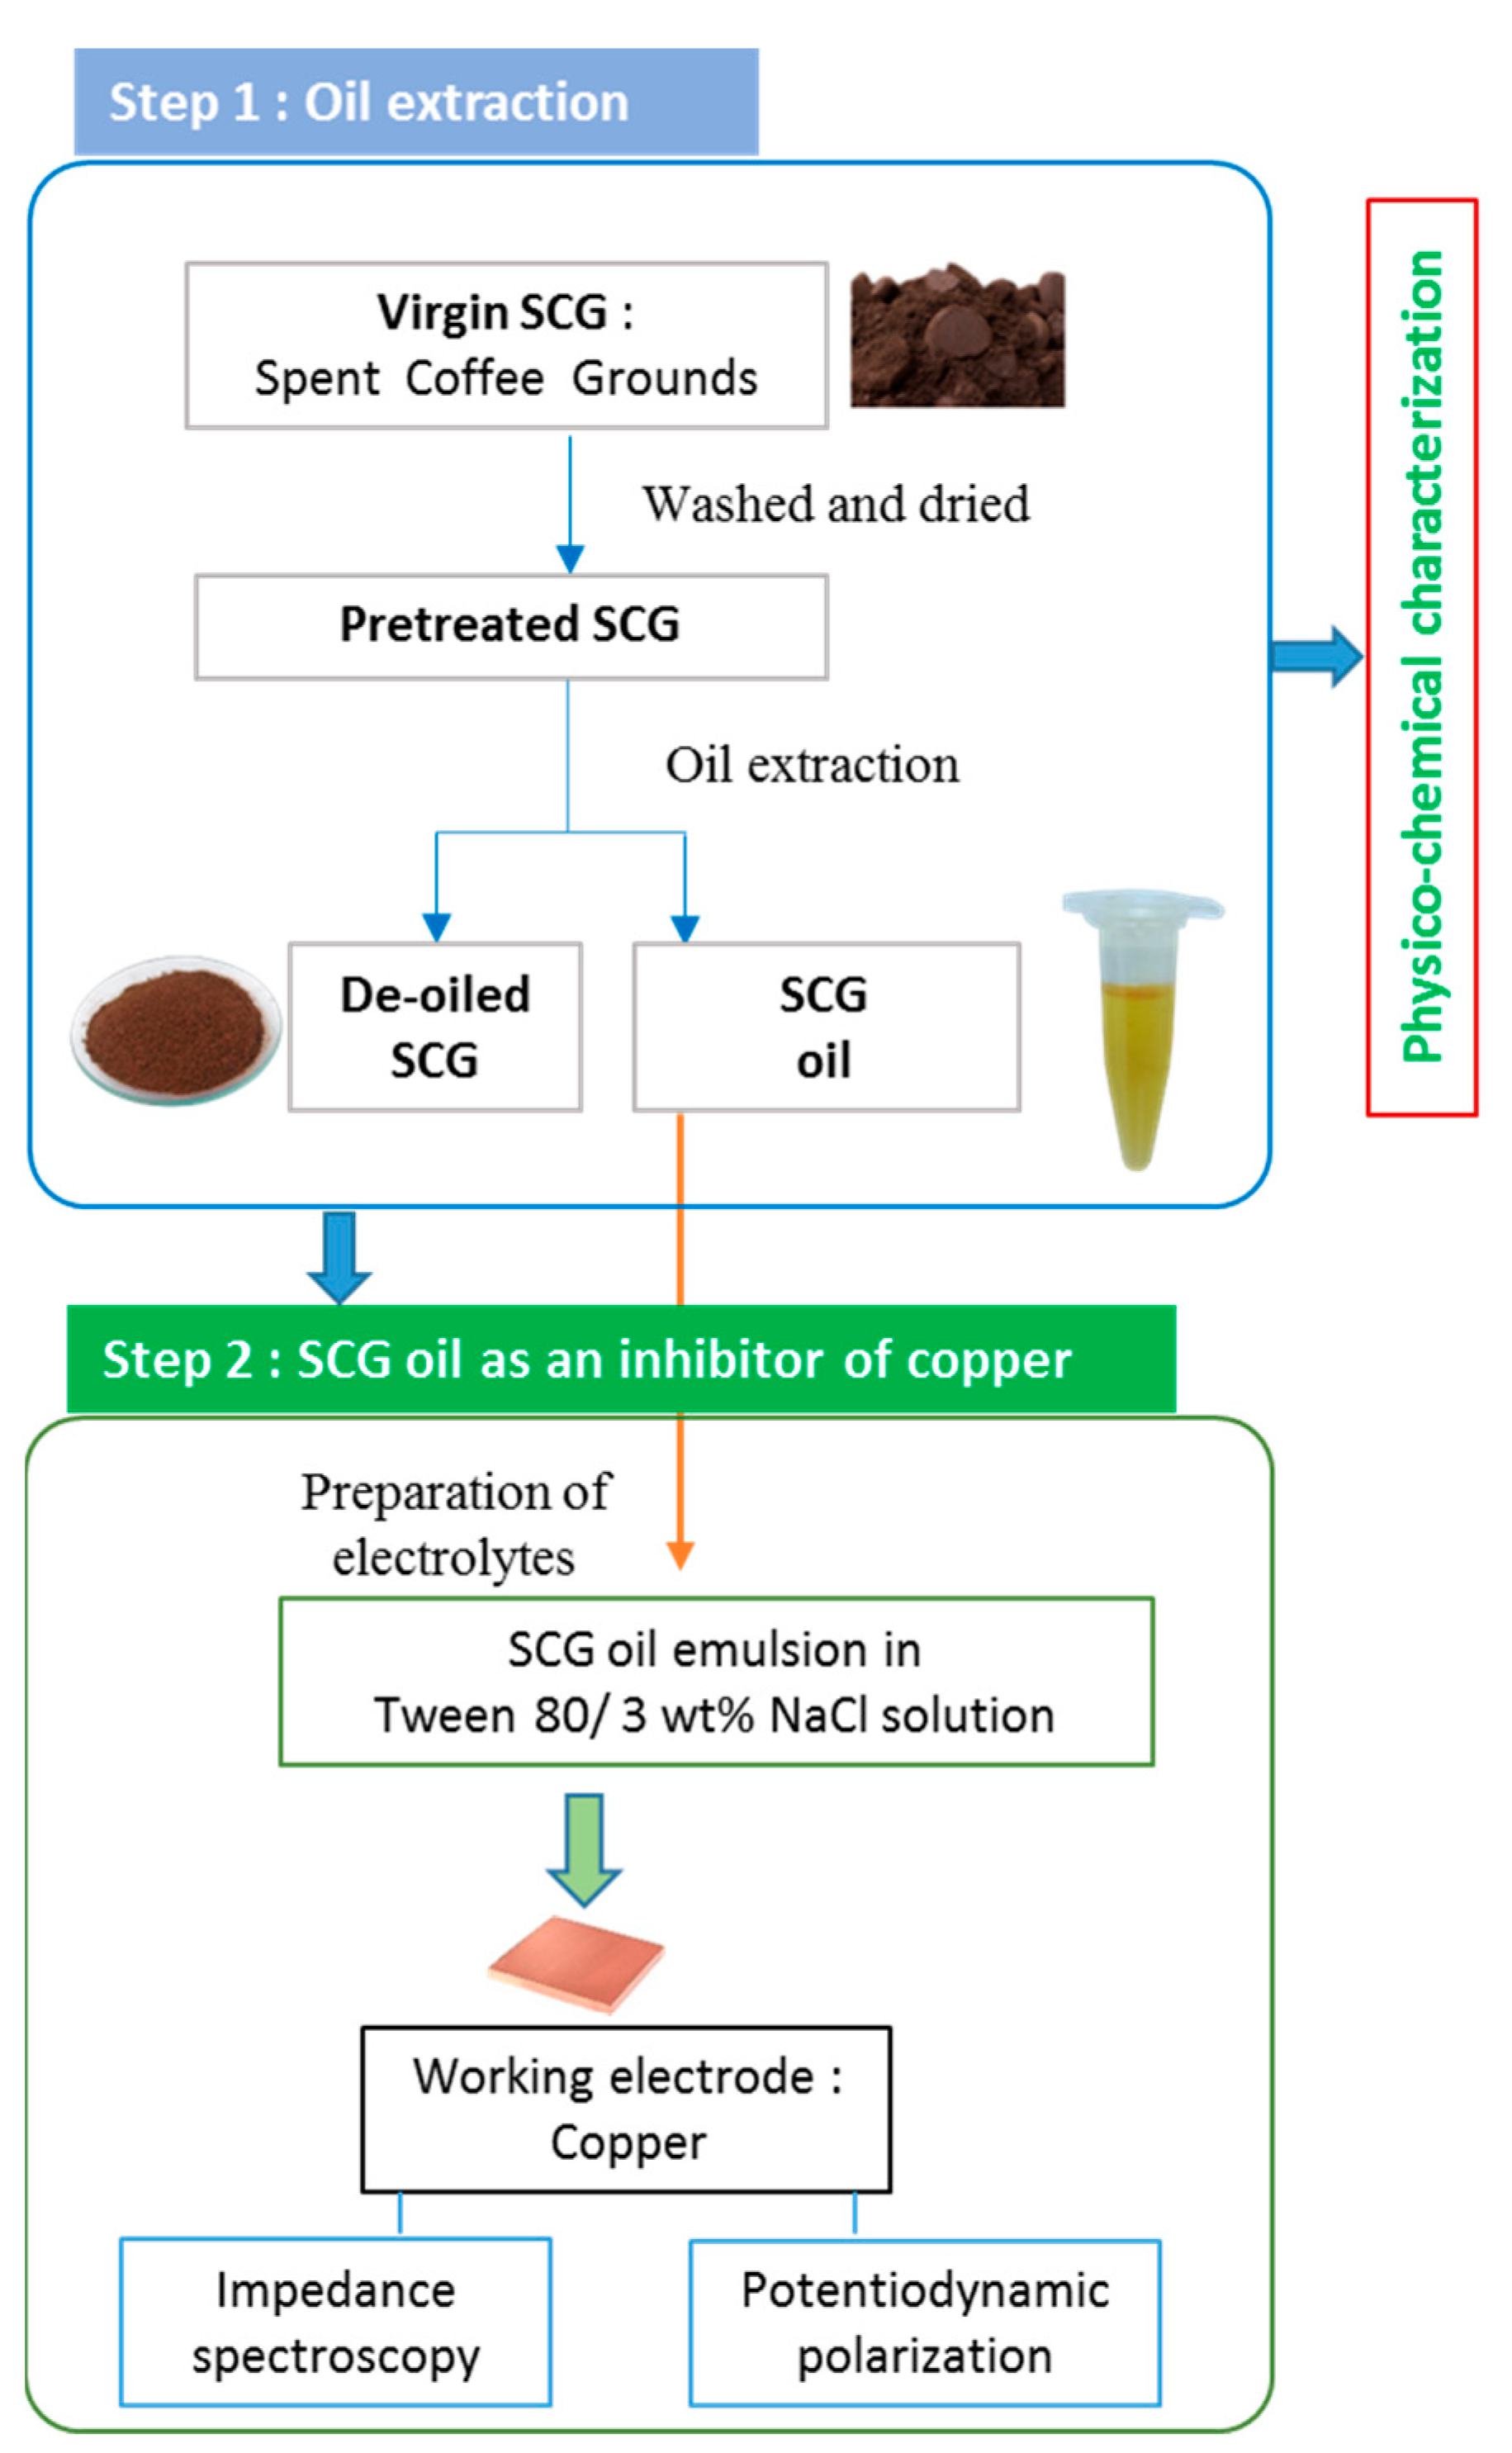
2. Experimental
2.1. Materials
2.2. Characterization of the SCG Extract
2.3. Electrochemical Measurements
3. Results and Discussion
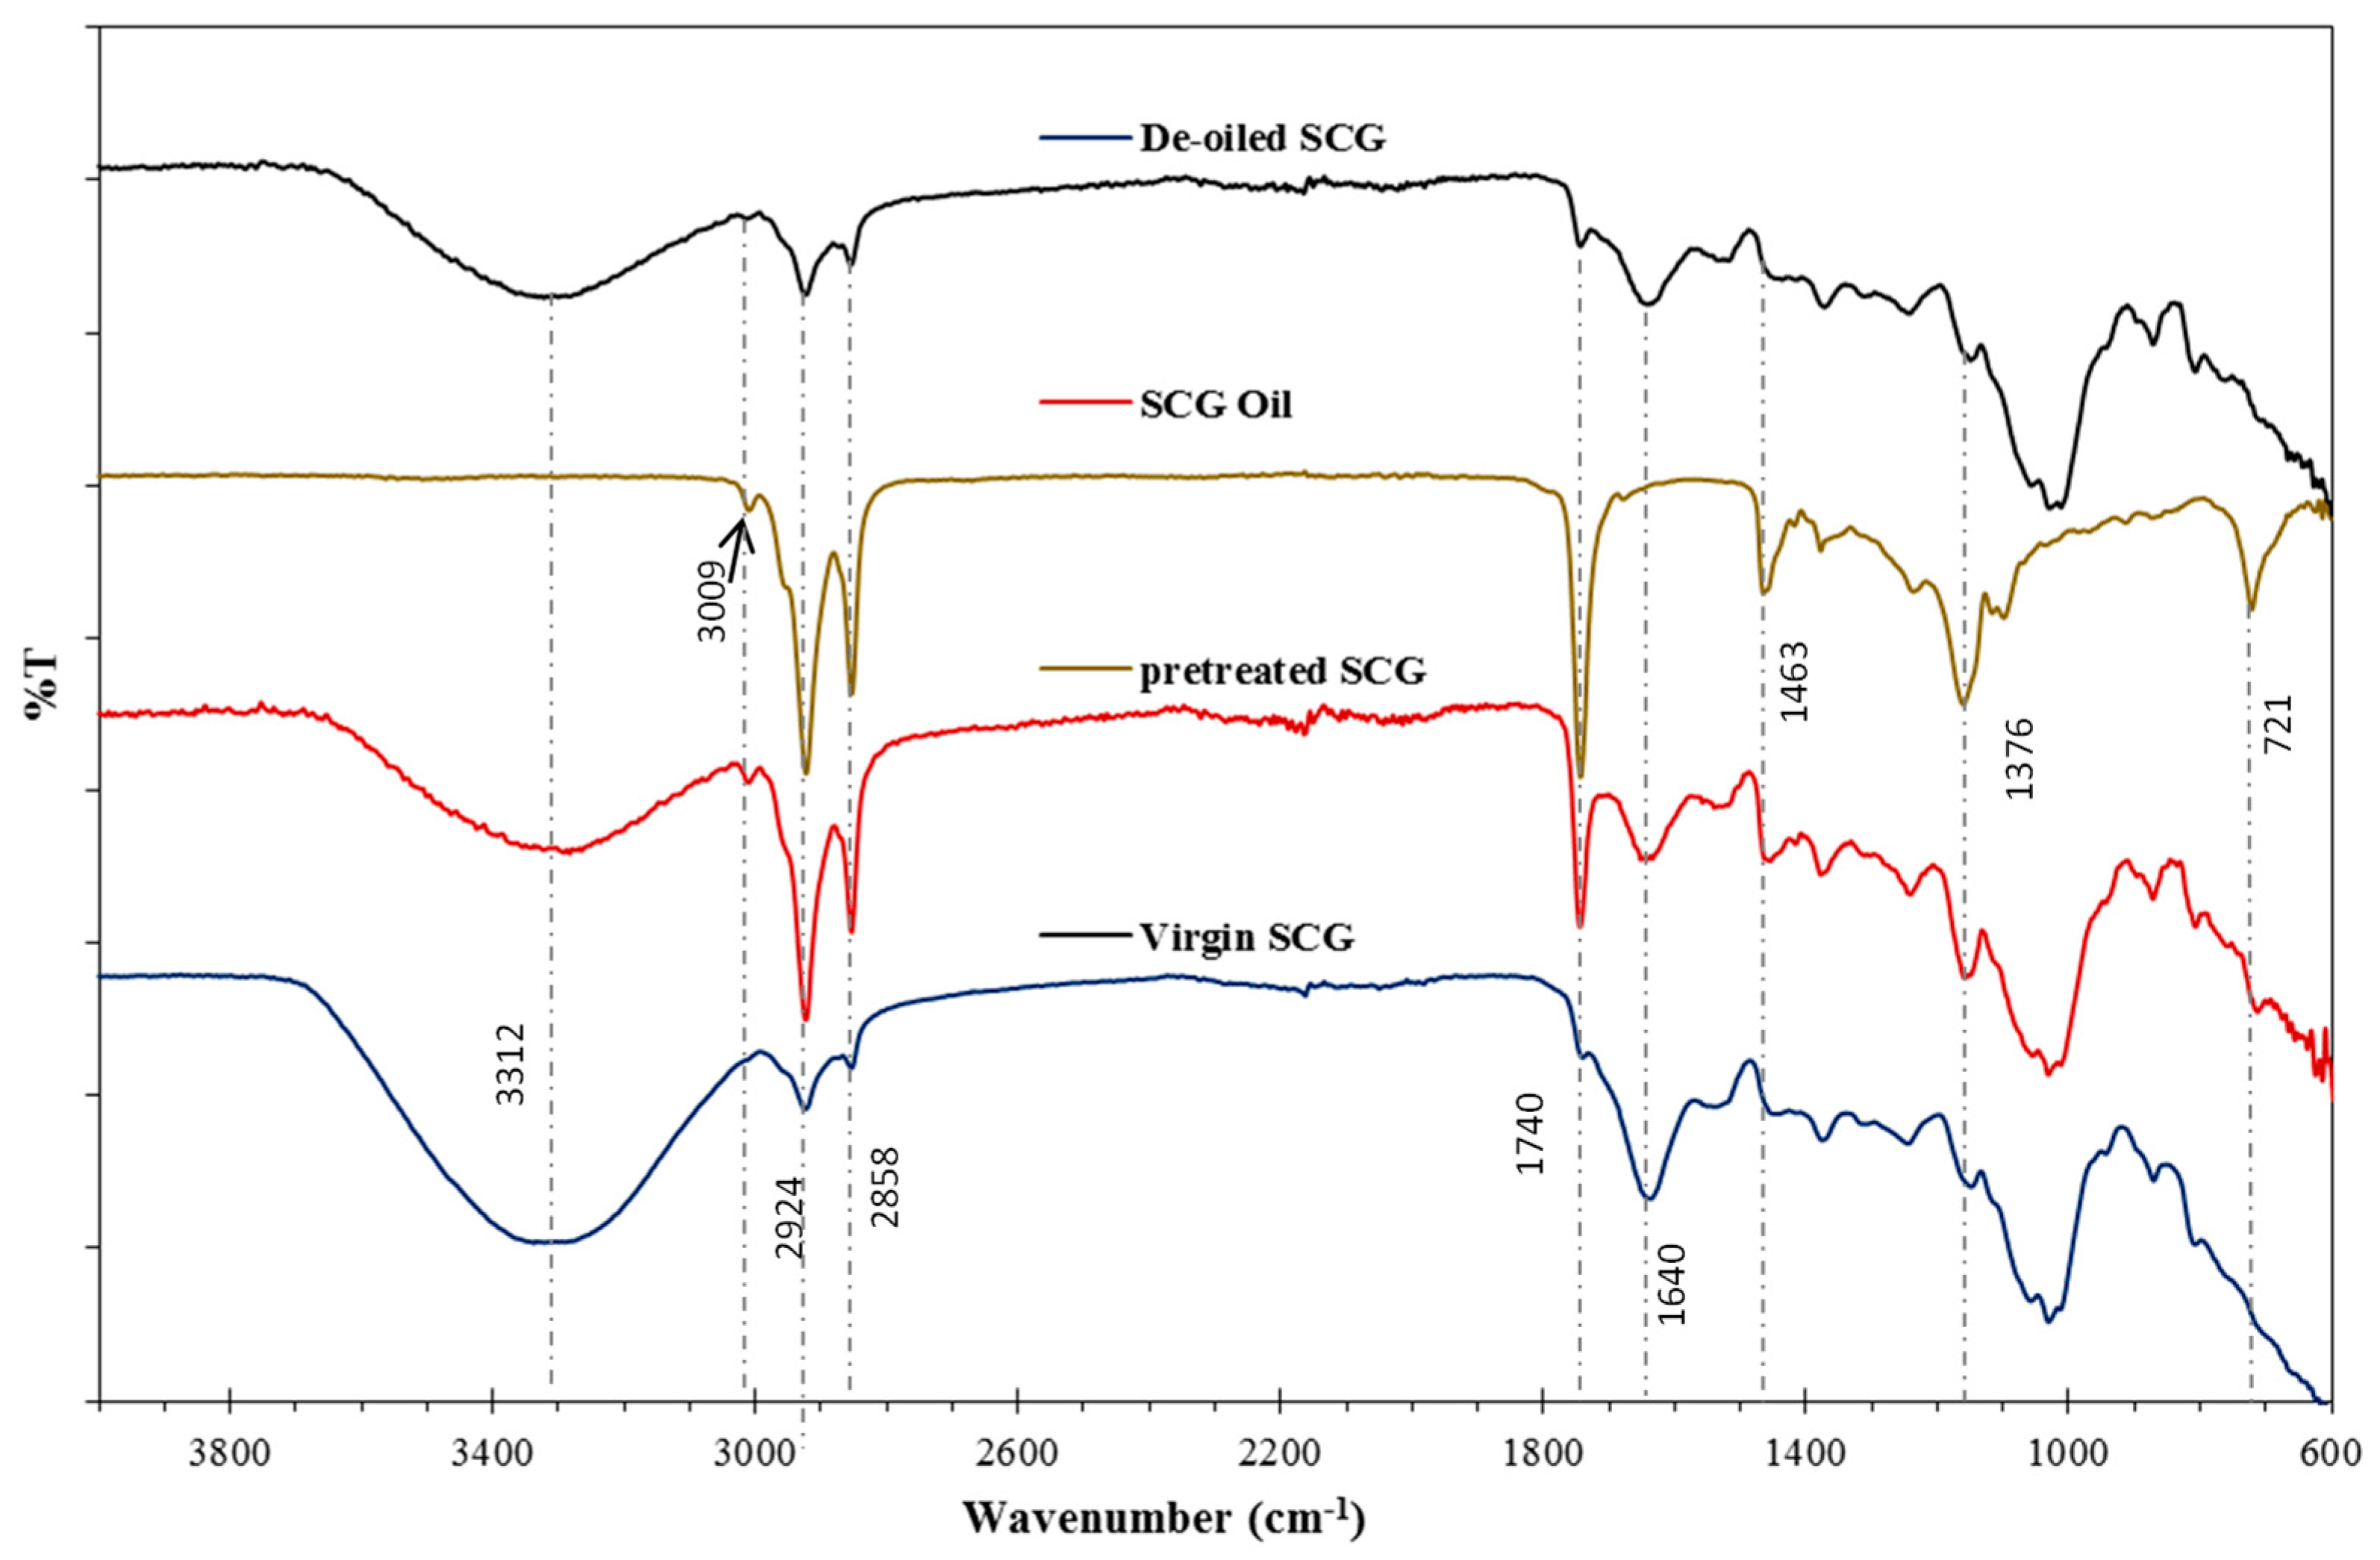
3.1. FTIR Spectral Analysis
- (i)
- The ester carbonyl group’s vibration (C=O) was observed between 1740 cm−1 and 1744 cm−1, which is a characteristic feature of carbonyl groups found in lipids, esters, and carboxylic acids [28].
- (ii)
- The region around 1639 cm−1 in the FTIR spectrum corresponds to the presence of C=C bonds.


| Wavenumbers (cm−1) | Attributions | |
|---|---|---|
| SCG Samples | SCG Oil | |
| 3312 | --- | O-H stretching vibration |
| --- | 3009 | C-H stretching symmetric vibration of the cis double bonds [35] |
| 2924 2858 | 2921 2853 | Asymmetric and symmetric stretching vibration of C-H bonds of aliphatic CH3 [32,35] |
| 1740 | 1746 | Stretching vibration of ester carbonyl functional groups (C=O) |
| 1463 | 1463 | Bending vibration of C-H of CH2 and CH3 aliphatic group |
| 1640 | C=C stretching vibration cis-olefins [35] | |
| 1369 | 1376 | Bending symmetric vibration of C-H bonds of CH2 groups [35] |
| 1100 | 1161 | Stretching vibration of C-O-C ester groups [36] |
| 1400–900 | 1400–900 | Stretching vibration of (C-O), (C-H), (C-N) [27,30,31] |
| 721 | 721 | =C-H Aliphatic CH2 rocking vibration and cis substituted olefin out-of-plane vibration overlapping [32,37] |
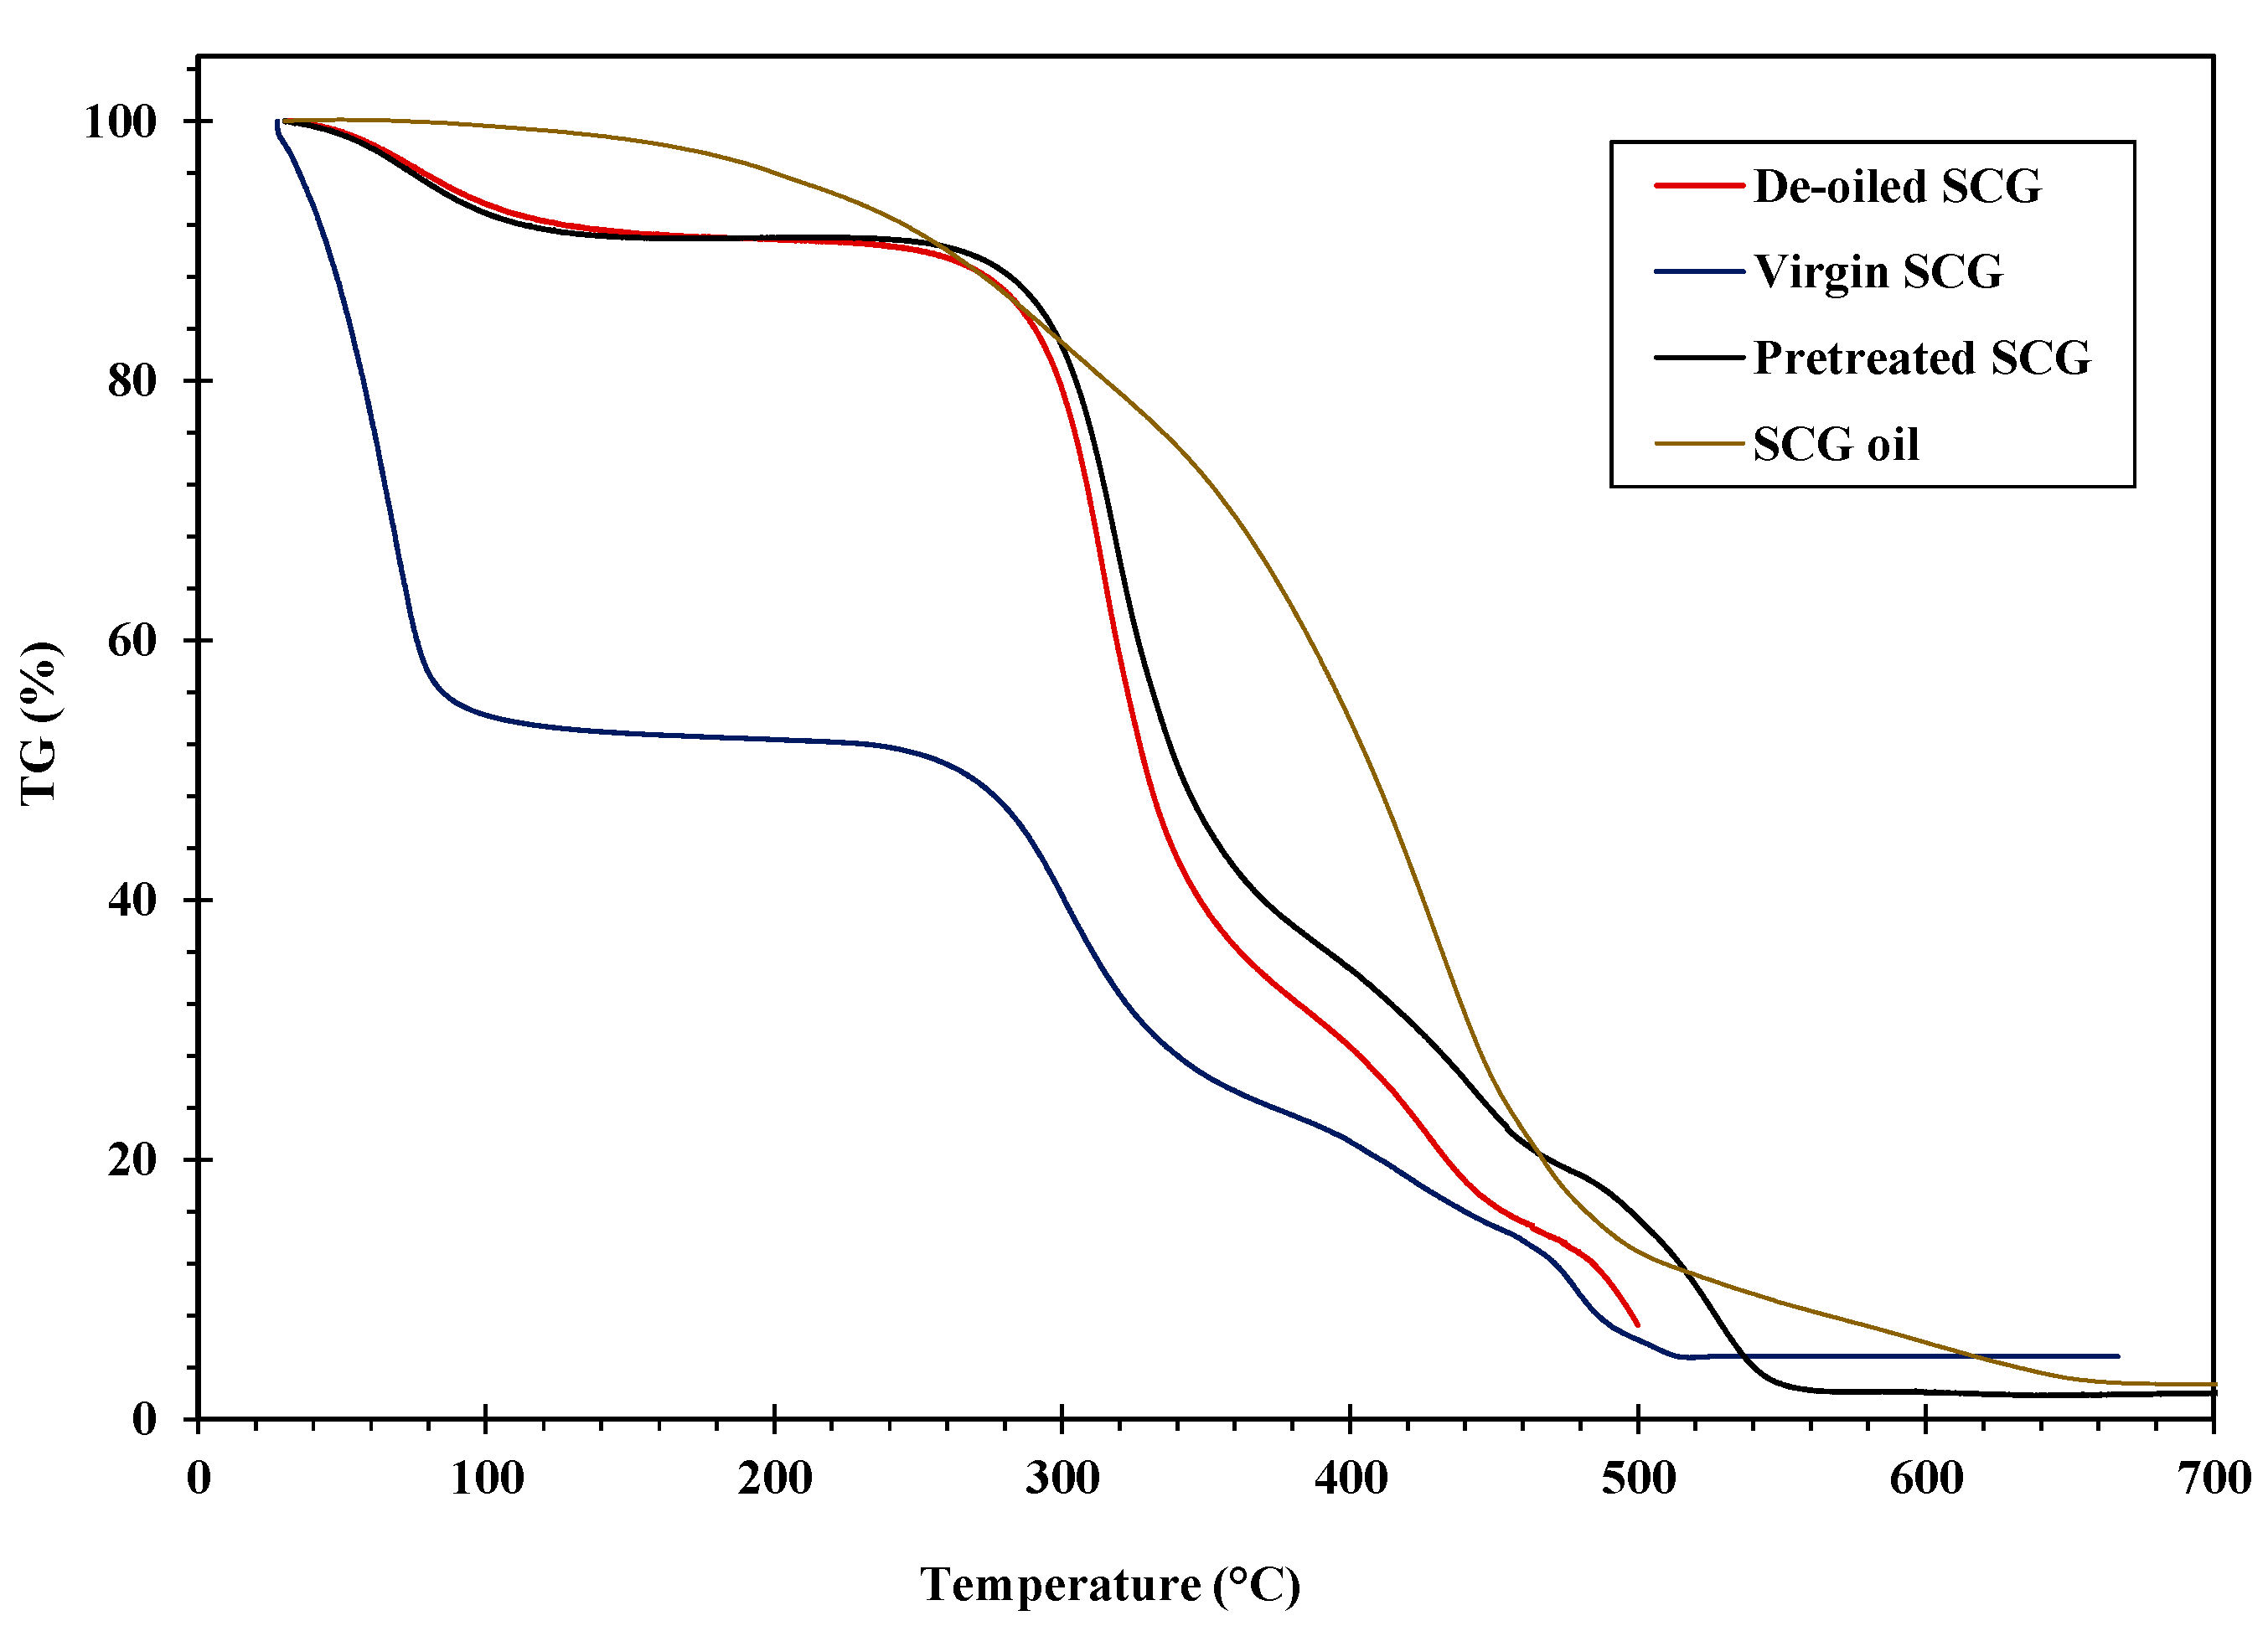
3.2. Thermogravimetric Analysis
3.3. Electrochemical Studies
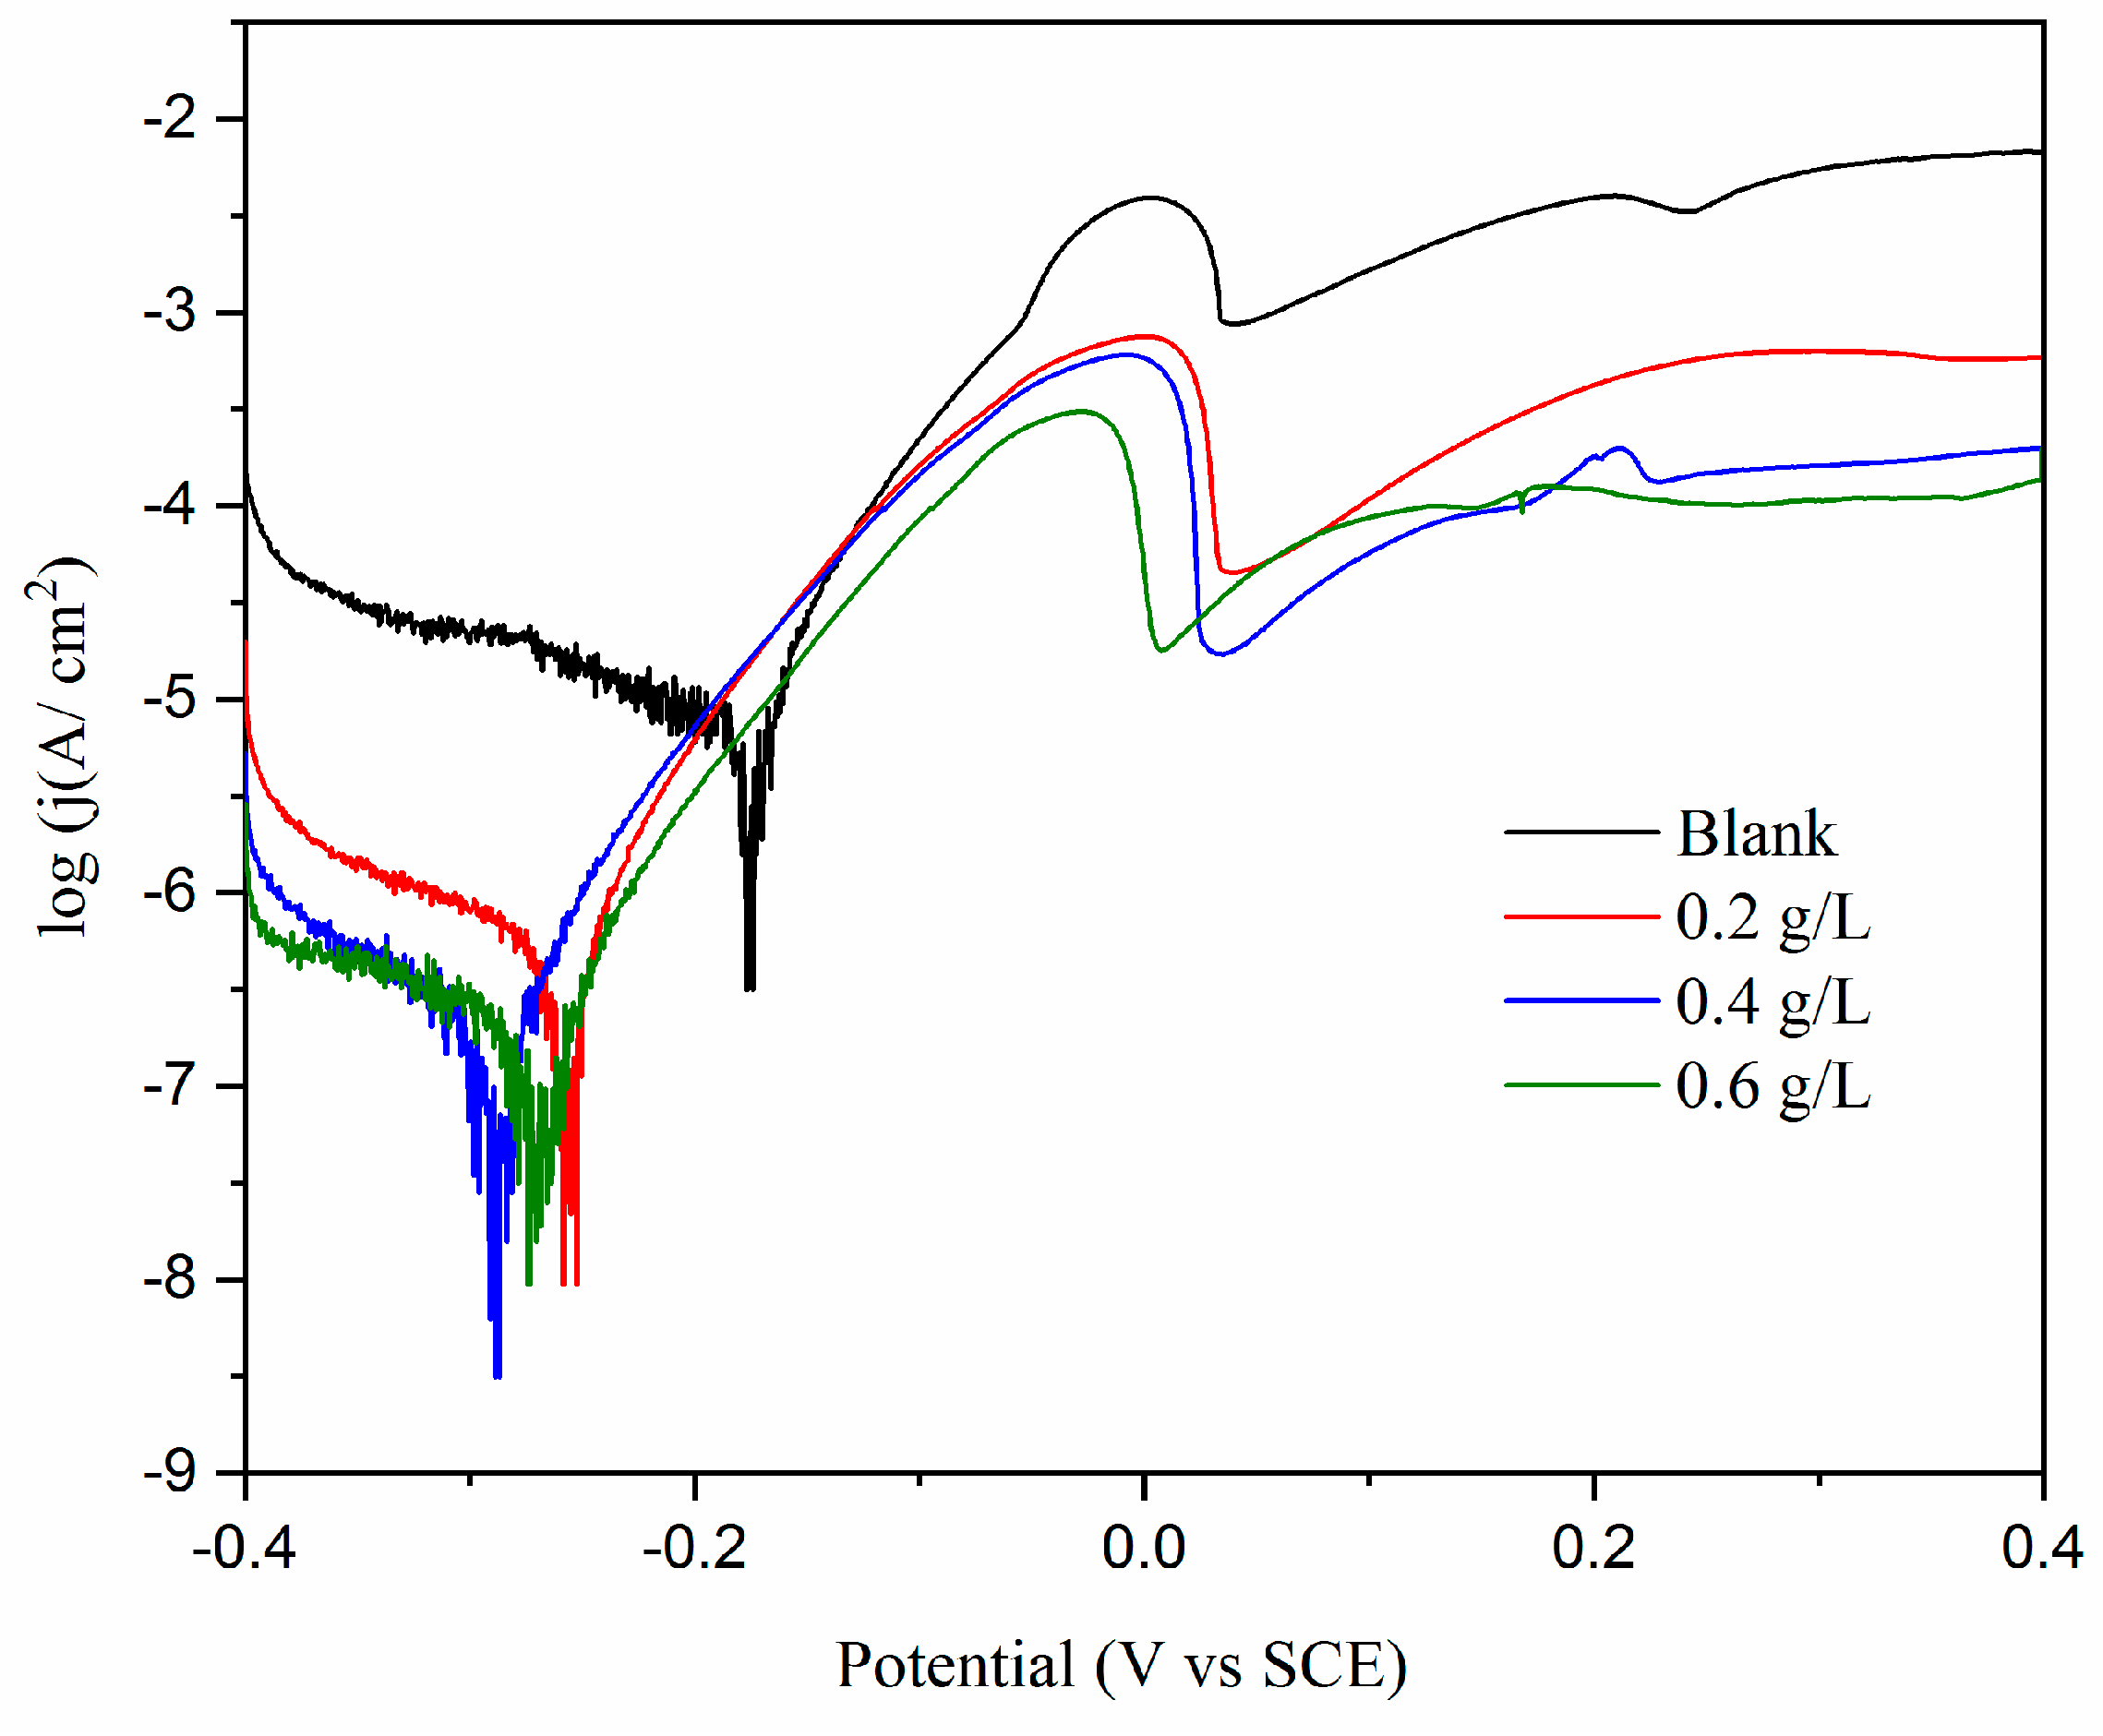
3.3.1. Potentiodynamic Polarization in the Range of −0.4 to +0.4 V/SCE
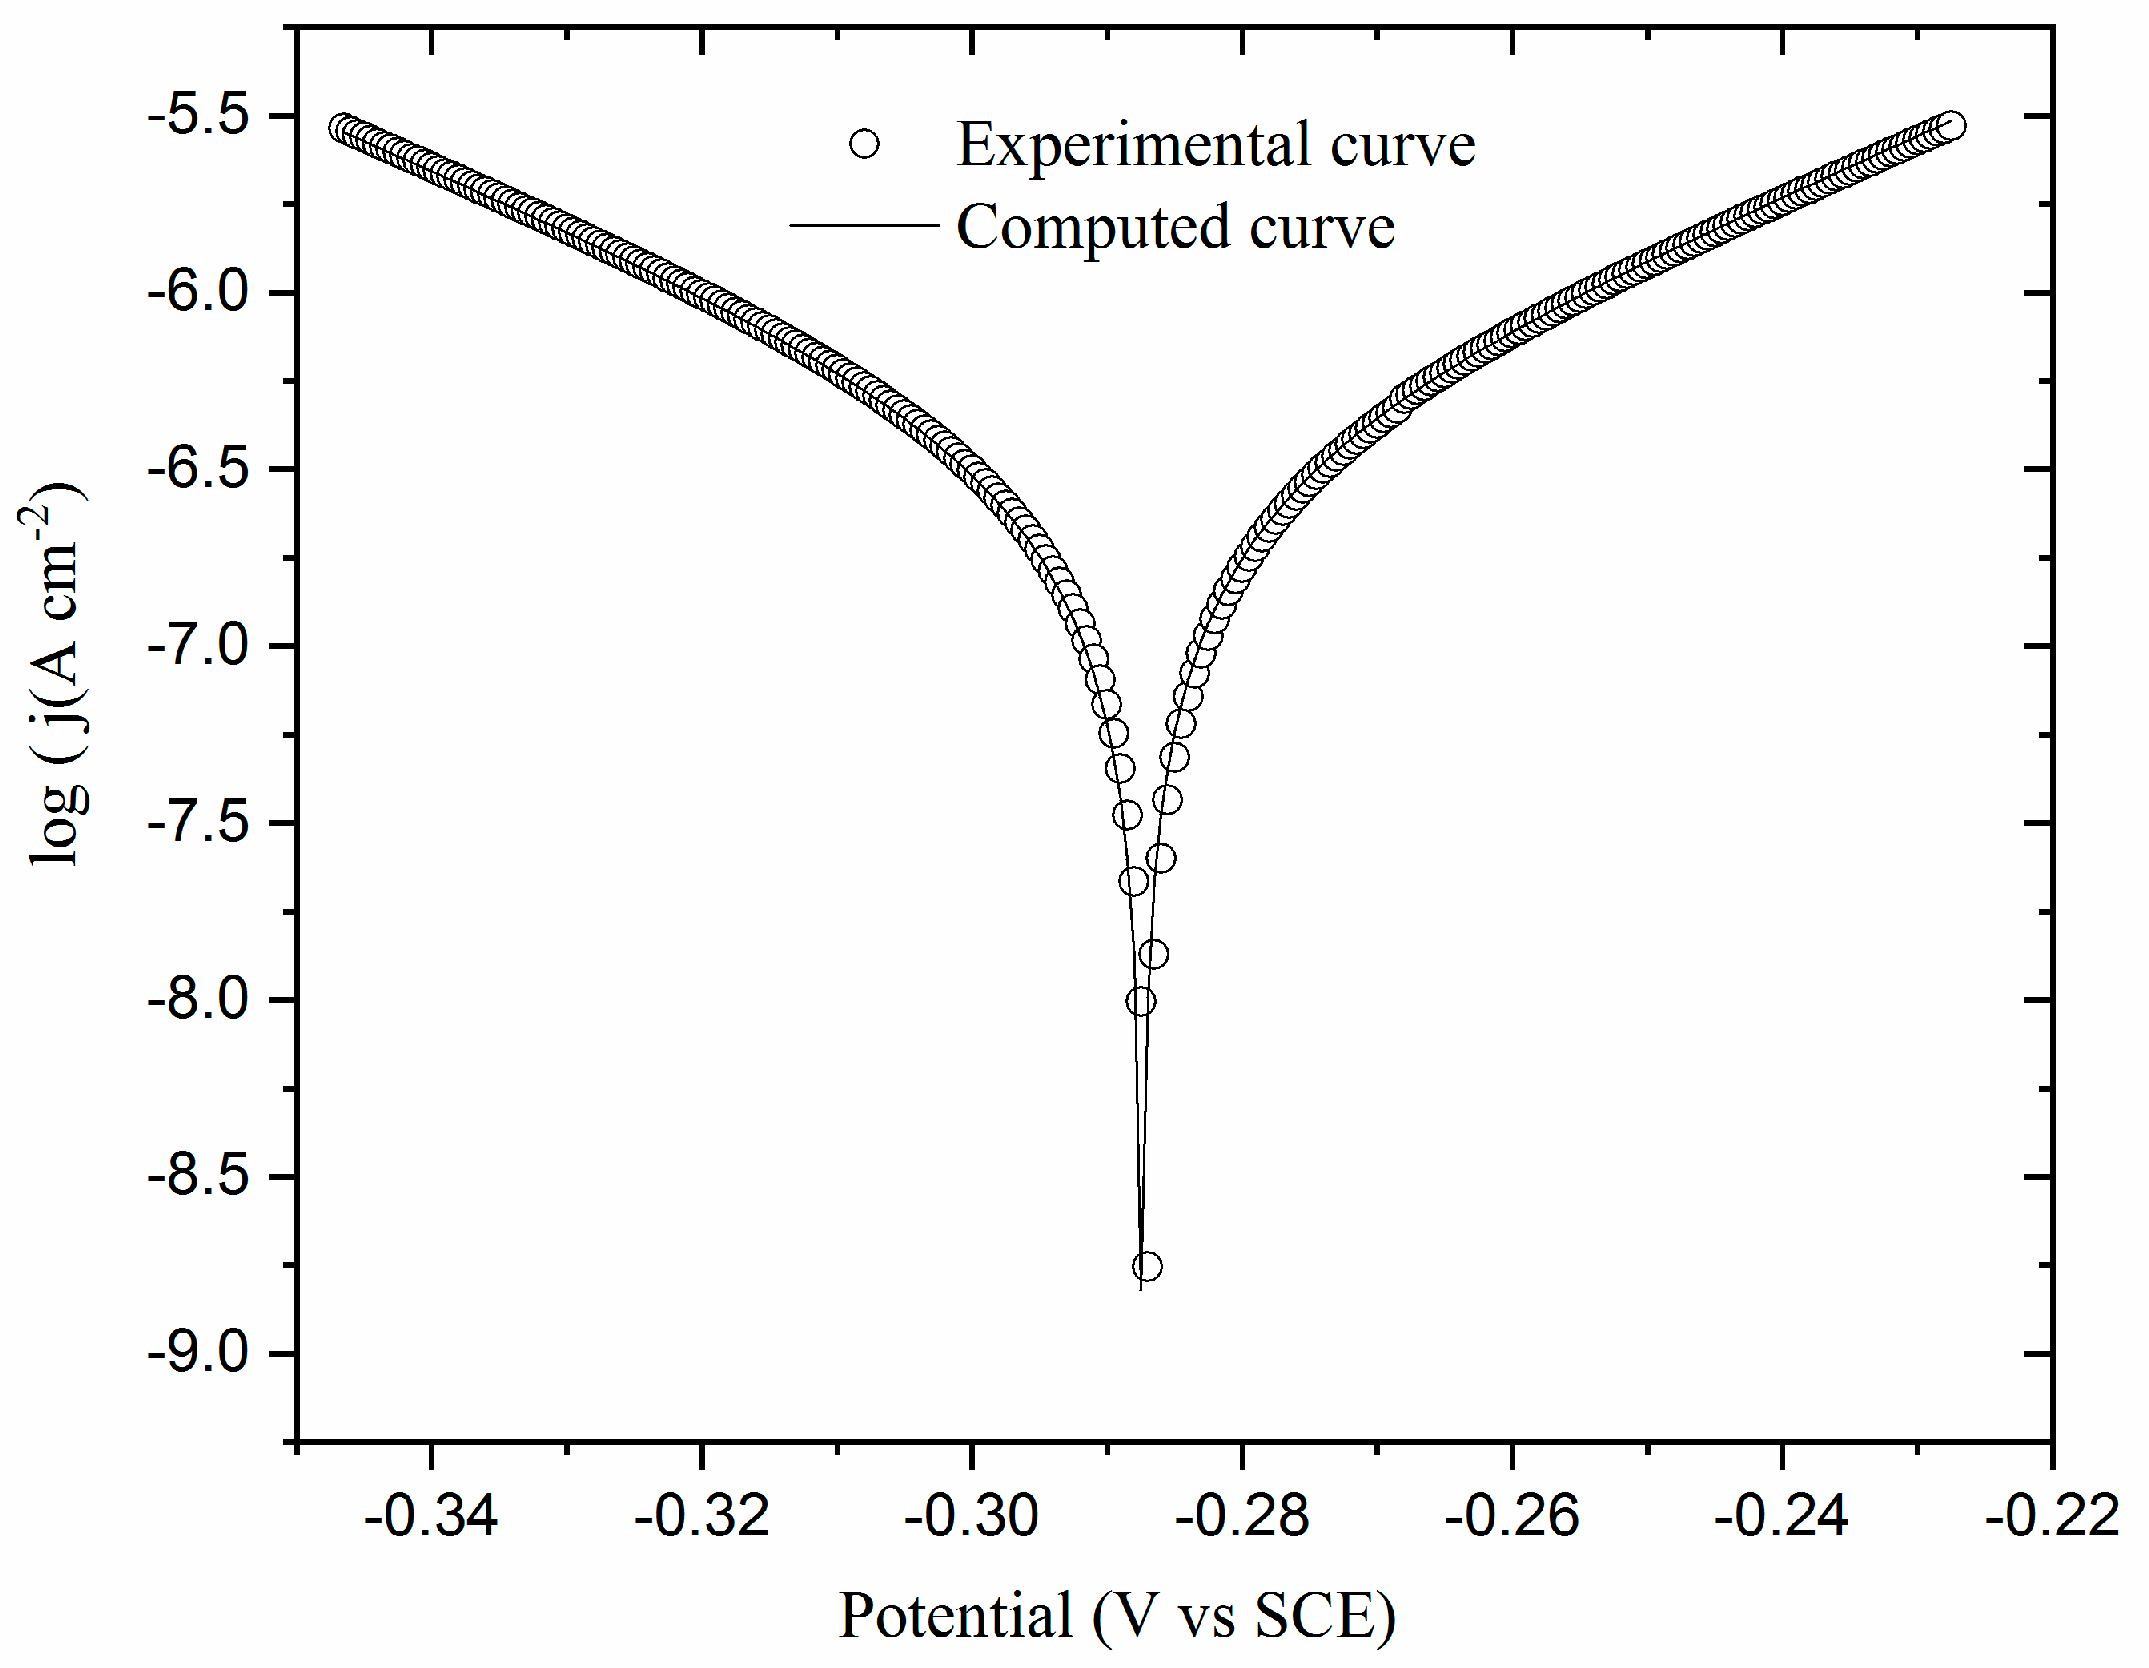
3.3.2. Voltammetry around OCP (ΔE = ±60 mV)
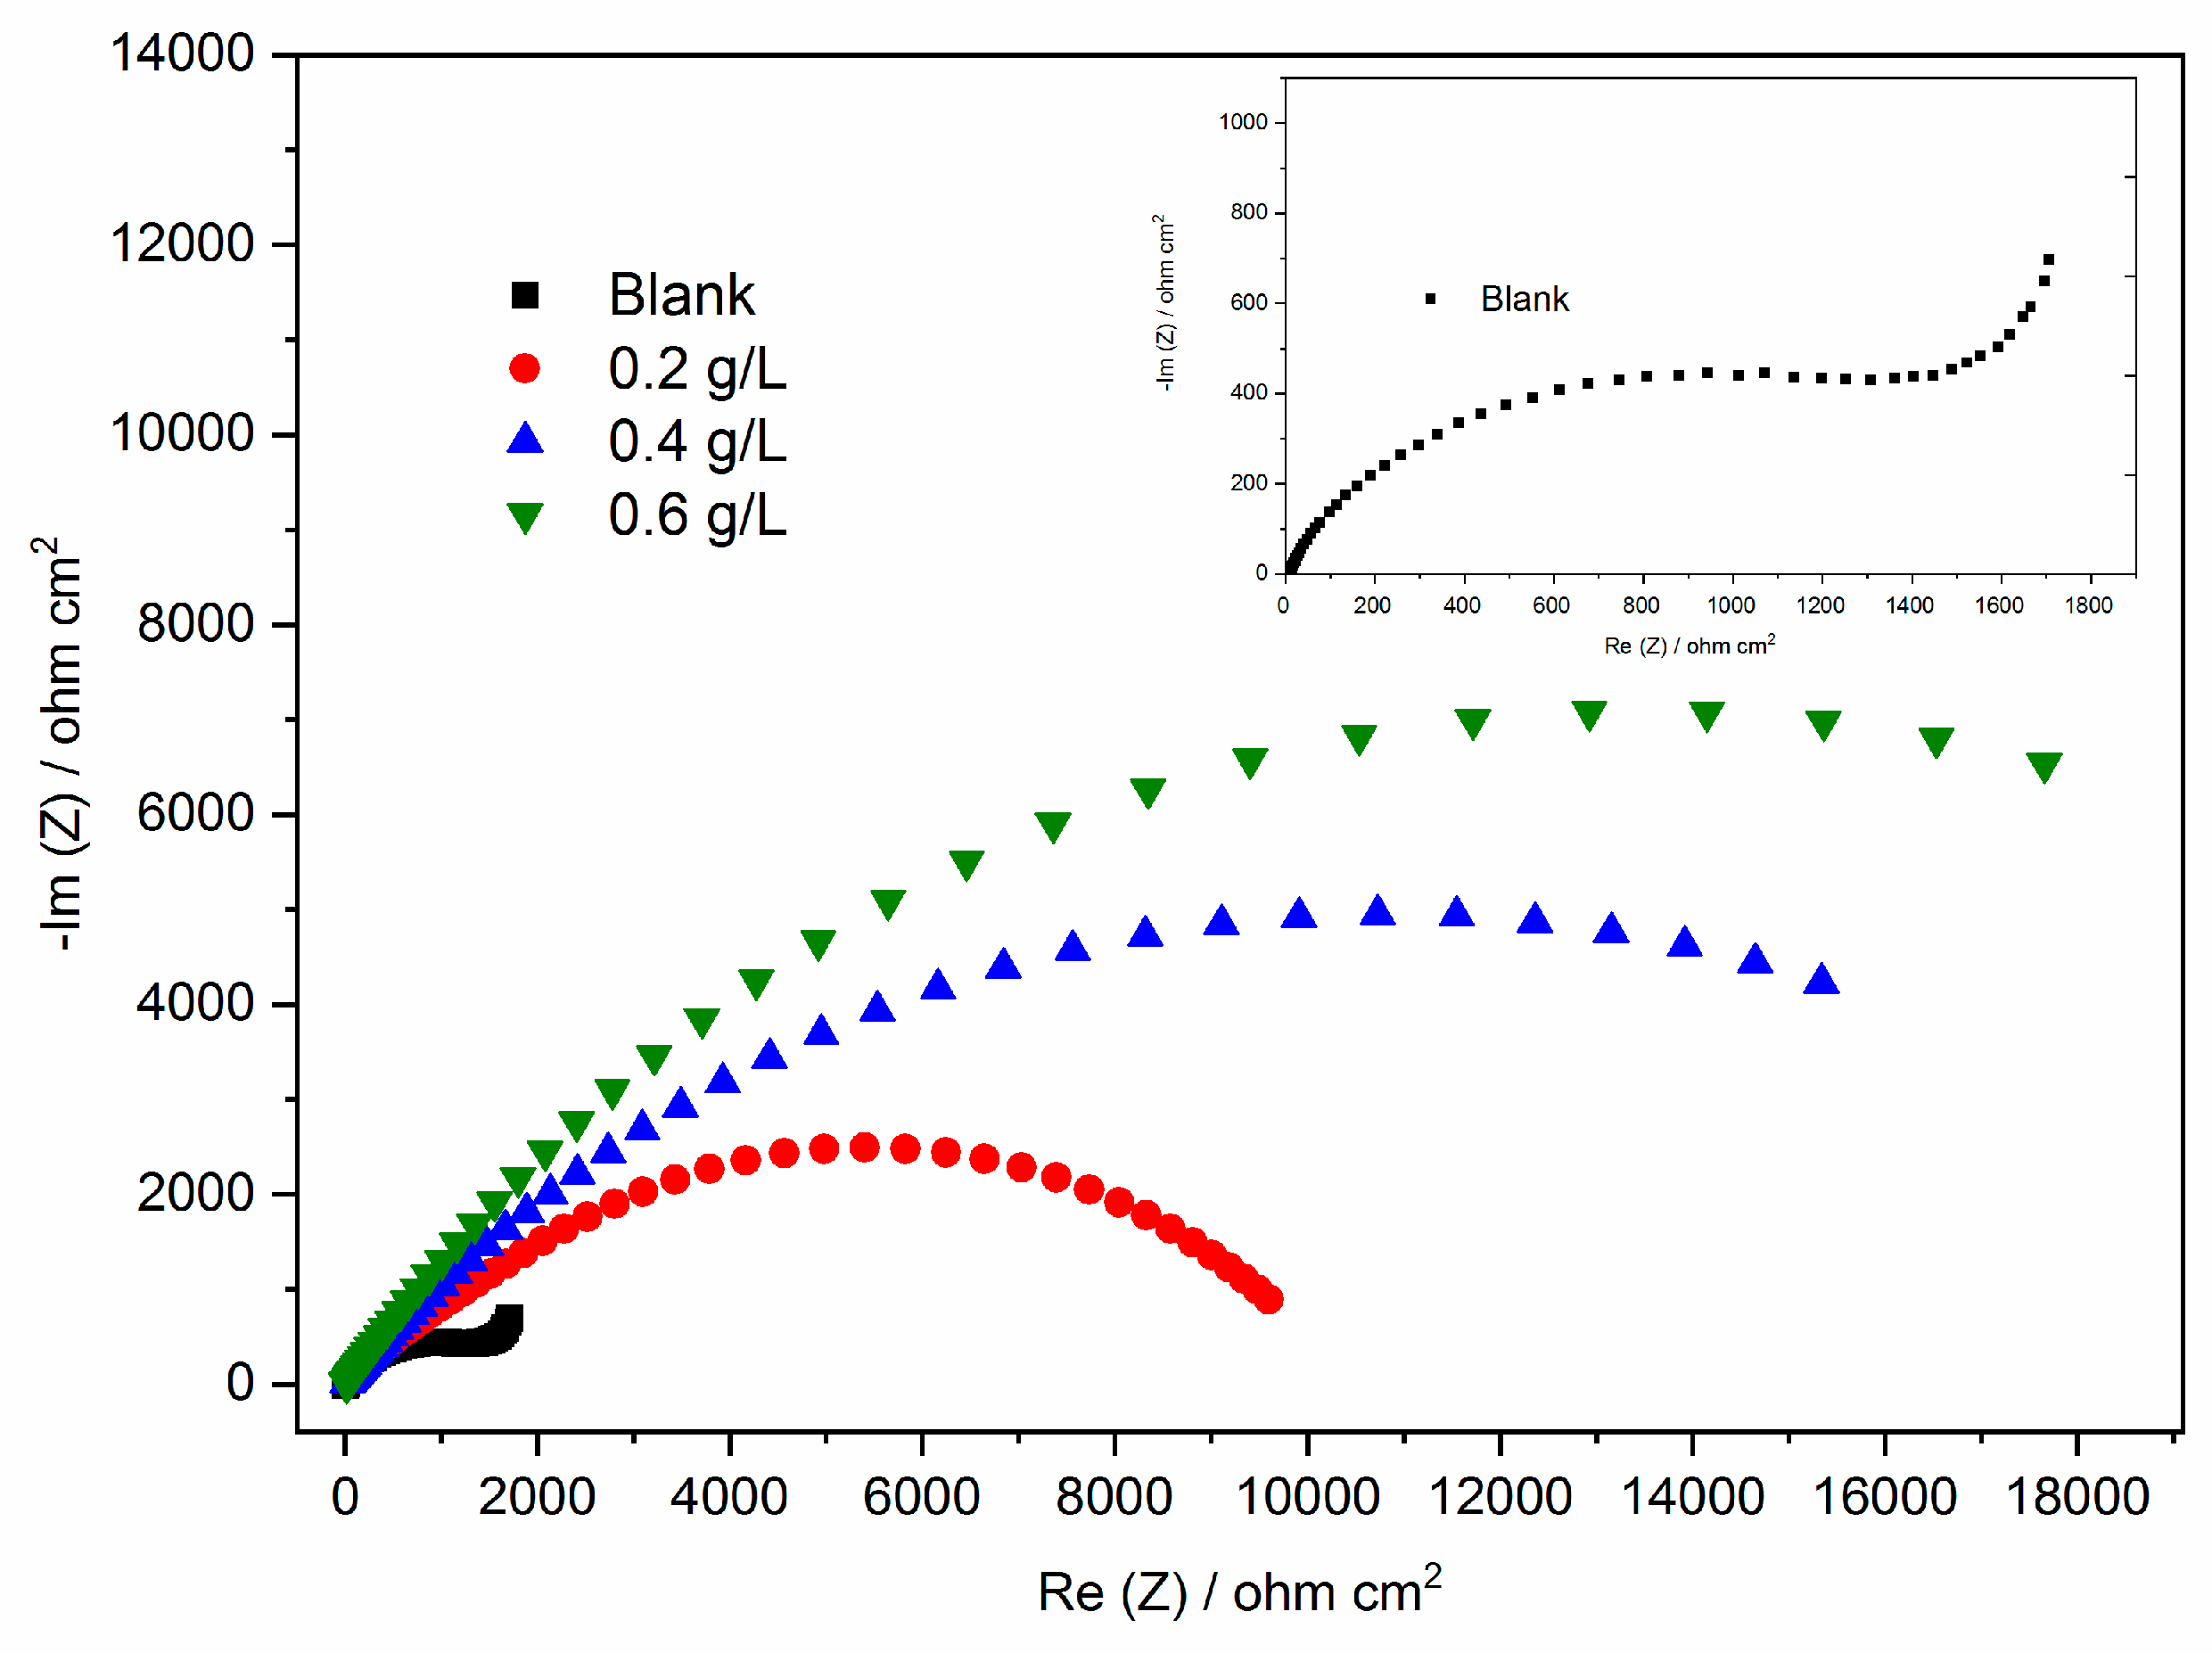
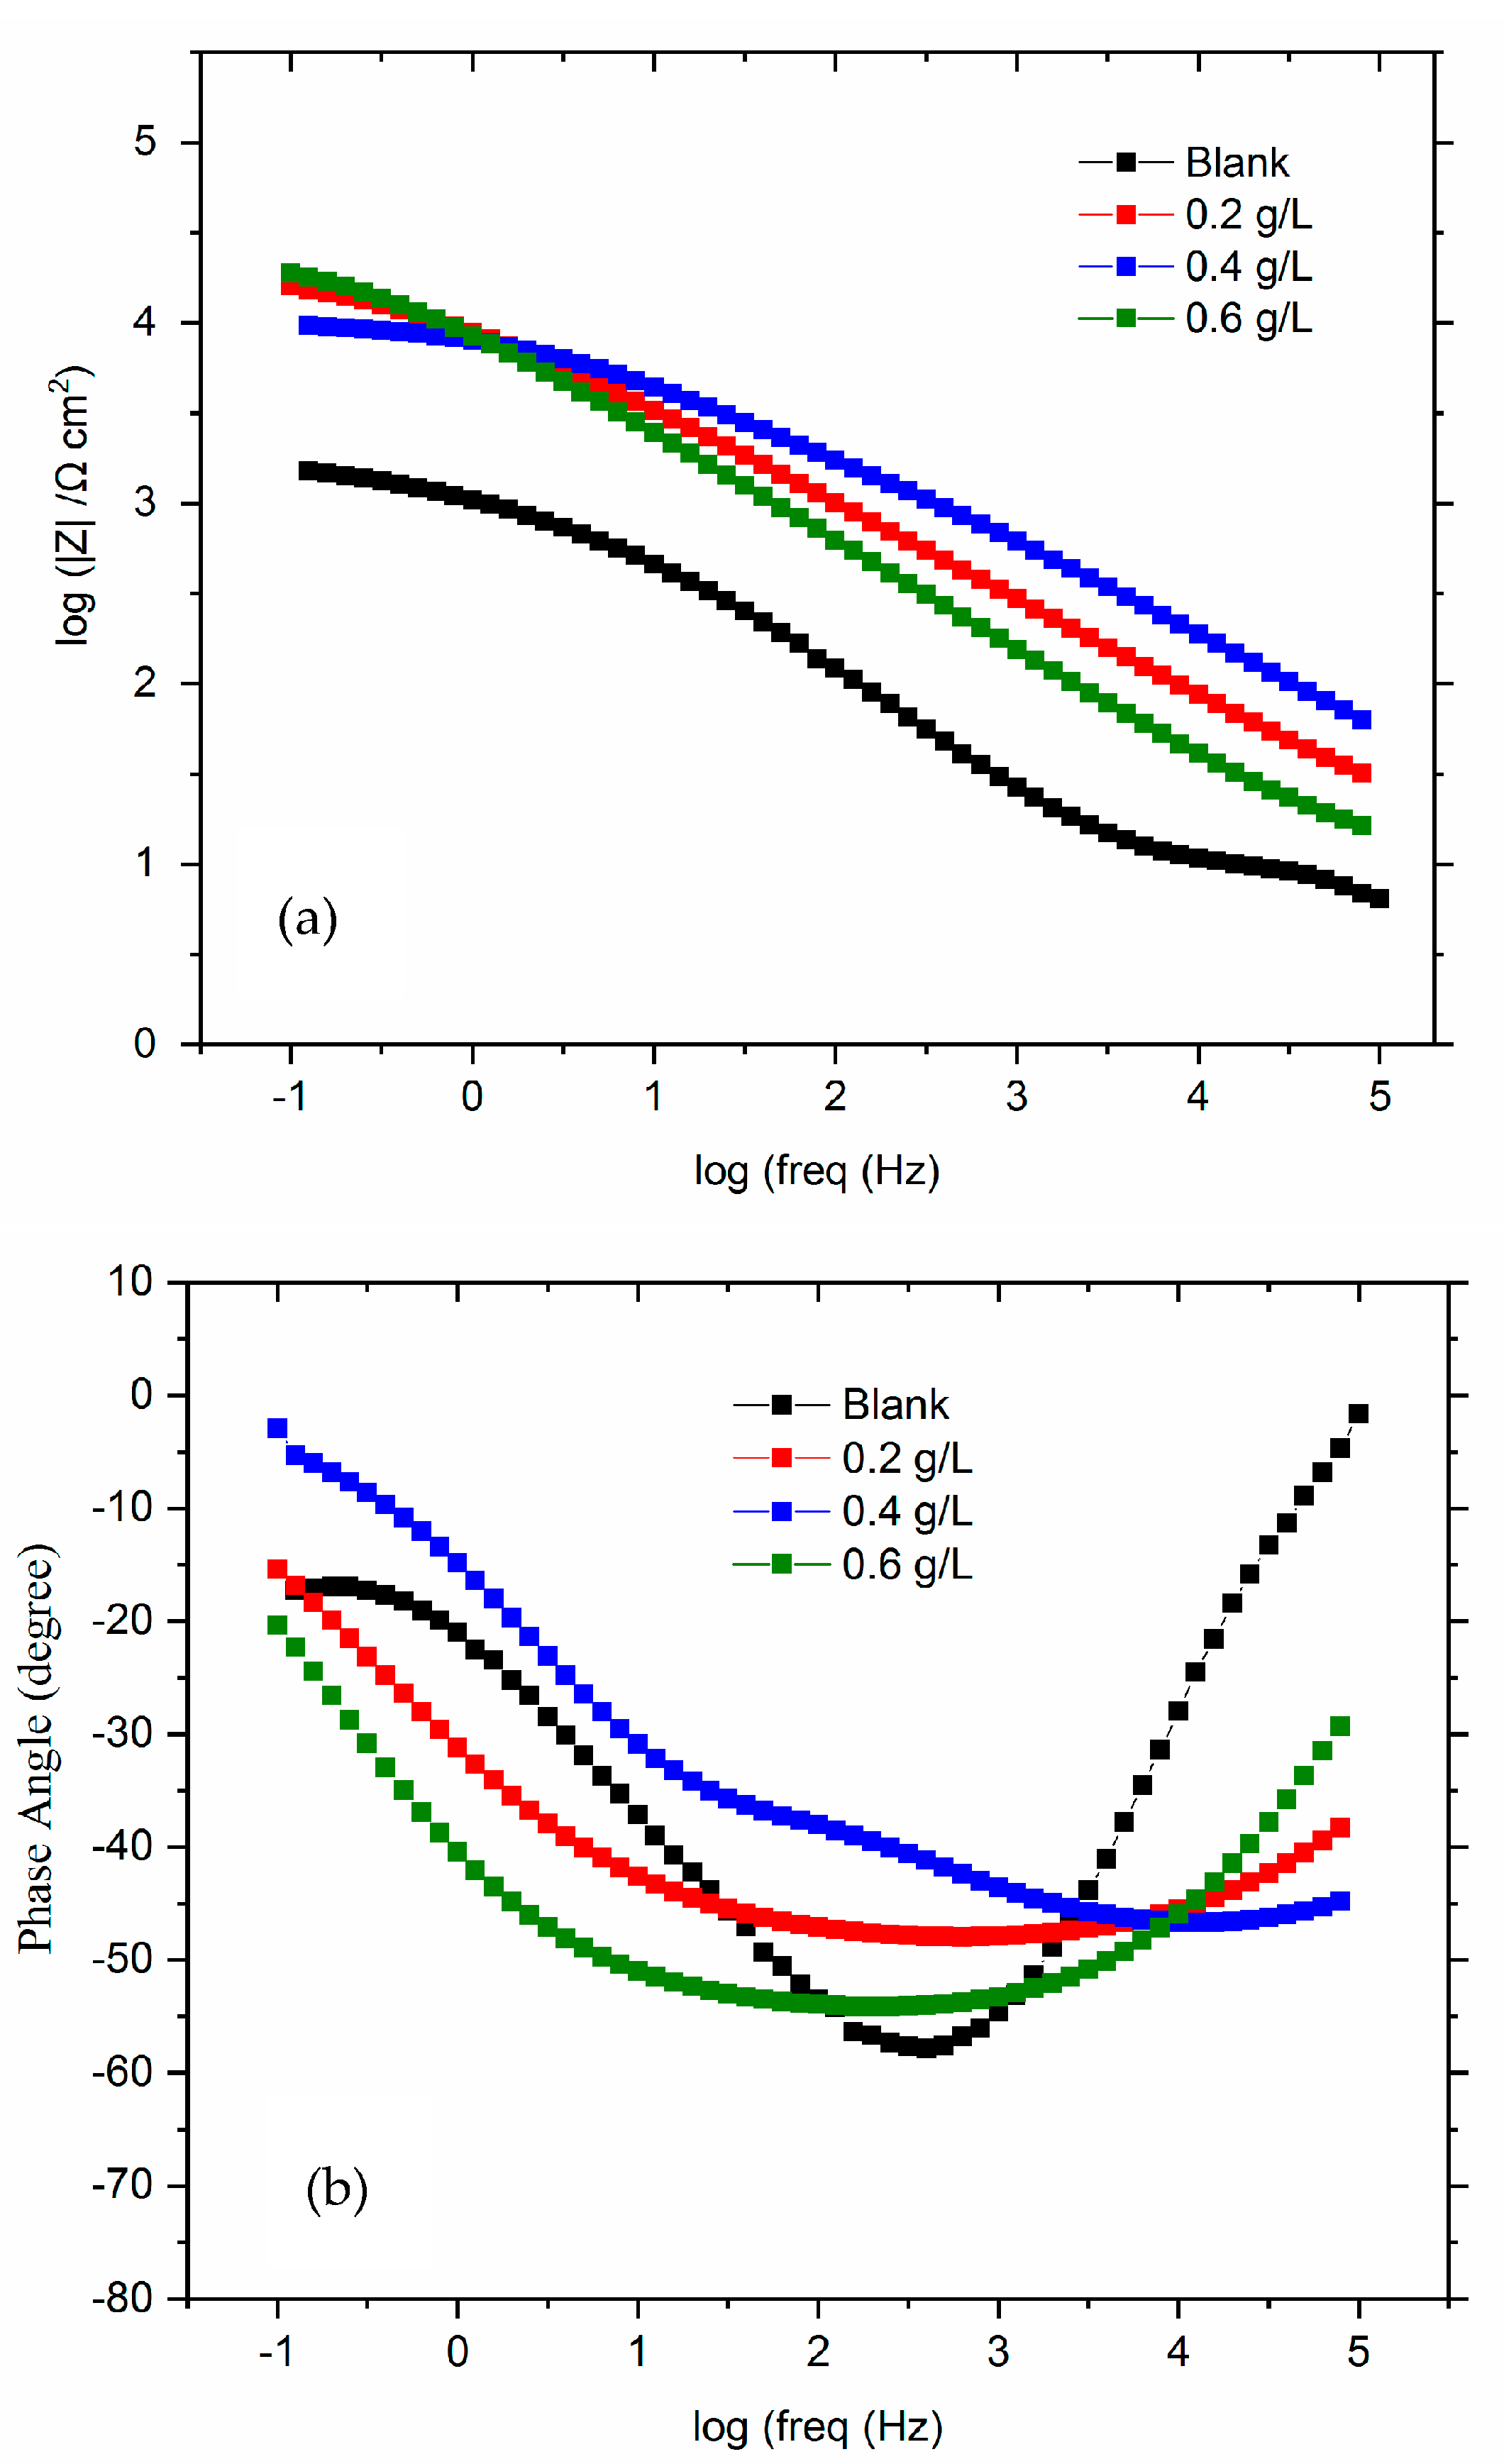
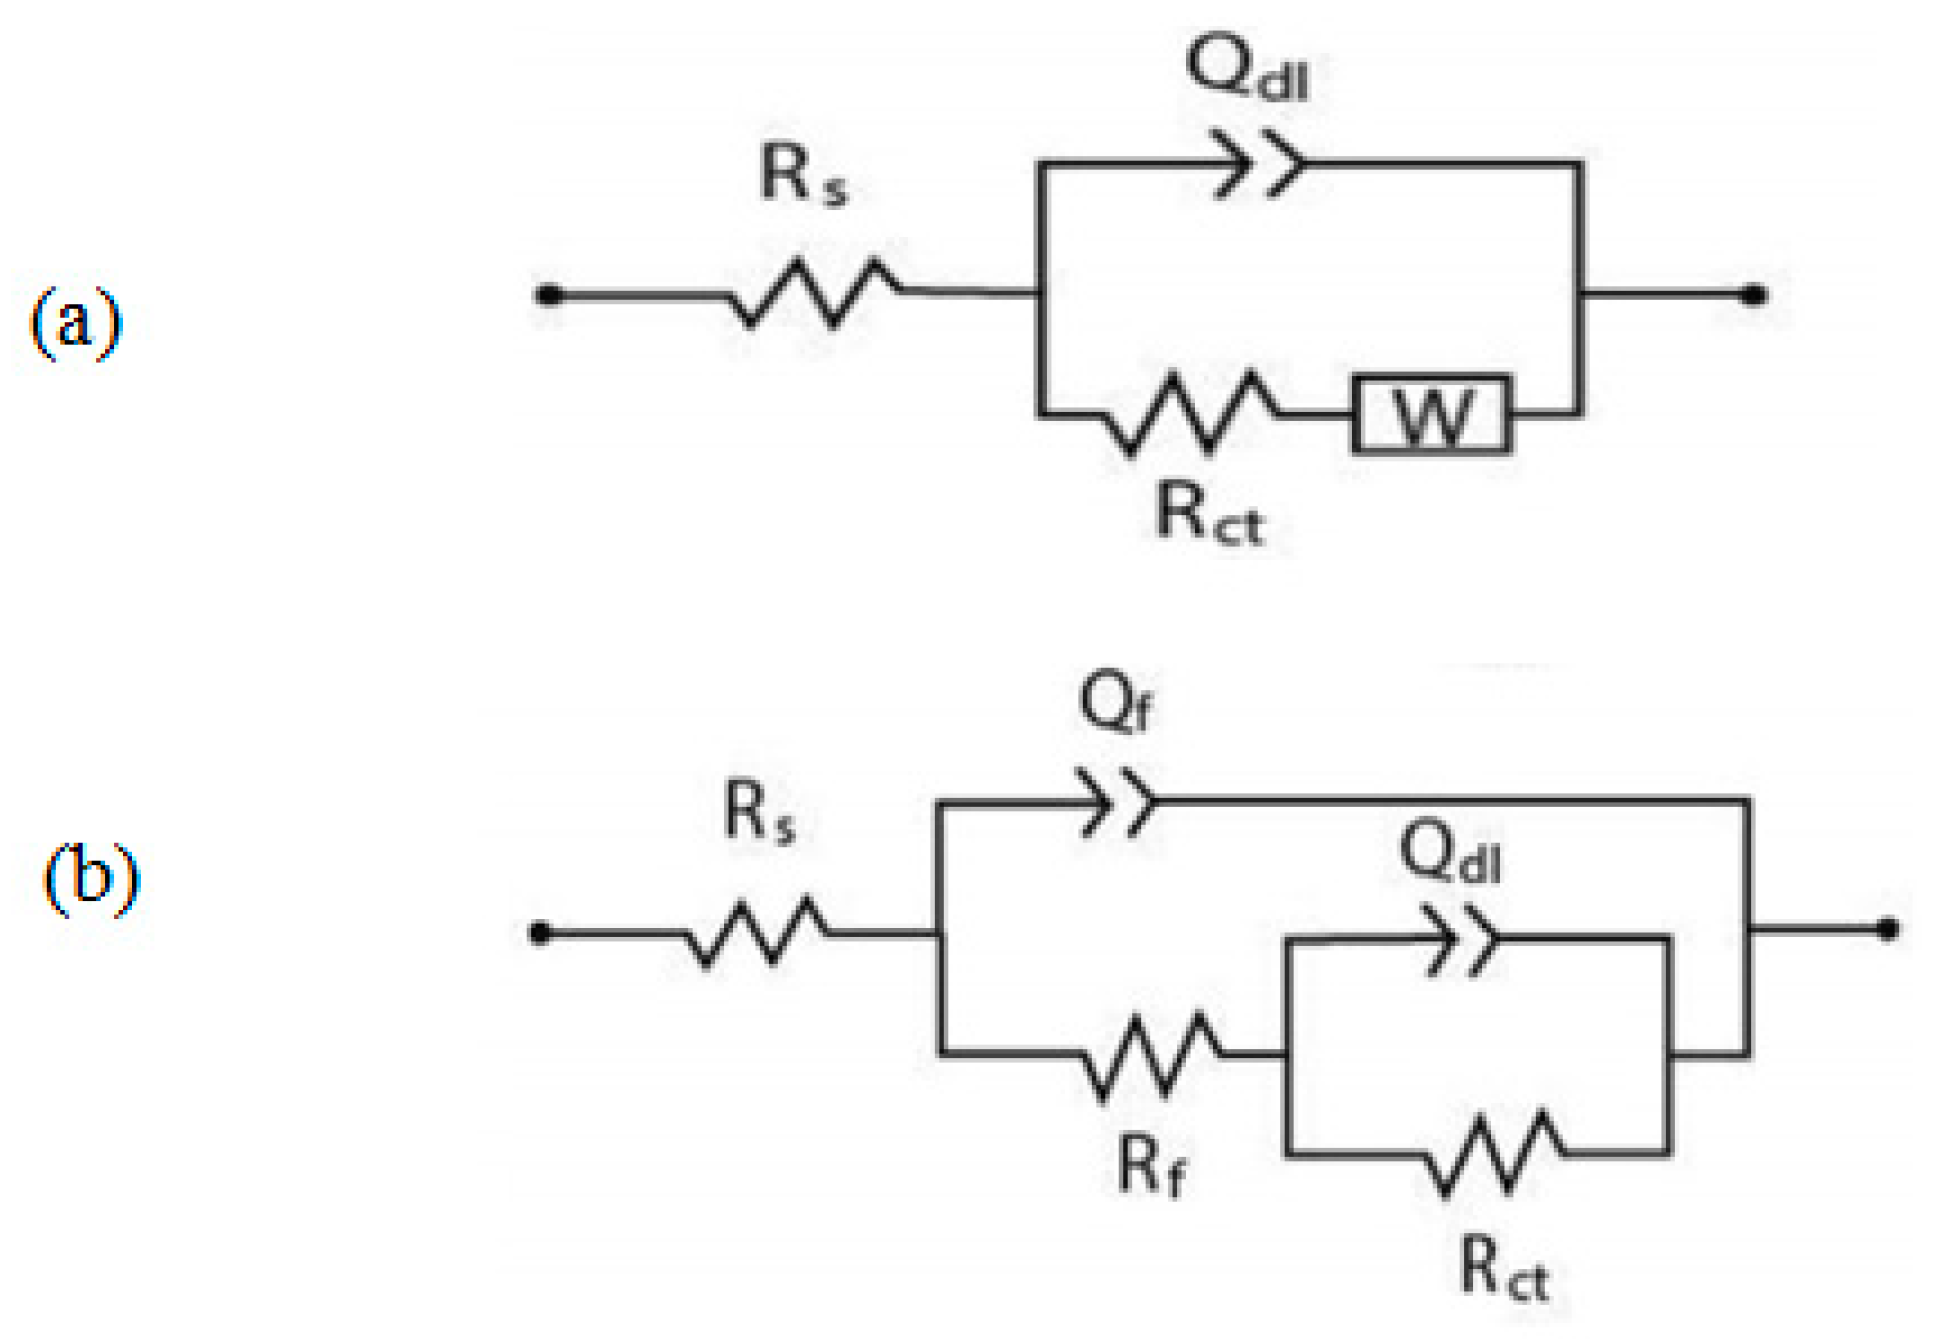
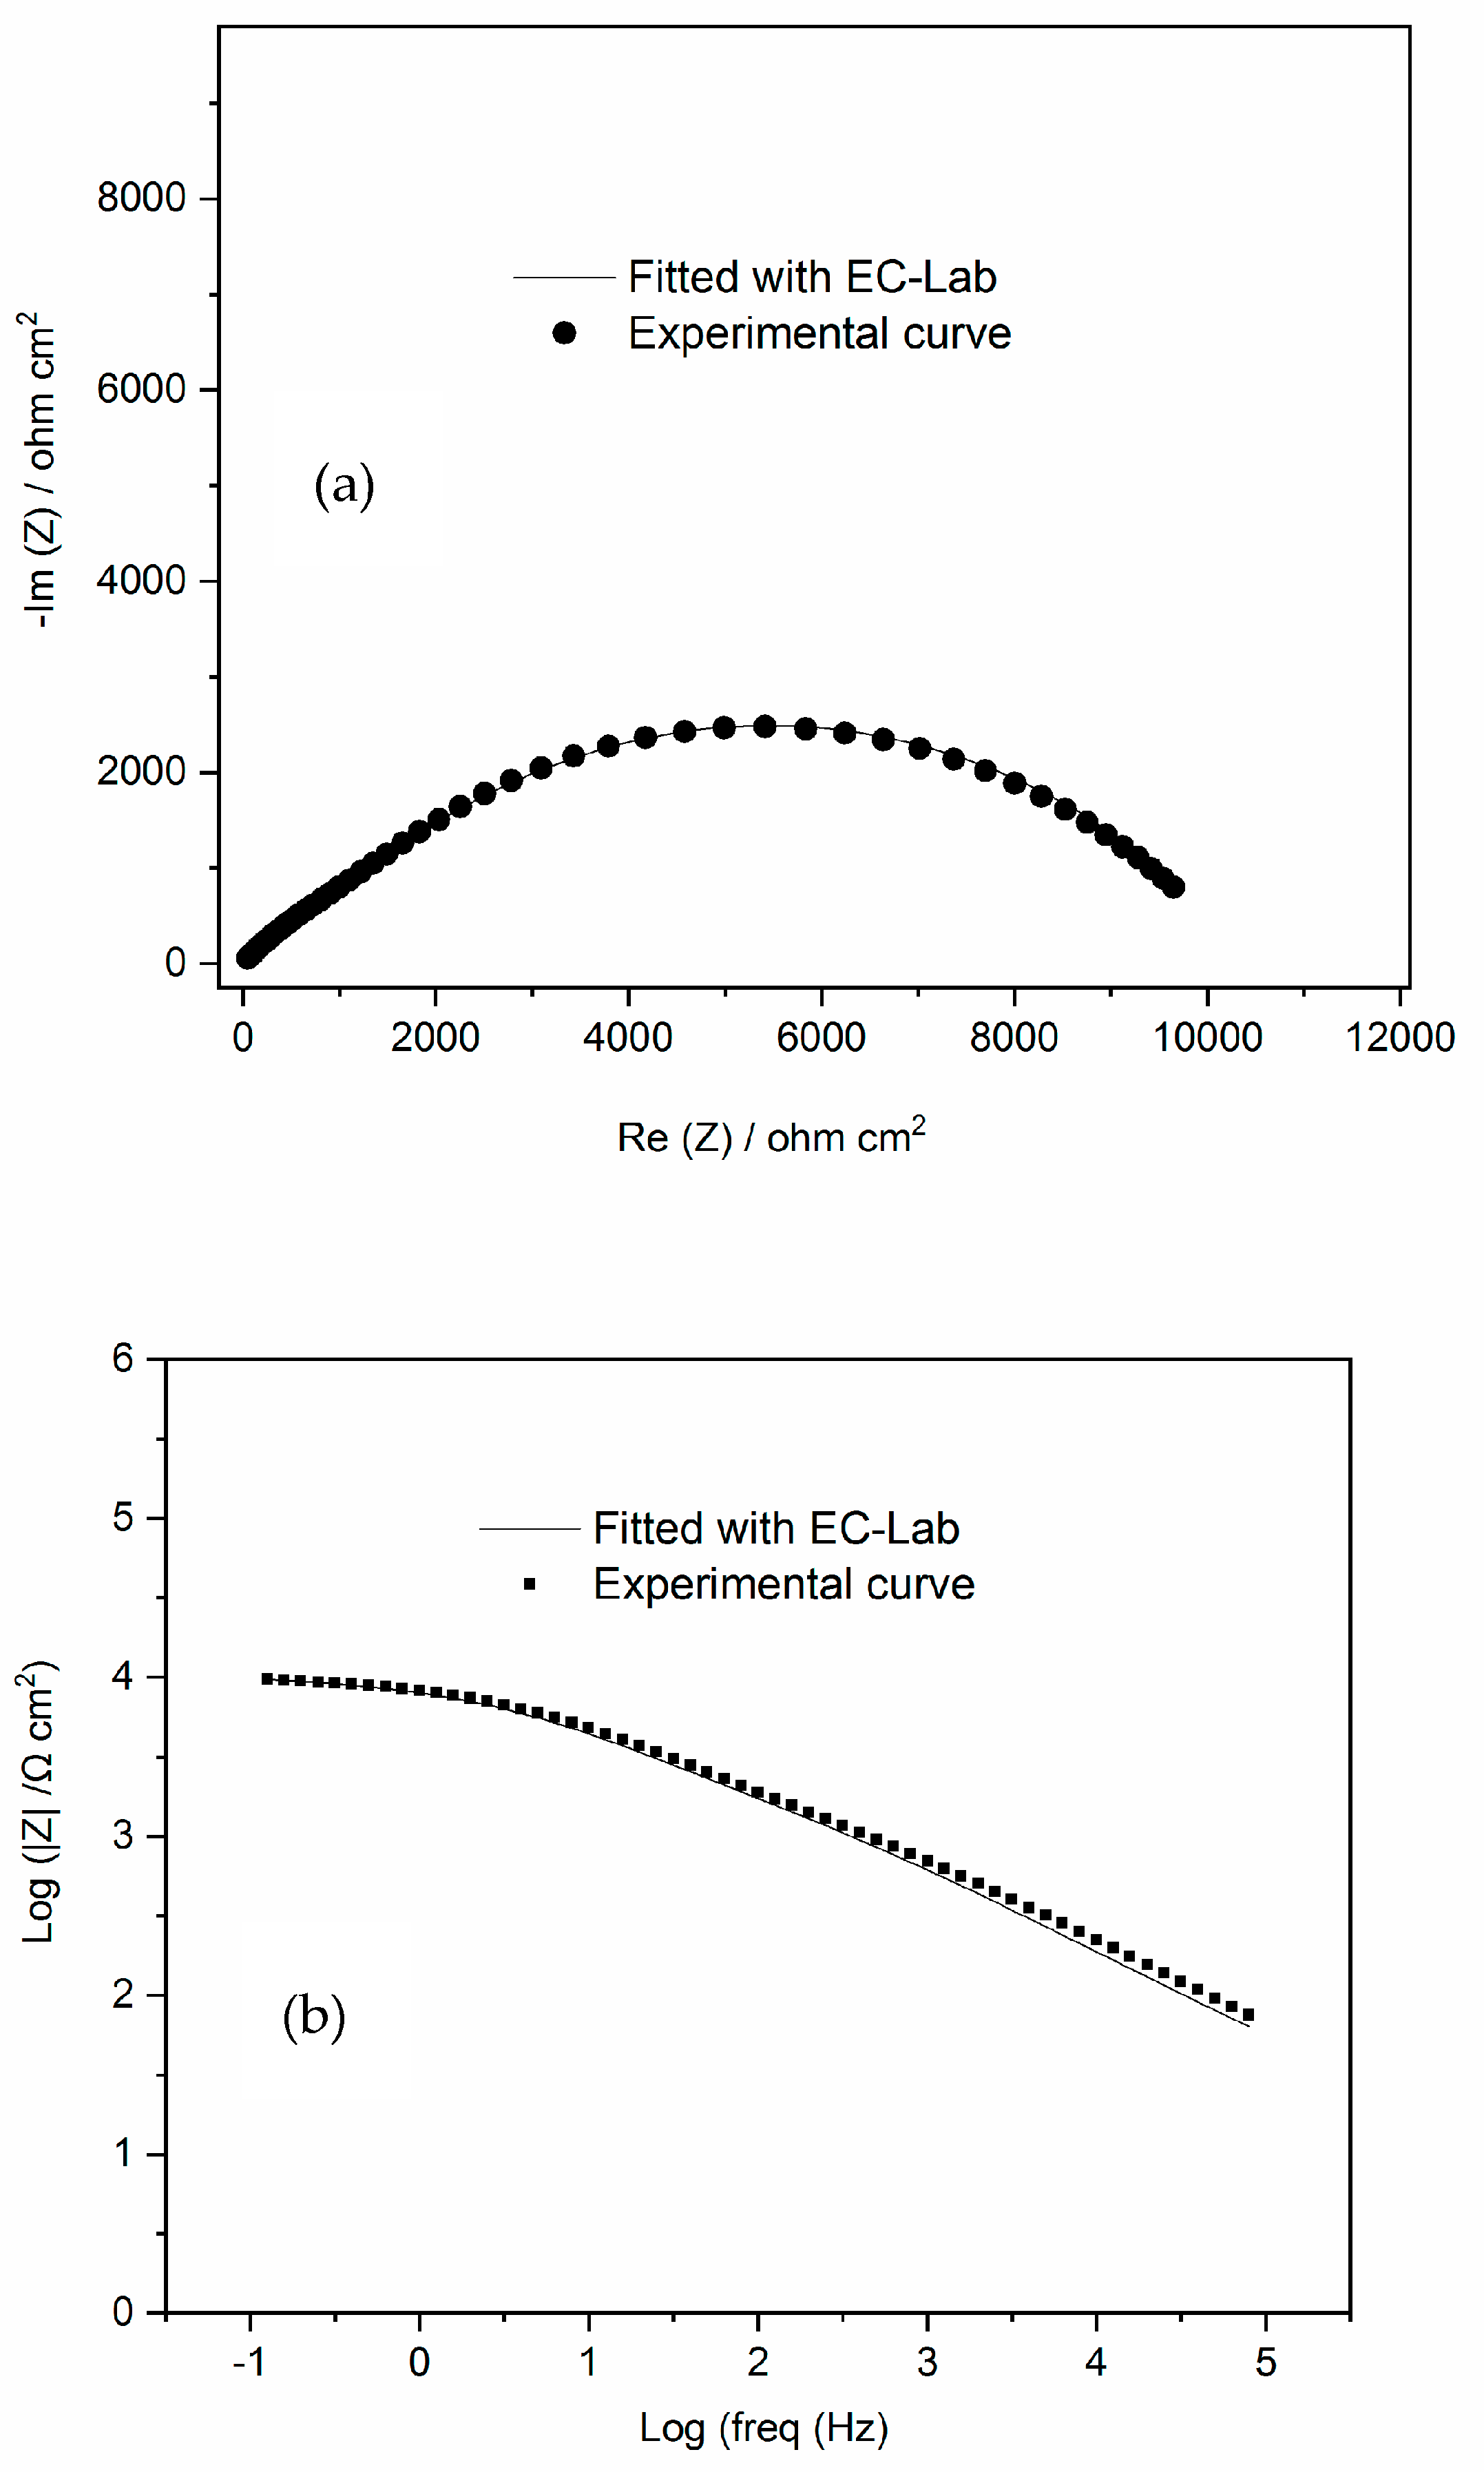
3.3.3. Electrochemical Impedances Spectroscopy (EIS)
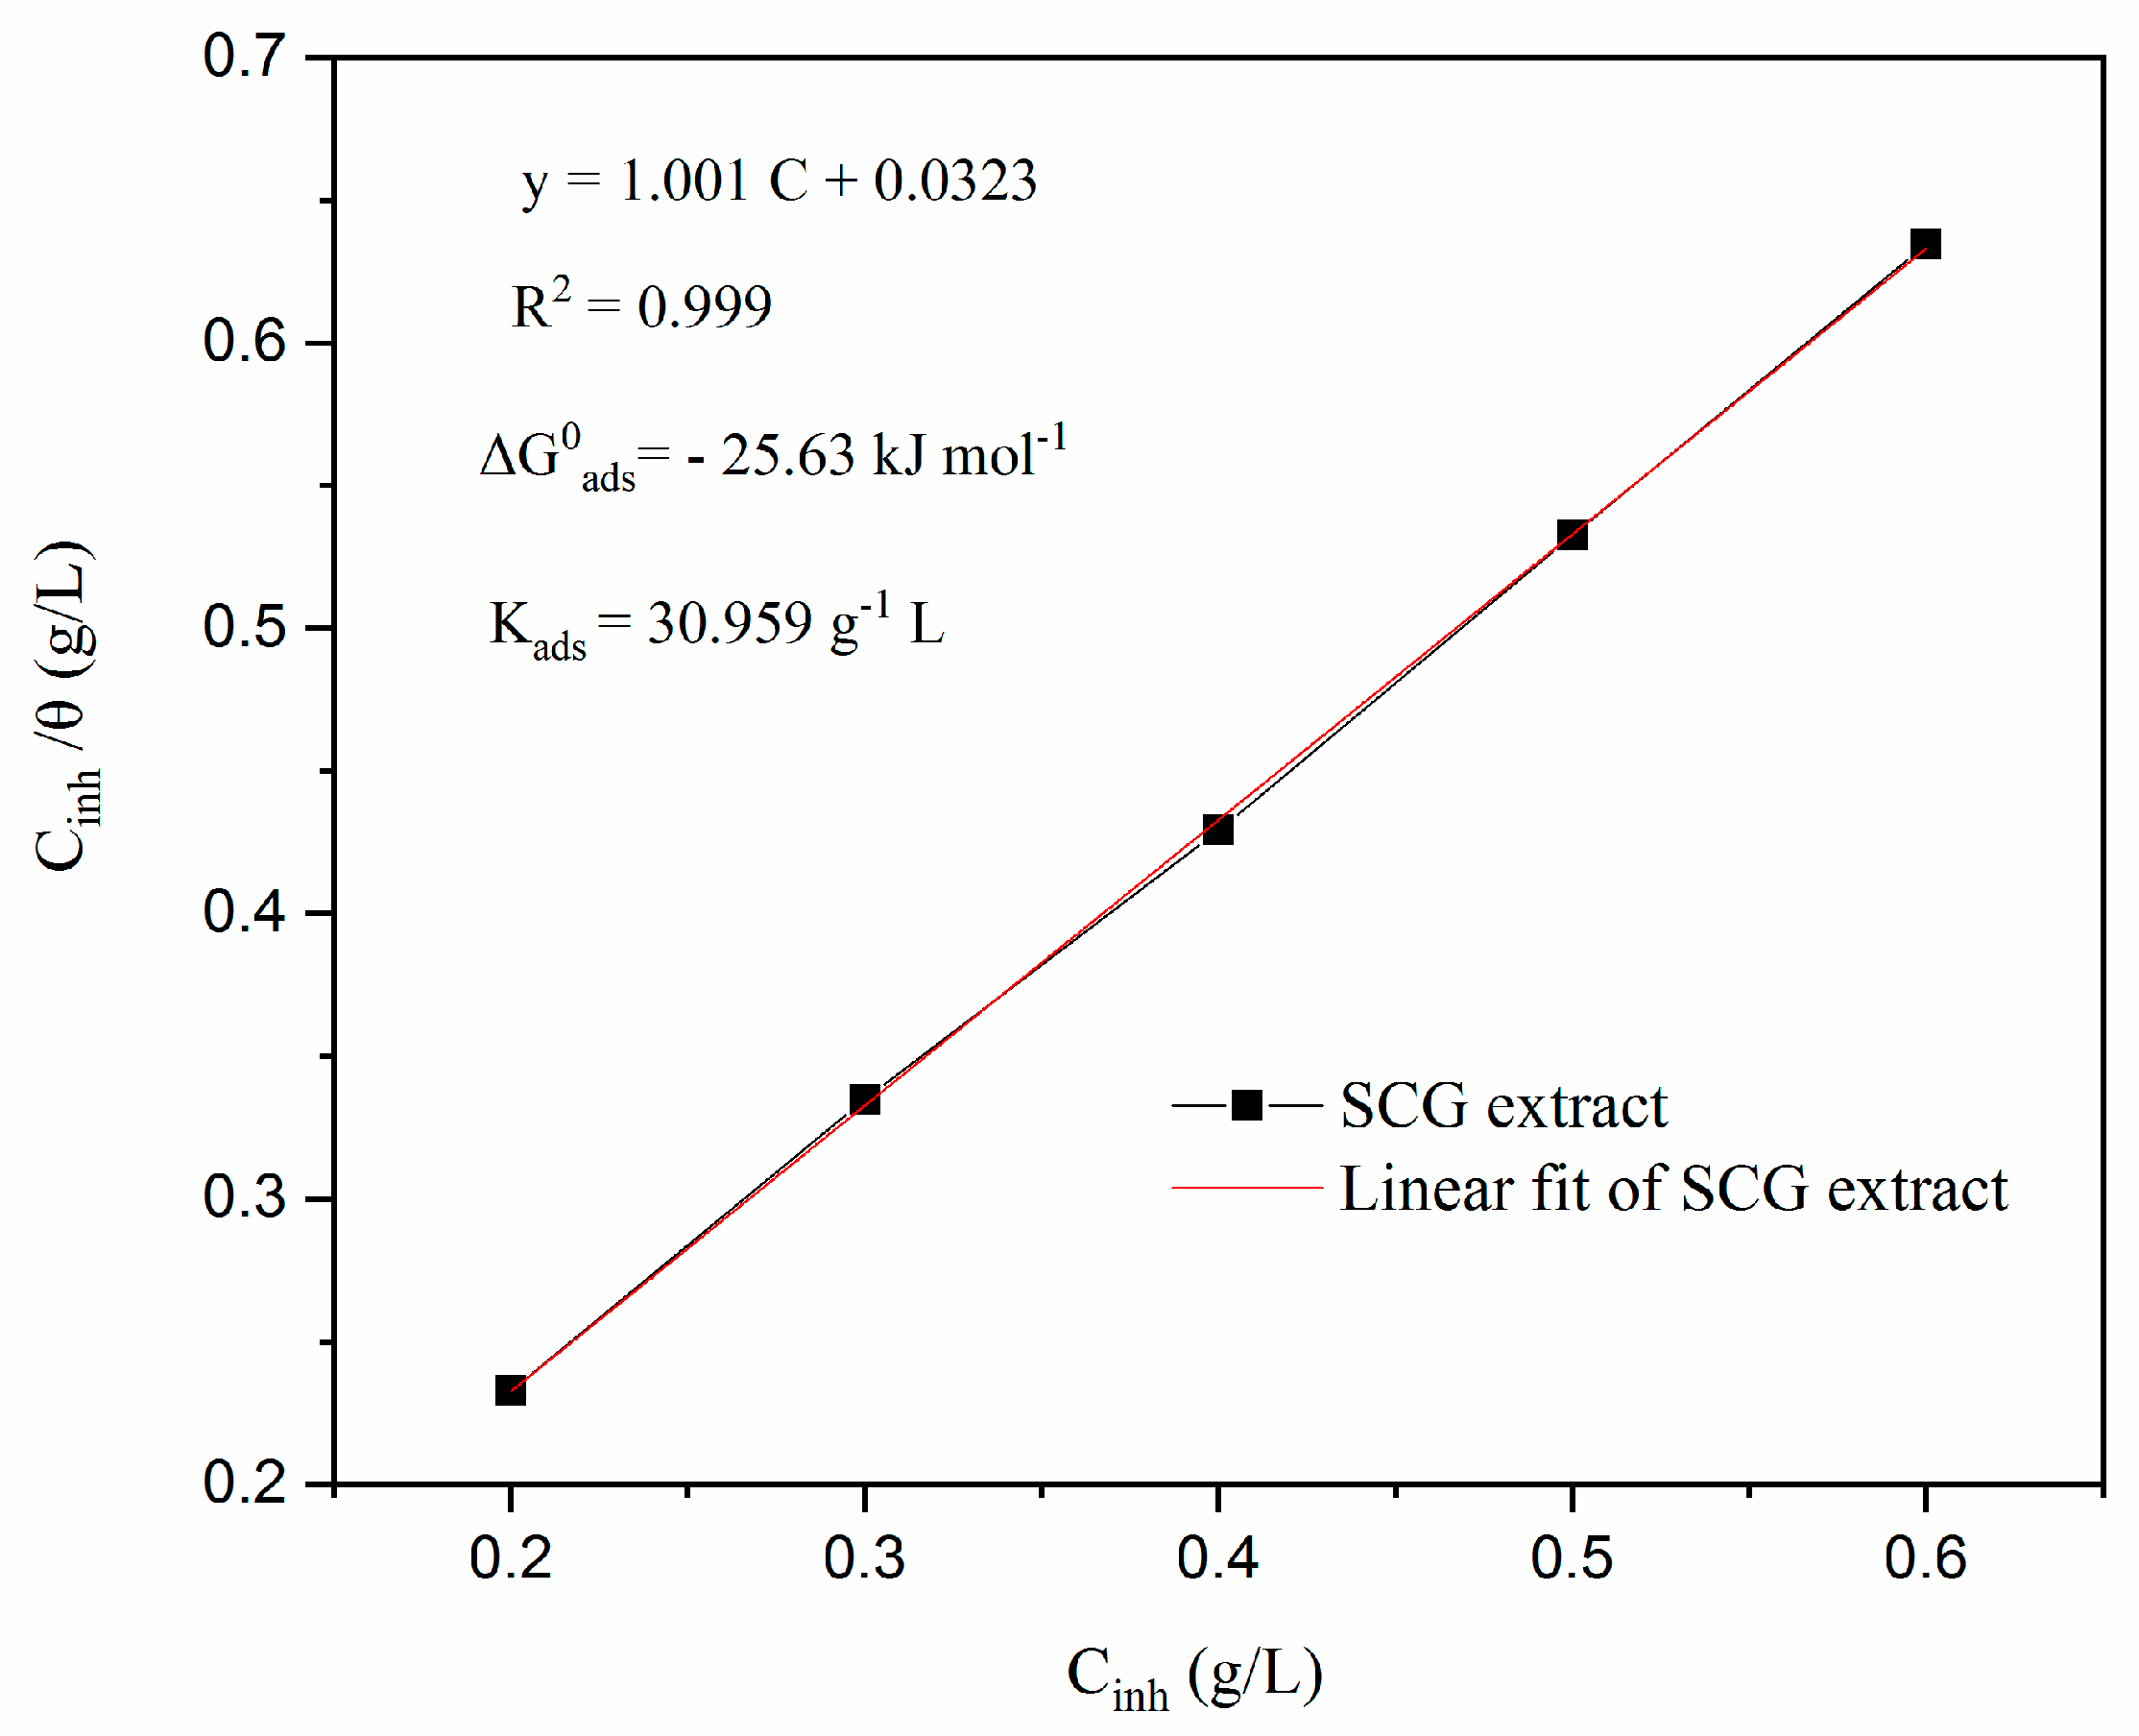
3.3.4. Adsorption Isotherm Modeling
4. Conclusions
Author Contributions
Funding
Institutional Review Board Statement
Informed Consent Statement
Data Availability Statement
Acknowledgments
Conflicts of Interest
References
- Khaled, K. Corrosion control of copper in nitric acid solutions using some amino acids—A combined experimental and theoretical study. Corros. Sci. 2010, 52, 3225–3234. [Google Scholar] [CrossRef]
- Dafali, A.; Hammouti, B.; Mokhlisse, R.; Kertit, S. Substituted uracils as corrosion inhibitors for copper in 3% NaCl solution. Corros. Sci. 2003, 45, 1619–1630. [Google Scholar] [CrossRef]
- Kear, G.; Barker, B.D.; Walsh, F.C. Electrochemical Corrosion of Unalloyed Copper in Chloride Media—A Critical Review. Corros. Sci. 2004, 46, 109–135. [Google Scholar] [CrossRef]
- Refait, P.; Rahal, C.; Masmoudi, M. Corrosion inhibition of copper in 0.5 M NaCl solutions by aqueous and hydrolysis acid extracts of olive leaf. J. Electroanal. Chem. 2020, 859, 113834. [Google Scholar] [CrossRef]
- Núñez, L.; Reguera, E.; Corvo, F.; González, E.; Vazquez, C. Corrosion of copper in seawater and its aerosols in a tropical island. Corros. Sci. 2005, 47, 461–484. [Google Scholar] [CrossRef]
- Mellak, N.; Ghali, N.; Messaoudi, N.; Benhelima, A.; Ferhat, M.; Addou, A. Study of corrosion inhibition properties of Schinus molle essential oil on carbon steel in HCl. Mater. Corros. 2021, 72, 1270–1278. [Google Scholar] [CrossRef]
- Miralrio, A.; Vázquez, A.E. Plant Extracts as Green Corrosion Inhibitors for Different Metal Surfaces and Corrosive Media: A Review. Processes 2020, 8, 942. [Google Scholar] [CrossRef]
- Chaubey, N.; Savita; Qurashi, A.; Chauhan, D.S.; Quraishi, M. Frontiers and advances in green and sustainable inhibitors for corrosion applications: A critical review. J. Mol. Liq. 2021, 321, 114385. [Google Scholar] [CrossRef]
- Alrefaee, S.H.; Rhee, K.Y.; Verma, C.; Quraishi, M.; Ebenso, E.E. Challenges and advantages of using plant extract as inhibitors in modern corrosion inhibition systems: Recent advancements. J. Mol. Liq. 2021, 321, 114666. [Google Scholar] [CrossRef]
- Wei, H.; Heidarshenas, B.; Zhou, L.; Hussain, G.; Li, Q.; Ostrikov, K. Green inhibitors for steel corrosion in acidic environment: State of art. Mater. Today Sustain. 2020, 10, 100044. [Google Scholar] [CrossRef]
- Daoudi, W.; El Aatiaoui, A.; Dagdag, O.; Zaidi, K.; Haldhar, R.; Kim, S.-C.; Oussaid, A.; Aouinti, A.; Berisha, A.; Benhiba, F.; et al. Anti-Corrosion Coating Formation by a Biopolymeric Extract of Artemisia herba-alba Plant: Experimental and Theoretical Investigations. Coatings 2023, 13, 611. [Google Scholar] [CrossRef]
- Haldhar, R.; Vanaraj, R.; Dagdag, O.; Berisha, A.; Kim, S.-C. Convolvulus microphyllus Extract as a Green, Effective, and Affordable Corrosion Inhibitor: Theoretical Calculations and Experimental Studies. Coatings 2023, 13, 860. [Google Scholar] [CrossRef]
- Ballesteros, L.F.; Teixeira, J.A.; Mussatto, S.I. Extraction of polysaccharides by autohydrolysis of spent coffee grounds and evaluation of their antioxidant activity. Carbohydr. Polym. 2017, 157, 258–266. [Google Scholar] [CrossRef] [PubMed]
- Shang, Y.-F.; Xu, J.-L.; Lee, W.-J.; Um, B.-H. Antioxidative polyphenolics obtained from spent coffee grounds by pressurized liquid extraction. S. Afr. J. Bot. 2017, 109, 75–80. [Google Scholar] [CrossRef]
- Campos-Vega, R.; Loarca-Piña, G.; Vergara-Castañeda, H.A.; Oomah, B.D. Spent coffee grounds: A review on current research and future prospects. Trends Food Sci. Technol. 2015, 45, 24–36. [Google Scholar] [CrossRef]
- Gómez-de la Cruz, F.J.; Cruz-Peragón, F.; Casanova-Peláez, P.J.; Palomar-Carnicero, J.M. A vital stage in the large-scale production of biofuels from spent coffee grounds: The drying kinetics. Fuel Process. Technol. 2015, 130, 188–196. [Google Scholar] [CrossRef]
- Karmee, S.K. A spent coffee grounds based biorefinery for the production of biofuels, biopolymers, antioxidants and biocomposites. Waste Manag. 2018, 72, 240–254. [Google Scholar] [CrossRef]
- Bouhlal, F.; Labjar, N.; Abdoun, F.; Mazkour, A.; Serghini-Idrissi, M.; El Mahi, M.; Lotfi, E.M.; Skalli, A.; El Hajjaji, S. Chemical and electrochemical studies of the inhibition performance of hydro-alcoholic extract of used coffee grounds (HECG) for the corrosion of C38 steel in 1 M hydrochloric acid. Egypt. J. Pet. 2020, 29, 45–52. [Google Scholar] [CrossRef]
- Bouhlal, F.; Labjar, N.; Abdoun, F.; Mazkour, A.; Serghini-Idrissi, M.; El Mahi, M.; Lotfi, E.M.; El Hajjaji, S. Electrochemical and Thermodynamic Investigation on Corrosion Inhibition of C38 Steel in 1M Hydrochloric Acid Using the Hydro-Alcoholic Extract of Used Coffee Grounds. Int. J. Corros. 2020, 2020, 4045802. [Google Scholar] [CrossRef]
- Torres, V.V.; Amado, R.S.; de Sá, C.F.; Fernandez, T.L.; da Silva Riehl, C.A.; Torres, A.G.; D’elia, E. Inhibitory action of aqueous coffee ground extracts on the corrosion of carbon steel in HCl solution. Corros. Sci. 2011, 53, 2385–2392. [Google Scholar] [CrossRef]
- Velazquez-Torres, N.; Martinez, H.; Porcayo-Calderon, J.; Vazquez-Velez, E.; Gonzalez-Rodriguez, J.G.; Martinez-Gomez, L. Use of an amide-type corrosion inhibitor synthesized from the coffee bagasse oil on the corrosion of Cu in NaCl. Green Chem. Lett. Rev. 2017, 11, 1404645. [Google Scholar] [CrossRef]
- da Costa, M.A.; de Gois, J.S.; Toaldo, I.M.; Bauerfeldt, A.C.F.; Batista, D.B.; Bordignon-Luiz, M.T.; do Lago, D.C.; Luna, A.S.; Senna, L.F. Optimization of Espresso Spent Ground Coffee Waste Extract Preparation and the Influence of Its Chemical Composition as an Eco-Friendly Corrosion Inhibitor for Carbon Steel in Acid Medium. Mater. Res. 2020, 23. [Google Scholar] [CrossRef]
- Bouhlal, F.; Mazkour, A.; Labjar, H.; Benmessaoud, M.; Serghini-Idrissi, M.; El Mahi, M.; Lotfi, E.M.; El Hajjaji, S.; Labjar, N. Combination effect of hydro-alcoholic extract of spent coffee grounds (HECG) and potassium Iodide (KI) on the C38 steel corrosion inhibition in 1M HCl medium: Experimental design by response surface methodology. Chem. Data Collect. 2020, 29, 100499. [Google Scholar] [CrossRef]
- Rahal, C.; Masmoudi, M.; Abdelhedi, R.; Sabot, R.; Jeannin, M.; Bouaziz, M.; Refait, P. Olive leaf extract as natural corrosion inhibitor for pure copper in 0.5 M NaCl solution: A study by voltammetry around OCP. J. Electroanal. Chem. 2016, 769, 53–61. [Google Scholar] [CrossRef]
- Masmoudi, F.; Jedidi, I.; Ben Amor, Y.; Masmoudi, M. Corrosion Protection Evaluation of Copper Coated with a Block Copolymer and Block Coploymer/Carbon Black Nanoparticles in 3 wt% NaCl Solution. ChemistrySelect 2023, 8, e202202608. [Google Scholar] [CrossRef]
- Yang, L.; Mahmood, N.; Corscadden, K.; Xu, C.C. Production of crude bio-oil via direct liquefaction of spent K-Cups. Biomass Bioenergy 2016, 95, 354–363. [Google Scholar] [CrossRef]
- Dang, C.-H.; Nguyen, T.-D. Physicochemical Characterization of Robusta Spent Coffee Ground Oil for Biodiesel Manufacturing. Waste Biomass Valorization 2019, 10, 2703–2712. [Google Scholar] [CrossRef]
- Krause, M.; Moitinho, A.; Ferreira, L.F.; de Souza, R.; Krause, L.; Caramão, E. Production and Characterization of the Bio-Oil Obtained by the Fast Pyrolysis of Spent Coffee Grounds of the Soluble Coffee Industry. J. Braz. Chem. Soc. 2019, 30, 1608–1615. [Google Scholar] [CrossRef]
- Lazzari, E.; Schena, T.; Marcelo, M.C.A.; Primaz, C.T.; Silva, A.N.; Ferrão, M.F.; Bjerk, T.; Caramão, E.B. Classification of biomass through their pyrolytic bio-oil composition using FTIR and PCA analysis. Ind. Crops Prod. 2018, 111, 856–864. [Google Scholar] [CrossRef]
- Lyman, D.J.; Benck, R.; Dell, S.; Merle, S.; Murray-Wijelath, J. FTIR-ATR Analysis of Brewed Coffee: Effect of Roasting Conditions. J. Agric. Food Chem. 2003, 51, 3268–3272. [Google Scholar] [CrossRef]
- Wang, J.; Jun, S.; Bittenbender, H.; Gautz, L.; Li, Q.X. Fourier Transform Infrared Spectroscopy for Kona Coffee Authentication. J. Food Sci. 2009, 74, C385–C391. [Google Scholar] [CrossRef] [PubMed]
- Raba, D.N.; Poiana, M.-A.; Borozan, A.B.; Stef, M.; Radu, F.; Popa, M.-V. Investigation on Crude and High-Temperature Heated Coffee Oil by ATR-FTIR Spectroscopy along with Antioxidant and Antimicrobial Properties. PLoS ONE 2015, 10, e0138080. [Google Scholar] [CrossRef] [PubMed]
- Phimsen, S.; Kiatkittipong, W.; Yamada, H.; Tagawa, T.; Kiatkittipong, K.; Laosiripojana, N.; Assabumrungrat, S. Oil extracted from spent coffee grounds for bio-hydrotreated diesel production. Energy Convers. Manag. 2016, 126, 1028–1036. [Google Scholar] [CrossRef]
- Atabani, A.; Shobana, S.; Mohammed, M.; Uğuz, G.; Kumar, G.; Arvindnarayan, S.; Aslam, M.; Al-Muhtaseb, A.H. Integrated valorization of waste cooking oil and spent coffee grounds for biodiesel production: Blending with higher alcohols, FT–IR, TGA, DSC and NMR characterizations. Fuel 2019, 244, 419–430. [Google Scholar] [CrossRef]
- Vlachos, N.; Skopelitis, Y.; Psaroudaki, M.; Konstantinidou, V.; Chatzilazarou, A.; Tegou, E. Applications of Fourier transform-infrared spectroscopy to edible oils. Anal. Chim. Acta 2006, 573–574, 459–465. [Google Scholar] [CrossRef]
- Jović, O.; Smolić, T.; Jurišić, Z.; Meić, Z.; Hrenar, T. Chemometric Analysis of Croatian Extra Virgin Olive Oils from Central Dalmatia Region. Croat. Chem. Acta 2013, 86, 335–344.jf0209793. [Google Scholar] [CrossRef]
- Moharam, M.A.; Abbas, L.M. A Study on the Effect of Microwave Heating on the Properties of Edible Oils Using FTIR Spectroscopy. Afr. J. Microbiol. Res. 2010, 4, 1921–1927. [Google Scholar]
- Ballesteros, L.F.; Teixeira, J.A.; Mussatto, S.I. Chemical, Functional, and Structural Properties of Spent Coffee Grounds and Coffee Silverskin. Food Bioproc. Technol. 2014, 7, 3493–3503. [Google Scholar] [CrossRef]
- Todaka, M.; Kowhakul, W.; Masamoto, H.; Shigematsu, M. Thermal analysis and dust explosion characteristics of spent coffee grounds and jatropha. J. Loss Prev. Process Ind. 2016, 44, 538–543. [Google Scholar] [CrossRef]
- Masmoudi, M.; Abdelmouleh, M.; Abdelhedi, R. Infrared characterization and electrochemical study of γ-methacryloxypropyltrimethoxysilane grafted in to surface of copper. Spectrochim. Acta Part A Mol. Biomol. Spectrosc. 2014, 118, 643–650. [Google Scholar] [CrossRef]
- Rahal, C.; Masmoudi, M.; Abdelmouleh, M.; Abdelhedi, R. An environmentally friendly film formed on copper: Characterization and corrosion protection. Prog. Org. Coatings 2015, 78, 90–95. [Google Scholar] [CrossRef]
- Elmorsi, M.; Hassanein, A. Corrosion inhibition of copper by heterocyclic compounds. Corros. Sci. 1999, 41, 2337–2352. [Google Scholar] [CrossRef]
- Raza, M.A.; Rehman, Z.U.; Ghauri, F.A. Corrosion study of silane-functionalized graphene oxide coatings on copper. Thin Solid Films 2018, 663, 93–99. [Google Scholar] [CrossRef]
- Yu, Y.; Yang, D.; Zhang, D.; Wang, Y.; Gao, L. Anti-corrosion film formed on HAl77-2 copper alloy surface by aliphatic polyamine in 3 wt.% NaCl solution. Appl. Surf. Sci. 2017, 392, 768–776. [Google Scholar] [CrossRef]
- Nam, N.; Ha, P.; Anh, H.; Hoai, N.; Hien, P. Role of hydroxyl group in cerium hydroxycinnamate on corrosion inhibition of mild steel in 0.6 M NaCl solution. J. Saudi Chem. Soc. 2019, 23, 30–42. [Google Scholar] [CrossRef]
- Sui, W.; Zhao, W.; Zhang, X.; Peng, S.; Zeng, Z.; Xue, Q. Comparative anti-corrosion properties of alkylthiols SAMs and mercapto functional silica sol–gel coatings on copper surface in sodium chloride solution. J. Sol-Gel Sci. Technol. 2016, 80, 567–578. [Google Scholar] [CrossRef]
- Dhouibi, I.; Masmoudi, F.; Bouaziz, M.; Masmoudi, M. A study of the anti-corrosive effects of essential oils of rosemary and myrtle for copper corrosion in chloride media. Arab. J. Chem. 2020, 14, 102961. [Google Scholar] [CrossRef]
- Hassairi, H.; Bousselmi, L.; Khosrof, S.; Triki, E. Evaluation of the inhibitive effect of benzotriazole on archeological bronze in acidic medium. Appl. Phys. A 2013, 113, 923–931. [Google Scholar] [CrossRef]
- Hong, S.; Chen, W.; Zhang, Y.; Luo, H.Q.; Li, M.; Li, N.B. Investigation of the inhibition effect of trithiocyanuric acid on corrosion of copper in 3.0wt.% NaCl. Corros. Sci. 2013, 66, 308–314. [Google Scholar] [CrossRef]
- Qiang, Y.; Zhang, S.; Xu, S.; Li, W. Experimental and theoretical studies on the corrosion inhibition of copper by two indazole derivatives in 3.0% NaCl solution. J. Colloid Interface Sci. 2016, 472, 52–59. [Google Scholar] [CrossRef]
- Ghelichkhah, Z.; Sharifi-Asl, S.; Farhadi, K.; Banisaied, S.; Ahmadi, S.; Macdonald, D.D. L-cysteine/polydopamine nanoparticle-coatings for copper corrosion protection. Corros. Sci. 2015, 91, 129–139. [Google Scholar] [CrossRef]
- Li, Z.; Wang, X.; Zhang, Y.; Jing, C. Enhancing the Corrosion Resistance of Epoxy Coatings by Impregnation with a Reduced Graphene Oxide-Hydrophobic Ionic Liquid Composite. ChemElectroChem 2018, 5, 3300–3306. [Google Scholar] [CrossRef]
- Peng, S.; Zeng, Z.; Zhao, W.; Li, H.; Xue, Q.; Wu, X. Synergistic effect of thiourea in epoxy functionalized silica sol–gel coating for copper protection. Surf. Coat. Technol. 2012, 213, 175–182. [Google Scholar] [CrossRef]
- Dueke-Eze, C.U.; Madueke, N.A.; Iroha, N.B.; Maduelosi, N.J.; Nnanna, L.A.; Anadebe, V.C.; Chokor, A.A. Adsorption and inhibition study of N-(5-methoxy-2-hydroxybenzylidene) isonicotinohydrazide Schiff base on copper corrosion in 3.5% NaCl. Egypt. J. Pet. 2022, 31, 31–37. [Google Scholar] [CrossRef]
- Bentiss, F.; Lebrini, M.; Lagrenée, M. Thermodynamic characterization of metal dissolution and inhibitor adsorption processes in mild steel/2,5-bis(n-thienyl)-1,3,4-thiadiazoles/hydrochloric acid system. Corros. Sci. 2005, 47, 2915–2931. [Google Scholar] [CrossRef]
- Pourriahi, M.; Nasr-Esfahani, M.; Motalebi, A. Effect of henna and rosemary extracts on the corrosion of 304L stainless steel in 3.5% NaCl solution. Surf. Eng. Appl. Electrochem. 2014, 50, 525–533. [Google Scholar] [CrossRef]
- Fateh, A.; Aliofkhazraei, M.; Rezvanian, A. Review of corrosive environments for copper and its corrosion inhibitors. Arab. J. Chem. 2020, 13, 481–544. [Google Scholar] [CrossRef]
- Ramos, S.A.F.; de Senna, L.F.; Lago, D.C.B.D. Evaluation of Aqueous Coffee Husks Extracts as a Corrosion Inhibitor of 1020 Carbon Steel in 1 mol L-1 HCl Solution. Mater. Res. 2019, 22, e20180839. [Google Scholar] [CrossRef]
- Deyab, M. Corrosion inhibition of aluminum in biodiesel by ethanol extracts of Rosemary leaves. J. Taiwan Inst. Chem. Eng. 2016, 58, 536–541. [Google Scholar] [CrossRef]
- Zhang, H.H.; Qin, C.K.; Chen, Y.; Zhang, Z. Inhibition behaviour of mild steel by three new benzaldehyde thiosemicarbazone derivatives in 0.5 M H2SO4: Experimental and computational study. R. Soc. Open Sci. 2019, 6, 190192. [Google Scholar] [CrossRef]
- Masmoudi, M.; Rahal, C.; Abdelhedi, R.; Khitouni, M.; Bouaziz, M. Inhibitive action of stored olive mill wastewater (OMW) on the corrosion of copper in a NaCl solution. RSC Adv. 2015, 5, 101768–101775. [Google Scholar] [CrossRef]
- de Souza, F.S.; Giacomelli, C.; Gonçalves, R.S.; Spinelli, A. Adsorption behavior of caffeine as a green corrosion inhibitor for copper. Mater. Sci. Eng. C 2012, 32, 2436–2444. [Google Scholar] [CrossRef]


| E | Ecorr(mV/SCE) | JcorrμA cm−2 | βa (mV/dec) | −βc (mV/dec) | CR mm year−1 | Rp (kΩ·cm2) | η (%) |
|---|---|---|---|---|---|---|---|
| Blank | −176 ± 2 | 5.41 ± 1.2 | 40 ± 13 | 120 ± 5 | 0.063 ± 1.1 | 2.40 ± 1.3 | – |
| 0.2 g/L | −272 ± 4 | 0.745 ± 0.3 | 45.4 ± 2 | 62.8 ± 6 | 0.00868 ± 0.3 | 15.35 ± 2 | 86.22 ± 5 |
| 0.4 g/L | −287 ± 3 | 0.305 ± 0.3 | 59.6 ± 7 | 60.7 ± 14 | 0.00355 ± 0.3 | 42.81 ± 1.4 | 94.36 ± 4 |
| 0.6 g/L | −274 ± 4 | 0.228 ± 0.2 | 46.8 ± 2 | 95.9 ± 2 | 0.00265 ± 0.2 | 59.89 ± 2.8 | 95.78 ± 3 |
| Blank | 0.2 g/L | 0.4 g/L | 0.6 g/L | |
|---|---|---|---|---|
| Rs (Ω cm2) | 6.915 ± 0.3 | 7.03 ± 0.8 | 8.4 ± 3.6 | 9.02 ± 2.2 |
| Rct (Ω cm2) | 1466 ± 80 | 6725 ± 200 | 13,985 ± 580 | 17,980 ± 630 |
| Qdl × 10−6 (F cm−2) | 145 ± 20 | 7.42 ± 2.8 | 6.836 ± 4.1 | 7.2 ± 3.5 |
| ndl | 0.687 ± 0.4 | 0.67 ± 0.02 | 0.4 ± 0.03 | 0.53 ± 0.06 |
| Rf (Ω cm2) | - | 3698 ± 7 | 7821 ± 28 | 8932 ± 37 |
| Qf × 10−6 (F cm−2) | - | 10.88 ± 3 | 25.03 ± 2.2 | 26.76 ± 1.8 |
| Rp (Ω cm2) | 1466 ± 60 | 10,423 ± 300 | 21,806 ± 700 | 26,822 ± 900 |
| nf | - | 0.559 ± 0.01 | 0.557 ± 0.01 | 0.63 ± 0.02 |
| W (Ω−1 cm−2 s0.5) | 140.2 ± 18 | - | - | - |
| η (%) | - | 85.93 | 93.27 | 94.55 |
Disclaimer/Publisher’s Note: The statements, opinions and data contained in all publications are solely those of the individual author(s) and contributor(s) and not of MDPI and/or the editor(s). MDPI and/or the editor(s) disclaim responsibility for any injury to people or property resulting from any ideas, methods, instructions or products referred to in the content. |
© 2023 by the authors. Licensee MDPI, Basel, Switzerland. This article is an open access article distributed under the terms and conditions of the Creative Commons Attribution (CC BY) license (https://creativecommons.org/licenses/by/4.0/).
Share and Cite
Rouin, G.; Abdelmouleh, M.; Mallah, A.; Masmoudi, M. Oil Extracted from Spent Coffee Grounds as a Green Corrosion Inhibitor for Copper in a 3 wt% NaCl Solution. Coatings 2023, 13, 1745. https://doi.org/10.3390/coatings13101745
Rouin G, Abdelmouleh M, Mallah A, Masmoudi M. Oil Extracted from Spent Coffee Grounds as a Green Corrosion Inhibitor for Copper in a 3 wt% NaCl Solution. Coatings. 2023; 13(10):1745. https://doi.org/10.3390/coatings13101745
Chicago/Turabian StyleRouin, Ghada, Makki Abdelmouleh, Abdulrahman Mallah, and Mohamed Masmoudi. 2023. "Oil Extracted from Spent Coffee Grounds as a Green Corrosion Inhibitor for Copper in a 3 wt% NaCl Solution" Coatings 13, no. 10: 1745. https://doi.org/10.3390/coatings13101745
APA StyleRouin, G., Abdelmouleh, M., Mallah, A., & Masmoudi, M. (2023). Oil Extracted from Spent Coffee Grounds as a Green Corrosion Inhibitor for Copper in a 3 wt% NaCl Solution. Coatings, 13(10), 1745. https://doi.org/10.3390/coatings13101745