Article

Optical, Electrical and Structural Properties of ITO/IZO and IZO/ITO Multilayer Transparent Conductive Oxide Films Deposited via Radiofrequency Magnetron Sputtering

1
Department of Physics, Nigde Omer Halisdemir University, 51240 Nigde, Turkey
2
Nanotechnology Application and Research Center, Nigde Omer Halisdemir University, 51240 Nigde, Turkey
*
Author to whom correspondence should be addressed.
Coatings 2023, 13(10), 1719; https://doi.org/10.3390/coatings13101719
Submission received: 22 August 2023 / Revised: 28 September 2023 / Accepted: 29 September 2023 / Published: 1 October 2023
(This article belongs to the Section Thin Films)

Abstract

:
In this study, we investigated the potential of multilayer TCO structures, specifically those made up of Indium Tin Oxide (ITO) and Indium Zinc Oxide (IZO), for crystalline silicon heterojunction solar cells (SHJ). We used the radiofrequency (RF) magnetron sputtering method to deposit various thin-film structures under various deposition temperatures and evaluated their electrical, optical, and morphological properties. The objective was to obtain films with lower sheet resistances and higher transmittances than those of single-layer thin films. Our results show that the ITO/IZO/ITO/IZO/ITO multilayer film structure deposited at 200 °C achieves the best sheet resistance of 18.5 Ohm/sq and a high optical transmittance of over 90% at a 550 nm wavelength. This indicates that multilayer TCO structures have the potential to be more optically and electrically efficient, and that they can improve the performance of optoelectronic devices. Finally, a power conversion efficiency of 17.46% was obtained for a silicon heterojunction (SHJ) solar cell fabricated using an ITO/IZO/ITO/IZO/ITO multilayer film structure deposited at 200 °C as a front TCO. Our study provides valuable insights into the field of TCOs and offers a promising avenue for future research.

1. Introduction

The increasing prominence of transparent conductive oxides (TCOs) in a wide range of optoelectronic applications can be attributed to their high optical transmittance in the visible wavelength and good electrical properties. Nevertheless, the practical applications of certain TCOs are restricted due to their high cost, limited transmittance in infrared wavelengths, and elevated sheet resistance, thereby imposing limitations on their usage. TCO films have been utilized in various optoelectronic applications due to their exceptional optical transmittance (>80%) in the visible wavelength range (380–700 nm) and favorable electrical properties (resistivity of <10−4 Ω.cm). These applications include thin-film transistors, solar cells, organic light-emitting diodes (OLEDs), flat-panel displays, liquid-crystal displays, and plasma display panels [1,2,3,4,5,6,7,8,9,10,11,12,13,14,15,16]. Various techniques such as pulsed laser deposition, thermal evaporation, chemical vapor deposition, electron-beam evaporation, sol–gel deposition, ion beam-assisted deposition, and magnetron sputtering are utilized for depositing TCO films [3,4,17,18,19]. Of these techniques, magnetron sputtering is widely employed due to its low substrate temperatures and high accumulation rates, as well as its suitability for industrial applications and its ability to ensure the excellent optoelectronic performance of the film [4,7]. The most widely utilized TCO films include indium tin oxide (ITO) [20,21,22], indium zinc oxide (IZO) [23], aluminum zinc oxide (AZO) [24], fluorine tin oxide (FTO) [25], gallium zinc oxide (GZO) [26], molybdenum zinc oxide MZO [27], and tungsten oxide (WO3) [28,29]. The III-group element Indium is the most effective dopant material among these TCO films owing to its ease of processing, resistance to oxidation, and low reactivity [30]. Despite the elevated expense of TCO films doped with Indium, ITO remains the most commonly used material in optoelectronic applications owing to its exceptional electrical (resistivity of 2 × 10⁻⁴ Ω.cm) and optical properties in comparison to other TCO films [3,7,31,32,33,34]. However, it has been observed that, in comparison to other TCO films, ITO films possess a substantially reduced transmittance performance in the infrared range (λ > 1200 nm) under humid conditions and high temperatures [32]. In recent years, IZO has gained attention as an alternative due to its favorable electrical conductivity and high light transmittance in the wavelength range of 400–900 nm, broad work function, ease of production using traditional sputtering methods, and low deposition temperature. Furthermore, the lack of grain in the amorphous structure of IZO films results in a flat surface, low internal stress, and good etching ability for micro-patterning. In contrast to traditional TCO electrodes, IZO films that are deposited using magnetron sputtering possess an amorphous structure regardless of the process parameters or film thickness [10,35]. This characteristic has been the subject of recent research, where various application examples of multilayer TCO structures such as TCO/Metal/TCO, TCO/TCO, and the combination of different compounds, have been demonstrated [36,37,38,39,40,41,42,43]. Numerous benefits of multilayer structures, including their extremely low sheet resistance and high optical transparency in the visible and near-infrared range, have been reported across a variety of applications [44,45,46,47]. The primary objective of research on multilayer TCOs is to examine the feasibility of utilizing structures that exhibit superior optical and electrical efficiency in optoelectronic devices, such as solar cells, displays, and transistors, among others. Most studies reveal several compelling reasons to favor multilayer TCO structures. These include their heightened stability, superior light transmittance, improved mechanical properties, and diminished light reflection. These attributes are vital for enhancing the overall efficiency and performance of solar cells, especially silicon heterojunction (SHJ) solar cells. One notable accomplishment emphasized in the study by Qingqing Qiu et al. involves optimizing an SHJ solar cell through the incorporation of an intact IZO layer deposition. This optimized cell achieves an impressive efficiency of 24.02%, representing a noteworthy milestone in high-performance solar cell technology [48]. Moreover, the study conducted by Volker Sittinger et al. highlights the exceptional qualities of IZO films as opposed to ITO films when employed as top TCO layers in perovskite–silicon tandem solar cells. This preference for IZO films is rooted in their comparable resistivity and optical characteristics, coupled with their substantially enhanced electrical mobility. The research underscores the critical role of material optimization in the development of efficient perovskite–silicon tandem solar cell designs [49]. Additionally, the research conducted by Muhammad Aleem Zahid et al. discusses the benefits of incorporating an Al2O3/IZO dual-layer antireflection coating on solar cells. This approach led to noticeable improvements, particularly a 1.37% increase in Jsc [50]. The study led by Monica Morales-Masis et al. unveiled the impressive performance of amorphous IZO films as TCO contacts in high-efficiency SHJ solar cells. These amorphous IZO films achieved a remarkable maximum Jsc of 38.6 mA/cm², as demonstrated in [8]. This accomplishment underscores the importance of material innovation in advancing the efficiency of solar cell technologies.
The aim of this study was to create a multilayer TCO structure that possesses superior electrical and optical properties when compared to single-layer films. To achieve this objective, thin layers of IZO were incorporated between layers of ITO and vice versa, thereby combining the properties of both ITO and IZO single-layer films. We analyzed the impacts of the deposition temperature on the electrical, optical, structural, and morphological properties of single-layer ITO, IZO, and multilayer ITO/IZO/ITO/IZO/ITO, IZO/ITO/IZO/ITO/IZO films. The results showed that the single-layer and multilayer films exhibited an average transmittance value of 80% and higher than 80% in the wavelength range of 400–800 nm in the visible spectrum. As the deposition temperature increased, a decrease in sheet resistance and an increase in conductivity were observed. An optimum sheet resistance of 18.5 Ω/sq was obtained for the ITO/IZO/ITO/IZO/ITO multilayer film structure deposited at 200 °C. Moreover, an increase in the deposition temperature led to an expansion in the optical band gap (Eg) range of the thin films (3.86–3.94 eV). The FOM (figure-of-merit) values showed that the ITO/IZO/ITO/IZO/ITO multilayer film deposited at 200 °C can be considered as an alternative to single-layer and multilayer films. Furthermore, the potential of the multilayer film structure as an effective TCO layer for solar cells was demonstrated by applying it as a TCO layer on the front side of SHJ solar cells.

2. Materials and Methods

Single-layer and multilayer TCO films were deposited on soda–lime glass (surface: 2.5 × 2.5 cm2, thickness: 1 mm) and solar cells using physical vapor deposition (PVD) (NANOVAK R&D AŞ, Ankara, Turkey), with a 13.6 MHz radio frequency (RF) magnetron. ITO (In2O3/SnO2 90/10 wt %) and IZO (In2O3/ZnO 90/10 wt %) sputtering targets with 99.99% purity were employed for the thin-film deposition. The single-layer ITO, IZO films, and multilayer films deposited, featuring ITO/IZO/ITO/IZO/ITO, IZO/ITO/IZO/ITO/IZO configurations, all achieved a total thickness of 160 nm, as clearly illustrated in Figure 1. The single-layer ITO, multilayer ITO/IZO/ITO/IZO/ITO, single-layer IZO, and multilayer IZO/ITO/IZO/ITO/IZO films will be abbreviated as TCO-I, TCO-II, and TCO-III, TCO-IV, respectively.
Prior to placing the substrates in the PVD chamber, the glass surface was cleaned using an ultrasonic bath, followed by separate immersions in acetone for 5 min, ethanol for 5 min, and distilled water for 10 min, and subsequently dried with nitrogen (N2). The cleaned glass was then placed inside the PVD system and kept there until a working pressure of 1 × 10⁻⁶ Torr was reached. A pressure of 9 × 10⁻⁴ Torr in the PVD chamber was maintained using Argon (Ar) gas at 5 mTorr (2 sccm), which was continuously supplied to the chamber. The ITO and IZO layers were deposited using 75 W RF magnetron sputtering at room temperature (RT) and 200 °C. In order to preserve the amorphous structure of the a-Si:H layers within the SHJ solar cells, a deposition temperature of 200 °C was selected for the TCO structures. Additionally, RT was included to facilitate the comparison of the electrical and optical properties of these TCO structures according to temperature. The PVD deposition parameters are presented in Table 1. The TCO-I film deposited at RT is abbreviated as TCO-I_RT and the TCO-I film deposited at 200 °C is abbreviated as TCO-I_200 °C. The TCO-II, TCO-III, and TCO-IV films were abbreviated similarly to the TCO-I film (for TCO-II; TCO-II_RT, and TCO-II_200 °C, for TCO-III; TCO-III_RT, and TCO-III_200 °C, and for TCO-IV; TCO-IV_RT, and TCO-IV_200 °C).
Finally, 5 × 5 cm²-sized, oriented in (100) direction, and textured n-type crystalline silicon (c-Si) substrates with a thickness of 180 µm were used for solar cell applications. The first step in cell fabrication was the usage of a 3% HF solution to remove the oxide layer on the c-Si surface. In this study, a cleaning process was performed on the c-Si substrates by immersing them in a solution for 120 s at RT. The c-Si was then rinsed with distilled water and dried with N2. Immediately following cleaning, the c-Si was placed in a Plasma-Enhanced Chemical Vapor Deposition (PECVD) system for the deposition of doped (p-n) and undoped (i) hydrogenated amorphous silicon (a-Si:H) layers. The (p-n) and (i) a-Si:H layers were deposited in the PECVD system under 13.56 MHz RF. Firstly, both surfaces of c-Si were deposited with the (i) a-Si:H (10 nm) layer at 200 °C, 50 W power, and 3.5 mbar pressure using silane (SiH4) and hydrogen (H2) gases. The (n) a-Si:H (10 nm) layer was then deposited using phosphine (PH3), SiH4, and H2 gases at 200 °C, 100 W power, and 2.1 mbar pressure to form the back surface field (BSF). To form a p–n junction structure, a (p) a-Si:H (10 nm) layer was deposited on the front surface using trimethylborane (TMB), SiH4, and H2 gases at 200 °C, 100 W power, and 3 mbar pressure. Subsequently, the ITO (40 nm) and silver (Ag) (280 nm) layers were deposited on the (n) a-Si:H layer in Ar atmosphere via PVD. The thicknesses of the ITO and Ag layers deposited on the (n) a-Si:H layer were kept constant in all SHJ solar cells. The TCO-I, TCO-II, TCO-III, and TCO-IV films were deposited on the front surface of the SHJ solar cell separately via PVD at RT and 200 °C. For the front metallization of the solar cell, fingers and busbars were printed using Ag paste via screen-printing.
The optical transmittance spectra and thickness of the TCO films were obtained using a Woollam V-Vase Ellipsometer (J.A. Woollam Company, Lincoln, NE, USA). An EddyCus® TF lab 4040 Hybrid contactless sheet resistance measurement system (SURAGUS GmbH, Dresden, Germany) was used for the electrical measurement of the TCO films. The structural properties of the TCO films were investigated using X-ray diffraction (XRD, PANalytical, Malvern Panalytical, Malvern, Worcestershire, UK) with CuKα radiation (λ = 0.15406 nm). Scanning electron microscopy (SEM, Zeiss EVO 40, ZEISS Microscopy, Oberkochen, Germany) and atomic force microscopy (AFM) (Innova, Bruker, Billerica, MA, USA) were used to study the surface morphology of the TCO films. A scanning area of 2 × 2 μm2 was selected for mapping via AFM. Finally, KOPEL Innovative PV Test Systems (Kyoshin Electric Co., Ltd., Kyoto, Japan) were used to determine the solar cell photovoltaic parameters.

3. Results and Discussion

3.1. Structural and Morphological Properties

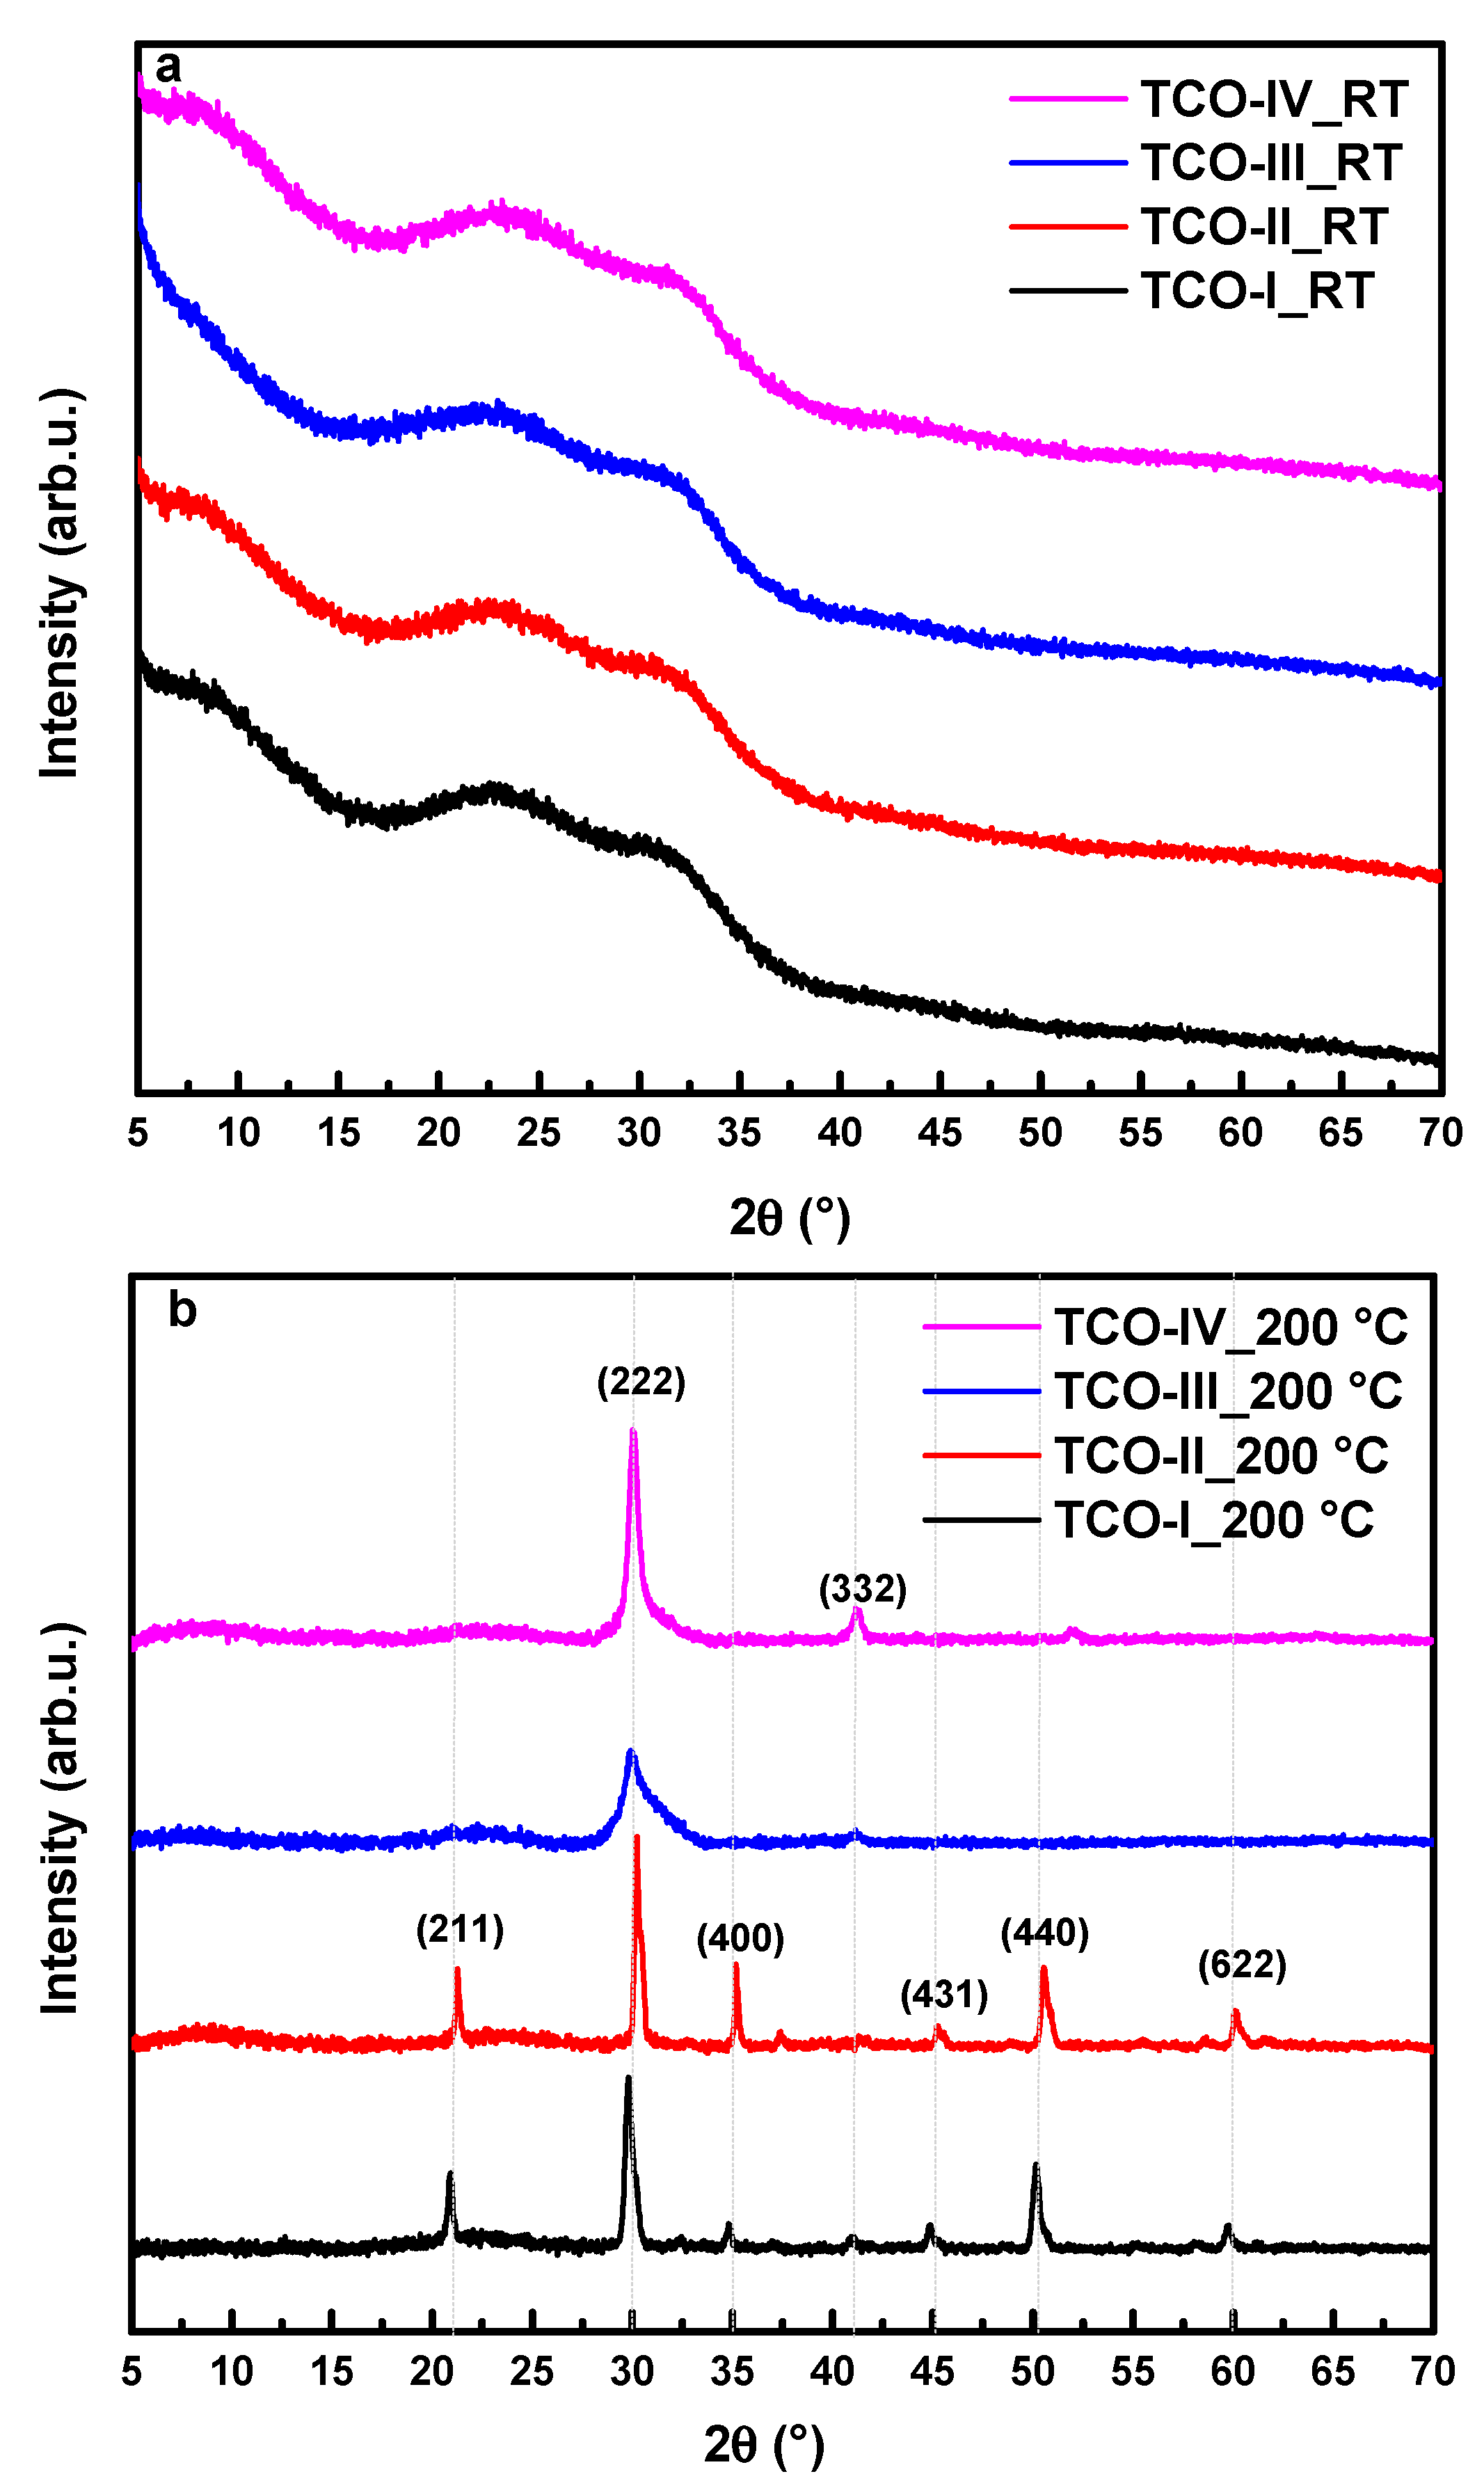
Structural analyses of the TCO films were conducted using XRD with a CuKα (λ = 0.15406 nm) X-ray source. The scan range was 2θ = 5–70°. The results of the XRD analysis for the TCO films are presented in Figure 2a,b.
The XRD results for the TCO films deposited at RT (Figure 1a) show an amorphous broad diffraction spectrum in the 20°–35° range with no distinct diffraction peaks observed. This can be attributed to the lack of zinc oxide (ZnO) incorporation into the indium oxide (In2O3) matrix in the case of IZO films, as reported by Lee et al. [51]. Similarly, the amorphous nature of the ITO films deposited below 100 °C has been reported by Park et al. [52]. In contrast, Figure 2b shows the results of the XRD analysis for the TCO films deposited at 200 °C and reveals enhanced crystallization in all films. The single-layer TCO-I_200 °C film exhibited (211), (222), (400), (431), (440), and (622) diffraction peaks, confirming the bixbyite-type crystal structure of the cubic-phase ITO [53,54]. The degree of crystallinity in the ITO film is contingent upon the manufacturing method and the conditions of deposition. In the context of this study, the ITO films exhibited a preferential orientation along the (100) crystallographic plane [55]. It is worth noting that the orientation of the ITO may change under different conditions, as reported by Thilakan et al. [56,57]. It was observed that the presence of IZO interlayers in the multilayer TCO-II_200 °C film increased the intensity of diffraction peaks compared to the single-layer TCO-I_200 °C film. Despite using the same deposition conditions for both the single-layer TCO-I_200 °C film and the multilayer TCO-II_200 °C film, they exhibited higher peak intensities (i.e., (211), (222) and (400)) as a result of the IZO film acting as an interlayer. In Figure 2b, the XRD analysis results demonstrate that the single-layer TCO-III_200 °C film exhibits prominent diffraction peaks associated with the (222) and (332) crystallographic planes. These findings indicate the presence of a well-defined crystalline structure in the film. Fortunato et al. [58] have reported that IZO films fabricated under a high RF power exhibit a polycrystalline structure, characterized by a sharp (222) diffraction peak at 30.5°, which is due to the low-In2O3 (10 wt. %) cubic bixbyite-type structure of ZnO in the In2O lattice. Despite this, the multilayer TCO-IV_200 °C film exhibited different intensities for these peaks compared to the single-layer TCO-III_200 °C film. This variation can be attributed to the introduction of ITO as an interlayer, which likely contributed to an enhancement in the peak intensity and influenced the overall crystal structure of the film. Typicall, in TCO/TCO configurations, the layer possessing greater thickness and a greater initial interaction point for X-rays tends to manifest a more pronounced XRD diffraction pattern. This phenomenon can be attributed to the increased path length that X-rays cover within the material. As X-rays traverse a longer distance, a greater number of atoms participate in X-ray scattering, resulting in a heightened peak intensity within the diffraction pattern. Consequently, this enhanced intensity renders the diffraction peaks more discernible and identifiable. When comparing the XRD patterns of multilayer thin films in TCO-II and TCO-IV, the structure with the greater film thickness exhibits a more prominent XRD pattern. Table 2 provides an overview of the structural characteristics of TCO films, deposited at a temperature of 200 °C.
Williamson–Hall (W–H) analysis was performed to determine the crystallite size (D) of the TCO films deposited at 200 °C. In this approach, the W–H equation is as follows [59,60,61,62,63]:
β cos θ = k λ D + ε   4 sin θ
In this formula, β is the full width at half maximum (FWHM), θ is the scattering angle, k = 0.9 is the shape factor, λ = 0.15406 nm is the X-ray wavelength, and ε is the lattice stress. Figure 3 shows the Williamson–Hall plots of the TCO films deposited at 200 °C. The data points for each sample are expressed with different symbols and a straight line was passed through all data points using the fitting method. The y-intercept of this straight line (=kλ/D) gives the crystallite size, while the slope gives the lattice stress. According to the obtained D value, the dislocation density (δ) and crystallites per unit field (N) values were calculated using the following equations, and these values are given in Table 2. The dislocation density (δ) was calculated using the following equation, as described in reference [32]:
δ = 1 D 2
Using the following formula, the calculation of the number of crystallites per unit field (N) was performed:
N = t D 3
The increase in the deposition temperature from RT to 200 °C indicates that the TCO films transitioned from the amorphous phase to the crystalline phase. This indicates that the crystalline region of TCO films deposited at 200 °C increases slightly. Due to both the effect of temperature and the effect of IZO being used as an interlayer, the best D value (35.02 nm) was obtained in the multilayer TCO-II_200 °C film. The next best D value was observed in the single-layer TCO-I_200 °C film (17.51 nm), followed by the multilayer TCO-IV_200 °C (6.23 nm) and single-layer TCO-III_200 °C (1.15 nm). When single-layer TCO-I_200 °C and multilayer TCO-II_200 °C films are compared among themselves, it is seen that the film obtained using IZO as an interlayer shows better D. Similarly, when single-layer TCO-III_200 °C and multilayer TCO-IV_200 °C films are compared, it is seen that the film obtained by using ITO as an interlayer shows better D. The use of IZO and ITO as an interlayer in the multilayer TCO-II_200 °C and TCO-IV_200 °C films showed superior crystallite quality compared to single-layer TCO-I_200 °C and TCO-III_200 °C films. The δ values of the TCO films at 200 °C obtained using Equation (2) are given in Table 2. The δ value of the multilayer TCO-II_200 °C film exhibits the lowest value compared to the other films, indicating that the linear defects were reduced. The highest δ value was observed in the single-layer TCO-III_200 °C film (highest linear defect), followed by the multilayer TCO-IV_200 °C and single-layer TCO-I_200 °C films, respectively. The N values of the TCO films at 200 °C obtained using Equation (3) are given in Table 2. It was observed that the N value of the multilayer TCO-II_200 °C film decreased and there was a positive correlation with the crystal size of the film [64]. The highest N value was observed in the single-layer TCO-III_200 °C film, followed by the multilayer TCO-IV_200 °C and single-layer TCO-I_200 °C films, respectively.
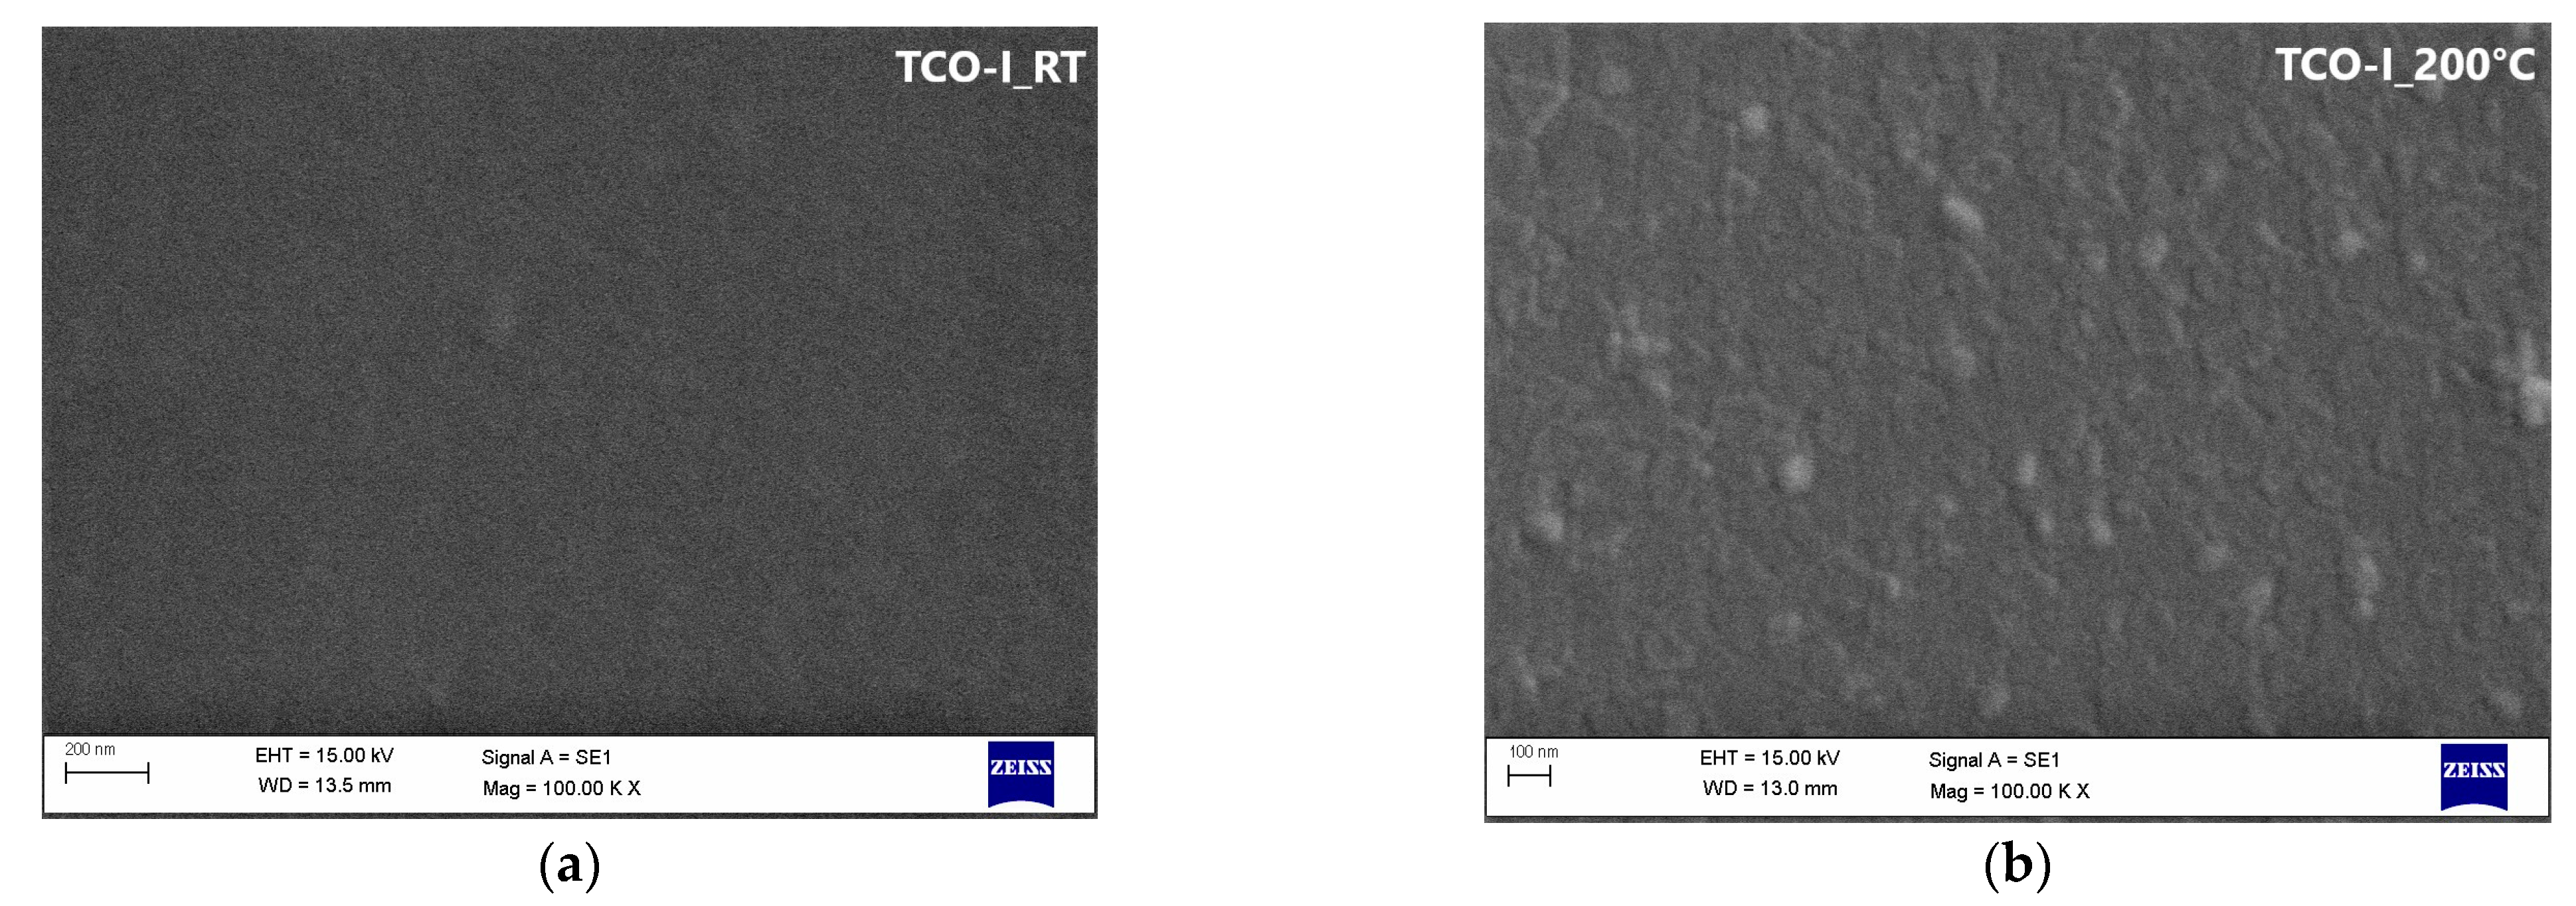
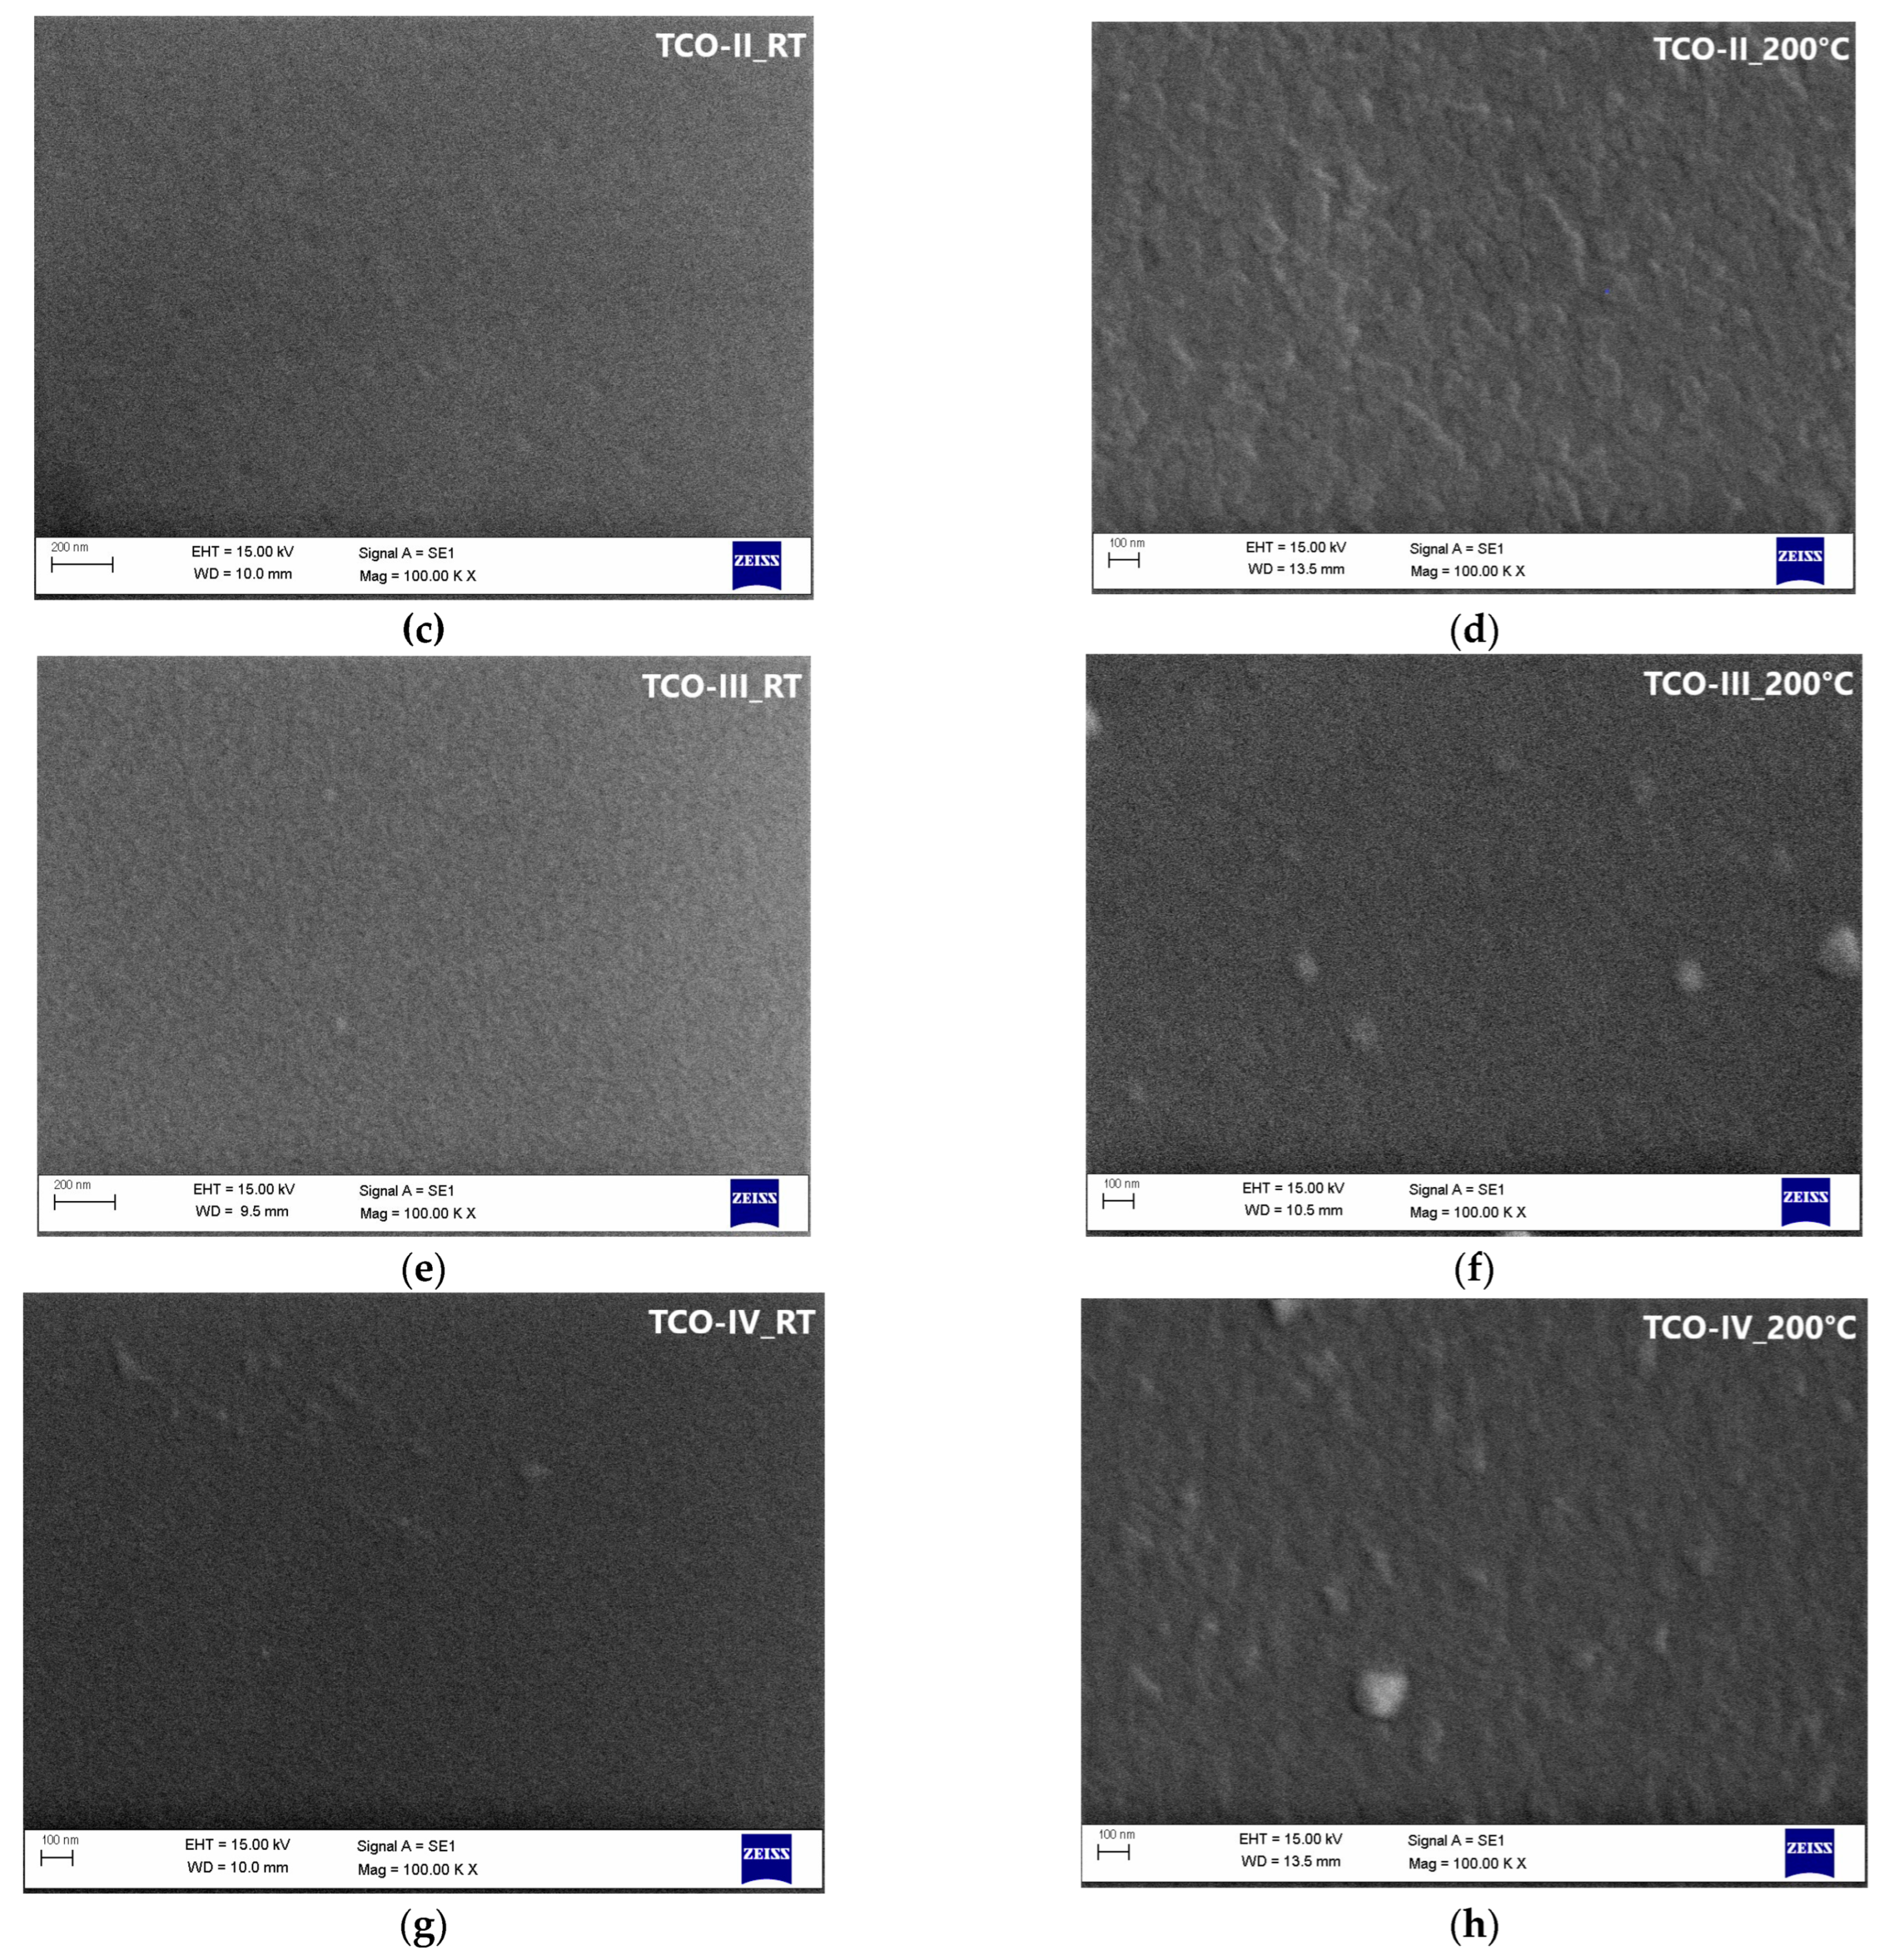
Figure 4 displays SEM images of the TCO films. The SEM analysis revealed that the TCO films deposited at RT exhibited an amorphous structure, which was consistent with the findings from the XRD measurements shown in Figure 2. Figure 4 (b,d,f,h) show SEM images of the TCO films deposited at 200 °C. Among these images, the most notable structural change was observed in the multilayer TCO-II_200 °C film (Figure 4d). Interestingly, incorporating ITO as an interlayer in the multilayer TCO-IV_200 °C film led to an improvement in the surface properties compared to the single-layer TCO-III_200 °C film deposited at the same temperature. This improvement is correlated with the XRD measurements in Figure 2b and resulted in an increased density of the (222) plane.
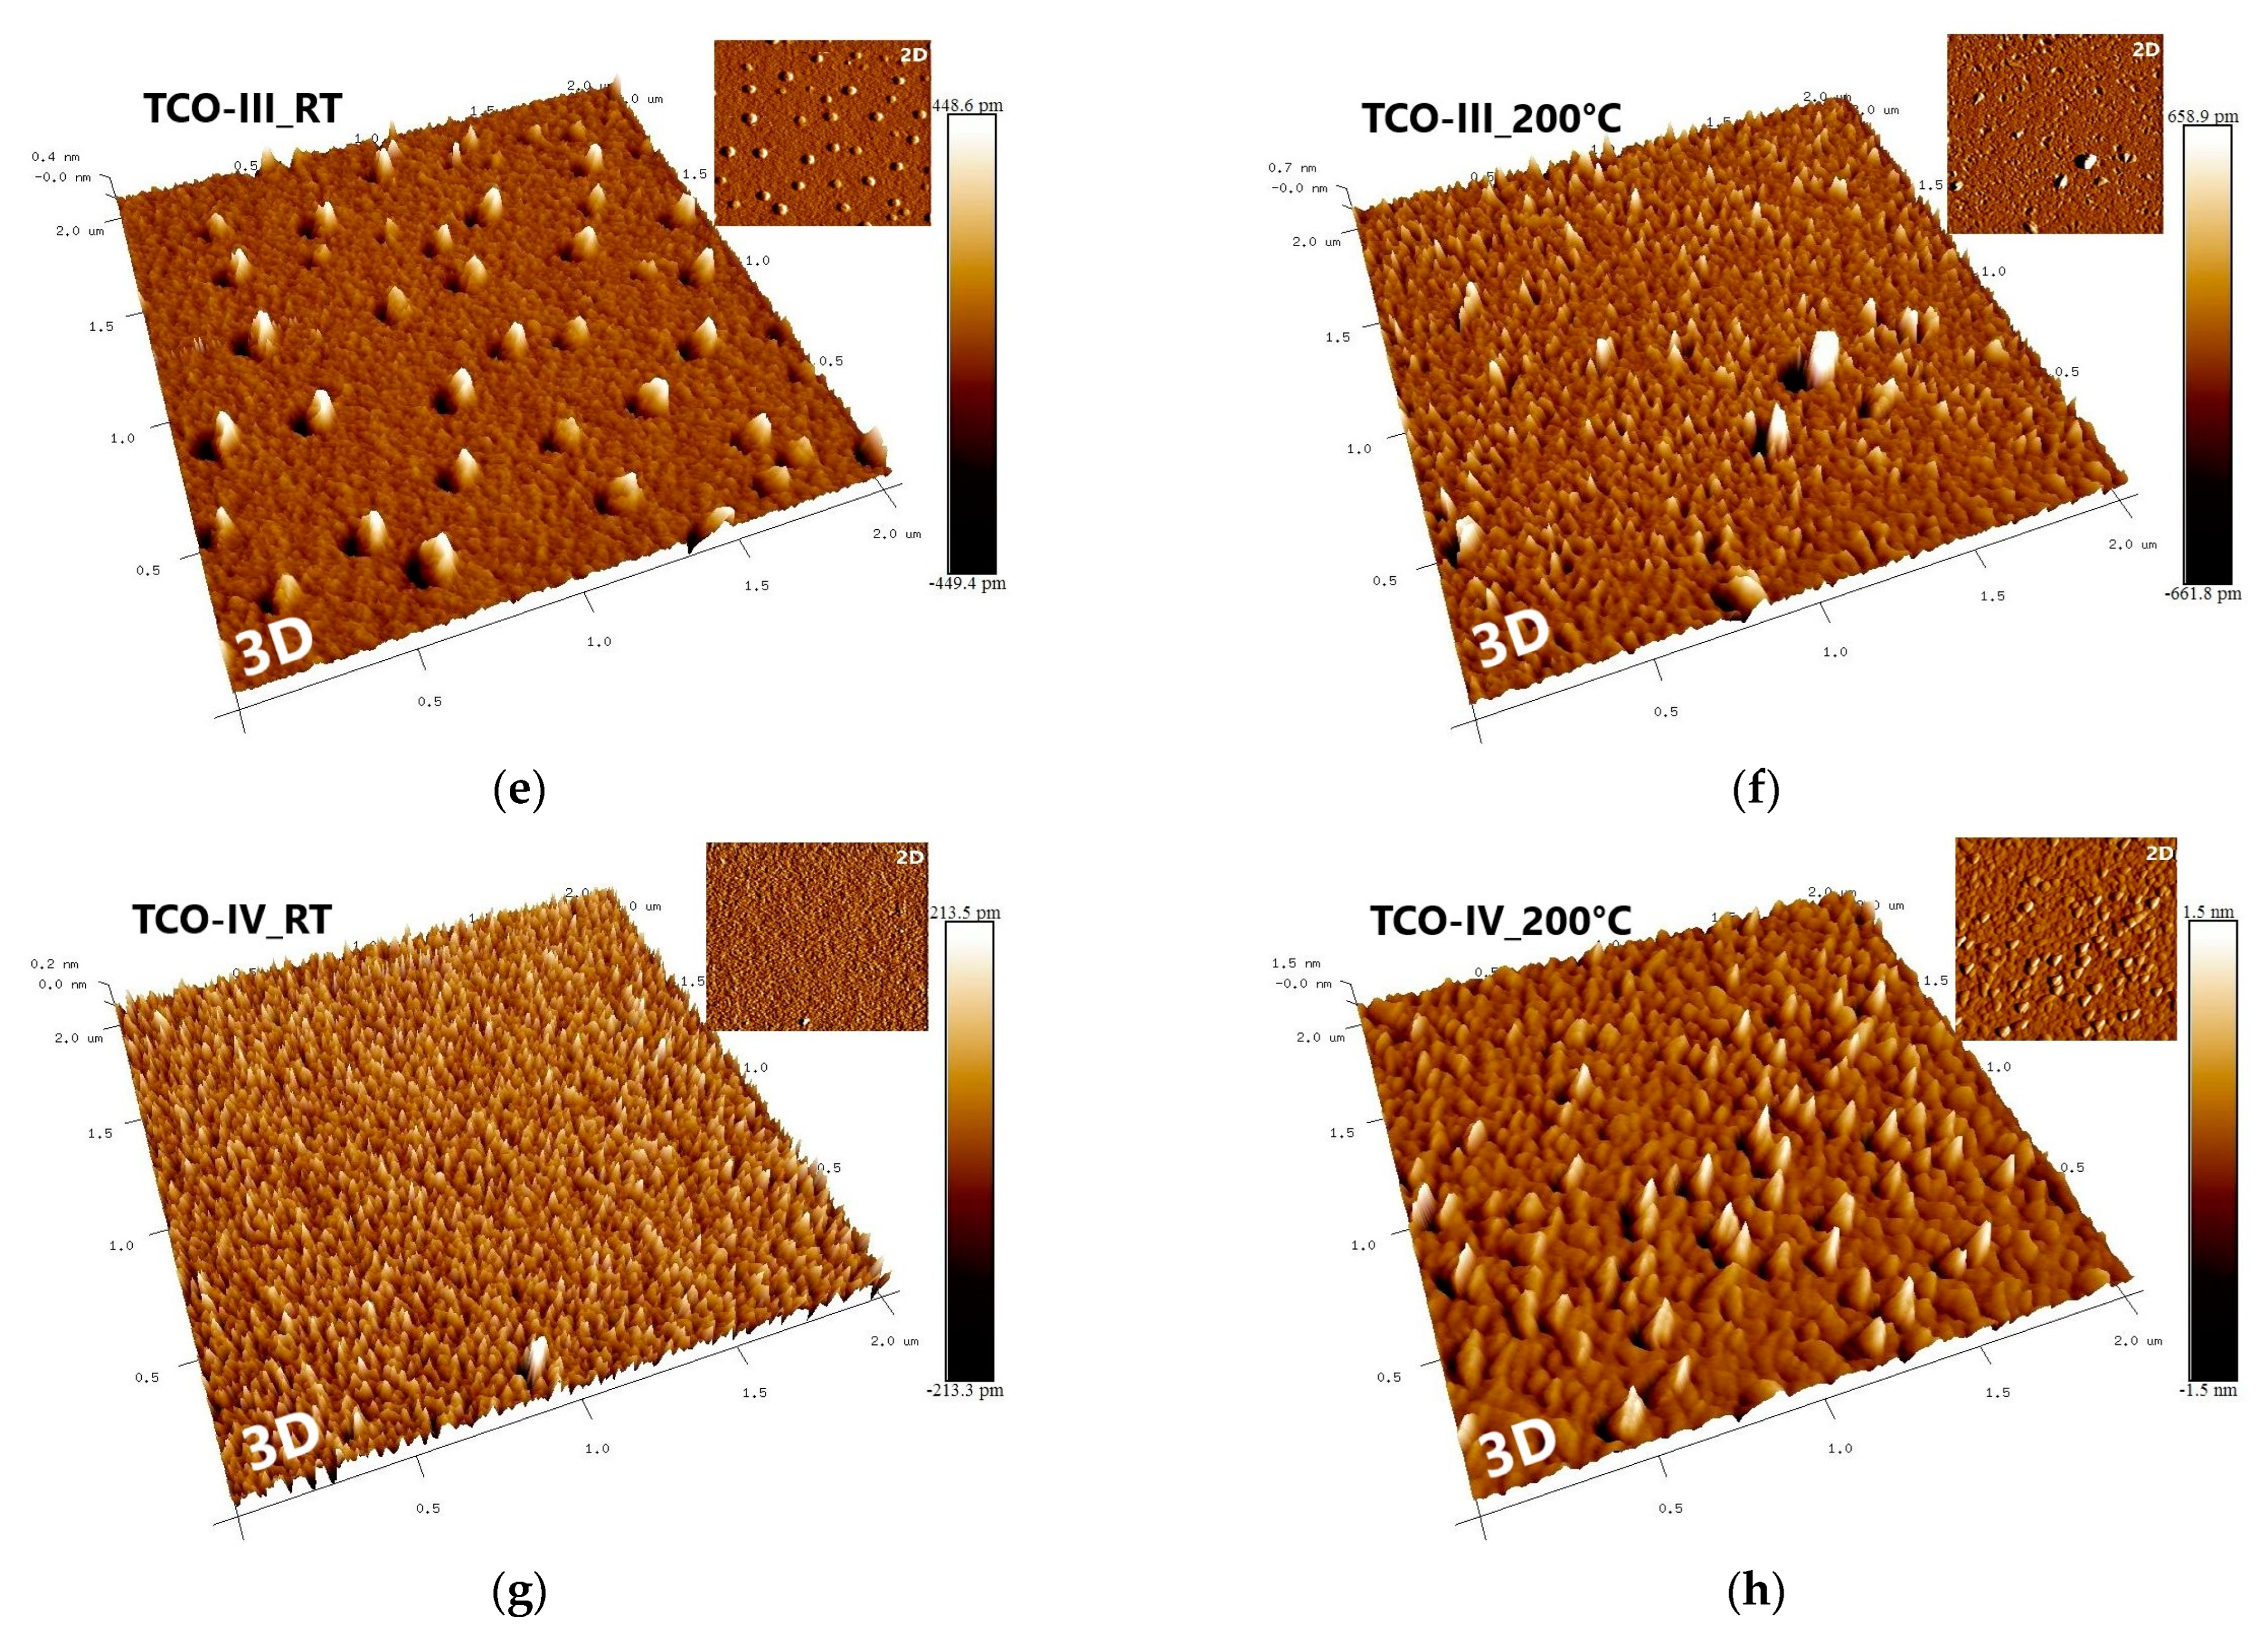
Figure 5a–h presents 2-dimensional (2D) and 3-dimensional (3D) AFM images of the TCO films with a scan area of 2 × 2 µm². AFM was performed using the touch mode with an antimony-doped Si cantilever. Various AFM surface roughness parameters (such as arithmetic mean roughness Ra, root mean square roughness Rq-RMS, and maximum roughness depth Rmax) were calculated to evaluate the surface properties; these are summarized in Table 3. AFM measurements revealed different surface morphologies for each TCO film and showed that all TCO films had inhomogeneous surface distributions. The examination of the AFM images in Figure 5 revealed the presence of valleys, mountains, and island clusters at various scales on the surfaces of all TCO films. The XRD patterns obtained at RT for all TCO films confirmed the presence of amorphous phases consistent with the AFM images, and revealed the formation of small grains. Moreover, the TCO films deposited at RT exhibited a lower surface roughness compared to those deposited at 200 °C. In the TCO films deposited at 200 °C, an increase in the surface roughness was observed along with the formation of larger grains due to the temperature effect, as consistently observed in XRD measurements. In addition to surface morphology, the surface roughness was evaluated using the RMS values obtained from the AFM measurements. The RMS values for the TCO-I, TCO-II, TCO-III, and TCO-IV films deposited at RT were 0.0512 nm, 0.0625 nm, 0.0642 nm, and 0.0617 nm, respectively. Similarly, the RMS values for the TCO-I, TCO-II, TCO-III, and TCO-IV films deposited at 200 °C were 0.307 nm, 0.330 nm, 0.214 nm, and 0.297 nm, respectively. The temperature-dependent increase in the RMS values of the TCO films can be attributed to the aggregation of small grains into larger clusters or the increase in the crystal size after annealing [65,66]. Furthermore, the increase in the RMS value is also related to the behavior of the absorption coefficient in the films [67]. Among all films, the multilayer TCO-II_200 °C film exhibited the highest surface roughness, while the multilayer TCO-II_200 °C and TCO-IV_200 °C films had the highest surface roughness between the single and multilayer films. These findings are consistent with the intensities of the XRD diffraction peaks in the films. Furthermore, the increasing surface roughness was closely correlated with the electrical resistivity of the films [68]. This observation is consistent with the improvement in the electrical properties of the films with both the increase in the temperature and increase in the crystal structure within similar TCO groups (e.g., TCO-I_RT and TCO-I_200 °C). As a result, multilayer TCO-II_200 °C and TCO-IV_200 °C films are considered to be promising choices when compared with other TCO films.

3.2. Optical and Electrical Properties

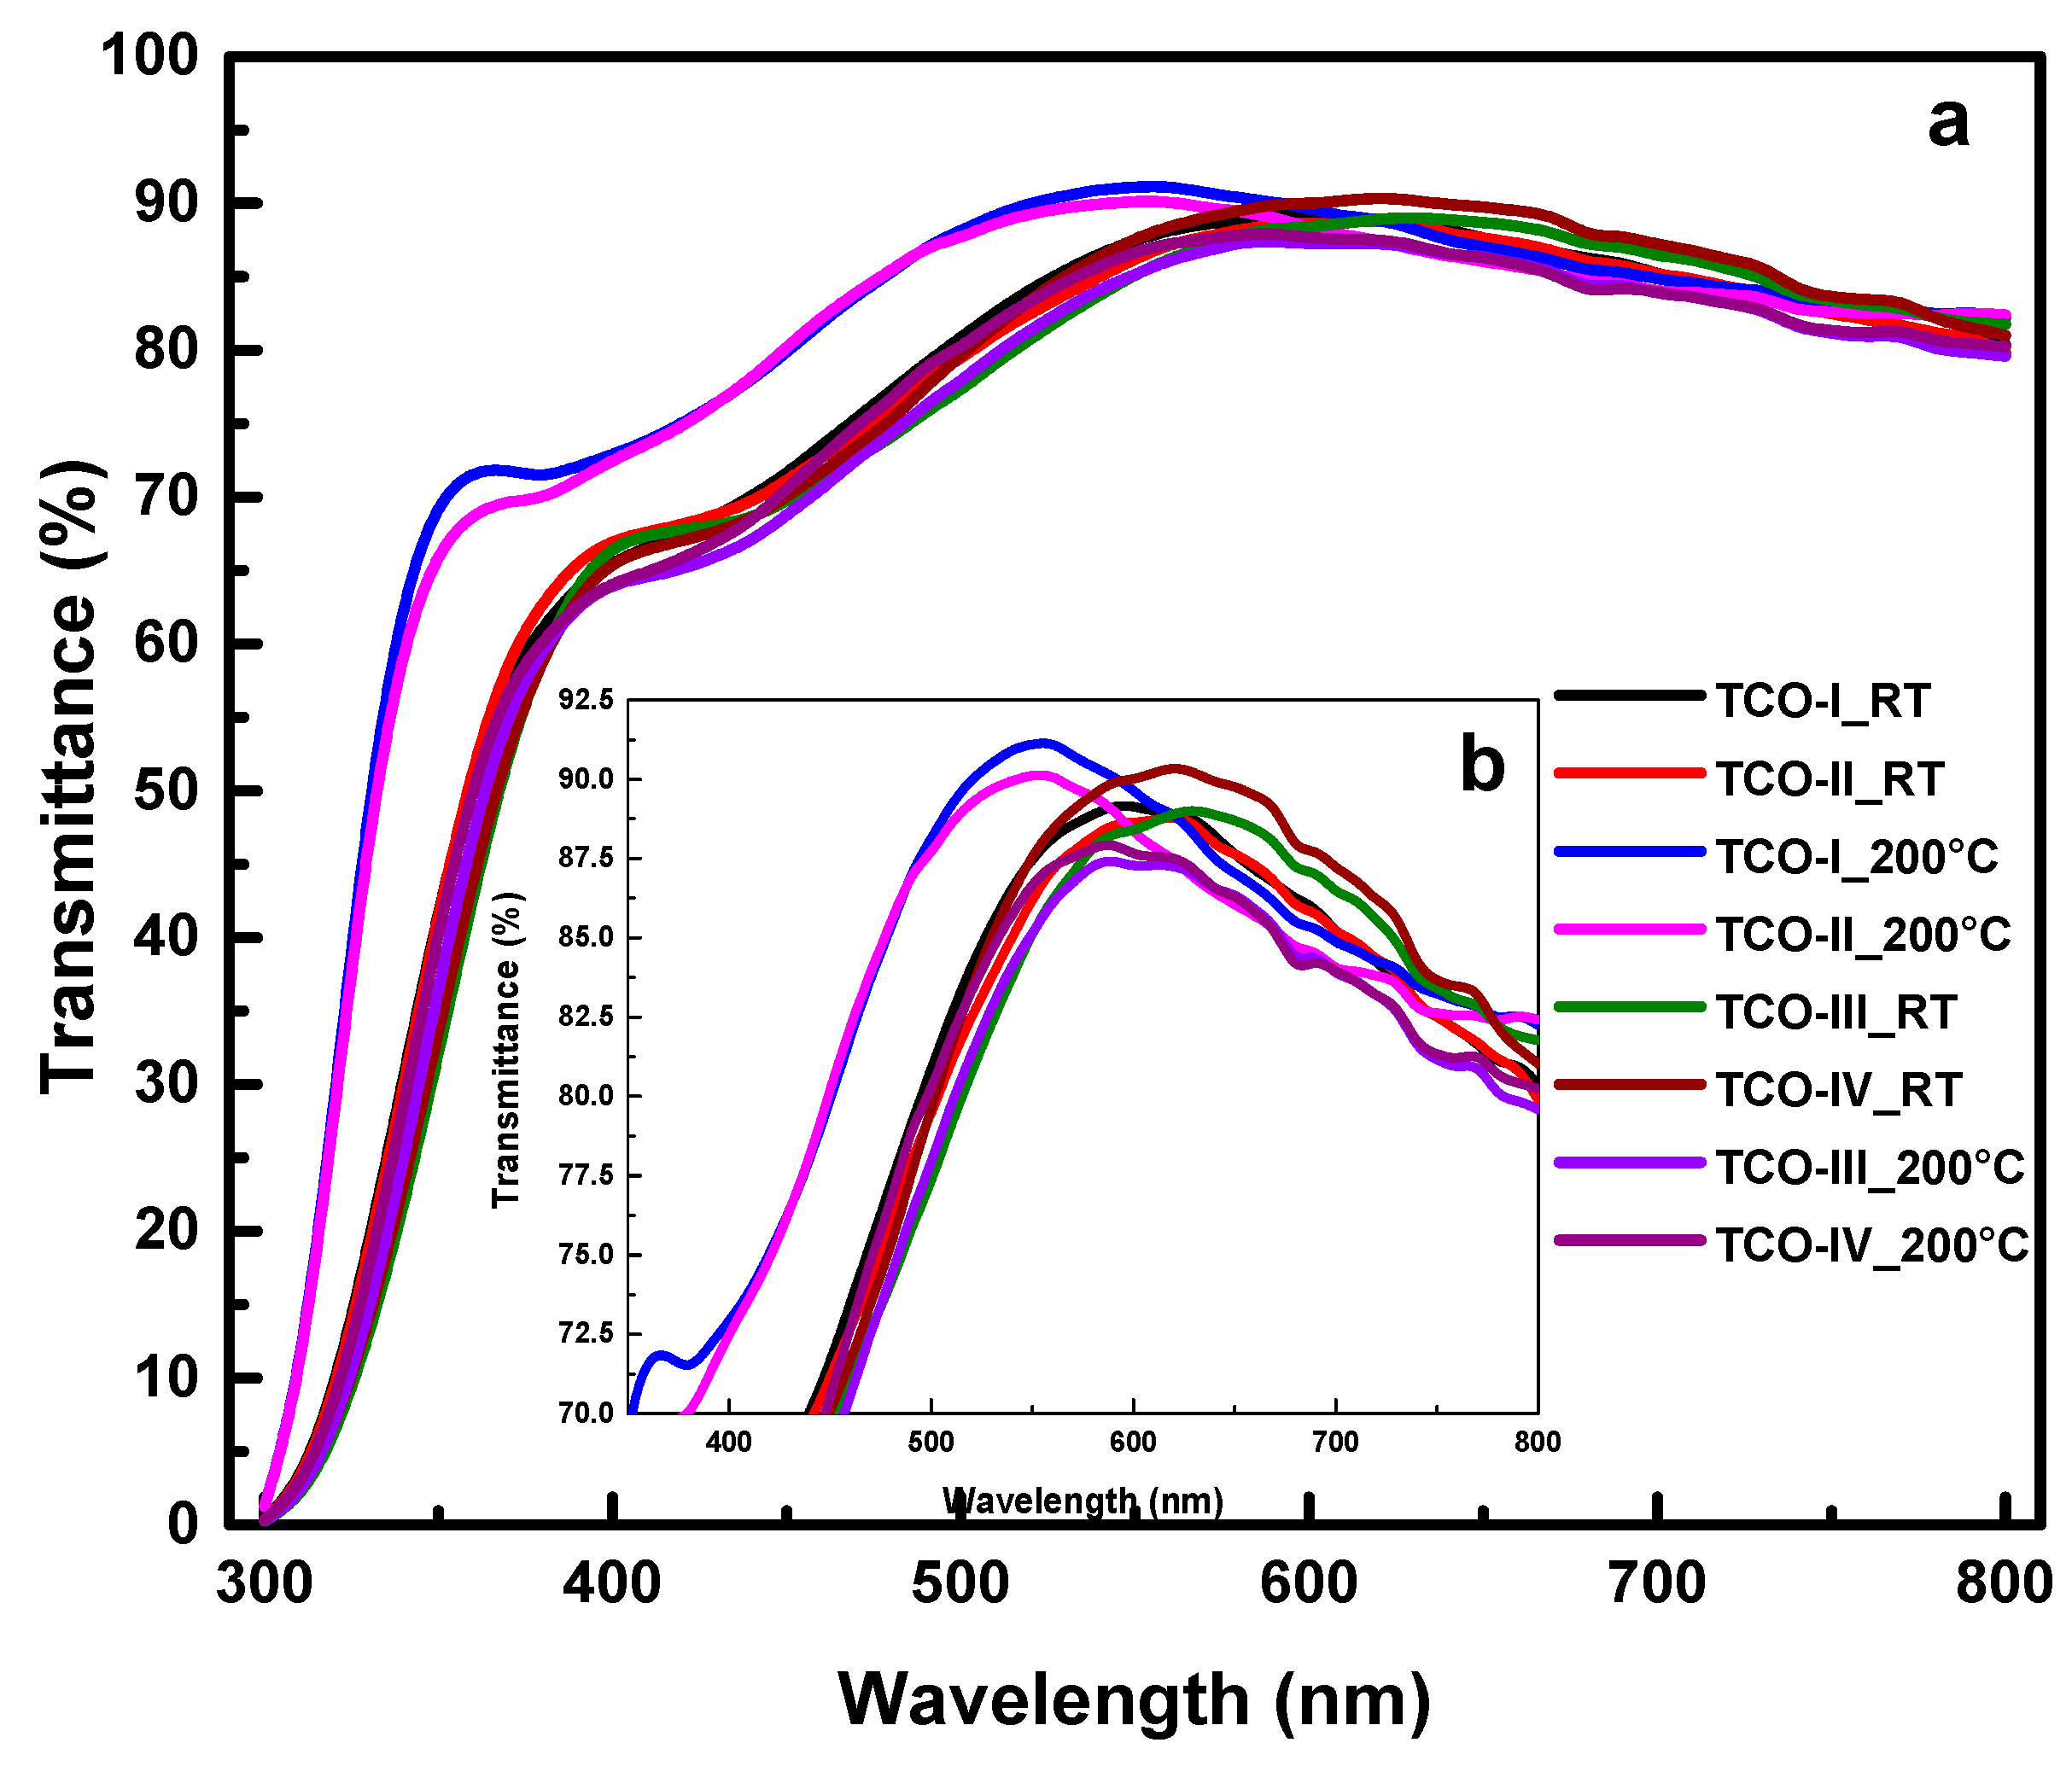
The transmittance measurement results of the TCO films deposited at RT and 200 °C are given in Figure 6a and the average values in the visible region (400–800 nm) of the electromagnetic spectrum are given in Table 3. When the results are compared, the single-layer TCO-I_RT (82.1%) and multilayer TCO-II_RT (81.7%) films exhibited lower transmittance than the single-layer TCO-I_200 °C and multilayer TCO-II_200 °C films. The single-layer TCO-I_200 °C (85.1%) and multilayer TCO-II_200 °C (84.5%) films exhibited higher transparency than all TCO films and showed a significant increase in transmittance in the near-ultraviolet region (UV) (Figure 6b). For the predominantly ITO films, the annealing process led to the expected increase in transmittance in the visible spectrum due to the improvement of the crystal structure, resulting in higher transmittance. On the other hand, the single-layer TCO-III_RT and multilayer TCO-IV_RT films showed higher transmittance at near-infrared wavelengths (Figure 6b) compared to other TCOs, although the average transmittance values were 81.6% and 82.5%. For the predominantly IZO films, a decrease in the average transmittance values was observed with the application of temperature treatment, with a transmittance value of 80.2% for the single-layer TCO-III_200 °C film and 80.9% for the multilayer TCO-IV_200 °C film. The reason for this decrease in transmittance is due to the higher crystallization temperature of IZO (500 °C) and its persistent amorphous properties at lower temperatures [3,69]. The multilayer TCO-IV_RT film was found to have the highest average transmittance among all the films in which IZO was predominantly used. In addition, the multilayer TCO-IV_RT film exhibited slightly higher transmittance properties than the single-layer TCO-III_RT film, and the multilayer TCO-IV_200 °C film exhibited slightly higher transmittance properties than the single-layer TCO-III_200 °C film. The reason why the impact of the multi-layer structure on transmittance is not fully discernible lies in the high crystallization temperature of IZO. All TCO films demonstrate excellent transparency in the visible and near-infrared (NIR) spectrum, ranging from 80% to 85% (glass + thin film). This makes them viable candidates for use as TCO in optoelectronic devices.
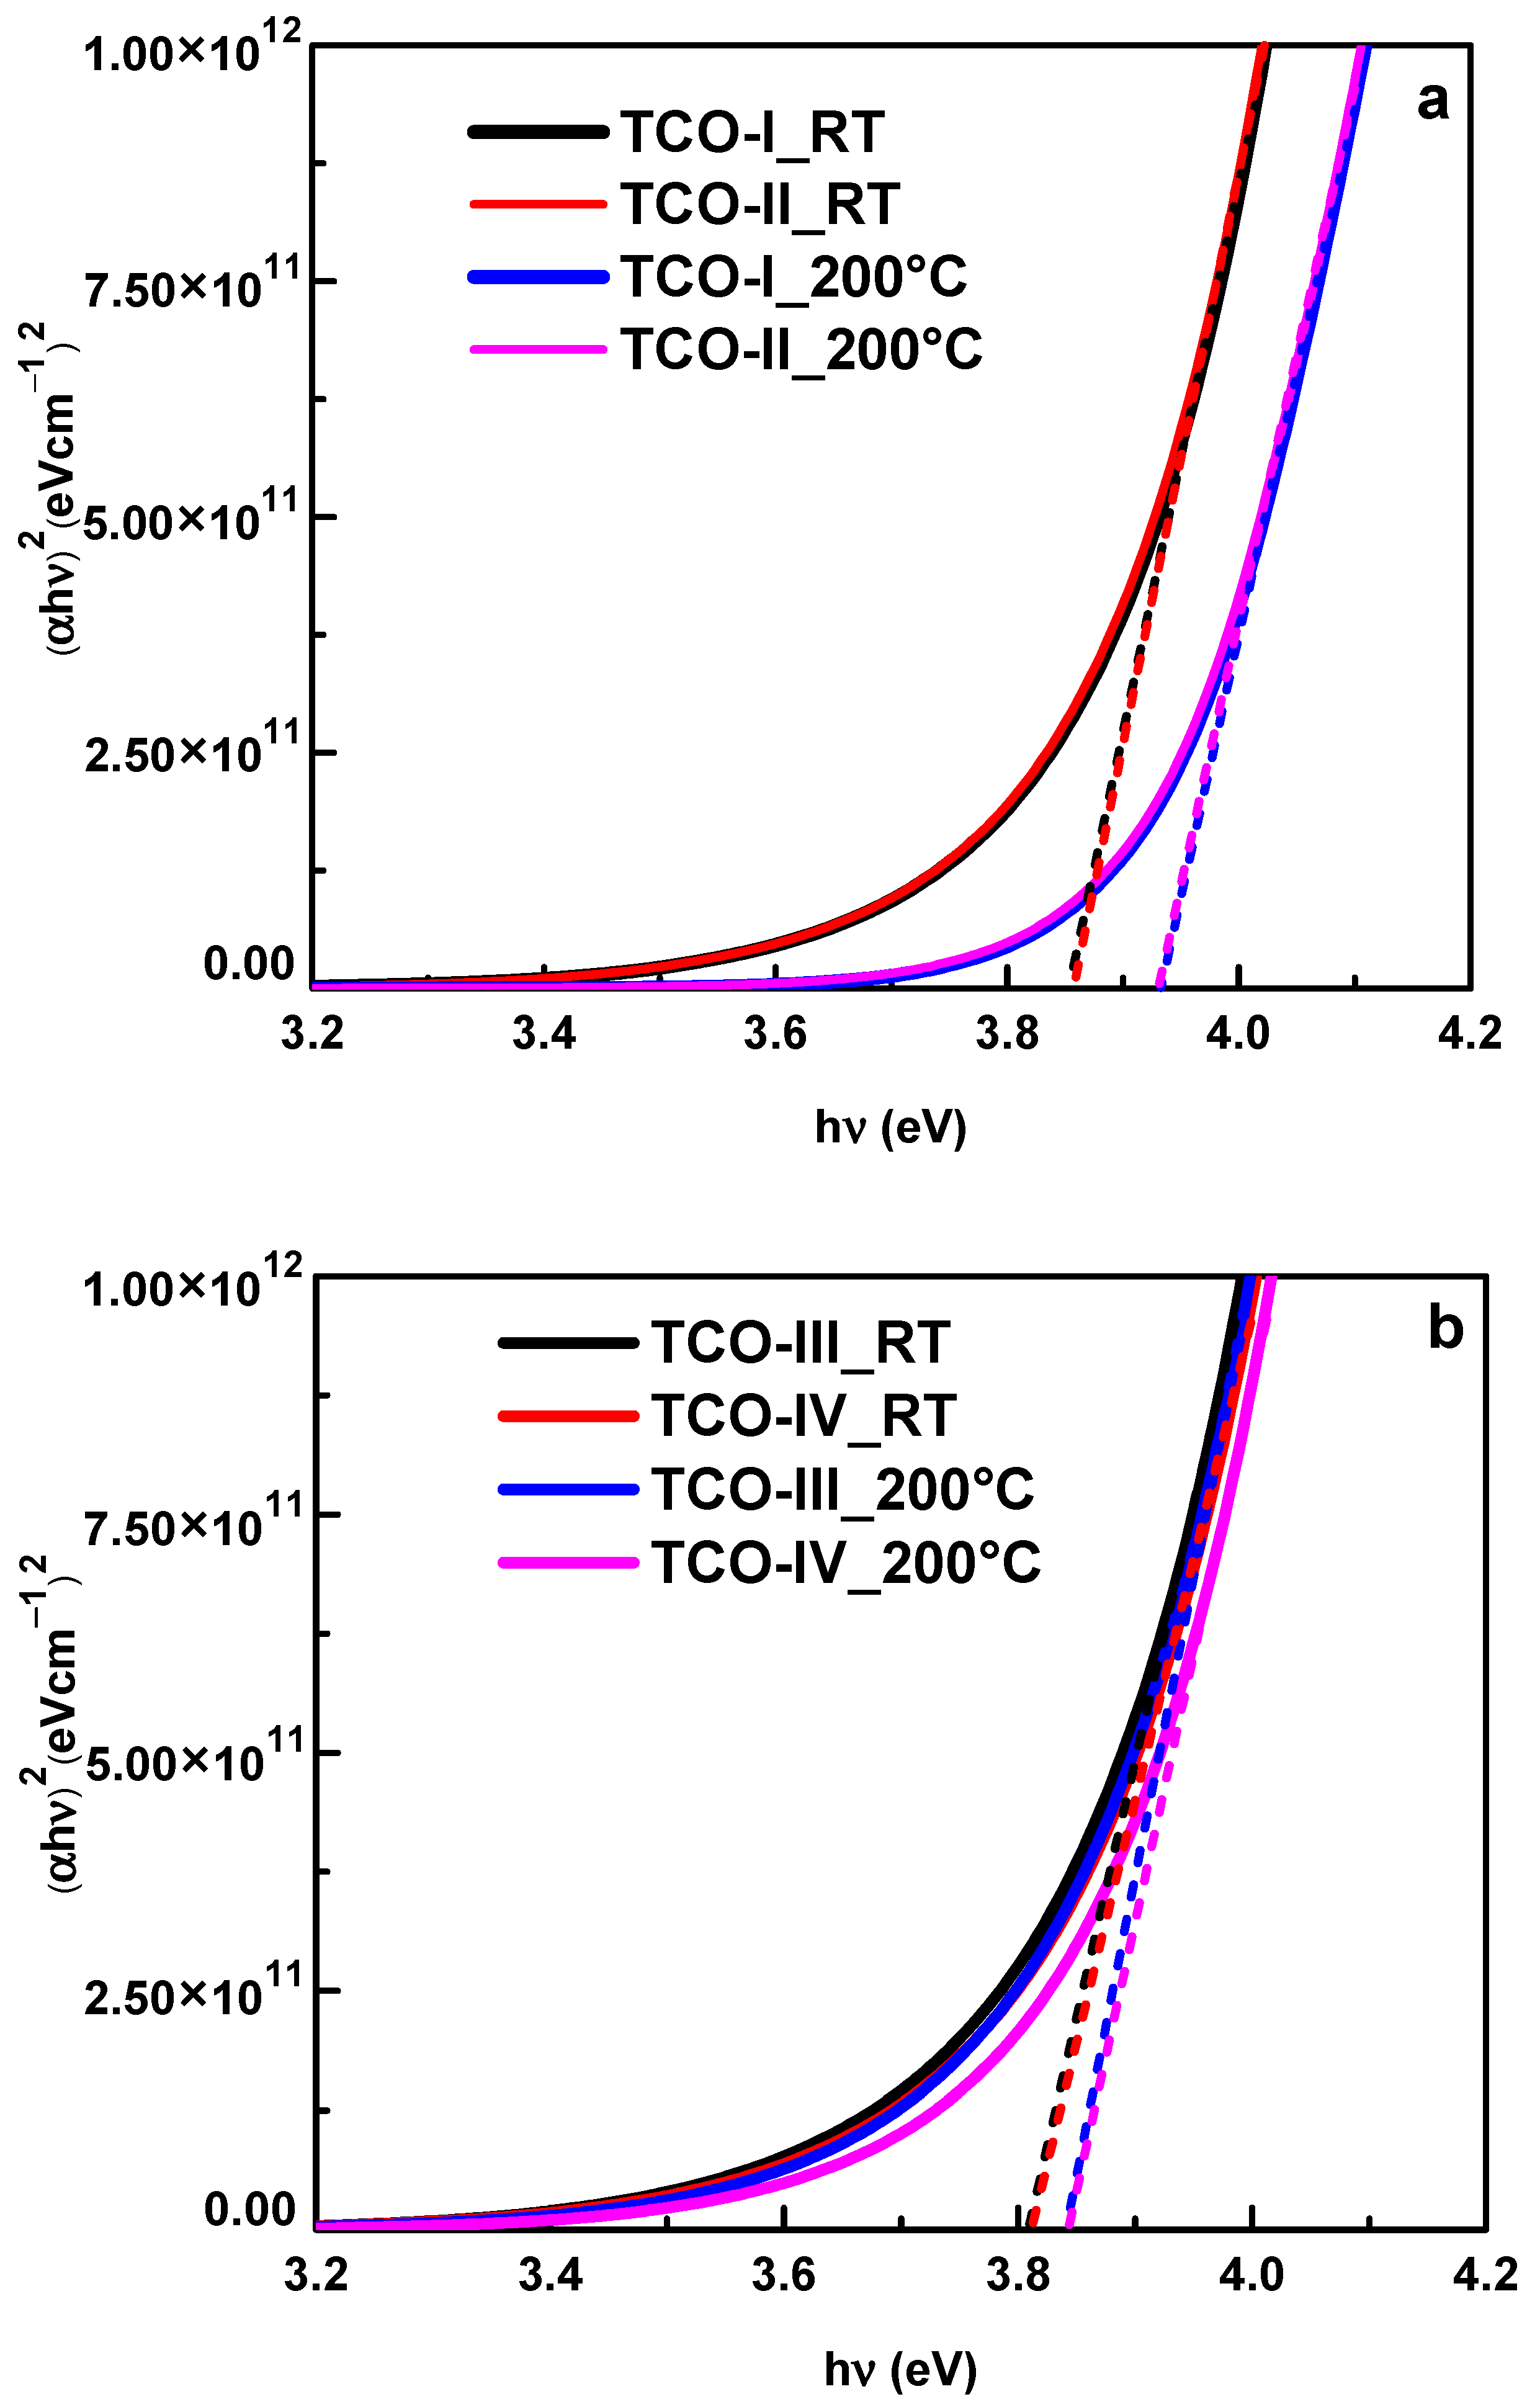
The optical Eg of the semiconductor materials was determined using the optical absorption coefficient in the visible region (α) and the energy of the incident photon (hν) [70]. The optical band gaps of the TCO films were calculated by plotting (αhν)2 against in Figure 7. The corresponding band gaps for the TCO films are summarized in Table 3. The optical band gaps of the TCO films were calculated in the range of 3.81 eV to 3.93 eV. In particular, the single-layer and multilayer TCO films deposited at 200 °C exhibited higher band gaps than their single-layer and multilayer counterparts deposited at RT (e.g., TCO-I_200 °C (Eg: 3.93 eV) > TCO-I_RT (Eg: 3.85 eV)), which can be attributed to the Burstein–Moss effect [71]. This broadening in Eg may indicate that the formation of defects in TCO films decreases with an increasing deposition temperature. Also, the increase in Eg can be attributed to the effect of the increase in the crystal quality according to the results obtained from XRD. Interestingly, the single-layer TCO-I_RT and multilayer TCO-II_RT films (3.85 eV), TCO-I_200 °C, and TCO-II_200 °C films (3.95 eV) showed the same band gap values among themselves. Similarly, the single-layer TCO-III_RT and multilayer TCO-IV_RT films (3.81 eV), TCO-III_200 °C and TCO-IV_200 °C films (3.84 eV) showed the same band gap values among themselves. As a result, the TCO films with the widest bandgap (single-layer TCO-I_200 °C and multilayer TCO-II_200 °C) are more suitable for solar cell applications because they can enhance the transmission of more photons. Furthermore, a larger optical bandgap makes the material less sensitive to lower-energy light, including longer wavelengths such as infrared. It will transmit or reflect such light more effectively. In addition, an increase in the optical bandgap shifts the absorption edge to higher energies in the Tauc plot, indicating that the material is more effective at absorbing shorter-wavelength light.
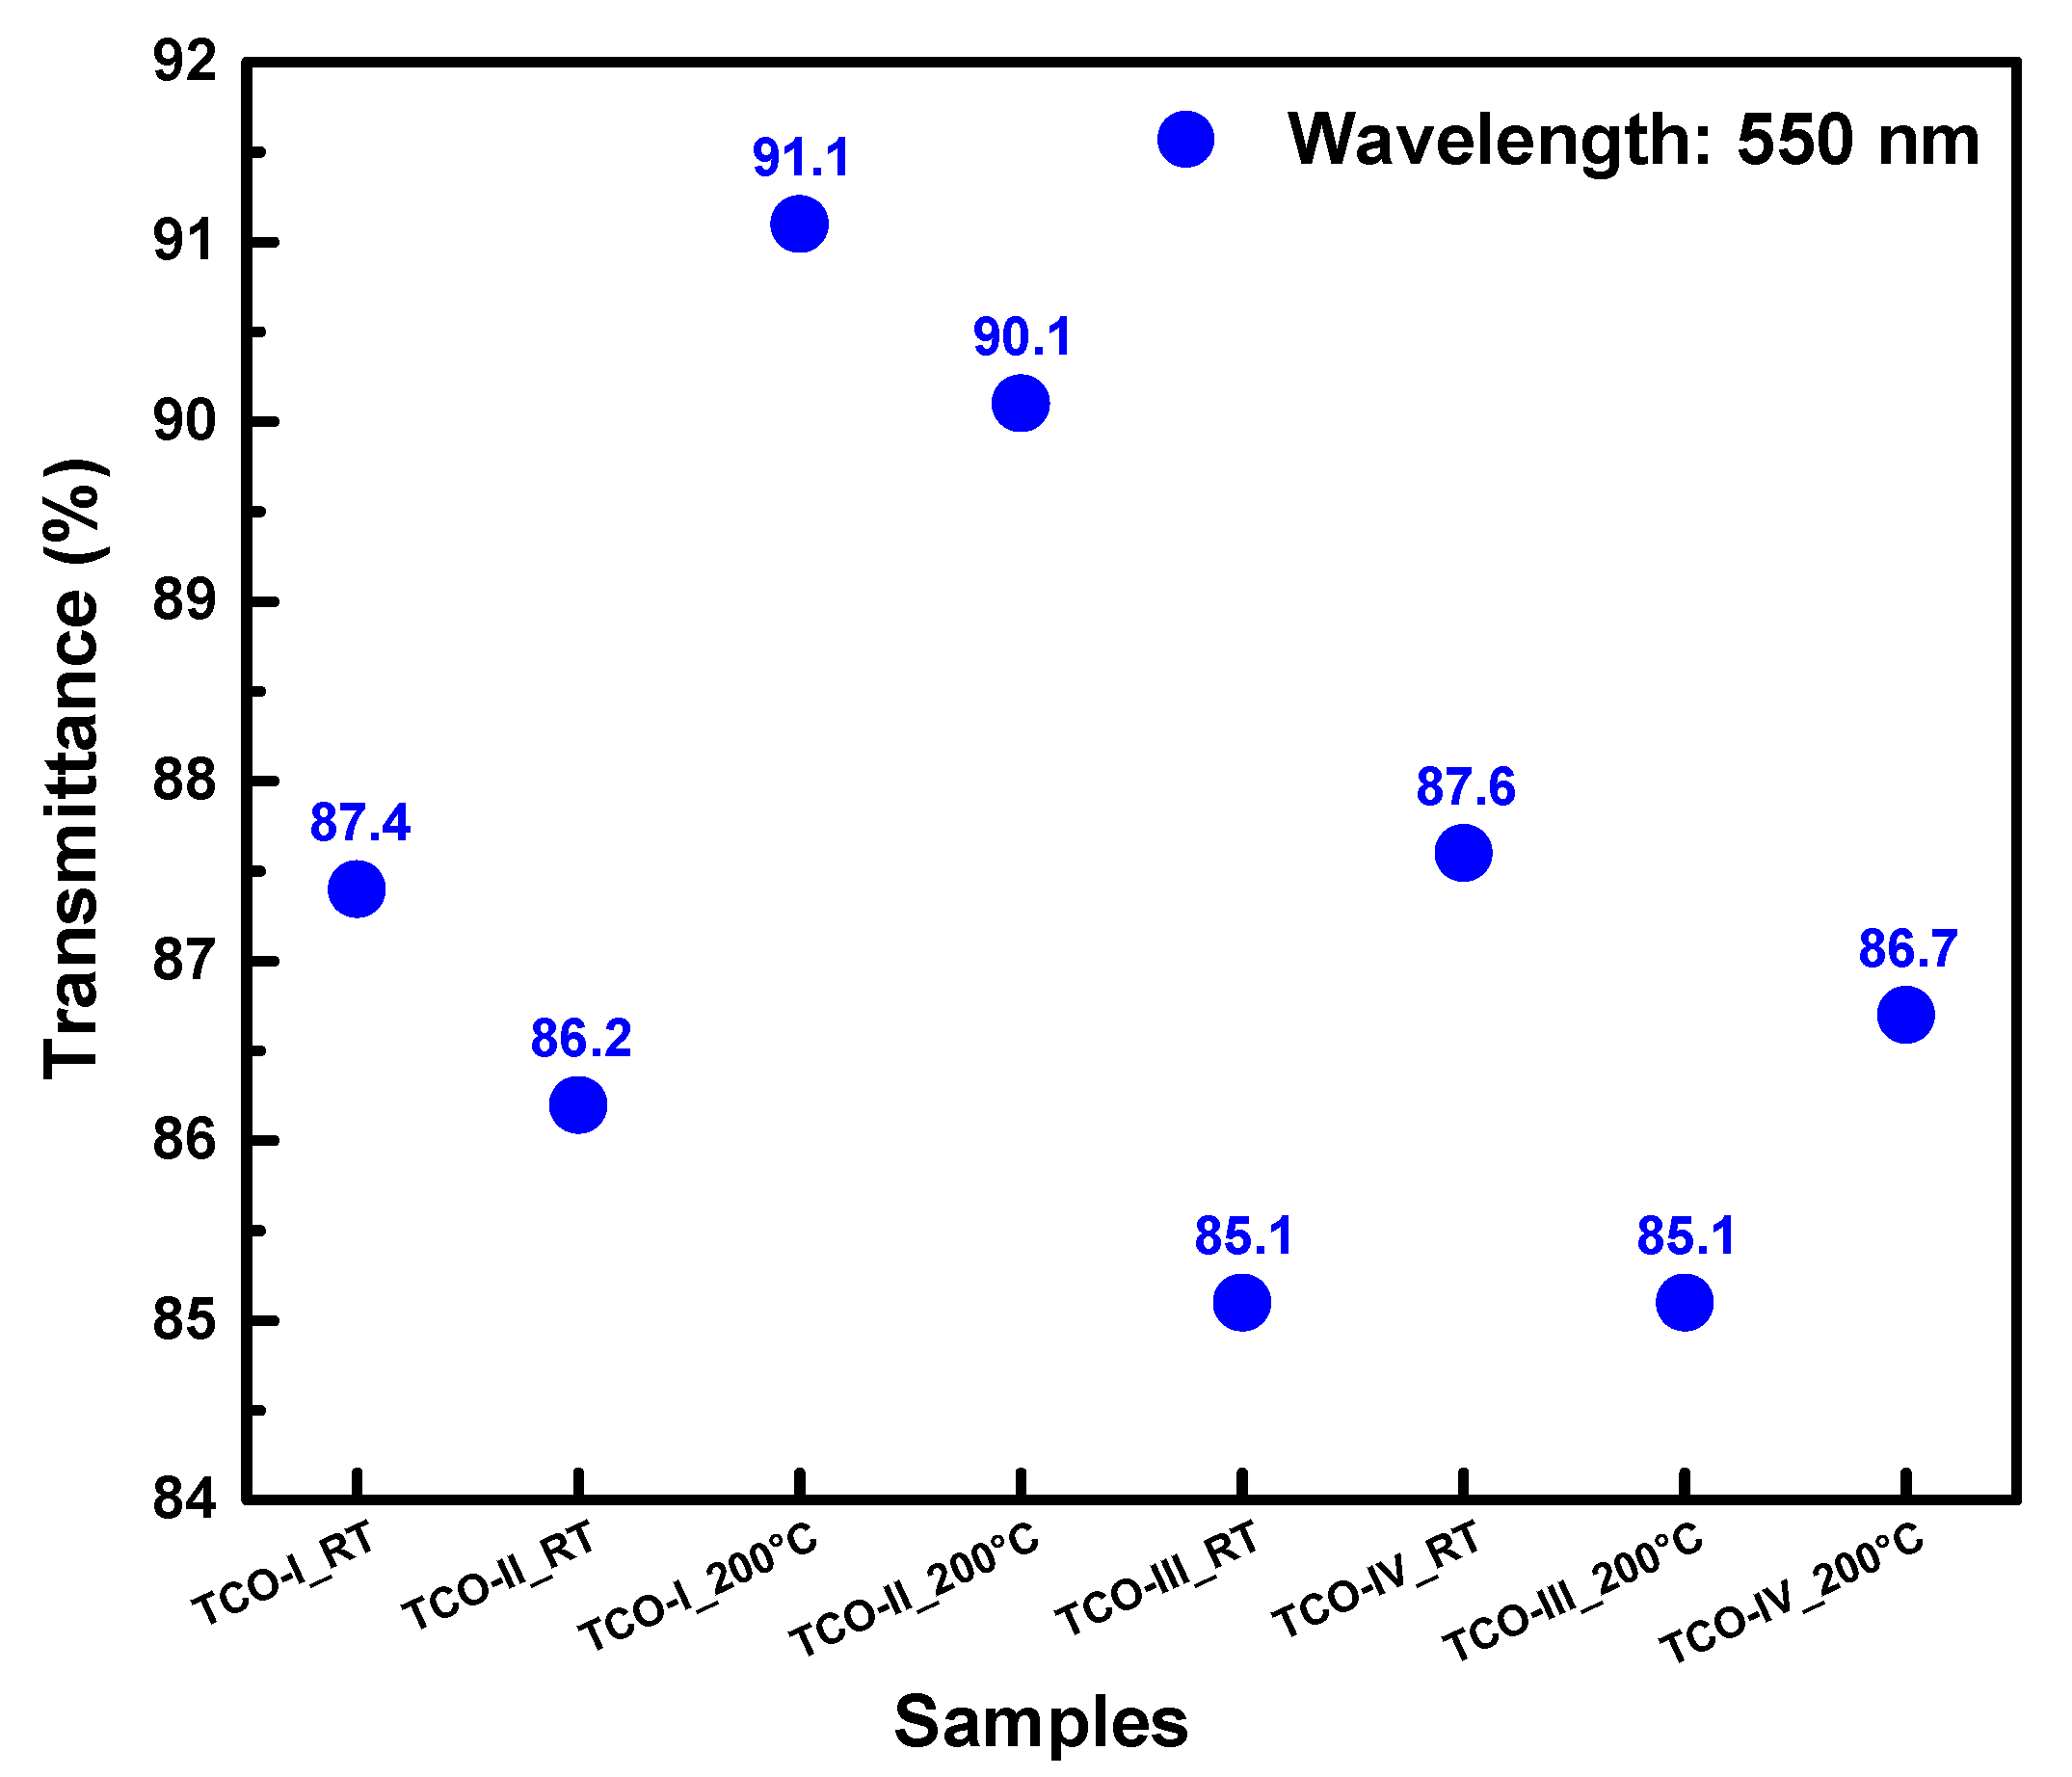
The effectiveness of TCO films depends on two key factors: optical transmittance and electrical conductivity. By calculating the FOM (ɸTC), both the optical and electrical properties of the TCO film can be combined into a single metric, providing a comprehensive measure of its overall performance. A higher ɸTC value indicates that the TCO film is more efficient in allowing light transmission while maintaining good electrical conductivity. To assess the performance of the TCO films in this study, ɸTC values were calculated according to Equation (4) using the transmittance values of the films at a 550 nm wavelength (Figure 8) and the sheet resistance data [72]. ɸTC is calculated using the following equation:
ɸ T C = T 10 R S H
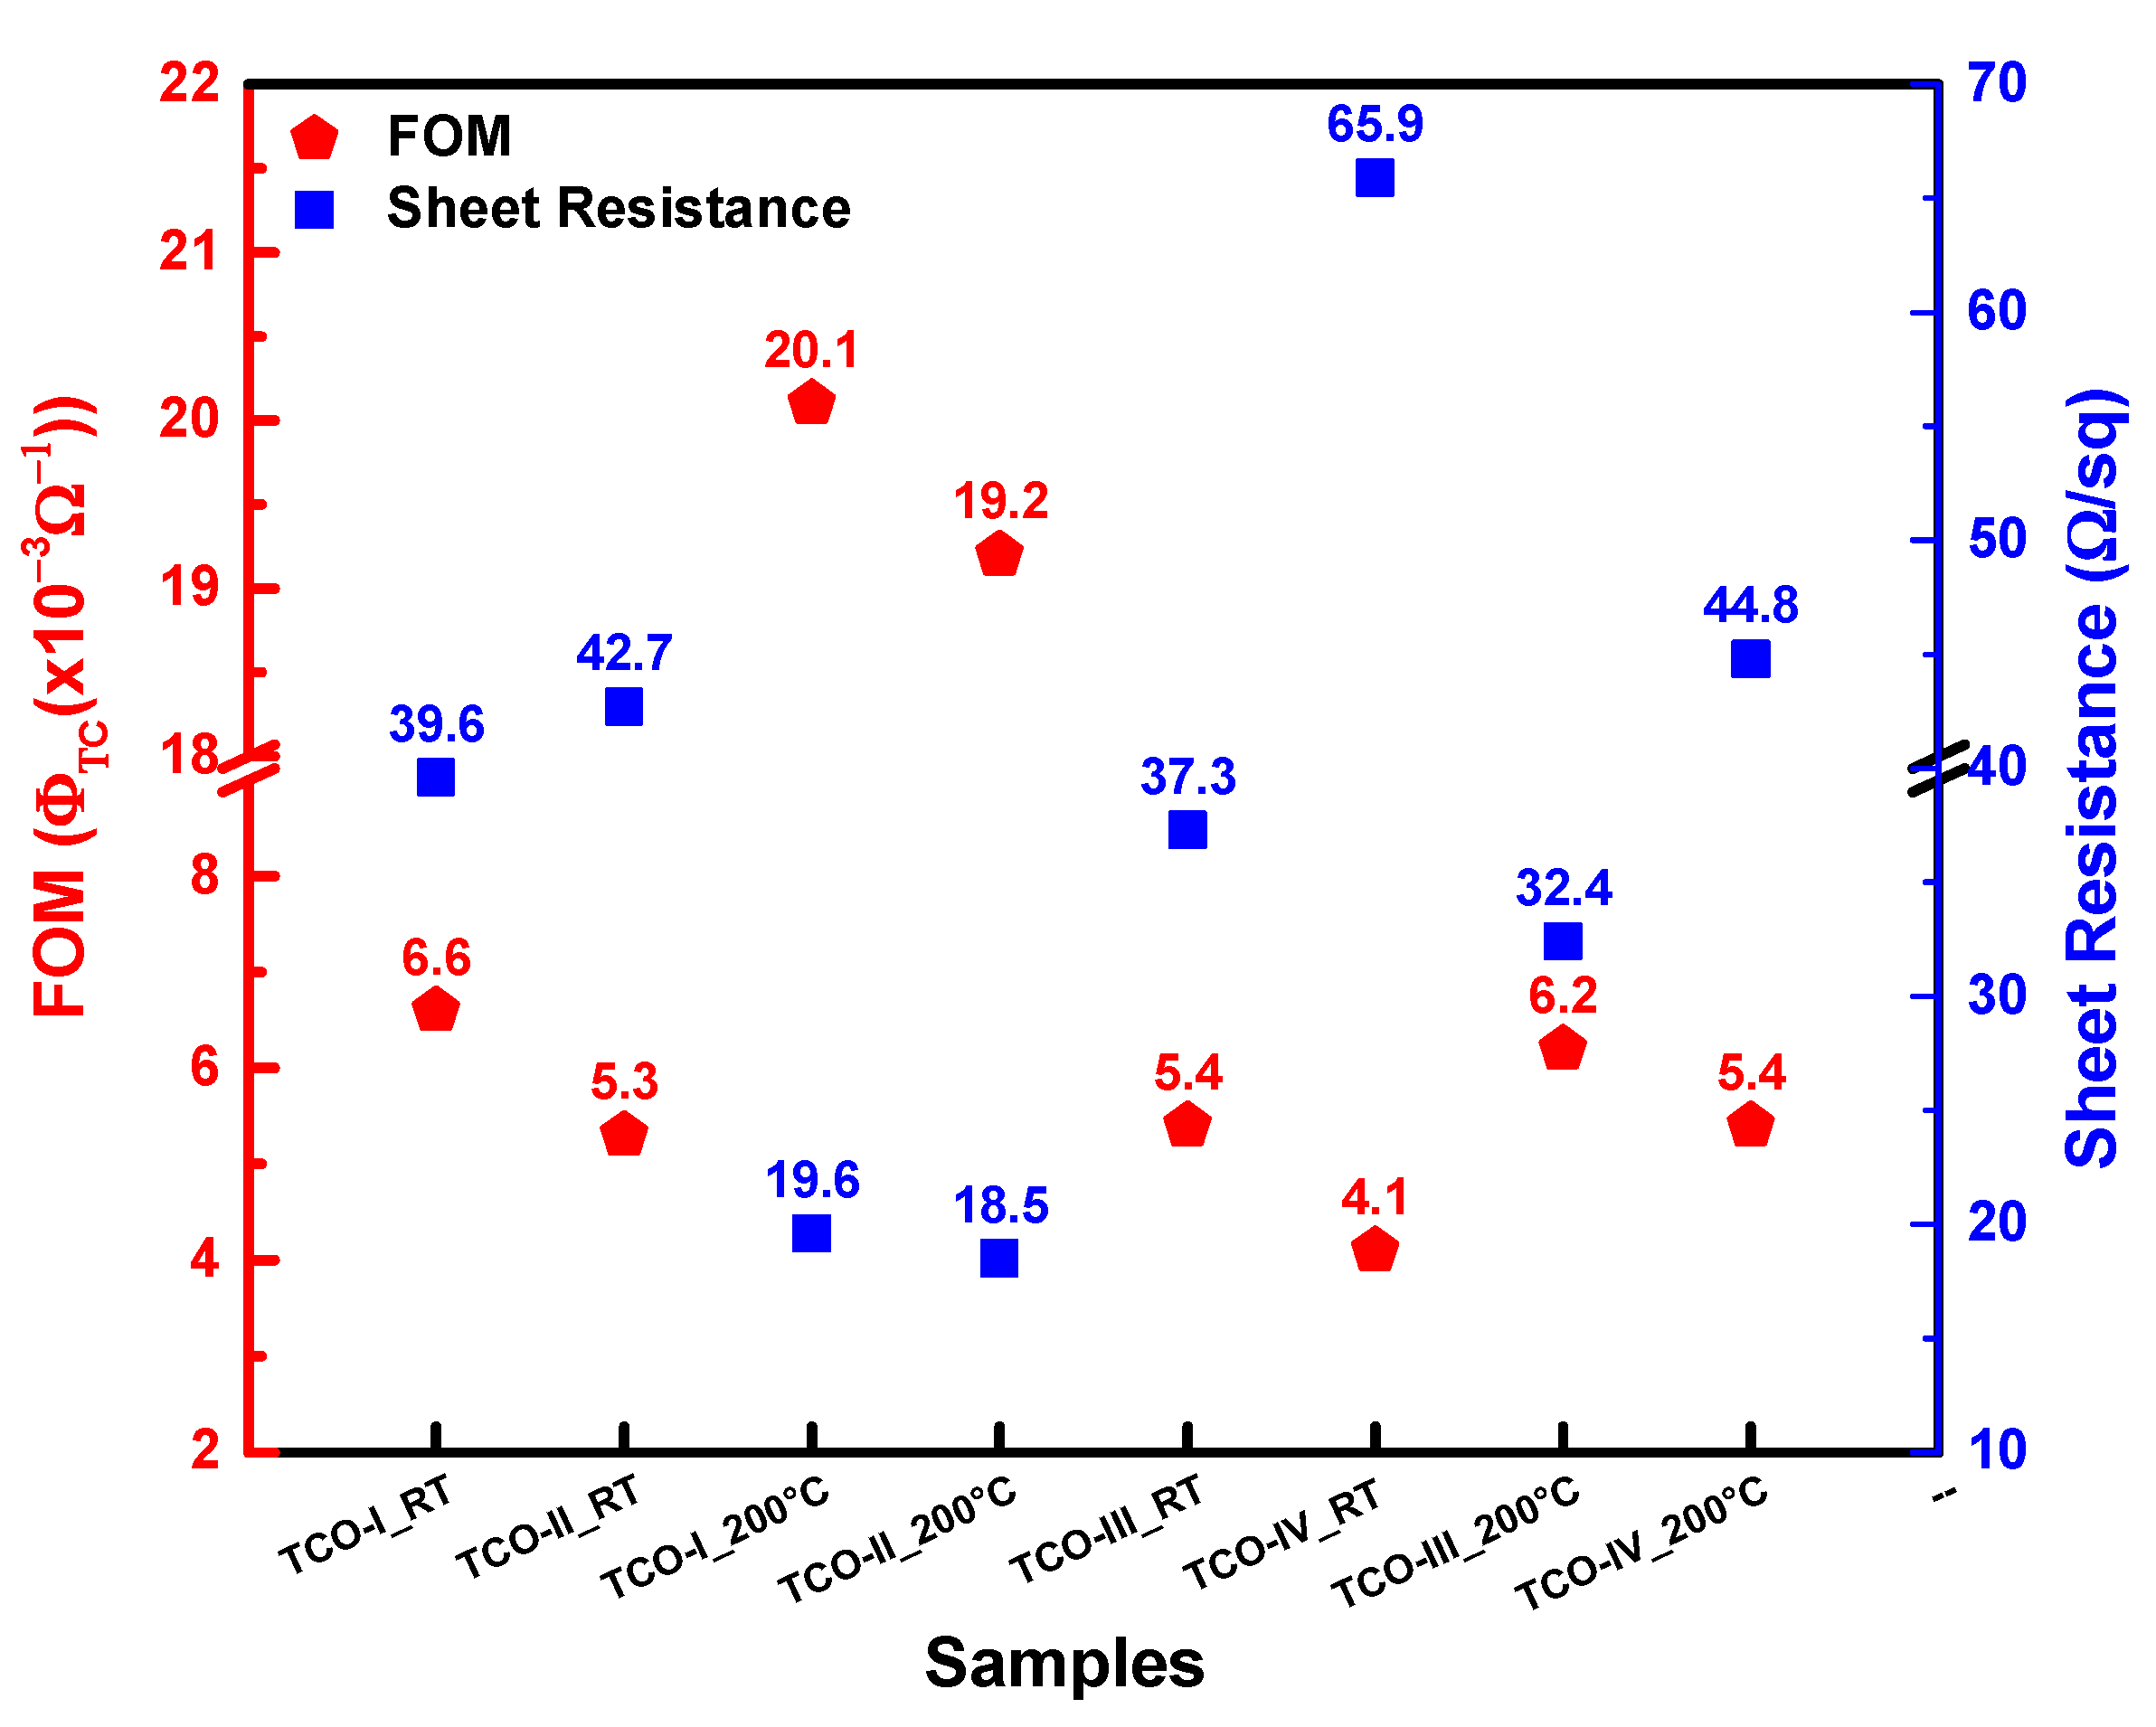
where T represents the transmittance, and RSH represents the sheet resistance of the TCO films. Figure 9 presents a comparison between the ɸTC values and the RSH values of the TCO films. The study also revealed that the single-layer TCO-I and TCO-III films deposited at RT and 200 °C exhibited higher ɸTC values compared to the multilayer TCO-II and TCO-IV films deposited at RT and 200 °C (e.g., ɸTC − single-layer TCO-I_RT: 6.6 × 10⁻³ Ω−1 > ɸTC − multilayer TCO-II_RT: 5 × 10⁻³ Ω−1). In addition, the single-layer TCO-I_200 °C film showed the highest ɸTC value (20.1 × 10⁻³ Ω−1). Alternatively, the multilayer TCO-II_200 °C film showed the next highest ɸTC value of 19.2 × 10⁻³ Ω−1. These two films were identified as possessing the most favorable optical and electrical properties among the evaluated TCO films.
In the study, as shown in Figure 10, RSH values of 39.6 Ω/sq, 42.7 Ω/sq, 37.3 Ω/sq, and 65.9 Ω/sq were obtained for single-layer TCO-I and TCO-II, and multilayer TCO-III and TCO-IV films deposited at RT, respectively. While it was observed that the RSH values of the TCO films decreased with increasing temperature, 19.6 Ω/sq, 18.5 Ω/sq, 32.4 Ω/sq, and 44.8 Ω/sq were obtained for the single-layer TCO-I and TCO-II, and multilayer TCO-III, and TCO-IV films, respectively. Since this is due to the improvement of the crystal structure in TCO films, the decrease in the RSH value led to an improvement in the electrical properties of the films. In addition, although the multilayer films seemed to show higher RSH values than the single-layer films, the multilayer TCO-II_200 °C film showed the lowest RSH value among all the films and was determined as the TCO film with the best electrical properties. Therefore, the multilayer TCO-II_200 °C film showed the potential to be an electrical alternative to single-layer TCO materials.
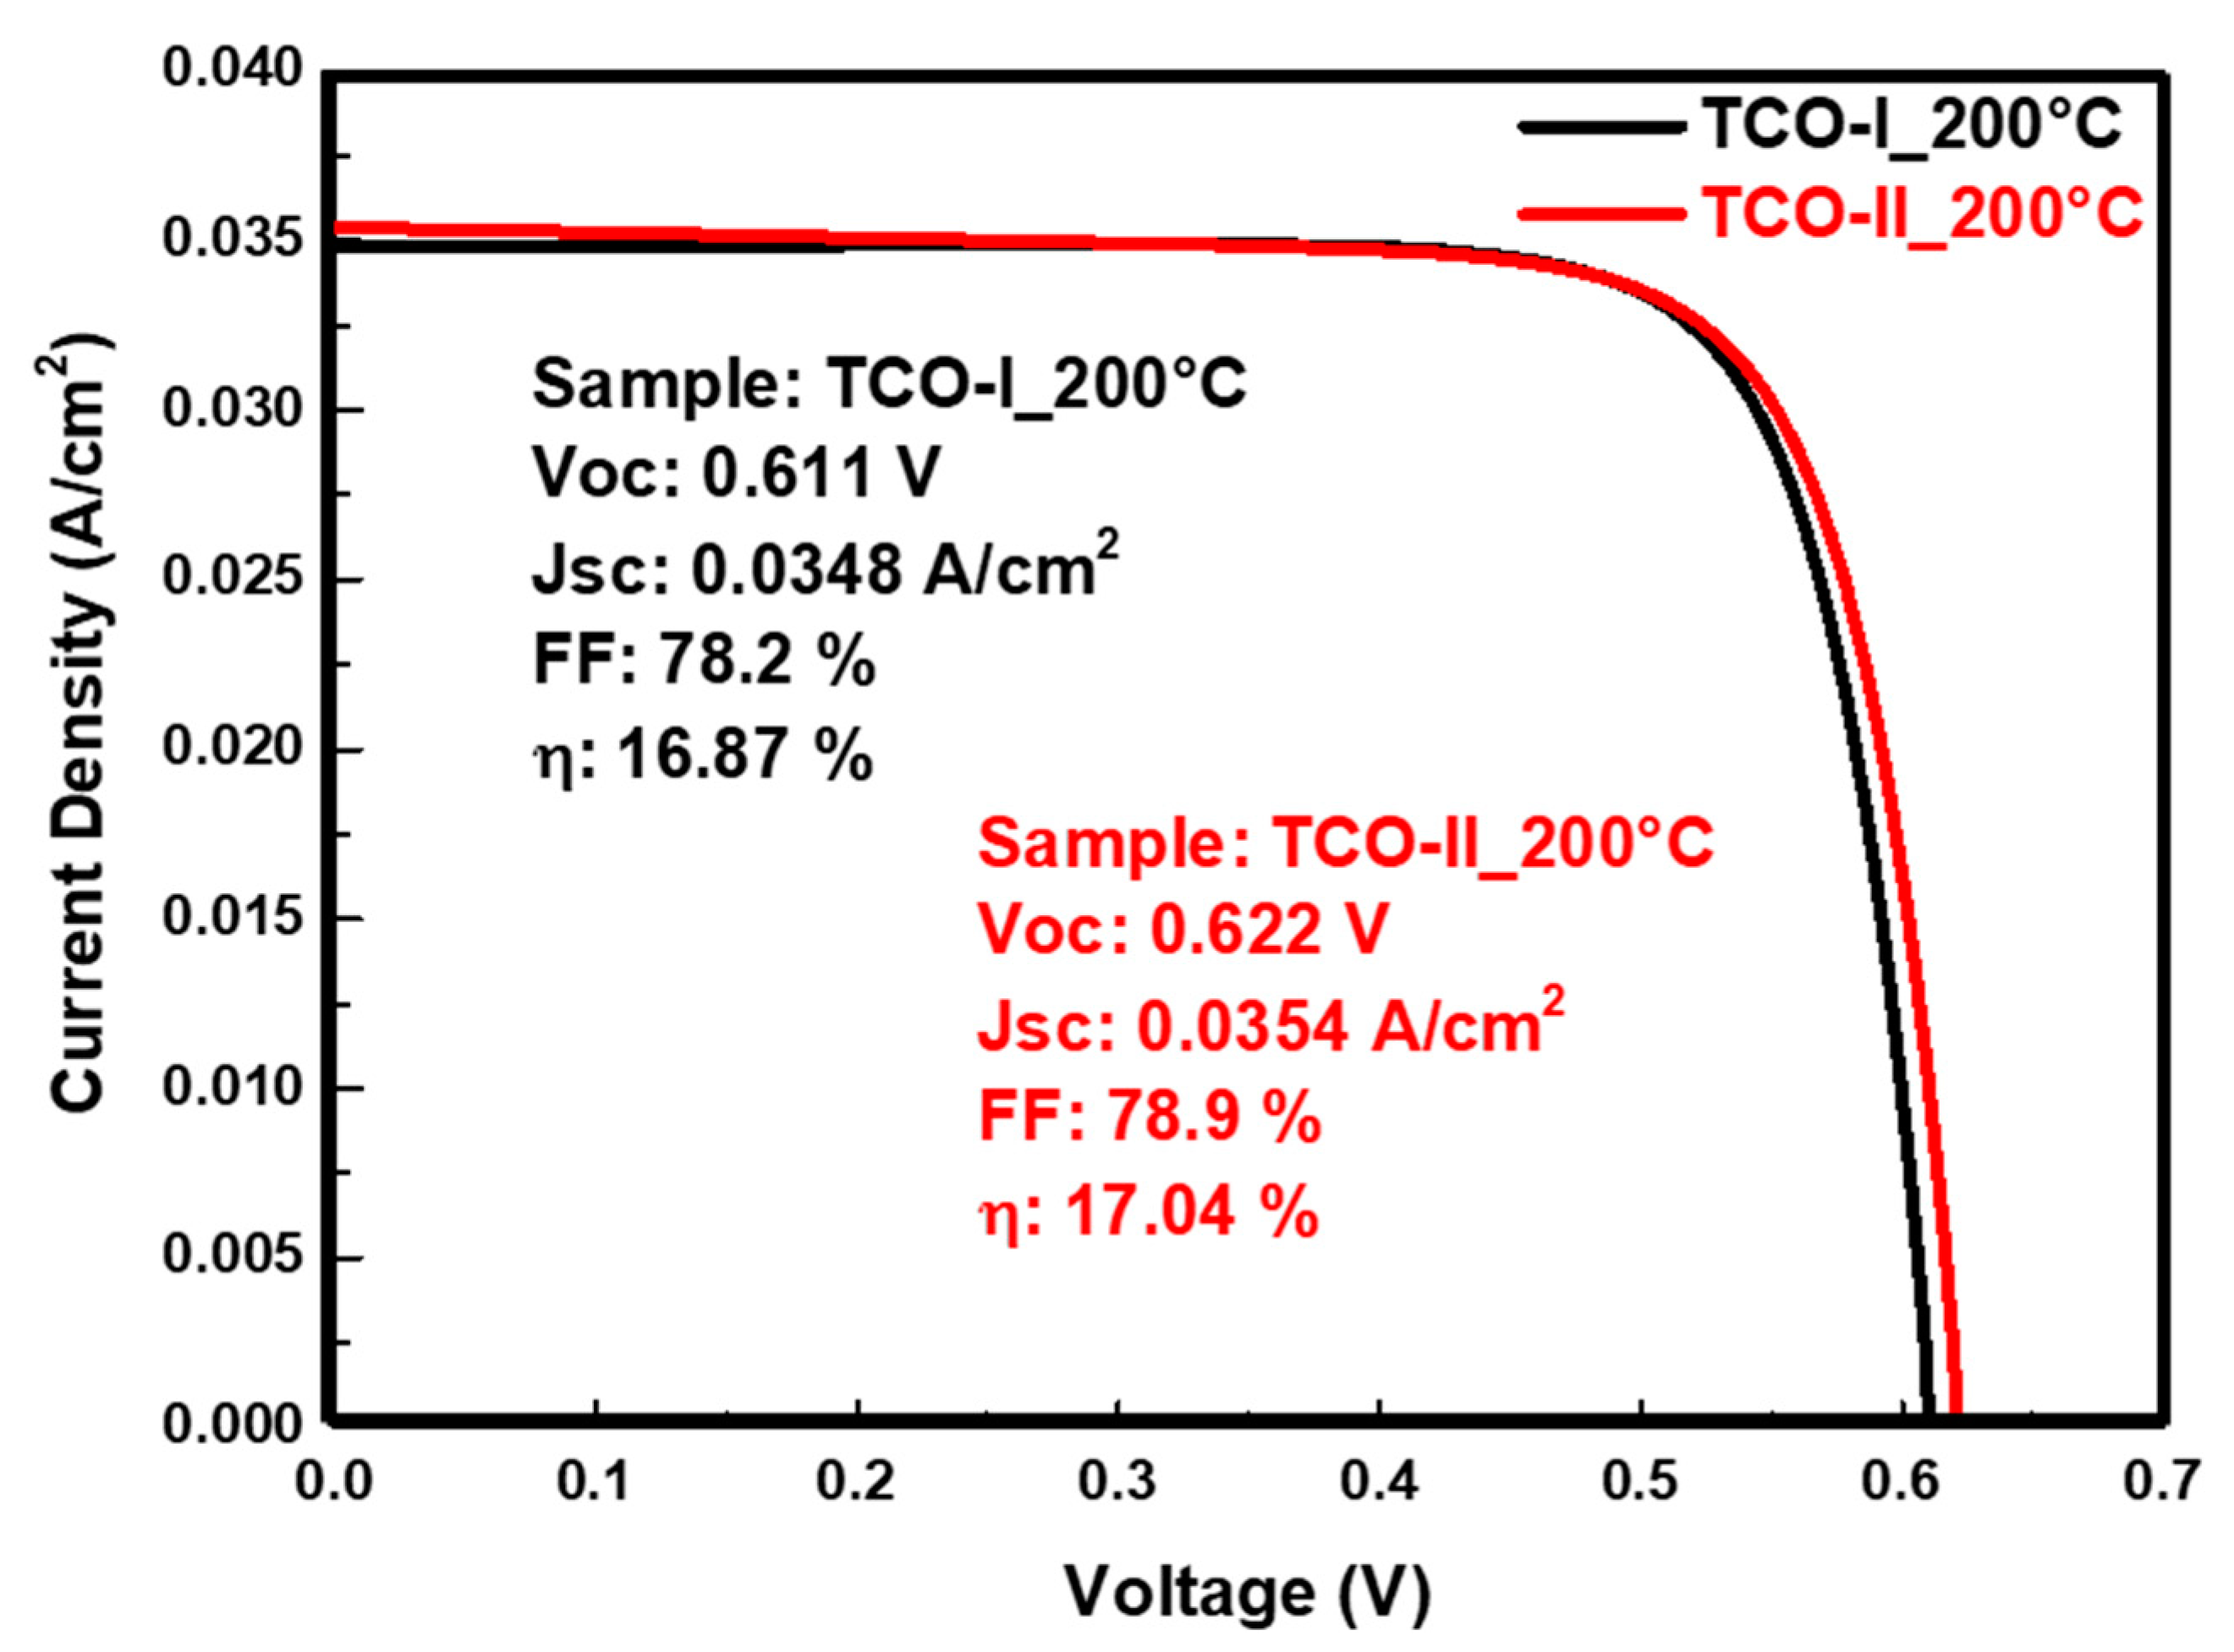
This study explores the advantages of employing multilayer TCO configurations over their single-layer counterparts, with a particular focus on their implications for solar cell technology. To evaluate the effectiveness of various TCO films, both single-layer and multilayer TCO films were deposited at RT and 200 °C. Promising TCO films were identified based on their structural, morphological, optical, and electrical properties, with the FOM being considered in the selection process. Among the identified TCO films, TCO-II_200 °C was chosen from the multilayer films. To assess the impact of the multilayer TCO-II_200 °C film, the single-layer TCO-I_200 °C film was selected as a reference, and two SHJ solar cells were compared. The measurement parameters of these SHJ solar cells, including the current density–voltage (J–V) characteristics, open-circuit voltage (VOC), short-circuit current density (JSC), fill factor (FF), and conversion efficiency (η), are depicted in Figure 10. The SHJ solar cell fabricated using the single-layer TCO-I_200 °C film exhibited VOC, JSC, FF, and η values of 0.611 V, 0.0348 A/cm², 78.2%, and 16.87%, respectively. Conversely, the SHJ solar cell fabricated using the multilayer TCO-II_200 °C film demonstrated VOC, JSC, FF, and η values of 0.622 V, 0.0354 A/cm², 78.9%, and 17.04%, respectively. A comparison of these results reveals that the multilayer TCO-II_200 °C film led to an enhancement in efficiency compared to the single-layer TCO-I_200 °C film. Additionally, the SHJ solar cell fabricated with the multilayer TCO-II_200 °C film exhibited improvements in VOC (from 0.611 V to 0.622 V), JSC (from 0.0348 A/cm² to 0.0354 A/cm²), FF (from 78.2% to 78.9%), and η (from 16.87% to 17.04%) when compared to the single-layer TCO-I_200 °C film. These enhancements can be attributed to the improved crystal structure, increased crystal size, and enhanced electronic properties of the multilayer TCO-II_200 °C film, despite both films having similar optical properties [73,74,75]. Most studies reveal several compelling reasons to favor multilayer TCO structures. These include their heightened stability, superior light transmittance, high conductivity, improved mechanical properties, lower cost, and diminished light reflection. These attributes are vital for enhancing the overall efficiency and performance of solar cells, especially SHJ solar cells [48,49].

4. Conclusions

This study investigated the properties of different TCO films, including single-layer TCO-I (ITO) and TCO-III (IZO), and multilayer TCO-II (ITO/IZO/ITO/IZO/ITO) and TCO-IV (IZO/ITO/IZO/ITO/IZO) films deposited on glass substrates using RF magnetron sputtering at RT and 200 °C. The research aimed to determine the best-performing TCO films and assess their suitability for use in SHJ solar cell applications. XRD analysis revealed that all RT-deposited TCO films were amorphous, while those deposited at 200 °C exhibited crystalline properties. Among the 200 °C-deposited films, the multilayer TCO-II film showed higher diffraction peak intensities than the TCO-I film, and the multilayer TCO-IV film exhibited higher peak intensities than the single-layer TCO-III film. The use of IZO as an interlayer in the multilayer TCO-II_200 °C film increased the peak intensities in the (211), (222), and (400) planes, and increased the crystal size (from 17.51 nm to 35.02 nm) compared to the single-layer TCO-I_200 °C film. The use of ITO as an interlayer in the multilayer TCO-IV_200 °C film increased the peak intensities in the (222) and (332) planes, and increased the crystal size (from 1.15 nm to 6.23 nm) compared to the single-layer TCO-III_200 °C film. Morphological properties were examined using SEM and AFM, revealing that the multilayer TCO-II_200 °C film was rougher than other films. This film exhibited exceptional properties, including high transmittance (84.5%) and low sheet resistance (18.5 Ω/sq). When applied to SHJ solar cells, the multilayer TCO-II_200 °C film showed a slightly higher conversion efficiency of 17.04%. These findings suggest exciting possibilities for further advancements in solar energy conversion, particularly in the context of SHJ technology, offering the potential for highly efficient solar energy solutions.

Author Contributions

Conceptualization, A.S.; investigation, A.S. and E.K.; supervision, A.S.; writing—original draft preparation, A.S. and E.K.; writing—review and editing, A.S., methodology, A.S. and E.K. All authors have read and agreed to the published version of the manuscript.

Funding

This research received no external funding.

Institutional Review Board Statement

Not applicable.

Informed Consent Statement

Not applicable.

Data Availability Statement

The data presented in this study are available in the article.

Conflicts of Interest

The authors declare no conflict of interest.

References

  1. Xu, H.; Lan, L.; Xu, M.; Li, M.; Luo, D.; Xiao, P.; Peng, J. Low-Roughness and Easily-Etched Transparent Conducting Oxides with a Stack Structure of ITO and IZO. ECS J. Solid State Sci. Technol. 2013, 2, R245–R248. [Google Scholar] [CrossRef]
  2. Lee, D.; Lee, A.; Kim, H.-D. IZO/ITO Double-Layered Transparent Conductive Oxide for Silicon Heterojunction Solar Cells. IEEE Access 2022, 10, 77170–77175. [Google Scholar] [CrossRef]
  3. Gonçalves, G.; Elangovan, E.; Barquinha, P.; Pereira, L.; Martins, R.; Fortunato, E. Influence of Post-Annealing Temperature on the Properties Exhibited by ITO, IZO and GZO Thin Films. Thin Solid Film. 2007, 515, 8562–8566. [Google Scholar] [CrossRef]
  4. Raniero, L.; Ferreira, I.; Pimentel, A.; Gonçalves, A.; Canhola, P.; Fortunato, E.; Martins, R. Role of Hydrogen Plasma on Electrical and Optical Properties of ZGO, ITO and IZO Transparent and Conductive Coatings. Thin Solid Film. 2006, 511–512, 295–298. [Google Scholar] [CrossRef]
  5. Jeong, J.-A.; Choi, K.-H.; Bae, J.-H.; Moon, J.-M.; Jeong, S.W.; Kim, I.; Kim, H.-K.; Yi, M.-S. Electrical, Optical, and Structural Properties of ITO Co-Sputtered IZO Films by Dual Target Magnetron Sputtering. J. Electroceramics 2009, 23, 361–366. [Google Scholar] [CrossRef]
  6. Sasabayashi, T.; Song, P.K.; Shigesato, Y.; Utsumi, K.; Kaijo, A.; Mitsui, A. Internal Stress of ITO, IZO and GZO Films Deposited by RF and DC Magnetron Sputtering. MRS Proc. 2001, 666, F2.4. [Google Scholar] [CrossRef]
  7. Kim, S.M.; Park, S.J.; Yoon, H.H.; Choi, H.W.; Kim, K.H. Preparation of ITO and IZO Thin Films by Using Facing Target Sputtering (FTS) Method. J. Korean Phy. Soc. 2009, 55, 1996–2001. [Google Scholar] [CrossRef]
  8. Morales-Masis, M.; Martin De Nicolas, S.; Holovsky, J.; De Wolf, S.; Ballif, C. Low-Temperature High-Mobility Amorphous IZO for Silicon Heterojunction Solar Cells. IEEE J. Photovolt. 2015, 5, 1340–1347. [Google Scholar] [CrossRef]
  9. Akdemir, O.; Zolfaghari Borra, M.; Nasser, H.; Turan, R.; Bek, A. MoO x /Ag/MoO x Multilayers as Hole Transport Transparent Conductive Electrodes for N-type Crystalline Silicon Solar Cells. Int. J. Energy Res. 2020, 44, 3098–3109. [Google Scholar] [CrossRef]
  10. Tsai, D.-C.; Chang, Z.-C.; Kuo, B.-H.; Wang, Y.-H.; Chen, E.-C.; Shieu, F.-S. Thickness Dependence of the Structural, Electrical, and Optical Properties of Amorphous Indium Zinc Oxide Thin Films. J. Alloys Compd. 2018, 743, 603–609. [Google Scholar] [CrossRef]
  11. Wang, F.; Wu, M.Z.; Wang, Y.Y.; Yu, Y.M.; Wu, X.M.; Zhuge, L.J. Influence of Thickness and Annealing Temperature on the Electrical, Optical and Structural Properties of AZO Thin Films. Vacuum 2013, 89, 127–131. [Google Scholar] [CrossRef]
  12. Lin, S.-S.; Huang, J.-L.; Lii, D.-F. The Effect of Thickness on the Properties of Ti-Doped ZnO Films by Simultaneous r.f. and d.c. Magnetron Sputtering. Surf. Coat. Technol. 2005, 190, 372–377. [Google Scholar] [CrossRef]
  13. Kuo, C.-C.; Liu, C.-C.; He, S.-C.; Chang, J.-T.; He, J.-L. The Influences of Thickness on the Optical and Electrical Properties of Dual-Ion-Beam Sputtering-Deposited Molybdenum-Doped Zinc Oxide Layer. J. Nanomater. 2011, 2011, 140697. [Google Scholar] [CrossRef]
  14. Seyhan, A.; Altan, T.; Ecer, Ö.C.; Zan, R. A Hydrogenated Amorphous Silicon (a-Si:H) Thin Films for Heterojunction Solar Cells: Structural and Optical Properties. J. Phys. Conf. Ser. 2017, 902, 012024. [Google Scholar] [CrossRef]
  15. Zdorovets, M.V.; Kozlovskiy, A.L.; Borgekov, D.B.; Shlimas, D.I. Influence of Irradiation with Heavy Kr15+ Ions on the Structural, Optical and Strength Properties of BeO Ceramic. J. Mater. Sci. Mater. Electron. 2021, 32, 15375–15385. [Google Scholar] [CrossRef]
  16. Trukhanov, S.V. Peculiarities of the magnetic state in the system La0.70Sr0.30MnO3−γ (0 ≤ γ ≤ 0.25). Exp. Theor. Phys. 2005, 100, 95–105. [Google Scholar] [CrossRef]
  17. Panasyuk, M.I.; Zubar, T.I.; Usovich, T.I.; Tishkevich, D.I.; Kanafyev, O.D.; Fedkin, V.A.; Kotelnikova, A.N.; Trukhanov, S.V.; Michels, D.; Lyakhov, D.; et al. Mechanism of Bubbles Formation and Anomalous Phase Separation in the CoNiP System. Sci. Rep. 2023, 13, 5829. [Google Scholar] [CrossRef]
  18. Tuleushev, A.Z.; Harrison, F.E.; Kozlovskiy, A.L.; Zdorovets, M.V. Evolution of the Absorption Edge of PET Films Irradiated with Kr Ions after Thermal Annealing and Ageing. Opt. Mater. 2021, 119, 111348. [Google Scholar] [CrossRef]
  19. Ferreira, A.A.; Silva, F.J.G.; Pinto, A.G.; Sousa, V.F.C. Characterization of Thin Chromium Coatings Produced by PVD Sputtering for Optical Applications. Coatings 2021, 11, 215. [Google Scholar] [CrossRef]
  20. Ravichandran, K.; Anandhi, R.; Sakthivel, B.; Swaminathan, K.; Ravikumar, P.; Begum, N.J.; Snega, S. Thickness Dependence of FTO Over-Layer on Properties of FTO/FZO Bilayer. Mater. Manuf. Process. 2013, 28, 1322–1326. [Google Scholar] [CrossRef]
  21. Keleş, F.; Kartal, E.; Seyhan, A. Yüksek Basınç Saçtırma Yönteminin Yoğunluk Modülasyonlu İTO İnce Filmlerin Optik Özelliklerine Etkisinin İncelenmesi. Selçuk Üniversitesi Fen Fakültesi Fen Derg. 2019, 45, 197–208. [Google Scholar] [CrossRef]
  22. Kartal, E.; Duran, İ.; Damgaci, E.; Seyhan, A. Investigation Of Structural, Optical, And Electrical Properties Of Ito Films Deposited At Different Plasma Powers: Enhanced Performance And Efficiency In SHJ Solar Cells. Eurasian J. Sci. Eng. Technol. 2023, 4, 25–35. [Google Scholar] [CrossRef]
  23. Shin, D.; Shin, J.H.; Lee, H.Y.; Lee, J.-Y.; Lee, S.-J. Characteristics of IZO/AZO and AZO/IZO Bi-Layer Transparent Conducting Thin Films Prepared by Using PLD. J. Korean Phys. Soc. 2012, 60, 1662–1665. [Google Scholar] [CrossRef]
  24. Montero, J.; Guillén, C.; Herrero, J. AZO/ATO Double-Layered Transparent Conducting Electrode: A Thermal Stability Study. Thin Solid Film. 2011, 519, 7564–7567. [Google Scholar] [CrossRef]
  25. Mahmood, K.; Munir, R.; Kang, H.W.; Sung, H.J. An Atmospheric Pressure-Based Electrospraying Route to Fabricate the Multi-Applications Bilayer (AZO/ITO) TCO Films. RSC Adv. 2013, 3, 25741. [Google Scholar] [CrossRef]
  26. Ponja, S.D.; Sathasivam, S.; Parkin, I.P.; Carmalt, C.J. Highly Conductive and Transparent Gallium Doped Zinc Oxide Thin Films via Chemical Vapor Deposition. Sci. Rep. 2020, 10, 638. [Google Scholar] [CrossRef] [PubMed]
  27. Chen, T.-H.; Jian, B.-L. Optical and Electronic Properties of Mo:ZnO Thin Films Deposited Using RF Magnetron Sputtering with Different Process Parameters. Opt. Quant. Electron. 2016, 48, 77. [Google Scholar] [CrossRef]
  28. Park, H.; Lee, J.; Kim, H.; Kim, D.; Raja, J.; Yi, J. Influence of SnO2:F/ZnO:Al Bi-Layer as a Front Electrode on the Properties of p-i-n Amorphous Silicon Based Thin Film Solar Cells. Appl. Phys. Lett. 2013, 102, 191602. [Google Scholar] [CrossRef]
  29. Szafraniak, B.; Fuśnik, Ł.; Xu, J.; Gao, F.; Brudnik, A.; Rydosz, A. Semiconducting Metal Oxides: SrTiO3, BaTiO3 and BaSrTiO3 in Gas-Sensing Applications: A Review. Coatings 2021, 11, 185. [Google Scholar] [CrossRef]
  30. Shaheera, M.; Girija, K.G.; Kaur, M.; Geetha, V.; Debnath, A.K.; Vatsa, R.K.; Muthe, K.P.; Gadkari, S.C. Characterization and Device Application of Indium Doped ZnO Homojunction Prepared by RF Magnetron Sputtering. Opt. Mater. 2020, 101, 109723. [Google Scholar] [CrossRef]
  31. Hong, C.H.; Jo, Y.J.; Kim, H.A.; Lee, I.-H.; Kwak, J.S. Effect of Electron Beam Irradiation on the Electrical and Optical Properties of ITO/Ag/ITO and IZO/Ag/IZO Films. Thin Solid Film. 2011, 519, 6829–6833. [Google Scholar] [CrossRef]
  32. Sofi, A.H.; Shah, M.A.; Asokan, K. Structural, Optical and Electrical Properties of ITO Thin Films. J. Electron. Mater. 2018, 47, 1344–1352. [Google Scholar] [CrossRef]
  33. Fallah, H.R.; Ghasemi, M.; Hassanzadeh, A. Influence of Heat Treatment on Structural, Electrical, Impedance and Optical Properties of Nanocrystalline ITO Films Grown on Glass at Room Temperature Prepared by Electron Beam Evaporation. Phys. E: Low-Dimens. Syst. Nanostruct. 2007, 39, 69–74. [Google Scholar] [CrossRef]
  34. Alam, M.J.; Cameron, D.C. Optical and Electrical Properties of Transparent Conductive ITO Thin Films Deposited by Sol–Gel Process. Thin Solid Film. 2000, 377–378, 455–459. [Google Scholar] [CrossRef]
  35. Ito, N.; Sato, Y.; Song, P.K.; Kaijio, A.; Inoue, K.; Shigesato, Y. Electrical and Optical Properties of Amorphous Indium Zinc Oxide Films. Thin Solid Film. 2006, 496, 99–103. [Google Scholar] [CrossRef]
  36. Kacha, K.; Djeffal, F.; Ferhati, H.; Foughali, L.; Bendjerad, A.; Benhaya, A.; Saidi, A. Efficiency Improvement of CIGS Solar Cells Using RF Sputtered TCO/Ag/TCO Thin-Film as Prospective Buffer Layer. Ceram. Int. 2022, 48, 20194–20200. [Google Scholar] [CrossRef]
  37. Ghasemi, H.; Mozaffari, M.H.; Moradian, R.; Ghobadi, N. Optical and Electrical Properties of ITO/Metal/NiO Triple-Layer Grown by PVD Method: An Experimental Study. Mater. Sci. Semicond. Process. 2022, 149, 106853. [Google Scholar] [CrossRef]
  38. Wang, J.; Meng, C.; Liu, H.; Hu, Y.; Zhao, L.; Wang, W.; Xu, X.; Zhang, Y.; Yan, H. Application of Indium Tin Oxide/Aluminum-Doped Zinc Oxide Transparent Conductive Oxide Stack Films in Silicon Heterojunction Solar Cells. ACS Appl. Energy Mater. 2021, 4, 13586–13592. [Google Scholar] [CrossRef]
  39. Wang, M.; He, Y.; Da Rocha, M.; Rougier, A.; Diao, X. Temperature Dependence of the Electrochromic Properties of Complementary NiO//WO3 Based Devices. Sol. Energy Mater. Sol. Cells 2021, 230, 111239. [Google Scholar] [CrossRef]
  40. Altuntepe, A.; Olgar, M.A.; Erkan, S.; Hasret, O.; Keçeci, A.E.; Kökbudak, G.; Tomakin, M.; Seyhan, A.; Turan, R.; Zan, R. Hybrid Transparent Conductive Electrode Structure for Solar Cell Application. Renew. Energy 2021, 180, 178–185. [Google Scholar] [CrossRef]
  41. Zan, R.; Olgar, M.A.; Altuntepe, A.; Seyhan, A.; Turan, R. Integration of Graphene with GZO as TCO Layer and Its Impact on Solar Cell Performance. Renew. Energy 2022, 181, 1317–1324. [Google Scholar] [CrossRef]
  42. Kozlovskiy, A.L.; Shlimas, D.I.; Zdorovets, M.V. Synthesis, Structural Properties and Shielding Efficiency of Glasses Based on TeO2-(1-x)ZnO-XSm2O3. J. Mater. Sci: Mater. Electron. 2021, 32, 12111–12120. [Google Scholar] [CrossRef]
  43. Henaish, A.M.; Darwish, M.A.; Hemeda, O.M.; Weinstein, I.A.; Soliman, T.S.; Trukhanov, A.V.; Trukhanov, S.V.; Zhou, D.; Dorgham, A.M. Structure and Optoelectronic Properties of Ferroelectric PVA-PZT Nanocomposites. Opt. Mater. 2023, 138, 113402. [Google Scholar] [CrossRef]
  44. Liu, C.-C.; Liang, Y.-C.; Kuo, C.-C.; Liou, Y.-Y.; Chen, J.-W.; Lin, C.-C. Fabrication and Opto-Electric Properties of ITO/ZnO Bilayer Films on Polyethersulfone Substrates by Ion Beam-Assisted Evaporation. Sol. Energy Mater. Sol. Cells 2009, 93, 267–272. [Google Scholar] [CrossRef]
  45. Rezaie, M.N.; Manavizadeh, N.; Abadi, E.M.N.; Nadimi, E.; Boroumand, F.A. Comparison Study of Transparent RF-Sputtered ITO/AZO and ITO/ZnO Bilayers for near UV-OLED Applications. Appl. Surf. Sci. 2017, 392, 549–556. [Google Scholar] [CrossRef]
  46. Gong, L.; Lu, J.; Ye, Z. Room-Temperature Growth and Optoelectronic Properties of GZO/ZnO Bilayer Films on Polycarbonate Substrates by Magnetron Sputtering. Sol. Energy Mater. Sol. Cells 2010, 94, 1282–1285. [Google Scholar] [CrossRef]
  47. Murugesan, M.; Arjunraj, D.; Mayandi, J.; Venkatachalapathy, V.; Pearce, J.M. Properties of Al-Doped Zinc Oxide and In-Doped Zinc Oxide Bilayer Transparent Conducting Oxides for Solar Cell Applications. Mater. Lett. 2018, 222, 50–53. [Google Scholar] [CrossRef]
  48. Qiu, Q.; Bai, Y.; Li, J.; Guo, C.; Chen, H.; Zhang, H.; Shi, J.; Liu, W.; Chen, T.; Liao, J.; et al. ZnO-Doped In 2 O 3 Front Transparent Contact Enables >24.0% Silicon Heterojunction Solar Cells. Energy Technol. 2023, 11, 2201310. [Google Scholar] [CrossRef]
  49. Sittinger, V.; King, H.; Kaiser, A.; Jung, S.; Kabakli, Ö.Ş.; Schulze, P.S.C.; Goldschmidt, J.C. Indium-Based Transparent Conductive Oxides Developed for Perovskite and Perovskite-Silicon Tandem Solar Cell Applications. Surf. Coat. Technol. 2023, 457, 129286. [Google Scholar] [CrossRef]
  50. Zahid, M.A.; Khokhar, M.Q.; Park, S.; Hussain, S.Q.; Kim, Y.; Yi, J. Influence of Al2O3/IZO Double-Layer Antireflective Coating on the Front Side of Rear Emitter Silicon Heterojunction Solar Cell. Vacuum 2022, 200, 110967. [Google Scholar] [CrossRef]
  51. Lee, J.-A.; Lee, J.-H.; Heo, Y.-W.; Kim, J.-J.; Lee, H.Y. Characteristics of Sn and Zn Co-Substituted In2O3 Thin Films Prepared by RF Magnetron Sputtering. Curr. Appl. Phys. 2012, 12, S89–S93. [Google Scholar] [CrossRef]
  52. Park, J.H.; Park, H.K.; Jeong, J.; Kim, W.; Min, B.K.; Do, Y.R. Wafer-Scale Growth of ITO Nanorods by Radio Frequency Magnetron Sputtering Deposition. J. Electrochem. Soc. 2011, 158, K131. [Google Scholar] [CrossRef]
  53. Lien, S.-Y. Characterization and Optimization of ITO Thin Films for Application in Heterojunction Silicon Solar Cells. Thin Solid Film. 2010, 518, S10–S13. [Google Scholar] [CrossRef]
  54. Ogi, T.; Hidayat, D.; Iskandar, F.; Purwanto, A.; Okuyama, K. Direct Synthesis of Highly Crystalline Transparent Conducting Oxide Nanoparticles by Low Pressure Spray Pyrolysis. Adv. Powder Technol. 2009, 20, 203–209. [Google Scholar] [CrossRef]
  55. Zhang, K.; Zhu, F.; Huan, C.H.A.; Wee, A.T.S. Effect of Hydrogen Partial Pressure on Optoelectronic Properties of Indium Tin Oxide Thin Films Deposited by Radio Frequency Magnetron Sputtering Method. J. Appl. Phys. 1999, 86, 974–980. [Google Scholar] [CrossRef]
  56. Thilakan, P.; Kumar, J. Studies on the Preferred Orientation Changes and Its Influenced Properties on IT0 Thin Films. Vacuum 1997, 48, 463–466. [Google Scholar] [CrossRef]
  57. Meng, L.; dos Santos, M.P. Properties of Indium Tin Oxide Films Prepared by Rf Reactive Magnetron Sputtering at Different Substrate Temperature. Thin Solid Film. 1998, 322, 56–62. [Google Scholar] [CrossRef]
  58. Fortunato, E.; Pimentel, A.; Gonçalves, A.; Marques, A.; Martins, R. High Mobility Amorphous/Nanocrystalline Indium Zinc Oxide Deposited at Room Temperature. Thin Solid Film. 2006, 502, 104–107. [Google Scholar] [CrossRef]
  59. Butt, M.Z.; Ali, D.; Aftab, M.; Tanveer, M.U. Surface Topography and Structure of Laser-Treated High-Purity Zinc. Surf. Topogr.: Metrol. Prop. 2015, 3, 035002. [Google Scholar] [CrossRef]
  60. Williamson, G.K.; Hall, W.H. X-Ray Line Broadening from Filed Aluminium and Wolfram. Acta Metall. 1953, 1, 22–31. [Google Scholar] [CrossRef]
  61. Butt, M.Z.; Ali, D.; Farooq, H.; Bashir, F. Structural, Electrical, and Mechanical Characteristics of Proton Beam Irradiated Al5086 Alloy. Phys. B Condens. Matter 2015, 456, 275–282. [Google Scholar] [CrossRef]
  62. Das, S.; Senapati, S.; Alagarasan, D.; Varadhrajaperumal, S.; Ganesan, R.; Naik, R. Thermal Annealing-Induced Transformation of Structural, Morphological, Linear, and Nonlinear Optical Parameters of Quaternary As 20 Ag 10 Te 10 Se 60 Thin Films for Optical Applications. ACS Appl. Opt. Mater. 2023, 1, 17–31. [Google Scholar] [CrossRef]
  63. Priyadarshini, P.; Das, S.; Alagarasan, D.; Ganesan, R.; Varadharajaperumal, S.; Naik, R. Observation of High Nonlinearity in Bi Doped BixIn35-xSe65 Thin Films with Annealing. Sci. Rep. 2021, 11, 21518. [Google Scholar] [CrossRef] [PubMed]
  64. Yudar, H.H.; Korkmaz, Ş.; Özen, S.; Şenay, V.; Pat, S. Surface and Optical Properties of Indium Tin Oxide Layer Deposition by RF Magnetron Sputtering in Argon Atmosphere. Appl. Phys. A 2016, 122, 748. [Google Scholar] [CrossRef]
  65. Raoufi, D.; Kiasatpour, A.; Fallah, H.R.; Rozatian, A.S.H. Surface Characterization and Microstructure of ITO Thin Films at Different Annealing Temperatures. Appl. Surf. Sci. 2007, 253, 9085–9090. [Google Scholar] [CrossRef]
  66. Wang, S.-K.; Lin, T.-C.; Jian, S.-R.; Juang, J.-Y.; Jang, J.S.-C.; Tseng, J.-Y. Effects of Post-Annealing on the Structural and Nanomechanical Properties of Ga-Doped ZnO Thin Films Deposited on Glass Substrate by Rf-Magnetron Sputtering. Appl. Surf. Sci. 2011, 258, 1261–1266. [Google Scholar] [CrossRef]
  67. Sahoo, D.; Sahoo, S.; Alagarasan, D.; Ganesan, R.; Varadharajaperumal, S.; Naik, R. Proton Ion Irradiation on As 40 Se 50 Sb 10 Thin Films: Fluence-Dependent Tuning of Linear–Nonlinear Optical Properties for Photonic Applications. ACS Appl. Electron. Mater. 2022, 4, 856–868. [Google Scholar] [CrossRef]
  68. Kim, H.-M.; Bae, K.; Sohn, S. Electronic and Optical Properties of Indium Zinc Oxide Thin Films Prepared by Using Nanopowder Target. Jpn. J. Appl. Phys. 2011, 50, 045801. [Google Scholar] [CrossRef]
  69. Jeon, J.-W.; Jeon, D.-W.; Sahoo, T.; Kim, M.; Baek, J.-H.; Hoffman, J.L.; Kim, N.S.; Lee, I.-H. Effect of Annealing Temperature on Optical Band-Gap of Amorphous Indium Zinc Oxide Film. J. Alloys Compd. 2011, 509, 10062–10065. [Google Scholar] [CrossRef]
  70. Haacke, G. New Figure of Merit for Transparent Conductors. J. Appl. Phys. 1976, 47, 4086–4089. [Google Scholar] [CrossRef]
  71. Burstein, E. Anomalous Optical Absorption Limit in InSb. Phys. Rev. 1954, 93, 632–633. [Google Scholar] [CrossRef]
  72. Park, H.-K.; Jeong, J.-A.; Park, Y.-S.; Kim, H.-K.; Cho, W.-J. Electrical, Optical, and Structural Properties of InZnSnO Electrode Films Grown by Unbalanced Radio Frequency Magnetron Sputtering. Thin Solid Film. 2009, 517, 5563–5568. [Google Scholar] [CrossRef]
  73. Kaphle, A.; Hari, P. Enhancement in Power Conversion Efficiency of Silicon Solar Cells with Cobalt Doped ZnO Nanoparticle Thin Film Layers. Thin Solid Film. 2018, 657, 76–87. [Google Scholar] [CrossRef]
  74. Lee, J.-H.; You, Y.-J.; Saeed, M.A.; Kim, S.H.; Choi, S.-H.; Kim, S.; Lee, S.Y.; Park, J.-S.; Shim, J.W. Undoped Tin Dioxide Transparent Electrodes for Efficient and Cost-Effective Indoor Organic Photovoltaics (SnO2 Electrode for Indoor Organic Photovoltaics). NPG Asia Mater. 2021, 13, 43. [Google Scholar] [CrossRef]
  75. Alagarasan, D.; Varadharajaperumal, S.; Aadhavan, R.; Shanmugavelu, B.; Naik, R.; Kh, S.; Haunsbhavi, K.; Shkir, M.; El Sayed Massoud, E.; Ganesan, R. Enhanced Photodetection Performance of Silver-Doped Tin Sulfide Photodetectors for Visible Light Photodetection. Sens. Actuators A Phys. 2023, 349, 114065. [Google Scholar] [CrossRef]
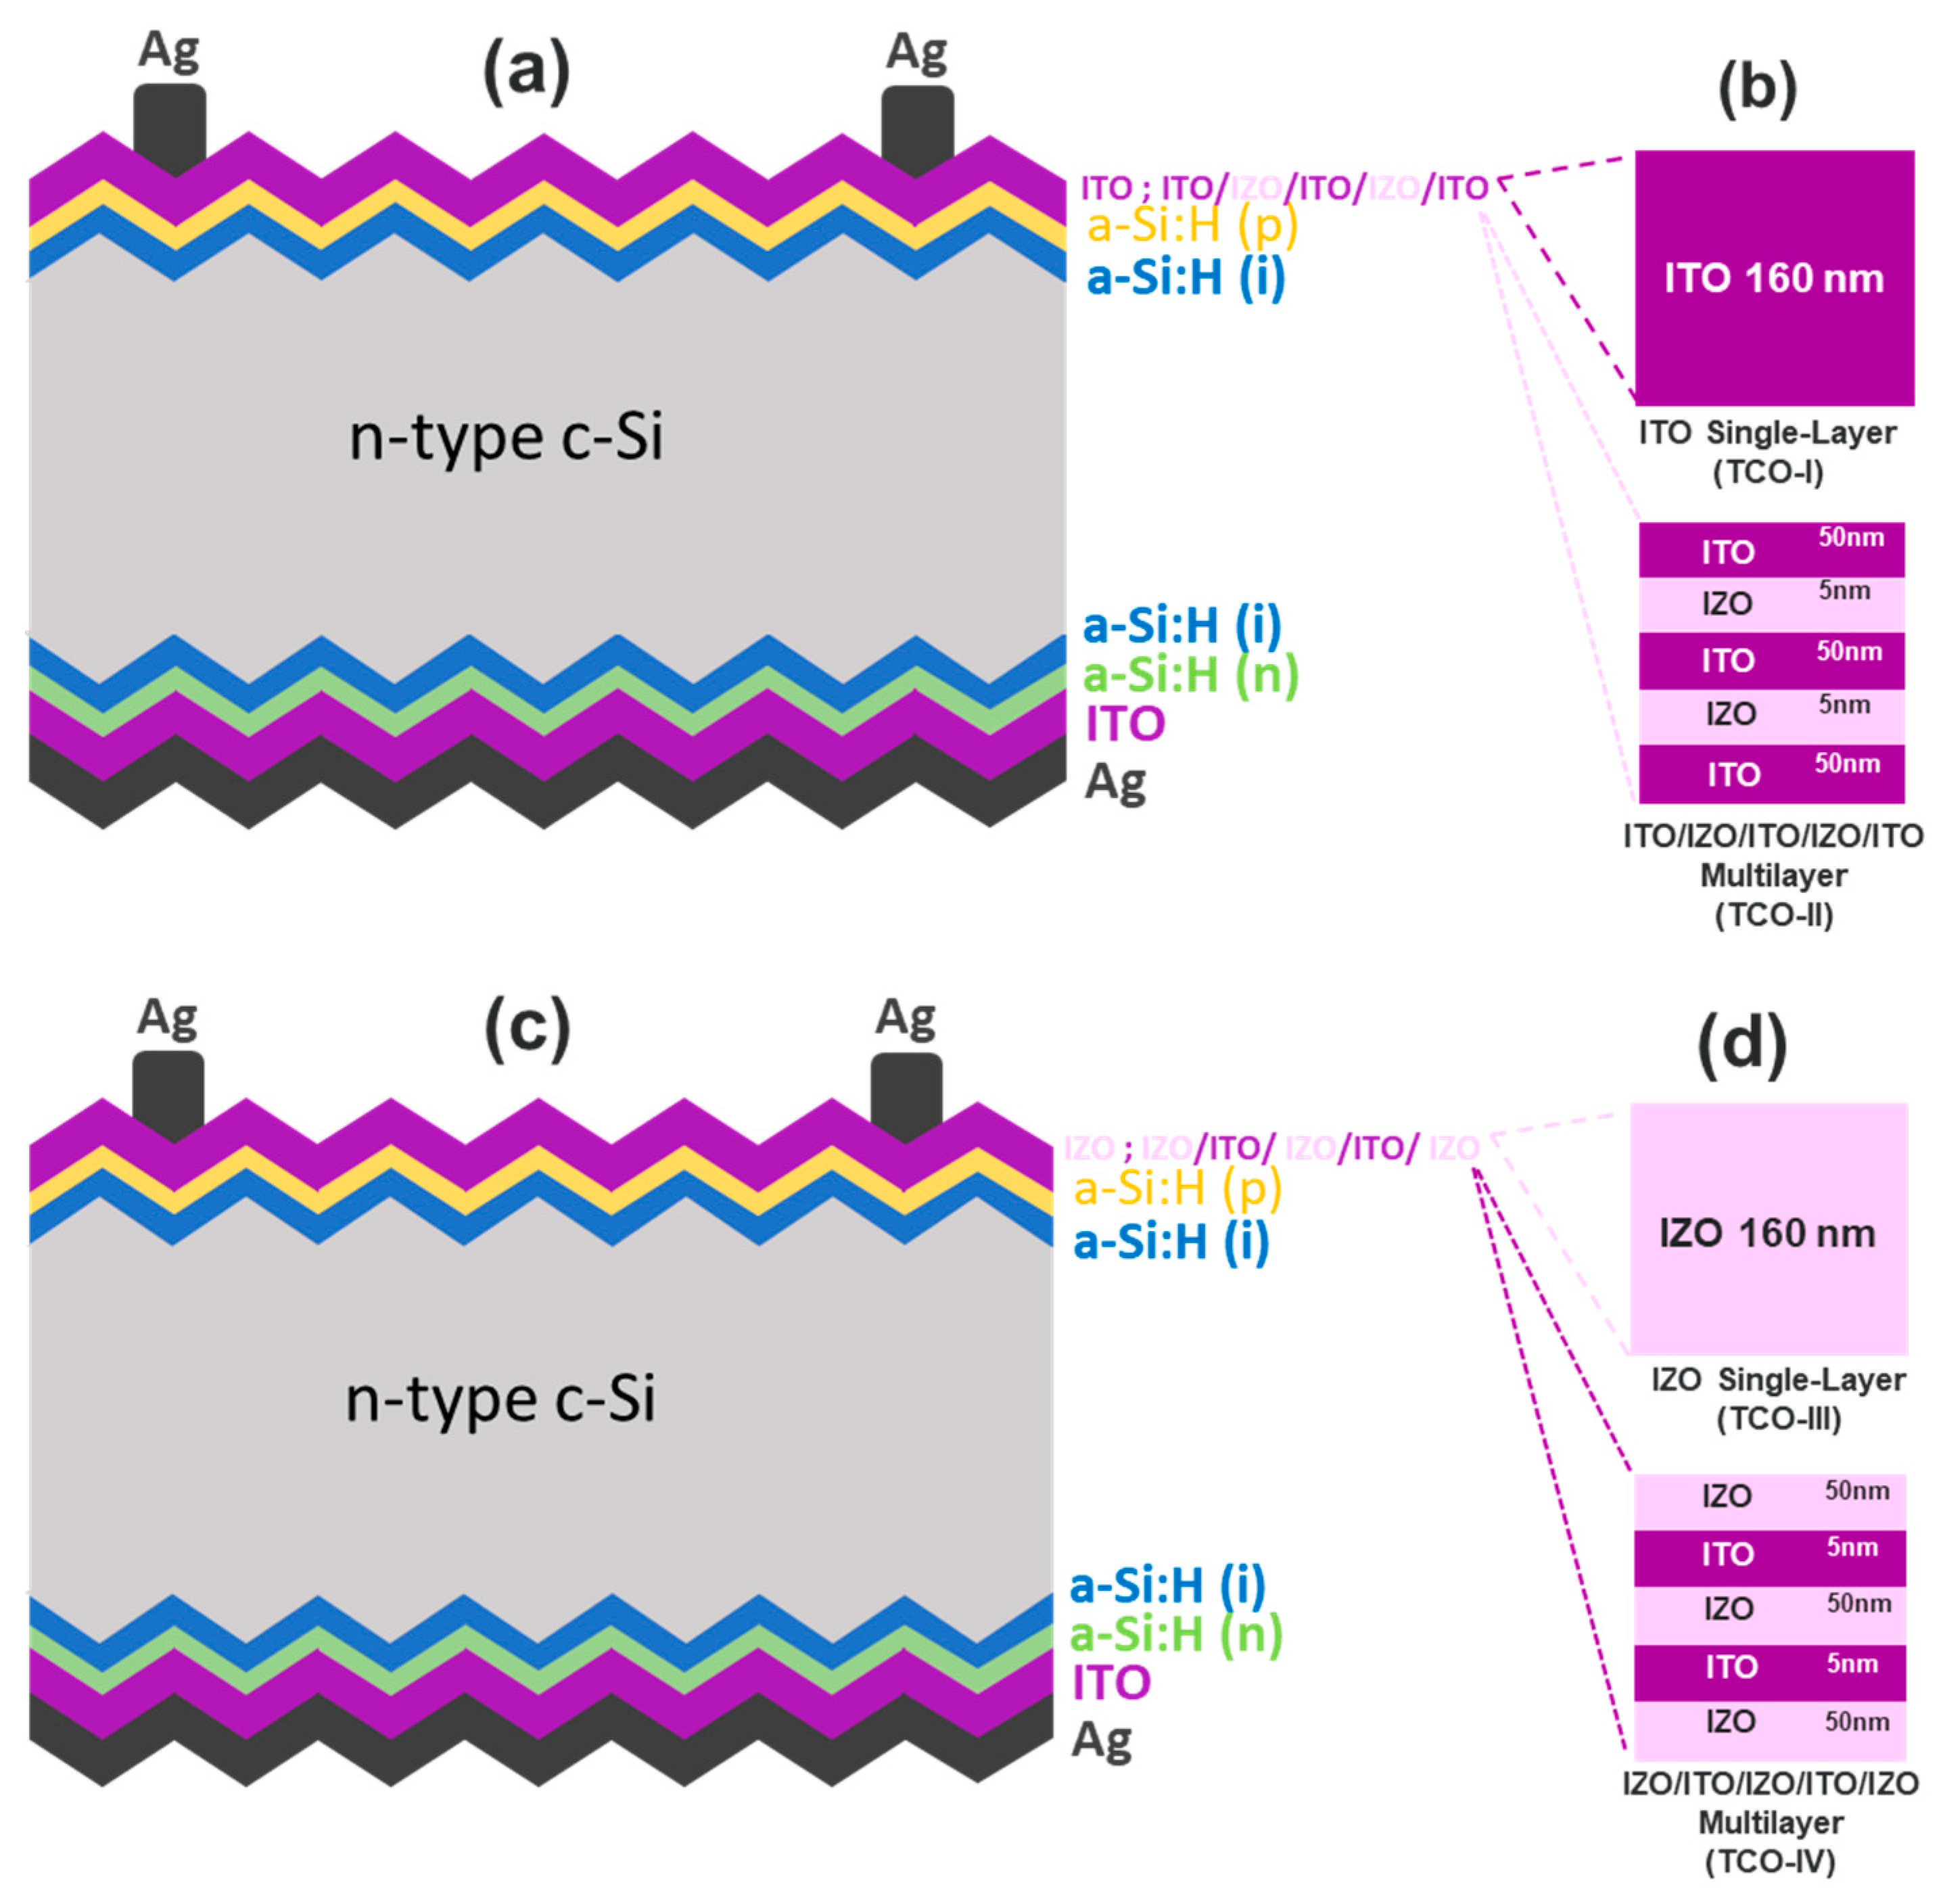
Figure 1. Schematics of TCO layers on SHJ solar cells (a,c) and glass substrates (b,d).
Coatings 13 01719 g001
Figure 2. XRD patterns of TCO films deposited at (a) RT and (b) 200 °C.
Coatings 13 01719 g002
Figure 3. Williamson–Hull plot for crystals of TCO films deposited at 200 °C.
Coatings 13 01719 g003
Figure 4. SEM images of TCO films deposited at RT and 200 °C. The names of the samples are indicated in the SEM images. (a) Single-layer TCO-I_RT; (b) single-layer TCO-I_200 °C; (c) multilayer TCO-II_RT; (d) multilayer TCO-II_200 °C; (e) single-layer TCO-III_RT; (f) single-layer TCO-III_200 °C; (g) multilayer TCO-IV_RT; and (h) multilayer TCO-IV_200 °C.
Coatings 13 01719 g004aCoatings 13 01719 g004b
Figure 5. AFM images of TCO films deposited at RT and 200 °C. The name of the samples is indicated on top of the AFM images. (a) Single-layer TCO-I_RT; (b) single-layer TCO-I_200 °C; (c) multilayer TCO-II_RT; (d) multilayer TCO-II_200 °C; (e) single-layer TCO-III_RT; (f) single-layer TCO-III_200 °C; (g) multilayer TCO-IV_RT; and (h) multilayer TCO-IV_200 °C.
Coatings 13 01719 g005aCoatings 13 01719 g005b
Figure 6. Transmittance spectra of TCO films deposited at RT and 200 °C. (a) Transmittance overview for TCOs.; (b) Zoomed view of transmittance for TCOs.
Coatings 13 01719 g006
Figure 7. Plot of (αhν)2 versus photon energy (hν) of TCO films deposited at RT and 200 °C. (a) Single-layer TCO-I_RT, TCO-I_200 °C, and multilayer TCO-II_RT, TCO-II_200 °C; (b) single-layer TCO-III_RT, TCO-III_200 °C, and multilayer TCO-IV_RT, TCO-IV_200 °C.
Coatings 13 01719 g007
Figure 8. Measured transmittance values of TCO films at 550 nm wavelength.
Coatings 13 01719 g008
Figure 9. FOM and sheet-resistance values of TCO films.
Coatings 13 01719 g009
Figure 10. J-V curve of SHJ solar cell fabricated using single-layer TCO-I_200 °C and multilayer TCO-II_200 °C films.
Coatings 13 01719 g010
Table 1. Deposition parameters of single-layer and multilayer films.
ParameterTCO-ITCO-IITCO-IIITCO-IV
Base pressure (Torr)1 × 10−61 × 10−61 × 10−61 × 10−6
Deposition pressure (Torr)9 × 10−49 × 10−49 × 10−49 × 10−4
Ar pressure (mTorr/sccm)5/25/25/25/2
Deposition temperature (°C)RT-200RT-200RT-200RT-200
Rotation speed (rpm)8888
Set power (W)75757575
Thickness (nm)16050/5/50/5/5016050/5/50/5/50
Deposition rate (Å/s)0.80.8/0.90.90.8/0.9
Table 2. Structural parameters of the TCO films deposited at 200 °C.
SamplesD
(nm)
ε
(×10−3)
δ
(lines/nm2)
N
(nm−2)
TCO-I_200 °C17.51−1.093.26 × 10−32.98 × 10⁻²
TCO-II_200 °C35.021.278.15 × 10−43.73 × 10⁻³
TCO-III_200 °C1.15−79.537.56 × 10−11.05 × 10²
TCO-IV_200 °C6.23−9.772.58 × 10−26.62 × 10⁻¹
Table 3. AFM surface roughness parameters (Rmax, Rq and Ra) and Eg values for TCO films.
AFM ResultsTransmittance
SamplesRmax
(nm)
Rq (RMS)
(nm)
Ra
(nm)
Eg
(eV)
Average (%)
(400–800 nm)
TCO-I_RT1.210.05120.03973.8582.1
TCO-II_RT1.500.06250.04383.8581.7
TCO-I_200 °C7.380.3070.2093.9385.1
TCO-II_200 °C3.860.3300.2193.9384.5
TCO-III_RT1.410.06420.05153.8181.6
TCO-IV_RT2.500.06170.04773.8182.5
TCO-III_200 °C9.980.2140.1093.8480.2
TCO-IV_200 °C4.510.2970.2263.8480.9
Disclaimer/Publisher’s Note: The statements, opinions and data contained in all publications are solely those of the individual author(s) and contributor(s) and not of MDPI and/or the editor(s). MDPI and/or the editor(s) disclaim responsibility for any injury to people or property resulting from any ideas, methods, instructions or products referred to in the content.