Abstract
High-entropy alloys (HEAs) have received increasing attention because of their excellent properties. To improve the surface hardness and wear resistance of pure Cu, a Cu35Ni25Co25Cr15 HEA coating was, for the first time, deposited on a pure Cu substrate by plasma transfer arc (PTA) welding. The welding current varied from 130 to 160 A. The microstructures and mechanical properties of the coating were investigated. The Cu35Ni25Co25Cr15 HEA coating comprised face-cubic-centered A1 (Cu-rich) and γ′ (NiCoCr-rich) phases. The coating had an apparent structural gradient with coarse grains at the interface with the Cu substrate. The bottom, middle, and top zones of the coating exhibited a fine smooth cellular structure, fine-needle structure, and long dendrites, respectively. As the welding current was increased, the dilution ratio of the coating and interfacial bonding strength gradually increased, whereas the hardness of the coating increased and then decreased. Under a welding current of 150 A, no gaps or pores appeared in the interface, and the coating exhibited good metallurgical bonding with the Cu substrate. The wear mechanisms of the Cu35Ni25Co25Cr15 HEA coating at different temperatures were also determined. Compared with pure Cu, the Cu35Ni25Co25Cr15 HEA coating exhibited excellent wear resistance, especially at high temperatures. This study paves a new way for coating on pure Cu and enhances the wear resistance of Cu components.
1. Introduction
Pure Cu is widely used in metallurgy, chemical, electrical, and other industrial fields owing to its excellent electrical and heat conductivities, weldability, and corrosion resistance [1,2]. However, the poor strength and wear resistance of Cu, due to rapid high-temperature oxidation, significantly limits its applications in heavy loadings [3]. Surface technologies are considered to strengthen pure Cu, maintaining its excellent physical properties while enhancing its wear resistance [4]. However, conventional laser surface-coating techniques are not adaptable on Cu, because Cu does not absorb laser energy [5]. Plasma transfer arc (PTA) welding can be conveniently performed on metal surfaces [6,7]. In addition, the PTA-welded coating has a low dilution ratio and uniform microstructure. Thus, studies have successfully welded Ni-Cr, Co-Cr, and Fe-Co alloys onto steel or aluminum substrates using PTA welding methods [8], and obtained good interfacial bonding [9,10,11]. However, owing to the high thermal conductivity of Cu and its alloys, the heat in the welding area rapidly dissipates during welding, resulting in incomplete fusion. Therefore, defects, such as pores, cracks, and deformation, are formed at the welding interface, resulting in a low bonding strength and mechanical properties of the coating [6,12,13]. Therefore, coatings with good interfacial microstructures and properties welded onto Cu substrates by PTA have rarely been reported. Therefore, it is still challenging to weld a coating with a high strength and wear resistance onto Cu or its alloys’ surface by the PTA welding method.
However, in terms of engineering applications, tools or devices using pure Cu, such as chutes, crystallizers, and blast furnace tuyeres, have been exposed to an increasingly harsh environment. In order to improve the surface hardness of Cu and its corrosion resistance, it is considered to exert coatings on the surface. According to the infinite solution characteristics of Cu and Ni [14], a CuNi alloy was selected as the base material to obtain a well-bonded alloy coating with an improved performance on a pure Cu substrate. In addition, Co and Cr are added to improve the wear and corrosion resistance of the coating, respectively [15,16,17,18]. However, traditional single-principal component alloys usually form intermetallic compounds and other phases, which affect the stability of the structures and properties [19]. Recently, high-entropy alloys (HEAs) have received increasing attention because of their excellent mechanical, physical, and chemical properties [20,21]. In addition, some studies have found that coatings with an HEA composition have a high wear resistance and oxidation resistance [22,23]. Thus, the high strength, hardness, good corrosion, and wear resistance of HEAs [24,25] have important potential for the surface modification of Cu alloys.
In our previous work, a Cu35Ni25Co25Cr15 HEA/diamond composite was prepared and exhibited good mechanical properties and wear resistance [26]. In this study, we coated Cu35Ni25Co25Cr15 HEA on a pure Cu substrate by PTA welding. To our knowledge, this is the first time that an HEA coating was deposited on a Cu substrate by this method. This work aimed to analyze the structural characteristics and wear resistance of the Cu substrate with the Cu35Ni25Co25Cr15 HEA coatings, and also to explore a suitable PTA welding process, which was rarely conducted on a Cu substrate.
2. Materials and Methods
2.1. Materials
The flowchart of material preparation and research methods is exhibited in Figure 1. As the substrate, pure Cu was machined to a size of 200 mm × 150 mm × 20 mm. Its surface was polished with 800 mesh emery paper and subsequently sandblasted. High-purity Cu, Ni, Co, and Cr were used to prepare Cu35Ni25Co25Cr15 (at%) HEA ingots. The alloy ingots were gas atomized to powder using a PSI HERMIGA 75 atomization system in Peshing New Metal (Changzhou, China) Co., Ltd. The atomization medium was argon with a purity of more than 99.99%. Alloy powder with a main particle size of 75–150 μm was used as the coating material.
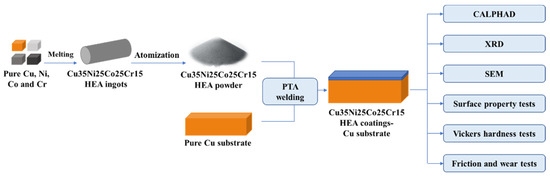
Figure 1.
Flowchart of material preparation and research methods.
2.2. PTA Process
The coating was prepared by PTA welding using an FB-200 welding system from Duomu Industrial Co., Ltd. of China. (Shanghai, China) The powder feeding capacity is 65 g/min, powder feeding gas flow 2 L/min, argon ion gas flow 2.5 L/min, and nitrogen protection gas flow 10 L/min. The distance of the welding torch from the substrate was 15 mm, and the torch was moved at a speed of 12 mm/s. The welding current varied from 130 to 160 A.
2.3. Characterization and Test Methods
The phase compositions of the Cu35Ni25Co25Cr15 HEA coating were calculated using CALPHAD software. X-ray diffraction (XRD) was performed using a D/Max 2550 X-ray diffractometer from Japanese Rigaku Corporation (Tokyo, Japan) to analyze the phase compositions of the HEA coatings deposited under different welding currents with a scanning angle of 5–100° and a scanning speed of 8°/min. The microstructures of the coating and worn surface were observed using a Quanta 650 FEG scanning electron microscope (SEM) from American FEI Company (Hillsboro, OR, USA)with an energy dispersive spectrometer (EDS, Oxford, UK) to analyze the elemental distribution. The microhardness was tested along the substrate and coating using an Alpha-1000 Vickers hardness tester from Shanghai Yizong Precision Instrument Co., Ltd. (Shanghai, China), with a load of 2.0 kgf and a loading time of 10 s. The interfacial bonding strength between the coating and substrate was measured using the scratch test method with an MFT-4000 multifunctional material surface property tester from Lanzhou Huahui Instrument Technology Co., Ltd. (Lanzhou, China). Using an HT-1000 high-temperature friction and wear tester from Lanzhou Zhongke Kaihua Technology Development Co., Ltd. (Lanzhou, China), the wear properties of the HEA coating and pure Cu substrate at 25, 300 and 700 °C were measured. The ball-disk rotary dry friction mode was adopted with a friction radius of 2 mm and a rotation rate of 400 rad/min. A Si3N4 grinding ball with a diameter of 3 mm and hardness of approximately 15 GPa was used. The friction test time was 20 min, and the load was 30 N.
3. Results and Discussions
3.1. Microstructures
The phase compositions of the Cu35Ni25Co25Cr15 HEA coatings at different temperatures were simulated using CALPHAD, and the results are shown in Figure 2a. The Cu35Ni25Co25Cr15 alloy was composed of face-cubic centered (FCC) A1 and γ′ phases, both with FCC structures. Figure 2b shows the XRD patterns of the Cu35Ni25Co25Cr15 HEA coatings deposited under different welding currents. In comparison to standard PDF cards, the HEA coatings comprised two FCC phases, corresponding to the FCC_A1 (ICDD PDF-040836) and γ′ (ICDD PDF-040850) phases in the CALPHAD calculation, respectively.
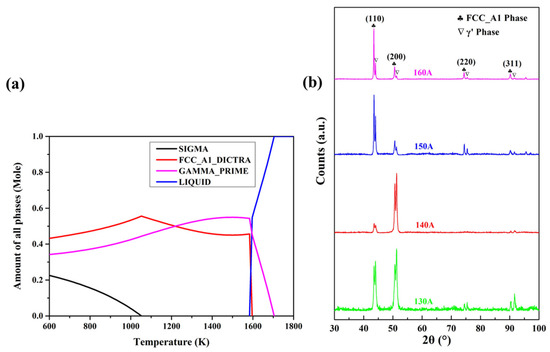
Figure 2.
Simulation of the phase compositions of the CuNiCoCr alloy by CALPHAD (a) and XRD patterns of the Cu35Ni25Co25Cr15 HEA coatings deposited under different welding currents (b).
The microstructures and morphology of the coatings deposited under different welding currents are similar. To determine the compositions of the Cu35Ni25Co25Cr15 HEA coating, the coating deposited under a welding current of 140 A was characterized, as shown in Figure 3. Table 1 shows the compositions of points A and B in Figure 3a. We can see that the Cu35Ni25Co25Cr15 HEA coating has a dual-phase microstructure. The light area represents the FCC_A1 phase, mainly the Cu-rich area, whereas the dark area is the γ′ phase, particularly the NiCoCr-rich area. The NiCoCr-rich phase is uniformly distributed around the Cu-rich phase.
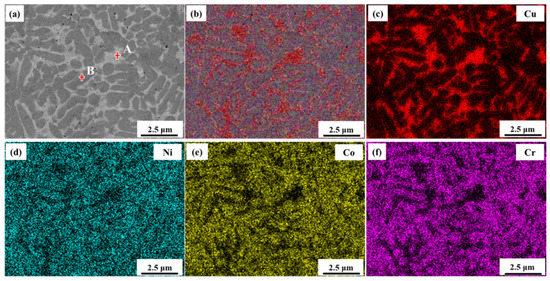
Figure 3.
Microstructures and compositions of the Cu35Ni25Co25Cr15 HEA coating deposited under a welding current of 140 A: (a) microstructure; (b) distribution of all elements; (c–f) distribution of Cu, Ni, Co, and Cr, respectively.

Table 1.
Compositions of the Cu35Ni25Co25Cr15 HEA coating deposited under a welding current of 140 A.
For HEAs, a phase diagram to guide the alloy compositional design is currently unavailable. In particular, researchers have summarized existing HEAs and used the mixing enthalpy to analyze the chemical compatibility of the components in the system. Accordingly, the possible phase composition of HEAs was calculated [24,27]. The mixing enthalpy can be calculated as follows [19]:
where is the interaction parameter of the ith and jth elements in the alloy system with n components, and is the mixed enthalpy of the binary alloy. It is concluded that an HEA can form a solid solution when is −15–5 kJ/mol. If is too large, the elements are not easily soluble, and elemental segregation tends to occur. Meanwhile, the more negative is, the stronger the binding force between the elements is, and an ordered phase or a compound is easier to form. Meanwhile, close to zero tends to create a solid solution [24].
Table 2 shows the mixed enthalpies of commonly used elements in HEA systems [28]. The mixing enthalpy of the Cu35Ni25Co25Cr15 HEA is calculated to be 3.37 kJ/mol, which satisfies the conditions for forming a solid solution. In addition, the mixed enthalpy between Cu and other elements is larger, and Cu-rich microscopic regions usually appear in several Cu-containing HEAs. This explains the phases (γ′ and FCC_A1 phase) in the Cu35Ni25Co25Cr15 HEA coatings.
Table 2.
Mixed enthalpy of different elements in high-entropy alloys (kJ/mol) [28].
Figure 4 shows the microstructures of different zones of the Cu35Ni25Co25Cr15 HEA coating deposited under a welding current of 160 A. The microstructure has coarse grains at the interface of the coating and Cu substrate, as shown in Figure 4a. This is ascribed to the melting of the alloy powder and formation of a typical liquid-solid interface with the locally melted Cu substrate during PTA welding, and the vertical and rapid growth of the crystal nucleus in the liquid phase along the normal interfacial direction. The bottom zone of the coating exhibits a fine and smooth cellular structure, the middle zone has a fine-needle structure, and the top zone exhibits obvious long dendrites, as shown in Figure 4b–d, respectively. This structure is attributed to the high-temperature gradient in the molten pool during PTA welding. At the area near the fusion zone at the bottom, a significant temperature gradient (G) might occur with a low cooling rate (R). With an increase in the coating thickness, the temperature gradient decreased, and the cooling rate increased [29]. At the area near the top of the coating, G/R might approach zero, resulting in an apparent structural gradient.
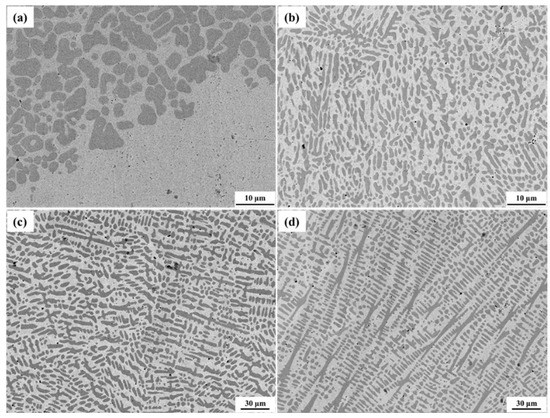
Figure 4.
Microstructures of different zones of the Cu35Ni25Co25Cr15 HEA coating deposited under a welding current of 160 A: (a) fusion zone; (b) bottom zone; (c) middle zone; and (d) top zone.
The microstructures of the interfacial zone of the Cu substrate and Cu35Ni25Co25Cr15 HEA coating under different welding currents are shown in Figure 5. The interfacial bonding between the coating and substrate improved with an increased welding current. When depositing under a welding current of 130 A, an obvious gap was noted at the interface of the coating and Cu substrate. Thus, poor interfacial bonding was noted, as shown in Figure 5a. Figure 6 shows that the gap (Figure 5) was mainly composed of chromium oxide. When the welding current was increased to 140 A, the welding power and energy increased, and the number of gaps and pores at the interface decreased.
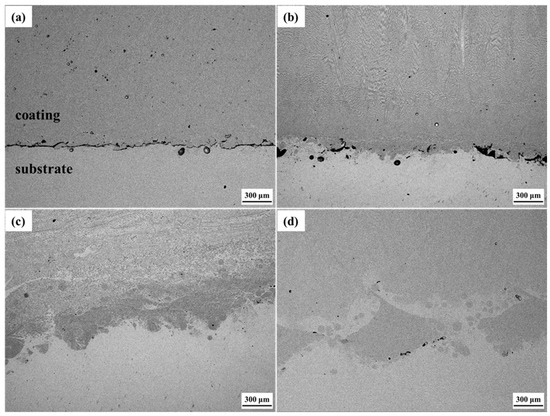
Figure 5.
Microstructures of the interfacial zone between the Cu substrate and Cu35Ni25Co25Cr15 HEA coating deposited under different welding currents: (a) 130 A; (b) 140 A; (c) 150 A; (d) 160 A.
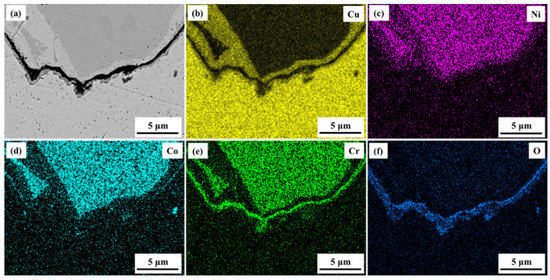
Figure 6.
Interfacial morphology and elemental distributions at the interface of the Cu substrate and Cu35Ni25Co25Cr15 HEA coating deposited under a welding current of 130 A: (a) interfacial morphology; (b–f) distributions of Cu, Ni, Co, Cr, and O, respectively.
Moreover, metallurgical bonding began to appear at some interfacial zones, as shown in Figure 5b. When the welding current was increased to 150 A and higher, no pores or gaps were detected at the interface between the coating and Cu substrate, and the fusion zone at the interface can be clearly seen, exhibiting a good metallurgical bonding effect, as shown in Figure 5c,d. As observed in the interfacial compositional zone between the Cu substrate and coating deposited under a current of 150 A (Figure 7), the Cu-rich phase in the coating and Cu substrate were closely integrated. The solubility of Cu and Ni was quite strong, so the interfacial gap disappeared, and the interface between the Cu substrate and Cu35Ni25Co25Cr15 HEA coating presented a good bonding effect.
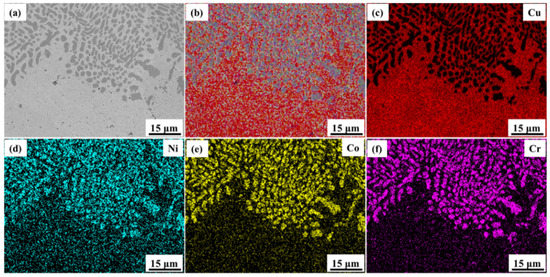
Figure 7.
Interfacial morphology and elemental distributions at the interface of the Cu substrate and Cu35Ni25Co25Cr15 HEA coating deposited under a welding current of 150 A: (a) interfacial morphology; (b) distribution of all elements; (c–f) distributions of Cu, Ni, Co, and Cr elements, respectively.
The dilution ratio of the coating dramatically affects the chemical composition and mechanical properties of the coating and substrate. A high dilution ratio expands the heat-affected zone, produces welding defects, and reduces the hardness of the coating. In contrast, a low dilution ratio reduces the bonding strength between the coating and substrate [30]. The coating dilution ratio η is calculated as follows [31]:
where is the thickness of the coating outside the surface of the substrate, and is the thickness of the remaining fusion zone in the substrate, as shown in Figure 8a. Using Equation (3), the dilution ratio of the Cu35Ni25Co25Cr15 HEA coating increased from 20.79% to 27.38% (see Appendix A for full data) as the welding current was increased from 130 to 160 A, as shown in Figure 8b.
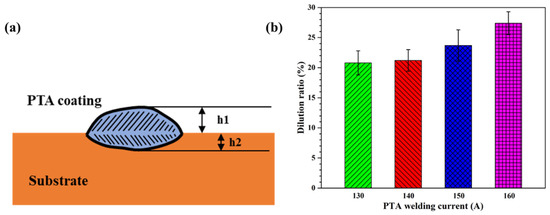
Figure 8.
Schematic of the cross-sectional areas used in the calculation of the dilution ratio of the PTA-welded specimen (a) and dilution ratio of the Cu35Ni25Co25Cr15 HEA coatings deposited under different welding currents (b).
3.2. Mechanical Properties
Microhardness tests were performed on different parts of the Cu substrate and Cu35Ni25Co25Cr15 HEA coatings deposited under different welding currents, and the results are shown in Figure 9. The hardness of the Cu substrate was 40.15 HV, and that of the interfacial zone increased rapidly after welding, especially when deposited under 150 A. The highest hardness value of 146.53 HV (see Appendix B for full data) was obtained under the welding current of 150 A, and the lowest hardness was 105.34 HV when being welded at 130 A. From the interfacial zone to the top side of the coating, the hardness of the HEA coatings deposited under different currents exhibited the same trends. It firstly increased until reaching the maximum value at the distance of approximately 1.5 mm from the interface and then decreased. The highest hardness of 190.68 HV was obtained in the coating deposited under a current of 150 A, which is approximately five times higher than that of the Cu substrate. The hardness decreased with the distance from the coatings to the surface. In the area close to the surface, the coating deposited under 150 A still exhibited a high hardness of 167.16 HV, and the lowest hardness was 145.58 HV when the welding current was 130 A.
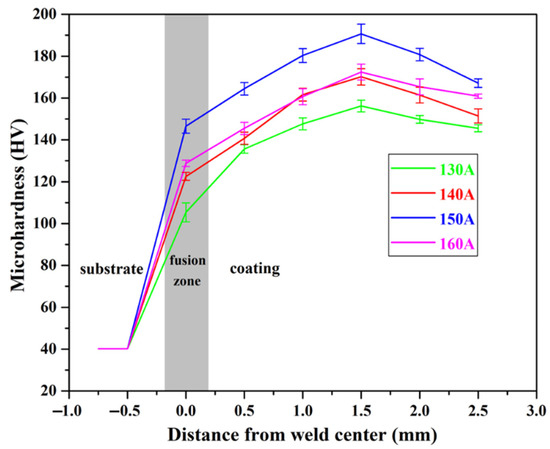
Figure 9.
Microhardness of the Cu35Ni25Co25Cr15 HEA coatings deposited under different welding currents.
The interfacial bonding strength between the Cu35Ni25Co25Cr15 HEA coating and Cu substrate was tested using the scratch test method [32]. This method continuously adds a load to the diamond indenter of the scratching probe and moves the specimen simultaneously to scratch the surface using a scratching needle. When the probe was cut through the coating and in contact with the substrate, an acoustic emission signal was obtained through each sensor. The curve of the load, sound signal intensity, and other information was automatically drawn. The load corresponding to the first spectral peak on the curve represents the critical value of the adhesion force between the coating and substrate [33]. As the PTA welding current was gradually increased from 130 to 160 A, the interfacial adhesion force between the Cu35Ni25Co25Cr15 HEA coating and Cu substrate gradually increased from 15.4 to 64.2 N (see Appendix C for full data), as shown in Figure 10. The results are consistent with the interfacial bonding morphology (Figure 5) and a gradual increase in the dilution ratio (Figure 8). In other words, with the increase in the welding current, the dilution ratio of the coatings increased, thereby improving the interfacial bonding strength. However, by comparing the interfacial bonding strength and hardness of the coatings welded under different currents comprehensively, it can be found that 150 A is a more appropriate welding process.
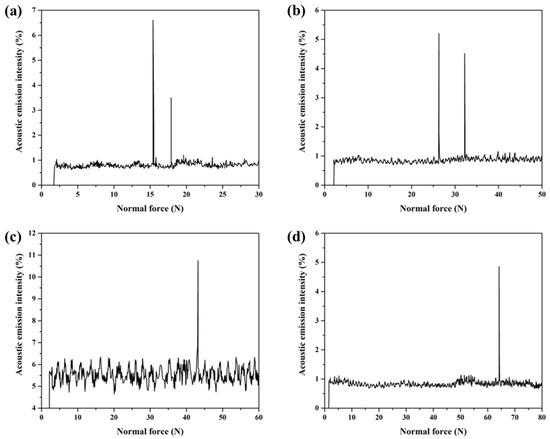
Figure 10.
Acoustic emission spectra of the Cu35Ni25Co25Cr15 HEA coatings on the Cu substrate deposited under different welding currents: (a) 130 A; (b) 140 A; (c) 150 A; (d) 160 A.
3.3. Wear Properties
Wear tests of pure Cu and the Cu35Ni25Co25Cr15 HEA coating deposited under a current of 150 A were carried out at 25, 300, and 700 °C. Figure 11a shows the change in the friction coefficient with time. As the friction progressed, the friction coefficient of the pure Cu was unstable with several fluctuations, whereas that of the Cu35Ni25Co25Cr15 HEA coating had minimal variations. As the test temperature was gradually increased from 25 to 700 °C, the average friction coefficient of the Cu35Ni25Co25Cr15 HEA coating and pure Cu decreased and then increased, with the lowest values of 0.453 and 0.159, respectively, at 300 °C. When the test temperature was increased from 25 to 300 °C, the worn Cu scraps or HEA coating debris slipped to the friction surface and formed metallic oxides due to the heat of the friction. When the surface was covered with oxides, a film formed, acting as a lubricant and reducing the friction coefficient. When the temperature was continuously increased to 700 °C, the Cu substrate and Cu35Ni25Co25Cr15 HEA coating softened, and the surfaces were severely worn. Adhesion and oxidation occurred, resulting in a higher friction coefficient. In addition, Figure 11a shows that the average friction coefficient of the Cu35Ni25Co25Cr15 HEA coating was higher than that of the pure Cu at the same test temperature. This is attributed to the fact that the high hardness of the Cu35Ni25Co25Cr15 HEA coating and few wear debris and oxides generated, may result in difficulty in the formation of a continuous lubricating layer on the friction surface.
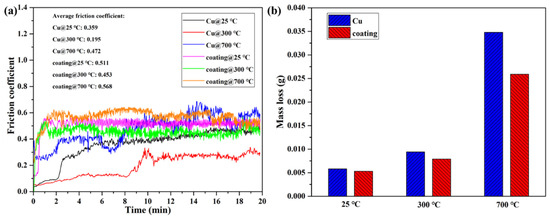
Figure 11.
Friction and worn behavior of the Cu35Ni25Co25Cr15 HEA coating deposited under a welding current of 150 A and the pure Cu at different temperatures: (a) friction coefficient; (b) wear mass loss.
In contrast, a stable and continuous oxide layer was formed on the pure Cu surface during friction, which achieved a better lubrication effect and made the friction coefficient of the pure Cu lower than that of the HEA coating. However, at the temperature of 700 °C, the difference between the friction coefficients of the HEA coating and pure Cu decreased. In particular, the friction coefficient of the pure Cu gradually exceeded that of the Cu35Ni25Co25Cr15 HEA coating after being worn for 12 min. This is owing to the fact that the pure Cu was severely softened and worn at 700 °C, and adhesion and oxidation became more severe than the HEA coating.
Figure 11b compares the wear mass loss of the pure Cu and Cu35Ni25Co25Cr15 HEA coating after the 20 min friction test at different temperatures. At the same temperature, the wear mass loss of the Cu35Ni25Co25Cr15 HEA coating was lower than that of the pure Cu. As the temperature gradually increased from 25 to 700 °C, the difference in the wear mass loss between the pure Cu and the HEA coatings became larger (see Appendix D for full data).
Figure 12 shows the worn surface morphology of the pure Cu and the HEA coatings. The minimal difference was observed on the worn surface between the pure Cu and HEA coatings at 25 and 300 °C. In particular, both worn surfaces were very rough, with pits, furrows, and scratches. However, due to the higher hardness and better wear resistance of the coating, the worn surface of the pure Cu was more severe than the Cu35Ni25Co25Cr15 HEA coating. Abrasive wear was determined to be the main wear mechanism. When the temperature was increased to 700 °C, the wear scar width increased significantly, and the worn surface was delaminated, resulting in scratches and exfoliation, especially on the pure Cu surface, along with local cracks. In addition, the wear situation of the pure Cu was more severe than that of the Cu35Ni25Co25Cr15 HEA coating with a higher wear mass loss. At this temperature, the wear mechanisms of the pure Cu and the HEA coating were both oxidation and adhesive wear. Compared with the pure Cu, the Cu35Ni25Co25Cr15 HEA coating exhibited a higher wear resistance, especially at 700 °C.
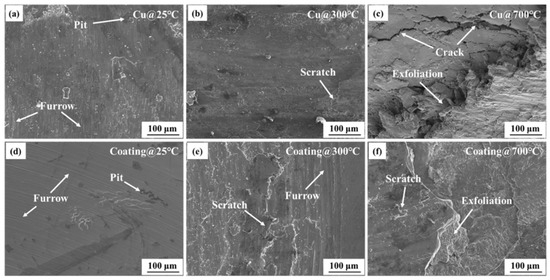
Figure 12.
Worn surface of the pure Cu and Cu35Ni25Co25Cr15 HEA coating deposited under a welding current of 150 A at different temperatures: (a,d) 25 °C, (b,e) 300 °C, and (c,f) 700 °C, respectively.
The results indicated that the Cu35Ni25Co25Cr15 HEA coating can be successfully prepared on the pure Cu surface by PTA welding. It could not only strengthen the surface, but also maintain the excellent properties of the Cu substrate, such as the high thermal and electrical conductivity. The findings of this study pave a new way for surface coating technology on pure Cu, and to extend its applications in a more and more serious environment.
4. Conclusions
In this study, a Cu35Ni25Co25Cr15 HEA coating was, for the first time, deposited on a pure Cu substrate by PTA welding. The microstructures of the coating were characterized, and the mechanical and wear properties were tested. The following conclusions were drawn:
1. The Cu35Ni25Co25Cr15 HEA coating comprised an FCC_A1 (Cu-rich) and γ′ (NiCoCr-rich) phase. A structural gradient was clearly observed in the coating. Coarse grains were formed at the interface between the coating and substrate. The bottom of the coating exhibited a fine cellular structure, the middle zone had a fine-needle structure, and the top surface exhibited long dendrites.
2. As the welding current was increased, the dilution ratio of the Cu35Ni25Co25Cr15 HEA coating and interfacial bonding strength between the coating and substrate gradually increased. When the welding current reached 150 A or higher, no gaps or pores appeared at the interfacial zone, and the coating had a good metallurgical bond with the Cu substrate. A high bonding strength of 64 N was obtained between the coating and the substrate.
3. The Cu35Ni25Co25Cr15 HEA coating significantly improved the hardness of the surface. The coating deposited under a welding current of 150 A had a high hardness, nearly five times higher than that of the pure Cu substrate. With an increase in the welding current, the hardness of the coating first increased and then decreased.
4. The wear resistance of the pure Cu with the HEA coating was significantly improved. The wear mechanism of the Cu35Ni25Co25Cr15 HEA coating at 25 and 300 °C was abrasive wear, whereas at a higher temperature (700 °C), the wear mechanisms were oxidation and adhesive wear. The findings of this study pave a new way for surface coating technology on pure Cu.
Author Contributions
Y.G.: Conceptualization, methodology, writing—original draft, funding acquisition. Z.Y.: Investigation, formal analysis. H.X.: Validation, methodology, resources. Q.L.: Software, writing—review and editing. B.L.: Methodology, data curation. Y.L.: Supervision, writing—review and editing, project administration, funding acquisition. All authors have read and agreed to the published version of the manuscript.
Funding
This investigation is supported by a grant from the National Natural Science Foundation of China (No. U20A20236), and the Fundamental Research Funds for the Central Universities of Central South University (No. 2022ZZTS0436).
Institutional Review Board Statement
Not applicable.
Informed Consent Statement
Not applicable.
Data Availability Statement
Not applicable.
Conflicts of Interest
The authors declare that there have been no known competing financial interests or personal relationships that could have appeared to influence the work reported in this paper.
Appendix A
Table A1.
Dilution ratio of the Cu35Ni25Co25Cr15 HEA coatings deposited under different welding currents.
Table A1.
Dilution ratio of the Cu35Ni25Co25Cr15 HEA coatings deposited under different welding currents.
| Welding Current (A) | Dilution Ratio (%) |
|---|---|
| 130 | 20.79 ± 2.02 |
| 140 | 21.21 ± 1.82 |
| 150 | 23.74 ± 2.61 |
| 160 | 27.38 ± 1.89 |
Appendix B
Table A2.
Microhardness of the Cu35Ni25Co25Cr15 HEA coatings deposited under different welding currents.
Table A2.
Microhardness of the Cu35Ni25Co25Cr15 HEA coatings deposited under different welding currents.
| Welding Current (A) | Microhardness at the Distance from Weld Center (HV2.0) | |||||
|---|---|---|---|---|---|---|
| Weld Center | 0.5 mm | 1.0 mm | 1.5 mm | 2.0 mm | 2.5 mm | |
| 130 | 105.34 ± 4.53 | 135.64 ± 2.02 | 147.68 ± 2.83 | 159.20 ± 2.82 | 149.84 ± 1.84 | 145.58 ± 1.65 |
| 140 | 122.54 ± 1.88 | 140.78 ± 2.91 | 161.60 ± 3.06 | 170.10 ± 3.92 | 161.43 ± 3.73 | 151.44 ± 3.32 |
| 150 | 146.53 ± 3.36 | 164.43 ± 4.02 | 180.33 ± 3.32 | 190.68 ± 4.65 | 180.73 ± 2.96 | 167.16 ± 2.03 |
| 160 | 128.82 ± 1.48 | 145.48 ± 2.89 | 160.66 ± 3.83 | 172.42 ± 3.78 | 165.37 ± 3.82 | 160.90 ± 1.05 |
Appendix C
Table A3.
Interfacial adhesion force between the Cu substrate and Cu35Ni25Co25Cr15 HEA coatings deposited under different welding currents.
Table A3.
Interfacial adhesion force between the Cu substrate and Cu35Ni25Co25Cr15 HEA coatings deposited under different welding currents.
| Welding Current (A) | Interfacial Adhesion Force (N) |
|---|---|
| 130 | 15.4 |
| 140 | 26.3 |
| 150 | 43.2 |
| 160 | 64.2 |
Appendix D
Table A4.
Wear mass loss of the Cu35Ni25Co25Cr15 HEA coating deposited under a welding current of 150 A and pure Cu substrate at different temperatures.
Table A4.
Wear mass loss of the Cu35Ni25Co25Cr15 HEA coating deposited under a welding current of 150 A and pure Cu substrate at different temperatures.
| Temperature (°C) | Cu Substrate Wear Mass Loss (g) | Cu35Ni25Co25Cr15 HEA Coating Wear Mass Loss (g) |
|---|---|---|
| 25 | 0.0058 | 0.0053 |
| 300 | 0.0094 | 0.0079 |
| 700 | 0.0348 | 0.0259 |
References
- Wan, X.; Xie, W.; Chen, H.; Tian, F.; Wang, H.; Yang, B. First-principles study of phase transformations in Cu-Cr alloys. J. Alloys Compd. 2021, 862, 158531. [Google Scholar] [CrossRef]
- Peeples, C.A.; Kober, D.; Schmitt, F.J.; Tholen, P.; Siemensmeyer, K.; Halldorson, Q.; Çoşut, B.; Gurlo, A.; Yazaydin, A.O.; Hanna, G. A 3D Cu-Naphthalene-phosphonate metal-organic framework with ultra-high electrical conductivity. Adv. Funct. Mater. 2021, 31, 2007294. [Google Scholar] [CrossRef]
- Zhao, Z.; Xiao, Z.; Li, Z.; Qiu, W.; Jiang, H.; Lei, Q.; Liu, Z.; Jiang, Y.; Zhang, S. Microstructure and properties of a Cu-Ni-Si-Co-Cr alloy with high strength and high conductivity. Mater. Sci. Eng. A 2019, 759, 396–403. [Google Scholar] [CrossRef]
- Zhang, J.; Zhao, W.; Wu, S.; Yin, R.; Zhu, M. Surface dual redox cycles of Mn (III)/Mn (IV) and Cu (I)/Cu (II) for heterogeneous peroxymonosulfate activation to degrade diclofenac: Performance, mechanism and toxicity assessment. J. Hazard. Mater. 2021, 410, 124623. [Google Scholar] [CrossRef] [PubMed]
- Wang, J.; Zhou, X.; Li, J. Evolution of microstructures and properties of SLM-manufactured Cu-15Ni-8Sn alloy during heat treatment. Addit. Manuf. 2021, 37, 101599. [Google Scholar] [CrossRef]
- Wu, C.; Wang, L.; Ren, W.; Zhang, X. Plasma arc welding: Process, sensing, control and modeling. J. Manuf. Process. 2014, 16, 74–85. [Google Scholar] [CrossRef]
- Ertugrul, G.; Hälsig, A.; Hensel, J.; Buhl, J.; Härtel, S. Efficient multi-material and high deposition coating including additive manufacturing by tandem plasma transferred arc welding for functionally graded structures. Metals 2022, 12, 1336. [Google Scholar] [CrossRef]
- Fu, Y.; Li, L.; Guo, X.; Li, M.; Pan, Z.; Wang, H.; Liu, C.; Zhao, L. Fe-Co-based coating with high hardness and high saturation magnetization deposited by co-axial powder feeding plasma transferred arc welding. Mater. Lett. 2022, 315, 131928. [Google Scholar] [CrossRef]
- Sudha, C.; Shankar, P.; Rao, R.S.; Thirumurugesan, R.; Vijayalakshmi, M.; Raj, B. Microchemical and microstructural studies in a PTA weld overlay of Ni-Cr-Si-B alloy on AISI 304L stainless steel. Surf. Coat. Technol. 2008, 202, 2103–2112. [Google Scholar] [CrossRef]
- Ferozhkhan, M.M.; Duraiselvam, M.; Ravibharath, R. Plasma transferred arc welding of stellite 6 alloy on stainless steel for wear resistance. Procedia Technol. 2016, 25, 1305–1311. [Google Scholar] [CrossRef]
- Appiah, A.N.S.; Bialas, O.; Czupryński, A.; Adamiak, M. Powder plasma transferred arc welding of Ni-Si-B + 60 wt% WC and Ni-Cr-Si-B + 45 wt% WC for surface cladding of structural steel. Materials 2022, 15, 4956. [Google Scholar] [CrossRef] [PubMed]
- Balakrishnan, M.; Balasubramanian, V.; Madhusudhan Reddy, G. Effect of PTA hardfaced interlayer thickness on ballistic performance of shielded metal arc welded armor steel welds. J. Mater. Eng. Perform. 2013, 22, 806–814. [Google Scholar] [CrossRef]
- Matějíček, J.; Antoš, J.; Rohan, P. W + Cu and W + Ni composites and FGMs prepared by plasma transferred arc cladding. Materials 2021, 14, 789. [Google Scholar] [CrossRef] [PubMed]
- Manzano, C.V.; Caballero-Calero, O.; Tranchant, M.; Bertero, E.; Cervino-Solana, P.; Martin-Gonzalez, M.; Philippe, L. Thermal conductivity reduction by nanostructuration in electrodeposited CuNi alloys. J. Mater. Chem. C 2021, 9, 3447–3454. [Google Scholar] [CrossRef]
- Denkena, B.; Krödel, A.; Lang, R. Fabrication and use of Cu-Cr-diamond composites for the application in deep feed grinding of tungsten carbide. Diam. Relat. Mater. 2021, 120, 108668. [Google Scholar] [CrossRef]
- Li, R.; Guo, E.; Chen, Z.; Kang, H.; Wang, W.; Zou, C.; Li, T.; Wang, T. Optimization of the balance between high strength and high electrical conductivity in CuCrZr alloys through two-step cryorolling and aging. J. Alloys Compd. 2019, 771, 1044–1051. [Google Scholar] [CrossRef]
- Pingale, A.D.; Owhal, A.; Belgamwar, S.U.; Rathore, J.S. Co-deposited CuNi@ MWCNTs nanocomposites for structural applications: Tribo-mechanical and anti-corrosion performances. Trans. IMF 2022, 1–8. [Google Scholar] [CrossRef]
- Singh, V.; Singh, I.; Bansal, A.; Omer, A.; Singla, A.K.; Goyal, D.K. Cavitation erosion behavior of high velocity oxy fuel (HVOF) sprayed (VC + CuNi-Cr) based novel coatings on SS316 steel. Surf. Coat. Technol. 2022, 432, 128052. [Google Scholar] [CrossRef]
- Ye, Y.; Wang, Q.; Lu, J.; Liu, C.; Yang, Y. High-entropy alloy: Challenges and prospects. Mater. Today 2016, 19, 349–362. [Google Scholar] [CrossRef]
- Yang, T.; Zhao, Y.; Tong, Y.; Jiao, Z.; Wei, J.; Cai, J.; Han, X.; Chen, D.; Hu, A.; Kai, J. Multicomponent intermetallic nanoparticles and superb mechanical behaviors of complex alloys. Science 2018, 362, 933–937. [Google Scholar] [CrossRef]
- Li, W.; Xie, D.; Li, D.; Zhang, Y.; Gao, Y.; Liaw, P.K. Mechanical behavior of high-entropy alloys. Prog. Mater. Sci. 2021, 118, 100777. [Google Scholar] [CrossRef]
- Ghadami, F.; Davoudabadi, M.A.; Ghadami, S. Cyclic oxidation properties of the nanocrystalline AlCrFeCoNi high-entropy alloy coatings applied by the atmospheric plasma spraying technique. Coatings 2022, 12, 372. [Google Scholar] [CrossRef]
- Ghadami, F.; Ghadami, S.; Davoudabadi, M. Sliding wear behavior of the nanoceria-doped AlCrFeCoNi high-entropy alloy coatings deposited by air plasma spraying technique. J. Therm. Spray Technol. 2022, 31, 1263–1275. [Google Scholar] [CrossRef]
- Zhang, Y.; Zuo, T.T.; Tang, Z.; Gao, M.C.; Dahmen, K.A.; Liaw, P.K.; Lu, Z.P. Microstructures and properties of high-entropy alloys. Prog. Mater. Sci. 2014, 61, 1–93. [Google Scholar] [CrossRef]
- Feng, R.; Zhang, C.; Gao, M.C.; Pei, Z.; Zhang, F.; Chen, Y.; Ma, D.; An, K.; Poplawsky, J.D.; Ouyang, L. High-throughput design of high-performance lightweight high-entropy alloys. Nat. Commun. 2021, 12, 4329. [Google Scholar] [CrossRef]
- Gao, Y.; Xiao, H.B.; Liu, Y.; Zhang, W. Effect of interfacial reaction on wear properties of Cu35Ni25Co25Cr15 multi-principal components alloy/diamond composites. Acta Mater. Compos. Sin. 2023, 40, 164. (In Chinese) [Google Scholar]
- Huang, H.; Wu, Y.; He, J.; Wang, H.; Liu, X.; An, K.; Wu, W.; Lu, Z. Phase-transformation ductilization of brittle high-entropy alloys via metastability engineering. Adv. Mater. 2017, 29, 1701678. [Google Scholar] [CrossRef]
- Takeuchi, A.; Inoue, A. Classification of bulk metallic glasses by atomic size difference, heat of mixing and period of constituent elements and its application to characterization of the main alloying element. Mater. Trans. 2005, 46, 2817–2829. [Google Scholar] [CrossRef]
- Chen, L.; Wang, C.; Zhang, X.; Mi, G. Effect of parameters on microstructure and mechanical property of dissimilar joints between 316L stainless steel and GH909 alloy by laser welding. J. Manuf. Process. 2021, 65, 60–69. [Google Scholar] [CrossRef]
- Antoszczyszyn, T.J.; Paes, R.M.G.; Oliveira, A.S.C.M.d.; Scheid, A. Impact of dilution on the microstructure and properties of Ni-based 625 alloy coatings. Soldag. Inspeção 2014, 19, 134–144. [Google Scholar] [CrossRef][Green Version]
- Cai, Y.; Chen, Y.; Manladan, S.M.; Luo, Z.; Gao, F.; Li, L. Influence of dilution rate on the microstructure and properties of FeCrCoNi high-entropy alloy coating. Mater. Des. 2018, 142, 124–137. [Google Scholar] [CrossRef]
- Sekler, J.; Steinmann, P.; Hintermann, H. The scratch test: Different critical load determination techniques. Surf. Coat. Technol. 1988, 36, 519–529. [Google Scholar] [CrossRef]
- Steinmann, P.; Tardy, Y.; Hintermann, H. Adhesion testing by the scratch test method: The influence of intrinsic and extrinsic parameters on the critical load. Thin Solid Films 1987, 154, 333–349. [Google Scholar] [CrossRef]


Disclaimer/Publisher’s Note: The statements, opinions and data contained in all publications are solely those of the individual author(s) and contributor(s) and not of MDPI and/or the editor(s). MDPI and/or the editor(s) disclaim responsibility for any injury to people or property resulting from any ideas, methods, instructions or products referred to in the content. |
© 2022 by the authors. Licensee MDPI, Basel, Switzerland. This article is an open access article distributed under the terms and conditions of the Creative Commons Attribution (CC BY) license (https://creativecommons.org/licenses/by/4.0/).