Article

Influence of Surface Coating towards the Controlled Toxicity of ZnO Nanoparticles In Vitro

by
Faruq Mohammad
1,*,
Ibrahim Birma Bwatanglang
2,
Hamad A. Al-Lohedan
1,*,
Jilani Purusottapatnam Shaik
3,
Hissah Hamad Al-Tilasi
1 and
Ahmed A. Soleiman
4
1
Department of Chemistry, College of Science, King Saud University, Riyadh 11451, Saudi Arabia
2
Department of Pure and Applied Chemistry, Faculty of Science, Adamawa State University, Mubi 650001, Nigeria
3
Department of Biochemistry, College of Science, King Saud University, Riyadh 11451, Saudi Arabia
4
Department of Chemistry, Southern University and A&M College, Baton Rouge, LA 70813, USA
*
Authors to whom correspondence should be addressed.
Coatings 2023, 13(1), 172; https://doi.org/10.3390/coatings13010172
Submission received: 7 December 2022 / Revised: 8 January 2023 / Accepted: 10 January 2023 / Published: 12 January 2023
(This article belongs to the Special Issue Advances in Nanostructured Thin Films and Coatings)

Abstract

:
The uncertainties in ZnO-mediated toxicity and particle stability in a biological system remain a challenge and mitigate against deployment as next-generation nanoparticles (NPs), especially in biomedical applications. With that perspective, the present study investigates the surface chemical properties of ZnO NPs coated with three different surfactant biomolecules, namely polyethylene glycol (PEG), cetyltrimethylammonium bromide (CTAB), and sodium dodecyl sulfate (SDS) to control the toxicity-induced potentials. On the testing of the surface-functionalized ZnO NPs, notable changes in the particle sizes, morphology, zeta potential, and hydrodynamic size compared to the pure ZnO NPs are observed. In addition, FTIR spectroscopy, TGA, XRD, XPS, and HRTEM analysis showed significant changes in the surface structures and surface functional groups of the three different ZnO NPs on surface functionalization. Following the physical characterization, the cell viability of rat liver BRL-3A-treated ZnO–PEG, ZnO–CTAB, and ZnO–SDS compared to pure ZnO NPs (<50%) falls between 70% and 95% in a dose-determined manner. The cells treated with the pure ZnO NPs showed a higher percentage of apoptotic cells (~61%), which is significantly higher than the 3.4%, 1.5%, and 0.6% for ZnO–PEG-, ZnO–CTAB-, and ZnO–SDS-treated cells (respectively). Furthermore, the surface functionalization was significantly observed to reduce the content of reactive oxygen species (ROS) to 13.6%, 9.7%, and 2.6% compared to the content level of ~71% from the pure ZnO-treated cells. Besides the marked impairment of mitochondrial potentials induced by the pure ZnO NPs, the surfactant–ZnO NPs were observed to slow down the induction of DNA fragmentation and retain the structural integrity of mitochondrial membranes. The toxicity effects are controlled in the order of ZnO–SDS > ZnO–CTAB > ZnO–PEG, i.e., anionic > cationic > non-ionic. Overall from the analysis, the study stresses the importance of having a suitable surface ligand for the ZnO NPs so as to use them in the biomedical sector.

1. Introduction

The rising interest and understanding of the basic chemistry of ZnO and associated biological interactions helped to underpin its deployment as next-generation nanoparticles (NPs), thereby underscoring the debates about toxicity for biomedical applications. The developing biomedical applications span from cancer therapy, drug delivery, and biosensing to cellular imaging [1,2]. Furthermore, the photocatalytic properties of ZnO NPs readily facilitate reactive oxygen species (ROS) formation and thereby enable their use as an active antibacterial additive in dentistry and dermatological formulations [2]. The isoelectric point of ZnO NPs facilitates surface protonation corresponding to body fluids, a property engineered in the formation of drug carriers [3]. The self-lighting and photoluminescent properties are utilized in cancer theranostic and photodynamic therapy [4]. The surface functionalization of ZnO NPs is tailored to enhance targeted drug delivery and inhibit the aggregation, agglomeration, and toxicity of drug formulations in vivo [5,6].
The physicochemical and surface properties ZnO NPs directly influence the physisorption or chemisorption of solvent molecules and other chemical or biomolecule species interaction [7]. Studies have shown that the surface atomic properties of ZnO and their orientations and arrangements are very much influenced by the kind of synthesis methods used and the reaction conditions applied, which also influence the stabilization of surface and toxicity levels [8,9,10]. The foregoing reports of ZnO further shows the significance of surface functionalization towards the formation of stable, biocompatible, and controlled physicochemical properties. In addition, the surface functionalization of ZnO NPs with hydrophilic/hydrophobic moieties is reported to improve drug solubility and enable controlled release in the biological milieu and is further reported to improve cell compatibility and target penetration [11]. Similarly to these important functions, scientists utilized biomolecules such as polyethylene glycol (PEG), amino acids, peptides, cyclodextrin, etc., to synthesize ZnO hybrid materials [12]. The introduction of biomolecule constructs in synthesis help to catalyze ZnO formation, initiate the stabilization of intermediate phases, inhibit ZnO-mediated ROS formation, and impede the adsorption growth mechanism [12] and crystal growth by complexation [13].
With these merits of development, the uncertainties in ZnO NPs toxicity and stability in a biological system water down the excitement. The intracellular absorption of Zn2+ ions by biological cells mediate the formation of ROS and dampen the much desired biomedical application of ZnO NPs [14]. Of various critical factors associated with the use of ZnO NPs in the biomedicine and pharmacological sector, important are the acellular factors, including the particle shape and size, particle surface structures/charges, and particle dissolution, which are observed to account for the difficulties inherent in its conversion into a stable dispersion [15]. These critical factors initiate particle–particle interactions and deposit fragments of ions in the biological system through Fenton-type reactions inducing oxidative stress signaling cascades [2]. Though the synthesis of relatively stable ZnO nanostructures could be achieved by functionalizing the surface with either non-ionic, cationic, or anionic surfactants, these surfactants were also observed to possess the intrinsic properties that mimic cell membrane phospholipid in ROS scavenging or antioxidant effects [16,17]. The biological membranes contain pleiotropic compounds (surfactants), consisting of phospholipids and proteins. The phospholipids, in addition to their tensioactive properties, also participate in the reduction of oxidative stress by quenching ROS activation [18]. The use of the aforementioned non-natural surfactants to lower the toxicity level of metal oxide NPs was reported in various studies. For example, an in vitro toxicity study carried on ZnO NPs was reported by Popescu et al. [19], using surfactant-controlled Mn-doping, and they suggested that the doping by the tailored surfactant (sodium hexametaphosphate, SHMTP) helped to induce a shielding effect on the tested cells by weakening the pro-oxidant nature linked with specific area and porosity increase. Similarly, Luo et al. [5] reported the use of polyethylene glycol (PEG) to modify the surface of ZnO NPs to reduce the induction of protein crowns and cytotoxicity compared against ZnO NPs without any coating. Furthermore, some tests on the renal toxicity potentials were observed to be lower in rat models with PEG-coated ZnO NPs (that were formed by the co-precipitation technique) compared to the groups treated with uncoated ZnO [20]. Furthermore, Oleszczuk et al. [21] showed a reduction in ZnO NPs by hexadecyltrimethylammonium bromide (CTAB) toward Daphnia Magna, and the same author reported a reduction of toxicity with sodium dodecyl sulfate (SDS)-functionalized ZnO NPs at a level > 60%, at a very low range concentration of 0.05 to 0.5 mg/L. The SDS–stabilized polyacrylate NPs as a drug delivery system were observed to be non-cytotoxic against keratinocytes at 1–3 weight% of SDS and were further reported to show 71% cell viability in peripheral blood mononuclear cells incubated for 24 h with a SDS/FeSP nanocomposite [22]. Additionally, some researchers observed the stabilization of NPs and that the surface protection of ZnO NPs with surfactants enhances the retention of antioxidant activity. This occurs due to the establishment of a balance between antioxidants and ROS, which facilitates oxygen electron density transfer to the odd electron present at the outer orbits of oxygen in the free radical species of *OH and O2* [21,23].
However, all of these studies reported the scavenging activity of surfactants, which is, however, not out of place in unravelling the antioxidant potential to study how each surfactant molecule controls the surface-induced toxic responses of ZnO NPs. For these reasons, this study uses three different surfactant biomolecules, namely PEG (non-ionic), CTAB (cationic), and SDS (anionic), to further understand the surfactant–particle toxicity reduction mechanism. The study started with synthesis and characterization, then proceeded to test the toxicity effects using cell viability, apoptosis assay, DNA fragmentation, ROS formation, mitochondrial depletion, etc. These biological assays are being studied to see how each surfactant molecule is controlling the surface-induced toxic responses of ZnO NPs.

2. Experimental

2.1. Materials and Methods

Zinc acetylacetonate hydrate, diphenyl ether, 1,2-hexadecanediol, PEG (PEG 6000), CTAB, SDS, and ethanol were purchased from Sigma-Aldrich (St. Louis, MO, USA) and were used as received. The in vitro biological studies were carried on BRL-3A cells of rat liver origin (a non-cancer cell line; ATCC® CRL-1442™), and the cells were grown in Eagle’s Minimum Essential Medium (EMEM) complemented with Fetal Bovine Serum (FBS) that contained 1% antibiotics (penicillin, 100 units mL−1; streptomycin, 100 µg mL−1) (Manassas, VA, USA). For the growth of cells, a 10% FBS-containing media was used, while for the treatment of various ZnO NPs to the cells, we used a 2% FBS media. The incubation conditions for the growth/maintenance of cell culture include the standard parameters of 37 °C temperature, 95% humidity, and 5% CO2.

2.2. Synthesis of ZnO NPs

For the formation of ZnO NPs, we followed organometallic compound decomposition at high temperature; in order words, the poly-ol method was used [24]. Briefly, 1.0 g of zinc acetylacetonate was added to 25 mL of diphenyl ether and 3 g of 1, 2-hexadecanediol, followed by heating to 200 °C in an inert atmosphere for 90 min. After heating for that time, we cooled the reaction mixture to room temperature, added the degassed ethanol, and separated the formed precipitate with the help of centrifugation (6000 rpm speed for 15 min). The obtained precipitate was then subjected to washing, first with hexane and then ethanol (degassed) 2–3 times in sequence, and the product after the centrifugation was dried under an inert atmosphere.
In the second step for the formation of ZnO-coated surface molecules (PEG, CTAB, and SDS), about 50 mg of ZnO NPs prepared in the first step was mixed with 0.11 g of PEG in 50 mL of distilled water [17]. Thus, the formed solution mixture was subjected to room-temperature stirring for a 3 h period or until we see the formation of a uniform dispersion of ZnO-NPs-surface-coated PEG. The solution was subjected to centrifugation (6000 rpm speed for 15 min time), and the precipitate obtained was washed with ethanol and finally dried at room temperature to form ZnO–PEG powder. In a similar way, the synthesis procedure was repeated with CTAB or SDS to form the ZnO NPs surface-coated with the other two surfactants, ZnO–CTAB and ZnO–SDS.

2.3. Instrumental Analysis

To understand the crystallinity and crystal structure of formed ZnO NPs, powder X-ray diffraction (XRD) studies were employed and for that, a Bruker-D8 instrument (Bruker AXS GmbH, Karlsruhe, Germany) that uses Cu Kα radiation (1.5406 Å), at the diffraction angle of 10–80° and a step size of 0.02°. For morphological properties, high-resolution transmission electron microscopy (HRTEM) on Tecnai G2 F20 instrument (operating at 200 kV electron acceleration voltage and 2.4 Å point to point resolution) was used, and the standard procedures for preparing the test samples are employed. The electron diffraction X-ray (EDX) analyses were carried out to investigate the elemental composition of samples using the detector connected to the HRTEM instrument. The functionality and surface bonding of ZnO NPs after coating with three different surfactants were analyzed using the Fourier-transform infrared (FTIR) spectroscopy, and for that, a Nexus 670 FTIR spectrometer operating in the transmission mode was used. For the FTIR analysis, the transparent pellets of samples are prepared by finely grinding the test material along with dry KBr powder using the press. The X-ray photoelectron spectroscopy (XPS) studies were done on an AXIS 165 high-performance multi-technique surface analyzer having a 165 mm mean radius hemispherical analyzer, operated on an eight channeltron detection system. The dynamic light scattering (DLS) technique was used for the particle size analysis, wherein the Zetasizer Nano S instrument was employed. For the UV–vis spectroscopic analysis, a SPECORD® PLUS double beam spectrophotometer was used, wherein distilled water was used as a sample dispersion medium.

2.4. Studies of Cell Viability

The effects of cell viability in vitro effects for the as-synthesized ZnO NPs (pure ZnO, ZnO–PEG, ZnO–CTAB, and ZnO–SDS) were measured on rat liver BRL-3A cells; the assay investigates the reduction of 3-(4,5-dimethylthiazol-2-yl)-2,5-diphenyltetrazolium bromide (MTT reagent, pale yellow; Sigma-Aldrich, St. Louis, MO, USA) by the viable cells into a Formazan product with a dark blue color and no changes in the non-viable cells. For the study, the normal cell concentrations (2 × 10⁴ cells per well) in a 96-well plate when reaching their confluence level were treated with the testing compounds individually at varying concentrations (25–500 µg/mL), followed by incubation for two different time intervals of 24 and 48 h. After the required incubation, we replaced the medium with the fresh one, and further, the assay protocol is in accordance with the manufacturer’s instruction, and for that, the absorbance at 570 nm was recorded. The negative controls are chosen fom cells without any sample exposure and camptothecin (30 µM; STD) as the positive control, and the IC50 values (required concentration to obtain 50% cell viability losses) were calculated.

2.5. Apoptosis Assay

The mechanism of cell death (BRL-3A cells) due to the exposure of various ZnO NPs were investigated with the help of an Annexin V-FITC (fluorescence isothiocyanate) apoptosis kit (Sigma-Aldrich, St. Louis, MO, USA); the assay involves the flow cytometric analysis of FITC-conjugated Annexin-V, as well as the propodium iodide (PI)-treated cells qualitatively and quantitatively. For the study, the ZnO NPs at their IC50 concentrations (TGA studies used to measure the exact Zn concentration in each ZnO type) were treated with the cells after reaching their confluence levels in a 6-well plate that were earlier seeded at 106 cells/well density and 24 h incubation. Then the cells were subjected to trypsinization, followed by centrifugation to generate a pellet that was re-suspended first in 100 μL of Annexin V–FITC binding buffer followed by incubation in 5 µL of Annexin V–FITC in darkness for 10 min. At this stage, the pellet was obtained by subjecting the cells to centrifugation and was re-suspended again in Annexin V–FITC binding buffer (500 μL) and PI (5 μL) in an ice bath. Then the status of the cells was analyzed by flow cytometry, making use of Cell Quest software for the investigation of apoptotic and non-apoptotic cells.

2.6. Oxidative Stress Assay

The oxidative stress status of the BRL-3A cells due to the treatment of various ZnO NPs was measured by assaying the status of reactive oxidative species (ROS) for 24 h and at IC50 concentration (similar to the apoptosis assay). The cells at 1 × 10⁵ cells/well density in a 6-well plate when reaching their confluence level were treated with the IC50 concentrations of the four ZnO NPs followed by incubation for another 24 h. After the incubation, the culturing medium was removed, washed the ZnO-treated cells with D-PBS twice, and then the cells were incubated in darkness for 30 min at room temperature by the addition of H2DFCDA (2′,7′-dichlorodihydrofluorescein diacetate; 10 µM) supplied by the manufacturer (Invitrogen™ D399; Waltham, MA, USA). As instructed by the manufacturer, all of the assay protocols were followed to finally obtain the cell pellet that was again re-suspended in D-PBS (500 µL) and further analyzed by the BD-FACS caliber.

2.7. DNA Fragmentation Assay

To understand the extent of DNA fragmentation onto the cells due to the treatment of various ZnO NPs, we measured the DNA fragments related to cytoplasmic histones, and for that, the cell-death detection ELISA kit from Roche was used. For the testing, the BRL-3A cells at 5 × 10⁴ cells (per well) concentration were plated in a 24-well plate and were exposed to four different ZnO NPs (at IC50) at their confluent levels for a 24 h period. As per the assay protocol, the ZnO-exposed cells were lysed using the buffer (200 µL) provided with the assay kit, followed by 20 µL of lysate addition to the streptavidin-coated 96-well plate and to which a reagent mixture containing the biotinylated anti-histone and peroxidase-coupled anti-DNA antibody was added. Then the cell culturing plate was incubated at room temperature (2 h), then washed, and finally quantified for the histone-associated DNA fragments from the activity of peroxidases that have been measured at 405 nm (BioTek ELx800 microplate reader, Winooski, VT, USA). Data presented is the fold-increase compared to the control measurements (cells of no treatment), and the values are shown as the mean ± SD of 3–5 independent experiments [24].

2.8. Mitochondrial Depletion Assay

The mitochondrial transmembrane potential (ΔΨm) of BRL-3A cells followed by the co-incubation of various ZnO NPs (at IC50 over a 24 h period) was accessed using the MitoCapture™ kit (Enzo Life Sciences, Inc., Farmingdale, NY, USA). In this, the assay investigates the JC-1 cyanine dye (5,5′,6,6′-tetrachloro-1,1′,3,3′-tetraethylbenzimi-dazolylcarbocyanine iodide) accumulation within the mitochondria and other cytoplasmic fractions. For the studies wherein the ΔΨm value is small, the dye exhibits green fluorescence by remaining in monomeric form, while for the higher values of ΔΨm, the formation of J-aggregates can be expected to have red fluorescence measured at 590 nm. As per the assay protocol provided by the manufacturer, the cells at their confluence levels (>80%) were exposed to four different ZnO NPs (IC50; 24 h) in a 24-well plate, and after the required incubation, we replaced the cell medium with the fresh medium with the added JC-1 dye. After 30 min of incubation, the unbound dye containing the medium was removed, washed with PBS, and then added to the fresh medium, where the fluorescence at excitation and emission wavelengths of 488 nm and 590 nm, respectively, were quantified (Spectramax EM Gemini spectrofluorimeter). The results shown are the percentage (%) change in the transmembrane potential (ΔΨm) relative to the control measurements without any sample exposure.

2.9. Statistical Analysis

All the experimental data provided are the mean ± SD (standard deviation) of at least three individual studies wherein we employed the Student’s t-test for statistical evaluation. Based on the analysis, * corresponds to the significance, p < 0.05, and ** for highly significance, p < 0.01, against the untreated controls, and for that, GraphPad Prism software (version 6) was used.

3. Results and Discussion

3.1. Physicochemical Characterization of Surface-Modified ZnO NPs

The synthesis of ZnO NPs followed two sequential steps; the first step involved the decomposition of zinc acetylacetonate at a heating temperature of 200 °C using 1,2-hexadecanediol that serves as a reducing agent and in the presence of diphenyl ether as a stabilizing agent for the formed ZnO NPs. The reducing-agent and surfactant molecules were subsequently removed from the precipitate by centrifugation using degassed ethanol and hexane. The second step involved the surface functionalization of as-synthesized ZnO NPs with the surfactant molecules (PEG, CTAB, and SDS), as shown in Table 1. The uniform dispersion of ZnO NPs surface-coated with PEG, CTAB, and SDS were separately obtained by subjecting the aqueous mixture of as-synthesized ZnO and the surfactants to stirring at room temperature. The powdered surfactants-coated ZnO NPs were finally obtained by washing the precipitate with ethanol, followed by centrifugation. The characterization carried out shows the externally coated molecules are not only modifying ZnO NPs’ size, surface, and morphological properties but also controlling the cytotoxicity potential when tested in vitro.
The ZnO NPs surface in general readily hydrolyzes to form hydroxide layers and because of the surface amphoteric nature, the particles become charged easily by the influence of either H+ or OH ions [12]. This chemistry was elucidated by the FTIR data presented in Figure 1a showing the band around 3300 cm−1 from the O–H stretching modes (water-induced) (FTIR of pure samples are provided in the Supporting Information of Figures S1–S3). The PEGylation of ZnO NPs shifted the O–H stretching modes to broader vibrational bands at 3455 cm−1, an indication of hydrogen-bonding formation between the –OH groups of ZnO and the oxygen atoms of ether groups in the PEG chain (H-bond donors) at the ZnO/polymer interface [25]. The hydrogen-bonding interactions of -OH molecules to the neighboring PEG molecules facilitate the stabilization of intermediate phases, for instance, Zn(OH)2 and impeding ZnO ROS formation [12]. The absorption peaks at 2850 cm−1 for the ZnO–PEG sample observed to be not present in the pure ZnO spectrum signified the stretching vibration of aliphatic C–H in the PEG molecules on the ZnO NPs. Similar observations were reported by Dehkourdi et al. [20] for the occurrence of bonds related to -CH groups with the coating of PEG onto the ZnO surface. The new characteristic vibrational bands at approximately 1645 cm−1, 1455 cm−1, and 1350 cm−1 in the ZnO–PEG spectrum corresponds to the asymmetric, symmetric, and bending vibrational modes of carboxylate anions that are adsorbed on the particle’s surfaces [26,27]. The small absorption bands that appeared around 1010 cm−1 and 1265 cm−1 are associated with surface-adsorbed CO2 (C-O) and H2O (O-H) in the pure ZnO spectrum and were observed to be shifted to 1055 and 1252 cm−1 on PEGylation, which further demonstrates the accuracy of hydrogen bonding [28]. The ZnO NPs stretching frequency of Zn–O bonds at 580 cm−1 related to ZnO structure’s E2 mode and were observed to remain in the same spectrum of ZnO–PEG [23]. The characteristic peak of ZnO absorption in the SDS-/CTAB-functionalized NPs shows the corresponding water O–H stretching vibration at a broad absorption band of 3334 and 3470 cm−1, respectively. The C–H stretching vibration at 2910 cm−1 and Zn-O bonds at 585 cm−1 were also observed. In the spectrum of ZnO–CTAB, the peak at 1490 cm−1 is allocated to an asymmetric stretching vibration of COO of the acetate group, while the 970–960 cm−1 peak is for the R-CH2OH group. Furthermore, the FTIR spectrum for the ZnO–SDS shows additional C–H bending vibrational bands at 1490 cm−1, S=O stretching vibration (i.e., SO4) of SDS molecule at 1224 cm−1, and C–H asymmetric and symmetric stretching frequency at 970 cm−1 and 960 cm−1, respectively [16]. The new absorption around 2600–2000 cm−1 can be linked to the CO2-related bonding.
In the spectrum of ZnO–CTAB and ZnO–SDS, the ZnO core structure is identified at 585 cm−1 and 588 cm−1 (respectively), signifying the coexistence of oxygen along with metal-terminated layers from the Zn–O bond. As compared to the bare Zn–O band at 580 cm−1, the surfactants were observed to influence the surface-bonded chemical groups that result in an absorption band difference of 5 cm−1 and 8 cm−1. Thus, the FTIR results clearly indicate the surface chemical nature of pure ZnO on functionalization with respect to the surfactants significantly influencing the Zn–O bonds’ surface layers. Samaele et al. [29] and Prasad et al. [30] described 470 cm−1 absorption peaks for SDS-modified ZnO, while Wu et al. [31] with CTAB-coated ZnO nanorods reported two characteristic absorption bands at 512 cm−1 (blue-shift) and at <500 cm−1.
The UV–vis absorption spectra of pure ZnO NPs and the surfactants-based ZnO NPs are compared as indicated in Figure 1b (UV–vis of pure samples are provided in the Supporting Information of Figure S4). From the graph, the ZnO’s characteristic absorption spectral band is found at 370–395 nm wavelength and arises from O 2p →Zn 3d electronic transitions for all the samples analyzed [28,32]. However, a significant shift in the excitonic absorption band was observed for the ZnO NPs functionalized with CTAB (395 nm) and SDS (391 nm) matched to pure ZnO (370 nm). The shift in the absorption edge to a longer wavelength indicates possible changes in the particles’ bandgap with a concomitant particle size decrease induced by the addition of surfactants [33]. Contrary to what is reported in some literature (360–378 nm) [28,32,34], the UV absorption of ZnO–PEG in this study demonstrated a different phenomenon. In addition to the absorption peak recorded at 345 nm, the ZnO’s surface functionalization with PEG in this study was observed to induce an optical absorption edge shift towards the longer wavelength (432 nm). Although the shift in the absorption peaks at 345 nm may have originated from the localized surface-controlled phenomenon of PEG molecules coated onto ZnO NP’s surface [27], the shift towards 432 nm may have originated from the transition between ionized oxygen vacancies and the valence band on the surfaces of the ZnO/polymer interface, suggesting that ZnO NP’s surface-functionalization with PEG has some defect states [35,36].
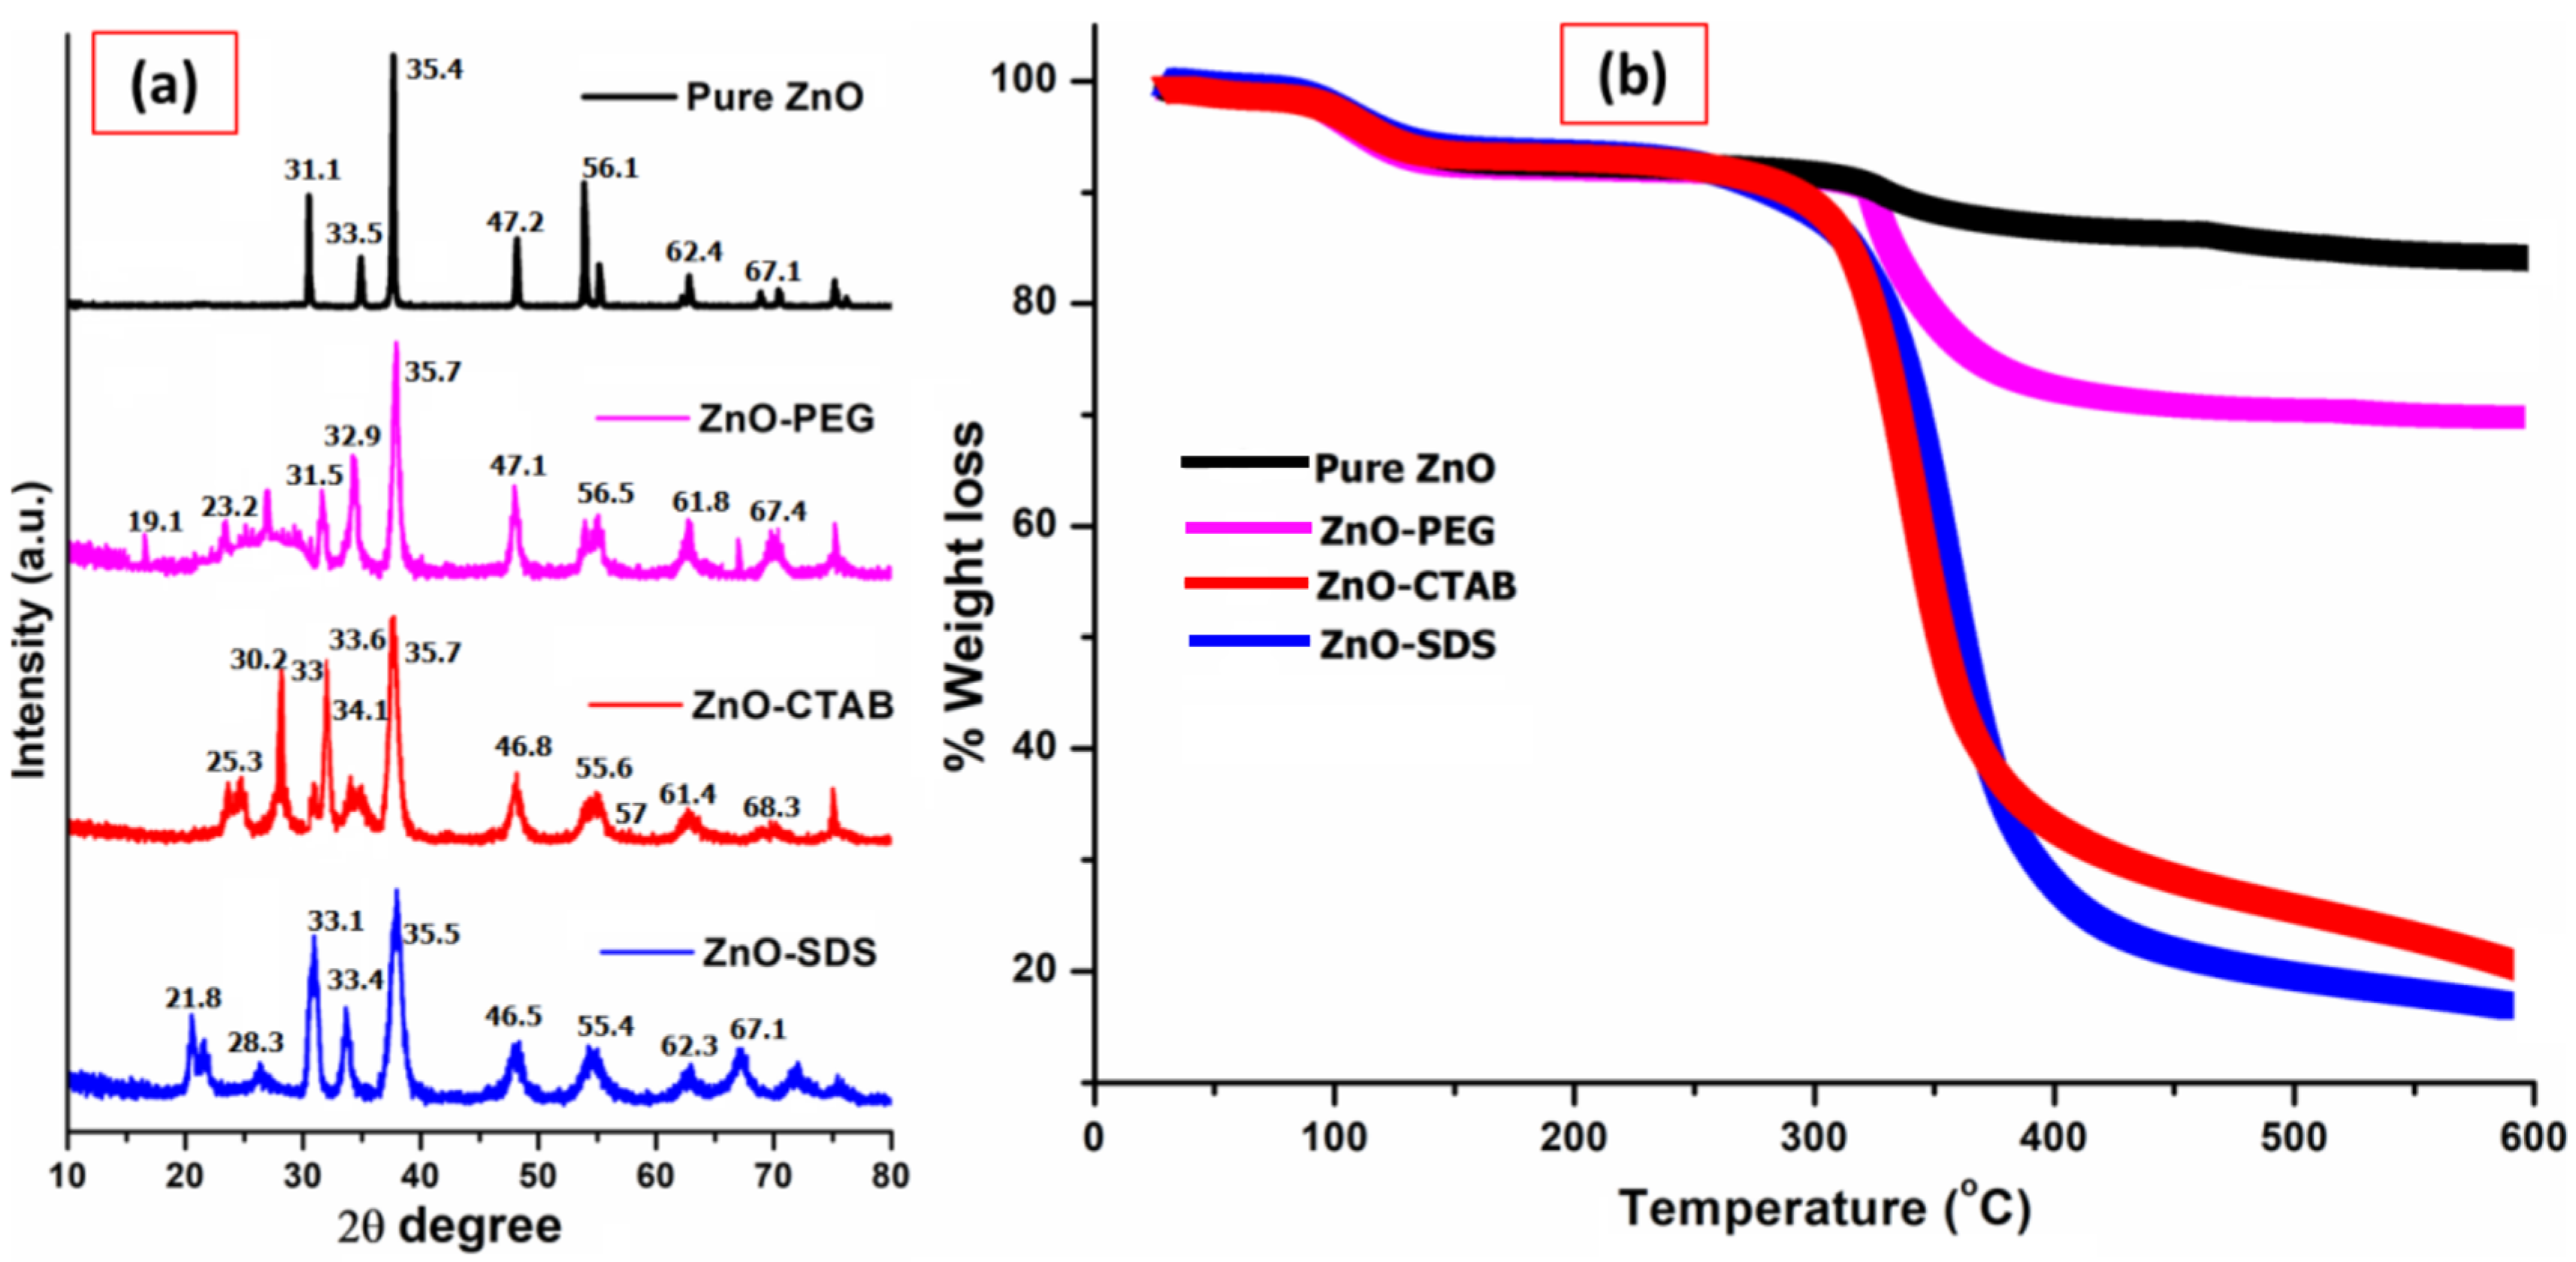
The comparison of powdered XRD patterns of various ZnO NPs is shown in Figure 2a, where the pure ZnO has the reflection pattern at 2θ of 31.2°, 33.4°, 35.3°, 47.1°, 56.2°, 62.3°, 67.0°. These diffraction patterns correspond to the characteristic structure of the hexagonal wurtzite phase for the ZnO NPs and are indexed as (100), (002), (101), (102), (110), (103), (112), respectively, in the archives of the Committee of Powder Diffraction Standards, JCPDS No. (36-1451) [32]. The more intense peak at the (101) plane indicates the high crystallinity and small particle size of ZnO crystallites [37]. The XRD patterns of surfactant-coated ZnO NPs show all of the standard diffraction patterns of ZnO; however, compared to pure ZnO, some noticeable peak intensity changes and shapes were reflected. The peaks appeared relatively to be broad, with a slight change in the intensity of diffraction plane. The changes in the intensity of the diffraction plane at (001), (002), (110), (103), and (112) indicate the formation of a ZnO/PEG interface. The peak broadening of diffraction planes according to the study reported by Parra and Haque [38] could arise from the induction of tensile strain. Furthermore, the study reported by Vidyasagar and Naik (2015) indicates the dependence of Miller indices related to the respective crystal planes. However, the effect on broadening, especially when the internal lattice strain values are very small, will have little or no impact on the structure of ZnO crystal [38] but further suggests that the particle size, as well as crystallinity, will be changed following the surfactant–surface functionalization [32,36]. Thus, the XRD patterns, despite the addition of polymers as surfactants, showed the typical crystal structure for standard ZnO NPs.
The XRD pattern of ZnO–CTAB shows an increase in the diffraction peaks intensity at (100) and (002) but also a reduction in the peak intensity for the diffraction plane at (102), (110), (103), and (112) compared to pure ZnO NPs. Similar observations were reported by Rahman et al. [39] on the growth orientation of the crystal plane at three dominant peaks, i.e., the (100), (002), and (101) planes for a ZnO NPs crystal, followed by CTAB addition. Furthermore, as mentioned earlier, ZnO is a polar crystal consisting of Zn2+ and O2 anions. On the other hand, CTAB is a cationic surfactant (CTA+ and Br ions) that can electrostatically form ion pairs CTA+ [Zn (OH)4]2− [40]. This chemistry was reported to be responsible for the surface-controlled defect potentials of ZnO [41]. In a similar way, for the ZnO–SDS sample, some studies reported the effectiveness of SDS in the formation of a bare crystalline phase by acting as a growth template in the functionalization of ZnO NPs [42]. Since SDS has S=O groups that could act as proton receptors, and, in aqueous solution, they ionize into Na+ (S) and CH3(CH2)11OSO3 (DS). The formed ions in contact with the polar faces of ZnO reduce its surface defects and facilitate the formation of small crystalline particles [42]. Ahson et al. (2020) observed that the hydrothermal growth with SDS favored the formation of small crystalline ZnO NPs, i.e., the bare polar planes of ZnO favor the formation of more oxygen vacancies [43]. The electrostatic attraction among the groups of ZnO and SDS with their negatively charged sulfate groups inhibits the potential oxygen vacancies formation at the polar planes and suppresses the growth of ZnO crystals in the axial direction [43,44]. This process was also reported to help in controlling the surface-induced ZnO NPs’ toxicity. According to the study, the sulfate ions of SDS act as polar surfactants that enveloped the ZnO by forming micelles and thereby suppressing the charges on the ZnO surface, restricting the crystal growth and surface defect [44].
The direct detection and thermal stability of the extent of surface functionalization for the ZnO NPs were determined by thermal analysis in the temperature range up to 600 °C. From the TGA graph shown in Figure 2b, ~7% weight loss attributed to the evaporation of water-induced -OH species in the pure ZnO NPs and was observed at approximately 100 °C. The surface functionalization of ZnO NPs with surfactants revealed two different weight-loss phenomena; the evaporation of water-induced -OH species occurring at a temperature range of 98 to 150 °C and further 30.4% weight loss at a temperatures range of 325 to 440 °C for the ZnO–PEG. The loss in weight at this temperature range could be associated with the decarboxylation of carbonyl groups. The ZnO–PEG displayed thermal stability after 450 °C and up to 600 °C and retained around 61.9% of its initial weight. Tavakoli et al. [45] reported 32.2% weight loss following the thermal analysis of PEGylated ZnO NPs manufactured by the mechanical method. The thermal analysis of ZnO–CTAB and ZnO–SDS shows similar thermal behaviors, showing a major leap at the 300 to 500 °C temperature range. The TGA curve of ZnO–CTAB shows a 45% drop in weight at this temperature range and gradually levels up to 600 °C either from the decarboxylation of carboxylate groups or from the loss of CO2. The highest weight loss of 70% at this temperature was observed in the TGA data for ZnO–SDS. The observation of pure ZnO NPs’ thermal stability up to 600 °C is an indication of the persistence of Zn2+ ions in the composite. The temperature range of 300 to 500 °C is linked to the coated surfactant degradation and is observed to have relatively high adsorption bonds exerted with the ZnO NPs. Samaele et al. [29] and Ramimoghadam et al. [16] reported almost similar temperatures (577–900 °C) for SDS-/CTAB-coated ZnO NPs. It will suffice to conclude that the thermal behavior of surfactants on the ZnO NPS with the observed cumulative weight loss of 56%, 60%, and 78% for ZnO–PEG, ZnO–CTAB, and ZnO–SDS (respectively) could serve as a proof for the successful surface adsorption of the surfactants onto ZnO NPs.
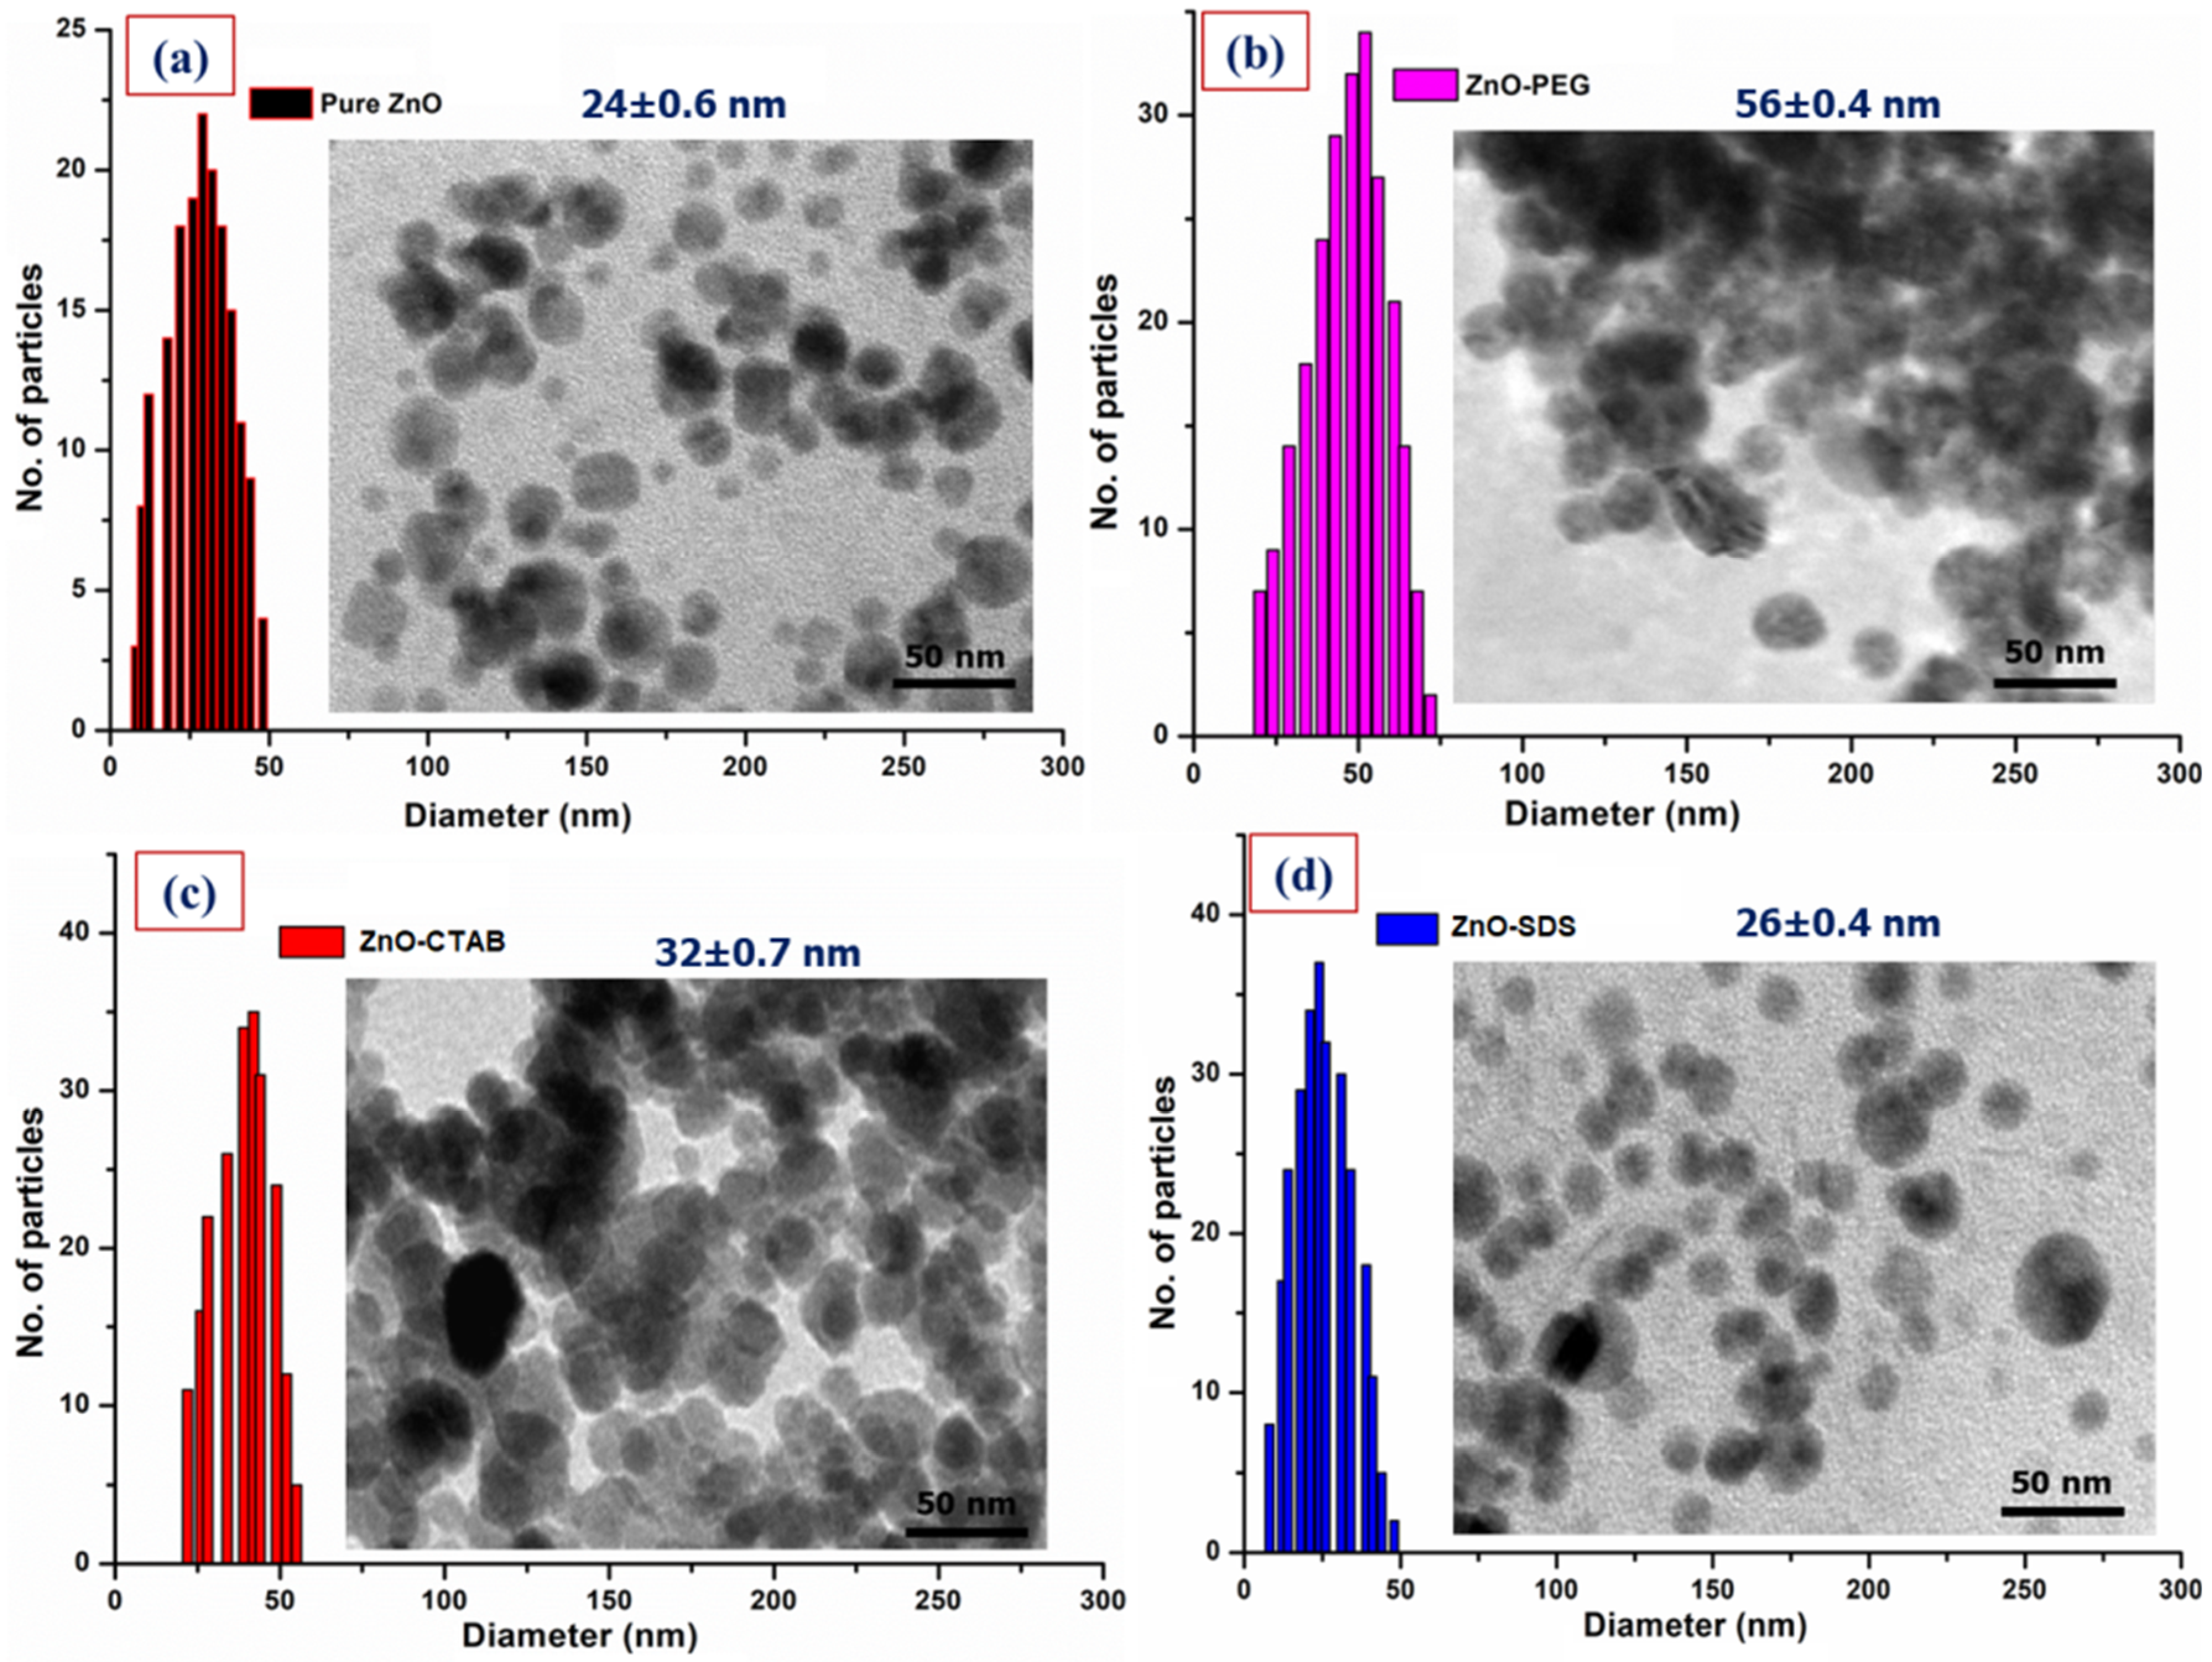
Figure 3 provides the changes in the morphology of pure ZnO NPs with the surfactants-doped ZnO NPs by the HRTEM images. From Figure 3, the micrograph of pure ZnO NPs showsa nearly spherical morphology, with many discrete and irregular grain sizes with an average diameter of 24 ± 0.6 nm. For example, Kayani et al. [46]’s study shows the formation of ZnO grains in a non-spherical shape and a faceted morphology originating from the crystallographic symmetry of the Wurtzite ore of ZnO. On surface functionalization with PEG and CTAB, an increase in the particle size/shapes loosely clustered around each other was observed. The micrograph of CTAB-coated ZnO with an average grain size of 32 ± 0.7 nm shows improved morphology and is less aggregated compared to that of ZnO–PEG. The ZnO–PEG surface consists of many irregular and discrete grains with an average particle size of 56 ± 0.4 nm. The irregular shapes and varying particle sizes could be associated with physical-force-induced agglomeration [47]. A spherical and ellipsoid NPs with different shape and size distributions are reported for ZnO modifying PEG synthesis by the precipitation route. According to a study by Anandan et al. [36], the FESEM/HRTEM image recorded after the inclusion of PEG with ZnO NPs gives rise to varying morphologies along with slight agglomeration. Pranjali et al. [48] reported the synthesis of well-dispersed spherical-shaped ZnO NPs with some elongated particles in the 20 to 50 nm size range. On surface functionalization with PEG, the author reported a small degree of aggregation with 31 ± 8 nm mean diameter.
Medina et al. [49] used CTAB to restrict ZnO NPs’ size during synthesis; the CTAB in the synthesis was observed to produce secondary particles with an irregular morphology and sizes ranging between 100 and 200 nm. The formation of non-uniform morphology and particle size were further reported to be connected to the CTAB’s critical micelle concentration (CMC). A further increase in the CTAB concentration at ZnO’s surface led to large-clusters formation, and the study reported the cause to be CTAB’s aggregation. The report by Oleszczuk et al. [21] indicated the distinct connections between ZnO NPs aggregates formed by the CTAB. The aggregate sizes were observed to increase significantly after 48 h on the addition of CTAB. The HRTEM for the ZnO–CTAB was observed to be less aggregated compared to the ZnO–PEG. Wu et al. [50] reported that the addition of 0–6 wt% CTAB reduces the surface defects of ZnO. According to the study, this can be attributed to the formation of chemical bonds via bromide ions (Br) occupying the oxygen vacancies in the lattice structure of ZnO. The spherical shape of ZnO crystals was, however, observed to improve on surface functionalization with SDS. The HRTEM image of ZnO–SDS shows dispersive and spherical-shaped morphology, with 26 ± 0.4 nm as average particle size. Surface functionalization using SDS was observed to influence the size and morphology of ZnO NPs, showing dispersed NPs with a spherical shape [51]. Similarly, Dianqing et al.’s [52] sol-gel method uses SDS as a surface modifier that can control the growth/Ostwald ripening of ZnO particles that were observed to essentially produce less aggregated but spherical morphology with ~6 nm average particle size. The adsorption of SDS on the hydrozicite surface as observed from the FTIR vibrational bands at 1224 cm−1 for sulfate group (–OSO3) in this study influences the ions diffusion among the grain boundaries, thus, deterring the agglomeration and bonding of ZnO NPs [51].
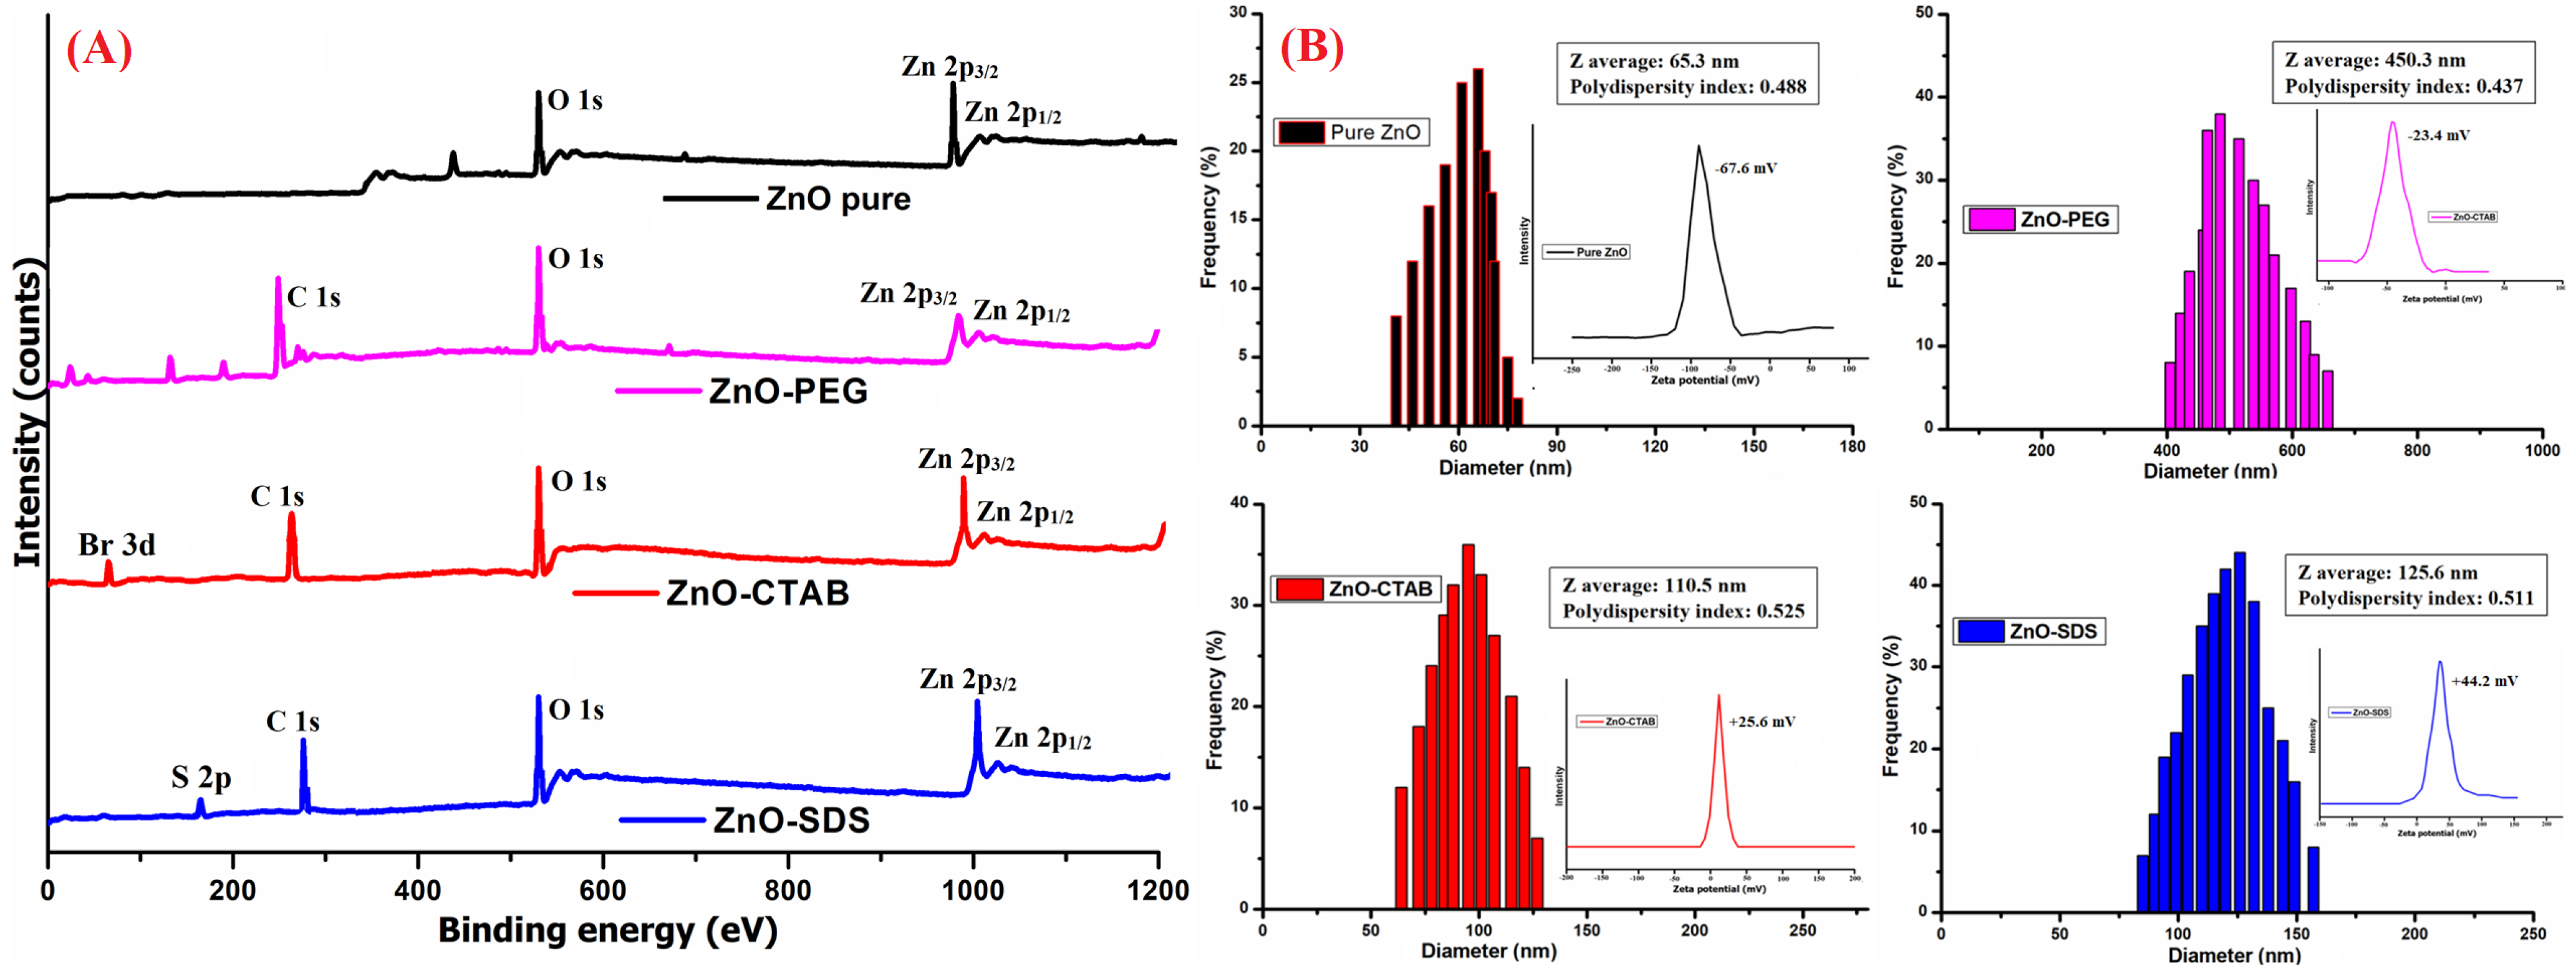
The XPS studies were performed to understand the oxidation state of Zn and its interactions with the surface-coated molecules. As shown in Figure 4A describing the Zn 2p spectrum of ZnO, ZnO–PEG, ZnO–CTAB, and ZnO–SDS, the presence of a normal chemical state for the Zn2+ ion can be identified in all four samples. However, a slight shift in the Zn 2p binding energy is reflected in the surfactant-functionalized ZnO NPs, suggesting the formation of a ZnO/polymer interface. The O1s spectrum observed in the pure ZnO NPs could be associated with representing the oxygen vacancy and hydrogen–oxygen group coated onto the ZnO’s surface [53]. The carbon C 1s peak at 284–288 eV binding energy of could be associated with the binding energy of C-C, C-O, or C=O [54]. The observed increase in the C-O peak, the reduction in Zn 2p3/2 peaks, and the appearance of the C 1s peak in the ZnO–PEG spectrum confirmed the successful PEGylation of ZnO NPs. This observation is supported by similar studies, like the study by Singletary et al. [54], which proved the effective PEGylation of Zn NPs and reported a rise in the profusion of the C-O peak and a reduction in the binding energy of Zn 2p3/2 peaks. The XPS spectra of ZnO–CTAB show the characteristic peaks of Zn 2p3/2 and 2p1/2, respectively. The doping with CTAB slightly decreases the intensity of Zn peaks, indicating the successful functionalization of ZnO with CTAB. Furthermore, the Br 3d XPS peaks in the ZnO–CTAB sample confirm the presence of Br on the ZnO surface. According to the study by Wu et al. [50] reporting that the CTAB’s bromide anions to occupy the oxygen vacancies in the ZnO crystal and further that the addition of 0–6 wt% CTAB reduces the surface defects of ZnO. In addition to Zn 2p3/2, C 1s, and O 1s peaks, the S 2p core level peaks were also reflected in the ZnO–SDS spectrum.
The availability of large surface-to-volume ratios and uncompensated charged ions/groups are the general characteristic of NPs. Furthermore, the availability of OH groups onto the ZnO NPs’ surfaces were identified by the FTIR analysis, and at the same time, the XPS data indicated the presence of Zn2+ and oxygen vacancy or the hydrogen–oxygen group through the peaks for Zn 2p3/2 and 2p1/2 and O 1s (respectively). These charged particles in the surfactant’s presence modify the net surface charge density of ZnO NPs, the electric potential, and their interparticle interactions [55]. As shown in Figure 4B, the surface functionalization of ZnO NPs with the surfactant induces changes to the zeta potential of ZnO–PEG, ZnO–CTAB, and ZnO–SDS NPs. The surfactant binding resulted in a sharp change of zeta potential from −67 mV (of pure ZnO) to −23 mV, +25.6 mV, and +44.2 mV for ZnO–PEG, ZnO–CTAB, and ZnO–SDS NPs, respectively. The ZnO NPs’ hydrodynamic sizes showed some correlation to their surface charges with the surfactant-functionalized ZnO NPs forming relatively larger hydrodynamic sizes compared to the bare charged ZnO (65.3 nm). The PEG coating on the ZnO’s surface negatively shifted the zeta potential below −30 mV, 30 mV for CTAB, and above 30 mV for SDS and was further observed to extend the stability of the ZnO suspension in the order of ZnO–SDS ˃ ZnO–CTAB ˃ ZnO–PEG.
Several phenomena are reported to influence the nature of zeta potential, including a difference arising from the higher viscosity of surfactant molecules, to shift in the slippage plane far away from the surface [56] and the active-site blockage by polymer chain adsorption [57]. The contribution of the effect of surface functionalization could also be seen from the obtained zeta potentials, favoring the formation of dispersed particles as recorded in the HRTEM images of ZnO–SDS, followed by ZnO–CTAB and ZnO–PEG. The high zeta potential indicates the induction of steric or electrostatic repulsion of ions in solution, which was also reported to exert a direct relationship to the superficial charge density and the stability of aggregates [47]. The polydispersity index (PDI) with values lesser than 0.05 are particularly seen with highly dispersed standards and assumed a broader size distribution if these values are greater than 0.7 [58]. The PDI recorded in this study for all the samples ranging from 0.4 to 0.5 suggests a relatively dispersed sample with respect to the particle size. The diameter of ZnO NPs (65.3 nm) were observed to increase on surface functionalization, showing 450.3 nm for ZnO–PEG, 110.5 nm for ZnO–CTAB, and 125.6 nm for ZnO–SDS NPs.

3.2. In Vitro Molecular Biology Studies

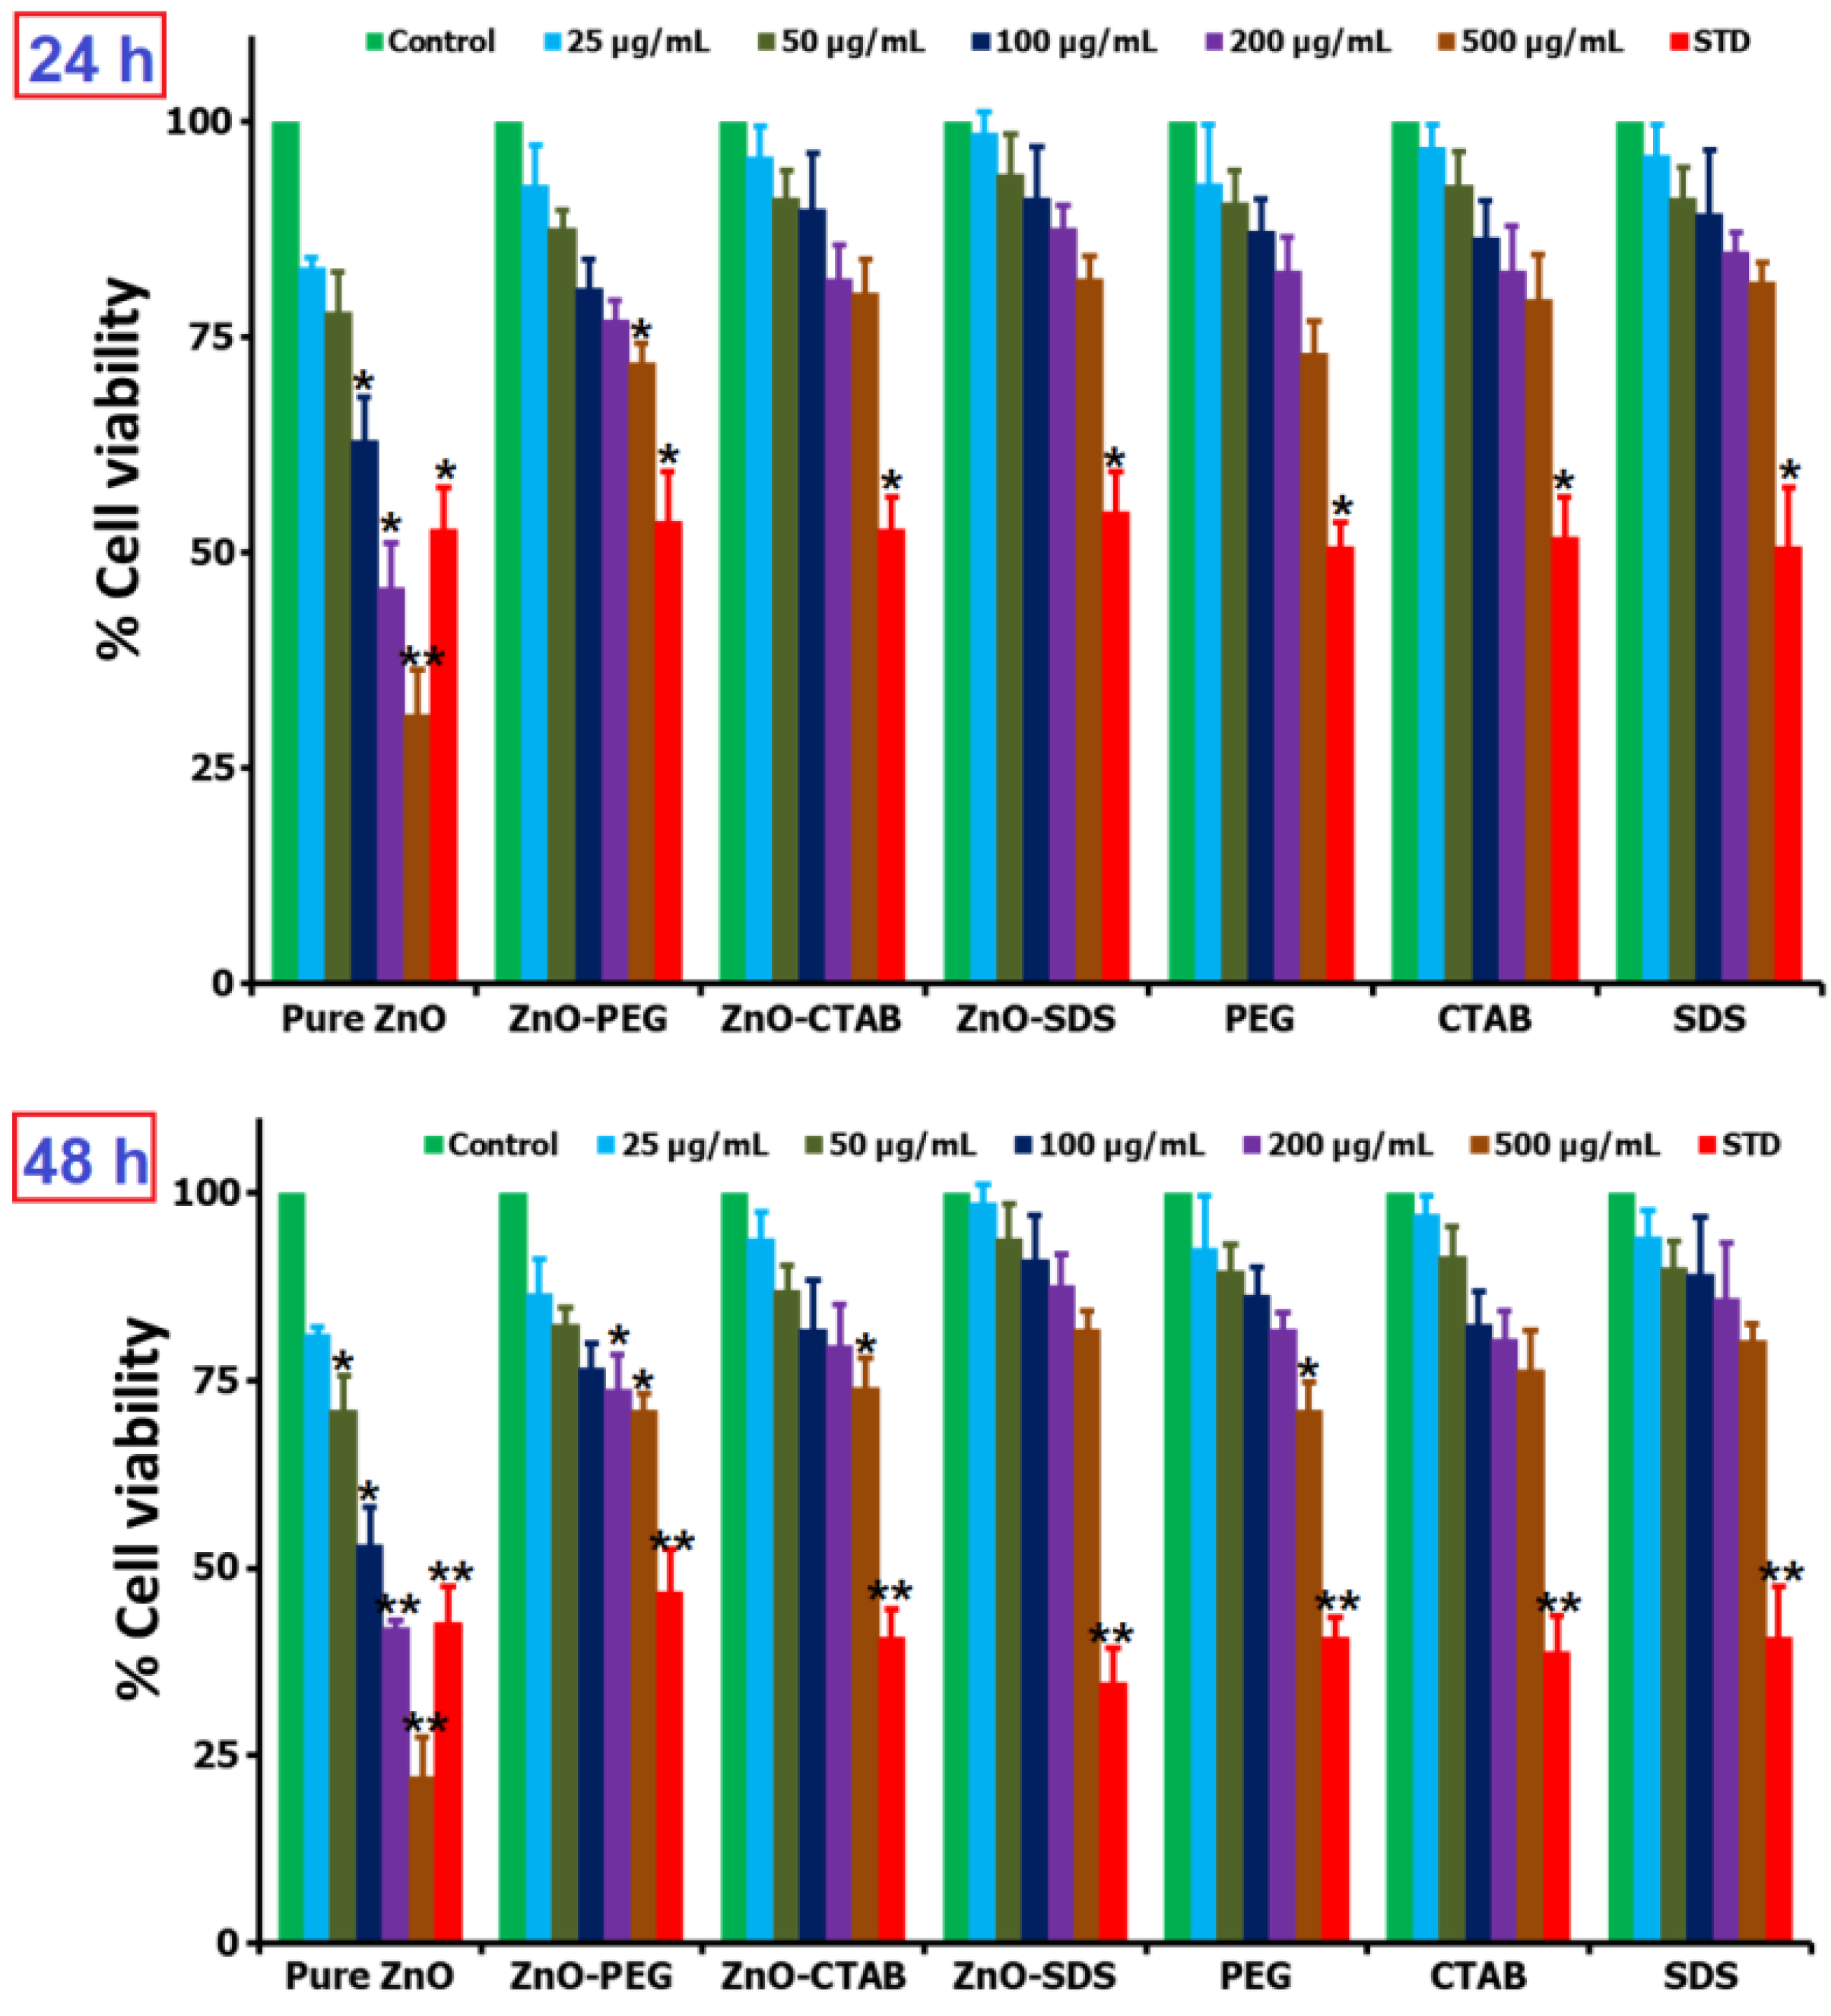
The profiling of the ZnO-toxicity-mediated chemistry and the influence of surfactant–surface functionalization underscore the importance of this study and calls for further discussion into chemistry in relation to the size, shape, and surface chemistry of NPs, which have been reported in several studies to be underlying factors that determine the toxicity behaviors of ZnO NPs [59]. The surfactants play a significant role as structure-directing agents, modifying ZnO NPs’ size, shape, and morphology from micro to nano and into rods, sheets, spheres, flakes, flowers, and triangular-like particles [56]. The SDS and CTAB were reported to show a time-dependent increase of ZnO–surfactant complex sizes, which, according to the study, influences the toxicity thresholds [21]. As reviewed in Lia et al. (2020), the spherical-shaped ZnO NPs having a larger surface area are reported to release more Zn2+ ions than tetrapods in normal human dermal fibroblasts and are described to show size- and dose-reliant cytotoxicity. Thus, ZnO NPs due to their high surface reactivity from the larger surface areas could easily trigger the production of ROS. The particle size, surface available charges, and hydrophilicity of NPs were reported to influence their reactivity with the biological milieu. Studies showed that the functionalization of NPs’ surface with surfactants creates an envelope or barrier layer around the NPs, deterring the adhesion of NPs with the macrophage cells [60]. This was observed in a study wherein 9% of PEGylated nanospheres were opsonized by cells compared to over 15% absorbed by the non-PEGylated nanospheres [61]. The murine macrophage cellular uptake of surfactant-covered metal NPs was also reported to be significantly lower compared with the bare NPs, reviewed in [62]. The ZnO NPs adsorbed SDS’s anionic group, establishing hydrophobic layers of SDS on the ZnO NPs’ surface. This chemistry according to Liu et al. [63] could inhibit the exchange between the ions of ZnO NPs and slow down the release of Zn2+. The release of Zn2+ ions was further reported to be responsible for pure ZnO NPs’ toxicity [62]. To further characterize the role of surfactants in reducing the ZnO-mediated toxicity, BRL-3A rat liver cells exposed with the surfactant–ZnO NPs and pure ZnO NPs were subjected to MTT-based assay, and the results are presented in Figure 5.
In the study, BRL-3A cells were separately exposed to pure ZnO, ZnO–PEG, ZnO–CTAB, and ZnO–SDS NPs at varying concentrations (25, 50, 100, 200, and 500 µg/mL) incubated for 24 h; according to the results, all showed dose-dependent cytotoxicity. The pure ZnO NPs considerably lowered the cell viability, with the group exposed to 200 and 500 µg/mL reducing the viable-cells number by <50%. In a separate study, the primary astrocytes cultured in 8 or 12 μg/mL of ZnO NPs examined by MTT assay were observed to significantly decrease the cell viability after 12 or 24 h of exposure in a dose- and time-dependent manner [64]. Lu et al. [5] also reported the same dose-reliant cytotoxicity in human THP-1 immune cells treated with pure ZnO NPs. The cell viability of SKOV3 cells incubated for 24 h were reported by Bai et al. [65] to significantly decrease on contact with 20 and 30 μg/mL ZnO NPs. The occurrence of ZnO NP-mediated toxicity is primarily through the oxidative injury and release of inflammatory mediators triggered by the surface-induced ROS [66] and credited to Zn to free Zn2+ ions dissolution [67]. The surface-functionalization of ZnO NPs with the surfactants was observed to markedly reduce the cytotoxicity effect on the BRL-3A cells. The ZnO–PEG was observed to show cell viability of ~95–70% in a dose-dependent manner. Furthermore, some similar reports were reported by Lu et al. [5] showing the PEGylated ZnO NPs at 100 mg/mL, exhibiting reduced cytotoxicity compared to pure ZnO NPs. However, in this study, the ZnO–CTAB and ZnO–SDS NPs, compared to ZnO–PEG, were observed to impact fewer cytotoxicity effects on the cell lines tested. At a low dose of 25 and 50 µg/mL, the viable-cells number is almost comparable to that of the negative control groups. The MTT assay showed that an increase in the dose up to 500 µg/mL minorly impacts the cytotoxic effect, retaining nearly 76% and 80% of the cells treated with ZnO–CTAB and ZnO–SDS NPs, respectively. The groups exposed to 25 µg/mL ZnO–SDS exerted <1% cytotoxic effect, and in this study, the impact of surfactants in controlling/reducing the cytotoxicity were observed to follow the trend ZnO–SDS > ZnO–CTAB > ZnO–PEG even after 48 h. The effect of SDS in reducing the toxicity of ZnO NPs on cell lines after 24 h of incubation were observed to be the same even after 48 h of incubation, i.e., functioning in a dose-determined manner. As demonstrated in the Figure 5, the toxicity effects on cells lines are observed to follow the reducing trends ZnO–SDS < ZnO–CTAB < ZnO–PEG < pure ZnO NPs in a dose-dependent manner. The calculated IC50 values for both 24 and 48 h of incubations are 220 and 95 µg/mL for pure ZnO NPs, 715 and 730 µg/mL for ZnO–PEG, 840 and 800 µg/mL for ZnO–CTAB, and 890 and 880 µg/mL for ZnO–SDS NPs.
Similarly, the apoptosis assay results (provided in Figure 6) are examined to follow a analogous trend with the MTT study results. The flow cytometry machinery revealed a pattern, showing the percentage of viable cells and cells undergoing apoptosis/necrosis. The pure ZnO NPs, compared to the surfactant-based ZnO NPs, showed a higher percentage of apoptotic cells (60.7%). Ng et al. [66] reported that the ZnO NPs can exert significant levels of toxicity effects onto the MRC5 cells through the apoptotic pathway to finally cause cell death. In this study, the NPs trigger the release of proapoptotic protease (caspase 2). Similar to the role surfactant played in reducing the cytotoxicity of ZnO established through the MTT assay, the surface functionalization of ZnO NPs with PEG was also observed to reduce the number of cells undergoing apoptosis to only 3.4%. Furthermore, a resounding reduction in apoptotic cells number were also seen in groups treated with ZnO–CTAB (1.5%) and ZnO–SDS (0.60%). The results of the Annexin assay agrees with the outcome from the MTT assay showing a reduction in the apoptotic-cells number following the trend of ZnO–SDS < ZnO–CTAB < ZnO–PEG < pure ZnO. Oleszczuk et al. [21] in a separate experiment observed that CTAB and SDS profoundly reduce the toxicity of ZnO NPs toward Daphnia Magna, showing nearly 100% toxicity reduction for CTAB-treated ZnO and >60% toxicity reduction for SDS-treated ZnO NPs.
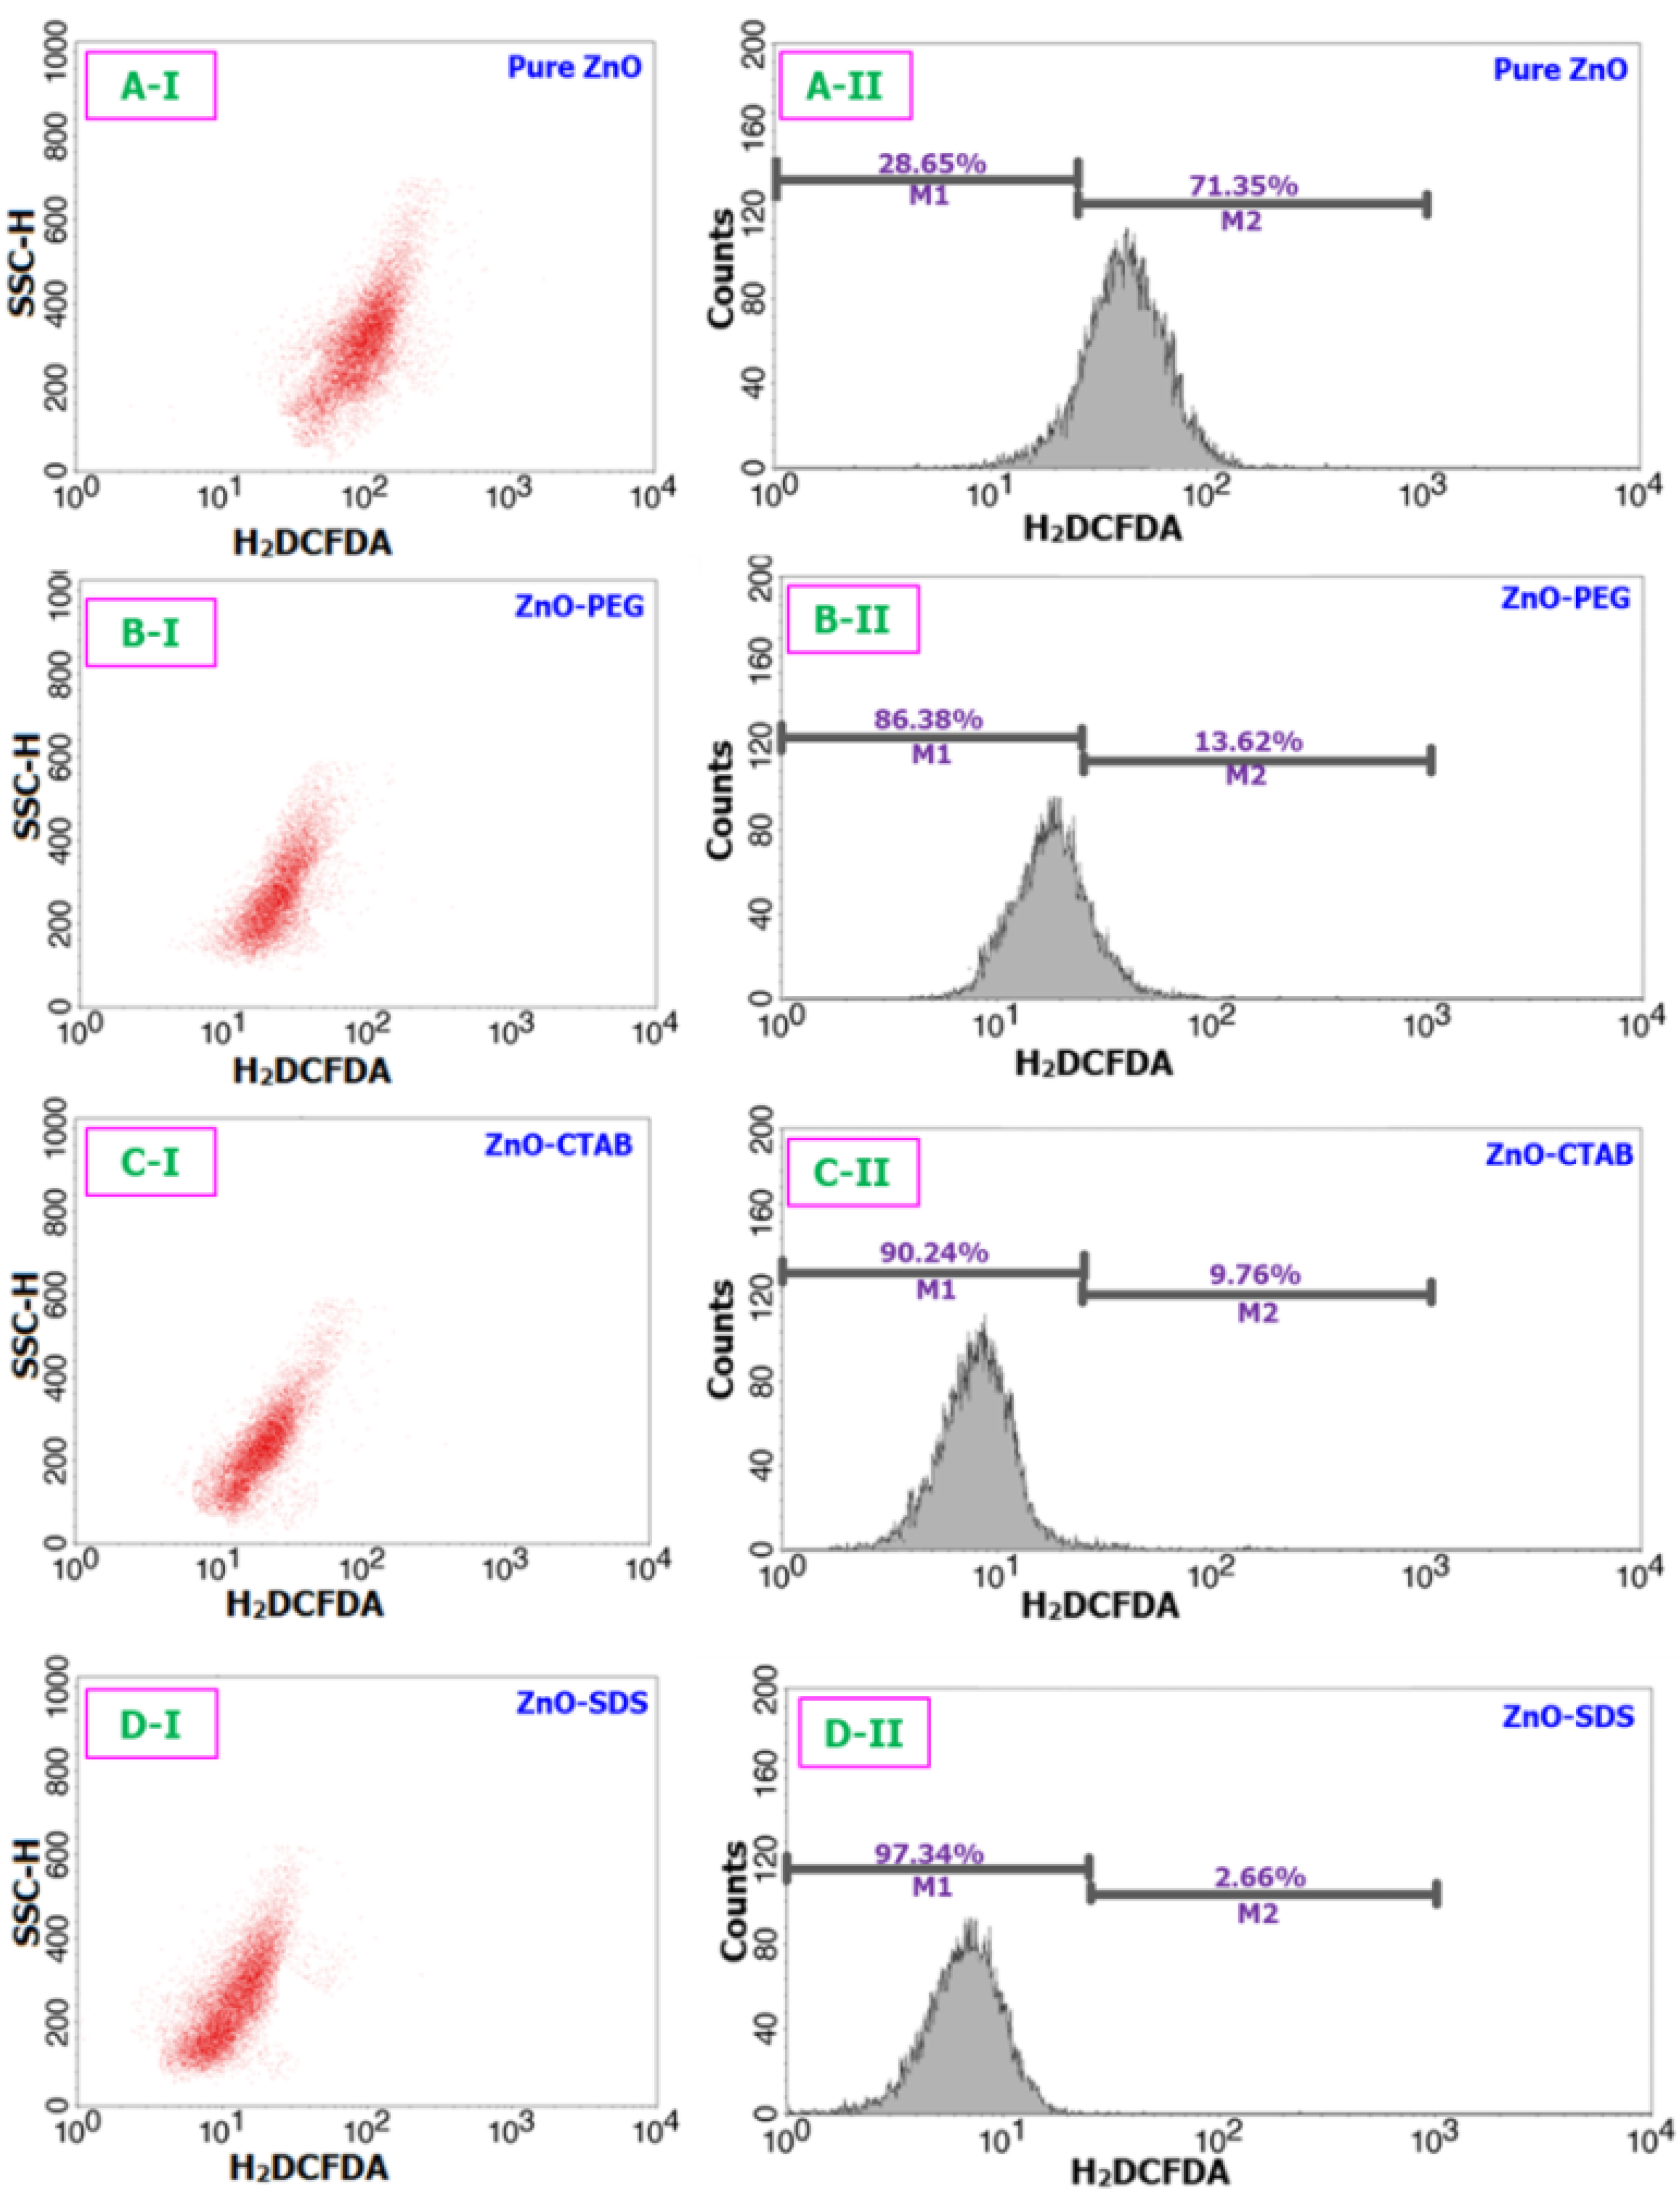
A body of research findings linked ROS-oxidative stress to ZnO-mediated toxicity [66]. High levels of ROS deplete anti-oxidative enzyme potentials and regulate the phosphorylation, translocation, and cleavage of pro-apoptosis families that mediate the induction of apoptosis [19]. Based on the findings from the cell viability studies, we reached the postulated outcome that the ZnO NPs could affect the intracellular ROS levels in the BRL-3A cells. Thus, we went further in the investigation to assess the role surfactants played in controlling the ZnO-induced intracellular ROS generation. As presented in Figure 7, the pure ZnO NPs-exposed cells significantly increased the content levels of ROS by 71.3% within 24 h of incubation. However, the representative flow-cytometry-based ROS patterns on doping with surfactants profoundly suppressed the ROS generation potentials of ZnO NPs. The quantification shows only 13.6%, 9.7%, and 2.6% of ZnO-induced intracellular ROS generated by the BRL-3A cells treated with the ZnO–PEG, ZnO–CTAB, and ZnO–SDS, respectively.
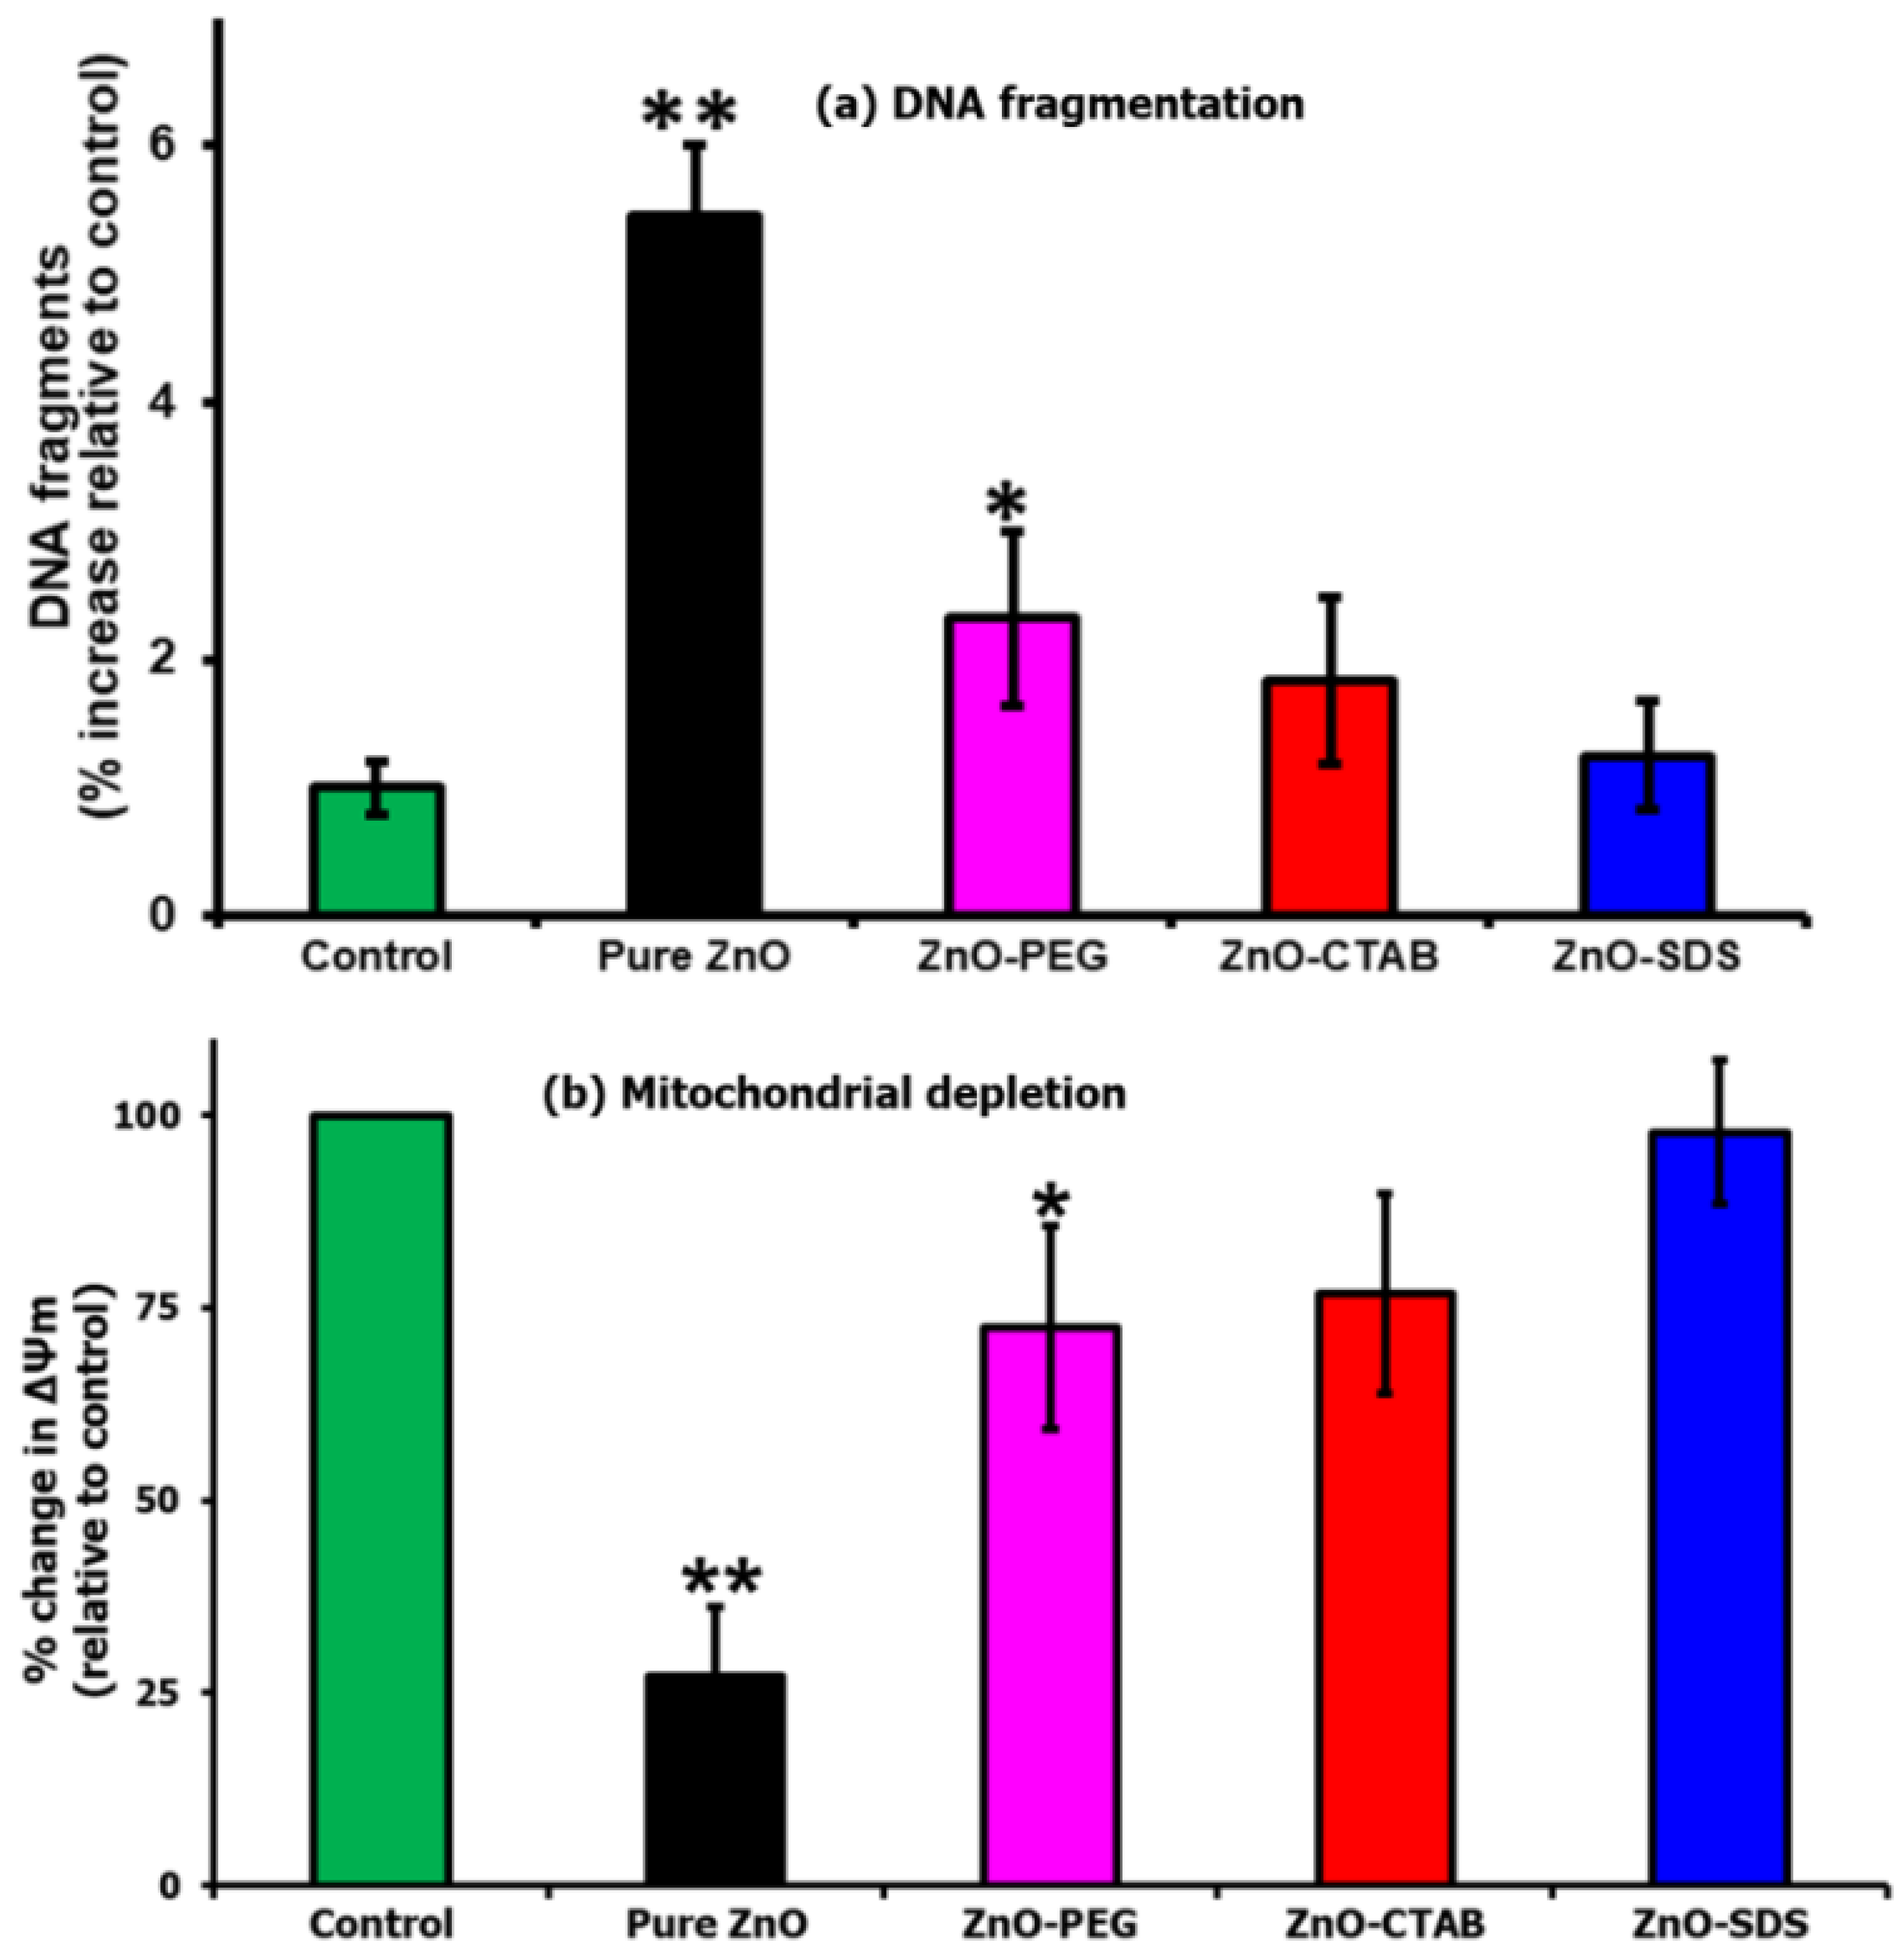
An enrichment of free radical species leads to oxidative stress and the impairment of cellular redox balance. This imbalance triggers oxidative damage, alters membrane permeability, and facilitates DNA damage [68]. The findings of the present study proved that the pure ZnO NPs showed a higher level of ROS, and such levels were reported in several related studies to impair the redox balance and enhance DNA fragmentation [65]. The results presented in Figure 8a shows the machinery of ZnO-induced ROS oxidative stress to induce the accumulation of DNA double-strand breaks. These features were not pronounced in the cells which were treated with surfactant-coated ZnO NPs. Furthermore, the surfactants were observed to slow down the induction of DNA fragmentation, with the ZnO–SDS-treated cells exhibiting a remarkable impairment of DNA damage, followed by ZnO–CTAB and ZnO–PEG. In addition to DNA breaks, ROS at higher levels were also reported to impair redox balance and induce mitochondrial dysfunction by reacting with membrane lipids [65]. Wang et al. [64] reported that pure ZnO NPs decreased mitochondrial membrane potential and induced ROS-mediated apoptosis in astrocytes. These findings draw the obvious conceivable conclusion to further evaluate the activity of ZnO-mediated toxicity on the mitochondrial membrane integrity, considering the high level of ROS-mediated apoptosis and DNA break earlier reported in Figure 7 and Figure 8a. In this study, the pure ZnO NPs-exposed cells as shown in Figure 8b exhibited a marked impairment of mitochondria potentials. The results also show that the ZnO–surfactants-treated cells were able to establish redox balance by slowing down the generation of ROS and hence the impact on the mitochondrial membrane potential. Remarkable performance was observed in the order of ZnO–SDS > ZnO–CTAB > ZnO–PEG.

4. Conclusions

In the study, the surface chemistry of ZnO NPs was successfully modified and functionalized with surfactants. The pure ZnO showed a higher percentage of apoptotic cells, compromised the structural integrity of the membrane potential of mitochondria, and facilitated the induction of DNA fragmentation in a dose-determined manner. The as-synthesized ZnO–PEG, ZnO–CTAB, and ZnO–SDS, on the other hand, profoundly reduced the ZnO-mediated toxicity by inhibiting ROS formation, observed to be the key drivers for reduced cell viability, DNA fragmentation, and mitochondrial depletion. The inhibitory properties of surfactants follow the trends ZnO–SDS > ZnO–CTAB > ZnO–PEG. From the study results, clear-cut experimental evidence was obtained on the surface functionalization of ZnO NPs with either non-ionic, cationic, or anionic surfactants, which will not only improve biocompatibility but also have the properties of counteracting the ROS-mediated chemistry by reducing the oxidative behaviors typical of pure ZnO NPs.

Supplementary Materials

The following supporting information can be downloaded at: https://www.mdpi.com/article/10.3390/coatings13010172/s1, Figure S1: FTIR spectral analysis of pure PEG sample; Figure S2: FTIR spectral analysis of pure SDS sample; Figure S3: FTIR spectral analysis of pure CTAB sample; Figure S4: UV-Vis spectral analysis of pure samples of CTAB, PEG, and SDS.

Author Contributions

Conceptualization, F.M.; methodology, F.M. and I.B.B.; investigation, F.M. and I.B.B.; validation, formal analysis, and data curation, F.M., I.B.B., J.P.S. and H.H.A.-T.; resources, H.A.A.-L. and A.A.S.; writing—original draft preparation, F.M. and I.B.B.; writing—review and editing, F.M. and I.B.B.; supervision, H.A.A.-L.; project administration, F.M. and H.A.A.-L.; funding acquisition, H.A.A.-L. All authors have read and agreed to the published version of the manuscript.

Funding

The authors extend their appreciation to the Deputyship for Research & Innovation, Ministry of Education in Saudi Arabia, for funding this research work through project no. (IFKSURG-2-1586).

Institutional Review Board Statement

Not applicable.

Informed Consent Statement

Not applicable.

Data Availability Statement

The data can be available from the first and corresponding author upon the requirement.

Acknowledgments

Deputyship for Research & Innovation, Ministry of Education in Saudi Arabia, through project no. (IFKSURG-2-1586).

Conflicts of Interest

The authors declare no conflict of interest with this work.

References

  1. Zhang, Y.; Nayak, T.R.; Hong, H.; Cai, W. Biomedical Applications of Zinc Oxide Nanomaterials. Curr. Mol. Med. 2013, 13, 1633–1645. [Google Scholar] [CrossRef] [PubMed] [Green Version]
  2. Długosz, O.; Szostak, K.; Staroń, A.; Pulit-Prociak, J.; Banach, M. Methods for Reducing the Toxicity of Metal and Metal Oxide NPs as Biomedicine. Materials 2020, 13, 279. [Google Scholar] [CrossRef] [PubMed] [Green Version]
  3. Sruthi, S.; Ashtami, J.; Mohanan, P.V. Biomedical application and hidden toxicity of Zinc oxide nanoparticles. Mater. Today Chem. 2018, 10, 175–186. [Google Scholar] [CrossRef]
  4. Zhang, Y.; Chen, W.; Wang, S.; Liu, Y.; Pope, C. Phototoxicity of zinc oxide nanoparticle conjugates in human ovarian cancer NIH: OVCAR-3 cells. J. Biomed. Nanotechnol. 2008, 4, 432–438. [Google Scholar] [CrossRef]
  5. Luo, M.; Shen, C.; Feltis, B.N.; Martin, L.L.; Hughes, A.E.; Wright, P.F.A.; Turney, T.W. Reducing ZnO nanoparticle cytotoxicity by surface modification. Nanoscale 2014, 6, 5791–5798. [Google Scholar] [CrossRef]
  6. Bwatanglang, I.B.; Mohammad, F.; Yusof, N.A. In Vivo tumor targeting and anti-tumor effects of 5-fluororacil loaded, folic acid targeted quantum dot system. J. Colloid Interf. Sci. 2016, 480, 146–158. [Google Scholar] [CrossRef]
  7. Limo, M.J.; Ramasamy, R.; Perry, C.C. ZnO Binding Peptides: Smart Versatile Tools for Controlled Modification of ZnO Growth Mechanism and Morphology. Chem. Mater. 2015, 27, 1950–1960. [Google Scholar] [CrossRef]
  8. Noguera, C. Polar Oxide Surfaces. J. Phys. Condens. Matter 2000, 12, R367–R410. [Google Scholar] [CrossRef]
  9. Meyer, B.; Marx, D. Density-functional study of the structure and stability of ZnO surfaces. Phys. Rev. B Condens. Matter Mater. Phys. 2003, 67, 035403. [Google Scholar] [CrossRef] [Green Version]
  10. Diebold, U.; Koplitz, L.V.; Dulub, O. Atomic-scale properties of low-index ZnO surfaces. Appl. Surf. Sci. 2004, 237, 336–342. [Google Scholar] [CrossRef]
  11. Shewale, V.; Joshi, P.; Mukhopadhyay, S.; Deshpande, M.; Pandey, R.; Hussain, S.; Karna, S.P. First-principles study of nanoparticle−biomolecular interactions: Anchoring of a (ZnO)12 cluster on nucleobases. J. Phys. Chem. C 2011, 115, 10426–10430. [Google Scholar] [CrossRef]
  12. Limo, M.J.; Sola-Rabada, A.; Boix, E.; Thota, V.; Westcott, Z.C.; Puddu, V.; Perry, C.C. Interactions between Metal Oxides and Biomolecules: From Fundamental Understanding to Applications. Chem. Rev. 2018, 118, 11118–11193. [Google Scholar] [CrossRef] [Green Version]
  13. Sola-Rabada, A.; Liang, M.-K.; Roe, M.J.; Perry, C.C. Peptide-directed crystal growth modification in the formation of ZnO. J. Mater. Chem. B 2015, 3, 3777–3788. [Google Scholar] [CrossRef] [Green Version]
  14. Ma, H.; Williams, P.L.; Diamond, S.A. Ecotoxicity of manufactured ZnO nanoparticles—A review. Environ. Pollut. 2013, 172, 76–85. [Google Scholar] [CrossRef]
  15. Fu, P.P.; Xia, Q.; Hwang, H.-M.; Ray, P.C.; Yu, H. Mechanisms of nanotoxicity: Generation of reactive oxygen species. J. Food Drug Anal. 2014, 22, 64–75. [Google Scholar] [CrossRef] [Green Version]
  16. Ramimoghadam, D.; Bin Hussein, M.Z.; Taufiq-Yap, Y.H. The Effect of Sodium Dodecyl Sulfate (SDS) and Cetyltrimethylammonium Bromide (CTAB) on the Properties of ZnO Synthesized by Hydrothermal Method. Int. J. Mol. Sci. 2012, 13, 13275–13293. [Google Scholar] [CrossRef] [Green Version]
  17. Anand, A.; Varghese, S. Role of surfactants on the stability of nano-zinc oxide dispersions. Part. Sci. Technol. 2017, 35, 67–70. [Google Scholar]
  18. Kunkel, M.; Schildknecht, S.; Boldt, K.; Zeyffert, L.; Schleheck, D.; Leist, M.; Polarz, S. Increasing the resistance of living cells against oxidative stress by nonnatural surfactants as membrane guards. ACS Appl. Mater. Interf. 2018, 10, 23638–23646. [Google Scholar] [CrossRef]
  19. Popescu, T.; Matei, C.O.; Vlaicu, I.D.; Tivig, I.; Kuncser, A.C.; Stefan, M.; Ghica, D.; Miclea, L.C.; Savopol, T.; Culita, D.C.; et al. Influence of surfactant-tailored Mn-doped ZnO nanoparticles on ROS production and DNA damage induced in murine fibroblast cells. Sci. Rep. 2020, 10, 18062. [Google Scholar] [CrossRef]
  20. Raisi Dehkourdi, B.; Fatahian, S.; Shahanipoor, K. Synthesis, Characterization and renal toxicity of ZnO and polyethylene glycol coated ZnO nanoparticles. Nanomed. J. 2017, 4, 55–60. [Google Scholar]
  21. Oleszczuk, P.; Jośko, I.; Skwarek, E. Surfactants decrease the toxicity of ZnO, TiO2 and Ni nanoparticles to Daphnia magna. Ecotoxicology 2015, 24, 1923–1932. [Google Scholar] [CrossRef] [PubMed] [Green Version]
  22. Garay-Jimenez, J.C.; Young, A.; Gergeres, D.; Greenhalgh, K.; Turos, E. Methods for purifying and detoxifying sodium dodecyl sulfate–stabilized polyacrylate nanoparticles. Nanomed. Nanotechnol. Biol. Med. 2008, 4, 98–105. [Google Scholar] [CrossRef]
  23. Singh, B.N.; Rawat, A.K.S.; Khan, W.; Naqvi, A.H.; Singh, B.R. Biosynthesis of stable antioxidant ZnO nanoparticles by Pseudomonas aeruginosa Rhamnolipids. PLoS ONE 2014, 9, e106937. [Google Scholar] [CrossRef] [PubMed] [Green Version]
  24. Mohammad, F.; Yusof, N.A. Surface ligand influenced free radical protection of superparamagnetic iron oxide nanoparticles (SPIONs) toward H9c2 cardiac cells. J. Mater. Sci. 2014, 49, 6290–6301. [Google Scholar] [CrossRef]
  25. Liufu, S.; Xiao, H.; Li, Y. Investigation of PEG adsorption on the surface of zinc oxide nanoparticles. Powder Technol. 2004, 145, 20–24. [Google Scholar] [CrossRef]
  26. Patra, M.K.; Manoth, M.; Singh, V.K.; Gowd, G.S.; Choudhry, V.S.; Vadera, S.R.; Kumar, N. Synthesis of stable dispersion of ZnO quantum dots in aqueous medium showing visible emission from bluish green to yellow. J. Lumin. 2009, 129, 320–324. [Google Scholar] [CrossRef]
  27. Leila, D.; Mar, L.-G.; Fatima, B.; Abddelyamine, N.; Ali, B.; Nacereddine, H. Effect of polyethylene glycol and propyltrimethoxysilane on structural and optical properties of zinc oxide nanoparticles synthesized by sol–gel process. J. Theor. Appl. Phys. 2018, 12, 159–167. [Google Scholar] [CrossRef] [Green Version]
  28. Zak, A.K.; Razali, R.; Majid, W.H.B.A.; Darroudi, M. Synthesis and characterization of a narrow size distribution of zinc oxide nanoparticles. Int. J. Nanomed. 2011, 6, 1399–1403. [Google Scholar]
  29. Samaele, N.; Amornpitoksuk, P.; Suwanboon, S. Effect of pH on the morphology and optical properties of modified ZnO particles by SDS via a precipitation method. Powder Technol. 2010, 203, 243–247. [Google Scholar] [CrossRef]
  30. Prasad, V.; D’Souza, C.; Yadav, D.; Shaikh, A.J.; Vigneshwaran, N. Spectroscopic characterization of zinc oxide nanorods synthesized by solid-state reaction. Spectrochim. Acta A 2006, 65, 173–178. [Google Scholar] [CrossRef]
  31. Wu, L.; Wu, Y.; Lü, W. Preparation of ZnO Nanorods and optical characterizations. Phys. E 2005, 28, 76–82. [Google Scholar] [CrossRef]
  32. Vidyasagar, C.C.; Naik, Y.A. Naik Surfactant (PEG 400) effects on crystallinity of ZnO nanoparticles. Arab. J. Chem. 2016, 9, 507–510. [Google Scholar] [CrossRef] [Green Version]
  33. Singla, M.L.; Kumar, M. Optical characterization of ZnO nanoparticles capped with various surfactants. J. Lumin. 2009, 129, 434–438. [Google Scholar] [CrossRef]
  34. Jose, A.; Devi, K.S.; Pinheiro, D.; Narayana, S.L. Electrochemical synthesis, photodegradation and antibacterial properties of PEG capped zinc oxide nanoparticles. J. Photochem. Photobiol. B Biol. 2018, 187, 25–34. [Google Scholar] [CrossRef]
  35. Liu, Y.; Liu, H.; Zhang, Q.; Li, T. Adjusting the proportions of {0001} facets and high-index facets of ZnO hexagonal prisms and their photocatalytic activity. RSC Adv. 2017, 7, 3515. [Google Scholar] [CrossRef] [Green Version]
  36. Anandan, M.; Dinesh, S.; Krishnakumar, N.; Balamurugan, K. Improved photocatalytic properties and anti-bacterial activity of size reduced ZnO nanoparticles via PEG-assisted precipitation route. J. Mater. Sci. Mater. Electron. 2016, 27, 12517–12526. [Google Scholar] [CrossRef]
  37. Trino, L.D.; Dias, L.F.; Albano, L.G.; Bronze-Uhle, E.S.; Rangel, E.C.; Graeff, C.F.; Lisboa-Filho, P.N. Zinc oxide surface functionalization and related effects on corrosion resistance of titanium implants. Ceram. Int. 2018, 44, 4000–4008. [Google Scholar] [CrossRef] [Green Version]
  38. Parra, M.R.; Haque, F.Z. Haque Poly(ethylene glycol) (PEG)-assisted shape-controlled synthesis of one-dimensional ZnO nanorods. Optik 2015, 126, 1562–1566. [Google Scholar] [CrossRef]
  39. Rahman, M.Y.A.; Umar, A.A.; Taslim, R.; Salleh, M.M. Effect of surfactant on the physical properties of ZnO nanorods and the performance of ZnO photoelectrochemical cell. J. Exp. Nanosci. 2015, 10, 599–609. [Google Scholar] [CrossRef] [Green Version]
  40. Zhao, M.; Wu, D.; Chang, J.; Bai, Z.; Jiang, K. Synthesis of cup-like ZnO microcrystals via a CTAB-assisted hydrothermal route. Mater. Chem. Phys. 2009, 117, 422–424. [Google Scholar] [CrossRef]
  41. Zou, X.; Ke, J.; Hao, J.; Yan, X.; Tian, Y. A new method for synthesis of ZnO flower-like nanostructures and their photocatalytic performance. Phys. B 2022, 624, 413395. [Google Scholar] [CrossRef]
  42. Eadi, S.B.; Kim, S.; Jeong, S.W. Effect of surfactant on growth of ZnO nanodumbbells and their characterization. J. Chem. 2017, 2017, 1728345. [Google Scholar] [CrossRef] [Green Version]
  43. Li, P.; Wei, Y.; Liu, H.; Wang, X.-K. Growth of well-defined ZnO microparticles with additives from aqueous solution. J. Solid State Chem. 2005, 178, 855–860. [Google Scholar] [CrossRef]
  44. Ahson, R.; Ahmad, R.; Afzal, N.; Mubarik, F.E. Effect of structure modifying agents on the structural, morphological and optical features of hydrothermally grown ZnO. J. Nanosci. Nanotechnol. 2020, 20, 3265–3273. [Google Scholar] [CrossRef] [PubMed]
  45. Tavakoli, A.; Ataei-Pirkooh, A.; Mm Sadeghi, G.; Bokharaei-Salim, F.; Sahrapour, P.; Kiani, S.J.; Moghoofei, M.; Farahmand, M.; Javanmard, D.; Monavari, S.H. Polyethylene glycol-coated zinc oxide nanoparticle: An efficient nanoweapon to fight against herpes simplex virus type 1. Nanomedicine 2018, 13, 2675–2690. [Google Scholar] [CrossRef]
  46. Kayani, Z.N.; Iqbal, M.; Riaz, S.; Zia, R.; Naseem, S. Fabrication and properties of zinc oxide thin film prepared by sol-gel dip coating method. Mater. Sci. 2015, 33, 515–520. [Google Scholar] [CrossRef]
  47. Rajendran, G.; Datta, S.P.; Singh, R.D.; Datta, S.C.; Vakada, M. Synthesis and characterization of ZnO nanoparticles–comparison of acetate (precursor) based methods. Inorg. Nano-Metal Chem. 2021, 52, 185–194. [Google Scholar] [CrossRef]
  48. Pranjali, P.; Meher, M.K.; Raj, R.; Prasad, N.; Poluri, K.M.; Kumar, D.; Guleria, A. Physicochemical and antibacterial properties of PEGylated zinc oxide nanoparticles dispersed in peritoneal dialysis fluid. ACS Omega 2019, 4, 19255–19264. [Google Scholar] [CrossRef]
  49. Medina, J.; Bolaños, H.; Mosquera-Sanchez, L.P.; Rodriguez-Paez, J.E. Controlled synthesis of ZnO nanoparticles and evaluation of their toxicity in Mus musculus mice. Int. Nano Lett. 2018, 8, 165–179. [Google Scholar] [CrossRef] [Green Version]
  50. Wu, C.K.; Sivashanmugan, K.; Guo, T.F.; Wen, T.C. Enhancement of inverted polymer solar cells performances using cetyltrimethylammonium-bromide modified ZnO. Materials 2018, 11, 378. [Google Scholar] [CrossRef] [Green Version]
  51. Zhang, L.-Z.; Xiang, L. Influence of sodium dodecyl sulfate on the fabrication of zinc oxide nanoparticles. Res. Chem. Intermed. 2011, 37, 281–289. [Google Scholar] [CrossRef]
  52. Li, D.; Hu, J.; Fan, F.; Bai, S.; Luo, R.; Chen, A.; Liu, C.C. Quantum-sized ZnO nanoparticles synthesized in aqueous medium for toxic gases detection. J. Alloys Compd. 2012, 539, 205–209. [Google Scholar] [CrossRef]
  53. Sun, J.-H.; Huang, J.-H.; Lan, X.-Y.; Zhang, F.-C.; Zhao, L.-Z.; Zhang, Y. Enhancing the performance of blue quantum-dot light-emitting diodes through the incorporation of polyethylene glycol to passivate ZnO as an electron transport layer. RSC Adv. 2020, 10, 23121–23127. [Google Scholar] [CrossRef]
  54. Singletary, M.; Hagerty, S.; Muramoto, S.; Daniels, Y.; MacCrehan, W.A.; Stan, G.; Lau, J.W.; Pustovyy, O.; Globa, L.; Morrison, E.E.; et al. PEGylation of zinc nanoparticles amplifies their ability to enhance olfactory responses to odorant. PLoS ONE 2017, 12, e0189273. [Google Scholar] [CrossRef] [Green Version]
  55. Punnoose, A.; Dodge, K.; Rasmussen, J.W.; Chess, J.; Wingett, D.; Anders, C. Cytotoxicity of ZnO Nanoparticles Can Be Tailored by Modifying Their Surface Structure: A Green Chemistry Approach for Safer Nanomaterials. ACS Sustain. Chem. Eng. 2014, 2, 1666–1673. [Google Scholar] [CrossRef]
  56. Marsalek, R. Particle Size and Zeta Potential of ZnO. APCBEE Procedia 2014, 9, 13–17. [Google Scholar] [CrossRef] [Green Version]
  57. Chibowski, S. Investigation of the Mechanism of Polymer Adsorption on a Metal Oxide/Water Solution Interface. Adsorpt. Sci. Technol. 1996, 14, 179–188. [Google Scholar] [CrossRef]
  58. Danaei, M.; Dehghankhold, M.; Ataei, S.; Hasanzadeh Davarani, F.; Javanmard, R.; Dokhani, A.; Khorasani, S.; Mozafari, M.R. Impact of Particle Size and Polydispersity Index on the Clinical Applications of Lipidic Nanocarrier Systems. Pharmaceutics 2018, 10, 57. [Google Scholar] [CrossRef] [Green Version]
  59. Liao, C.; Jin, Y.; Li, Y.; Tjong, S.C. Interactions of Zinc Oxide Nanostructures with Mammalian Cells: Cytotoxicity and Photocatalytic Toxicity. Int. J. Mol. Sci. 2020, 21, 6305. [Google Scholar] [CrossRef]
  60. Mathaes, R.; Winter, G.; Besheer, A.; Engert, J. Influence of particle geometry and PEGylation on phagocytosis of particulate carriers. Int. J. Pharm. 2014, 465, 159–164. [Google Scholar] [CrossRef]
  61. Moayedian, T.; Mosaffa, F.; Khameneh, B.; Tafaghodi, M. Combined effects of PEGylation and particle size on uptake of PLGA particles by macrophage cells. Nanomed. J. 2015, 2, 299–304. [Google Scholar]
  62. Miyazawa, T.; Itaya, M.; Burdeos, G.C.; Nakagawa, K.; Miyazawa, T. A Critical Review of the Use of Surfactant-Coated Nanoparticles in Nanomedicine and Food Nanotechnology. Int. J. Nanomed. 2021, 16, 3937–3999. [Google Scholar] [CrossRef] [PubMed]
  63. Liu, N.; Wang, Y.; Ge, F.; Liu, S.; Xiao, H. Antagonistic effect of nano-ZnO and cetyltrimethyl ammonium chloride on the growth of Chlorella vulgaris: Dissolution and accumulation of nano-ZnO. Chemosphere 2018, 196, 566–574. [Google Scholar] [CrossRef]
  64. Wang, J.; Deng, X.; Zhang, F.; Chen, D.; Ding, W. ZnO nanoparticle-induced oxidative stress triggers apoptosis by activating JNK signaling pathway in cultured primary astrocytes. Nanoscale Res. Lett. 2014, 9, 117. [Google Scholar] [CrossRef]
  65. Bai, D.-P.; Zhang, X.-F.; Zhang, G.-L.; Huang, Y.-F.; Gurunathan, S. Zinc oxide nanoparticles induce apoptosis and autophagy in human ovarian cancer cells. Int. J. Nanomed. 2017, 12, 6521–6535. [Google Scholar] [CrossRef] [Green Version]
  66. Ng, C.T.; Yong, L.Q.; Hande, M.P.; Ong, C.N.; Yu, L.E.; Bay, B.H.; Baeg, G.H. Zinc oxide nanoparticles exhibit cytotoxicity and genotoxicity through oxidative stress responses in human lung fibroblasts and Drosophila melanogaster. Int. J. Nanomed. 2017, 12, 1621. [Google Scholar] [CrossRef] [Green Version]
  67. De Angelis, I.; Barone, F.; Zijno, A.; Bizzarri, L.; Russo, M.T.; Pozzi, R.; Franchini, F.; Giudetti, G.; Uboldi, C.; Ponti, J.; et al. Comparative study of ZnO and TiO2 nanoparticles: Physicochemical characterisation and toxicological effects on human colon carcinoma cells. Nanotoxicology 2013, 7, 1361–1372. [Google Scholar] [CrossRef]
  68. Jones, D.P. Radical-free biology of oxidative stress. Am. J. Physiol.-Cell Physiol. 2008, 295, C849–C868. [Google Scholar] [CrossRef]
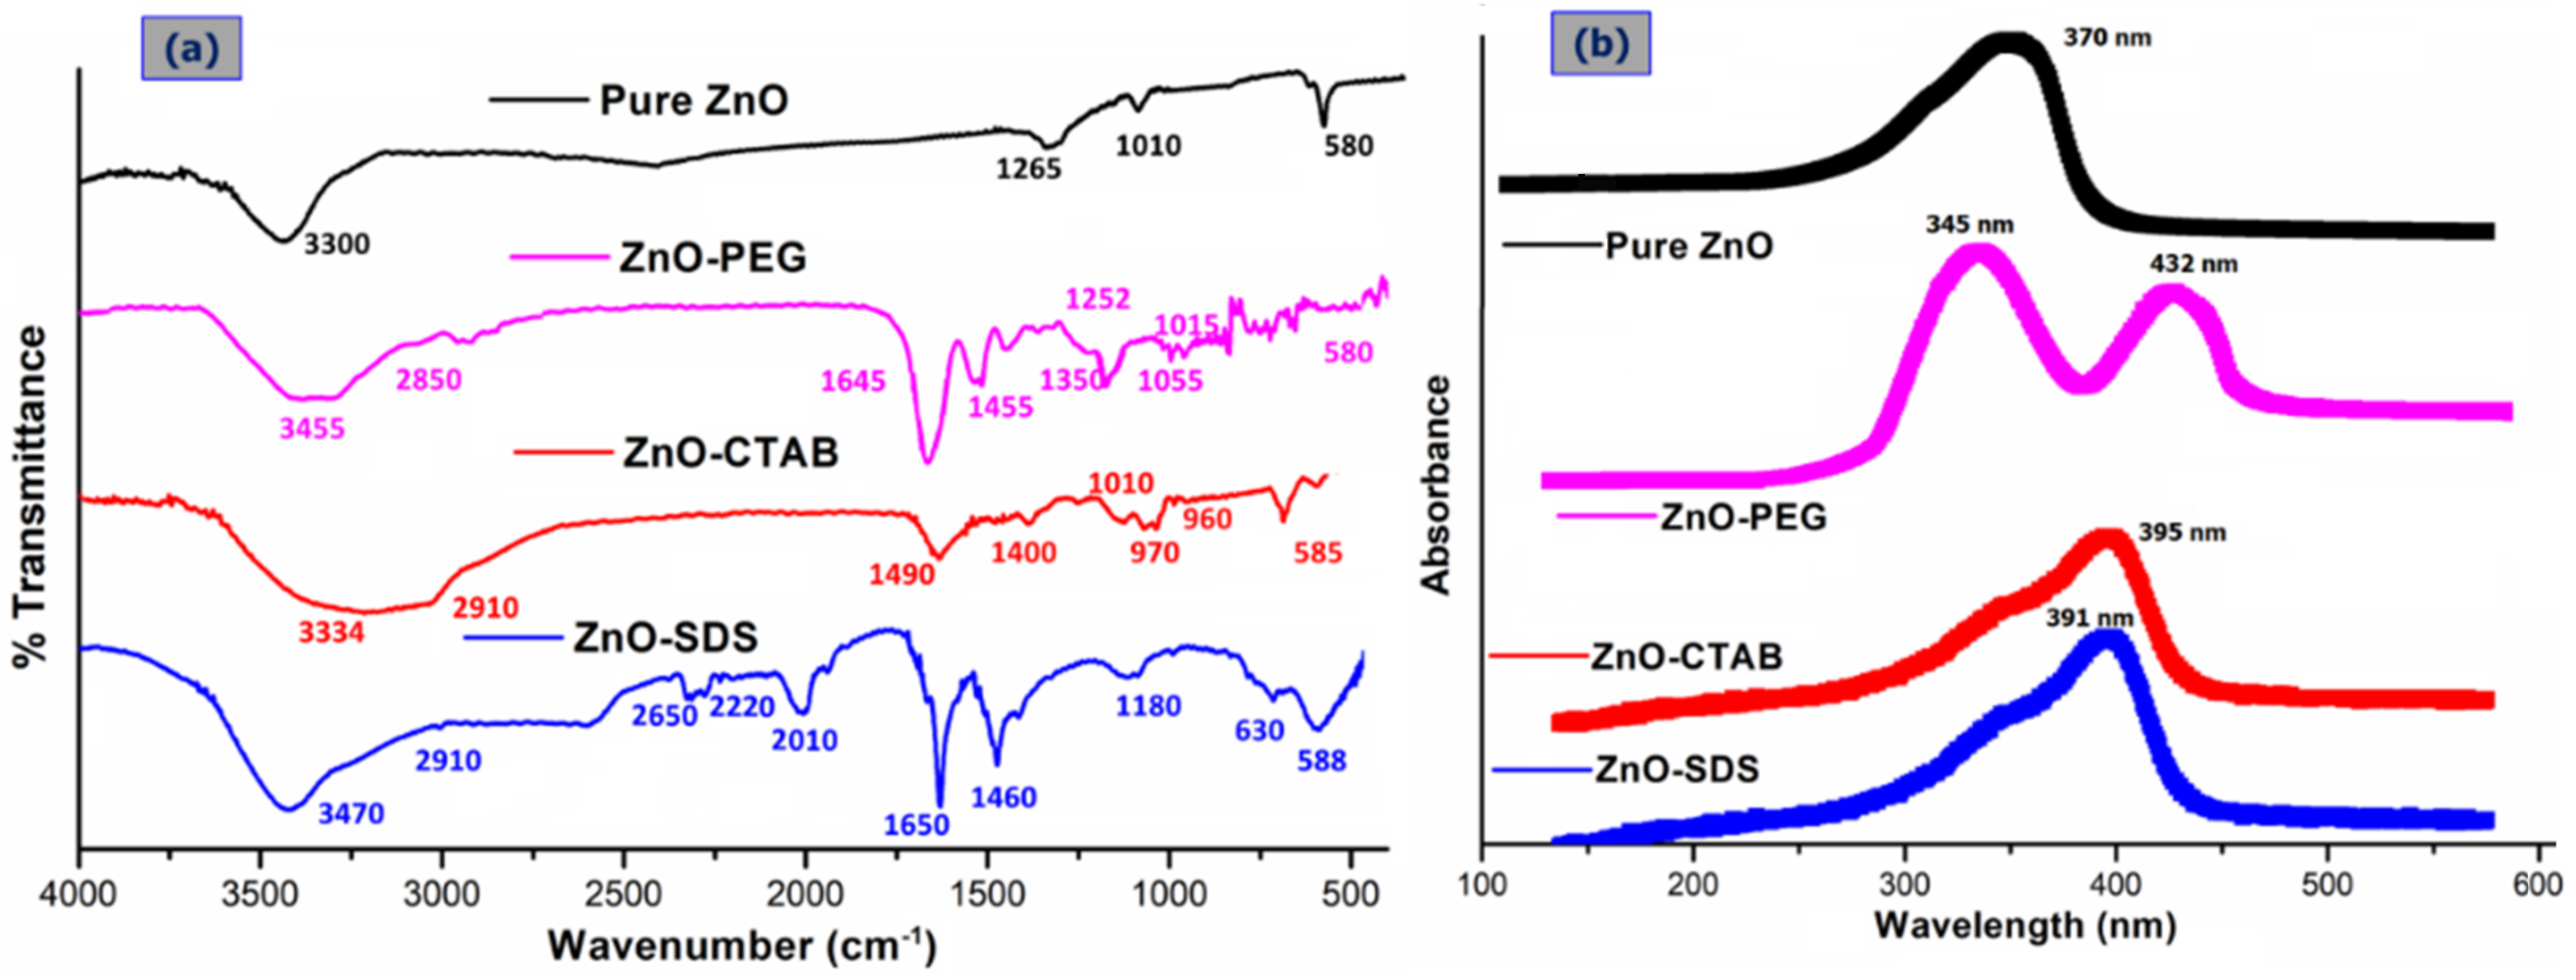
Figure 1. Comparison of the FTIR (a) and UV–vis (b) spectra of pure ZnO with that of surfactant-coated ZnO NPs (ZnO–PEG, ZnO–CTAB, and ZnO–SDS).
Coatings 13 00172 g001
Figure 2. Comparison of (a) powdered XRD patterns and (b) TGA studies of all four ZnO NPs.
Coatings 13 00172 g002
Figure 3. HRTEM analysis of all four ZnO NPs along with the size distribution, (a) Pure ZnO, (b) ZnO–PEG, (c) ZnO–CTAB, and (d) ZnO–SDS.
Coatings 13 00172 g003
Figure 4. (A) XPS and (B) DLS analysis of all four ZnO-based composites (inset: Zeta potential studies of the corresponding sample).
Coatings 13 00172 g004
Figure 5. In vitro cell viability and proliferation studies of various ZnO NPs and surfactants (0–500 µg/mL) when tested at two different time periods of 24 and 48 h (* for significance, p < 0.05, and ** for high significance, p < 0.01).
Coatings 13 00172 g005
Figure 6. Comparison of the apoptosis assay results for all four different ZnO samples (IC50) when tested over a 24 h period. (A-I) and (A-II) corresponds to the cellular differentiation and the fluorescence intensity (respectively) of pure ZnO sample. Likewise, (B(I,II)D(I,II)) are related to ZnO-PEG, C-ZnO-CTAB, and D-ZnO-SDS samples respectively.
Coatings 13 00172 g006
Figure 7. Assay of ROS to understand the oxidative stress potentials of all four ZnO samples over a 24 h period. (A-I) and (A-II) stands for the flow cytometric cell differentiation and fluorescence intensity (respectively) of pure ZnO sample. Likewise, (B(I,II)–D(I,II)) correspond to ZnO-PEG, C-ZnO-CTAB, and D-ZnO-SDS samples respectively.
Coatings 13 00172 g007
Figure 8. (a) DNA fragmentation and (b) mitochondrial depletion assay when tested against the four different ZnO NPs (* for significance, p < 0.05, and ** for high significance, p < 0.01 values).
Coatings 13 00172 g008
Table 1. Surfactants used for the coating of ZnO NPs.
SurfactantStructure
PEGCoatings 13 00172 i001
CTABCoatings 13 00172 i002
SDSCoatings 13 00172 i003
Disclaimer/Publisher’s Note: The statements, opinions and data contained in all publications are solely those of the individual author(s) and contributor(s) and not of MDPI and/or the editor(s). MDPI and/or the editor(s) disclaim responsibility for any injury to people or property resulting from any ideas, methods, instructions or products referred to in the content.