Article

Properties of the YbF3 Films Prepared by Ion-Assisted Deposition

1
Tianjin Key Laboratory of Optical Thin Film, Tianjin Jinhang Technical Physics Institute, Tianjin 300308, China
2
Joint Laboratory of Optoelectronic Materials and Intelligent Surface Structures, Tianjin 300308, China
*
Author to whom correspondence should be addressed.
Coatings 2022, 12(11), 1693; https://doi.org/10.3390/coatings12111693
Submission received: 13 September 2022 / Revised: 3 November 2022 / Accepted: 4 November 2022 / Published: 7 November 2022
(This article belongs to the Special Issue Advances in Nanostructured Thin Films and Coatings)

Abstract

:
The purpose of this study is to characterize the microstructure, composition, optical properties and residual stress of YbF3 films. The films were deposited by ion-assisted deposition at different ion energy. The SEM images showed that the surface of the film was uniform and smooth. The XRD patterns showed that the YbF3 films presented an amorphous microstructure. XPS measurement revealed that the ratio of F and Yb reduced with increasing ion energy. The optical constants of the films were determined from the whole optical spectrum. The refractive index increased with the ion energy. Due to the decrease in the amount of F, non-stoichiometric films were formed, and the visible light absorption of the films increased with increasing ion energy. Higher ion energy could increase the packing density, resulting in a decrease in the moisture absorption of the film. The films exhibited tensile stress. The value of residual stress increased with increasing ion energy, since moisture adsorption had an important effect on the residual stress.

1. Introduction

YbF3 is an important multispectral optical film with low optical loss, good mechanical properties and good environmental adaptability [1], which has been widely used in high-performance antireflection films [2,3,4,5], high-reflection mirrors [6], high-power infrared laser films [7,8,9] and high-efficiency beamsplitters [10,11].
Due to the bombardment of high-energy ions, the columnar microstructure of the films formed during the thermal evaporation will be degraded for higher density, better surface quality and better mechanical properties. Some researchers focused on the formation theory and properties of the YbF3 film prepared by ion-assisted deposition (IAD). Lisitsyn et al. studied the migration of the primary F centers in rutile MgF2 crystal and checked the hypothesis on the mobile interstitial aggregation with the formation of the F2 interstitial molecules, which provided a clear analysis of the formation of point defects in the fluorides [12]. Schnellbügel et al. investigated the effects of IAD on the stoichiometry and chemical state of the Yb ions, and produced AR and PR coatings on ZnSe substrates [13]. Zhang et al. prepared YbF3 thin film by APS plasma IAD and studied the effect of the anode voltage on the residual stress and refractive index of YbF3 [14]. Zhang et al. measured the refractive index and thickness of the YbF3 thin films deposited by IAD, and revealed that a higher bias voltage can improve the homogeneity of YbF3 thin films [15]. However, there are still some problems to be solved. Firstly, the relationships between the ion energy and microstructure, composition, optical properties and residual stress of the films need to be comprehensively described; secondly, in terms of optical characterization, the optical constants of the films in visible, near-infrared [4,15,16] and mid-infrared [17,18] regions can be calculated, but the optical loss mechanism of YbF3 thin films prepared by IAD needs to be examined in further studies. Finally, the moisture absorption has a great influence on the properties of the YbF3 thin films with an unclear mechanism. Moreover, there are few reports on the method of reducing the moisture absorption.
In this paper, YbF3 films were prepared by IAD to investigate the microstructure, composition, optical properties and residual stress of the YbF3 films. The relationship between the ion energy and properties of the films was revealed. Using Condy–Lorentz and Gaussian dispersion models, the optical constants were obtained to study the mechanism of the optical loss. The results provided a method to reduce the moisture absorption.

2. Materials and Methods

2.1. Sample Preparation

YbF3 thin films were deposited on various substrates. The films on double-sided polished Si (diameter of 20 mm and thickness of 1 mm) were used for the SEM and XRD measurements, the films on double-sided polished Ge (diameter of 25 mm and thickness of 2 mm) were used for XPS testing and infrared spectroscopy, the films on double-sided polished silica (diameter of 40 mm and thickness of 1 mm) were used for UV-visible near-infrared spectroscopy, and the films on single-sided polished silica (diameter of 25 mm and thickness of 1 mm) were used for the surface shape measurement. The equipment used for YbF3 film deposition was an IAD equipped with a Kaufman ion source. The diameter of the ion source was 12 cm. Prior to deposition, the substrate surfaces were pre-cleaned using Ar ion from an ion source. The YbF3 films were deposited using the thermal evaporation method. The substrate temperature was kept at 140 ℃. The base pressure of the vacuum chamber was pumped down to below 2 × 10⁻³ Pa. The deposition process was monitored by thin-film deposition controllers (Inficon, IC6, Bad Ragaz, Switzerland). The deposition rate and thickness of the films were set at 0.3 nm/s and 700 nm, respectively. The values of the ion-beam voltage, which determines the ion energy, were between 0 and 360 V, while the ion-beam current was fixed at 100 mA. During deposition, the Ar gas flow was kept at 25 sccm.

2.2. Characterization of Thin Films

The surface morphology of the YbF3 films was measured by scanning electron microscopy (SEM, Sigma300, Zeiss, Jena, Germany). The crystal structure characterization of the YbF3 thin films was carried out with a Rigaku D/MAX 2500 X-ray diffractometer at Cu Ka radiation of wavelength λ = 1.5406 Å, under the 40 kV and 200 mA for X-ray tube voltage and current, respectively. The X-ray photoelectron spectroscopy (XPS) experiments were carried out on a PHI-5000 system using a monochromatized Al Kα X-ray source (radiation at 1486.6 eV) with an energy step size of 0.200 eV. The binding energy of contaminated carbon (C 1s 284.8 eV) was used as the reference. The XPS peak 4.1 was used to fit the XPS spectra, and the deviation ( 𝜒 2 ) was less than 1.27. The spectral characteristics of the YbF3 films from 190 nm to 2000 nm were tested with the spectrophotometer (Lambda 900, PE, Waltham, MA, USA), and the infrared spectra from 2000 nm to 12,000 nm were measured by a Fourier-transform spectrometer (Spectrum 3, PE, Waltham, MA, USA).
To characterize the dielectric constant of thin films from 190 nm to 2000 nm, Condy–Lorentz (C-L) dispersion models were used, and Gaussian oscillators were added according to the characteristic absorption peak. In the C-L model, the imaginary part of the dielectric constant ε2(E) can be expressed as follows [19,20]:
ε 2 ( E ) = { E 1 E exp ( E E t E u ) ; 0 < E E t G ( E ) L ( E ) = ( E E g ) 2 ( E E g ) 2 + E p 2 A E 0 Γ E [ ( E 2 - E 0 2 ) 2 + Γ 2 E 2 ] ; E > E t
E 1 = E t L ( E t ) G ( E t )
where E is the photon energy (eV). E0, A, Eg and Γ are the photon energy, the optical transition matrix element, the bandgap width and the bandwidth of the interband transition center, respectively. Et is the boundary energy between the Urbach band tail transition and interband transition. In the region of photon energy less than Et and greater than Et, it is band tailed transition absorption and the interband transition absorption, respectively. Ep is the second transition energy. When the photon absorption is much greater than Eg + Ep, it is expressed by the Lorentz absorption line. Eu is the width of the Urbach tail. E1 is expressed in Formula (2), as the imaginary part of the dielectric function is continuous at E = Et. G(E) is approximated by a constant density function of the state density dipole. The real part ε1(E) is determined as usual from a Kramers–Kronig transformation:
ε 1 ( E ) = ε + 2 π P 0   E ε 2 ( E ) E 2 E 2 d   E
where P denotes the principal values of the Cauchy integrals and ε is the high-frequency static dielectric constant.
The Gaussian oscillation formula is shown in Formulas (4)–(7) [21,22,23]:
ε n - Gaussian = ε n 1 + i ε n 2
ε n 2 = A e ( E - E n σ ) 2   A e ( E + E n σ ) 2
σ = B r n 2 ln ( 2 )
ε n 1 = 2 π P 0 ξ ε n 2 ( ξ ) ξ 2 E 2 d ξ
where εn1 and εn2 are the real part and imaginary part of the dielectric function εn_Gaussian, respectively. The   1 / 2 ln ( 2 ) factor sets the broadening parameter. En, An and Brn are the central energy, the amplitude and the full width at half maximum of the oscillator, respectively. P denotes the principal values of the Cauchy integrals.   A = A n / B r n .
The Gaussian oscillation was used for characterizing the dielectric constant in the infrared region.
The measurement of the residual stress properties of the optical films was based on the substrate figure. A ZYGO surface interferometer was used to measure the substrate figures before and after coating, and the Stoney formula was used to calculate the films’ residual stress [24].

3. Results and Discussion

The SEM images of the YbF3 films are shown in Figure 1. It can be seen in Figure 1a–c that the surface of the YbF3 films is continuous with low packing density. No large particles are formed on the film surface, which means that the films are not well crystallized. As the ion energy increases, the surface of the film becomes smoother, which is attributed to the high-energy ion-assisted deposition enabling the evaporated particles to obtain greater kinetic energy to migrate on the surface of the substrate.
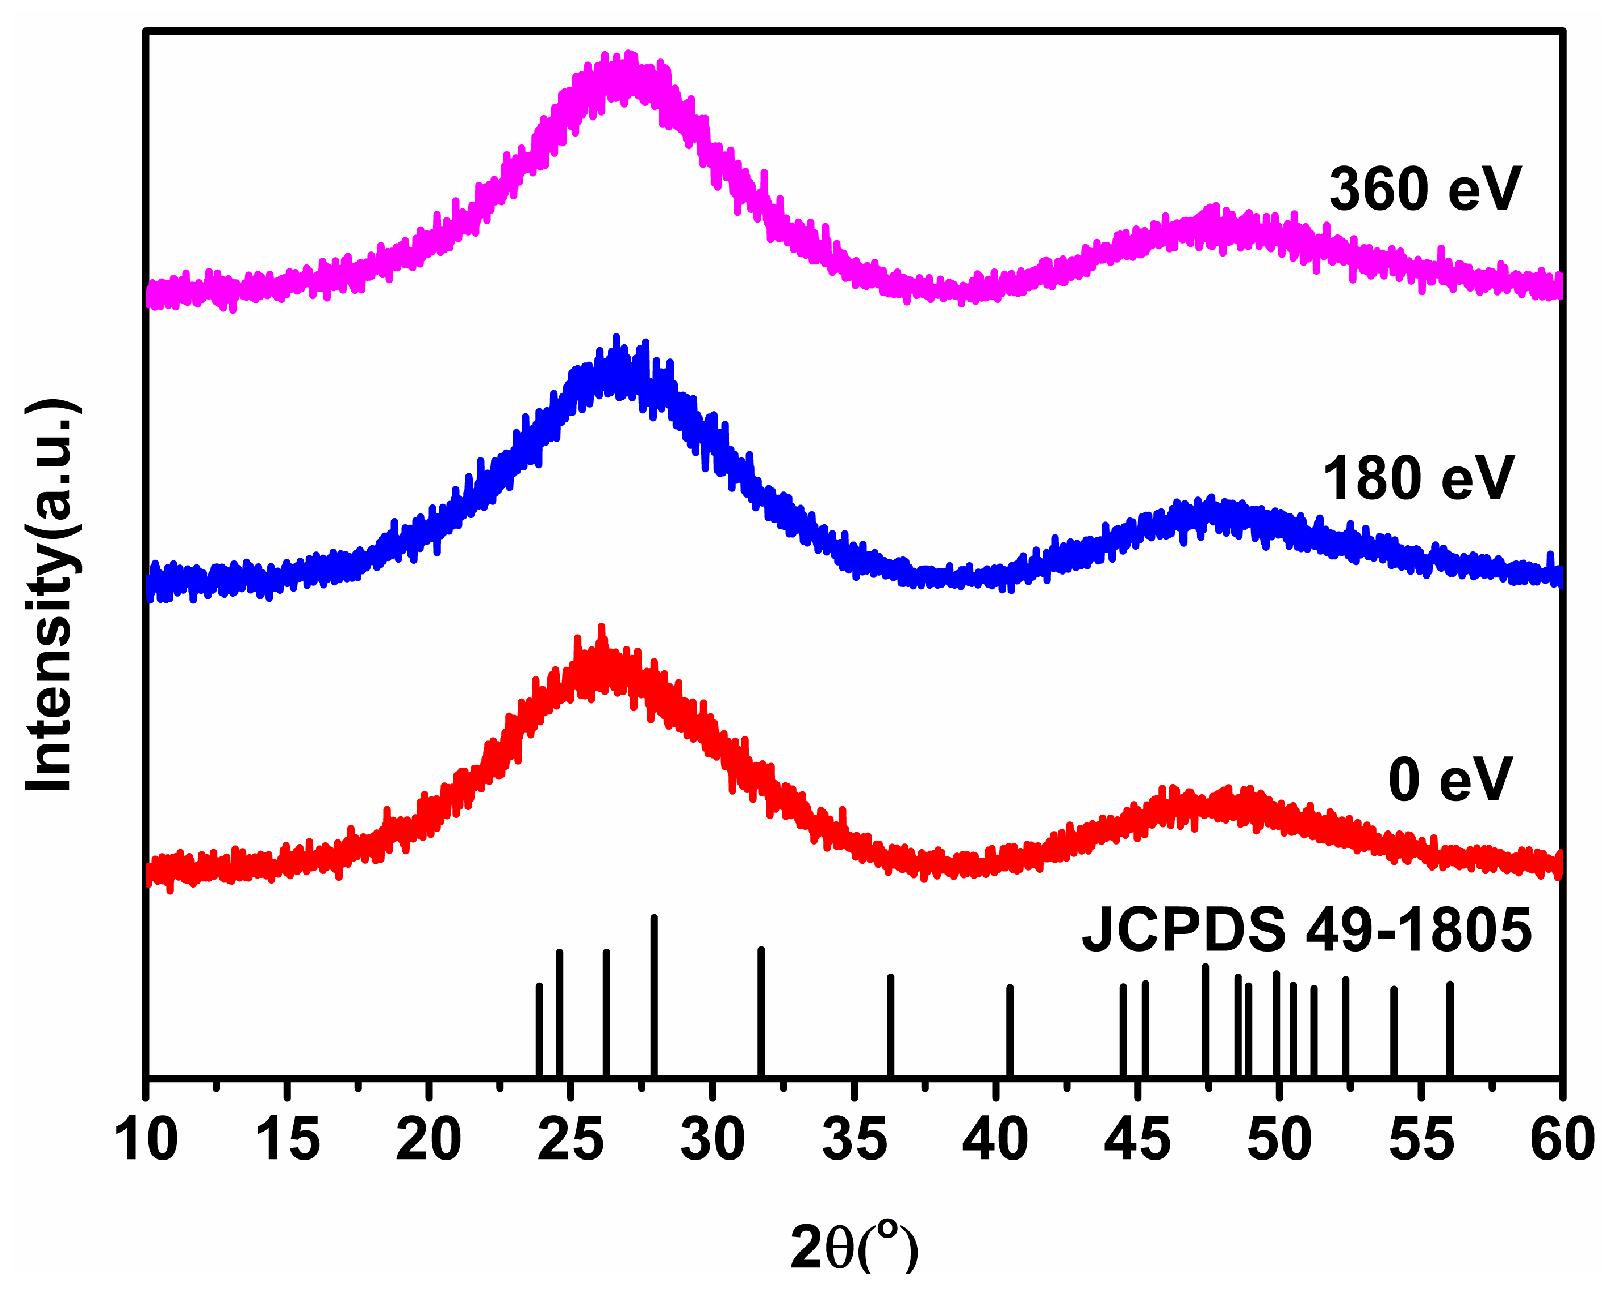
Figure 2 shows the XRD spectra of the YbF3 films. It can be seen from Figure 2 that all of the XRD patterns show two wide bands around 2θ = 26.5° and 48°. The YbF3 films exhibit an amorphous structure [25]. According to the standard data of JCPDS 49-1805, both of the bands may contain many peaks. Since the XRD spectra for the films deposited at different ion energies have no significant differences, the disordered structure of the films is not obviously improved.
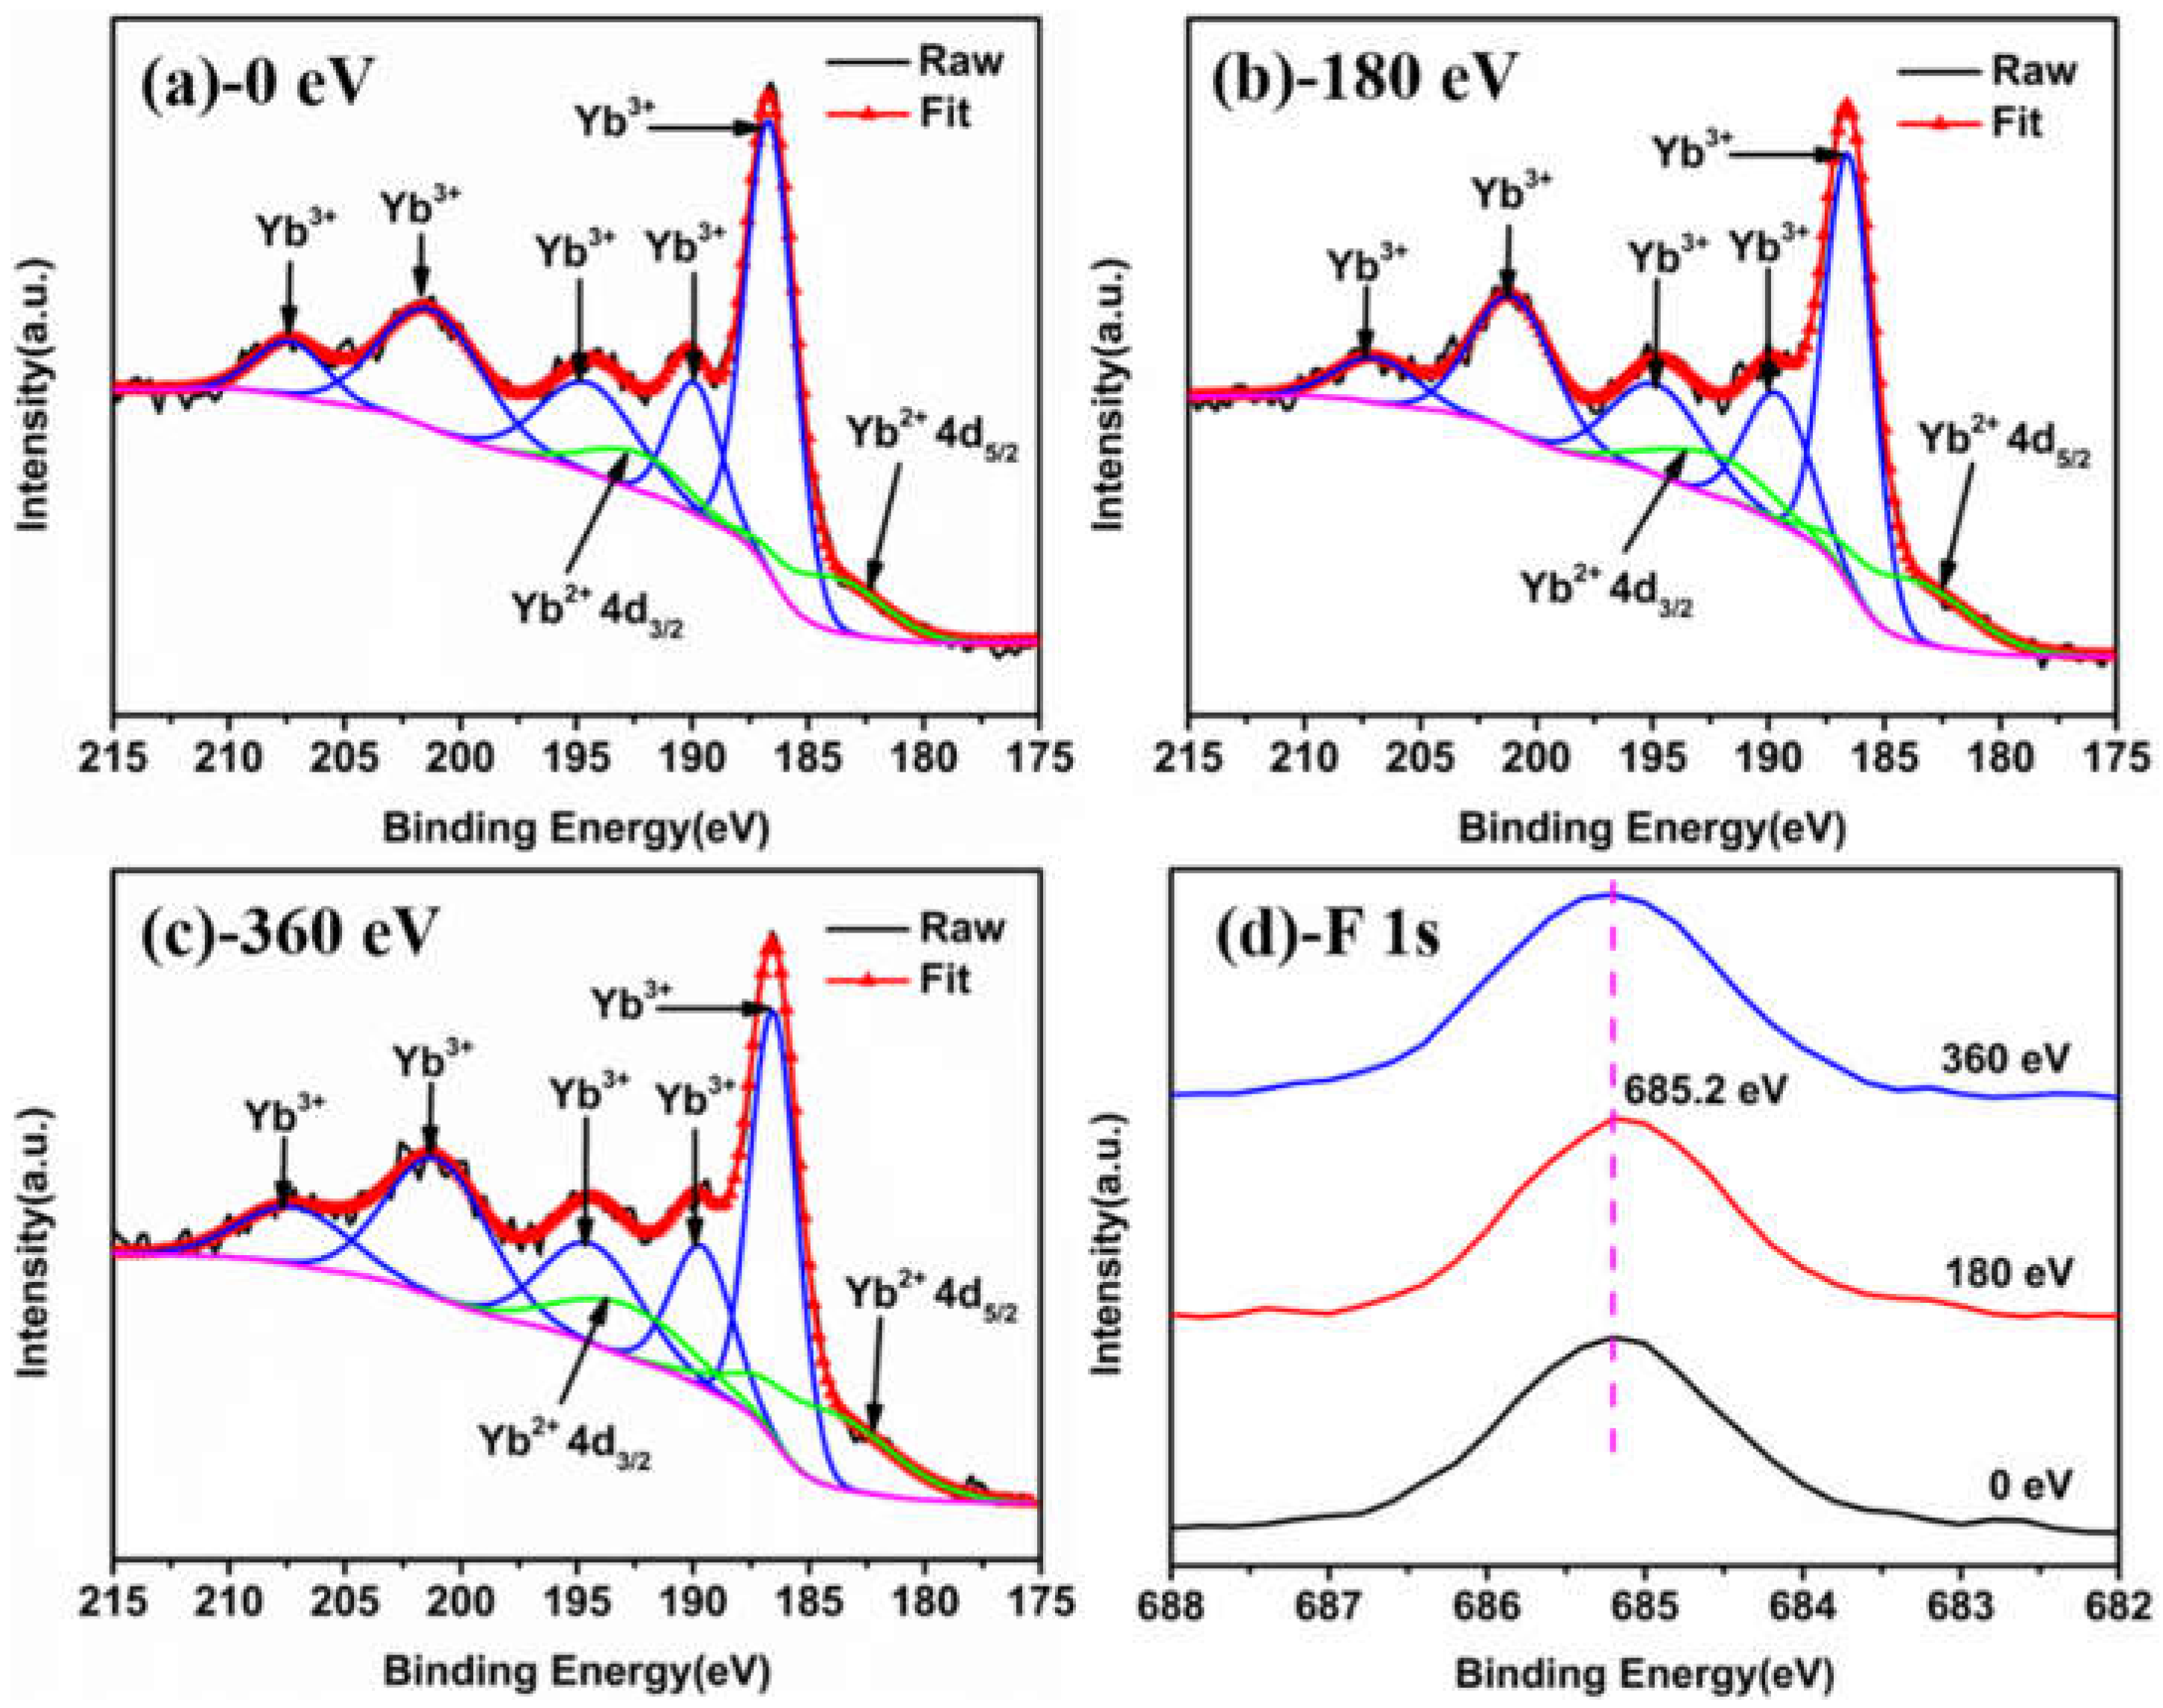
The XPS test is an effective way to obtain a quantitative analysis of the composition and element chemical states of the films, whose results are shown in Figure 3. The ratio of the F and Yb of the YbF3 films are 2.625, 2.329 and 1.789, respectively. The preferential sputtering of the F ions during IAD was confirmed by other researchers [26]. According to the momentum transfer theory, F ions will achieve higher mobility during the IAD, which promotes the formation of the F2 interstitial molecules, resulting in the loss of the F ion. The narrow-scanning spectra of the Yb 4d for the films are presented in Figure 3a–c. The spectra of the Yb 4d can be divided into seven peaks around 207 eV, 201 eV, 194.5 eV, 192.5 eV, 189.5 eV, 186.5 eV and 184 eV [25,27,28,29]. The peaks around 192.5 eV and 184 eV are attributed to the 4d3/2 and 4d5/2 components of Yb2+, respectively. Due to the coulomb and exchange interactions, the final states of 4d94f13 are divided into the 3(HGFDP) and 1(HGFDP) state through LS coupling, which makes the 4d spectra of Yb3+ very complex and mixed [28]. The existing probability of Yb2+ can be obtained by the ratio of the area of the peak at the Yb2+ and the total area of the peaks. Finally, the existing probability of Yb2+ in the films estimated from the 4d spectrum are 14.29%,18.71% and 22.09%, respectively. The narrow-scanning XPS spectra of F 1s for the films deposited at different ion energies are shown in Figure 3d. The F 1s peaks of the YbF3 films are at 685.2 eV, corresponding to Yb–F bonds.
Figure 4 displays the spectra characteristics of the YbF3 films. As shown in Figure 4, the films exhibit good transparency in the visible and near-infrared region. All of the YbF3 films show the absorption bands between 900 nm and 1000 nm. The band includes two peaks around 957 nm and 975 nm, and these peaks are attributed to Yb3+ ions in the films. There are also some absorption bands below 400 nm, which are attributed to the Yb2+ ions [30,31]. The absorption peaks are at 190 nm, 205 nm and 241 nm for the YbF3 films deposited without ion assistance, while they are at 190 nm, 205 nm, 241 nm and 307 nm for the YbF3 films deposited with ion assistance. Since the measuring and fitting spectra match very well, the optical constants of the YbF3 films are obtained.
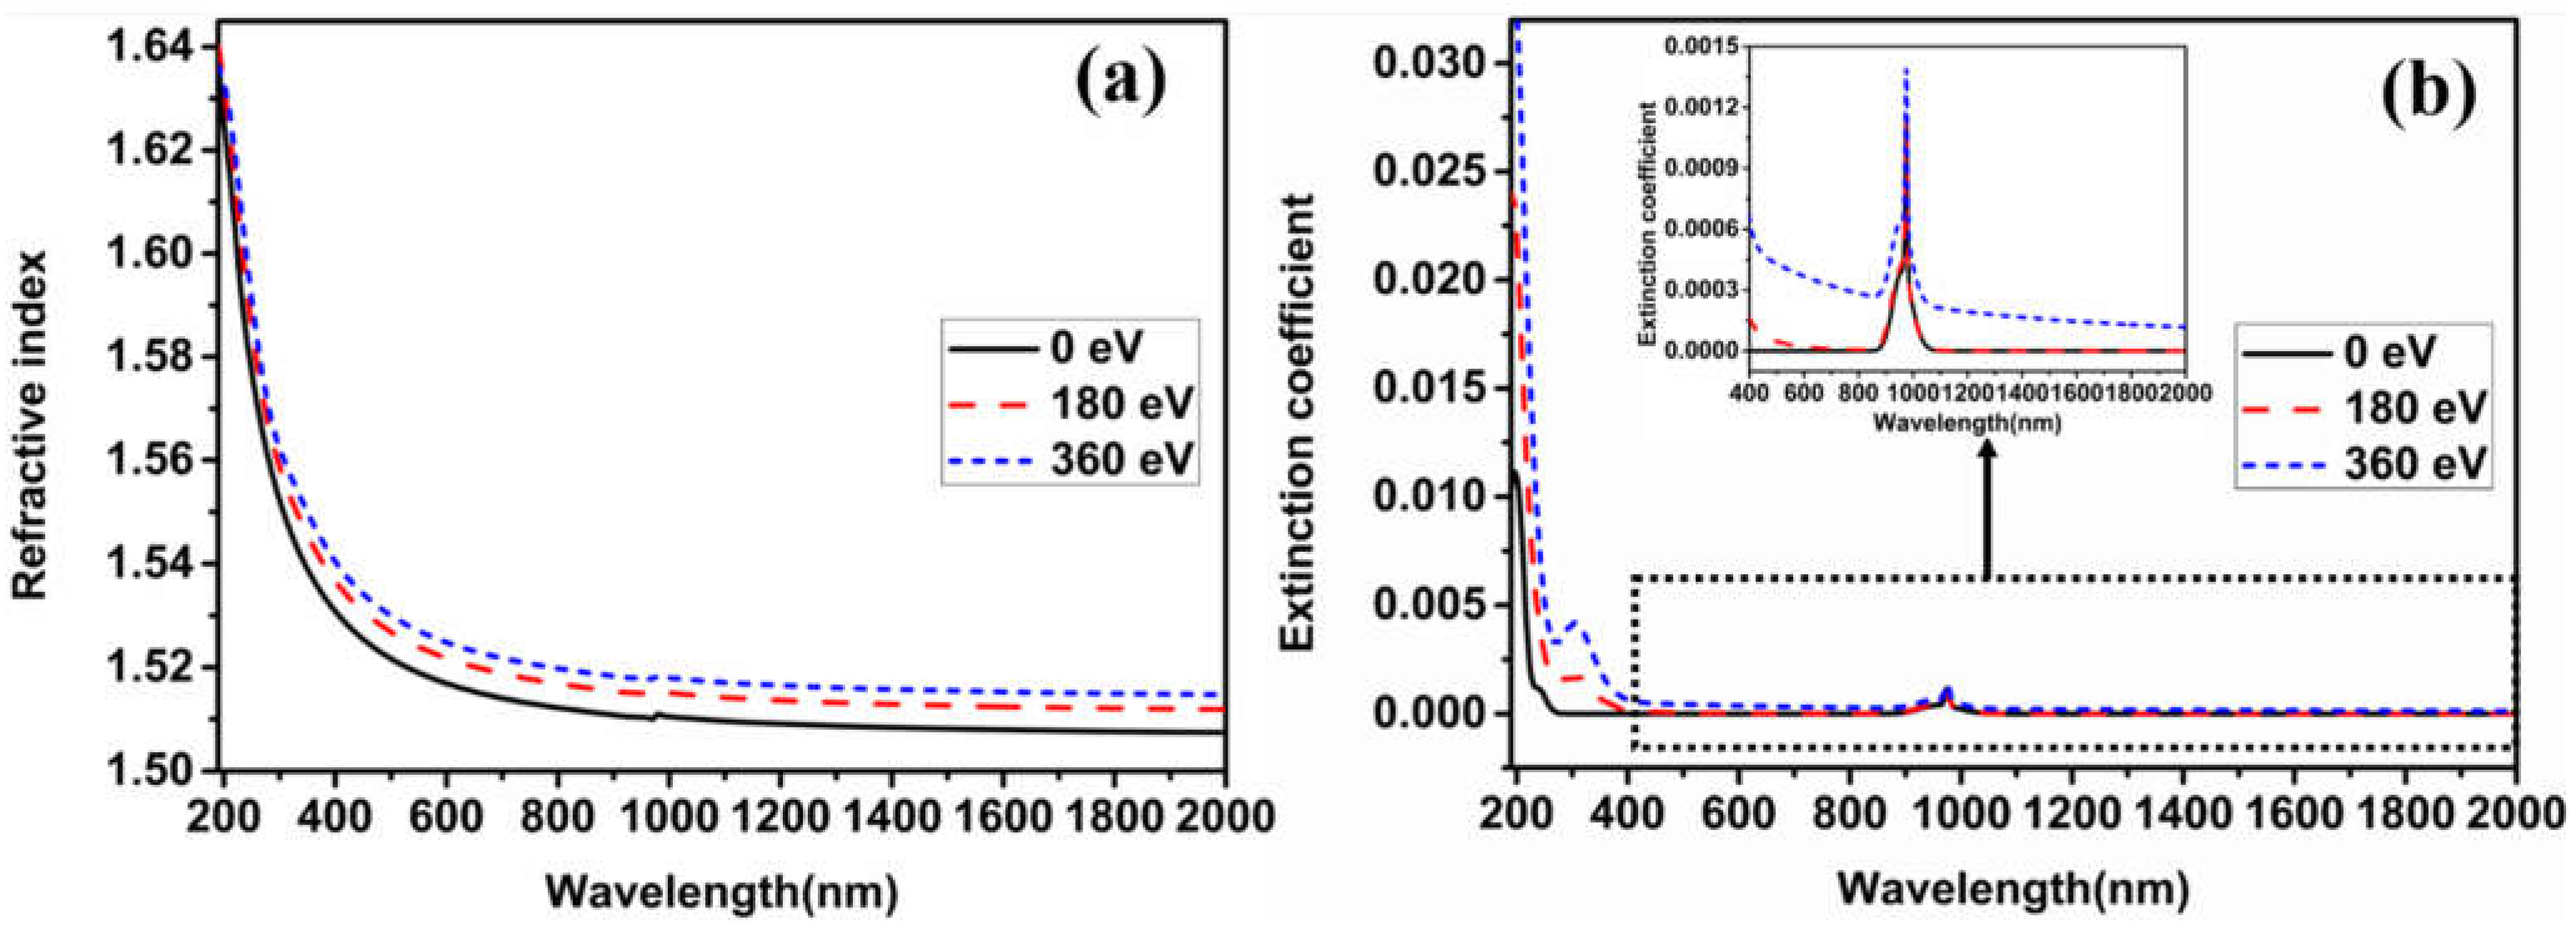
The optical constants of the YbF3 films in the range 190–2000 nm are shown in Figure 5. The dispersion characteristics of the optical constants of the YbF3 films are obvious. It can be seen from Figure 5a that the refractive index of the films increases with increasing ion energy, which is due to the increase in the higher packing density of the film. As the ion energy increases, the energy of the film particles on the substrate increases. It means the particles have larger mobility, resulting in a higher packing density. In addition, the optical absorption of the films in the visible to near-infrared region is caused by the loss of the F ion. The XPS measurement indicates that the ratio of the F and Yb of the YbF3 films decreases with increasing ion energy. Thus, the extinction coefficient of the YbF3 films increases with increasing ion energy (Figure 5b).
The spectra characteristics of the YbF3 films from 2000 nm to 12,000 nm are shown in Figure 6. There are obvious absorption peaks around 2900 nm and 6100 nm caused by the moisture adsorption of the YbF3 films with the columnar microstructure. With the increase in the ion energy, the intensity of the absorption peak becomes smaller. As the measuring and fitting spectra match very well, the optical constants of the YbF3 films from 2000 nm to 12,000 nm are obtained.
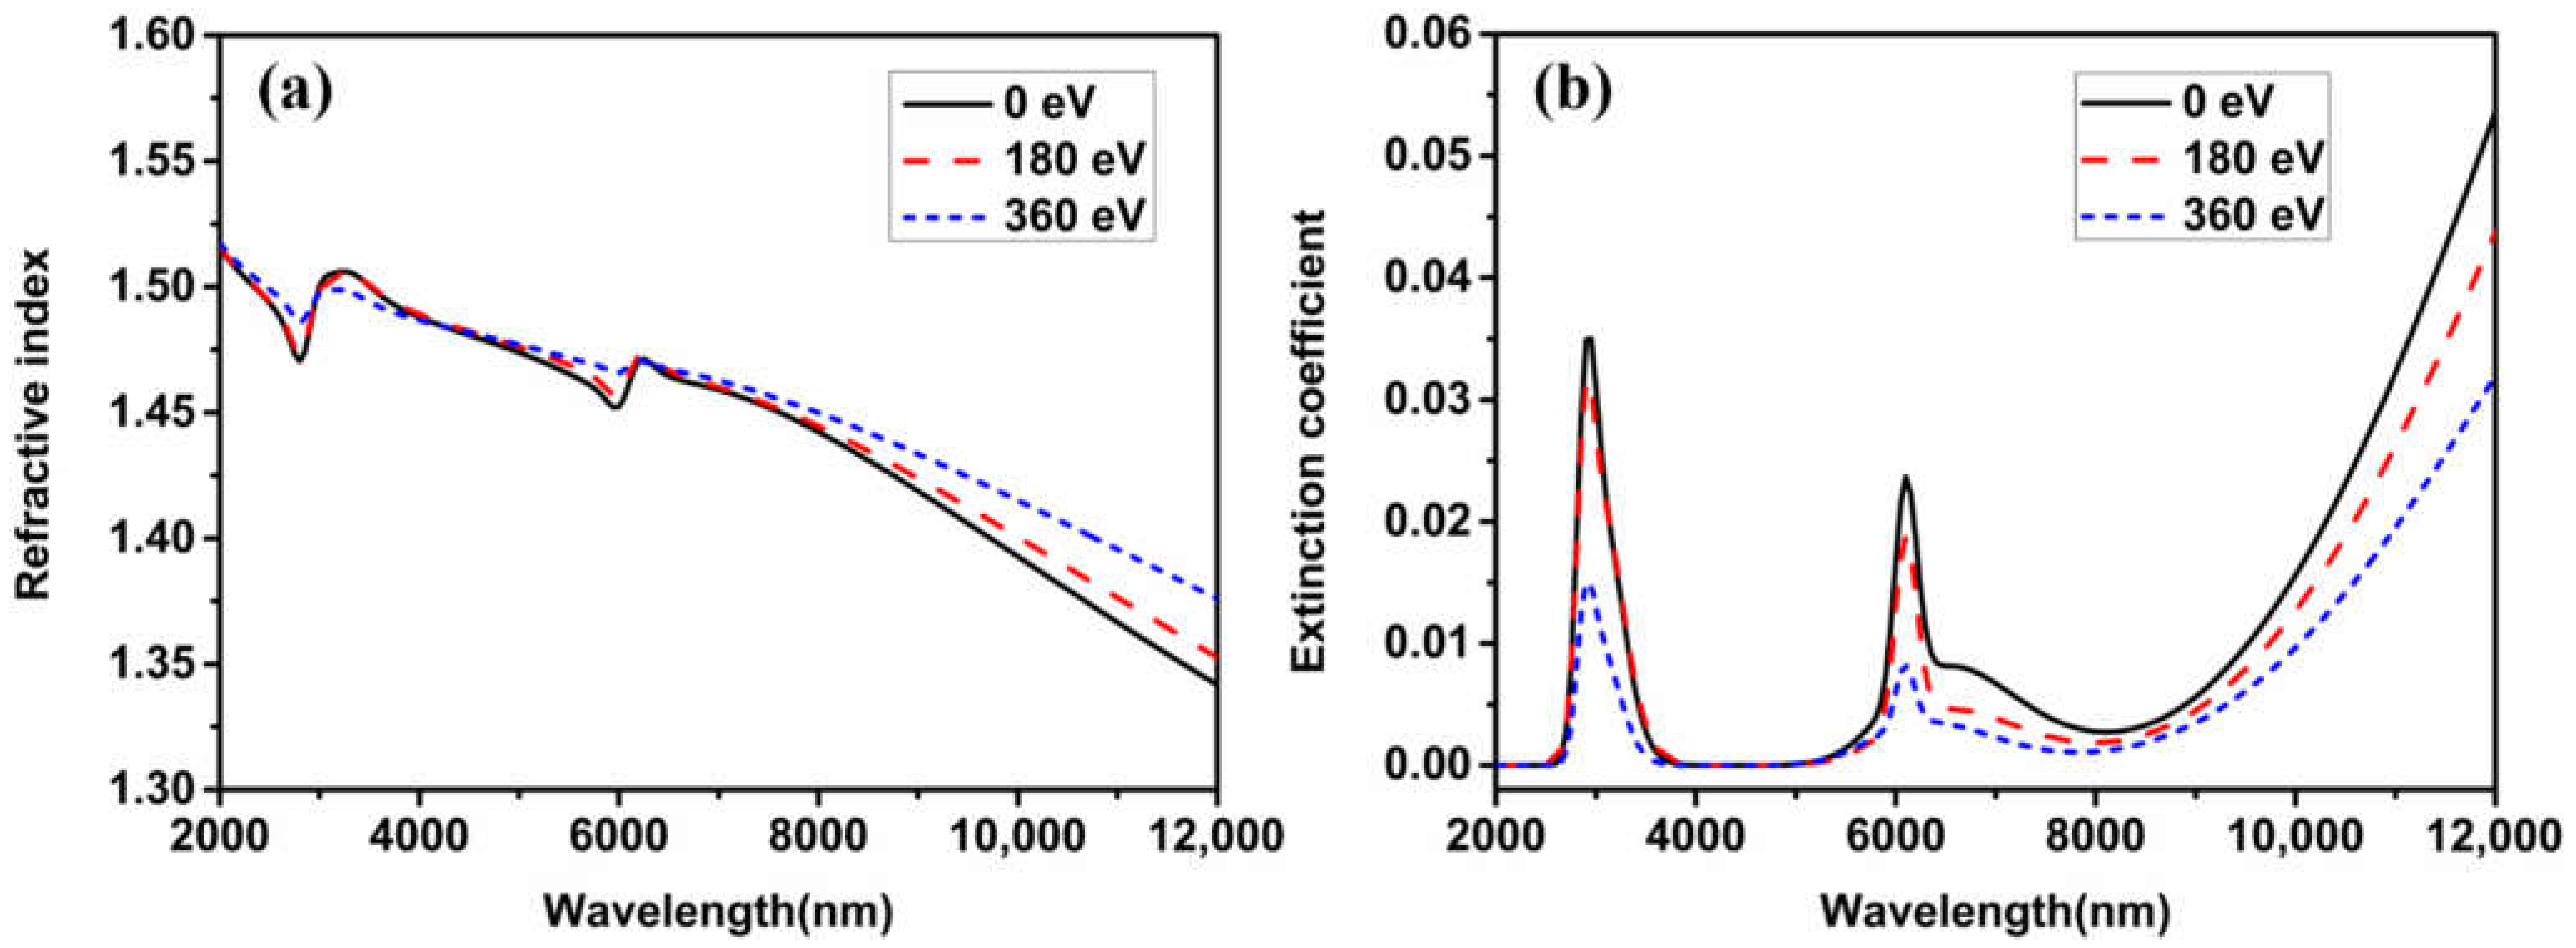
The optical constants of the YbF3 films from 2000 nm to 12,000 nm are shown in Figure 7. The optical constants changed abruptly around 2900 nm and 6100 nm. As mentioned, this phenomenon is caused by the moisture adsorption. Meanwhile, the packing density increases with the increasing ion energy, resulting in a higher refractive index. It can be seen from Figure 7 that the extinction coefficient decreases with increasing ion energy, which implies that the films with a higher packing density may absorb little moisture. It can be concluded that high-energy ion-assisted deposition is an effective way to remove the moisture adsorption. Moreover, the extinction coefficient of the film prepared at a higher ion energy is low, which is significant for fabricating low-loss optical coatings.
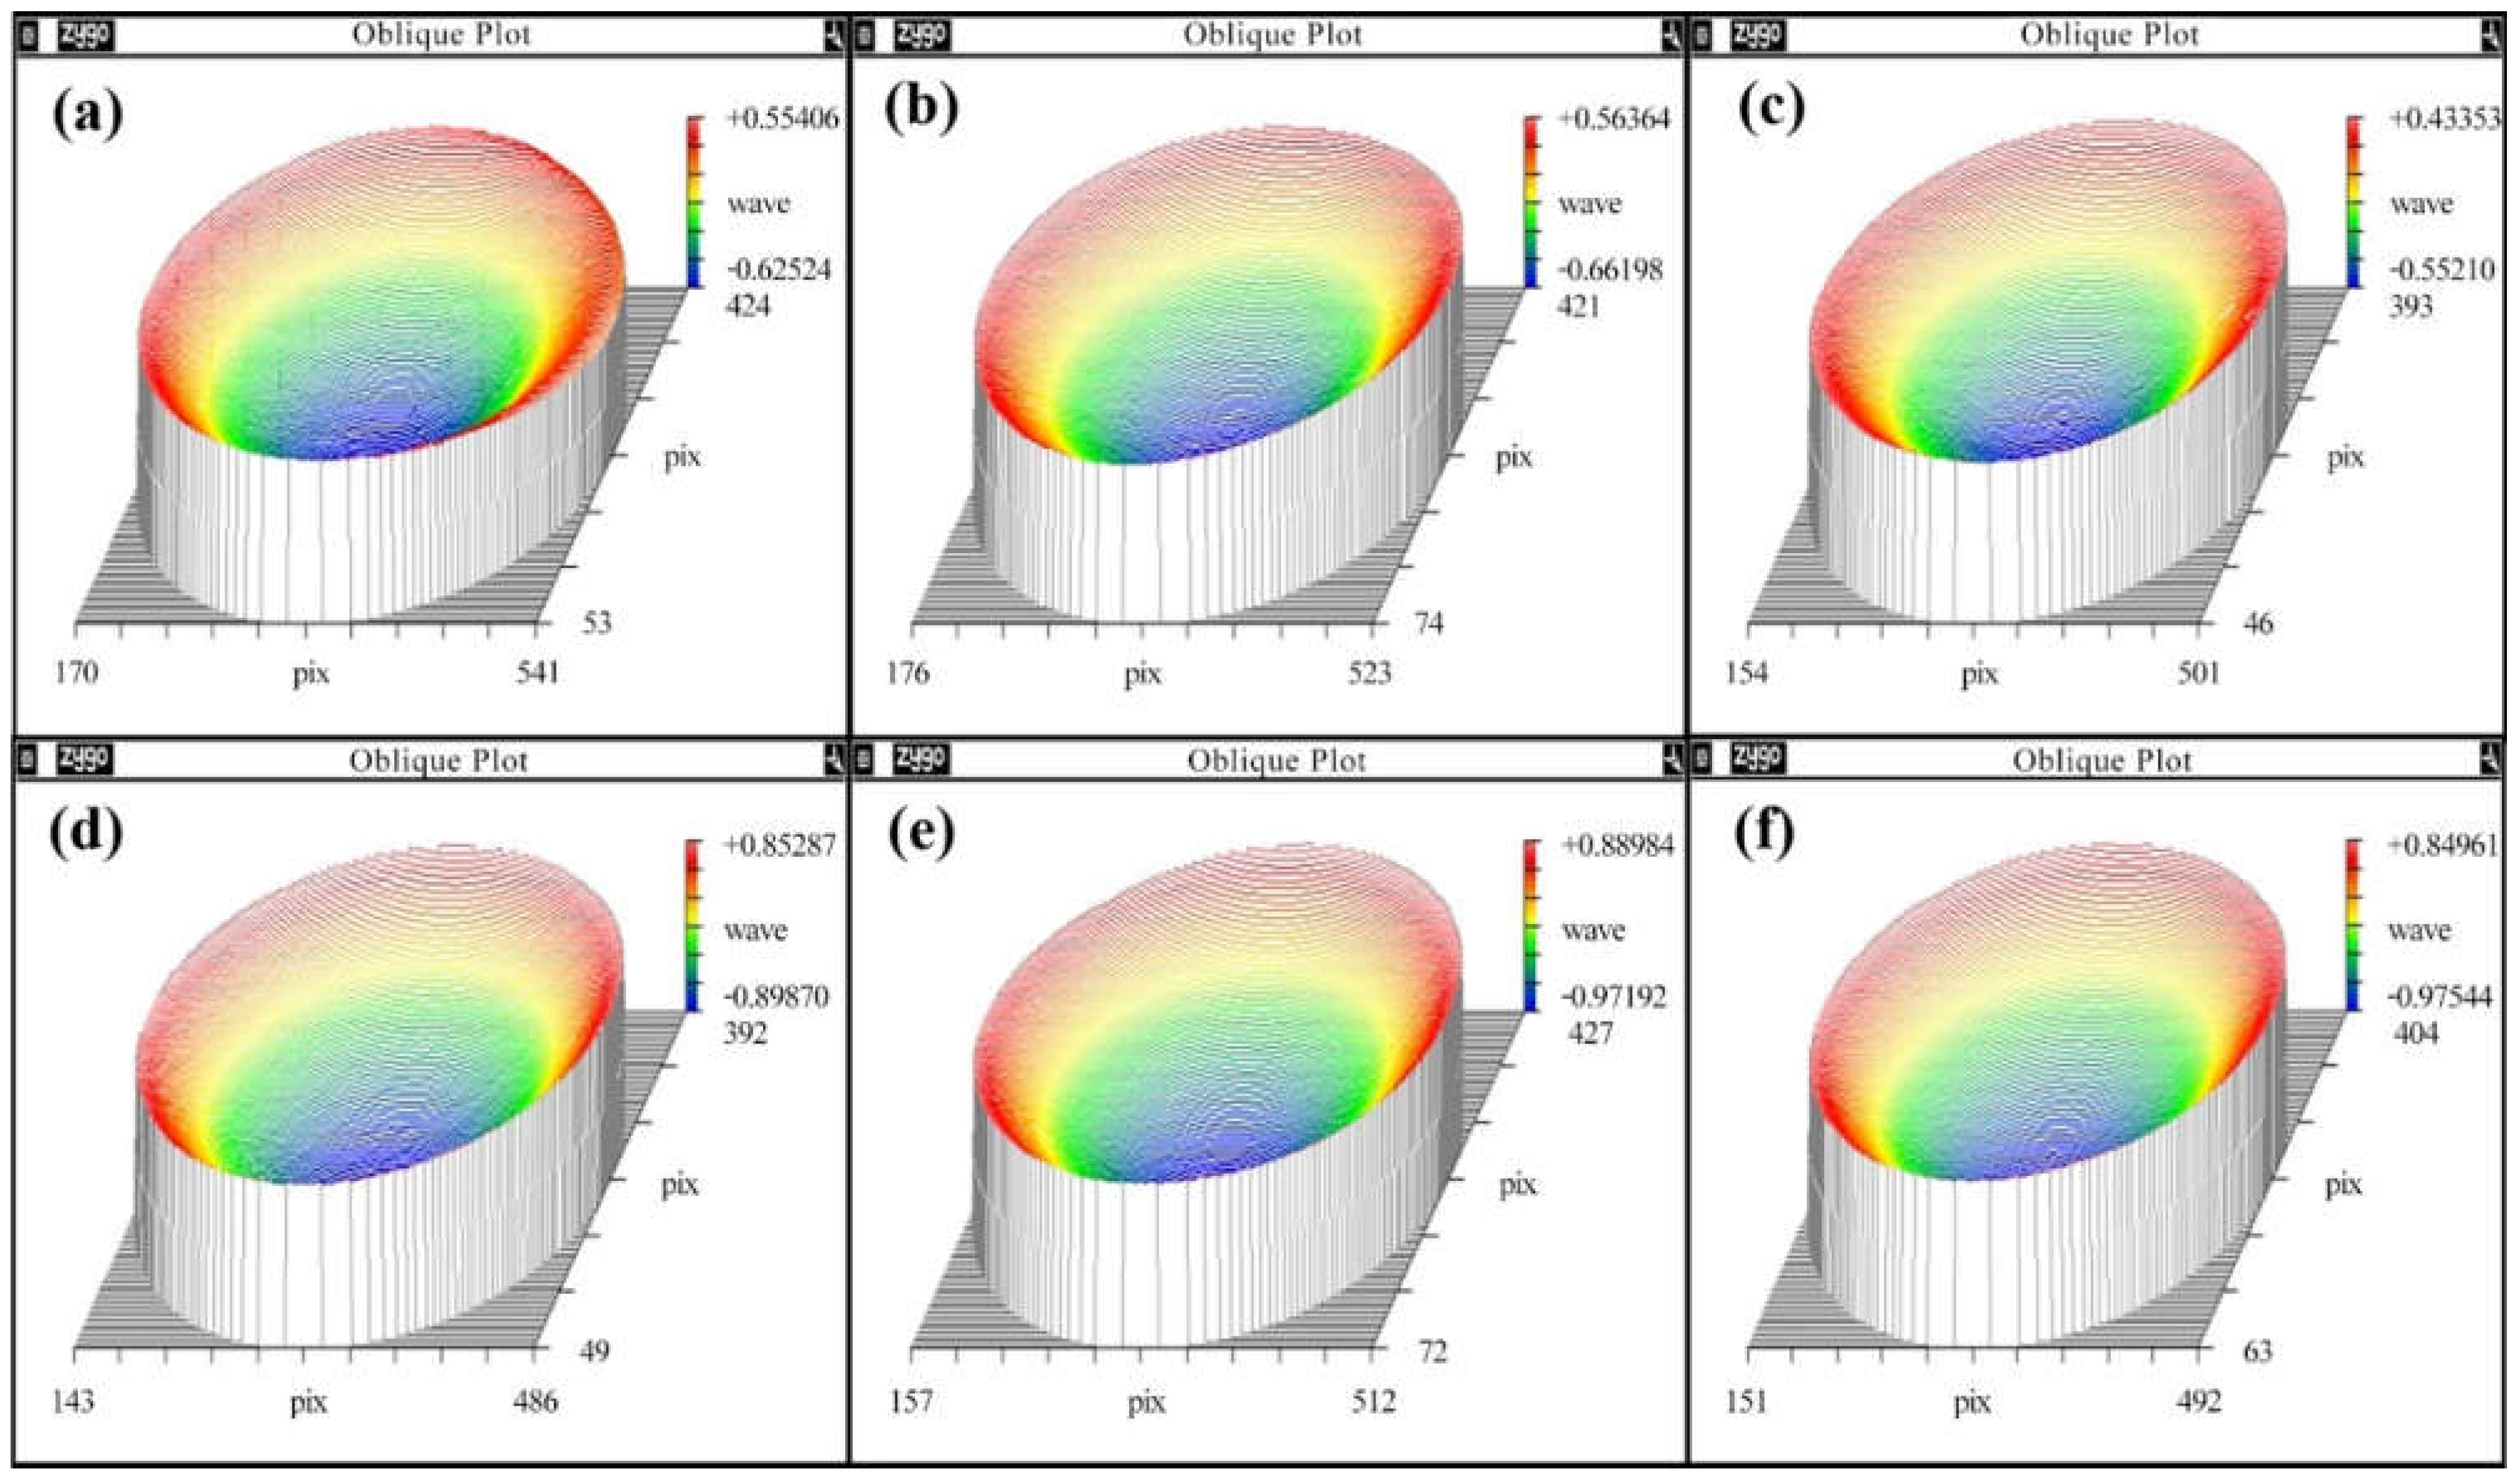
The surface shape of the YbF3 films is shown in Figure 8. The surface shape of the substrates maintains a positive curvature, while the value of the radius of curvature of the spherical surface increases after coating. This means that the YbF3 films exhibited tensile stress. The values of the total residual stress of the YbF3 films deposited at different ion energy are 0.101 GPa, 0.106 GPa and 0.146 GPa, respectively. The total residual stress is expressed as follows:
σ tot = σ int + σ the + σ ext
where σtot, σint, σthe and σext denote total residual stress, intrinsic stress, thermal stress and extrinsic stress, respectively. The σtot is affected by many factors. Firstly, as the films are deposited at the same temperature, the difference in σthe is small. Secondly, the packing density of the film increases with increasing ion energy, which will lead to the decrease in tensile stress. Finally, the disappearance of absorbed water will change the mechanical properties of the film and increase the tensile stress of the film [32]. Since the total residual stress increases with increasing ion energy, the stress caused by the moisture adsorption may play an important role in the variation of the residual stress.

4. Conclusions

The YbF3 films were prepared by ion-assisted deposition at different ion energies. The SEM measurement indicates that the surface of the YbF3 films is continuous and smooth. The XRD patterns show that the YbF3 films exhibit an amorphous structure. The XPS results reveal that ion assistance could result in the loss of the F ion and lead to the absorption of Yb2+ ions below 400 nm. The optical constants of the film are obtained as the ideal fitting results of the optical spectra. The residual stress increases with increasing ion energy, which implies that the moisture absorption has a great influence on residual stress.

Author Contributions

Writing—original draft preparation, P.S.; methodology, J.B. and J.H.; investigation, M.Y.; supervision, J.S. and Y.J.; writing—review and editing, H.L.; project administration, H.L. All authors have read and agreed to the published version of the manuscript.

Funding

This work was supported by the National Natural Science Foundation of China (61975150, 61905179), the Natural Science Foundation of Tianjin (19JCZDJC38400).

Institutional Review Board Statement

Not applicable.

Informed Consent Statement

Not applicable.

Data Availability Statement

Data sharing is not applicable to this article.

Conflicts of Interest

The authors declare no conflict of interest.

References

  1. Stolze, M.; Neff, J.; Waibel, F. Rare earth-based low-index films for IR and multispectral thin film solutions. Proc. SPIE 2017, 10448, 104481S. [Google Scholar]
  2. Zhang, Y.H.; Xiong, S.M.; Huang, W.; Zhang, K.P.; Tian, X.X. Six-spectral antireflection coating on zinc sulfide simultaneously effective for the visible, near-IR, and long wavelength IR regions. Surf. Coat. Tech. 2019, 359, 1–5. [Google Scholar] [CrossRef]
  3. Liu, W.; Tu, H.L.; Gao, M.; Su, X.P.; Zhang, S.Y.; Huo, C.S.; Yang, H. High performance DLC/BP and ZnS/YbF3 double-layer protective and antireflective coatings. J. Alloys Compd. 2013, 581, 526–529. [Google Scholar] [CrossRef]
  4. Zhupanov, V.; Fedoseev, V.; Trubetskov, M.; Amotchkina, T.; Tikhonravov, A. Design and production of three line antireflection coating for visible-far infrared spectral regions. Proc. SPIE. 2015, 9627, 962706. [Google Scholar]
  5. Fu, X.H.; Dong, L.H.; Lu, P.; Fu, X.H.; Duan, W.B.; Li, X.M.; Yin, R.J. Study of Infrared AR and Protection Coating On MgF2. Proc. SPIE 2006, 6034, 603415. [Google Scholar]
  6. Zhang, Y.H.; Xiong, S.M.; Huang, W. Study on defects in ZnS/YbF3 infrared coatings on silicon substrates. Surf. Coat. Tech. 2017, 320, 3–6. [Google Scholar] [CrossRef]
  7. Zhang, Y.P.; Zhang, Y.D. Defect study on several fluoride coatings. Proc. SPIE 2009, 7283, 72832Q. [Google Scholar]
  8. Wang, G.; Ling, X.L.; Liu, X.F.; Fan, Z.X. Effects of deposition temperature on characterization and laser-induced damage threshold of YbF3 films. Opt. Laser. Technol. 2013, 49, 274–278. [Google Scholar] [CrossRef]
  9. Rahe, M.; Ristau, D.; Schmidt, H. The effect of hydrogen concentration in conventional and IAD coatings on the absorption and laser induced damage at 10.6 µm. Proc. SPIE 1992, 1848, 335–348. [Google Scholar]
  10. Amotchkina, T.; Trubetskov, M.; Schulz, M.; Pervak, V. Comparative study of NIR-MIR beamsplitters based on ZnS/YbF3 and Ge/YbF3. Opt. Express. 2019, 27, 5557–5569. [Google Scholar] [CrossRef] [Green Version]
  11. Xiong, S.M.; Zhang, Y.D. The optical coatings of the 3.8µm reflecting and visible transmitting. Proc. SPIE 1998, 3557, 71–76. [Google Scholar]
  12. Lisitsyn, V.M.; Lisitsyna, L.A.; Popov, A.I.; Kotomin, E.A.; Abuova, F.U.; Akilbekov, A.; Maier, J. Stabilization of primary mobile radiation defects in MgF2 crystals. Nucl. Instrum. Meth. B 2016, 374, 24–28. [Google Scholar] [CrossRef]
  13. Schnellbügel, A.; Hagedorn, H.; Anton, R. Ion assisted deposition of non-toxic coatings for high power CO2 laser optics. Proc. SPIE 1994, 2253, 839–848. [Google Scholar]
  14. Zhang, Y.P.; FAN, J.Q.; Long, G.Y. Influence of deposition parameters on residual stress of YbF3 thin film. Proc. SPIE 2016, 9796, 97960N. [Google Scholar]
  15. Zhang, Y.H.; Xiong, S.M.; Huang, W.; Zhang, K.P. Determination of refractive index and thickness of YbF3 thin films deposited at different bias voltages of APS ion source from spectrophotometric methods. Adv. Opt. Techn. 2018, 7, 33–37. [Google Scholar] [CrossRef]
  16. Wang, Y.; Zhang, Y.G.; Chen, W.L.; Shen, W.D.; Liu, X.; Gu, P.F. Optical properties and residual stress of YbF3 thin films deposited at different temperatures. Appl. Optics. 2008, 47, C319–C323. [Google Scholar] [CrossRef] [PubMed]
  17. Su, W.T.; Li, B.; Liu, D.Q.; Zhang, F.S. The determination of infrared optical constants of rare earth fluorides by classical Lorentz oscillator model. J. Phys. D Appl. Phys. 2007, 40, 3343–3347. [Google Scholar] [CrossRef]
  18. Zhang, Y.H.; Zhang, K.P.; Huang, W.; Xiong, S.M. Determination of infrared refractive index of ZnS and YbF3 thin films by spectroscopy. Optik 2018, 170, 321–327. [Google Scholar] [CrossRef]
  19. Ferlauto, A.S.; Ferreira, G.M.; Pearce, J.M.; Wronski, C.R.; Collins, R.W. Analytical model for the optical functions of amorphous semiconductors from the near-infrared to ultraviolet: Applications in thin film photovoltaics. J. Appl. Phys. 2002, 92, 2424–2436. [Google Scholar] [CrossRef] [Green Version]
  20. Wang, L.S.; Liu, H.S.; Jiang, Y.G.; Yang, X.; Liu, D.D.; Ji, Y.Q.; Zhang, F.; Chen, D.Y. Effects of hot-isostatic pressing and annealing post-treatment on HfO2 and Ta2O5 films prepared by ion beam sputtering. Optik 2017, 142, 33–41. [Google Scholar] [CrossRef]
  21. Liu, D.D.; Liu, H.S.; Ji, Y.Q.; Jiang, Y.G.; Xing, Y.Z.; Leng, J.; Zhuang, K.W. Research VIS-NIR optical constants of Si films deposited by different techniques. Proc. SPIE 2018, 10691, 106910P. [Google Scholar]
  22. Liu, D.D.; Liu, H.S.; Jiang, C.H.; Leng, J.; Zhang, Y.M.; Zhao, Z.H.; Zhuang, K.W.; Jiang, Y.G.; Ji, Y.Q. Temperature dependence of the infrared optical constants of germanium films. Thin Solid Films 2015, 592, 292–295. [Google Scholar] [CrossRef]
  23. Ji, Y.Q.; Jiang, Y.G.; Liu, H.S.; Wang, L.S.; Liu, D.D.; Jiang, C.H.; Fan, R.W.; Chen, D.Y. Effects of thermal treatment on infrared optical properties of SiO2 films on Si Substrates. Thin Solid Films 2013, 545, 111–115. [Google Scholar] [CrossRef]
  24. Thielsch, R.; Gatto, A.; Kaiser, N. Mechanical stress and thermal-elastic properties of oxide coatings for use in the deep-ultraviolet spectral region. Appl. Opt. 2002, 41, 3211–3217. [Google Scholar] [CrossRef] [PubMed]
  25. Zhang, Y.; Wang, R.Z.; Xiao, S.G.; Qu, M.H.; Li, K.Y.; Liu, C.X.; Wang, X.F.; Yan, X.H.; Yan, H. Efficient ultraviolet and near-infrared conversion amorphous YbF3: Er film. J. Lumin. 2014, 145, 351–356. [Google Scholar] [CrossRef]
  26. Schnellbügel, A.; Selle, B.; Anton, R. Determination of the Stoichiometry and the Yb2+/Yb3+ Ratio in YbFx Optical IAD Films by RBS and in situ XPS Analysis. Microchim Acta. 1997, 125, 239–243. [Google Scholar] [CrossRef]
  27. Schmidt, S.; Hüfner, S. X-ray photoemission of YbInCu4. Phys. Rev. B 2005, 71, 195110. [Google Scholar] [CrossRef]
  28. Ohno, Y. XPS studies of the intermediate valence state of Yb in (YbS)1.25CrS2. J. Electron. Spectrosc. 2008, 165, 1–4. [Google Scholar] [CrossRef]
  29. Suga, S.; Ogawa, S.; Namatame, H.; Taniguchi, M.; Kakizaki, A.; Ishii, T.; Fujimori, A.; Oh, S.J.; Kato, H.; Miyahara, T.; et al. XPS and UPS Studies of Valence Fluctuation and Surface States of Yb4As3, Yb4Sb3 and Yb4Bi3. J. Phys. Soc. Jpn. 1989, 58, 4534–4543. [Google Scholar] [CrossRef]
  30. Kaczmarek, S.M.; Tsuboi, T.; Ito, M.; Boulon, G.; Leniec, G. Optical study of Yb3+/Yb2+ conversion in CaF2 crystals. J. Phys. Condens. Matter. 2005, 17, 3771–3786. [Google Scholar] [CrossRef] [Green Version]
  31. Nicoara, I.; Lighezan, L.; Enculescu, M.; Enculescu, I. Optical spectroscopy of Yb2+ ions in YbF3-doped CaF2 crystals. J. Cryst. Growth 2008, 310, 2026–2032. [Google Scholar] [CrossRef]
  32. Hirsch, E.H. Stress in porous thin films through adsorption of polar molecules. J. Phys. D 1980, 13, 2081–2094. [Google Scholar] [CrossRef]
Figure 1. SEM images of the YbF3 films prepared at different ion energies. (a) 0 eV. (b) 180 eV. (c) 360 eV.
Coatings 12 01693 g001
Figure 2. XRD spectra of the YbF3 films.
Coatings 12 01693 g002
Figure 3. XPS spectra of the YbF3 films. (a) Narrow-scanning XPS spectra of Yb 4d for the film deposited at ion energy of 0 eV. (b) Narrow-scanning XPS spectra of Yb 4d for the film deposited at ion energy of 180 eV. (c) Narrow-scanning XPS spectra of Yb 4d for the film deposited at ion energy of 360 eV. (d) Narrow-scanning XPS spectra of F 1s for the films.
Coatings 12 01693 g003
Figure 4. Fitting and measuring results of optical spectra from 190 nm to 2000 nm of YbF3 films prepared at different ion energies. (a) 0 eV. (b) 180 eV. (c) 360 eV.
Coatings 12 01693 g004
Figure 5. Optical constants of YbF3 films from 190 nm to 2000 nm. (a) Refractive index. (b) Extinction coefficient.
Coatings 12 01693 g005
Figure 6. Fitting and measuring results of optical spectra from 2000 nm to 12,000 nm of YbF3 films prepared at different ion energies. (a) 0 eV. (b) 180 eV. (c) 360 eV.
Coatings 12 01693 g006
Figure 7. Optical constants of YbF3 films from 2000 nm to 12,000 nm. (a) Refractive index. (b) Extinction coefficient.
Coatings 12 01693 g007
Figure 8. Surface shape of the YbF3 film deposited at different ion energies. (a) 0 eV before coating. (b) 180 eV before coating. (c) 360 eV before coating. (d) 0 eV after coating. (e) 180 eV after coating. (f) 360 eV after coating.
Coatings 12 01693 g008
Publisher’s Note: MDPI stays neutral with regard to jurisdictional claims in published maps and institutional affiliations.