Article

Properties and Compatibility Assessment of the Slurry with Quicklime for Fissure Restoration of Earthen Sites in Northwest China

1
Western Center for Disaster Mitigation in Civil Engineering, Ministry of Education, Lanzhou University of Technology, Lanzhou 730050, China
2
Department of Cultural Relics Management, Yinchuan 750002, China
3
Northwest Research Institute Co., Ltd. of C.R.E.C., Lanzhou 730000, China
*
Author to whom correspondence should be addressed.
Coatings 2022, 12(9), 1255; https://doi.org/10.3390/coatings12091255
Submission received: 31 July 2022 / Revised: 22 August 2022 / Accepted: 24 August 2022 / Published: 27 August 2022
(This article belongs to the Special Issue Coatings for Cultural Heritage: Cleaning, Protection and Restoration)

Abstract

:
Slurries with quicklime for fissure restoration in earthen sites in northwest China can reduce dry shrinkage and reinforce the soil on both sides of fissure. However, their full-scale properties need to be investigated and a compatibility assessment needs to be carried out in order to proceed with further research. The paper pays attention to the full-scale properties of the slurry and typical site soils. A total of 3 slurries with different mix proportions and 35 earthen sites in northwest China are selected to test properties, including basic physical properties, mechanical properties, thermal properties, and water-physical properties. The test results show the properties of the slurries are close and that the properties of the site soils are obviously different. Then, a compatibility assessment is considered as a multi-criteria decision-making problem to solve. Three universal and necessary steps in the paper are to select assessment indicators, weigh each indicator, and sort all of the samples. The AHP, CRITIC, and TOPSIS methods are adopted in the process of the compatibility assessment. The results of assessment show that most site soils are commonly or highly compatible with three slurries; few site soils are very highly or lowly compatible; and that no site soils are very lowly compatible, which means that the three slurries with quicklime with different mix proportions are acceptable for most earthen sites in NW China. The paper provides much basic data of the slurries with quicklime and site soils widely distributed in arid region in NW China, and also builds a model of the compatibility assessment which has potential for the further application of slurries with quicklime.

1. Introduction

Fissures are a typical and common erosion pattern of earthen sites in Northwest China, and fissure grouting is a common and effective method to repair fissures [1]. It has been suggested that soil can be used as repair materials for earthen buildings to improve their compatibility [2,3]. Typically used slurries in the field include slurry with calcined ginger [4], modified lime [5], and gypsum [6]. However, dry shrinkage of the soil gradually becomes an issue in conservation practice. Some researchers suggest that adding quicklime to the slurry may reduce shrinkage [7]. Fissure grouting on site shows that no new cracks develop, and that the soil on both sides of the fissure is strengthened due to the slurry expansion when adding quicklime [8]. Now, it is essential that full-scale properties be tested and analyzed for further potential applications. Thus, it means the compatibility assessment of the slurry with quicklime is crucial.
Compatibility is certainly one of the most frequently used words in conservation practice, and the concept of “more compatibility” is widely accepted by experts [9]. An essential component of conservation actions is the assessment of compatibility between conservation materials and relics. However, the compatibility requirements are not same for various conservation practice (for example, different relics [10,11,12] (lithoid, earthen, wooden, etc.), different climates [13,14] (humid, arid, etc.), and different purposes (restoration, consolidation, etc.). It is understood that a universal definition of compatibility to meet all requirements is not possible and that absolute compatibility is impractical. As mentioned in the literature [15]: “… in spite of the fact that each one might have an idea of what are “proper and compatible” materials, it is felt that there is a need for a better definition of these concepts when historical structures are concerned, although bearing in mind that ‘‘absolute compatibility’’ is more a wishful thinking than an objective and feasible reality.”
Although compatibility is not easy to define, some compatibility assessments are still often carried out. Unlike compatibility, incompatibility seems to be more easily approved by conservation workers. Some typical examples of incompatibility are that too much difference in strength leads to incompatible deformation, too much difference in color leads to a loss of historical information, and too much difference in gas/water permeability leads to interface separation [8], etc. This means that we can judge that the conservation material is incompatible with the exact relic when considering a certain character. This provides the possibility of operation for compatibility assessments [9].
The main goal of a compatibility assessment is to choose the most compatible materials or to optimize the conservation material for its specific application by varying several different parameters. So, the implication here may be that it is necessary to determine how to quantify the results of compatibility assessment and how to determine its relative position between “absolute compatibility” and “absolute incompatibility”. These are the final outcomes that the compatibility assessment needs to present.
At present, qualitative results of compatibility assessment are common. Cui et al. [16] studied the mechanical compatibility of fissure grouting slurry with quicklime and thought that the slurry with the mass mix proportion of 3:2:5 and the liquid-solid ratio of 0.5 is the most compatible due to the most similar mechanical parameters. Loureiro et al. [17] studied the assessment of compatibility between historic mortars and lime-METAKAOLIN restoration mortars made from amazon industrial waste, and the conclusion is the restoration mortars are compatible with historic mortars as the mineralogical composition and physical and mechanical properties are similar. Saez-Perez et al. [18] studied the characterization and chromatic assessment of gypsum-based pastes for construction and heritage restoration, and thought the colorimetric analysis by means of quantitative spectrophotometry is of vital importance when determining the loss of color intensity of the pastes used. Lubelli et al. [19] studied the characterization and compatibility assessment of commercial stone repair mortars, and the conclusion is some requirements are hard to be fulfilled and not all requirements can be fulfilled at the same time. Sala et al. [20] studied the lightweight natural lime composites for rehabilitation of historical heritage, and thought several natural lime composites satisfies different strength/density requirements. Mazzuca et al. [21] studied polyvinyl alcohol-based hydrogels as new tunable materials for application in the cultural heritage field, and thought the reported gels are optimum candidates for paper cleaning applications due to appropriate mechanical and retentive properties. Bal et al. [22] studied the oxidation-resistant copper nanoparticles and their possible application in nanofluid and nanohydrogels, and the nanoparticles were prepared with biocompatible and naturally available polymers.
Meanwhile, according to the related researches, the compatibility includes multiple branches, such as physical-chemical branch, mechanical branch, artistic branch, and so on, even though a particular conservation is concerned. Obviously, compatibility assessment becomes a multi-criteria decision-making (MCDM) problem when considering every branch of compatibility. Lots of studies have been reported for MCDM in different fields and some typical methods are widely adopted [23,24,25,26].
In this paper, the focus is the properties and assessment of compatibility between the slurry for fissure grouting and site soils in Northwest China. The four branches of properties (basic physical, mechanical, thermal, water-physical) are tested whether the slurry and site soils. Based the results of properties, the compatibility assessment is carried out. Total 12 indicators are selected, the combined weight is produced by the subjective and objective weights, and all site soils are ranked with TOPSIS. The research may have an obvious impact on some practical applications.

2. Materials and Methods

2.1. Materials

2.1.1. Slurries

According to the previous related researches [7,8], a micro-expansion is caused when the mass proportion of quicklime reaches 30%. To ensure the appearance of the micro-expansion, the mass proportion of quicklime adopts 30%, and the mass proportion of fly ash adopts 10%, 20% and 30%. To keep a similar consistency, corresponding with the mass proportion of fly ash, the liquid-solid ratio adopts 0.52, 0.50, and 0.48 [7]. Table 1 shows the details of mix proportions (mass) of slurries.
Quicklime is purchased from Tianyu Fine Chemical Company in Lanzhou, China. Based on laboratory test results, the standard designation of the quicklime is EN 459-1 CL 90-Q (R5, P1) in accordance with Building Lime—Part 1: definitions, specifications and conformity criteria (BS EN 459-1: 2015).
Fly ash is purchased from Xigu Thermal Power Plant, Lanzhou, China. The chemical composition is shown in Table 2. The fly ash belongs to Category N in accordance with Fly ash for concrete Part 1: Definition, specifications and conformity criteria (BS EN 450-1: 2012). Meanwhile, fly ash is original and has not undergone any alkaline activation process.
Soil comes from the Gouya Mountain, Lanzhou, China, and its physical properties are shown in Table 3.
Modified polyvinyl alcohol solution (often called SH solution in Chinese literature) is colorless and odorless, and can be diluted indefinitely by water. The raw concentration of modified polyvinyl alcohol solution is 5% (mass fraction), and its density is 1.09 g/cm3 and its viscosity is 51.45 × 10⁻³ Pa⋅s at a temperature of 25 °C. The concentration of 1.5% is used in this work. The purpose of adding modified polyvinyl alcohol (PVA) solution is to improve the cohesion and the strength of the slurry since PVA molecules form the film covering and the filiform bonding around soil particles, and eventually connect to form a stable spatial mesh network [27,28]. Note that modified polyvinyl alcohol solution can stay stable indoors. A solid film can only form in the wall of the container when the solution in the container dries. A solid jelly can form when the solution is exposed in low temperature (below 0 °C) for a long time. The film and the jelly are no longer soluble in water.
The following is the manufacture process of the slurry. First, the mixture of quicklime, fly ash and site soil with the designed mix proportion is stirred at a speed of 450 r/min for two minutes. Then, the binder is mixed and stirred at the same speed for one minute according to the designed liquid-solid ratio. Finally, the prepared slurry is poured into the mold to shape. The slurry is shaped for 24 h in the cube model of 70.7 mm. The slurry sample is exposed to the indoor air for 63 d. All specimens for tests are cut from the original cube sample.

2.1.2. Site Soils

All site soils are picked out form the crumbling part of each earthen ruins (Figure 1a), and then carefully wrapped in tissue paper and packed in sticky tape (Figure 1b). Site soils are transported into the laboratory, and then a series of tests are taken in the laboratory.
Thirty-five typical earthen sites distributed in Northwest China are adopted. Table 4 shows the basic information of every earthen site, such as the latitude, the longitude, the architectural form, and the construction period. Furthermore, codes ES01~ES35 indicate the earthen site from north to south.

2.2. Tests

The same tests are taken for three slurries and thirty-five site soils in the laboratory, and four branches of the properties are considered in the paper. Three replicates samples are prepared for each test.
For basic physical properties, the density, specific gravity, and water content are tested meeting the Standard for geotechnical testing method (GB/T 50123-2019). The density is tested with the wax sealed method, the specific gravity is tested with the pycnometer and the water content is tested with the drying method.
For mechanical properties, the compression and tension strength, inner cohesion and internal friction angle are tested. The compression test is uniaxial and unconfined, and the tension test is with the Brazilian tensile method. The loading machine is the electro-hydraulic press machine with the maximum load of 30 kN (Figure 2a), and the loading rate is 1 mm/min for the compression test and 0.5 mm/min for the tension test. From the load-displacement curve, the stress-strain curve can be calculated. The modulus of elasticity is the slope of the linear part in the stress-strain curve. The inner cohesion and internal friction angle are obtained through the direct shear test. For the soil samples (φ61.8 mm × 20 mm), the normal stress (σ) is designed as 100, 200, 300, and 400 kPa, and the shear rate is designed as 0.8 mm/min. The maximum of the shear stress (τ) is recorded corresponding with the normal stress, and then the four point is drawn and fitted with the line in the σ-τ coordinate system. The equation of the fitting line is certain, and the constant is the inner cohesion and the slope is the tangent of the internal friction angle according to the Mohr-Coulomb law. The test machine is the ZJ strain-controlled shear machine from Nanjing Soil Instrument Factory (Figure 2b).
For thermal properties, the thermal conductivity, coefficient of thermal diffusion and coefficient of heat expansion are tested. The thermal tests are taken using Xiangke Test Machine for Thermal Conduction DRE-2C. The thermal conductivity and the coefficient of heat diffusion is tested by Transient plane source method (TPS) meeting the standard Plastics—Determination of the thermal conductivity and thermal diffusivity- Part 2: Transient plane heat source (hot disc) method (ISO22007-2-2008), and the size of the specimen is 5 cm × 5 cm × 1.5 cm. The specific heat capacity is calculated with the density, thermal conductivity and coefficient of thermal diffusion. The coefficient of heat expansion is tested with Dongfang Test Machine for heat expansion PCY-III-1400, and the size of the specimen is φ8 mm × 23 mm. The rising rate of temperature is 2 °C/min and the maximum of temperature is 150 °C in the test process.
For water-physical properties, the permeability coefficient is tested according to the Chinese Standard for geotechnical testing method (GB/T 50123-2019) and the disintegration rate is tested according to the literature [29,30].

3. Results

3.1. Test Results of Slurries

3.1.1. Basic Physic Test

Figure 3 shows the results of basic physic test, including density, specific gravity, water content, and porosity. The slurry with the mix proportion 3:2:5 has the minimum of the density, specific gravity and water content, which shows there are more pores in the slurry. So, the porosity of the slurry with 3:2:5 is the maximum among three slurries. The specific gravity decreases with the increase of the proportion of fly ash, other indexes do not. On the whole, the basic physical properties of the three slurries are close.

3.1.2. Mechanical Test

As can be seen from Figure 4a, the compression strength of slurries with mix proportion 3:1:6, 3:2:5, and 3:3:4 is 1.48, 1.575, and 1.524 MPa; the tensile strength is 0.229, 0.243, and 0.235 MPa. As can be seen from Figure 4b, the modulus of elasticity of slurries with mix proportion 3:1:6, 3:2:5, and 3:3:4 is 180, 202, and 193 MPa. As can be seen from Figure 4c, the inner cohesion of slurries with mix proportion 3:1:6, 3:2:5, and 3:3:4 is 232, 241, and 215 kPa; the internal friction angle is 39.65°, 43.92°, and 40.12°. The slurry with 3:2:5 has the maximum of the all mechanical properties. It is obvious that the mechanical properties of the slurry with mix proportion 3:2:5 are the best.

3.1.3. Thermal Test

Figure 5a,b show the results of thermal test for slurries. The thermal conductivity of slurries with mix proportion 3:1:6, 3:2:5, and 3:3:4 is 0.809, 0.825, and 0.814 W/m/K; the coefficient of thermal diffusion is 0.809, 0.953, and 0.809 m2/s. The specific heat capacity of slurries with mix proportion 3:1:6, 3:2:5 and 3:3:4 is 0.855, 0.753, and 0.867 kJ/kg/K; the coefficient of heat expansion is 5.68 × 10⁻⁶, 5.35 × 10⁻⁶, and 5.51 × 10⁻⁶ 1/K. Overall, high thermal conductivity and coefficient of thermal diffusion and low specific heat capacity of the slurry with mix proportion 3:2:5 could reduce heat accumulation, and low coefficient of heat expansion could reduce the heat deformation.

3.1.4. Water-Physical Test

As can be seen from Figure 6, the permeability coefficient of slurries with mix proportion 3:1:6, 3:2:5 and 3:3:4 is 18.7 × 10⁻⁶, 23.2 × 10⁻⁶ and 21.3 × 10⁻⁶ cm/s. The slurry with 3:2:5 has the maximum of the permeability coefficient. After being soaked for enough time, the mass of all slurries does not change and the disintegration does not occur. So, the disintegration rate of three slurries is 0 g/min.

3.2. Test Result of Site Soils

3.2.1. Basic Physic Test

As can be seen from Figure 7, the maximum and minimum of the density of 35 site soils is 2.11 g/cm3 and 1.38 g/cm3, and the average (marked with the red dashed line and the red arrow and text in Figure 7a) is 1.633 g/cm3; the maximum and minimum of the specific gravity of 35 site soils is 2.74 and 2.47, and the average (marked with the red dashed line and the red arrow and text in Figure 7b) is 2.614; the maximum and minimum of the water content of 35 site soils is 4.07% and 0.12%, and the average (marked with the red dashed line and the red arrow and text in Figure 7c) is 1.604%; the maximum and minimum of the density of 35 site soils is 47.87% and 19.92%, and the average (marked with the red dashed line and the red arrow and text in Figure 7d) is 38.478%; the maximum and minimum of the plasticity index of 35 site soils is 12.57 and 8.28, and the average (marked with the red dashed line and the red arrow and text in Figure 7e) is 10.153; the maximum and minimum of the liquidity index of 35 site soils is −0.93 and −2.84, and the average (marked with the red dashed line and the red arrow and text in Figure 7f) is −1.830.

3.2.2. Mechanical Test

As can be seen from Figure 8, the maximum and minimum of the compression strength of 35 site soils is 2.303 and 0.146 MPa, and the average (marked with the red dashed line and the red arrow and text in Figure 8a) is 0.859 MPa; the maximum and minimum of the tensile strength of 35 site soils is 0.35 and 0.01 MPa, and the average (marked with the red dashed line and the red arrow and text in Figure 8b is 0.118 MPa; the maximum and minimum of the modulus of elasticity of 35 site soils is 212 MPa and 11 MPa, and the average (marked with the red dashed line and the red arrow and text in Figure 8c) is 76.17 MPa; the maximum and minimum of the inner cohesion of 35 site soils is 393 and 3 kPa, and the average (marked with the red dashed line and the red arrow and text in Figure 8d) is 112.14 kPa; the maximum and minimum of the internal friction angel of 35 site soils is 54.4° and 18°, and the average (marked with the red dashed line and the red arrow and text in Figure 8e) is 35.81°.

3.2.3. Thermal Test

As can be seen from Figure 9, the maximum and minimum of the thermal conductivity of 35 site soils is 1.092 and 0.548 W/m/K, and the average (marked with the red dashed line and the red arrow and text in Figure 9a) is 0.812 W/m/K; the maximum and minimum of the coefficient of thermal diffusion of 35 site soils is 1.190 and 0.357 m2/s, and the average (marked with the red dashed line and the red arrow and text in Figure 9b) is 0.689 m2/s; the maximum and minimum of the specific heat capacity of 35 site soils is 0.9813 and 0.4592 kJ/kg/K, and the average (marked with the red dashed line and the red arrow and text in Figure 9c) is 0.755 kJ/kg/K; the maximum and minimum of the coefficient of heat expansion of 35 site soils is 15.10 × 10⁻⁶ and 1.83 × 10⁻⁶ 1/K, and the average (marked with the red dashed line and the red arrow and text in Figure 9d) is 8.29 × 10⁻⁶ 1/K.

3.2.4. Water-Physical Test

As can be seen from Figure 1, the maximum and minimum of the permeability coefficient of 35 site soils is 69.7 × 10⁻⁶ and 1.7 × 10⁻⁶ cm/s, and the average (marked with the red dashed line and the red arrow and text in Figure 10a) is 26.671 × 10⁻⁶ cm/s; the maximum and minimum of the coefficient of thermal diffusion of 35 site soils is 1.67 and 0.001 g/min, and the average (marked with the red dashed line and the red arrow and text in Figure 10b) is 0.353 g/min.

4. Analysis of Compatibility Assessment

There are three steps to accomplish the compatibility assessment of the slurries and site soils in NW China. The first step is to select indicators; the second step is to weigh indicators; the third step is to sort all of the samples. Careful consideration should be given to every step.

4.1. Select Indicators

Compatibility assessment needs to select assessment indicators before transferring to a multi-criteria decision-making model (MCDM). There are fifteen indicators of all properties in the previous results, but some indicators are closely related and some are not important. So, twelve indicators are selected after careful consideration of importance and independence: density, specific gravity, porosity, compression strength, modulus of elasticity, inner cohesion, internal friction angle, thermal conductivity, specific heat capacity, coefficient of heat expansion, permeability coefficient and disintegration rate. The following is the detail.
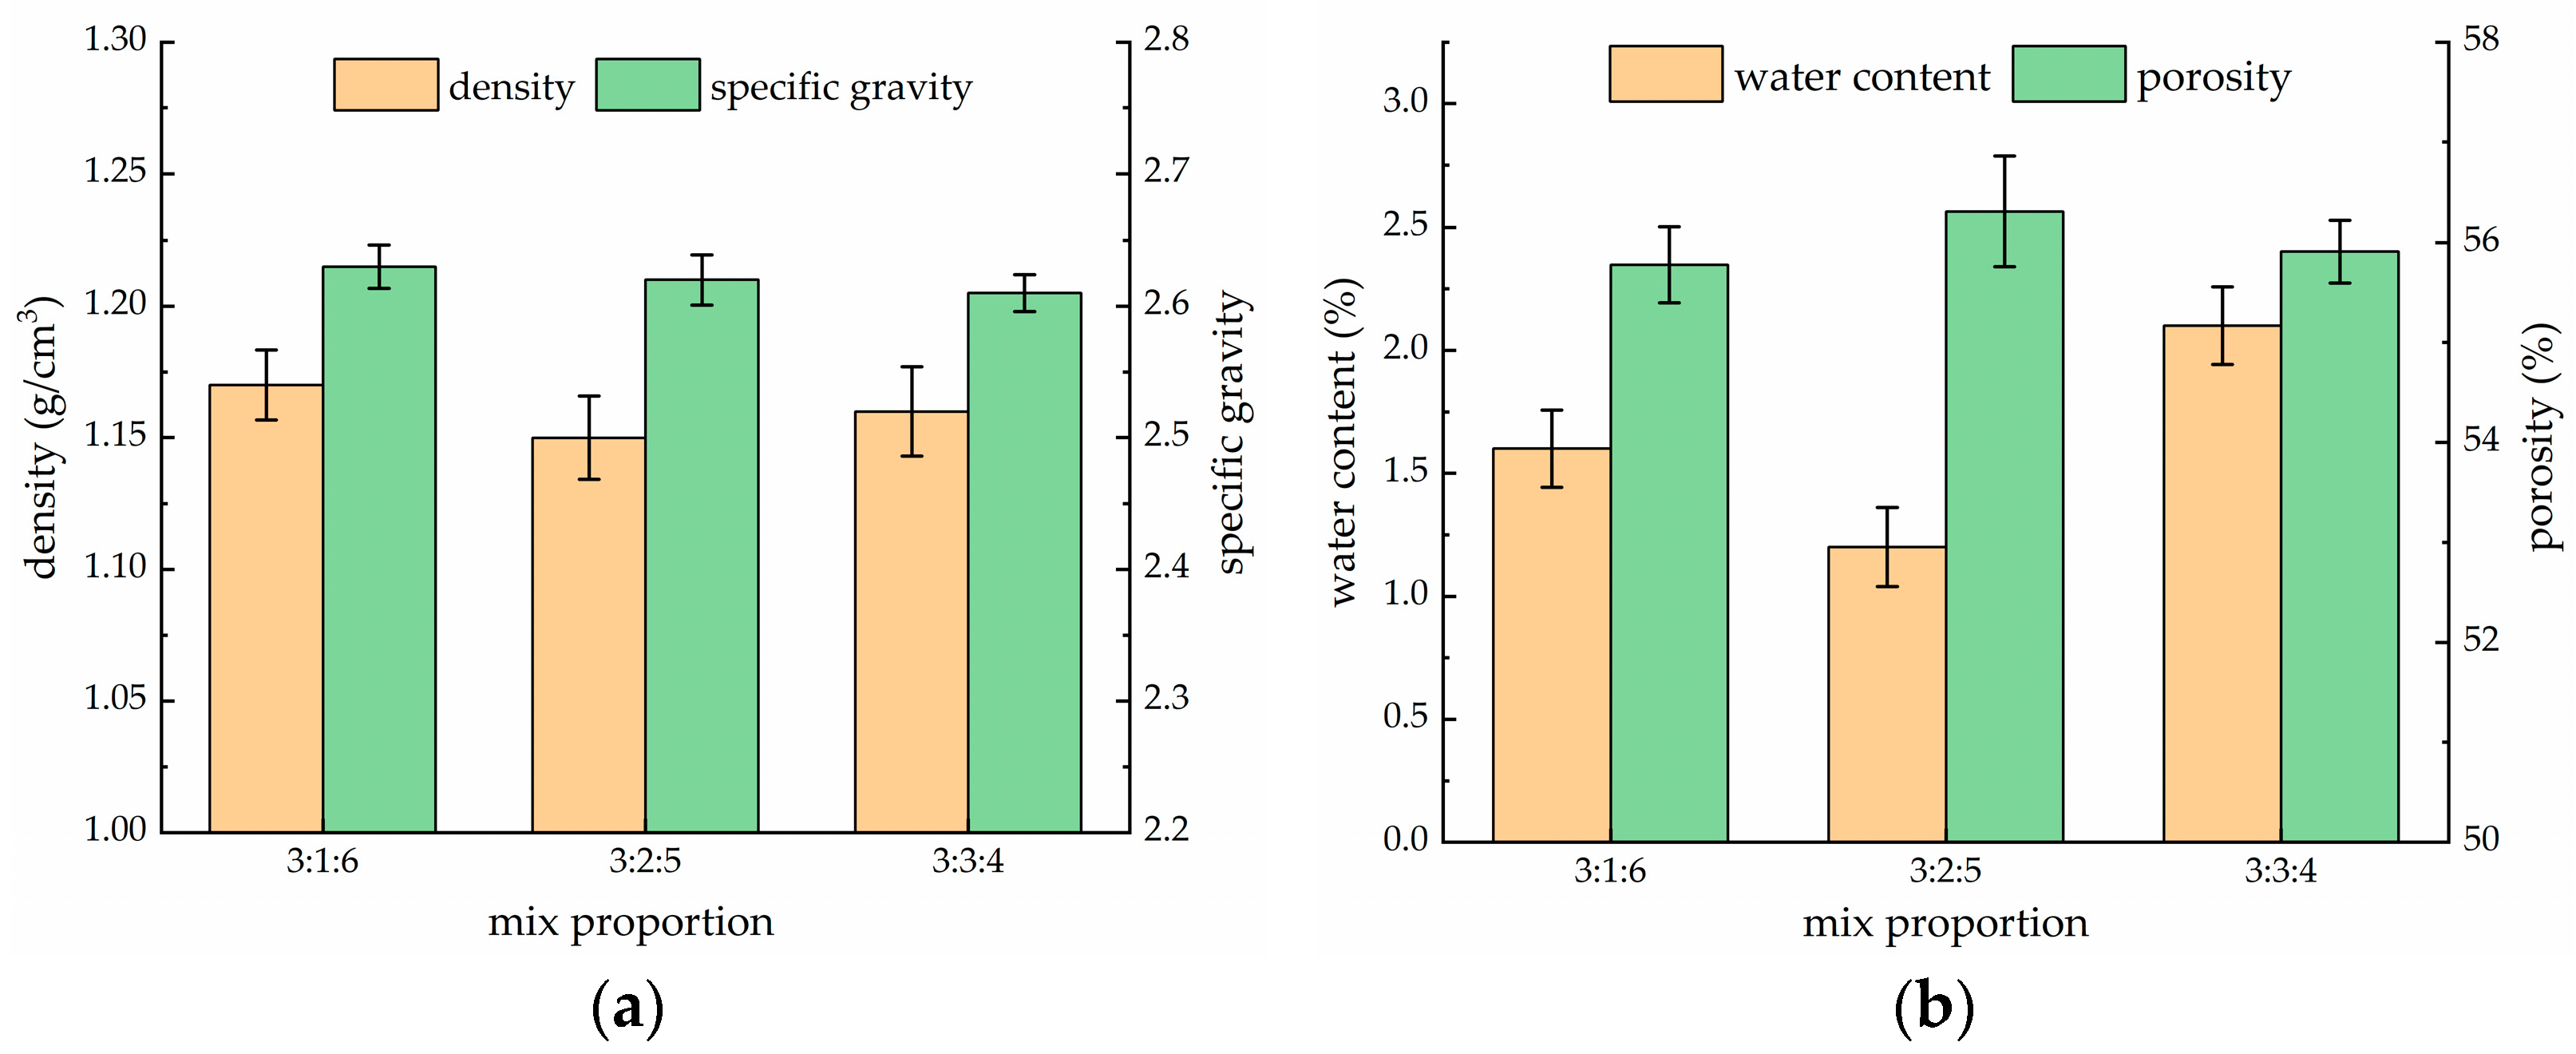
In the basic physical branch, density, specific gravity, and porosity are selected. Compared with other construction materials, the distinct character of soil is the three-phase composition. Basic physical indicators indicate the global property and the proportion of each phase; specially, the density indicates the global property, and the specific gravity and the porosity indicate the feature of solid phase and gas phase. Besides, other basic physical indicators can be expressed by the three indicators. Note that the water content is not selected since the water content of the site soil is closely related to the climate of the area, and when the slurry is applied in same area, it is possible that the slurry will reach the same value of water content as the soil.
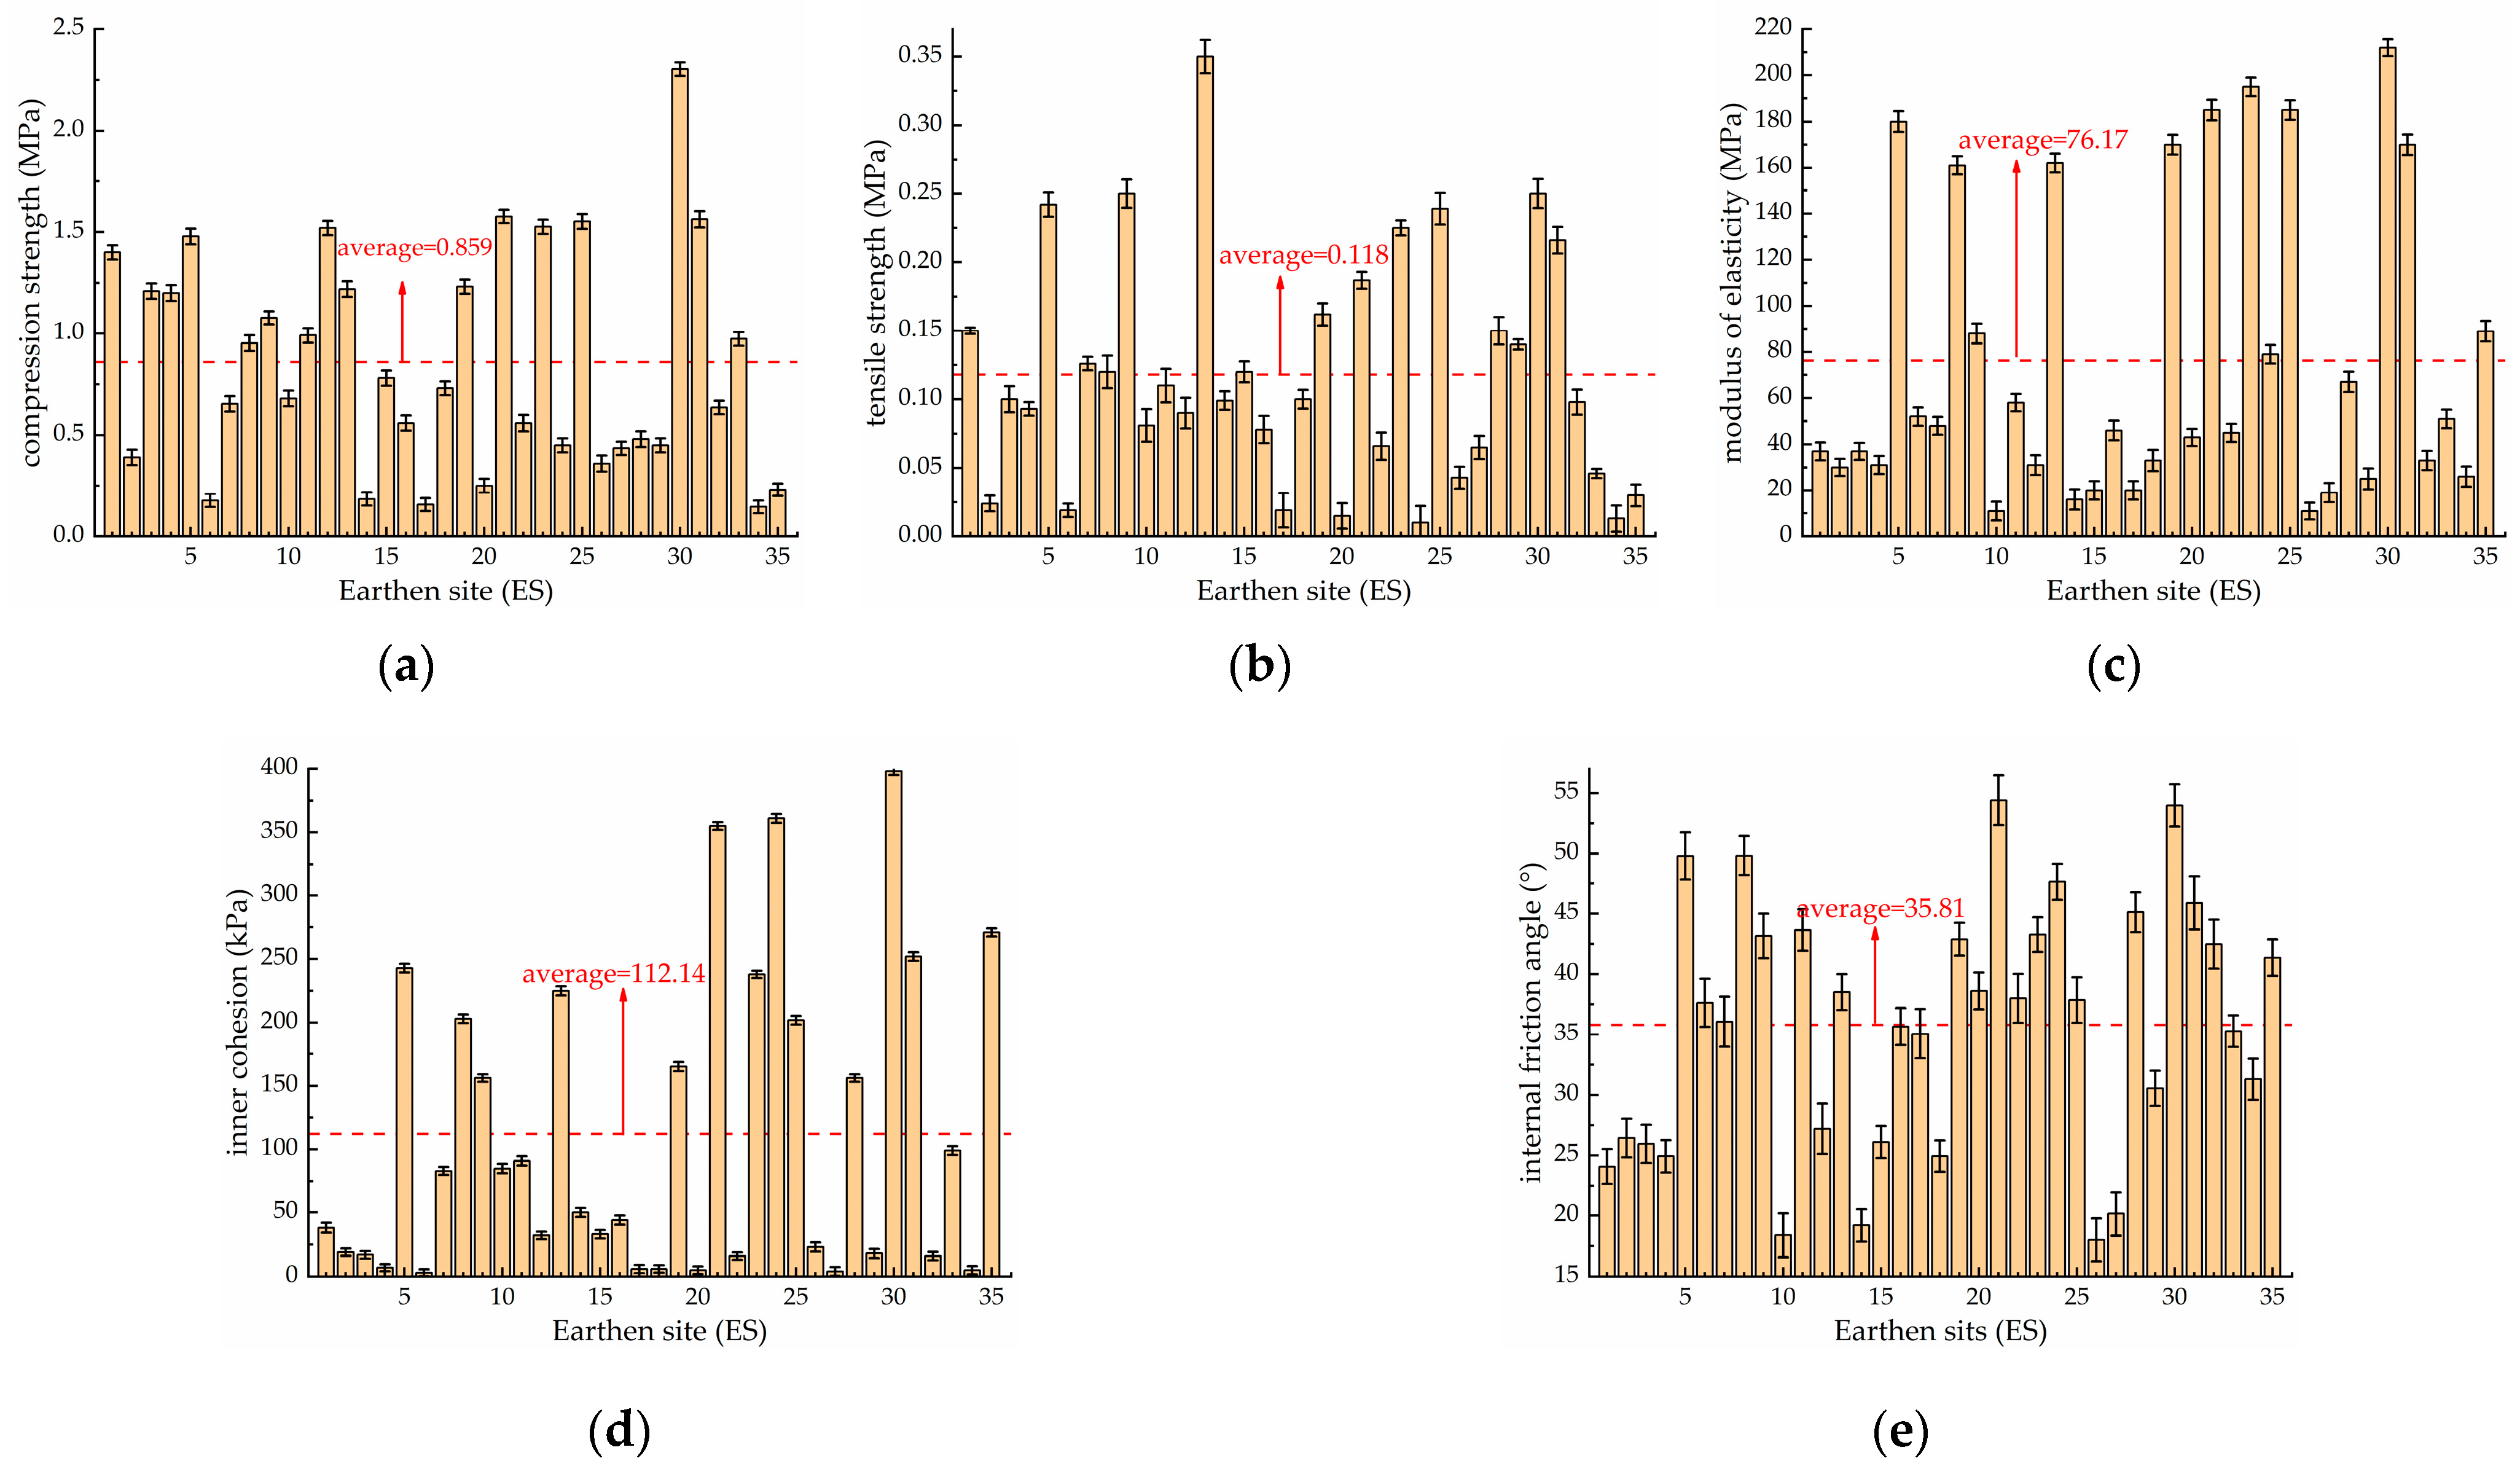
In the mechanical branch, four indicators are selected, namely compressive strength, modulus of elasticity, inner cohesion, and internal friction angle. The compressive strength and modulus of elasticity are common and necessary parameters for mechanical calculations. According to the Mohr-Coulomb criterion, inner cohesion and internal friction angle are essential parameters to judge the state of stressed soil. Note that the tensile strength is strongly related with the compression strength in much of the literature, which shows the compression and tensile strength can substitute for each other in some degree.
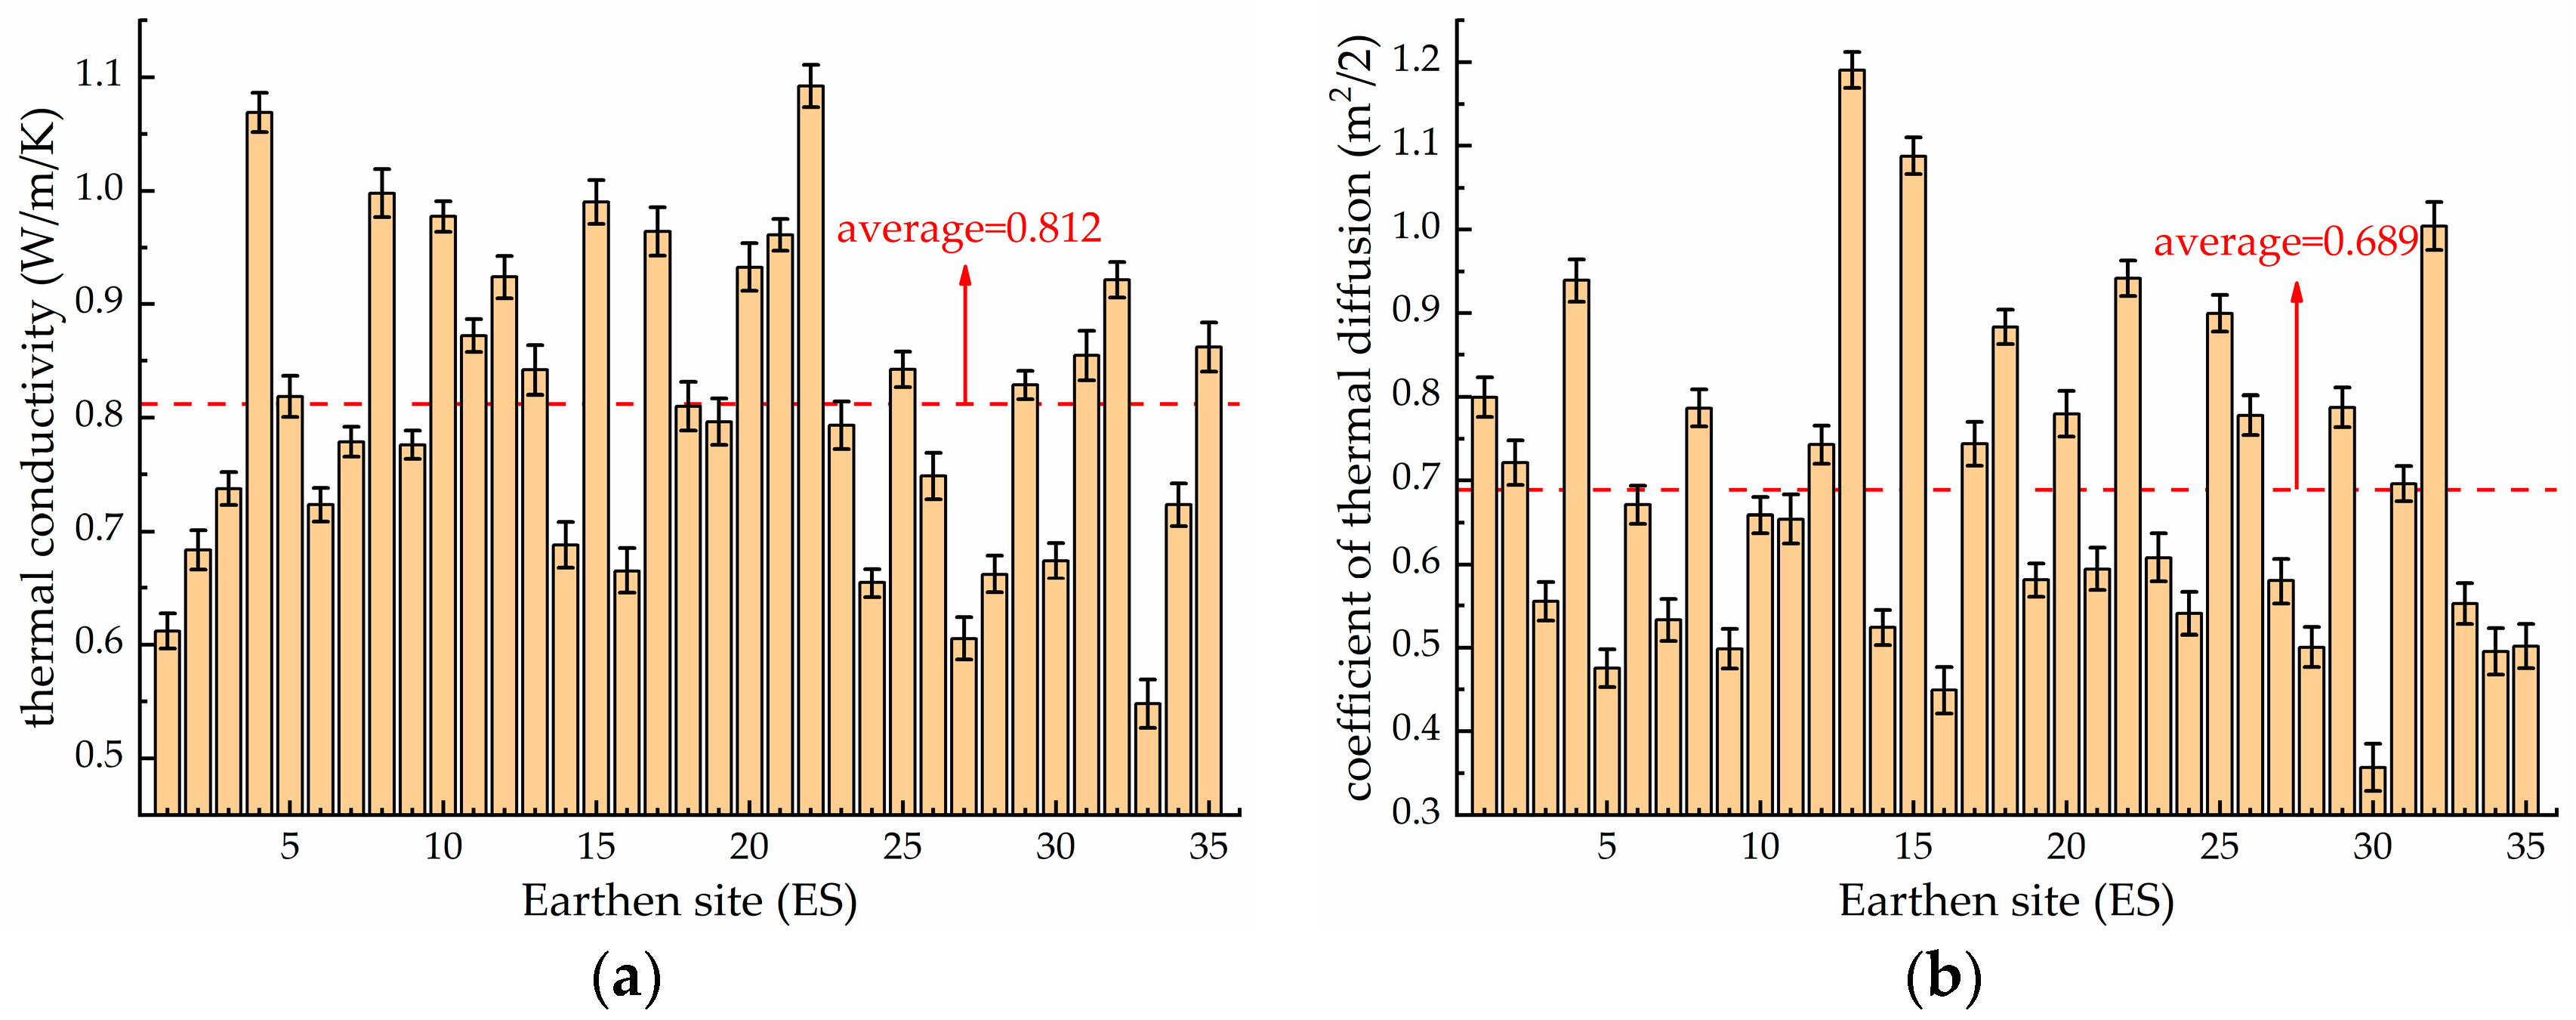
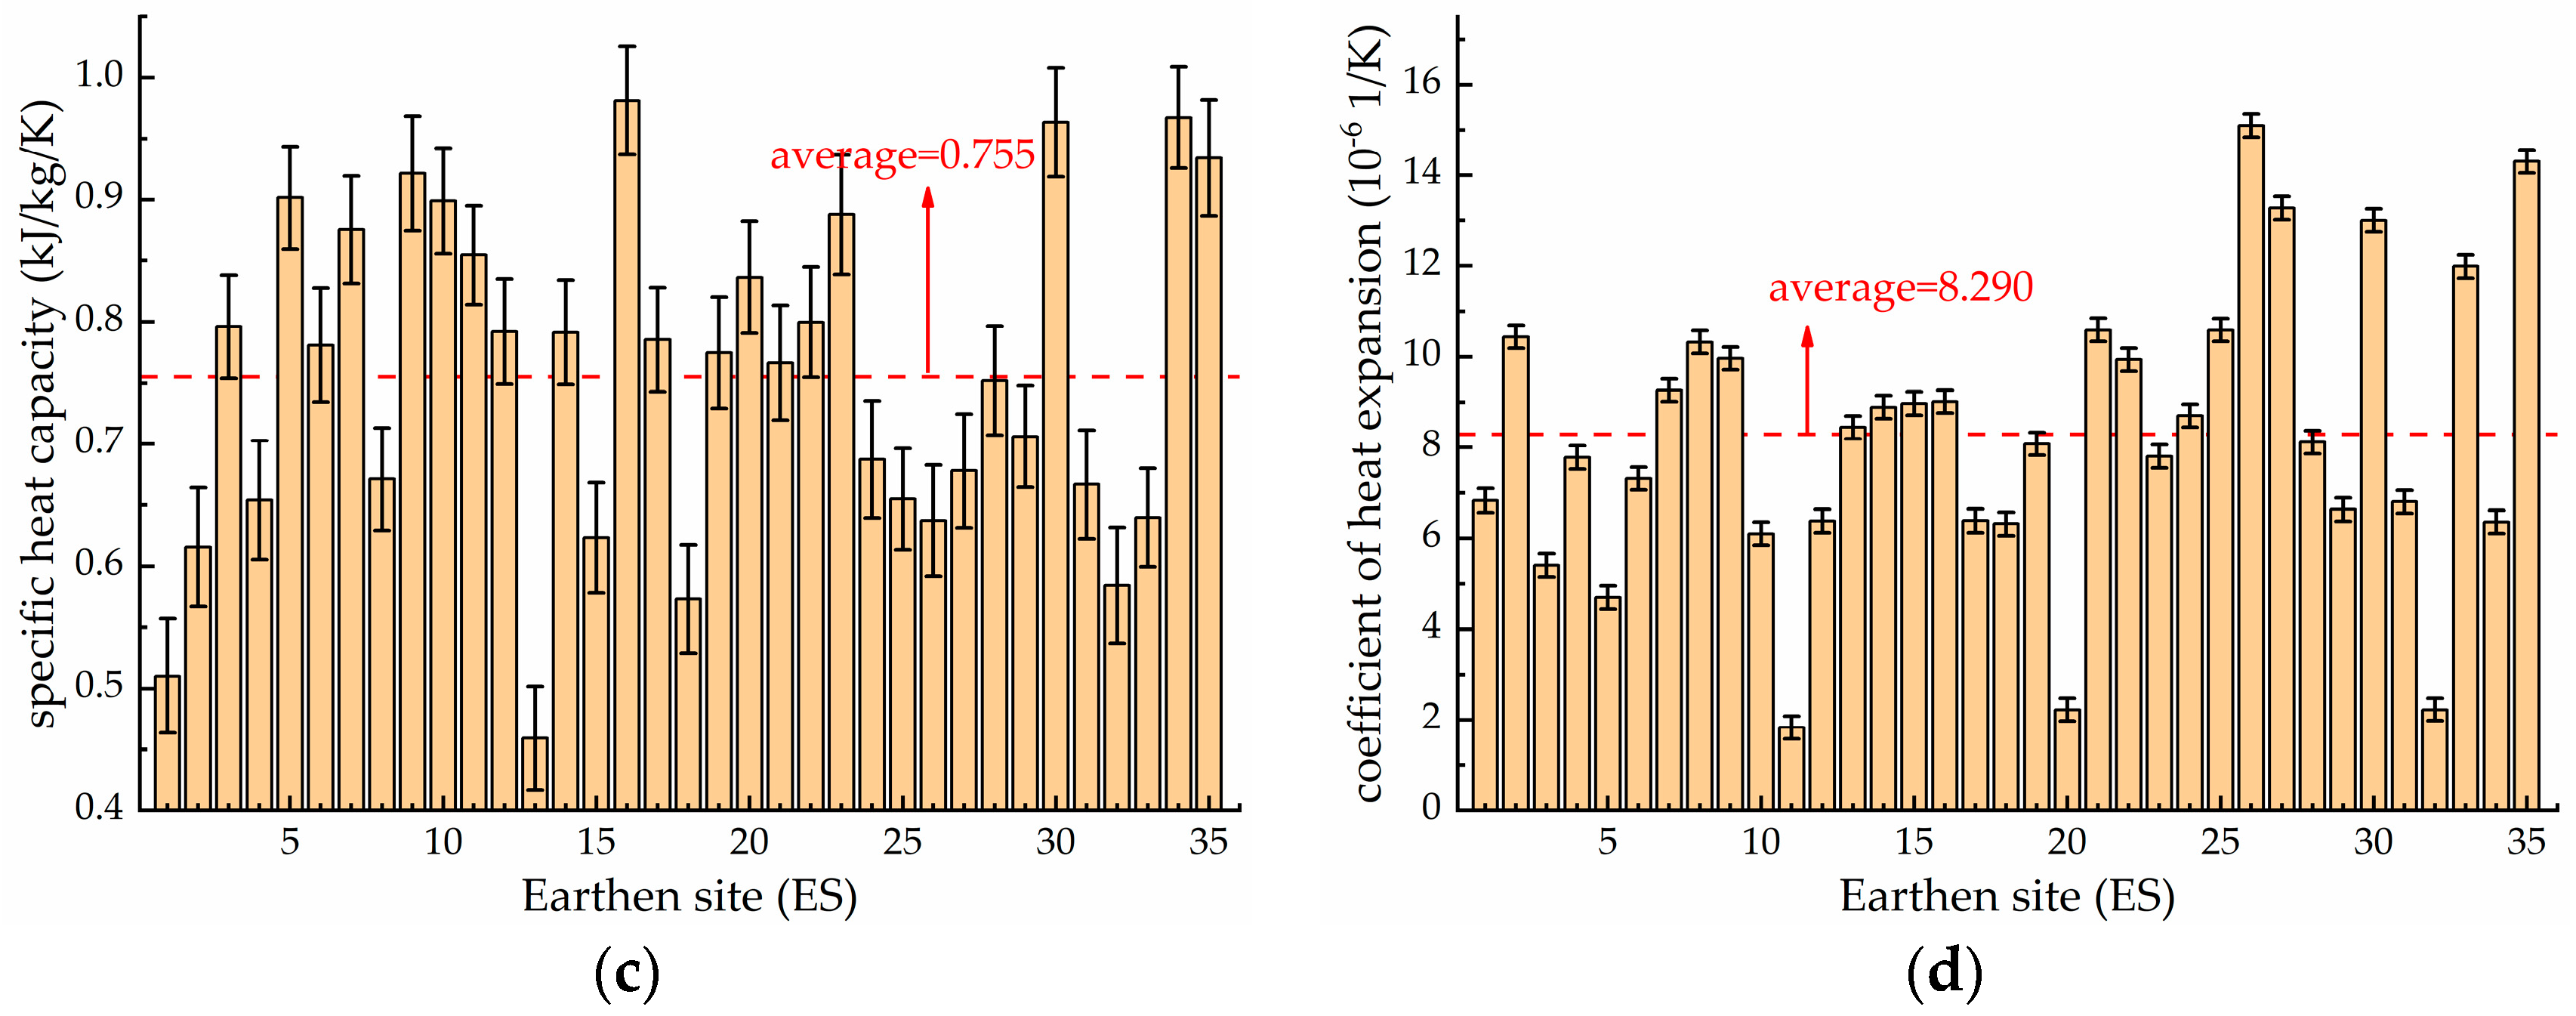
In the thermal branch, thermal conductivity, specific heat capacity, and thermal expansion coefficient are selected. The thermal conductivity and specific heat capacity are important parameters in the calculation of heat. Considering the temperature change, the deformation is expressed by the coefficient of liner expansion. Note that the coefficient of thermal diffusion is not selected since it can be converted by thermal conductivity, specific heat capacity, and density in mathematical expression.
In the water-physical branch, permeability coefficient and disintegration rate are selected. The permeability coefficient shows the permeability in water saturation, and the disintegration rate shows the stability in water. In Northwest China, sudden rainfall in summer and snowfall in winter may lead to the rise of water levels, and further lead to a decline in strength and water movement. Two selected parameters are used to described a range of possibilities.

4.2. Weight Indicators

At present, the methods of weighting indicators can be divided into two main categories in general: subjective weights and objective weights. Analytic hierarchy process (AHP) is a common and basic method to calculate subjective weights; and criteria importance through intercriteria correlation (CRITIC) is a common method to calculate objective weights. Both methods are useful and efficient in some particular situations. So, two methods are adopted and then a combined weight is generated by subjective and objective weights.

4.2.1. AHP

The key of the AHP method is to construct the hierarchy model and ensure the importance of each index. The former is easy in the paper since every layer of the hierarchy model is clear after selecting indicators. The latter is decided by exports. The following is the detail.
Step 1: construct the hierarchy model.
In the model, compatibility assessment is the goal layer; there are four branches in the criterion layer, and there are 12 selected indicators in the index layer. Figure 11 shows the hierarchy model.
Step 2: ensure the weight decision matrix of each layer.
The weight decision matrix A can be given as follows:
A = ( a i j ) n × n
where aij is governed by the rules: aij > 0; aij = 1/aji (Ij); aij =1 (i = j = 1, 2, …, n).
aij indicates a quantified judgment on a pair of elements Ai and Aj, which indicate sets of elements. The value of aij was determined from a nine-point scale, indicating preferences between options as equally, moderately, strongly, very strongly, and extremely preferred. These preferences can be expressed as pairwise weights of 1, 3, 5, 7, and 9, while 2, 4, 6, and 8 are intermediate values [31].
Step 3: calculate the weight of each layer
The weight of each layer is gained from the eigenvector corresponding the maximum eigenvalue of the matrix A [32].
A w = λ max w
where w = (w1, w2, …, wn) is the eigenvector, A is the weight decision matrix, and λmax is the largest eigenvalue of matrix A. Here, the authors use the eigenvector function in MATLAB to calculate w and λmax.
Step 4: check the consistency
The aim of checking the consistency is to ensure that each pairwise comparison is consistent with others and gain an accurate result.
The consistency index (CI) was calculated by Equation (3):
C I = λ max n n 1
The random index (RI) and its values for different scales of matrices are cited in the literature [33].
The judgmental consistency of matrix A can be obtained by calculating the consistency ratio (CR):
C R = C I R I
When CR ≤ 0.1, the matrix can be regarded as consistent. The final comparison matrix is shown in Appendix A.
Step 5 calculate the weight of each indicator.
The weight of each indicator is the multiplication of the weight of criteria layer and the weight of index layer, shown in Table 5.

4.2.2. CRITIC

The key of the CRITIC method is the calculation of the amount of information [31]. The detailed steps of CRITIC are the followings.
Step 1: standardize the raw data.
Let i = 1~35 represent site soils, and j = 1~12 represent the evaluation indicators, and then standard the raw data, as Equation (5).
x i j = r i j min j ( r i j ) max j ( r i j ) min j ( r i j )
Step 2: calculate the standard deviation and correlation coefficient.
Let δj represent the standard deviation of an indicator, and let ccjh represent the correlation coefficient of two indicators.
Step 3: calculate the amount of information Ij.
I j = δ j h = 1 12 ( 1 c c j h )
Step 4: compute the weight of each indicator.
W j = I j j = 1 12 I j
Finally, the combined weight is the average of the subjective and objective weights, and the result is shown in Table 6.
To facilitate subsequent matrix operations, the weight vector is converted to the diagonal matrix W, as follows:
W = d i a g ( w 1 , w 2 , , w 13 )

4.3. Sort All Samples

To sort all samples, there are many methods (i.e., technique for order preference by similarity to ideal solution (TOPSIS), vlse kriterijumska optimizacijal kompromisno resenje (VIOKR), preference ranking organization method for enrichment evaluations (PROMETHEE), west-worst method (BWM), decision making trail and evaluation laboratory (DEMATEL), elimination et choix traduisant la realite (ELECTRE), etc.) [34,35]. The most simple and basic method is TOPSIS, which is adopted in the paper.
The key in the application of TOPSIS is to determine what the ideal solution is in practice. According to the previous section, “absolute compatibility” is just wishful thinking, which means the absolute compatible material cannot be found and cannot represent the ideal solution. But the similarity is certainly an equivalent concept of the compatibility in some particular cases (i.e., the conservation material that is the most similar to the relic is sometimes considered to be the most compatible materials). This can be attempted in the assessment of compatibility between the slurry and earthen sites. The purposes of fissure grouting are: (1) to fill and seal fissures; and (2) to improve the continuity and stability of the earthen site. The achievement of purposes may be affected by the reason that properties of the slurry are obvious contrast with the soil, which leads to stress concentration and water-salt accumulation at the interface between slurry and soil. To avoid these, the slurry that is the most similar to the soil is considered as the most compatible material and the ideal solution. Certainly, it has to be realized that the aim is not to copy the site soil completely, but to use the possibility of obtaining appropriate properties by varying several parameters, and therefore optimize the slurry for its specific application [36]. Also, it is realized that the ideal solution should be different and determined again in other practices.
The following is the detailed steps of TOPSIS.
Step 1: build a standardized data matrix.
The raw data matrix R is composed of all values of 12 indicators of the slurry and 35 site soils. Note that the column represents the same indicator and the row represents the same site soil. In particular, the first row represents the slurry.
R = ( r i j ) 36 × 12
Then, calculate the absolute value of the difference in each indicator between site soils and the slurry:
b i j = | r i j r 1 j |
B = ( b i j ) 36 × 13
All data in matrix B need to be normalized to form the normalized matrix C:
c i j = max j ( b i j ) b i j max j ( b i j ) min j ( b i j )
Step 2: calculate the weighted normalized matrix D:
D = C W
Step 3: calculate the distances between the ideal solution and each sample.
As mentioned earlier, the slurry is considered the ideal solution. Specifically, the positive ideal solution is placed in the first row of the matrix D, and the negative ideal solution is the set of the value 0 in every column. So, the distances between the ideal solution and every sample can be expressed as shown:
L i + = j = 1 n ( d i j d j + ) 2 = j = 1 n ( d i j d 1 j ) 2 L i = j = 1 n ( d i j d j ) 2 = j = 1 n d i j 2
Step 4: calculate the result of assessment.
The result of compatibility assessment is expressed as the relative distance, as shown (12):
E i = L i L i + + L i
Finally, the global flow chart of compatibility assessment is shown in Figure 12.

4.4. Assessment Results

For the convenience of calculation, the computation is designed with MTABLAB, and the code is shown in Appendix B. Figure 13 shows the results of compatibility assessment. As can be seen from Figure 13a,b, (1) for one earthen site, the difference of the compatibility assessment among the three slurries is small since the properties of slurries are close; (2) for all earthen sites, the difference of the compatibility assessment of one slurry is very obvious; (3) most results of assessment range 0.4~0.8 (middle and high), few results range 0.2~0.4 (low) and 0.8~1 (very high), and no results range 0~0.2 (very low).

5. Discussion

The importance of compatible slurries in the conservation practice for earthen sites is obvious. So, the essential and necessary work which must be carried out is to get the properties of the slurries and to assess their compatibility. Firstly, the properties should be comprehensive. It is understood that the basic physical and mechanical properties must be considered and tested for any kind of engineering. The additional properties should be considered and tested considering the actual application environment involved and the aim of long-term service. In NW China, strong sunshine and sudden rainfall are obvious climatic characteristic, and hence the slurries and earthen sites are easily exposed to strong sunlight and local excess water. Considering the above, thermal and water-physical properties should be test when the slurries may be applied in NW China. Certainly, the same tests should be taken for the site soils. The results show the properties of site soils are obviously different, and furthermore that one slurry could not be adjusted to all earthen sites. Then, the compatibility assessment needs to be considered. MCDM seems to be a universal model to assess the compatibility. To process MCDM, some basic principles and simple steps are clear, but the details should be careful considered in a particular conservation practice. A basic physical branch, mechanical branch, thermal branch, and water-physical branch are considered, and twelve indicators are selected in the paper. Two methods are adopted to gain a combined weight of each indicator, and then the TOPSIS method is used to sort all samples. The reasonable selections and weighting are the basic premise of get correct results. When it is necessary to evaluate the compatibility of another conservation material in different regions, the steps in the paper are worthy of reference. Finally, it should be realized that the aim to get the full-scale properties and to assess the compatibility is to ensure that the compatible materials could perform well in the appropriate environment.

6. Conclusions

Slurries for fissure restoration in earthen sites must be compatible with site soils. The content of the compatibility includes more than one branch. In northwest China, the slurry has to meet more requirements for the particularly arid environment. Besides the basic physical and mechanical properties of the slurry, thermal and water-physical properties should be considered, and the corresponding properties of the site soils have to be tested to compare them more easily. Meanwhile, the compatibility assessment between the slurry and the site soil is carried out. Also, we have realized that comparisons with other similar types of slurry are necessary and need to be researched in the future. The main conclusions are as follows:
(1) The slurries with quicklime for fissure restoration in NW China are tested in multi-properties, and the properties of the slurries with different mix proportions are close; the slurry with the mix proportion 3:2:5 generally is considered as the better slurry.
(2) Thirty-five typical earthen sites in NW China are selected and the same tests are taken; the range of each properties for all site soils is clear and the difference are obvious.
(3) Compatibility assessment can be considered as MCDM; to proceed with the work, three necessary and basic steps are involved: to select indicators of compatibility assessment, to weigh each indicator, and to sort all of the samples; these steps can be easily adopted in the similar practice.
(4) The principle of indicators selection is the importance and the dependence; the combined weight is the average of subjective and objective weights that are decided by AHP and CRITIC; the TOPSIS method is used to sort all samples.
(5) Most results of compatibility assessment are middle (M) and high (H), few results are very high (VH) and low (VL), and no results are very low (VL). The three slurries can be considered being compatible with most earthen sites.

Author Contributions

Conceptualization, X.Y. and K.C; methodology, X.Y. and X.H.; software, X.Y.; investigation, G.Z.; data curation, Q.Q.; writing—original draft preparation, X.Y.; writing—review and editing, K.C.; project administration, X.Y. and K.C; funding acquisition, K.C. All authors have read and agreed to the published version of the manuscript.

Funding

This research was funded by the National Nature Science Foundation of China (52068050).

Institutional Review Board Statement

Not applicable.

Informed Consent Statement

Not applicable.

Data Availability Statement

Not applicable.

Conflicts of Interest

The authors declare no conflict of interest.

Appendix A

Table A1. The following is the comparison matrix of criterion/index layer.
Criterion/Index LayerComparison MatrixWeight
Criterion Layer
(1)(2)(3)(4)
(1) basic physic branch11/51/21/30.0838
(2) mechanical branch51430.5462
(3) thermal branch21/411/20.1377
(4) water-physical branch31/3210.2323
λmax = 3.7321, CR = 0.0189 < 0.1
Index Layer
basic physic branch(1)(2)(3)
(1) density11/21/3 0.1635
(2) specific gravity211/2 0.2970
(3) porosity321 0.5396
λmax = 3.0092, CR = 0.0079 < 0.1
mechanical branch(1)(2)(3)(4)
(1) compressive strength11/21/41/40.0874
(2) modulus of elasticity211/31/30.1428
(3) inner cohesion43110.3849
(4) internal friction angle43110.3849
λmax = 4.0206, CR = 0.0076 < 0.1
thermal branch(1)(2)(3)
(1) thermal conductivity122 0.5
(2) specific heat capacity1/211 0.25
(3) heat expansion coefficient1/211 0.25
λmax = 3, CR = 0 < 0.1
water-physical branch(1)(2)
(1) permeability coefficient11/3 0.25
(2) disintegration rate31 0.75
λmax = 2, CR = 0 < 0.1

Appendix B

The following is the MATLAB code of the realization of the compatibility assessment.
clc;
clear all;
SO=xlsread(′soil.xlsx′);
SL=xlsread(′slurry.xlsx′);
for j=1:12;
       maxc1(j)=max(SO(:,j));
       minc1(j)=min(SO(:,j));
       CRSTD(:,j)=(maxc1(j)-SO(:,j))/((maxc1(j)-minc1(j)));
end
s=std(CRSTD);
cor=corrcoef(CRSTD);
qi=s.*sum(1-cor);
wo=qi/sum(qi);
wa=[0.0137 0.0249 0.0452 0.0477 0.0780 0.2102 0.2102 0.0689 0.0344 0.0344 0.0581 0.1742];
W=diag((wa+wo)/2);
for jj=1:3;
       for i=1:35;
              B(i,:)=abs(SO(i,:)-SL(jj,:));
       end
       for j=1:12;
              maxc2(j)=max(B(:,j));
              minc2(j)=min(B(:,j));
              C(:,j)=(maxc2(j)-B(:,j))/((maxc2(j)-minc2(j)));
       end
       D=C*W;
       for j=1:12;
              maxr2(j)=max(D(:,j));
              minr2(j)=min(D(:,j));
              LP(:,j)=(D(:,j)-maxr2(j)).^2;
              LN(:,j)=D(:,j).^2;
       end
       DLP=sqrt(sum(LP,2));
       DLN=sqrt(sum(LN,2));
       E(jj,:)=DLN./(DLP+DLN);
end
plot(E.′);

References

  1. The Getty Conservation Institute, Pontificia Universidad Católica del Perú. Interdisciplinary Experts Meeting on Grouting Repairs for Large-Scale Structural Cracks in Historic Earthen Buildings in Seismic Area; The Getty Conservation Institute: Los Angeles, CA, USA, 2007. [Google Scholar]
  2. Pearson, G.T. Conservation of Clay and Chalk Buildings; Donhead Publishing Ltd.: Shaftsbury, VT, USA, 1997. [Google Scholar]
  3. Keefe, L. Earth Building: Methods and Materials, Repair and Conservation; Taylor & Francis: London, UK, 2005. [Google Scholar]
  4. Zhang, J.; Chen, W.; Li, Z.; Wang, X.; Guo, Q.; Wang, N. Study on workability and durability of calcined ginger nuts-based grouts used in anchoring conservation of earthen sites. J. Cult. Herit. 2015, 16, 831–837. [Google Scholar] [CrossRef]
  5. González-Sánchez, J.F.; Fernández, J.M.; Navarro-Blasco, Í.; Alvarez, J.I. Improving lime-based rendering mortars with admixtures. Constr. Build. Mater. 2021, 271, 121887. [Google Scholar] [CrossRef]
  6. Lv, J.; Zhou, T.; Du, Q.; Wu, H. Experimental investigation on properties of gypsum-quicklime-soil grout material in the reparation of earthen site cracks. Constr. Build. Mater. 2017, 157, 253–262. [Google Scholar] [CrossRef]
  7. Cui, K.; Yu, X.; Huang, J.; Shao, H.; Gu, X. Early solidification process of the slurry with quicklime for fissure restoration of earthen sites. J. Build. Eng. 2022, 53, 104530. [Google Scholar] [CrossRef]
  8. Cui, K.; Feng, F.; Chen, W.-W.; Wang, D.-H.; Wang, X.-H. Slurry and Technology Optimization for Grouting Fissures in Earthen Sites with Quicklime. Adv. Mater. Sci. Eng. 2019, 2019, 1–11. [Google Scholar] [CrossRef]
  9. Rodrigues, J.D.; Grossi, A. Indicators and ratings for the compatibility assessment of conservation actions. J. Cult. Herit. 2007, 8, 32–43. [Google Scholar] [CrossRef]
  10. Barone, G.; Branca, C.; Gresta, S.; Imposa, S.; Leone, A.; Majolino, D. Geoarcheometric and geophysical methodologies applied to the study of cultural heritage: “St. Agata la Vetere” in Catania (Sicily, Italy). J Cult Herit. 2004, 5, 263–271. [Google Scholar] [CrossRef]
  11. Feng, Z.; Luo, X.; Wang, J.; Cao, S.-J. Energy-efficient preservation environment control for enclosed exhibition hall of earthen relics. Energy Build. 2021, 256, 111713. [Google Scholar] [CrossRef]
  12. Zhang, C.; Zhang, B.; Cui, B. High hydrophobic preservation materials can cause damage to tabia relics. Prog. Org. Coatings 2020, 145, 105683. [Google Scholar] [CrossRef]
  13. Zhang, T.; Xu, H.; Wang, C. Self-adaptability and topological deformation of Ganlan architectural heritage: Conservation and regeneration of Lianghekou Tujia village in Western Hubei, China. Front. Arch. Res. 2022; in press. [Google Scholar] [CrossRef]
  14. Fan, W.; Chen, W.; Zhang, Q.; Wu, G. Feasibility of protecting earthen sites with sticky rice and lime composite. Constr. Build. Mater. 2022, 346, 128449. [Google Scholar] [CrossRef]
  15. Rodrigues, J.D. INCOMARECH Project: Conclusions and tentative recommendations. PACT 1999, 56. [Google Scholar]
  16. Cui, K.; Feng, F.; Chen, W.; Wang, X.; Cheng, F. Study on the mechanical compatibility of fissure grouting slurry with quick lime and grouting technology optimization in earthen sites. Rock Soil Mech. 2019, 40, 1–10. (In Chinese) [Google Scholar]
  17. Loureiro, A.M.S.; Paz, S.P.A.; Veiga, M.D.R.; Angélica, R.S. Assessment of compatibility between historic mortars and lime-METAKAOLIN restoration mortars made from amazon industrial waste. Appl. Clay Sci. 2020, 198, 105843. [Google Scholar] [CrossRef]
  18. Sáez-Pérez, M.P.; Durán-Suárez, J.A.; Verdú-Vázquez, A.; Gil-López, T. Characterization and chromatic evaluation of gypsum-based pastes for construction and heritage restoration. Constr. Build. Mater. 2021, 307, 124981. [Google Scholar] [CrossRef]
  19. Lubelli, B.; Nijland, T.G.; van Hees, R.P.J. Characterization and compatibility assessment of commercial stone repair mortars. J. Cult. Herit. 2021, 49, 174–182. [Google Scholar] [CrossRef]
  20. Sala, E.; Zanotti, C.; Passoni, C.; Marini, A. Lightweight natural lime composites for rehabilitation of Historical Heritage. Constr. Build. Mater. 2016, 125, 81–93. [Google Scholar] [CrossRef]
  21. Mazzuca, C.; Severini, L.; Domenici, F.; Toumia, Y.; Mazzotta, F.; Micheli, L.; Titubante, M.; Di Napoli, B.; Paradossi, G.; Palleschi, A. Polyvinyl alcohol based hydrogels as new tunable materials for application in the cultural heritage field. Colloids Surfaces B: Biointerfaces 2020, 188, 110777. [Google Scholar] [CrossRef]
  22. Bal, D.K.; Chandan, M.R.; Taneja, R.; Tiwari, R.R.; Saboor, S.; Mishra, D.; Ghosh, A.; Shaik, A.H. Biocompatible polymer-capped oxidation-resistant copper nanoparticles for nanofluid and hydrogel applications. Eur. Phys. J. Plus 2021, 137, 1–16. [Google Scholar] [CrossRef]
  23. Du, Y.; Chen, W.; Cui, K.; Zhang, K. Study on Damage Assessment of Earthen Sites of the Ming Great Wall in Qinghai Province Based on Fuzzy-AHP and AHP-TOPSIS. Int. J. Arch. Heritage 2019, 14, 903–916. [Google Scholar] [CrossRef]
  24. Kim, C.J.; Yoo, W.S.; Lee, U.K.; Song, K.J.; Kang, K.I.; Cho, H. An experience curve-based decision support model for prioritizing restoration needs of cultural heritage. J. Cult. Herit. 2010, 11, 430–437. [Google Scholar] [CrossRef]
  25. Kutut, V.; Zavadskas, E.K.; Lazauskas, M. Assessment of priority alternatives for preservation of historic buildings using model based on ARAS and AHP methods. Arch. Civ. Mech. Eng. 2014, 14, 287–294. [Google Scholar] [CrossRef]
  26. Li, J.; Chen, Y.; Yao, X.; Chen, A. Risk Management Priority Assessment of heritage sites in China Based on Entropy Weight and TOPSIS. J. Cult. Herit. 2021, 49, 10–18. [Google Scholar] [CrossRef]
  27. Wang, Y.M.; Yang, Z.C.; Chen, W.W.; Han, W.F. Strength characteristics and mechanism of loess solidified with new polymer material SH. Chin. J. Rock Mech. Eng. 2005, 24, 2554–2559. [Google Scholar]
  28. He, F.G.; Lv, R.; Su, H.Z.; Zhou, J.; Zhang, J.K.; Wang, N. Durability test and reinforced mechanism on adding SH materials into soil of archaeological sites. Rock Soil Mech. 2019, 40, 297–307. (In Chinese) [Google Scholar]
  29. Guan, X.P. Study on the Correlation between fractal and engineering of rammed earth of the Ming Great Wall on the foot of Qilian Mountains. Master’s Thesis, Lanzhou University of Technology, Lanzhou, China, 2017. [Google Scholar]
  30. Du, Y.M. Military defense system and vulnerability assessment of earthen sites of the Ming Great Wall in Qinghai Province. Ph.D. Thesis, Lanzhou University, Lanzhou, China, 2019. [Google Scholar]
  31. Saaty, T.L. Rank from comparisons and from ratings in the analytic hierarchy/network processes. Eur. J. Oper. Res. 2006, 168, 557–570. [Google Scholar] [CrossRef]
  32. Saaty, T.L. The Analytic Hierarchy Process: Planning, Priority Setting, Resources Allocation; McGraw: New York, NY, USA, 1980. [Google Scholar] [CrossRef]
  33. Saaty, T.L. The analytic hierarchy process: A 1993 overview. Cent. Eur. J. Oper. Res. Econ. 1993, 2, 119–137. [Google Scholar]
  34. Alao, M.; Ayodele, T.; Ogunjuyigbe, A.; Popoola, O. Multi-criteria decision based waste to energy technology selection using entropy-weighted TOPSIS technique: The case study of Lagos, Nigeria. Energy 2020, 201, 117675. [Google Scholar] [CrossRef]
  35. Asante, D.; Ampah, J.D.; Afrane, S.; Adjei-Darko, P.; Asante, B.; Fosu, E.; Dankwah, D.A.; Amoh, P.O. Prioritizing strategies to eliminate barriers to renewable energy adoption and development in Ghana: A CRITIC-fuzzy TOPSIS approach. Renew. Energy 2022, 195, 47–65. [Google Scholar] [CrossRef]
  36. Zacharopoulou, G. The renascence of lime based mortar technology: An appraisal of a bibliographic study. Compat. Mater. Prot. Eur. Cult. Herit. 1998, 55, 89–114. [Google Scholar]
Figure 1. Crumbling earthen ruins and wrapped and packed soils. (a) Crumbling earthen ruins; (b) wrapped and packed soils.
Coatings 12 01255 g001
Figure 2. The machine for mechanical tests. (a) Loading machine; (b) shear machine.
Coatings 12 01255 g002
Figure 3. Basic physical properties of three slurries. (a) Density and specific gravity; (b) water content and porosity.
Coatings 12 01255 g003
Figure 4. Mechanical properties of three slurries. (a) Compression and tensile strength; (b) modulus of elasticity; (c) inner cohesion and internal friction angle.
Coatings 12 01255 g004
Figure 5. Thermal properties of three slurries. (a) Thermal conductivity and coefficient of thermal diffusion; (b) specific heat capacity and coefficient of heat expansion.
Coatings 12 01255 g005
Figure 6. Water physical properties of three slurries.
Coatings 12 01255 g006
Figure 7. Basic physical properties of 35 site soils. (a) Density; (b) specific gravity; (c) water content; (d) porosity; (e) plasticity index; (f) liquidity index.
Coatings 12 01255 g007
Figure 8. Mechanical properties of 35 site soils. (a) Compression strength; (b) tensile strength; (c) modulus of elasticity; (d) inner cohension; (e) internal friction angle.
Coatings 12 01255 g008
Figure 9. Thermal properties of 35 site soils. (a) Thermal conductivity; (b) coefficient of thermal diffusion; (c) specific heat capacity; (d) coefficient of heat expansion.
Coatings 12 01255 g009aCoatings 12 01255 g009b
Figure 10. Water-physical properties of 35 site soils. (a) Permeability coefficient; (b) disintegration rate.
Coatings 12 01255 g010
Figure 11. The hierarchy model of AHP.
Coatings 12 01255 g011
Figure 12. Flow chart of compatibility assessment.
Coatings 12 01255 g012
Figure 13. Results of compatibility assessment. (a) ES1~18; (b) ES19~35.
Coatings 12 01255 g013
Table 1. Details of mix proportions (mass) of slurries.
AbbreviationQuicklimeFly AshSoilLiquid-Solid Ratio
3:1:630%10%60%0.52
3:2:530%20%50%0.50
3:3:430%30%40%0.48
Table 2. Chemical composition of fly ash.
MassSiO2Al2O3Fe2O3CaOMgOSO3LOI
%55.927.45.54.91.51.41.1
Table 3. Physical properties of soil.
NameDensity (g∙cm−3)Water Content (%)Liquid Limit (%)Plastic Limit (%)Specific Gravity
Silty clay1.660.8634.4921.022.61
Table 4. Basic information of 35 earthen sites.
CodeLocationLatitude (N)Longitude (E)Construction DynastyArchitectural Form
ES01Guazhou40°29′37″95°32′38″HanBeacon tower
ES02Guazhou40°25′38”95°41′35”QingCastle
ES03Guazhou40°15′34”95°35′54”TangCastle
ES04Dunhuang40°14′22”94°47′21”SongCastle
ES05Jiayuguan39°54′54″98°23′38″MingGreat Wall
ES06Jiuquan39°51′13″98°34′33″MingGreat Wall
ES07Gaotai39°29′03″99°43′06″MingGreat Wall
ES08Linze39°12′00″100°22′28″MingGreat Wall
ES09Zhangye38°51′53″100°45′46″MingGreat Wall
ES10Minqin38°40′00”103°0′59”QingCastle
ES11Shandan38°39′52″101°15′13″MingGreat Wall
ES12Ningxia38°36.925′106°4.297′MingCastle
ES13Minqin38°33′19”103°00′20”HanCastle
ES14Ningxia38°33.33′105°83′51′MingGreat Wall
ES15Jinchang38°30′18”102°25′30”TangCastle
ES16Minle38°27′37″100°52′27″MingGreat Wall
ES17Yongchang38°19′34″101°56′38″MingGreat Wall
ES18Jinchang38°09′56”102°08′32”SongCastle
ES19Wuwei37°41′59″102°58′44″MingGreat Wall
ES20Gulang37°28′02″102°54′32″MingGreat Wall
ES21Menyuan37°22′42″101°37′05″MingGreat Wall
ES22Jingtai37°09′52″104°10′20″MingBeacon tower
ES23Tianzhu37°08′51″102°52′25″MingCastle
ES24Huzhu36°45′55″101°56′13″MingGreat Wall
ES25Baiyin36°44′51”104°41′53”TangCastle
ES26Yongdeng36°42′45”103°16′15”QingCastle
ES27Yongdeng36°40′41”102°53′55”SongCastle
ES28Ledu36°29′03″102°23′57″MingGreat Wall
ES29Yongdeng36°27′07”103°22′45”HanCastle
ES30Pingan36°27′02″102°04′02″MingGreat Wall
ES31Huangzhong36°25′38″101°35′25″MingGreat Wall
ES32Minhe36°19′49″102°51′47″MingGreat Wall
ES33Yongdeng36°18′53″103°24′58″MingGreat Wall
ES34Yongjing36°04′50″103°17′02″MingGreat Wall
ES35Guide36°02′54″101°25′57″MingGreat Wall
Table 5. Subjective weight of each indicator.
Criterion LayerWeight of Criterion LayerIndex LayerWeight of Index LayerSubjective Weight
Basic physic branch0.0838Density0.16350.0137
Specific gravity0.29700.0249
Porosity0.53960.0452
Mechanical branch0.5462Compressive strength0.08740.0477
Modulus of elasticity0.14280.0780
Inner cohesion0.38490.2102
Internal friction angle0.38490.2102
Thermal branch0.1377Thermal conductivity0.50.0689
Specific heat capacity0.250.0344
Coefficient of heat expansion 0.250.0344
Water-physical branch0.2323Permeability coefficient0.250.0581
Disintegration rate0.750.1742
Table 6. Results of combined weight.
IndicatorsSubjective WeightObjective WeightCombined Weight
Density0.01370.06900.0414
Specific gravity0.02490.07160.0482
Porosity0.04520.09510.0702
Compressive strength0.04770.07650.0621
Modulus of elasticity0.07800.08550.0817
Inner cohesion0.21020.08210.1461
Internal friction angle0.21020.07320.1417
Thermal conductivity0.06890.08480.0768
Specific heat capacity0.03440.08060.0575
Coefficient of heat expansion 0.03440.08390.0591
Permeability coefficient0.05810.11230.0852
Disintegration rate0.17420.08560.1299
Publisher’s Note: MDPI stays neutral with regard to jurisdictional claims in published maps and institutional affiliations.

