Article

Vertical Growth Dynamics and Multifractality of the Surface of Electropolymerized Poly(o-ethoxyaniline) Thin Films

by
Cindel Cavalcante de Souza
1,
Ariamna María Dip Gandarilla
2,
Walter Ricardo Brito
2,
Edgar Aparecido Sanches
3,
Abhijeet Das
4,
Sanjeev Kumar
4,
Robert Saraiva Matos
5,6,
Ştefan Ţălu
7,* and
Henrique Duarte da Fonseca Filho
1
1
Laboratory of Synthesis of Nanomaterials and Nanoscopy, Physics Department, Federal University of Amazonas-UFAM, Manaus 69067-005, AM, Brazil
2
Laboratorio de Bioeletrônica e Eletroanalítica (LABEL), Department of Chemistry, Federal University of Amazonas, Manaus 69067-005, AM, Brazil
3
Laboratório de Polímeros Nanoestruturados (NANOPOL), Federal University of Amazonas-UFAM, Manaus 69067-005, AM, Brazil
4
Centre for Advanced Research, Department of Physics, Rajiv Gandhi University, Rono Hills, Doimukh 791112, Arunachal Pradesh, India
5
Amazonian Materials Group, Physics Department, Federal University of Amapá-UNIFAP, Macapá 68903-419, AP, Brazil
6
Graduate Program in Materials Science and Engineering, Federal University of Sergipe-UFS, São Cristóvão 49100-000, SE, Brazil
7
The Directorate of Research, Development and Innovation Management (DMCDI), Technical University of Cluj-Napoca, 15 Constantin Daicoviciu St., 400020 Cluj-Napoca, Romania
*
Author to whom correspondence should be addressed.
Coatings 2022, 12(8), 1216; https://doi.org/10.3390/coatings12081216
Submission received: 27 July 2022 / Revised: 14 August 2022 / Accepted: 16 August 2022 / Published: 19 August 2022
(This article belongs to the Section Corrosion, Wear and Erosion)

Abstract

:
Electropolymerized poly(o-ethoxyaniline) (POEA) nanostructured thin films were successfully deposited on indium tin oxide (ITO) substrate. The surface dynamic of the films was extensively investigated using morphological and multifractal parameters extracted from the atomic force microscopy (AFM). AFM topographical maps reveal surfaces with different morphologies as a function of the deposition cycles. The height parameters show that there is greater spatial vertical growth for films deposited with higher cycles of deposition. After five cycles of deposition occurs the formation of a more isotropic surface, while for 15 cycles a less isotropic surface is observed. The Minkowski functionals confirm that morphological aspects of the two films change according to the amount of deposition cycles employed. The POEA surfaces also exhibit a strong multifractal nature with a decrease in the multifractal spectrum width as the number of deposition cycles increases. Our findings prove that deposition cycles can be useful in controlling the vertical growth and surface dynamics of electropolymerized POEA nanostructured samples, which can be useful for improving the fabrication of POEA-coated ITO-based devices.

1. Introduction

Intrinsically conducting polymers (ICP) are of great interest to researchers worldwide in technological applications due to their unique morphological, thermal, electrical, and mechanical properties. Additionally, they are easy to synthesize, low cost, and present considerable long-term stability [1,2]. Soluble derivatives of polyaniline (PANI) have been prepared by polymerization of ring or nitrogen-substituted aniline monomers copolymerization [3,4,5]. Because it is highly soluble in various organic solvents and helps to prevent corrosion on metal surfaces, poly(o-ethoxyaniline) (POEA), a ring-substituted polyaniline derivative, has been currently reported in the literature [6,7].
The electrochemical polymerization of ICP has shown several advantages over the chemical oxidation method. This technique allows the development of conducting films for several technological application [8]. However, rare reports have focused on using atomic force microscopy (AFM) to perform both microtexture and micromorphology assessment of POEA films [9]. This technique allows the evaluation of geometrical characteristics of film surfaces at various scales and in different aspects [10,11]. Moreover, fractal analysis accesses a complex surface geometry related to possible alignment of polymer chains and/or long-range orders in semicrystalline conducting polymers [12,13,14]. Currently, several parameters such as surface entropy, fractal succolarity, and fractal lacunarity are included in the analysis of biopolymeric films, in addition to the use of commercial software, such as MountainsMap, which provides many other surface parameters [15,16]. Surface texture homogeneity and roughness are designed to be the key to predict some problems (such as failure and low conductive performance) of the electropolymerized films based on conducting polymers.
A new discussion of micromorphology, microtexture evaluation, and fractal analysis is reported here based on the growth modes of POEA on the indium tin oxide (ITO) substrate as a function of deposition parameters. The AFM methods were performed to examine the surfaces of POEA films fabricated with varying cycles in the context of morphological and multifractal parameters. According to the International Standardization Organization (ISO), the results presented and discussed here helped us to understand the influence of varying cycles on the evaluated statistical surface parameters, generating essential information about the electropolymerized POEA thin films produced in this work.

2. Materials and Methods

2.1. Materials

All reagents used in this work were analytical grade. POEA thin films were produced by electrodeposition and deposited on glass substrates coated with ITO (15 Ω/sq, Lumtech Moorestown, NJ, USA). Electrochemical and the procedures were performed using an AUTOLAB PGSTAT 204 (Methrohm Autolab, Utrecht, The Netherlands), controlled with NOVA 2.1.2 electrochemical analysis software. The POEA electrodeposition was carried out in a 0.2 mol·L−1 OEA and 1.5 mol·L−1 H2SO4 solution, using cyclic voltammetry from −0.2 to +1.2 V at a scan rate of 50 mV·s−1. To make a complete study of the ITO substrate morphology, including the different films prouced on it, 3 samples were deposited on the ITO with 5, 15, and 25 cycles, respectively. In this way, we labeled the samples as #1, #2, #3, and #4, where the first was considered as a clean substrate and the others representing 5, 15, and 25 cycles, respectively. Subsequently, after removing the electrolyte solution, they were streaked with water and air-dried. Further details on processing the samples analyzed in this work can be found elsewhere [9].

2.2. AFM Imaging and Morphological Analysis

All images used were obtained at relative humidity of (40 ± 1)% and room temperature (296 ± 1) K using an AFM Innova from Bruker (Santa Barbara, CA, USA), operated in tapping mode using a silicon cantilever, with a scan rate of 0.5 Hz. The images have an area of 10 × 10 μm2 with 256 × 256 pixels. Analyses were performed using Gwyddion 2.59 software [17], in accordance with ISO 25178-2: 2012.
The AFM technique can generate 3D topographic maps of a surface, which allows for performing various mathematical operations for a better understanding of spatial patterns. Thus, by using the Gwyddion software (version 2.56) it was possible to extract the following parameters: interface width (w); arithmetic mean roughness (Ra); and maximum height of profile (Rz), which is the sum of Rp (maximum profile peak height) and Rv (maximum profile valley depth). Based on the height distribution function z(xi, yj), the height statistical parameters are presented according to Equations (1) and (2) [10,17]:
w = 1 M x N y i = 1 M x j = 1 N y z 2 ( x i , y j )
R a = 1 M x N y i = 1 M x j = 1 N y | z ( x i , y j ) |
where M and N are the number of points of per profile and the number of profiles, respectively.
In addition, it was also possible to obtain autocorrelation function (ACF) and Minkowski functionals (MFs). ACF associates information between valleys and peaks, for example, the distribution of two points on the surface; thus, it is an important statistical tool [10,17,18] and is described by Equation (3):
G ( τ x , τ y ) = + z 1 z 2 w ( z 1 , z 2 , τ x , τ y ) d z 1 d z 2 = l i m S 1 S S ζ ( x 1 , y 1 ) ζ ( x 1 + τ x , y 1 + τ y ) d x 1 d y 1
In this equation, for certain points (x1, y1) and (x2, y2), z1 and z2 are the respective heights; τx is equal to x1x2 and τy is equal to y1y2 [17,19]. The function w(z1, z2, τx, τy) is related to the probability density of the arbitrary function ζ(x, y) linked to points (x1, y1) and (x2, y2) and the distance τ between them [17,19]. The anisotropy ratio (Str), Equation (4), was also obtained, and is a parameter associated with the directional heterogeneities of the microtexture of a surface [20]. Sa1 represents the fastest autocorrelation decay and Sa2 is the slowest.
S t r = S a 1 S a 2

2.3. Multifractal Analysis

Multifractal analyses were obtained using MATLAB software, version 8.2.0.29 (R2013b). Existing computational routines [21,22,23] were used in which the code is based on multifractal theory dividing the image into a total square cell N(ε), where ε is the side. Thus, to implement a case counting algorithm, a partition function (Equation (5)) was used [23] to generate the multifractal parameters:
Z ( q , ε ) = i = 1 N ( ε ) p i q ( ε ) ~ ε τ ( q )
where pi = Ni(ε)/N(ε), Ni(ε) represent the pixels of a given color within the i-th square, N(ε) is the total number of pixels of this color, and q (a real number) is a power exponent. The Rényi dimension [24] or generalized fractal dimension [25], also known as the multifractal parameter Dq (Equation (10)), is highly relevant to study surface self-similarity. It is calculated through the logarithmic fit of the curve Z(q,ε) versus ε:
D q = τ ( q ) ( q 1 )
where τ(q) is a scale exponent of the moment q of measurement p, known as the mass exponent, and it represents the multifractal singularity. It is found by f(α(q)), Equation (7) [10]:
f ( α ( q ) ) = q α ( q ) τ ( q )
where the parameter α(q) indicates the singularity strength along the surface and is given by Equation (8) [10]:
α ( q ) = d τ ( q ) / d q

2.4. Statistical Analysis

The results obtained from the samples studied here were statistically evaluated using the OriginPro® 2016 software, in which the means were checked by analysis of variance (one-way ANOVA) with p < 0.05.

3. Results

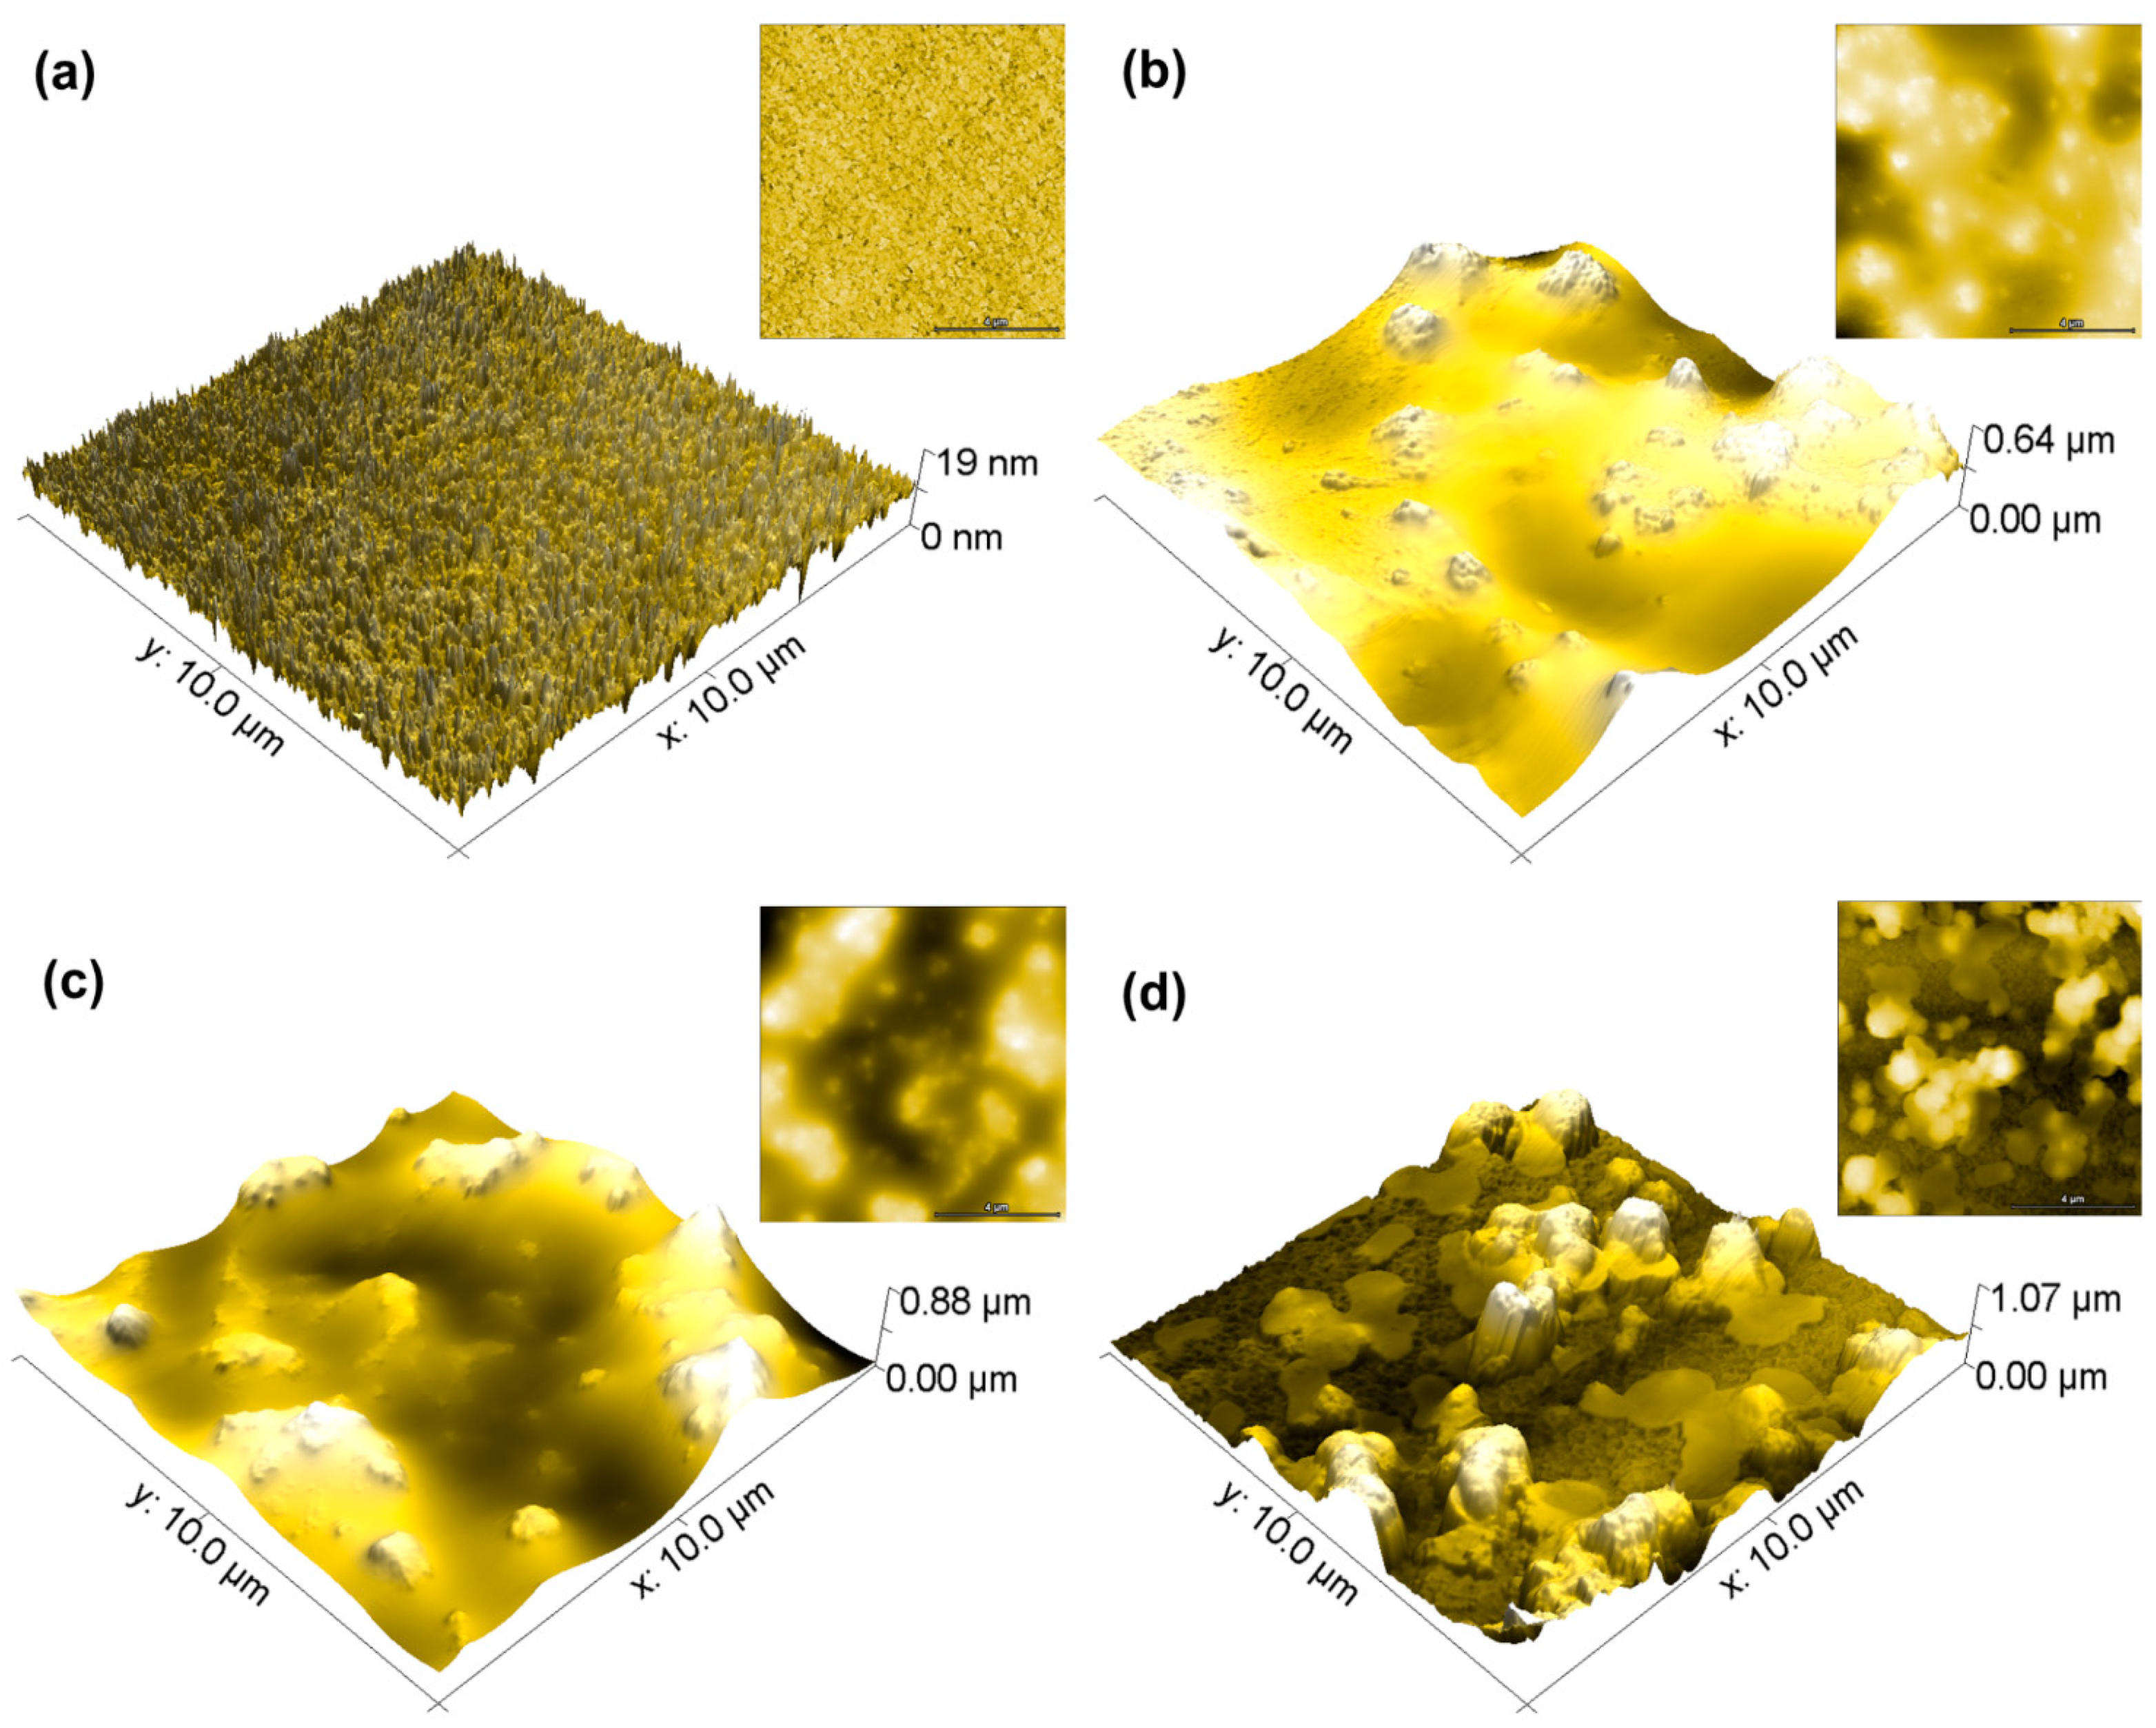
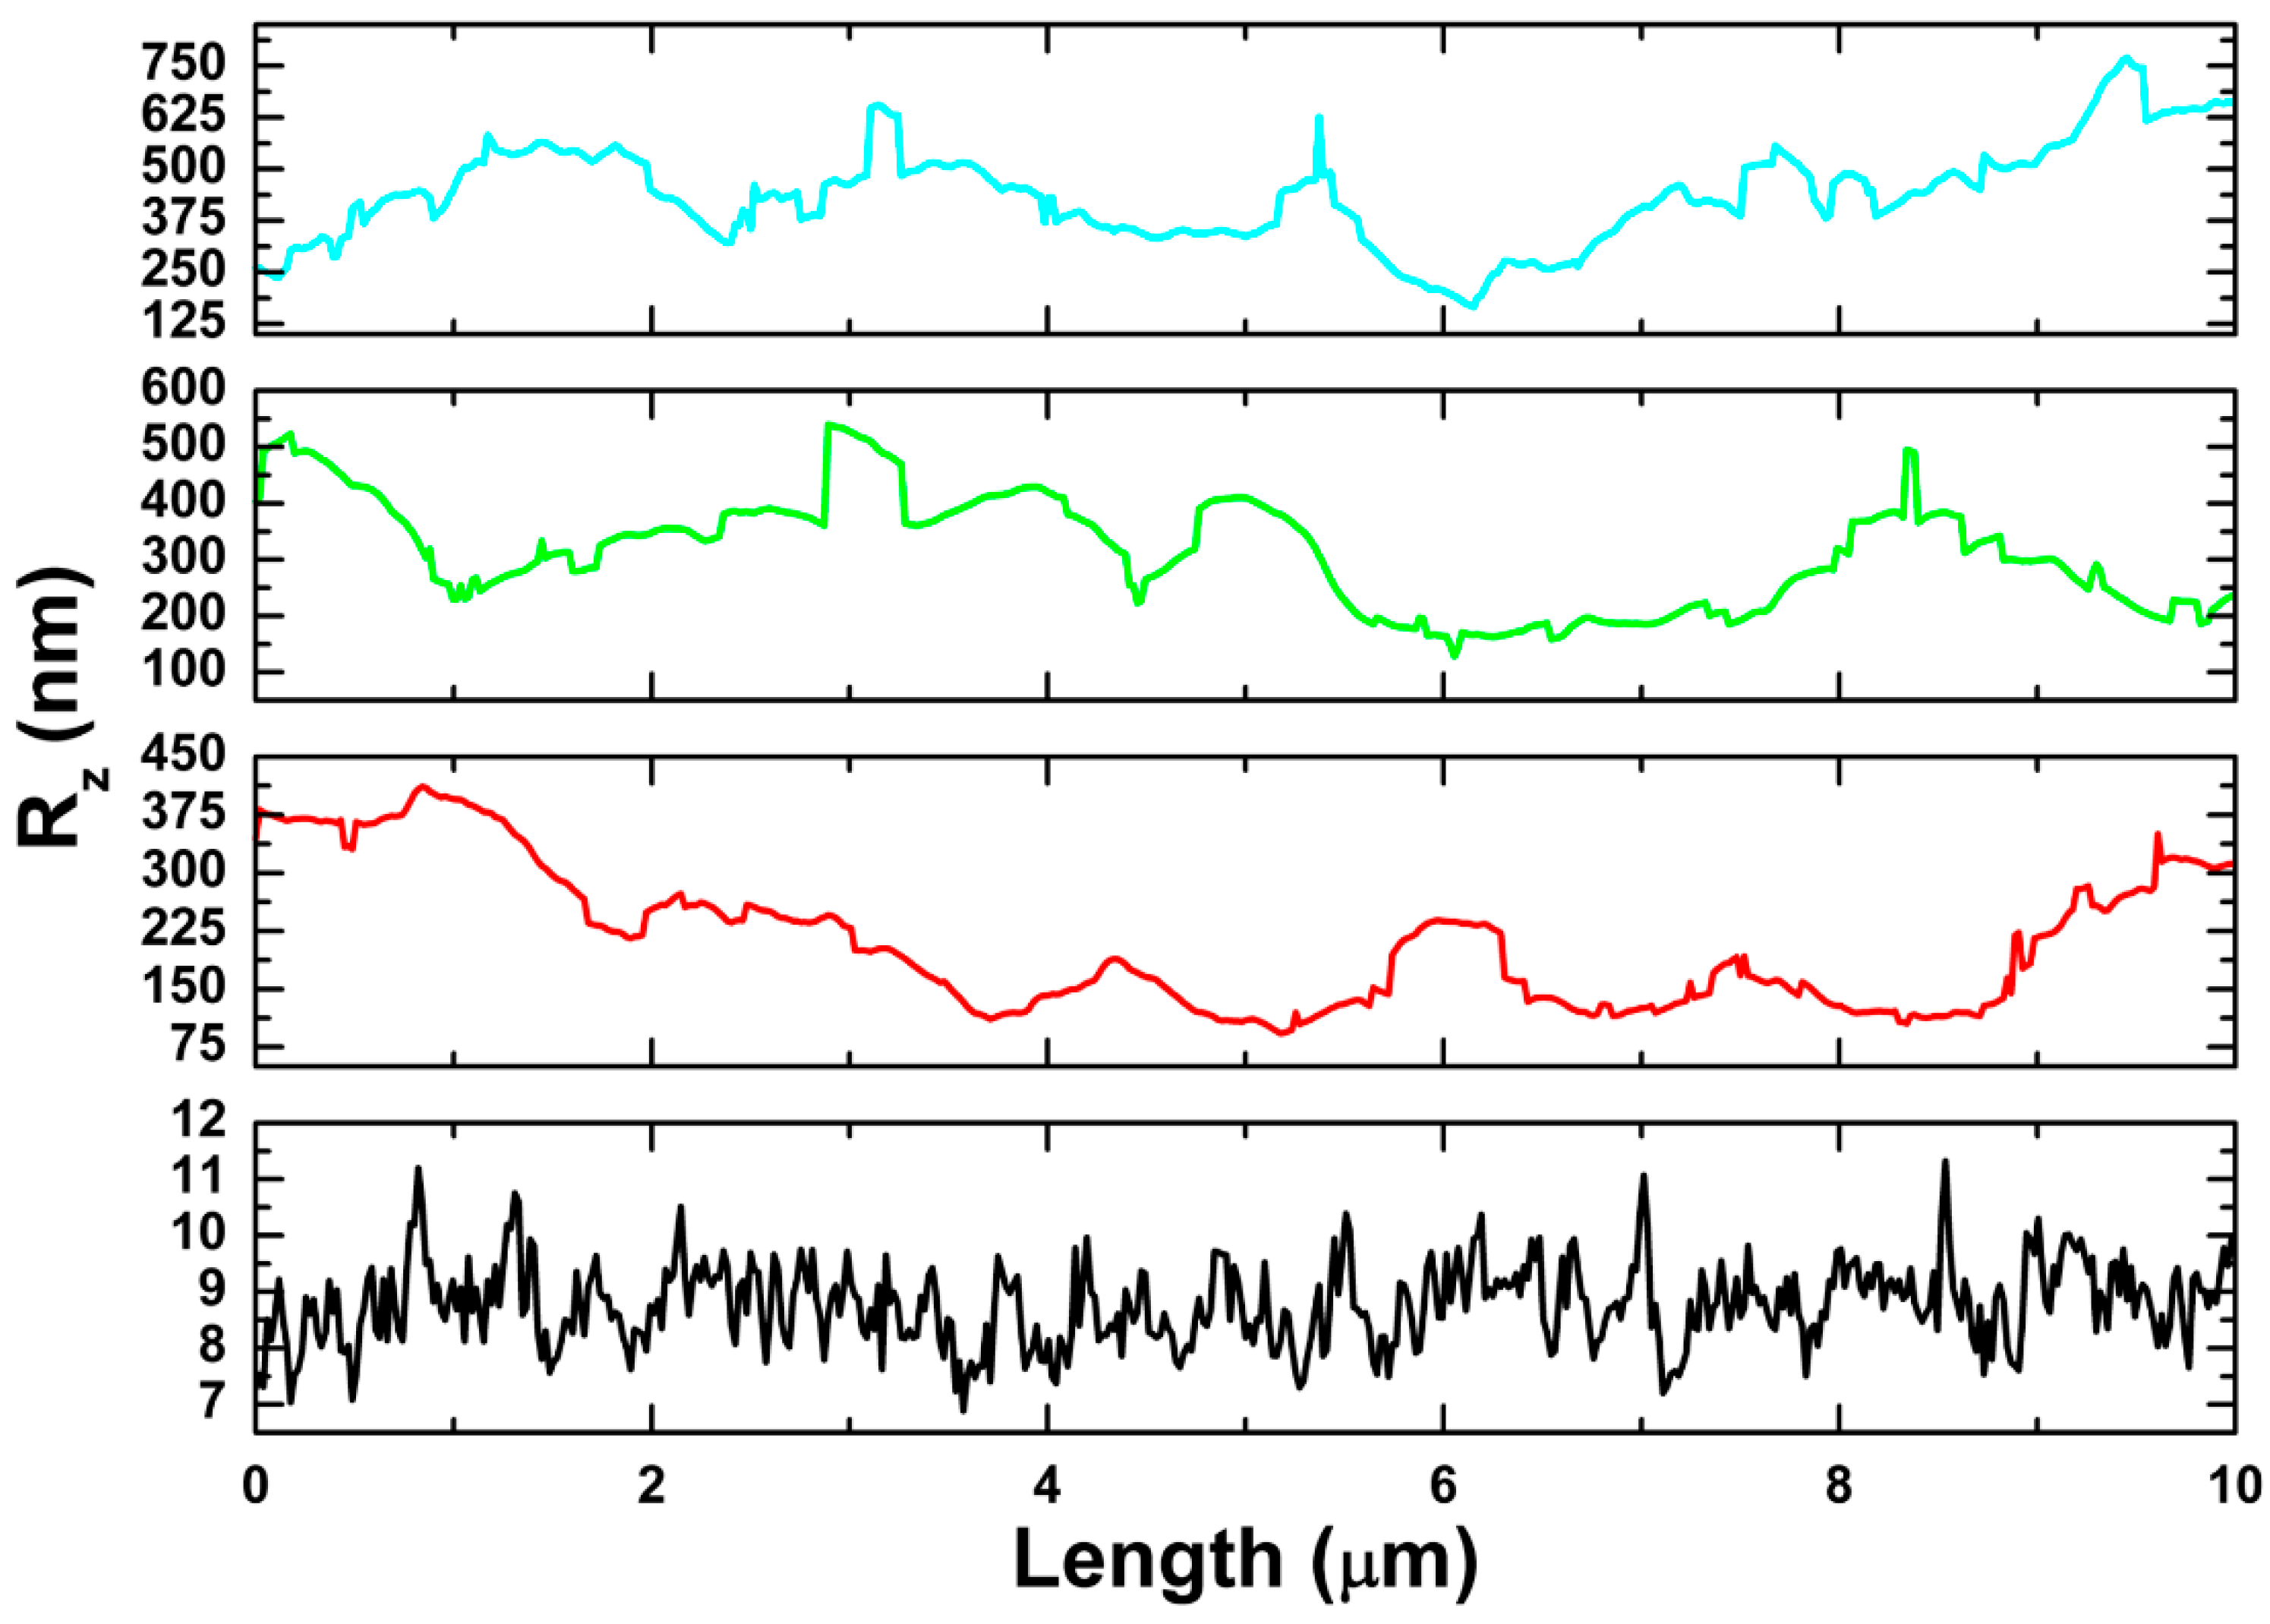
3.1. AFM Measurements

Atomic force microscopy (AFM) has contributed significantly to analyzing the surface morphology of material surfaces. In this regard, Figure 1 displays the variation in morphology or roughness of poly(o-ethoxyaniline) thin film surfaces as a function of the number of deposition cycles. A linear trend of increase in surface roughness is evident with increase in cycles from the interface width (w) and average roughness (Ra) values listed in Table 1. This observation can be attributed to the coalescing of smaller particles into larger grains as reported in the literature [9]. In addition, growth of the analyzed surfaces with formation of islands with uneven peaks from sample #2 to sample #4 is shown in Figure 1.
According to Liete et al. [26], this phenomenon is positively correlated with the realization of conductive islands in POEA film surfaces linked with its crystalline sections. This indicates that increase in cycles can contribute to the enhancement of electrical conductivity in POEA films. Furthermore, the values for the maximum height of the profile (Rz) registered by the algebraic sum of the maximum profile peak height and maximum profile valley depth in a surface shows augmentation in values with increasing cycles. This implies the presence of heights and valleys with larger values contributing to the increase in surface roughness. The significant roughness of sample #4 as compared to the other analyzed samples is validated from the absence of discrete patterns in one part of ten-point height profiles to its neighborhood as a function of length, as shown in Figure 2.

3.2. Spatial Autocorrelation (ACF)

Recently, morphological analysis of AFM images with appropriate parameters contributed to the understanding of correlation between variations in surface microtexture and roughness and deposition parameters, and consequently to the interfacial properties [11,27]. In this context, the autocorrelation function (ACF) [28] and texture aspect ratio (Str) [16] are used to investigate the repeatability of specific patterns or isotropy in the investigated surface textures. Figure 3 and Table 2 show the ACF graphs and data with the fastest and slowest decay for four sample surface lengths and their corresponding values.
From the figure, increase in oscillation is obvious with number of cycles and contributes to the formation of hillocks with uneven peaks in the surfaces, as observed in Figure 1. In addition, the fastest decay of the ACF (or autocorrelation length) presents the smallest value for sample #1, indicating the existence of negative correlation between the lateral surface heights. It is interesting to note that the slowest decay length exhibits the largest value for sample deposited at 15 cycles. This observation suggests that a small change in two surface heights can introduce an appreciable change in roughness, as there is a marked difference between them. Through the division between the fastest and the slowest decay length of the ACF, one can define parameter Str, which varies between 0 and 1; if Str = 1, then there is an isotropic surface [29]. In this framework, from Table 2, the Str values show the highest and lowest values for samples deposited at 5 and 15 cycles, respectively, suggesting the highest and lowest microtexture isotropy for the samples. The lowest isotropy for sample #3 microtexture can be validated from its largest value for the slowest decay of ACF, while absence of preferred texture direction in the case of sample #1 is attributed to it having the smallest value for autocorrelation length. Our analysis validates that accounting for surface roughness is not the only comprehensive way to study the microtexture of film surfaces; other relevant parameters should also be considered for analyzing the variation in the microtexture of the investigated samples.

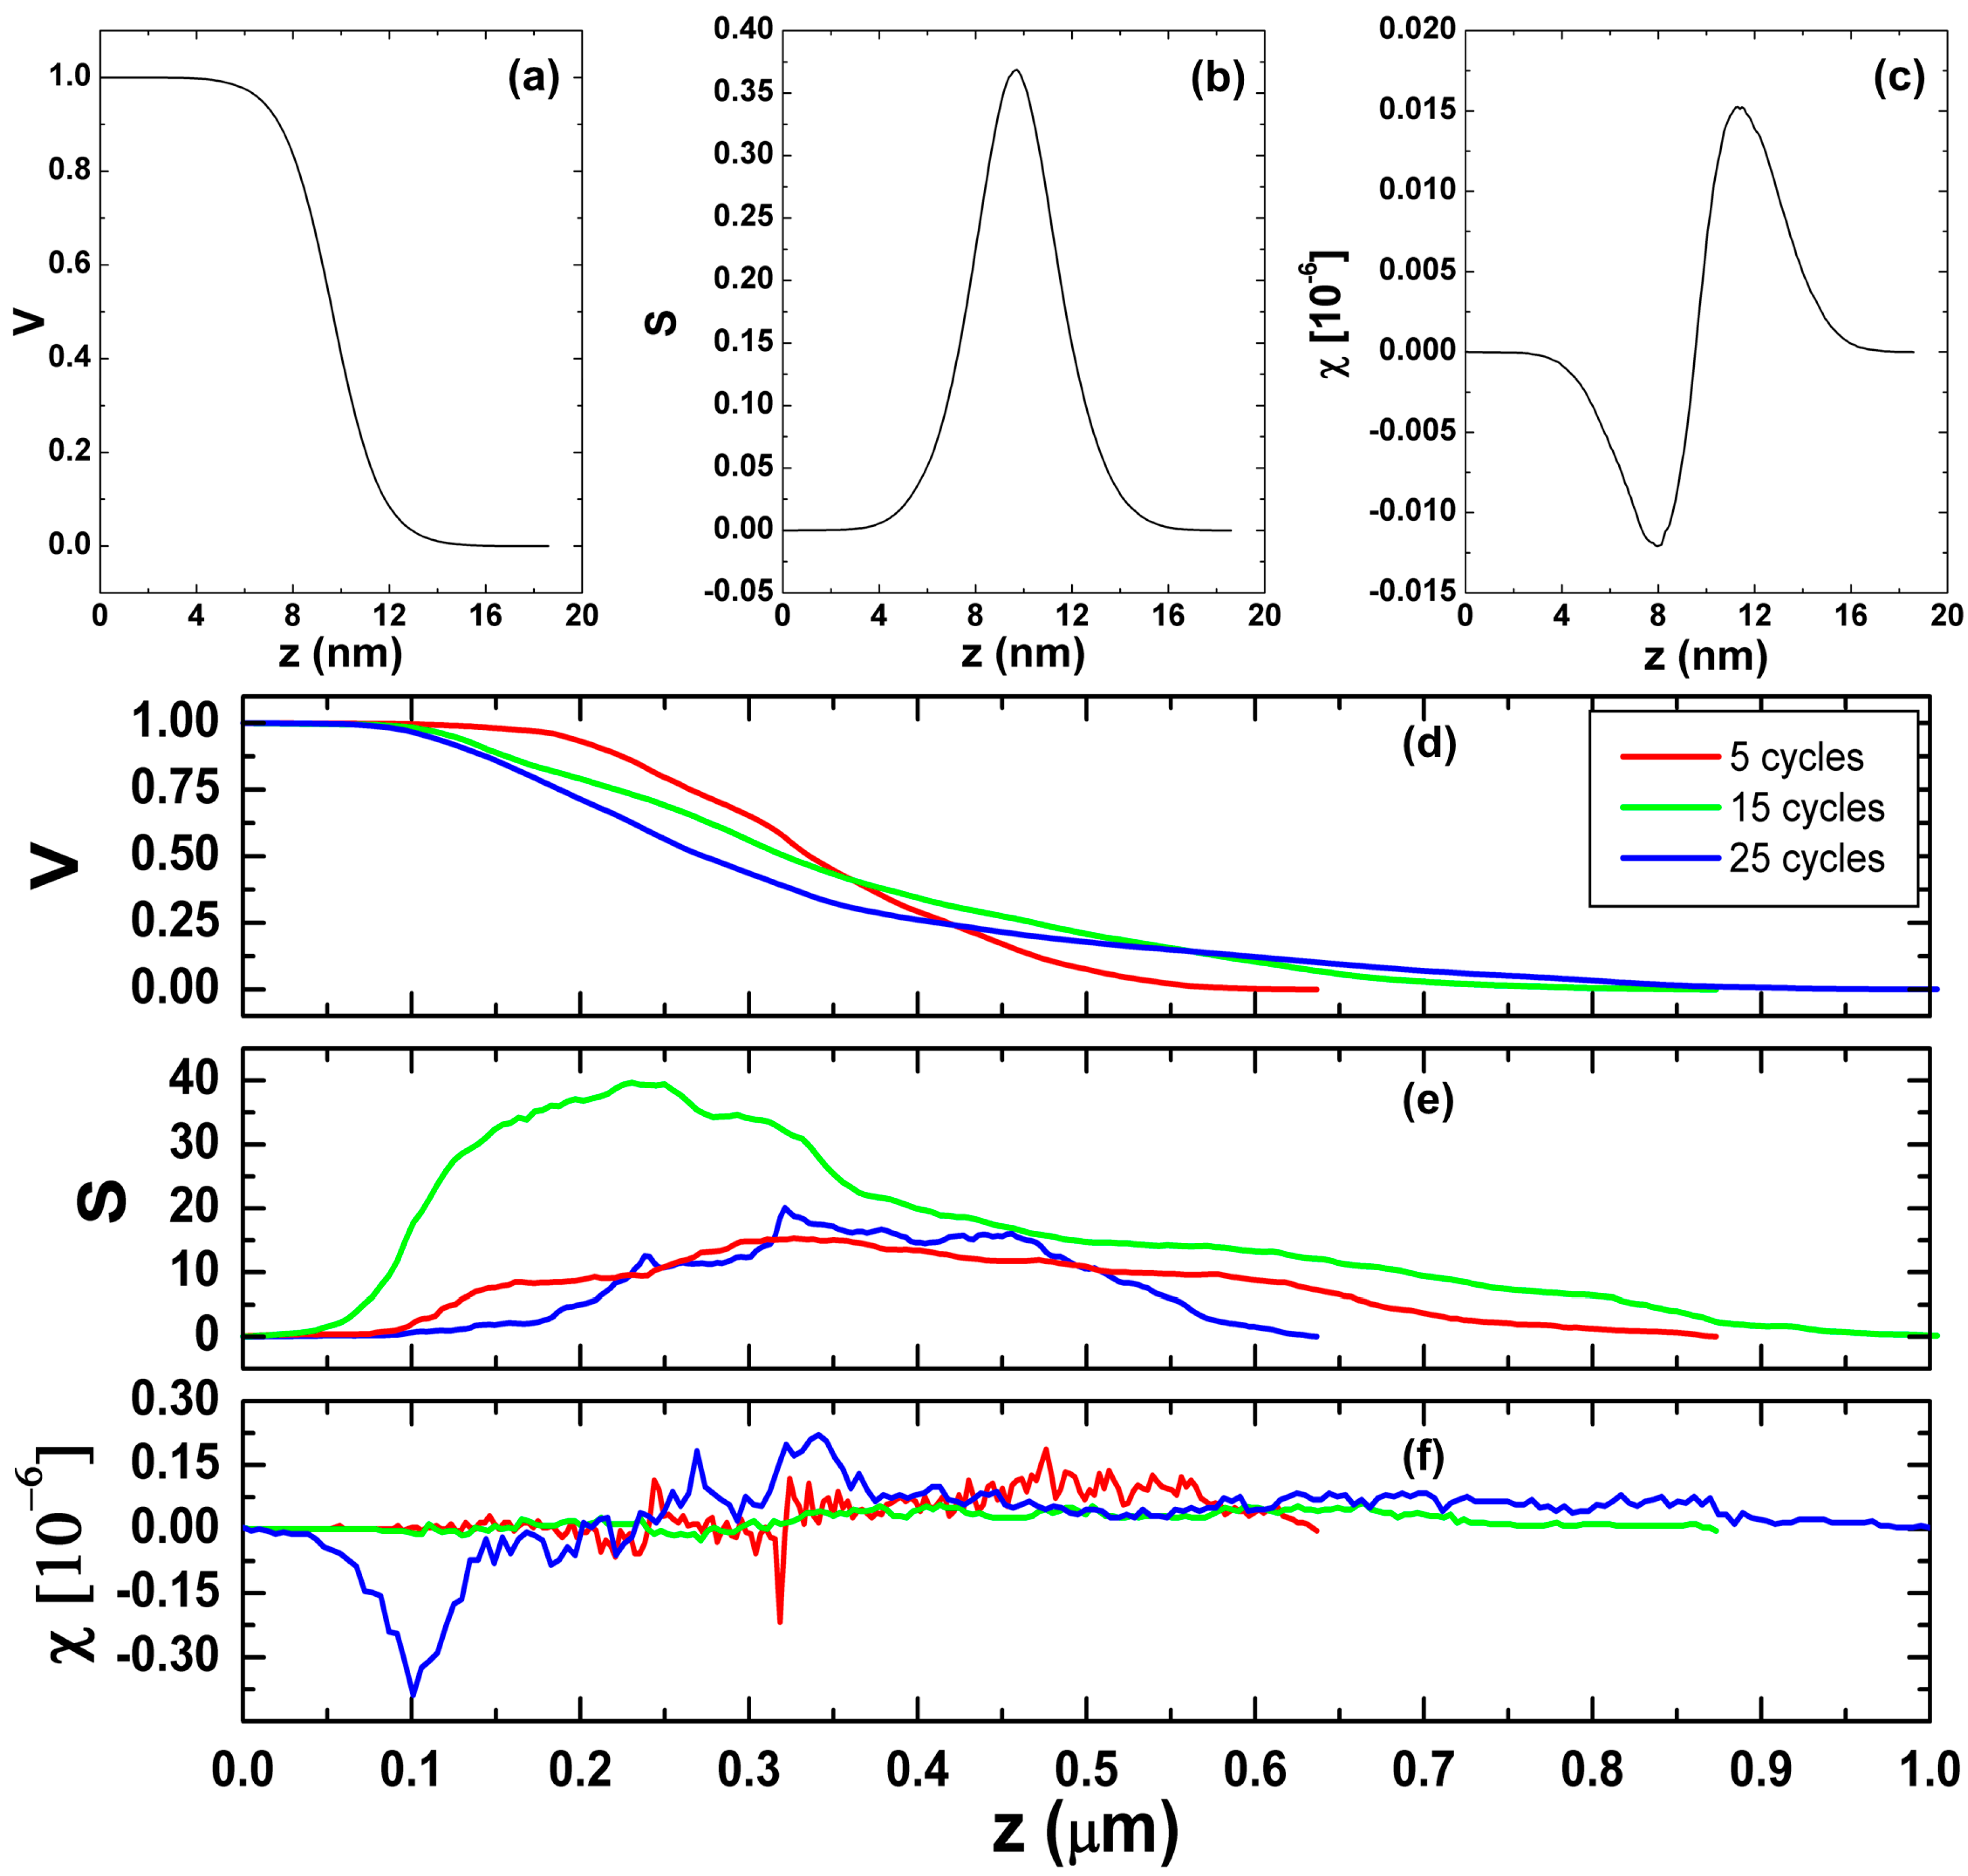
3.3. Minkowski Functionals

The variation in morphology of thin film surfaces following a deterministic but stochastic behavior can be probed using the Minkowski functionals. For a Gaussian random field, the analytic form of the functionals takes the form [30]:
V ( h ) = 1 / 2 [ e r f z ( x , y ) / 1.414 w ]
S ( h ) = k 8 π [ exp ( z ( x , y ) ) 2 2 R a ]
χ ( h ) = k 2 z ( x , y ) 2 π 3 R a exp [ ( z ( x , y ) ) 2 2 R a ]
where V(h), S(h), and χ(h) are the Minkowski volume, boundary, and connectivity, respectively. For surfaces of thin films, these parameters probe the covered area, boundary length, and dissimilarity between the linked components and holes, respectively. Figure 4 provides the graphs of the variation in Minkowski volume, boundary, and connectivity for the analyzed surfaces as a function of z, and Table 3 gives their corresponding values.
An increase in values of the volume parameter with V > 0.5 is observed for films deposited at 5, 15, and 25 cycles. Additionally, greater density of peaks is attributed to sample #3 from its highest value for Minkowski volume, while all the other samples exhibit a regular type of topography [31,32] as observed in Figure 4d. Additionally, a similar trend in morphology is experiential for samples #1 and #4, shown in Figure 4e, although the enhanced roughness in the case of the sample deposited at 25 cycles is attributed to its low autocorrelation length. Interestingly, the Minkowski connectivity, computed using the Gaussian radially averaged power spectral density function, displayed the largest value for sample #2, indicating the presence of significant peaks in the surface. Additionally, its value for sample set down at 25 cycles shows a smaller value compared to those at 5 and 15 cycles, indicating a smaller difference between the linked components and holes, validating the enhancement in surface roughness owing the existence of negative correlation between the lateral difference in surface heights, as suggested from the value of fastest decay length. This analysis is also supported by Figure 4f, which shows enhanced irregularity in the connectivity spectra.

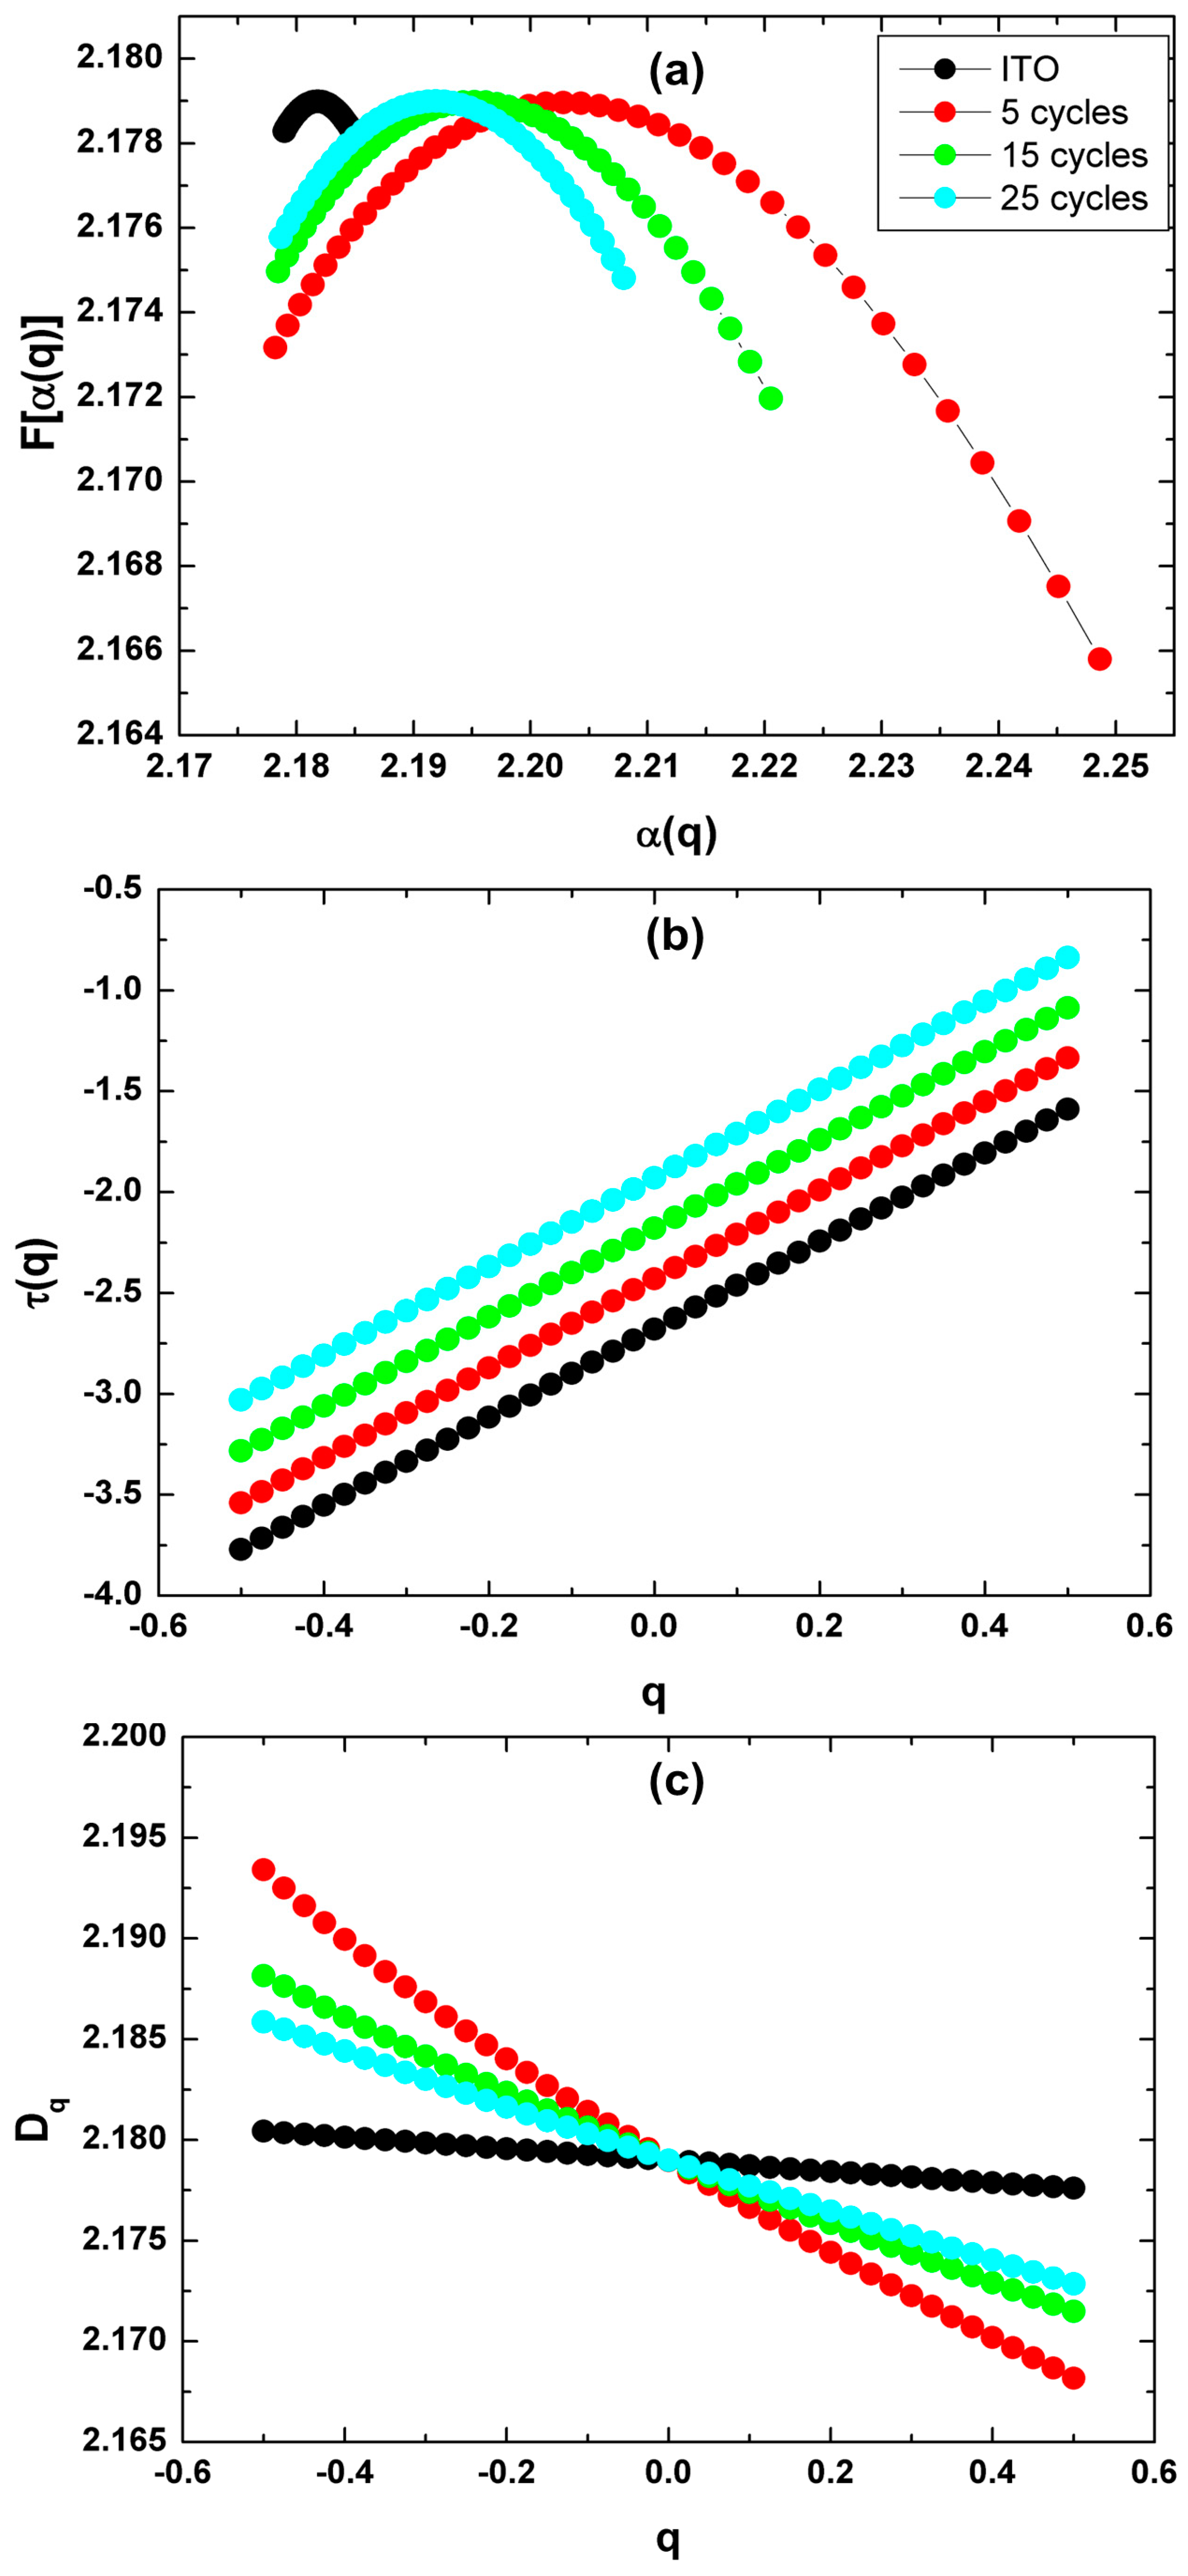
3.4. Multifractal Analysis

Fractal analysis of thin film surfaces is unable to assess the specificities in growth probabilities as a consequence of the presence of local irregularities and scaling variation along the surface. This limitation is overcome with the implementation of multifractal analysis. The nonlinear trend of mass exponent (τ) as a function of moment of order (q), shown in Figure 5a, indicates multifractal settings of virgin ITO electrode and the samples deposited at 5, 15, and 25 cycles. However, as observed in Figure 5b, the analyzed film surfaces, except for the ITO electrode, displays a nonlinear decreasing behavior of generalized dimension (Dq). This observation validates the multifractal nature of POEA films, while the electrode surface shows monofractal behavior [33]. The multifractal spectra for the investigated surfaces are shown in Figure 5c. Table 4 provides their respective values. The width of the multifractal spectrum is computed by the Equation (12) [10]:
Δα = αmaxαmin
where the singularity strengths are given by αmax and αmin, which are the most and least singular, respectively [34,35]. The surfaces of POEA displays decrease in multifractality strength with increasing cycles, as observed in Table 4. In addition, this observation can be attributed to enhancement in regularity and uniformity in surface heights with increase in cycles. Furthermore, the spectrum arm height difference (Δf) is given as [10]:
Δf = f(αmin) − f(αmax)
A decreasing trend observed for the POEA samples with increasing cycles identifies a larger distribution of surface heights in the valleys along with a decrease in vertical complexity [33]. This observation supports the qualitative information gained from Figure 1 and quantitative evidence from other reported methods. Our analysis suggests that multifractal analysis along with stereometric and Minkowski functionals analysis can shed light on the dynamics of morphology in POEA thin films with varying cycles of deposition.

4. Conclusions

A conjugated polymer such as poly(o-ethoxyalinine) offers applications in corrosion surface protection and must therefore possess surfaces with high strength and wear resistance. This requires an understanding of morphology dynamics of POEA films as a function of deposition parameters. In this regard, we analyzed the surfaces of POEA films deposited with varying cycles in the context of stereometric, MFs, and multifractal analysis. Height patterns strongly indicate the increase in surface roughness with increasing number of cycles. The autocorrelation length indicates the presence of negative correlation between lateral surface heights for film deposited at 5 cycles, while a steep difference between surface heights for film at 20 cycles is revealed from the slowest decay length of autocorrelation function. Minkowski volume indicates a similar pattern in the topography for films at 5, 15, and 25 cycles, respectively, while it also realized the greatest density of peaks for sample #3. The lower value of Minkowski connectivity for film at 25 cycles as compared to 5 and 15 cycles is attributed to the negative correlation between lateral separations in surface heights. The multifractal nature of POEA surfaces deposited at varying cycles is validated from the mass exponent and generalized dimension as a function of qth order moments. The width of the multifractal spectra exhibited a decrement in multifractal behavior of the investigated films with increase in cycles and is attributed to the increase in regularity and uniformity of surface heights. In addition, the difference in fractal dimension corresponding to the most and least probabilities of surface heights showed a decreasing trend and signifies an increase in height distribution at surface valleys along with a decrease in vertical complexity. Our work presented an in-depth view of the morphological dynamics of poly(o-ethoxyalinine) as a function of increasing cycles for appropriate applications.

Author Contributions

C.C.d.S.: conceptualization, project coordination, and methodology. A.M.D.G. and W.R.B.: conceptualization, methodology, and data collecting/analysis. E.A.S., A.D. and S.K.: original draft preparation, data analysis. R.S.M. and H.D.d.F.F.: data curation, formal analysis, validation, resources, software. Ş.Ţ.: data processing/writing and funding acquisition. All authors have read and agreed to the published version of the manuscript.

Funding

This research received no external funding.

Institutional Review Board Statement

Not applicable.

Informed Consent Statement

Not applicable.

Data Availability Statement

The data used to support the findings of this study are available from the corresponding author upon request.

Acknowledgments

The authors thank Coordenação de Aperfeiçoamento de Pessoal de Nível Superior (CAPES) for financial support, and for the use of the infrastructure of the Analytical Center of Universidade Federal do Amazonas (UFAM). We also thank the Laboratório de Síntese de Nanomateriais e Nanoscopia (LSNN) associated with the Sistema Nacional de Laboratórios em Nanotecnologias (SisNANO)—Processo CNPq 442601/2019-0.

Conflicts of Interest

The authors declare no conflict of interest.

References

  1. Wang, C.-C.; Wei, S.-C.; Luo, S.-C. Recent advances and biomedical applications of peptide-integrated conducting polymers. ACS Appl. Bio Mater. 2022, 5, 1916–1933. [Google Scholar] [CrossRef] [PubMed]
  2. Ghomi, M.; Zare, E.N.; Varma, R.S. Properties of conducting polymers. ACS Symp. Ser. 2022, 1405, 39–65. [Google Scholar] [CrossRef]
  3. Macinnes, D.; Funt, B.L. Poly-o-methoxyaniline: A new soluble conducting polymer. Synth. Met. 1988, 25, 235–242. [Google Scholar] [CrossRef]
  4. Bergeron, J.-Y.; Chevalier, J.-W.; Dao, L.H. Water-soluble conducting poly(aniline) polymer. J. Chem. Soc. Chem. Commun. 1990, 2, 180. [Google Scholar] [CrossRef]
  5. Nogueira, J.S.; Mattoso, L.H.c.; Lepienski, C.M.; Faria, R.M. AC conduction of poly(o-methoxyaniline). Synth. Met. 1995, 69, 259–260. [Google Scholar] [CrossRef]
  6. Sathiyanarayanan, S.; Dhawan, S.K.; Trivedi, D.C.; Balakrishnan, K. Soluble conducting poly ethoxy aniline as an inhibitor for iron in HCl. Corros. Sci. 1992, 33, 1831–1841. [Google Scholar] [CrossRef]
  7. Daouadji, M.M.; Chelali, N. Influence of molecular weight of poly(ortho-ethoxyaniline) on the corrosion inhibition efficiency of mild steel in acidic media. J. Appl. Polym. Sci. 2004, 91, 1275–1284. [Google Scholar] [CrossRef]
  8. Mello, S.V.; Mattoso, L.H.C.; Santos, J.R.; Gonçalves, D.; Faria, R.M.; Oliveira, O.N. Electrochemical response of poly(o-ethoxyaniline) films produced by different techniques. Electrochim. Acta 1995, 40, 1851–1855. [Google Scholar] [CrossRef]
  9. Ito, R.M.; de Souza, C.C.; Gandarilla, A.M.D.; de Oliveira, L.M.; Brito, W.R.; Sanches, E.A.; Matos, R.S.; da Fonseca Filho, H.D. Micromorphology and microtexture evaluation of poly(o-ethoxyaniline) films using atomic force microscopy and fractal analysis. J. Polym. Res. 2020, 27, 299. [Google Scholar] [CrossRef]
  10. Ţălu, Ş. Micro and Nanoscale Characterization of Three Dimensional Surfaces. Basics and Applications; Napoca Star Publishing House: Cluj-Napoca, Romania, 2015; pp. 199–210. [Google Scholar]
  11. Korpi, A.R.G.; Rezaee, S.; Luna, C.; Ţălu, Ş.; Arman, A.; Ahmadpourian, A. Influence of the oxygen partial pressure on the growth and optical properties of RF-sputtered anatase TiO2 thin films. Results Phys. 2017, 7, 3349–3352. [Google Scholar] [CrossRef]
  12. Novikov, V.U.; Kozlov, G. V Fractal analysis of macromolecules. Russ. Chem. Rev. 2000, 69, 347–366. [Google Scholar] [CrossRef]
  13. Valle, F.; Brucale, M.; Chiodini, S.; Bystrenova, E.; Albonetti, C. Nanoscale morphological analysis of soft matter aggregates with fractal dimension ranging from 1 to 3. Micron 2017, 100, 60–72. [Google Scholar] [CrossRef]
  14. Li, Y.-C.; Chen, K.-B.; Chen, H.-L.; Hsu, C.-S.; Tsao, C.-S.; Chen, J.-H.; Chen, S.-A. Fractal aggregates of conjugated polymer in solution state. Langmuir 2006, 22, 11009–11015. [Google Scholar] [CrossRef] [PubMed]
  15. de Oliveira, L.M.; Matos, R.S.; Campelo, P.H.; Sanches, E.A.; da Fonseca Filho, H.D. Evaluation of the nanoscale surface applied to biodegradable nanoparticles containing Allium sativum essential oil. Mater. Lett. 2020, 275, 128111. [Google Scholar] [CrossRef]
  16. De Oliveira, L.M.; Matos, R.S.; Ţălu, Ş.; Rocha, A.L.F.; de Aguiar Nunes, R.Z.; Bezerra, J.d.A.; Campelo Felix, P.H.; Inada, N.M.; Sanches, E.A.; da Fonseca Filho, H.D. Three-dimensional nanoscale morphological surface analysis of polymeric particles containing Allium sativum Essential Oil. Materials 2022, 15, 2635. [Google Scholar] [CrossRef]
  17. Nečas, D.; Klapetek, P. Gwyddion: An open-source software for SPM data analysis. Cent. Eur. J. Phys. 2012, 10, 181–188. [Google Scholar] [CrossRef]
  18. Ţălu, Ş.; Bramowicz, M.; Kulesza, S.; Shafiekhani, A.; Rahmati, M.; Ghaderi, A.; Ahmadirad, M.; Solaymani, S. Microstructure of nickel nanoparticles embedded in carbon films: Case study on annealing effect by micromorphology analysis. Surf. Interface. Anal. 2017, 49, 153–160. [Google Scholar] [CrossRef]
  19. Bielejewska, N.; Hertmanowski, R. Surface characterization of nanocomposite Langmuir films based on liquid crystals and cellulose nanocrystals. J. Mol. Liq. 2021, 323, 115065. [Google Scholar] [CrossRef]
  20. Dong, W.P.; Sullivan, P.J.; Stout, K.J. Comprehensive study of parameters for characterising three-dimensional surface topography. Wear 1994, 178, 45–60. [Google Scholar] [CrossRef]
  21. Yao, B.; Imani, F.; Sakpal, A.S.; Reutzel, E.W.; Yang, H. Multifractal analysis of image profiles for the characterization and detection of defects in additive manufacturing. J. Manuf. Sci. Eng. 2018, 140, 031014. [Google Scholar] [CrossRef]
  22. Imani, F.; Yao, B.; Chen, R.; Rao, P.; Yang, H. Joint Multifractal and Lacunarity Analysis of Image Profiles for Manufacturing Quality Control. J. Manuf. Sci. Eng. 2019, 141, 044501. [Google Scholar] [CrossRef]
  23. Chen, Y.; Yang, H. Numerical simulation and pattern characterization of nonlinear spatiotemporal dynamics on fractal surfaces for the whole-heart modeling applications. Eur. Phys. J. B 2016, 89, 181. [Google Scholar] [CrossRef]
  24. Ţălu, Ş.; Stach, S.; Valedbagi, S.; Bavadi, R.; Elahi, S.M.; Ţălu, M. Multifractal characteristics of titanium nitride thin films. Mater. Sci.-Poland 2015, 33, 541–548. [Google Scholar] [CrossRef]
  25. Block, A.; von Bloh, W.; Schellnhuber, H.J. Efficient box-counting determination of generalized fractal dimensions. Phys. Rev. A 1990, 42, 1869–1874. [Google Scholar] [CrossRef] [PubMed]
  26. Leite, F.L.; Alves, W.F.; Mir, M.; Mascarenhas, Y.P.; Herrmann, P.S.P.; Mattoso, L.H.C.; Oliveira, O.N. TEM, XRD and AFM study of poly(o-ethoxyaniline) films: New evidence for the formation of conducting islands. Appl. Phys. A 2008, 93, 537. [Google Scholar] [CrossRef]
  27. Kuznetsov, G.V.; Islamova, A.G.; Orlova, E.G.; Ivashutenko, A.S.; Shanenkov, I.I.; Zykov, I.Y.; Feoktistov, D.V. Influence of roughness on polar and dispersed components of surface free energy and wettability properties of copper and steel surfaces. Surf. Coatings Technol. 2021, 422, 127518. [Google Scholar] [CrossRef]
  28. Nečas, D.; Klapetek, P. One-dimensional autocorrelation and power spectrum density functions of irregular regions. Ultramicroscopy 2013, 124, 13–19. [Google Scholar] [CrossRef]
  29. Blateyron, F. The Areal Field Parameters. In Characterisation of Areal Surface Texture; Springer: Berlin/Heidelberg, Germany, 2013; pp. 15–43. [Google Scholar]
  30. Mantz, H.; Jacobs, K.; Mecke, K. Utilizing Minkowski functionals for image analysis: A marching square algorithm. J. Stat. Mech. Theory Exp. 2008, 2008, P12015. [Google Scholar] [CrossRef]
  31. Mwema, F.M.; Akinlabi, E.T.; Oladijo, O.P.; Fatoba, O.S.; Akinlabi, S.A.; Ţălu, Ş. Advances in manufacturing analysis: Fractal theory in modern manufacturing. In Modern Manufacturing Processes, 1st ed.; Woodhead Publishing: Philadelphia, PA, USA, 2020; pp. 13–39. [Google Scholar] [CrossRef]
  32. Salerno, M.; Banzato, M. Minkowski measures for image analysis in scanning probe microscopy. Microsc. Anal. 2005, 19, 13–15. [Google Scholar]
  33. Ghosh, K.; Pandey, R.K. Annealing time induced roughening in ZnO thin films: A fractal and multifractal assessment. Mater. Sci. Semicond. Process. 2020, 106, 104771. [Google Scholar] [CrossRef]
  34. Astinchap, B.; Moradian, R.; Namdari, T.; Jurecka, S.; Ţălu, Ş. Prepared σ-MnO2 thin films by chemical bath deposition methods and study of its optical and microstructure properties. Opt. Quantum Electron 2019, 51, 170. [Google Scholar] [CrossRef]
  35. Shakoury, R.; Arman, A.; Mwema, F.M.; Luna, C.; Ghosh, K.; Jurečka, S.; Ţălu, Ş.; Rezaee, S.; Korpi, A.G. Multifractal and optical bandgap characterization of Ta2O5 thin films deposited by electron gun method. Opt. Quantum Electron. 2020, 52, 95. [Google Scholar] [CrossRef]
Figure 1. Relevant 2D and 3D AFM images: (a) ITO, (b) 5 cycles, (c) 15 cycles, and (d) 25 cycles.
Coatings 12 01216 g001
Figure 2. Maximum height of the profile acquired from AFM images.
Coatings 12 01216 g002
Figure 3. ACFs graphs as a function of the sample length (r) of (a) ITO, (b) 5 cycles, (c) 15 cycles, and (d) 25 cycles.
Coatings 12 01216 g003
Figure 4. The Minkowski functionals of the samples: (a) volume, (b) boundary, and (c) connectivity for the ITO surface; (df) are, respectively, volume, boundary, and connectivity for the POEA thin films.
Coatings 12 01216 g004
Figure 5. (a) Generalized dimensions and (b) the mass exponent τ(q) as a function of the order of moments for the thin film surfaces. For better visualization, the curves referring to τ(q) were shifted in by −0.5, −0.25, 0.00, and +0.25 for ITO, 5, 15, and 25 cycles, respectively. (c) Multifractal singularity curve of the ITO and POEA films.
Coatings 12 01216 g005
Table 1. Different surface roughness parameters of the samples.
ParameterUnit#1#2#3#4
wnm1.83 ± 0.09121.88 ± 18.24138.95 ± 22.22194.15 ± 150.05
Ranm1.41 ± 0.0796.15 ± 12.03110.68 ± 21.09150.05 ± 22.28
Rznm8.77 ± 0.73210.00 ± 88.45313.10 ± 97.86440.00 ± 12.00
Table 3. Values of Minkowski functionals of the POEA films surfaces.
ParameterUnit#1#2#3#4
V-0.500.540.830.58
S (10−3)-3.320.981.756.86
χ (10−6)-1.7172.4524.301.61
Table 4. Sample multifractal data.
ParameterUnit#1#2#3#4
Multifractal Parameters
αmax-2.1852.2472.2212.208
αmin-2.1792.1782.1782.179
Δα-0.0060.0690.0430.029
f(αmax)-2.1782.1662.1712.175
f(αmin)-2.1782.1732.1752.176
Δf-0.000.0070.0040.001
Table 2. Corresponding values of τa1, τa2, Sa1, Sa2, and Str for the samples.
ParameterUnit#1#2#3#4
τa1°45.015.6−9.67−87.2
τa2°−52.1−44.250.9−53.4
Sa1µm69.1 × 10−31.271.340.99
Sa2µm111.3 × 10−32.794.112.18
Str-0.620.450.250.45
Publisher’s Note: MDPI stays neutral with regard to jurisdictional claims in published maps and institutional affiliations.

