Article

Effect of Cu Coating on Microstructure and Properties of Al/Steel Welding–Brazing Joints Obtained by Cold Metal Transfer (CMT)

1
School of Materials Science and Engineering, Jiangsu University of Science and Technology, Zhenjiang 212003, China
2
School of Public Utilities, Jiangsu Urban and Rural Construction College, Changzhou 213003, China
3
Zhejiang Xinrui Braing Technology Co., Ltd., Shengzhou 312400, China
*
Author to whom correspondence should be addressed.
Coatings 2022, 12(8), 1123; https://doi.org/10.3390/coatings12081123
Submission received: 19 June 2022 / Revised: 8 July 2022 / Accepted: 29 July 2022 / Published: 5 August 2022

Abstract

:
Adding alloy elements to develop excellent properties in Al alloy/steel welding–brazing joints to realize lightweight vehicle structures has become a feasible task. Here, CMT welding–brazing was used to realize the reliable connection of Al/steel with a Cu coating. Al alloy/steel welding–brazing joints with different thicknesses of Cu coating were designed to study the influence of Cu on microstructure composition, mechanical properties and corrosion resistance. Then, the action rule of the Cu element on the interfacial microstructure evolution was clarified. The results showed that the appropriate Cu coating could effectively inhibit the reaction of Al and Fe and reduce the thickness of interfacial brittle intermetallic compounds (IMCs). Moreover, Cu could react with Al, Fe and Si to promote the formation of the τ5-Al7.2(Cu,Fe)1.8Si phase and control the formation of the brittle θ-Fe(Al,Si)3 phase, which improved the toughness of IMCs. When the thickness of the Cu coating on the surface of steel was 10 μm, the tensile strength of the Al alloy/steel CMT welding–brazing joint reached a maximum of 138.7 MPa and the corrosion resistance of the joint reached the optimum level. However, when the thickness of the Cu coating increased to 20 μm, the IMCs’ thickness at the interface of the joint reached the minimum, but Cu reacted with Al to form a brittle Al2Cu phase under the higher Cu content, which deteriorated the tensile strength and corrosion resistance of joints. This work will provide an experimental and theoretical basis for developing good properties in Al/Cu-coating/steel welding joints.

1. Introduction

In response to the global call for “energy conservation, emission reduction and environmental protection”, Al alloy, as a substitution for parts of steel, can effectively achieve lightweight structures in vehicles, ships and other means of transportation because of its low density, high specific strength, good conductivity and corrosion resistance [1]. However, due to the great differences in physical and chemical properties between Al alloy and steel, it is difficult to weld Al alloy/steel structural parts [2]. Firstly, the melting point of Al alloy is approximately one third of that of steel. During welding, Al alloy melts while steel is still solid, which increases the difficulty of Al alloy/steel welding metallurgy. Secondly, the density of Al alloy is low, and there is a stable and dense oxide film on the surface. In the welding process, the molten Al alloy can easily float on the surface of the welding pool, resulting in uneven composition and the formation of inclusions in joints, which reduces the quality of the welded joints. In particular, it should be pointed out that the brittle and hard IMCs, such as FeAl2, FeAl3 and Fe2Al5, can easily form at the interface of Al alloy and steel [3,4]. These IMCs will deteriorate the toughness of the welded joint.
To solve the above problems, intermediate transition metals are usually considered to be added between Al and steel, to alleviate the thermal stress caused by the differences in physical and chemical properties and inhibit the formation of brittle Fe-Al IMCs. Researchers have mainly focused on welding–brazing and solid-state welding of Al/steel with Cu, Al, Zn, AI-Si, Ni, etc., as intermediate transition metals. Yang et al. [5] carried out a laser butt welding experiment between 5083 Al alloy and steel, with Cu foil as an interlayer. They found that Cu foil effectively reduced the temperature gradient and heat transfer rate of liquid metal at the interface, and significantly increased the melting amount of Al alloy. Saleh et al. [6] used a thermoelectric couple machine to weld AA6063 Al alloy and UNSS32304 steel, with a Cu layer as the intermediate layer. The results showed that the Cu coating could inhibit the mutual diffusion between Fe and Al. Cu reacted Al to form eutectic Al-Cu, which reduced the brittle Fe-Al IMCs. Li et al. [7] studied the friction welding of Usibor1500 high-strength steel/Al coating/AA6022 Al alloy. The results showed that the average thickness of the Fe-Al IMC layer was approximately 10 nm. Athieu et al. [8] used laser welding–brazing to join 6061 Al alloy/Zn coating/low steel using Zn−15Al as a filler metal. The IMC thickness was approximately 8~12 μm. The maximum tensile strength of the joint was approximately 220 MPa. Mohammadpour and Xia et al. [9,10] used AlSi5 and AlSi12 filler metal to join 6022 Al alloy and steel with a Zn coating by laser welding–brazing. The results showed that the affinity between Si and Al was greater than that of Fe and Al, which was beneficial for the formation of the Al-Fe-Si compound. Compared with the joint with AlSi5 as the filler metal, the IMC thickness of the joint was thinner and its tensile strength was 120 N/mm with AlSi12 as the filler metal. Shi et al. [11] studied the resistance spot welding of X626 Al alloy/Zn-Ni interlayer/low-carbon steel and X626 Al alloy/Zn-Ni-Cr interlayer/low-carbon steel, respectively. The results showed that Zn evaporated to form steam, which increased the porosity of the weld seam to delay the formation of the Fe2Al5 IMC layer. The thickness of the Fe2Al5 IMC layer in the weld joint with the Zn-Ni coating was 1 μm, while the Fe2Al5 IMC layer thickness was 0.5 μm on the condition of Zn-Ni-Cr coating, and its average shear strength was 1905 N/mm and its average fatigue strength was 160 N/mm.
Based on the above research results, in the process of laser welding–brazing on Al alloy and steel, incomplete fusion defects appear easily in the initial welding process due to the low laser absorption rate of Al alloy. Meanwhile, the growth of interfacial IMCs is promoted owing to the high heat input, which shrinks the welding parameter window [12]. Additionally, with regard to friction welding and resistance spot welding to realize the connection of Al alloy and steel, their industrial applications are limited due to the high requirements for material dimensions and joint forms [13]. However, cold metal transfer (CMT) technology has the characteristic of arc stability, and its unique droplet transfer mode can realize the accurate control of heat input during welding, which has special advantages in the joining of dissimilar metals. The above studies indicated that Cu can reduce the formation of interfacial IMCs, but the action rule of Cu on the interfacial microstructure evolution in Al alloy/steel welding–brazing joints remains unknown currently. Therefore, Cu was coated on the surface of Q235B steel, and then experiments on 6082 Al alloy/Cu coating/Q235B steel were conducted by CMT technology with AlSi12 as the welding wire. We designed Al alloy/steel welding–brazing joints with different thicknesses of Cu coating to clarify the effect of Cu on the microstructure composition, mechanical properties and corrosion resistance. Undoubtedly, our work will provide a deeper understanding of the influence of Cu on the interfacial microstructure evolution, which is beneficial to the application and development of good properties in Al alloy/steel welding joints in lightweight vehicle structures.

2. Experimental Materials and Methods

2.1. Materials and Electroplating Method

In this study, 6082 Al alloy and Q235B steel were chosen as the base metals; both of their dimensions were 150 mm × 100 mm × 2 mm. ER4047 (AlSi12) welding wire with the diameter of 1.6 mm was selected as the filler wire. The chemical compositions of them are shown in Table 1.
In order to remove burrs, all Q235B steel plates were polished with sandpaper before electroplating. Then, the steel plates were immersed in acid solution for 2 min, and the acid solution was 5%H2SO4 + 15%HCl + 80% distilled water. Finally, the steel plates were cleaned with distilled water. The samples were electroplated in solution. The composition of the electroplating solution was 14 g/L Cu2(OH)2CO3, 90 g/L HEDP, 40 g/L K2CO3, 7 g/L C4H4O6KNa, 0.1 g/L SDS. The different thicknesses of the pure Cu layer were obtained on the surfaces of steel plates by changing the electroplating time. The thicknesses of Cu coating were 5, 10, and 20 μm, respectively.

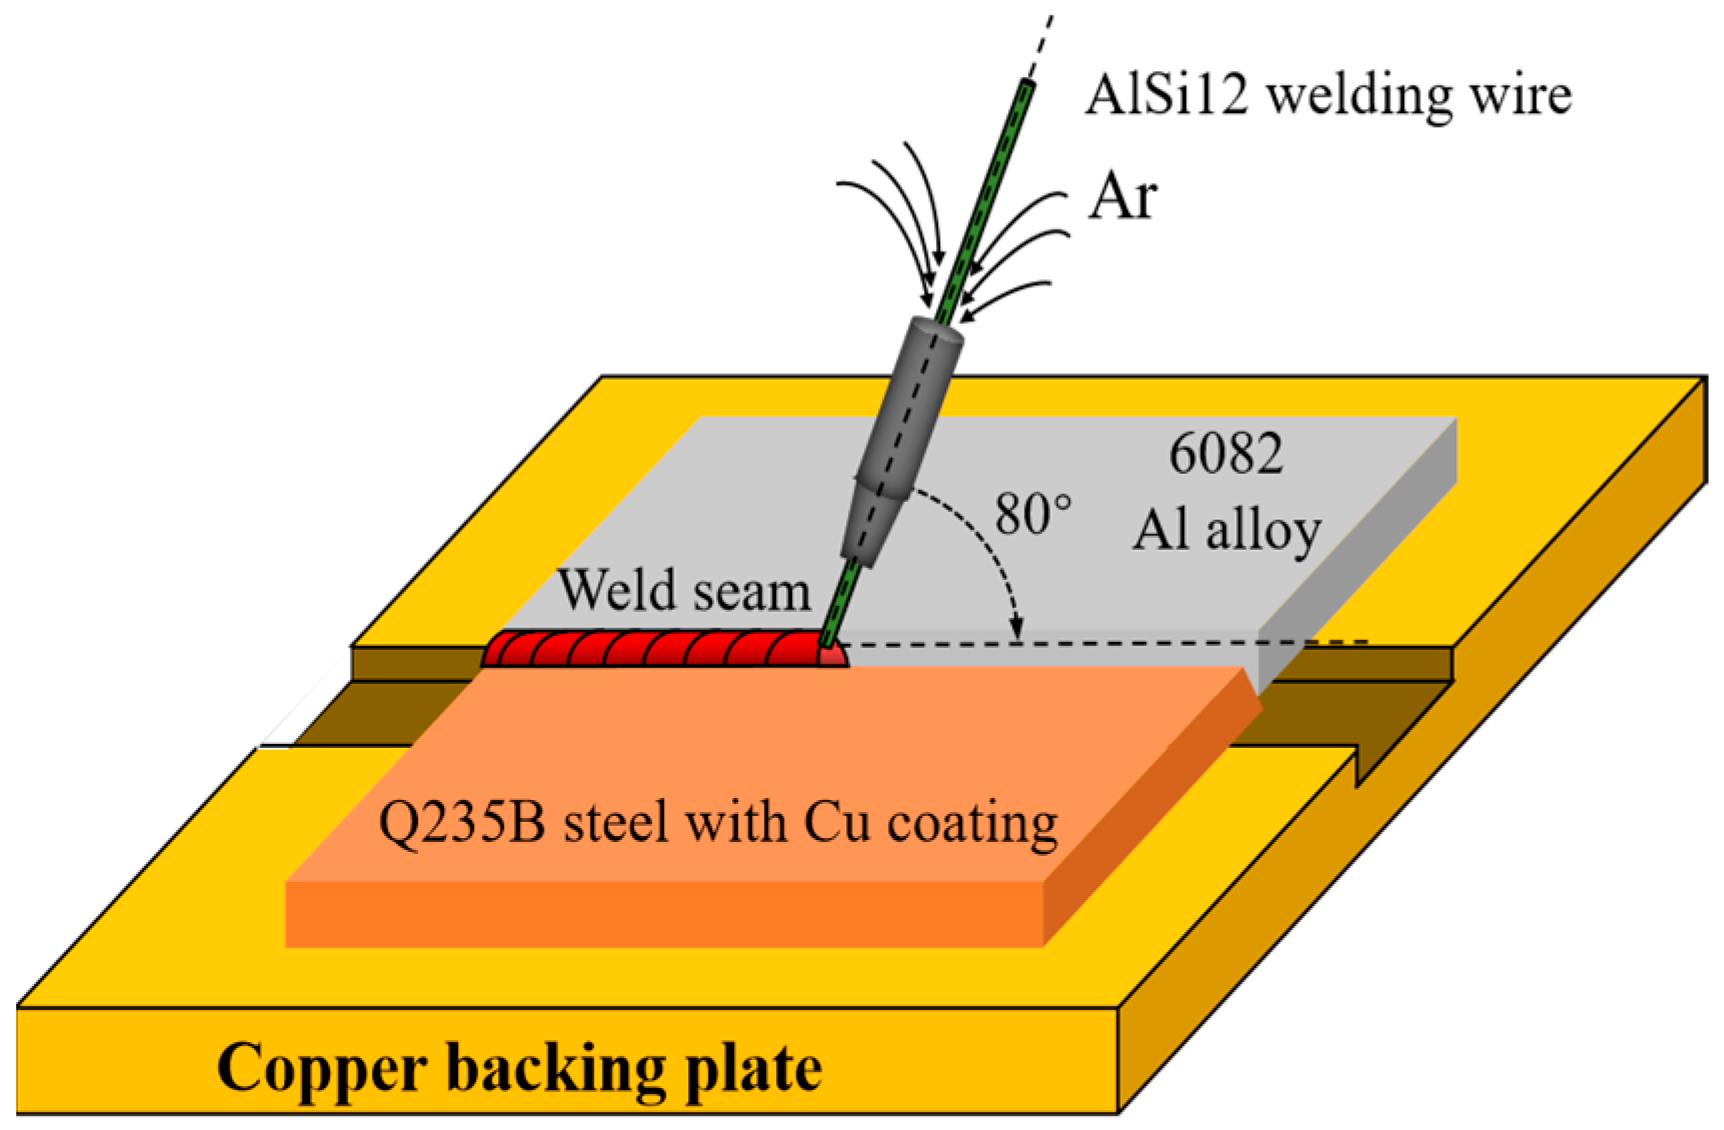
2.2. CMT Welding–Brazing Process

The butt welding experiments of 6082 Al alloy/Cu coating/Q235B steel were carried out with the CMT5000i welder (Fronius company, Wels, Austria) with AlSi12 welding wire. We cleaned the surfaces of the base metals with acetone and removed the oil stain before welding. The steel with Cu coating was prepared with a single V-shaped groove of 45°, while the aluminum alloy was not prepared with a groove. The root gap was 0.5 mm for assembly. The distance from the end of the AlSi12 welding wire to the surface of the base metal was 2 mm. The inclination angle of the CMT torch was set to 10°. Argon gas with 99.99% purity was chosen as the shielding gas. The schematic diagram of the CMT welding–brazing process is shown in Figure 1. The welding–brazing parameters are listed in Table 2.

2.3. Characterization Methods

After welding, the test samples for microstructure, mechanical property and corrosion resistance analysis were obtained from the welding–brazing joint by wire cutting along the direction perpendicular to the weld seam. The samples were ground and polished, and then etched with Keller reagent for 10 s. The macro-morphology of Al alloy/steel welding–brazing joints was observed by a ZEISS optical microscope (OM, Oberkochen, Germany). Microstructure and element distribution of joints were analyzed by a JSM−6480 scanning electron microscope (SEM, JEOL, Tokyo, Japan) equipped with energy-dispersive X-ray spectroscopy (EDS). The phase composition of joints with the size of 10 mm × 10 mm × 3 mm was analyzed by an XRD−6000 X-ray diffractometer instrument (XRD, Shimadzu, Kyoto, Japan). X-ray diffraction (XRD) analysis was carried out with Cu-Kα radiation and scanning angles (2θ) between 10° and 90°.
The tensile tests were conducted on a tensile testing machine (Jinan Jingji Test Instrument Co.,Ltd, Jinan, China) with a constant displacement rate of 1 mm/min according to the GB/T2651−2008 standard. The fracture morphology of tensile specimens was observed by SEM.

2.4. Electrochemical Measurements

The electrochemical experiments were carried out on the EGM283 Electrochemical Workstation with a three-electrode cell system. The welding–brazing joint acted as a working electrode, a platinum plate as an auxiliary electrode and a saturated calomel electrode (SCE) as a reference electrode. The dimension of electrochemical testing specimens was 10 mm × 10 mm × 2 mm, and the exposed measurement area was 20 cm2. The corrosion solution was a 3.5% NaCl solution. The potentiodynamic polarization curve was recorded from −1 to 1.5 V, and the scanning rate was 2 mV/s.

3. Results and Discussion

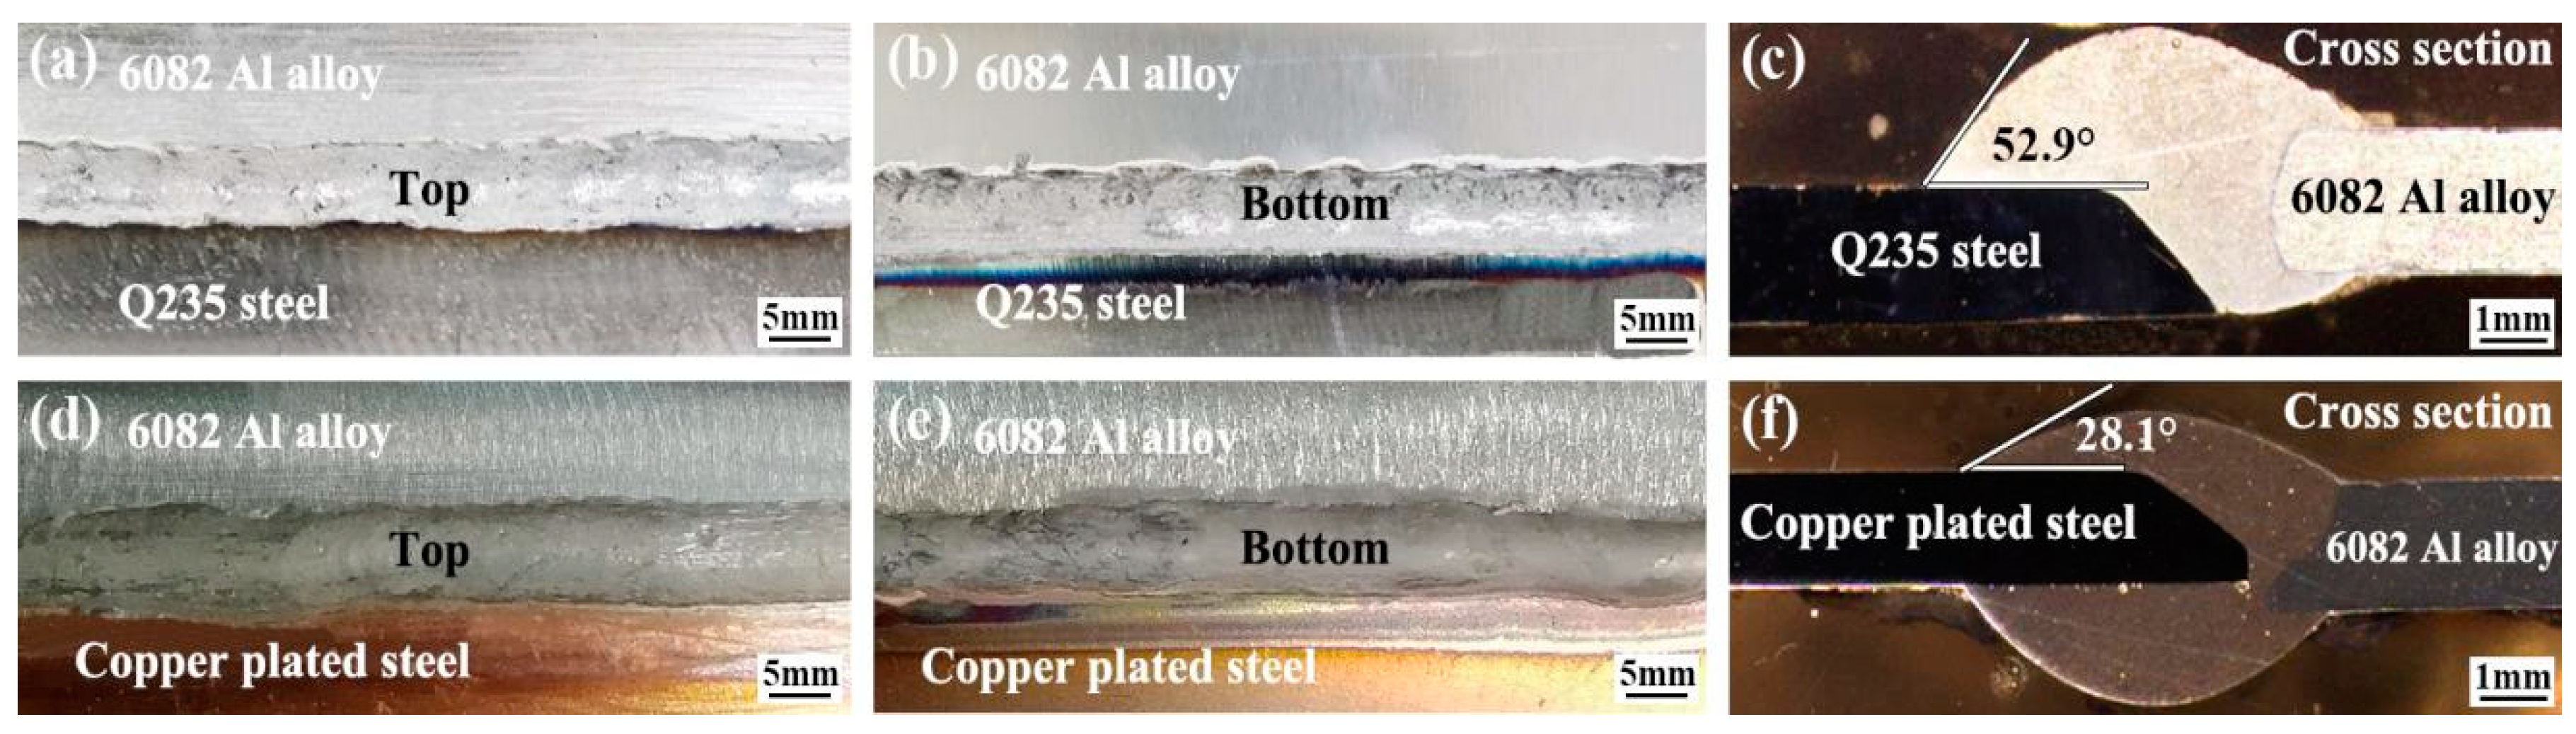
3.1. Effect of Cu Coating on Macro-Morphology of Al Alloy/Steel CMT Welding–Brazing Joints

Figure 2 shows the macro-morphology of Al alloy/steel CMT welding–brazing joints with different Cu coating thicknesses. Under the action of the CMT heat source, the filler metal AlSi12 and part of the Al alloy base metal melted, while the steel did not melt. The molten Al alloy was wetted and spread on the surface of steel to form the Al alloy/steel welding–brazing joints. For the joints without Cu coating (as shown in Figure 2a–c), the Al alloy/steel CMT welding–brazing joint was formed completely, and the wetting angle of the molten wire on the surface of steel was 52.9°. When the Cu coating thickness was 10μm, its wetting angle was 28.1°(as shown in Figure 2d–f), and the Al alloy/steel CMT welding–brazing joint had a better shape, based on its better wettablity and spreadability. This was mainly attributed to the fact that adding the Cu element into the molten AlSi12 welding wire could reduce its melting point and improve its wettablity and spreadability, which improved the forming shape of the weld bottom. Chen et al. [14] found that the fluidity of Al-Si-Cu welding wire was better than that of Al-Si welding wire through their spreadability test and clearance fillability test. In the welding process, the former can wet the base metal fully, so as to fill up the weld seam in a shorter time and make it more uniform.

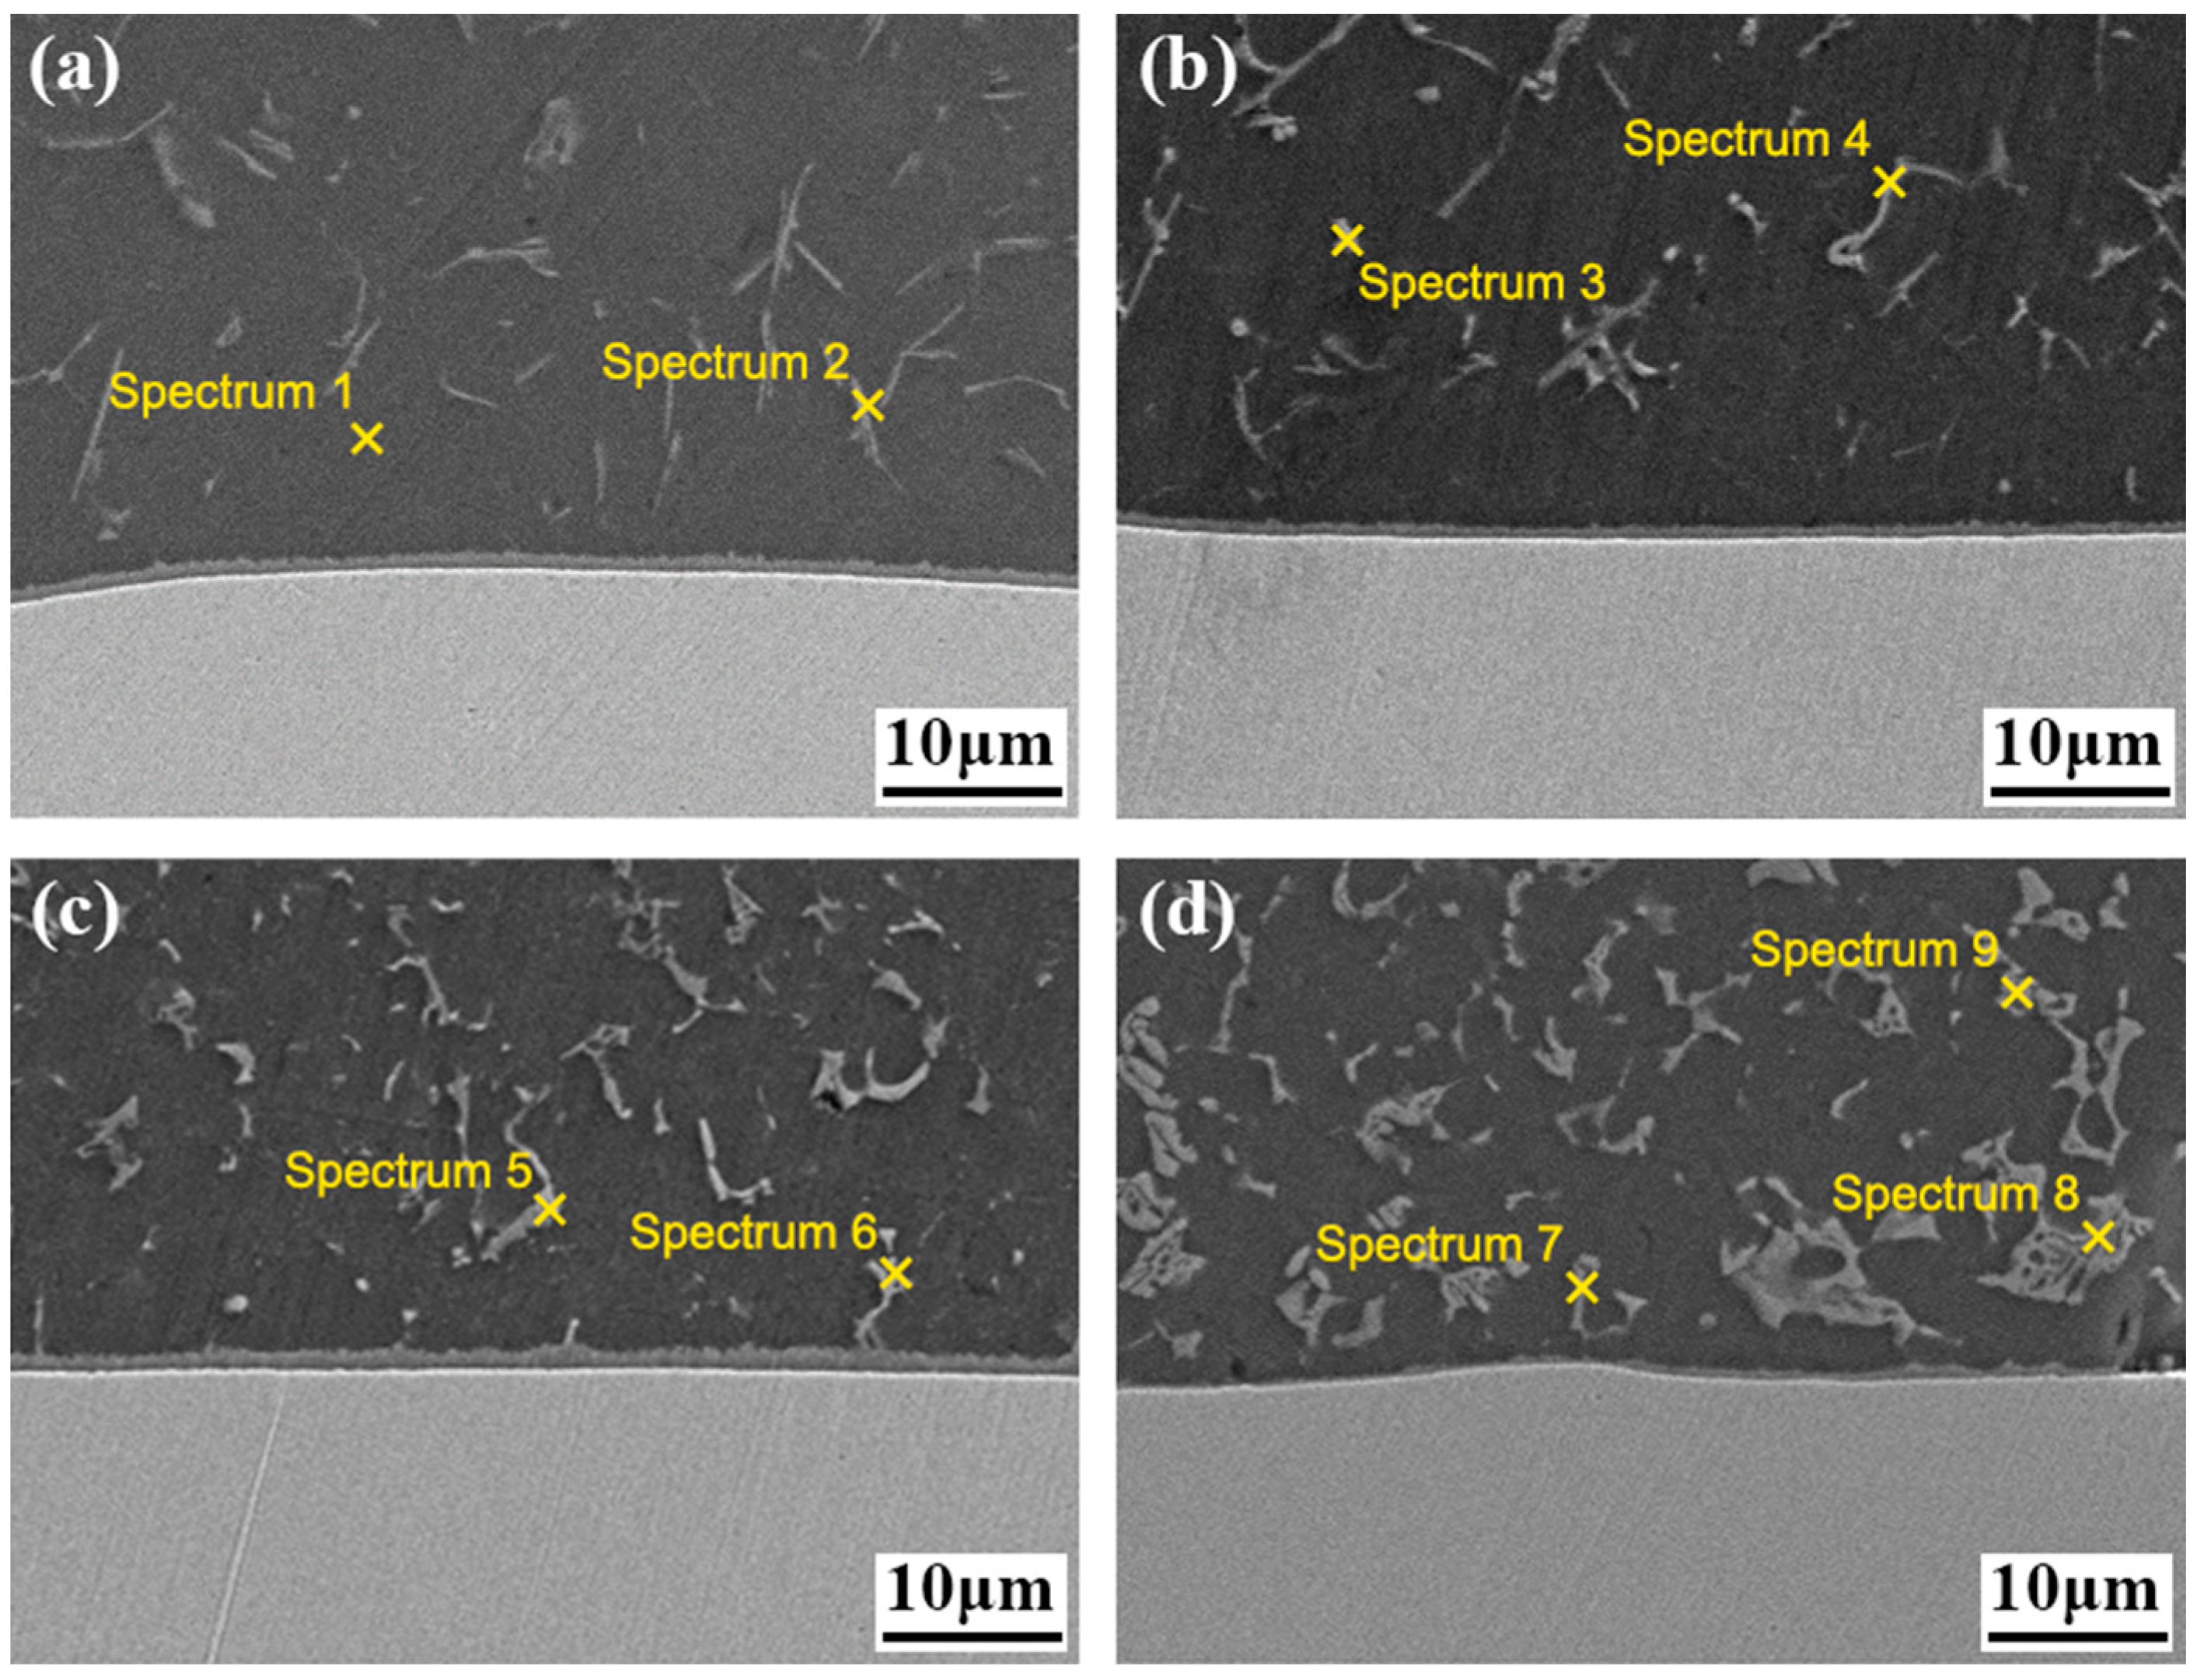
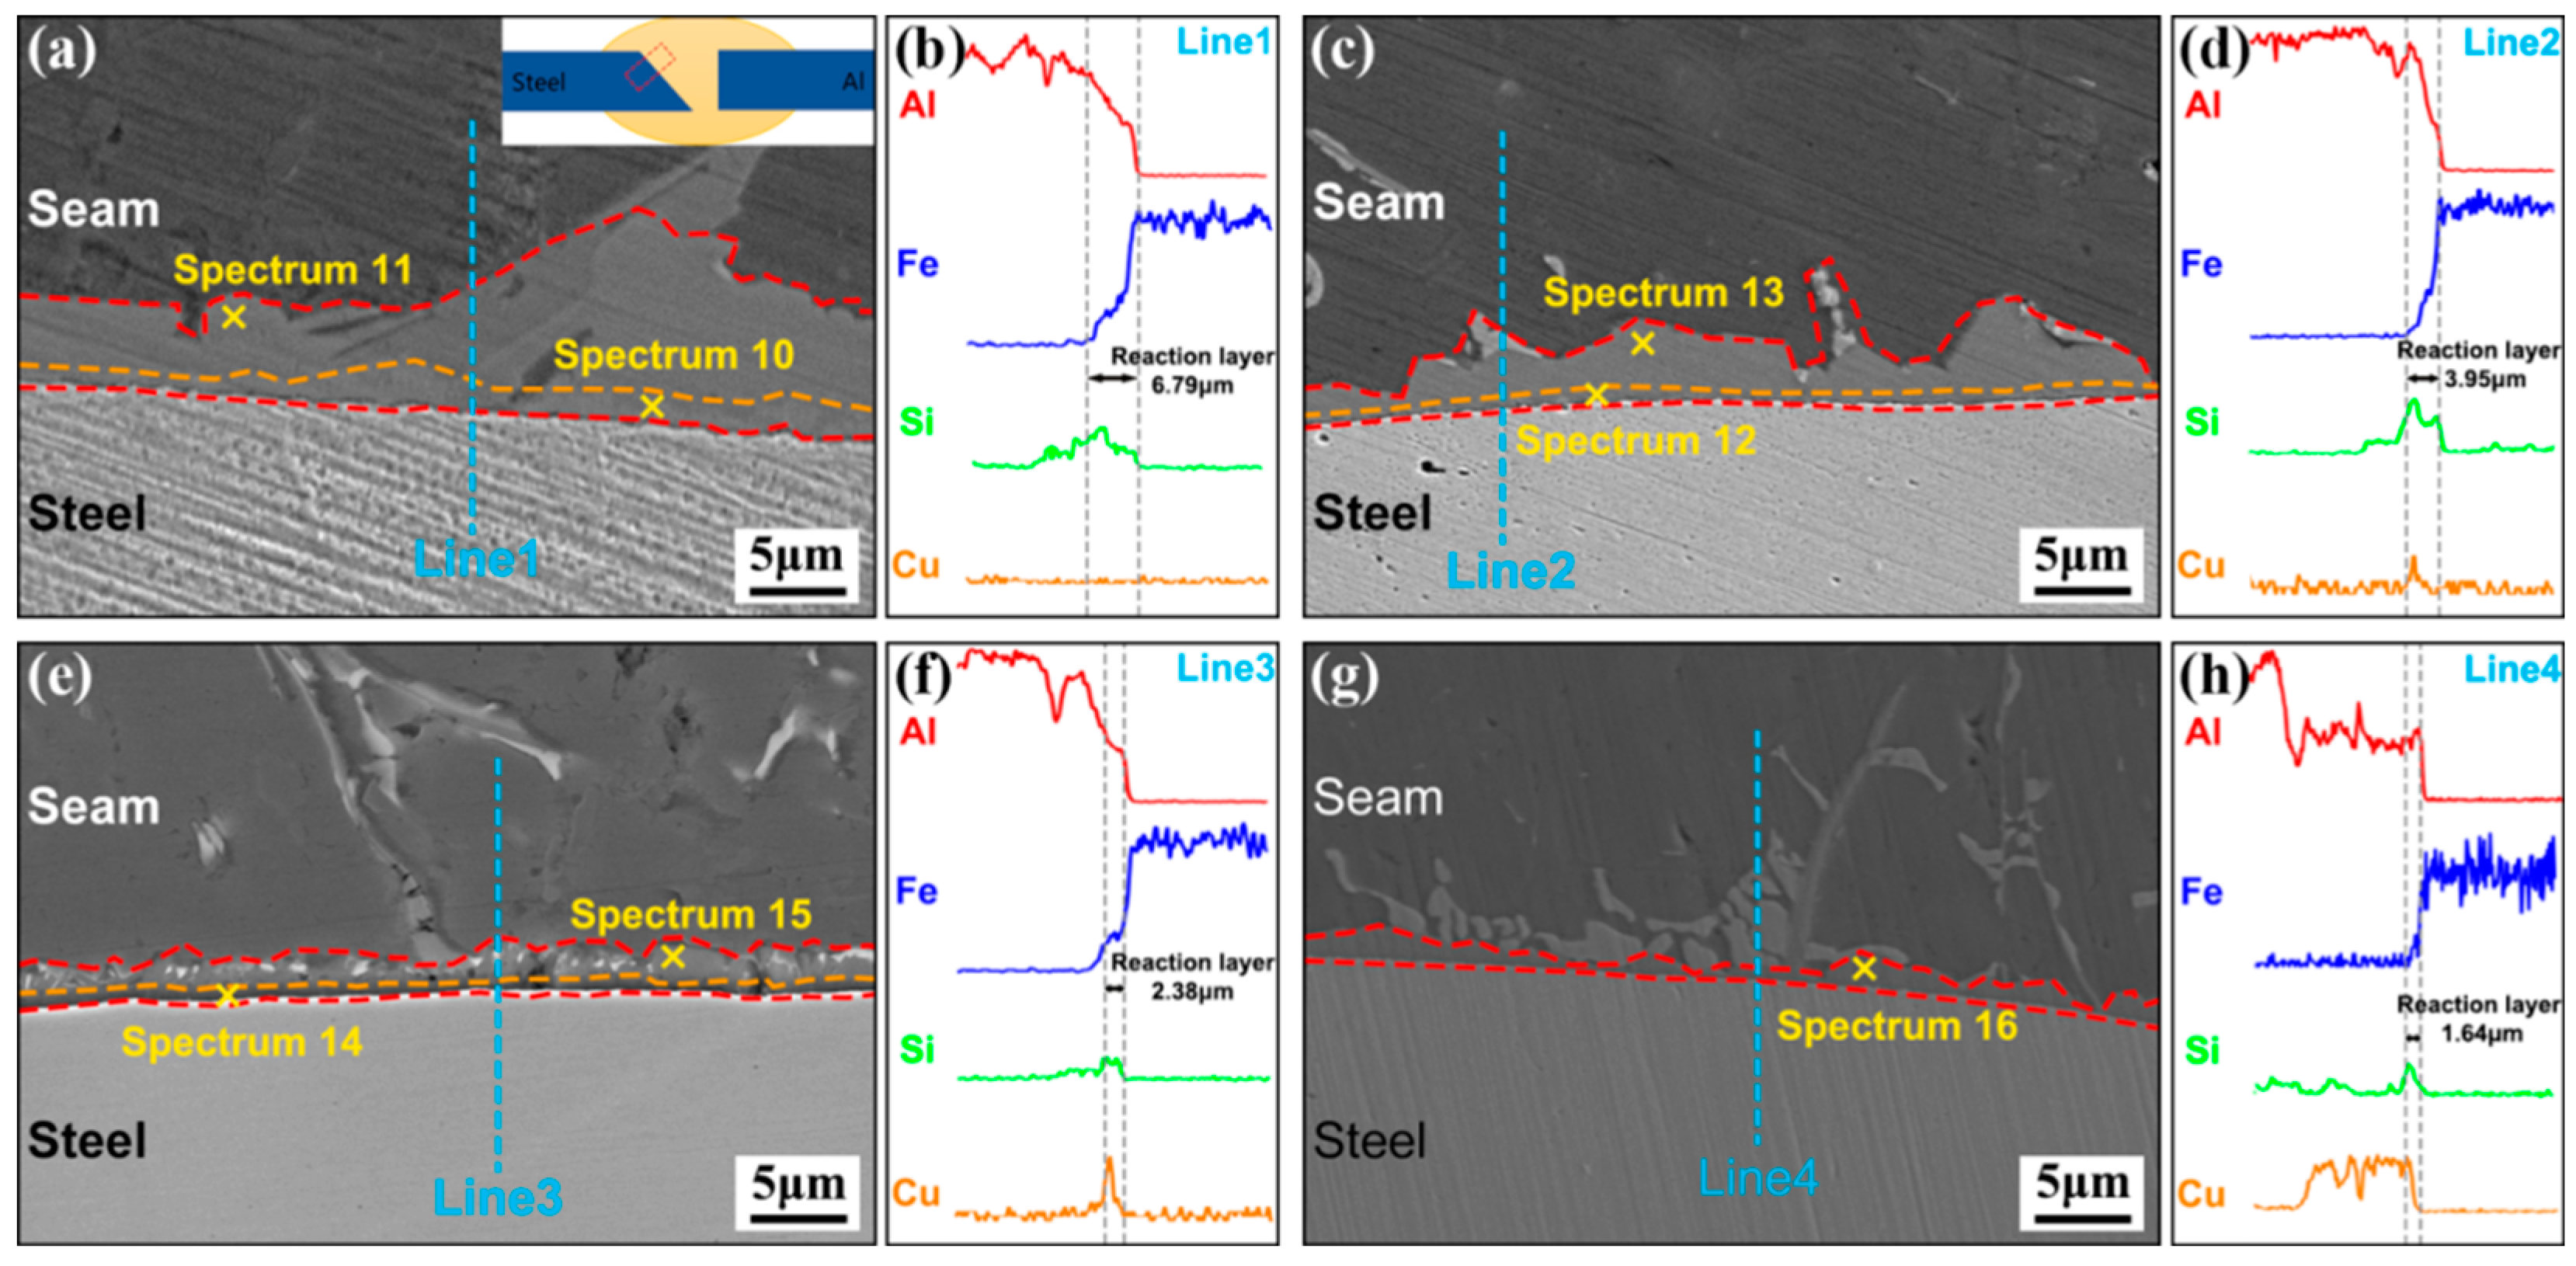
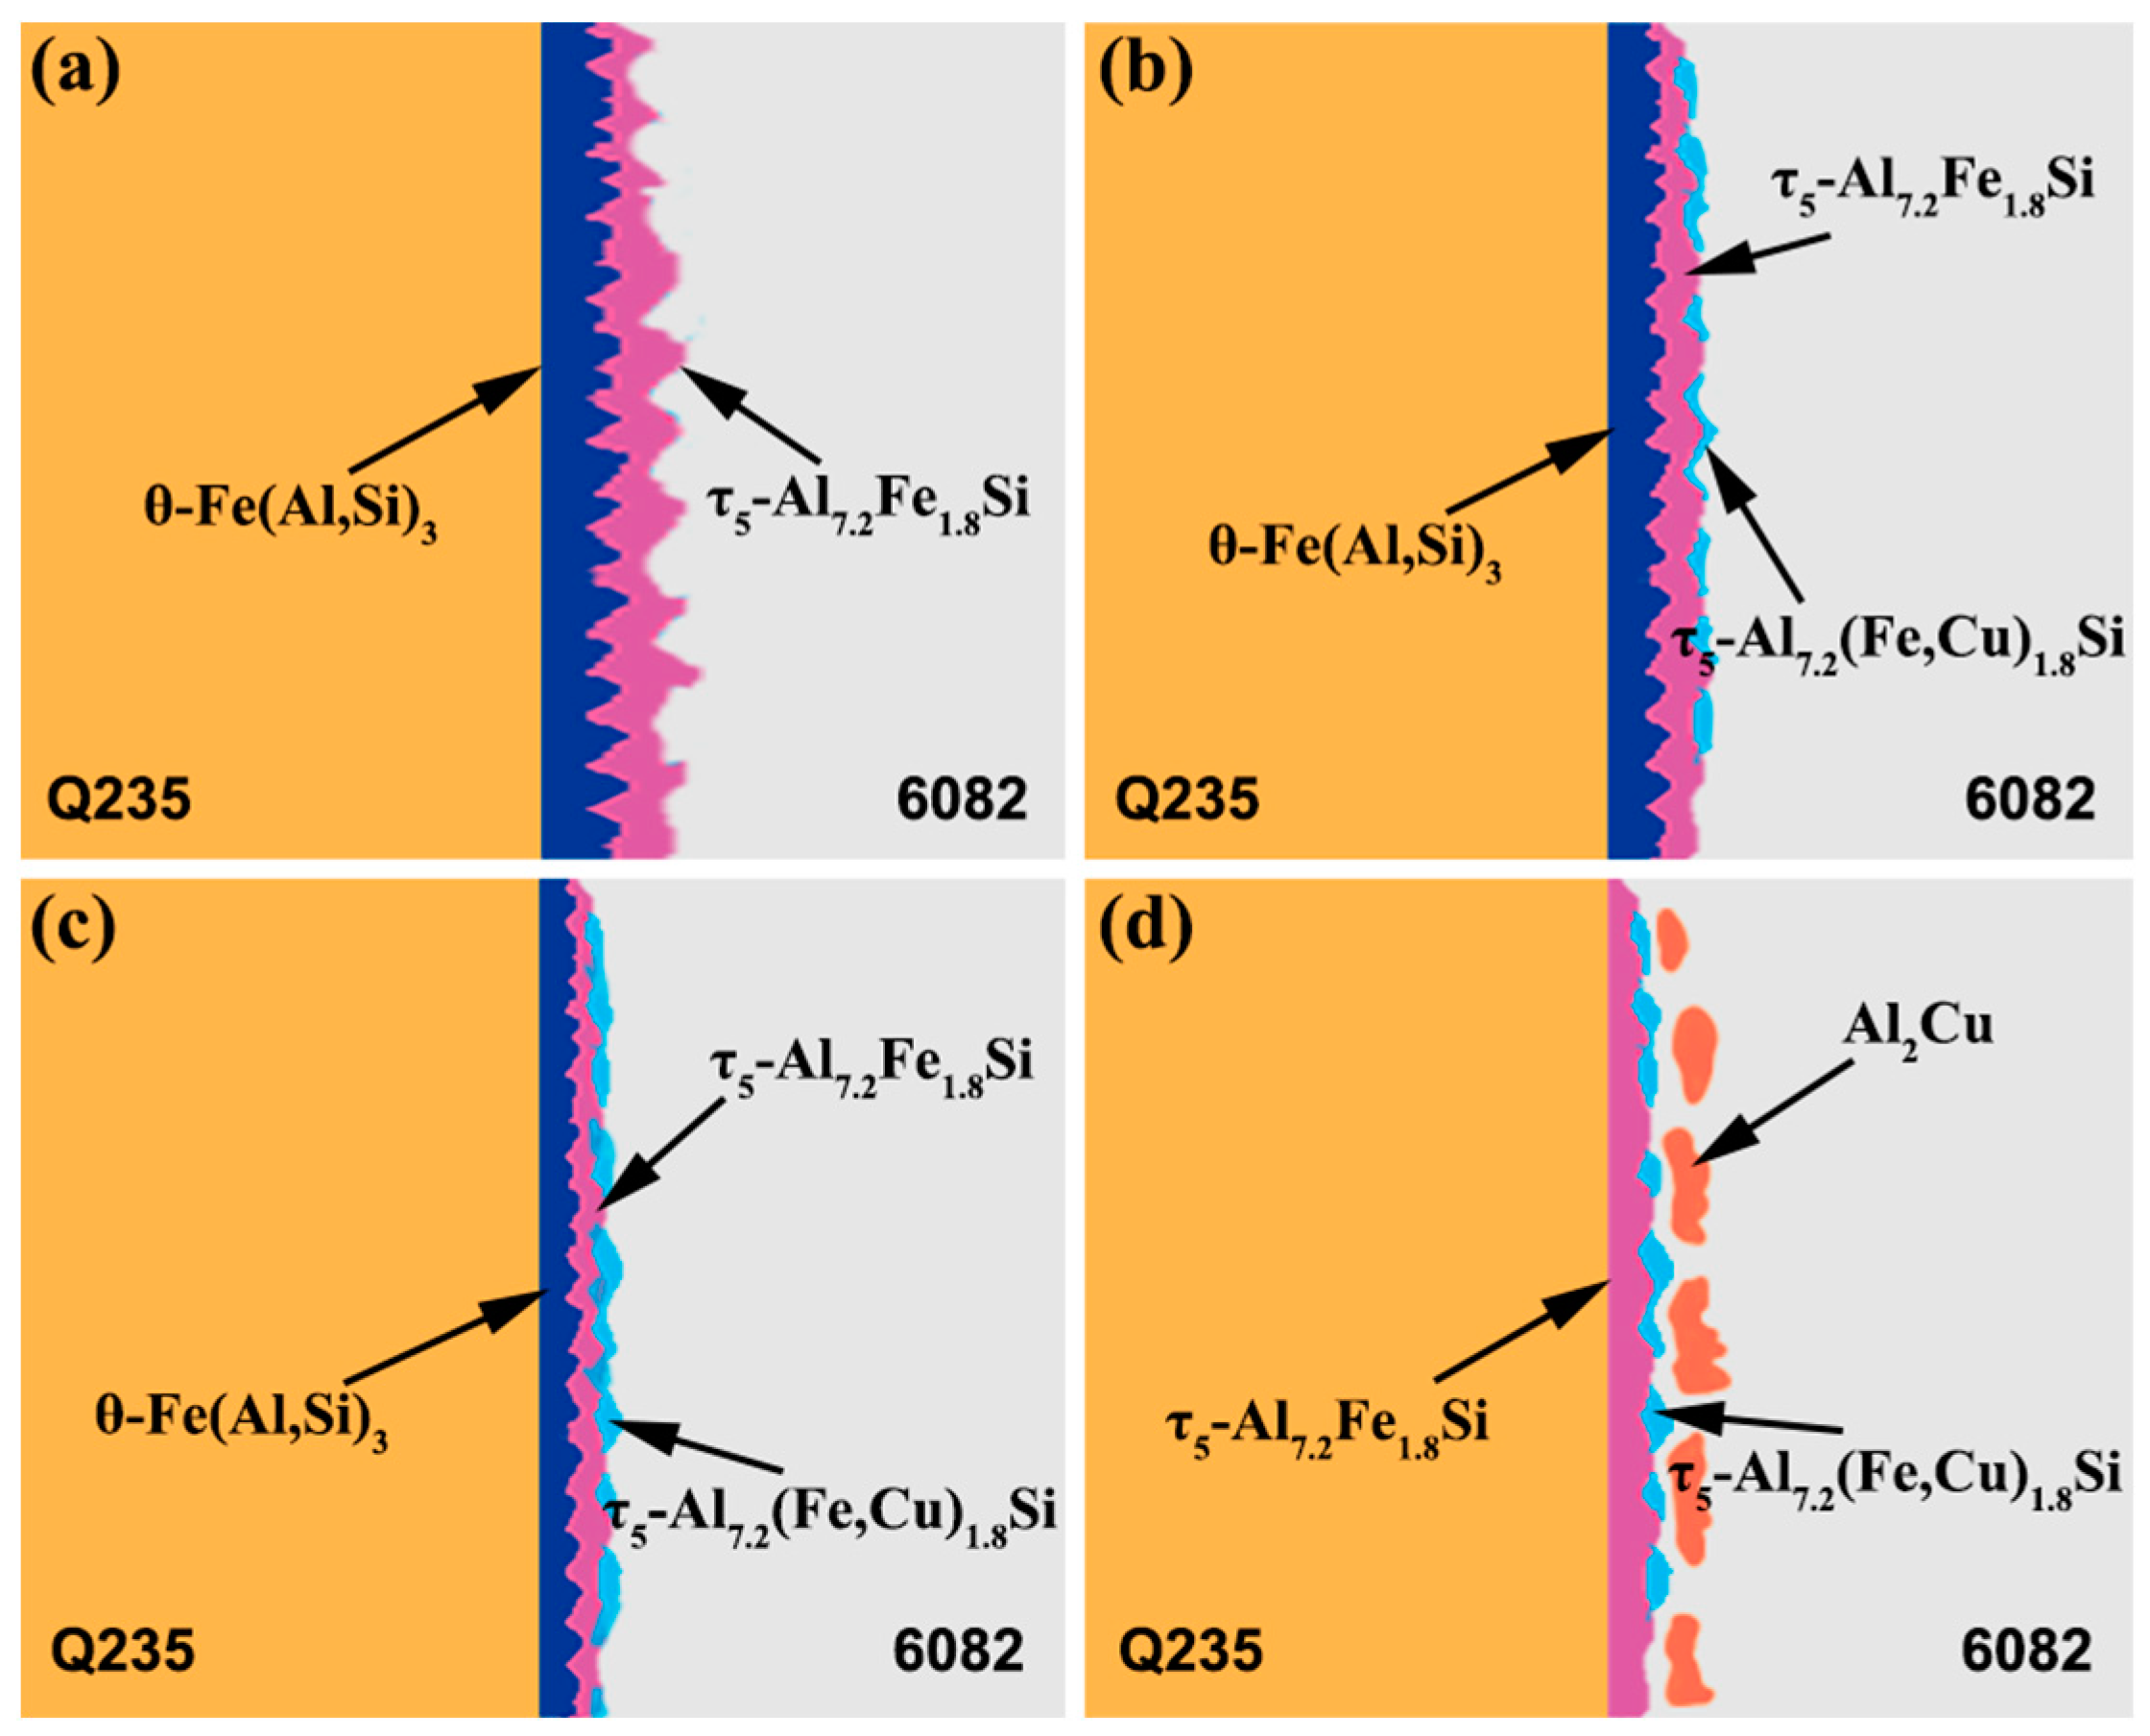
3.2. Influence of Cu Coating on Microstructure and Interface Reaction Layer Composition of Al Alloy/Steel CMT Welding–Brazing Joints

The mechanical properties of Al alloy/steel welding–brazing joints depends greatly on the microstructure composition, especially on the phase composition variation of IMCs at the interface. Therefore, it is indispensable to clarify the interfacial microstructure evolution of joints under different thicknesses of Cu coatings. Figure 3 shows the microstructure at the steel side of Al alloy/steel welding–brazing joints with different Cu coating thicknesses. Figure 4 presents an enlarged view of the interface reaction layer and corresponding EDS line scanning results. Yellow crosses are used to mark the different phases in Figure 3 and Figure 4 (Spectra 1 to 16). The EDS point scanning results are listed in Table 3. The line scanning paths in Figure 4 are indicated by the blue dotted lines (Lines 1 to 4). The EDS line scanning results are shown in Figure 4.
Figure 3a shows the microstructure morphology of the weld seam without Cu coating. According to the EDS point scanning results listed in Table 2, combined with the Al-Si binary phase diagram and Al-Si-Fe ternary phase diagram, the microstructure of the weld seam was composed of a dark gray matrix α-Al solid solution (Spectrum 1) and a white needle τ5-Al7.2Fe1.8Si phase (Spectrum 2).
When the Cu coating thickness was 5 μm (as shown in Figure 3b), it can be inferred that the dark gray matrix was still α-Al solid solution, while the white short rod phase was the τ5-Al7.2(Fe,Cu)1.8Si phase. Therefore, the weld seam was mainly composed of α-Al solid solution (Spectrum 3), τ5-Al7.2(Fe,Cu) 1.8Si phase (Spectrum 4) and τ5-Al7.2Fe1.8Si phase.
The microstructure composition of the weld seam had no change with the thickness of the Cu coating increasing to 10 μm (as shown in Figure 3c).
When the thickness of the Cu coating was 20 μm, a white dendritic phase (Spectrum 8) formed, and the weld seam consisted of a dark gray matrix α-Al solid solution, a white short rod τ5-Al7.2 (Fe,Cu) 1.8Si phase and the white dendritic Al2Cu, which tend to be weak areas in joints during tension [15,16].
Figure 4a shows the interface reaction layer of the Al alloy/steel welding–brazing joint without a Cu coating; according to the EDS point scanning results, the interface reaction layer was composed of θ-Fe (Al,Si)3 (Spectrum 10) near the side of the steel and τ5-Al7.2Fe1.8Si (Spectrum 11) near the side of the weld seam, with a total thickness of 6.7 μm. Song’s research also confirmed that the interface reaction zone of the Al/steel joint showed delamination [17]. It was found from Lin’s research that the θ-Fe(Al,Si)3 phase compared to the τ5-Al7.2Fe1.8Si phase was more brittle and easily became a weakness [18]. Figure 4b shows the EDS line scanning result of the corresponding interface reaction layer. The content of Si element in the interface reaction layer increased obviously. The diffusion of Si element to the Al/Fe interface effectively inhibited the generation of the Al-Fe brittle phase and promoted the formation of the Al-Fe-Si compound.
Figure 4c shows the interface reaction layer of the joint with a 5 μm Cu coating. Compared with the joint without a Cu coating, the microstructure composition of the interface reaction zone had no obvious change, and its thickness was reduced to 3.95 μm. Additionally, the proportion of θ-Fe(Al,Si)3 phase (Spectrum 12) in the interface layer was obviously reduced. Under the action of the CMT heat source, the Cu coating melts and reacts with Al,Si and Fe, and then Cu atoms are detected at the interface layer and weld seam to form the τ5-Al7.2(Fe,Cu)1.8Si phase (Spectrum 13). The EDS line scan results in Figure 4d verify that Cu participated in the chemical metallurgical reaction.
When the thickness of the Cu coating was 10 μm, the interfacial microstructure of the joint still had no variation, but the thickness of the interface layer decreased to 2.38 μm, as shown in Figure 4e–f. The growth of the interface layer, especially the θ-Fe (Al,Si)3 phase, was inhibited with the increasing Cu coating thickness. Several studies have shown that IMC layers with excessive thickness can easily lead to stress concentration and become a source of crack propagation. Reducing the thickness of the IMC layer can significantly improve the mechanical properties of the joints [19,20].
When the thickness of the Cu coating was increased to 20μm, the microstructure composition of the interface layer had a great change; moreover, the thickness of the interface layer was only 1.64 μm, as shown in Figure 4g–h. The interface layer consisted of a single phase, τ5-Al7.2(Fe,Cu)1.8Si (Spectrum 16). Meanwhile, the formation of Al2Cu appeared in the weld seam under high Cu content.
Figure 5 shows the XRD analysis results of Al alloy/steel welding–brazing joints under different thicknesses of Cu coating. For the joints without a Cu coating and with a 5–10 μm Cu coating, the compounds of α-Al solid solution, AlFe and τ5-Al7.2(Fe,Cu)1.8Si phase formed. However, when the thickness of the Cu coating was 20 μm, the joint consisted of α-Al solid solution, τ5-Al7.2(Fe,Cu)1.8Si and Al2Cu compound. This result was consistent with the above microstructure composition analysis.
In conclusion, a Cu coating on the surface of steel plays an important role in the composition of the interface reaction layer of Al alloy/steel welding–brazing joints. Figure 6 shows the microstructure composition schematic diagram of the interface reaction layer with different thicknesses of Cu coating.
For the Al alloy/steel CMT welding–brazing joint without a Cu coating, the interface reaction layer was mainly composed of the θ-Fe(Al,Si)3 phase near the side of the steel and the τ5-Al7.2Fe1.8Si phase near the side of the weld seam (as shown in Figure 6a). Once the surface of the steel was coated with the thickness of 5 μm Cu, Cu participated in the reaction among Al, Fe and Si to form a new τ5-Al7.2(Fe,Cu)1.8Si phase. The interface reaction layer consisted of the θ-Fe(Al,Si)3 phase, τ5-Al7.2Fe1.8Si phase and τ5-Al7.2(Fe,Cu)1.8Si phase (as shown in Figure 6b). For the Al alloy/steel CMT welding–brazing joint with a 10 μm Cu-coating, the amount of θ-Fe(Al,Si)3 phase decreased, while the proportion of τ5-Al7.2(Fe,Cu)1.8Si phase increased (as shown in Figure 6c). When the thickness of the Cu coating was 20 μm, the θ-Fe(Al,Si)3 phase disappeared and the new Al2Cu phase appeared. The interface reaction layer consisted of the τ5-Al7.2Fe1.8Si phase, τ5-Al7.2(Fe,Cu)1.8Si phase and Al2Cu phase (as shown in Figure 6d). Moreover, the thickness of IMCs decreased gradually with the increasing Cu coating thickness.

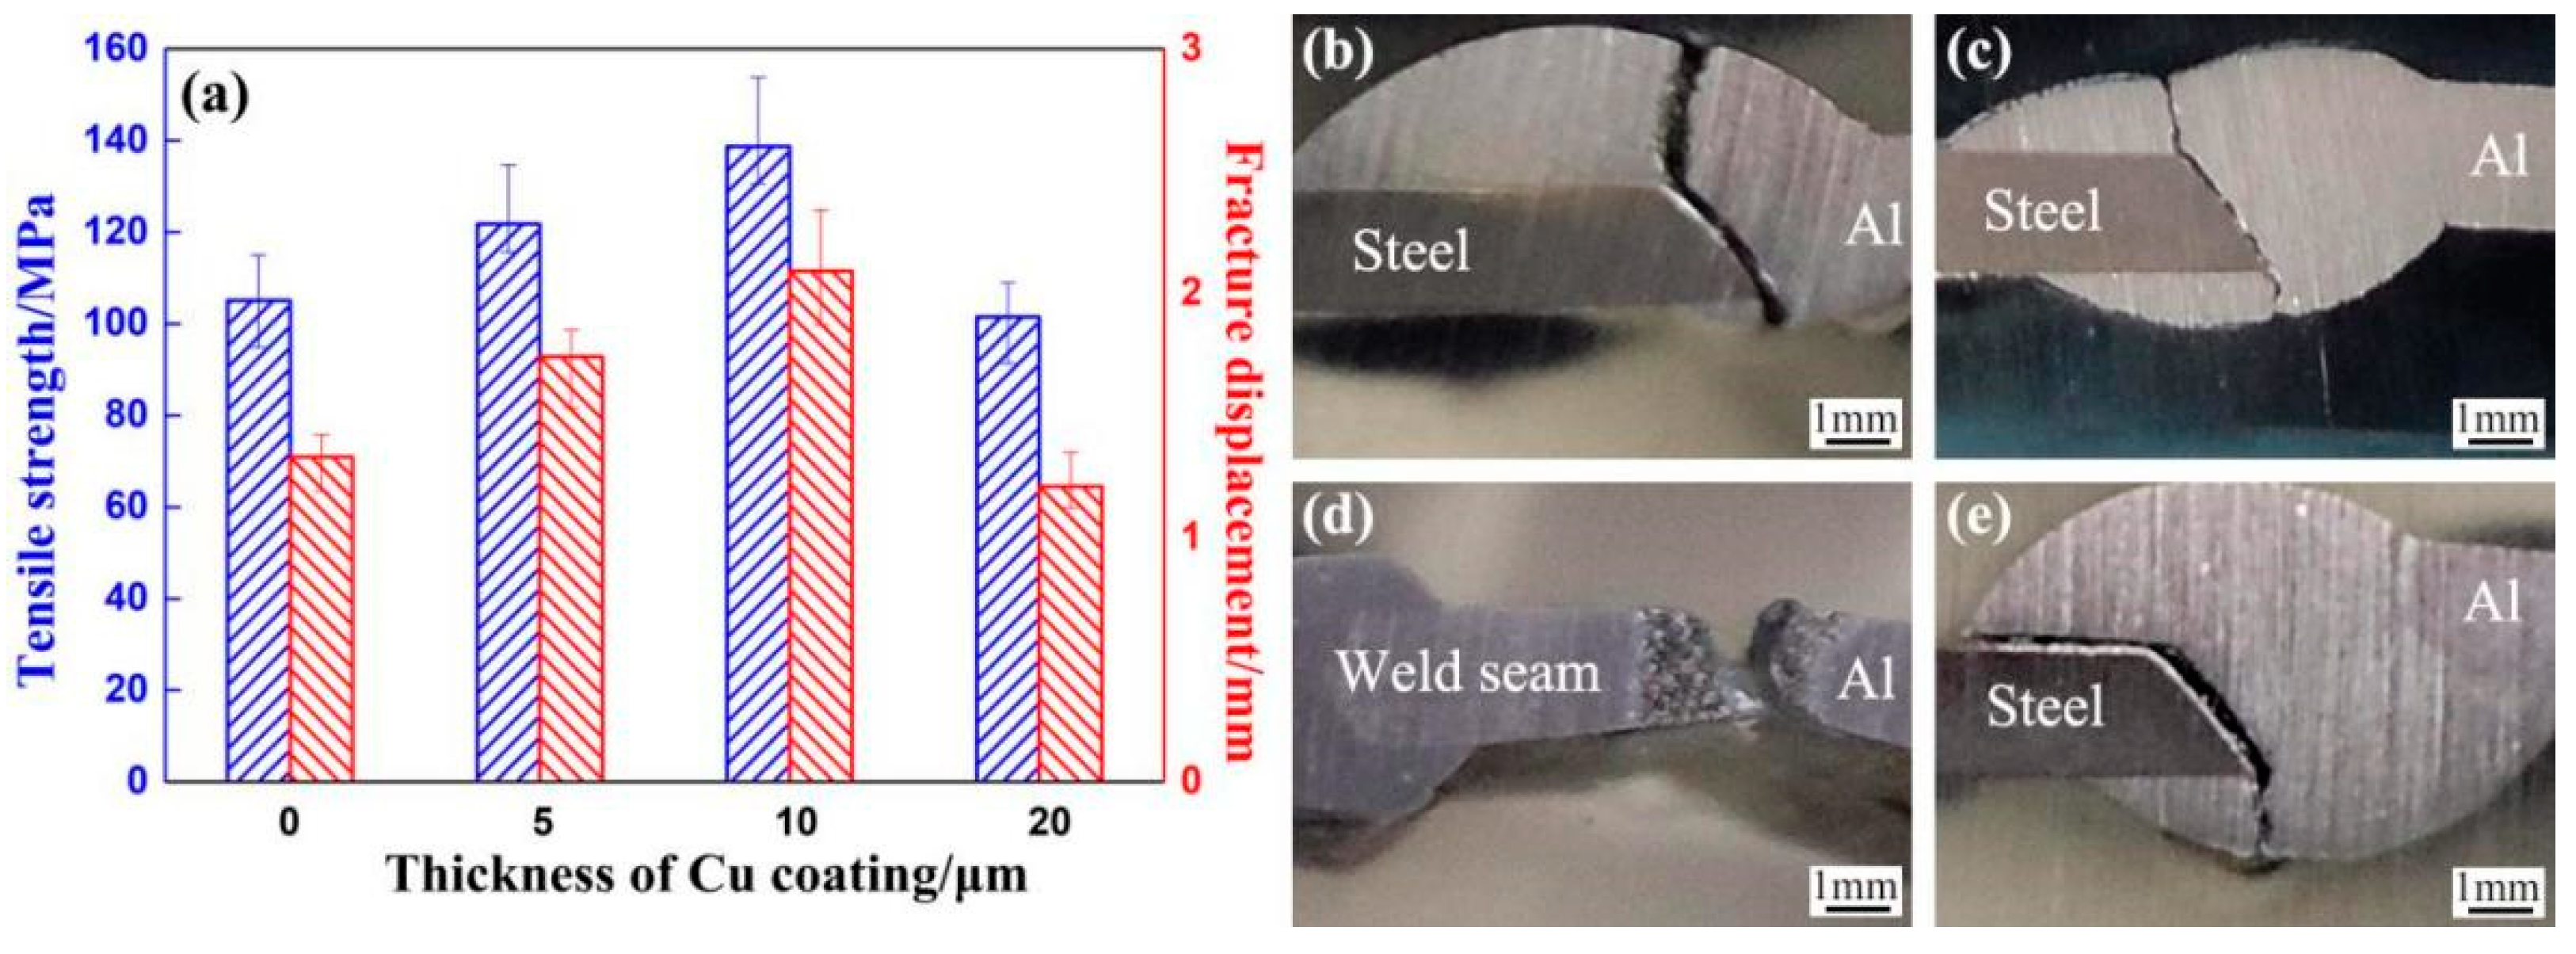
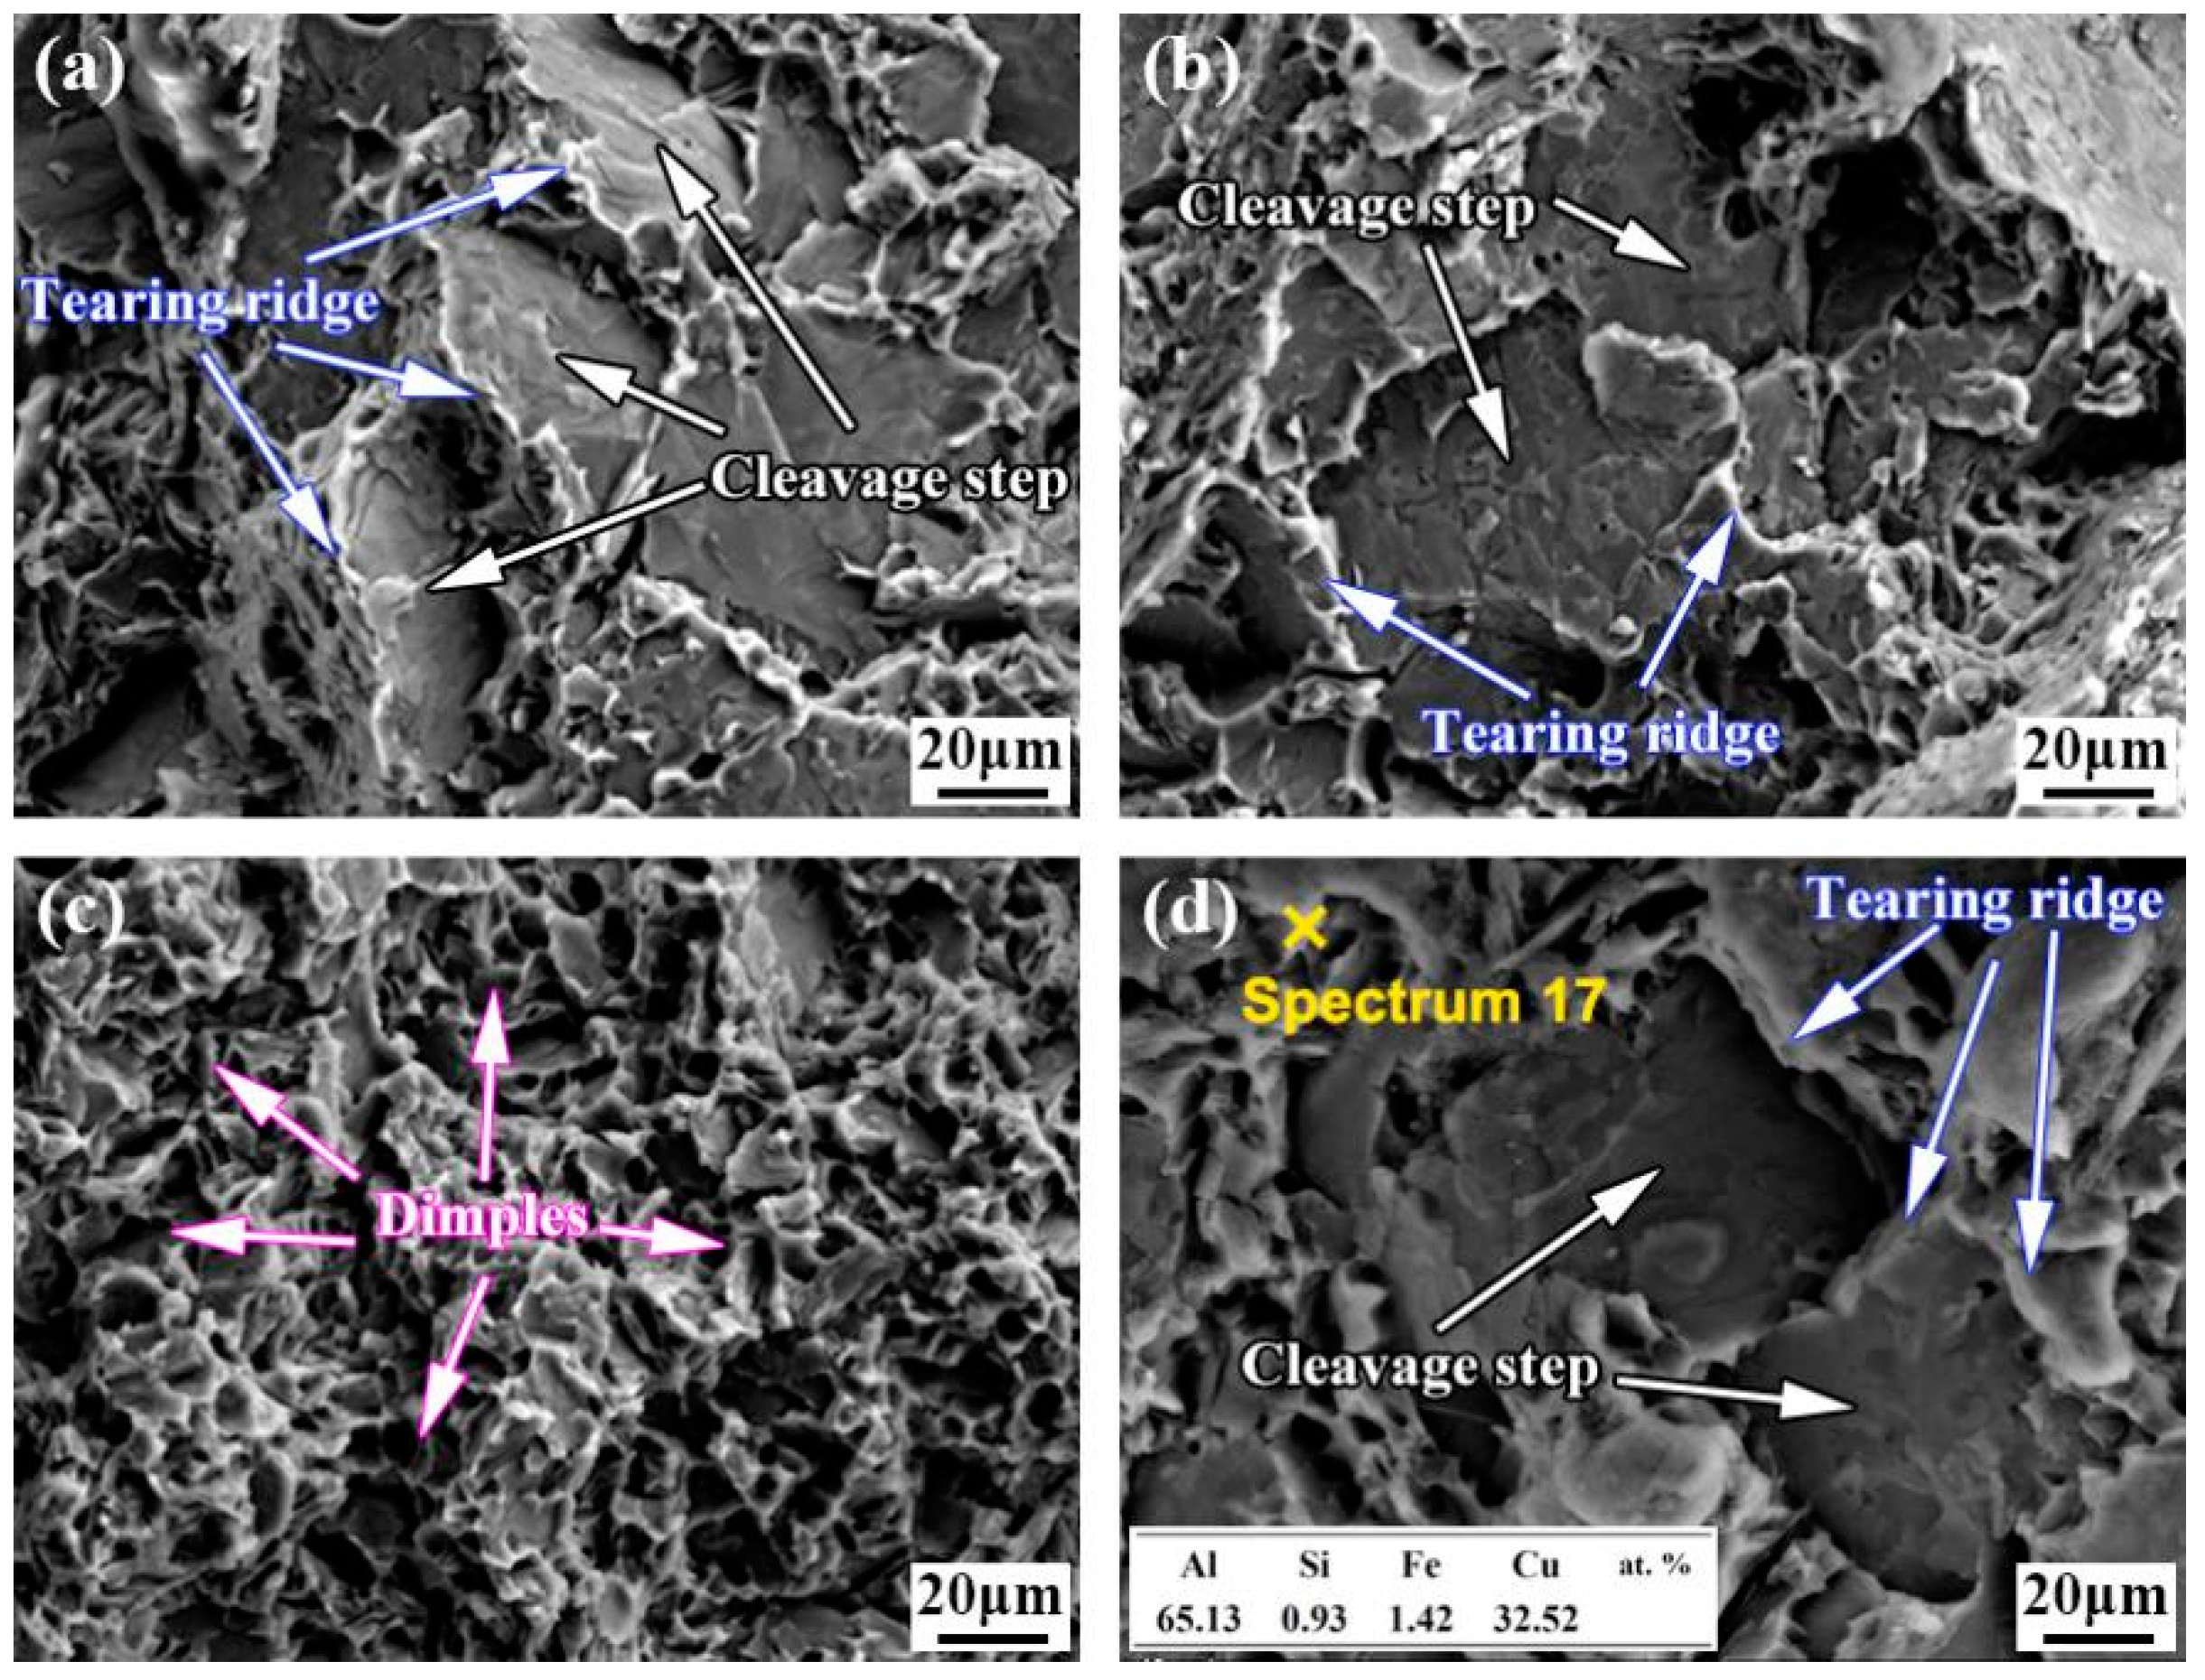
3.3. Effect of Cu Coating on Tensile Properties of Al Alloy/Steel CMT Welding–Brazing Joints

In order to analyze the influence of Cu on the tensile properties of joints and optimize the thickness of the Cu coating, tensile property tests of the joints with different thicknesses of Cu coating were conducted, and the results are shown in Figure 7. From Figure 7a, the change trend of tensile strength was consistent with that of fracture displacement. They both increased firstly and then decreased with the increase in the thickness of the Cu coating. When the thickness of the Cu coating was 10 μm, the tensile strength and fracture displacement reached the maximum of 138.7 MPa and 2.09 mm, respectively, which are 31.9% higher than those of the joint without Cu coating. However, when the thickness of the Cu coating was increased to 20 μm, the tensile strength and fracture displacement of the joint decreased to 101.5 MPa and 1.21 mm, respectively, which are lower than those of the joint without Cu coating.
Figure 7b-e show the fracture locations of joints with different thicknesses of Cu coating. On the one hand, the fracture locations of the joints lay in the interface layer between Al alloy and steel (Figure 7b–e). For the joints without Cu coating (as shown in Figure 7b), thick Fe-Si-Al IMCs formed at the interface of the joint, which resulted in low tensile strength. When the Cu coating thickness was 5 μm (as shown in Figure 7c), the thickness of the IMC layer was reduced, but the brittle θ-Fe(Al,Si)3 phase accounted for a large proportion in the Fe-Si-Al IMCs; thus, the interface layer was still the weakest area of the joint. When the Cu coating thickness was 20 μm (as shown in Figure 7e), the thickness of the IMC layer of the joint was the smallest, but the brittle Al2Cu compound formed in the IMC layer of the joint, which reduced the tensile strength of the joint. On the other hand, the fracture locations of the joints lay near the Al alloy fusion line (Figure 7d). When the Cu coating thickness was 10 μm (as shown in Figure 7d), the thickness of the IMC layer of the joint was small, and the IMC layer was mainly composed of the τ5-Al7.2Fe1.8Si phase and τ5-Al7.2(Fe,Cu)1.8Si. This led to the tensile strength of the joint reaching the maximum of 138.7 MPa.
To clarify the fracture mechanisms of joints with different thicknesses of Cu coating, the fracture morphologies of joints were observed by SEM, and the results are shown in Figure 8. In Figure 8a, tearing ridges and cleavage steps can be observed in the joint without a Cu coating, which indicates that the fracture of the joint can be considered a brittle fracture. For the fracture morphology of the joint with a 5 μm Cu coating, shown in Figure 8b, the IMCs in the fracture of the joint were composed of the τ5-Al7.2(Fe,Cu)1.8Si phase and θ-Fe(Al,Si)3 phase, which indicated that the fracture firstly occurred along the interface between the steel and θ-Fe(Al,Si)3 phase and branched out into the θ-Fe(Al,Si)3 phase, and then propagated from the θ-Fe(Al,Si)3 phase into τ5-Al7.2(Fe,Cu)1.8Si, and finally into the weld seam. From Figure 8c, when the thickness of the Cu coating was 10 μm, the joint fractured near the fusion line of Al alloy, owing to the reduction in the θ-Fe(Al,Si)3 phase and the thickness of IMCs, and a large number of dimples were distributed at the surface of the fracture, which showed a typical morphology of ductile fracture. For the fracture of the joint with the 20 μm Cu coating, shown in Figure 8d, the EDS point results showed that the point mainly contained 65.13% Al and 35.52% Cu (Spectrum 17), and it can be inferred as Al2Cu. The IMCs were composed of τ5-Al7.2(Fe,Cu)1.8Si phases, τ5-Al7.2Fe1.8Si and new Al2Cu. The Al2Cu phase, which reduced the resistance of crack propagation due to its higher brittleness, was responsible for the deterioration in the tensile properties of the joint.

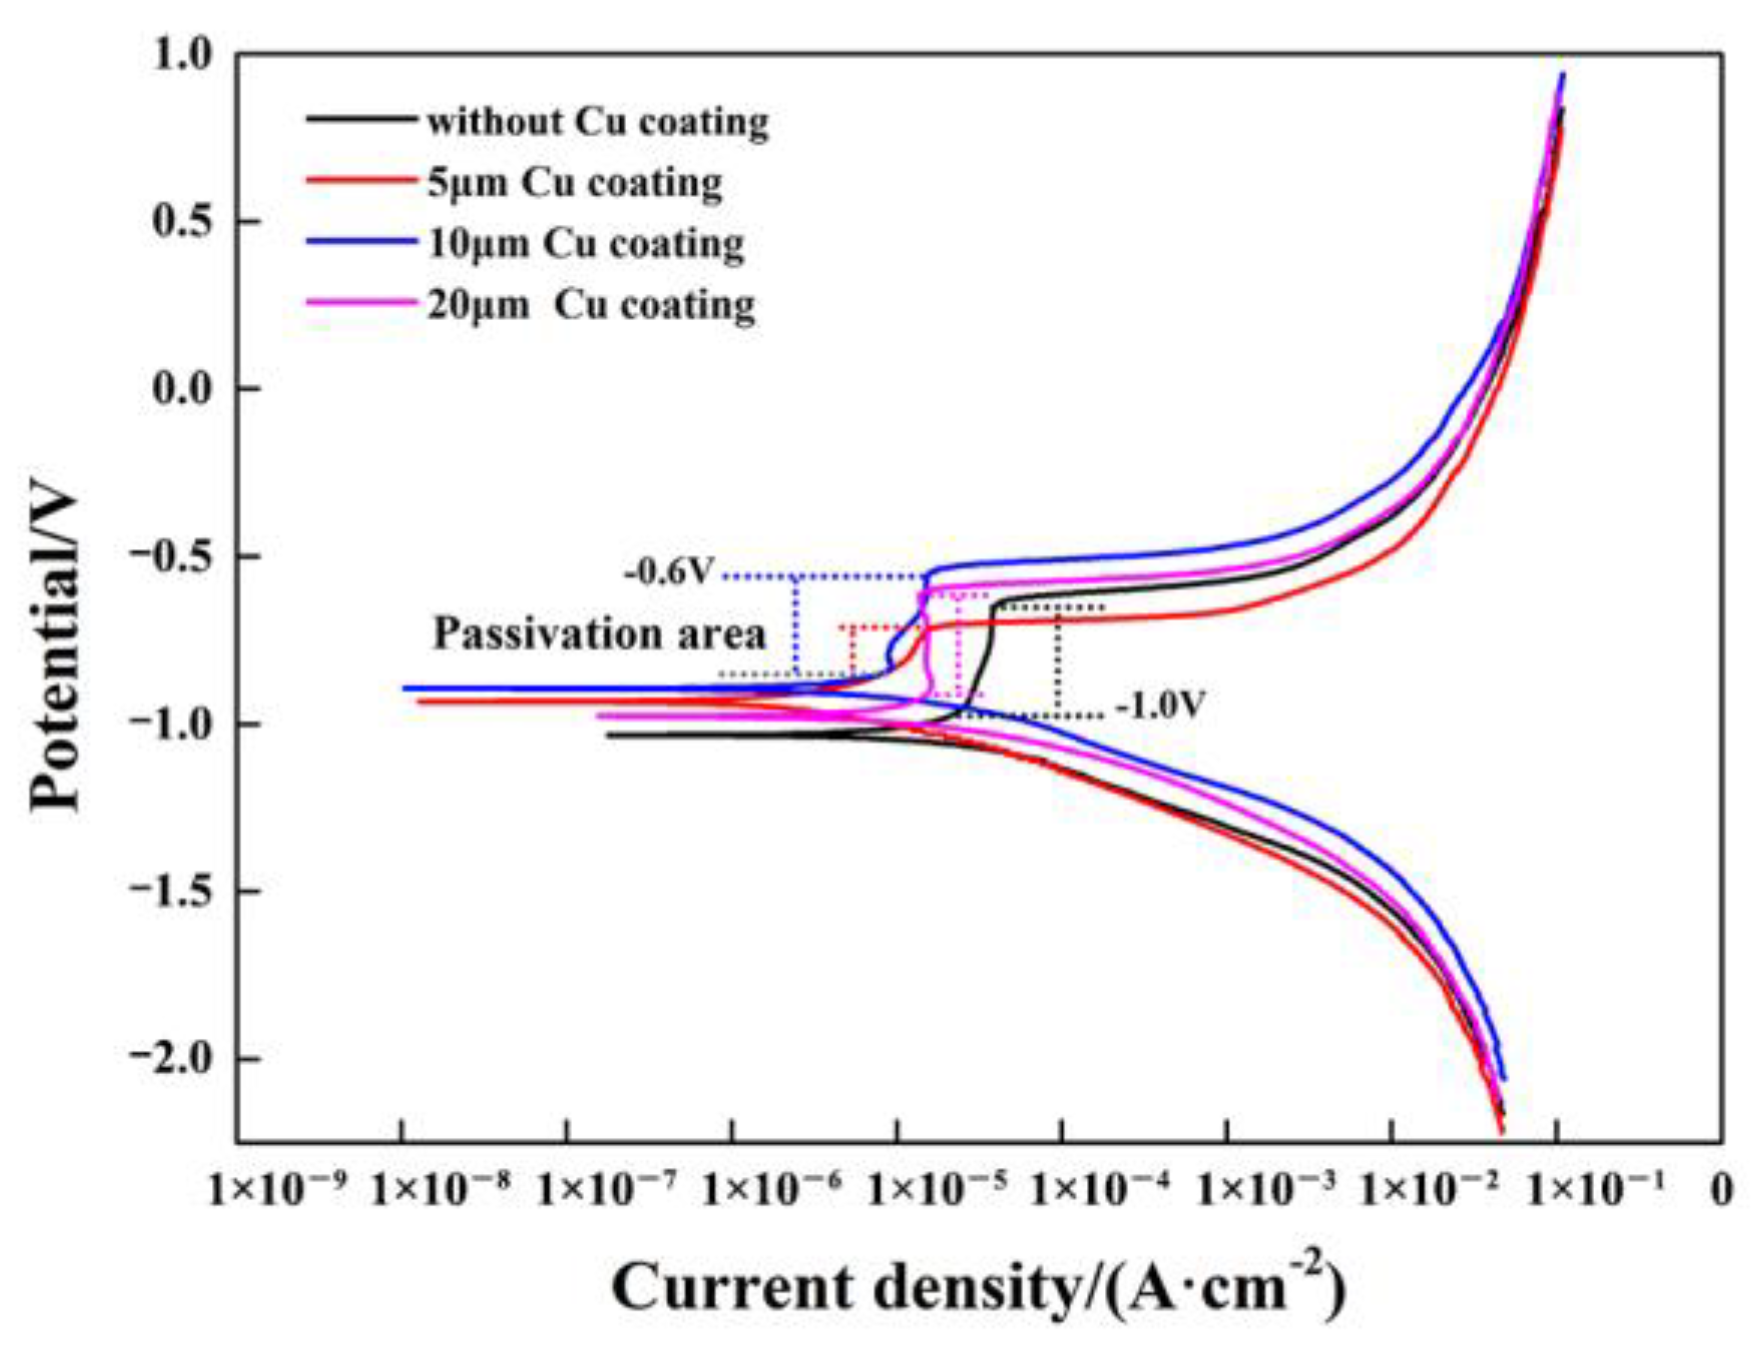
3.4. Effect of Cu Coating on Corrosion Resistance of Al Alloy/Steel CMT Welding–Brazing Joints

Figure 9 shows the potentiodynamic polarization curves of Al alloy/steel welding–brazing joints with different thicknesses of Cu coating. Self-corrosion potential and corrosion current density were obtained by using CView software to fit the polarization curve in Figure 9, and the results are listed in Table 4.
From Figure 9, the Al alloy/steel welding–brazing joint was passivated many times during the process of corrosion, and the passive potential of the joint was in the potential region from −0.6 to −1.0 V. At the initial stage of corrosion, the dissolution rate of the passive film is close to its regeneration rate, so the passive film is in the equilibrium state of dissolution and regeneration. With the increase in potential, the corrosion current increases and the dissolution rate of the passive film increases. When the dissolution rate is greater than the regeneration rate, the passive film breaks down and the joint is corroded.
From Table 4, the relationship between the Cu coating thickness and self-corrosion potential was 10 μm (−0.933 V) > 5 μm (−1.038 V) > 20 μm (−1.0708 V) > 0 μm (−1.0802 V), and the relationship between the Cu coating thickness and corrosion current density was 10 μm (4.21 × 10⁻⁶ A·cm−2) < 5 μm (4.58 × 10⁻⁶ A·cm−2) < 20 μm (7.34 × 10⁻⁶ A·cm−2) < 0 μm (4.09 × 10⁻⁵ A·cm−2). The self-corrosion potential represents the difficulty of corrosion of Al alloy/steel welding–brazing joints. The greater the self-corrosion potential, the less likely it is that corrosion will occur. The corrosion current density represents the actual corrosion rate of joints. The smaller the corrosion current density is, the smaller the corrosion rate is [21]. Therefore, when the thickness of the Cu coating was 10μm, the self-corrosion potential of the joint was the maximum, while the corrosion current density was the minimum, indicating that the corrosion resistance of the joint was optimal.
The above results indicated that the thickness of the IMC layer at the interface had a great influence on the corrosion resistance of the joint. For Cu coatings ranging from 0 to 10 μm, the thickness of the IMC layer decreased gradually with the increase in the Cu coating thickness, and the corrosion resistance of the joint increased gradually. Gu et al. [22] conducted electrochemical corrosion testing on Al alloy and galvanized steel welding–brazing joints, and found that the increase in the IMC layer thickness could accelerate the corrosion of the joints. Tan L et al. [23] found that the corrosion potential of the Al-Fe-Si phase was −200 mv, with a large corrosion potential difference from the base metal of Al alloy and steel, thus accelerating the corrosion of the joint. However, when the Cu coating thickness was 20 μm, the Al2Cu compound formed in the IMC layer of the joint, which had higher electrode potential [24] compared with the Al-Fe-Si compound. There was a larger potential difference between the Al2Cu compound and the base metal, which intensified the corrosion of the joint. Thus, the corrosion resistance of the joint was reduced.

4. Conclusions

In this study, 6082 Al alloy and Q235B steel with Cu coatings of 0~20 μm thickness were joined by CMT technology, using AlSi12 as a filler metal. The effects of different Cu coating thicknesses on the macro-morphology, microstructure, mechanical properties and corrosion resistance of Al alloy/steel welding–brazing joints were studied. The main conclusions were drawn as follows:
  • A Cu coating with an appropriate thickness could improve the wettability and spreadability of AlSi12 on the surface of steel, which resulted in the excellent formation of Al alloy/steel CMT welding–brazing joints.
  • The addition of the Cu element could inhibit the reaction of Al and Fe and reduce the thickness of interfacial brittle IMCs. When the Cu coating thickness was no more than 10 μm, the microstructure of the Al alloy/steel joint was composed of θ-Fe(Al,Si)3, τ5-Al7.2Fe1.8Si and τ5-Al7.2(Fe,Cu)1.8Si at the interfacial reaction layer and α-Al solid solution and τ5-Al7.2Fe1.8Si in the welded seam. As the Cu coating thickness increased to 20 μm, θ-Fe(Al,Si)3 disappeared and Al2Cu appeared in the joint.
  • With the increase in the Cu coating on the surface of the steel, the thickness of the IMCs decreased and the content of brittle θ-Fe(Al,Si)3 was reduced, which improved the tensile strength and corrosion resistance of the Al/steel joints. When the thickness of the Cu coating on the surface of steel was 10 μm, the tensile strength of the Al/steel joint reached the maximum of 138.7 MPa and the corrosion resistance of the joint reached the optimal level. However, when the thickness of the Cu coating increased to 20 μm, the IMC thickness reached the minimum, but Cu reacted with Al to form a brittle Al2Cu phase under high Cu content, which deteriorated the tensile strength and corrosion resistance of the joint.

Author Contributions

Conceptualization, C.Z., J.P. and M.W.; methodology, C.Z., Q.S., S.W., S.K.U.G.H. and Y.S; validation, C.Z., M.W. and J.P.; writing—original draft preparation, C.Z., M.W. and J.P.; writing—review and editing, Q.S. and Y.S. All authors have read and agreed to the published version of the manuscript.

Funding

This work is sponsored by the National Natural Science Foundation of China (No. 51675249), Changzhou Science and Technology Plan Project (No. CJ20190028), Natural Science Research General Project of Jiangsu Province (No. 19KJB46001) and the Excellent Scientific and Technological Innovation Team of Universities in Jiangsu Province.

Institutional Review Board Statement

Not applicable.

Informed Consent Statement

Not applicable.

Data Availability Statement

The data used to support the findings of this study are available from the corresponding authors upon request.

Conflicts of Interest

The authors declare no conflict of interest.

References

  1. Hong, T.J.; Dong, F.L.; Ding, F.J.; Zhao, J.B.; Wang, S.L. Application of aluminum alloy in automotive lightweight. Hot Work. Technol. 2020, 49, 1–6. [Google Scholar]
  2. Agudo, L.; Eyidi, D.; Schmaranzer, C.H.; Arenholz, E.; Jank, N.; Brucker, J.; Pyzalla, A.R. Intermetallic FexAly-phases in a steel/Al-alloy fusion welds. J. Mater. Sci. 2007, 42, 4205–4214. [Google Scholar] [CrossRef]
  3. Hao, D.S.; Zhang, H. Application and development of alloy elements in Aluminum/Steel welding. J. Mater. Sci. 2021, 50, 1–5. [Google Scholar]
  4. Wang, H.Y.; Feng, B.Q.; Song, G.; Liu, L.M. Laser-arc hybrid welding of high-strength steel and aluminum alloy joints with brass filler. Mater. Manuf. Processes 2017, 33, 735–742. [Google Scholar] [CrossRef]
  5. Yang, X.D.; Shi, Y.; Liu, J. Effect of Cu foil on laser butt welding quality of Aluminum/Steel dissimilar metals joint. J. Mech. Eng. 2014, 50, 143–149. [Google Scholar] [CrossRef]
  6. Saleh, M.I.; Khan, T.I.; Roven, H.J. Transient liquid phase bonding of AA-6063 to UNS S32304 using Cu interlayer. Procedia Chem. 2016, 19, 517–524. [Google Scholar] [CrossRef] [Green Version]
  7. Li, S.H.; Chen, Y.H.; Kang, J.D.; Amirkhiz, B.S.; Nadeau, F. Friction stir lap welding of aluminum alloy to advanced high strength steel using a cold-spray deposition as an interlayer. Mater. Lett. 2018, 239, 212–215. [Google Scholar] [CrossRef]
  8. Mathieu, A.; Shabadi, R.; Deschamps, A.; Suery, M.; Matteï, S.; Grevey, D.; Cicala, E. Dissimilar material joining using laser (aluminum to steel using zinc-based filler wire). Opt. Laser Technol. 2007, 39, 652–661. [Google Scholar] [CrossRef]
  9. Mohammadpour, M.; Yazdian, N.; Wang, H.P.; Carlson, B.; Kovacevic, R. Effect offiller wire composition on performance of Al/galvanized steeljoints by twin spot laser welding-brazing method. J. Manuf. Process. 2018, 31, 20–34. [Google Scholar] [CrossRef]
  10. Xia, H.B.; Zhao, X.Y.; Tan, C.W.; Chen, B.; Song, X.G.; Li, L.Q. Effect of Si content on theinterfacial reactions in laser welded-brazed Al/steel dissimilarbutted joint. J. Mater. Process. Technol. 2018, 258, 9–21. [Google Scholar] [CrossRef]
  11. Shi, L.T.; Kang, J.D.; Shalchi-Amirkhiz, B.; Sigler, D.R.; Haselhuhn, A.S.; Carlson, B.E. Effect of coatingtype on microstructure and mechanical behavior of resistancespot welds of thin X626 aluminum sheet to low carbon steel. J. Mater. Process. Technol. 2019, 264, 438–447. [Google Scholar] [CrossRef]
  12. Li, J.; Huang, J.K.; Jin, Q.S. Research status of welding-brazing of aluminum/steel dissimilar metals. Electr. Weld. Mach. 2018, 48, 109–114. [Google Scholar]
  13. Wu, S.H.; Chen, S.j. Study on Welding of Steel/Aluminum Dissimilar Metal. Hot Work. Technol. 2012, 41, 170–173. [Google Scholar]
  14. Chen, Y.L.; Qi, Y.F.; Liu, X. Microstructure and mechanical properties of AlSiCu10-10 filler meter brazing 6063 aluminum alloy. China Weld. 2018, 27, 52–56. [Google Scholar]
  15. Song, J.L.; Lin, S.B.; Yang, C.L.; Ma, G.C. Analysis of intermetallic layer in dissimilar TIG welding-brazing butt joint of aluminium alloy to stainless steel. Sci. Technol. Weld. Join. 2010, 15, 213–218. [Google Scholar] [CrossRef]
  16. Pu, J.; Wu, M.F.; Yuan, Y. Study of microstructure and grain boundary penetration behavior in 6063 Al alloy contact reactive brazing. Rare Metal. Mat. Eng. 2007, S3, 168–171. [Google Scholar]
  17. Song, J.L.; Lin, S.B.; Yang, C.L.; Ma, G.C. Characteristics of precoating TIG welding-brazing joint of aluminum alloy to stainless steel. Chin. J. Nonferrous Met. 2009, 19, 1209–1215. [Google Scholar]
  18. Lin, S.B.; Song, J.L.; Yang, C.L.; Ma, G.C. Micrstructure analysis of interfacial layer with tungsten inert gas welding-brazing joint of aluminum alloy/stainless steel. Acta Metall. Sin. 2009, 45, 1211–1216. [Google Scholar]
  19. Kang, M.J.; Kim, C. Joining Al 5052 alloy to aluminized steel sheet using cold metal transfer process. Mater. Des. 2015, 81, 95–103. [Google Scholar] [CrossRef]
  20. Schubert, E.; Klassen, M.; Zerner, I.; Walz, C.; Sepold, G. Light-weight structures produced by laser beam joining for future applications in automobile and aerospace industry. J. Mater. Process. Technol. 2001, 115, 2–8. [Google Scholar] [CrossRef]
  21. Kang, D.H.; Lee, H.W. Study of the correlation between pitting corrosion and the component ratio of the dual phase in duplex stainless steel welds. Corros. Sci. 2013, 74, 396–407. [Google Scholar] [CrossRef]
  22. Gu, Y.F.; Li, J.; Shi, Y.; Huang, J.K.; Fan, D. Corrosion property of arc welding brazed joint between aluminum and steel. Chin. J. Nonferrous Met. 2016, 26, 758–765. [Google Scholar]
  23. Tan, L.; Allen, T.R. Effect of thermomechanical treatment on the corrosion of AA5083. Corros. Sci. 2010, 52, 548–554. [Google Scholar] [CrossRef]
  24. Zhang, M.X.; Guan, Y.Q.; Zheng, Y.P. The corrosion behaviors of ADC12 aluminum alloy in vapour. J. Chin. Soc. Corros. Prot. 2002, 4, 229–232. [Google Scholar]
Figure 1. Schematic diagram of CMT welding–brazing process.
Coatings 12 01123 g001
Figure 2. Effect of Cu coating on macro-morphology of welding–brazing joints: (ac) without Cu coating; (df) with 10 μm Cu coating.
Coatings 12 01123 g002
Figure 3. The microstructure of Al alloy/steel welding–brazing joints: (a) without Cu coating; (b) with 5 μm Cu coating; (c) with 10 μm Cu coating; (d) with 20 μm Cu coating.
Coatings 12 01123 g003
Figure 4. Interface reaction zone and corresponding EDS line scanning results of welding–brazing joints with different Cu coating thicknesses: (a,b) without Cu coating; (c,d) with 5 μm Cu coating; (e,f) with 10 μm Cu coating; (g,h) with 20 μm Cu coating.
Coatings 12 01123 g004
Figure 5. The XRD results analysis of welding–brazing joints with different thicknesses of Cu coating.
Coatings 12 01123 g005
Figure 6. Microstructure evolution of reaction layer in welding–brazing joints with different thicknesses of Cu coating: (a) without Cu coating; (b) with 5 μm Cu coating; (c) with 10 μm Cu coating; (d) with 20 μm Cu coating.
Coatings 12 01123 g006
Figure 7. Tensile property results and macro-fracture location of welding–brazing joints: (a) tensile strength and fracture displacement results; (b) without Cu coating; (c) with 5 μm Cu coating; (d) with 10 μm Cu coating; (e) with 20 μm Cu coating.
Coatings 12 01123 g007
Figure 8. Tensile fracture morphology of welding–brazing joints: (a) without Cu coating; (b) with 5 μm Cu coating; (c) with 10 μm Cu coating; (d) with 20 μm Cu coating.
Coatings 12 01123 g008
Figure 9. Polarization curves of joints with different thicknesses of Cu coating.
Coatings 12 01123 g009
Table 1. The chemical compositions of base metals and welding wire (wt.%).
ElementsCrMnCMgSiNiTiZnFeAl
6082-0.4-0.10.8-0.150.20.5Bal.
Q235B0.70.20.2-0.20.02--Bal.-
ER4047F-0.15-0.112.15-0.10.20.21Bal.
Table 2. CMT welding–brazing parameters.
ParametersValue
Shielding gas flow, L/min18
Wire feeding speed, m/min5.5
Welding speed, mm/min350
Welding voltage, V12.1
Welding current, A107
Table 3. The EDS point scanning results and possible phases of corresponding test points in Figure 3 and Figure 4.
Test PointElement Ratio (at.%)Possible Phase
AlSiFeCu
197.230.921.85α-Al
269.1511.4319.42τ5-Al7.2Fe1.8Si
397.021.320.690.97α-Al
470.0810.6313.975.32τ5-Al7.2(Fe,Cu)1.8Si
598.010.850.230.91α-Al
672.058.6711.337.95τ5-Al7.2(Fe,Cu)1.8Si
797.010.980.211.8α-Al
858.541.111.3738.98Al2Cu
973.407.458.2610.89τ5-Al7.2(Fe,Cu)1.8Si
1063.2810.3426.38θ-Fe(Al,Si)3
1173.5410.1716.29τ5-Al7.2Fe1.8Si
1262.129.2828.470.13θ-Fe(Al,Si)3
1371.3210.4117.440.83τ5-Al7.2(Fe,Cu)1.8Si
1462.2611.8125.440.49θ-Fe(Al,Si)3
1575.348.5815.230.85τ5-Al7.2(Fe,Cu)1.8Si
1669.819.2320.010.95τ5-Al7.2(Fe,Cu)1.8Si
Table 4. Self-corrosion potential and self-corrosion current density of welding–brazing joints with different thicknesses of Cu coating.
Cu Coating/μmPotential/VCurrent Density/(A·cm−2)
0−1.08024.09 × 10−5
5−1.0384.58 × 10−6
10−0.9334.21 × 10−6
20−1.07087.34 × 10−6
Publisher’s Note: MDPI stays neutral with regard to jurisdictional claims in published maps and institutional affiliations.

