Article

Multi-Objective Optimization of Process Parameters of 45 Steel Laser Cladding Ni60PTA Alloy Powder

1
College of Mechanical Engineering, North China University of Science and Technology, 21 Bohai Road, Caofeidian Xincheng, Tangshan 063210, China
2
College of Metallurgy and Energy, North China University of Science and Technology, 21 Bohai Road, Caofeidian Xincheng, Tangshan 063210, China
*
Author to whom correspondence should be addressed.
Coatings 2022, 12(7), 939; https://doi.org/10.3390/coatings12070939
Submission received: 31 May 2022 / Revised: 26 June 2022 / Accepted: 29 June 2022 / Published: 1 July 2022

Abstract

:
When laser cladding is used to repair parts, the interaction of parameters has a significant influence on equipment performance. In order to explore the process parameters and quality of Ni60PTA coating, the statistical relationship between the process parameters (laser power, scanning speed, and powder feeding rate) and the responses (dilution ratio, ratio of layer width to height, and contact angle) was established by experiments using the response surface method (RSM) and variance analysis. The results show that the laser power is the dominant factor affecting the dilution ratio. However, the scanning speed has the greatest influence on the ratio of layer width to height and contact angle. These experimental results show that the proposed model can predict the actual data. In addition, the microstructure and microhardness of the samples prepared with the optimum process parameters were characterized. The results show that the quality of the cladding layer is good without cracks, deformation, and pores. The microstructure of the cladding zone is mainly composed of γ (Ni), FeNi3, M (M = Fe, Ni, Cr)23C6, M7C3, and CrB. The average microhardness of the coating is about 620 HV0.2, which is about 3.1 times that of 45 steel substrate.

1. Introduction

Due to excellent surface properties and low manufacturing costs, 45 steel is widely used in important equipment parts [1,2]. However, most of these components are used in complex environments, which require frequent maintenance or replacements, as well as increased maintenance costs. In recent years, laser cladding has been widely applied in the remanufacturing industry. Its principle is shown in Figure 1. Under the irradiation of a laser, one or more alloy elements are fused with the substrate surface so that high-performance cladding can be obtained on the surface of cheap materials. Laser cladding has many advantages compared to other modification technologies, such as a small heat-affected zone, a low dilution ratio, and a good metallurgical combination. Therefore, it has been widely used in the remanufacturing and repair of parts [3,4,5,6,7].
Based on the above views, many studies have explored effective surface repair technology for 45 steel materials, examining many research results. Zhu et al. [8] prepared almost completely dense nickel titanium carbide composite coatings with different titanium carbide content on 45 steel. The results showed that the average microhardness of Ni-50TiC coating was between 551HV 3 and 682HV 3—at least 2 times that of 45 steel—and the wear amount was significantly reduced. Zhang et al. [9] fabricated crack-free Ni60A coating on the surface of 45 steel. Through XRD, SEM, and EDS analysis and characterization, it was found that there were a large number of hard phases, which improved the wear resistance. Lu et al. [1] successfully obtained Zr50Ti5Cu27Ni10Al8 metallic glass (Mg) coating on 45 steel. The corrosion tests showed that the corrosion resistance of 45 steel with glass coating was much higher than without.
The above studies have mainly focused on changing the cladding materials to improve the surface properties. The combination of process parameters also has a significant effect on the performance of the cladding layer [10]. Among them, the laser power, scanning speed, powder feeding rate, and others are the key factors to determine the service life of remanufactured parts. There is a complex nonlinear relationship between the process parameters and the quality of the coating. These parameters have different effects on coating quality. In order to make the coating have excellent quality, mechanical properties, formability, and low crack sensitivity, it is necessary to select reasonable process parameters. Through analysis, adjustment, and optimization, the quality of coating can be effectively controlled [11]. Therefore, in order to meet the needs of high-quality coating, optimizing the combination of process parameters is important to ensure and improve the service life of parts.
At present, many optimization methods have been applied in the manufacturing field, such as the Taguchi method, the finite element method, mathematical statistics, and the response surface method. Riquelme et al. [12] used the Taguchi method to conduct cladding experiments on an aluminum alloy substrate and obtained the optimal parameter combination under the optimized conditions of the maximum aspect ratio and minimum defect rate. Hebbale et al. [13] used the Taguchi technique to evaluate the effects of different parameters on the wear behavior. These results showed that the slurry speed had a significant effect on the mass loss of uncoated substrate. Therefore, the Taguchi method is effective for optimizing a single objective response, but it is not suitable for optimizing a multi-objective parameter. Yao et al. [14] used COMSOL software to simulate the temperature field and stress field of different process parameters. Under the condition of minimum residual stress, the best power and scanning speed were obtained. Although the work efficiency was improved, the interactions among process parameters were not explored. Erfanmanesh et al. [15] and Nabhani et al. [16] used empirical statistical data to predict the correlation between process parameters and single-pass cladding geometry and analyzed it by regression. The shortcoming of this method is that the error of the fitting curve is large when the data are irregular.
Compared to the above optimization method, RSM is a newly developed multi-objective mathematical optimization method combining experimental design and statistical technology [17]. Through the analysis of experimental data, the fitting function and a three-dimensional surface graph can be obtained, and then the impact of impact factors on the response values can be directly reflected, including the interactions among impact factors. It has the functions of prediction, improvement, and optimization. This method is simple, efficient, and suitable for solving complex nonlinear optimization problems. Therefore, it has been widely used in manufacturing processes. The single-pass laser cladding test is the main method used to select the process parameters of laser rapid prototyping. The geometric shape of the cross-section is the main index to quantitatively evaluate the quality of the cladding layer. This is mainly because the laser cladding process involves complex multiphase and multi-physical fields. In addition, the geometry of the cross-section of a single cladding layer plays a decisive role in the quality and efficiency of laser rapid prototyping. Therefore, taking it as an evaluation index has the dual significance of quality and cost control. However, there is no perfect prediction theory or method to completely replace the process parameter selection based on the single-pass test. Therefore, it is very important to find a method to optimize the morphology of single-pass coating.
In order to obtain excellent coating quality, an RSM prediction model for single-pass coating morphology was established based on the section geometry of the coating as the main evaluation index. The influence of linear and nonlinear coupling among different process parameters on the morphology of the coating was explored. The ideal coating was obtained by the ideality optimization method, and the microstructure and microhardness of the best samples were characterized. This method can provide method guidance and decision-making reference for preparing a high-quality cladding layer in production practices.

2. Experimental Conditions and Scheme

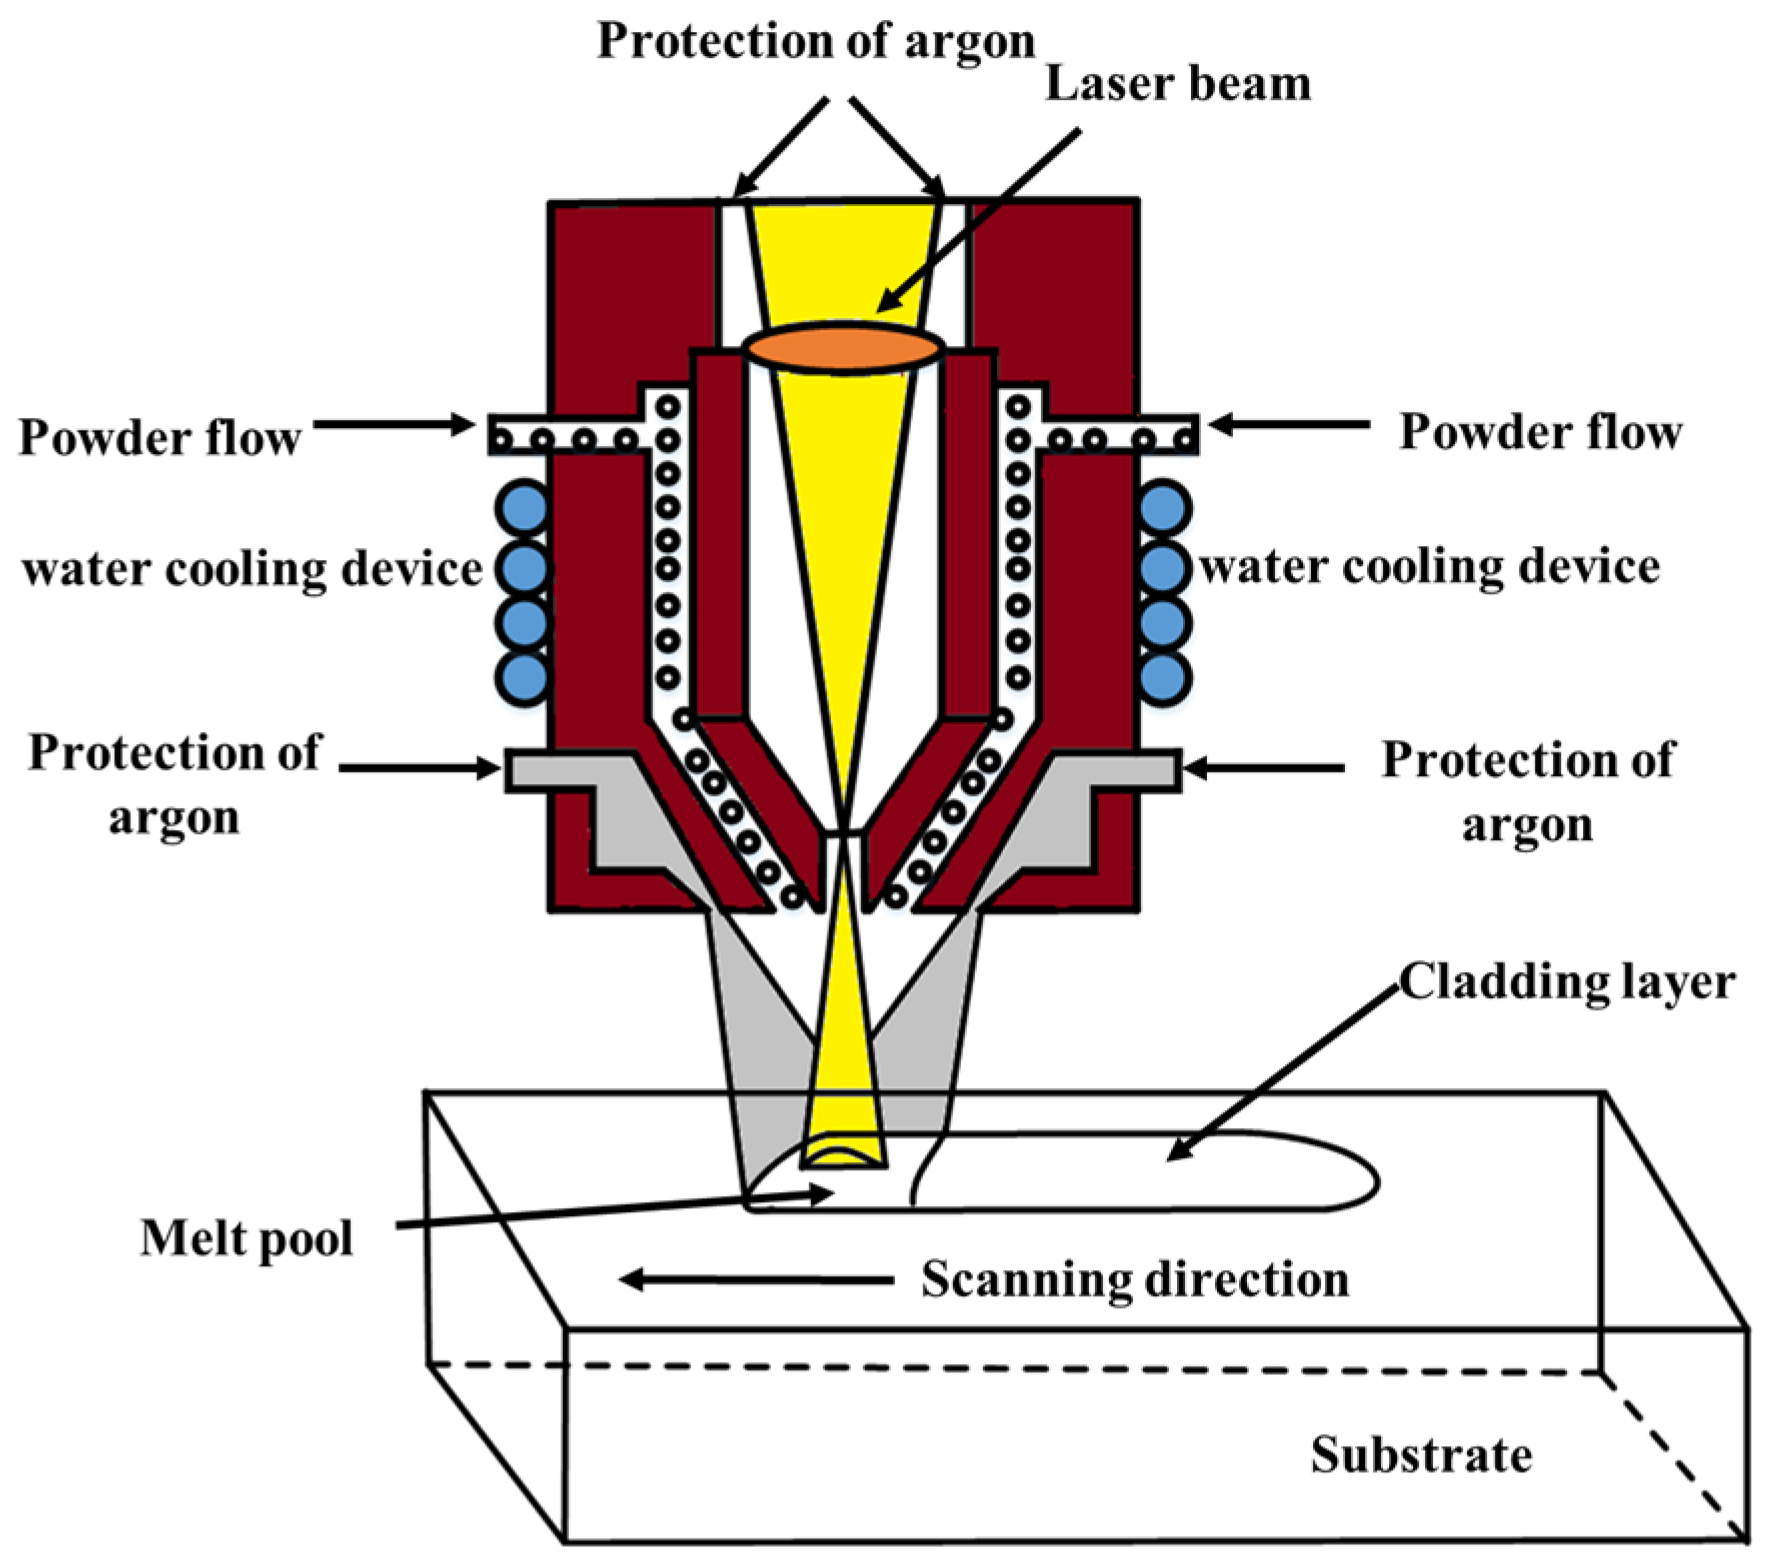
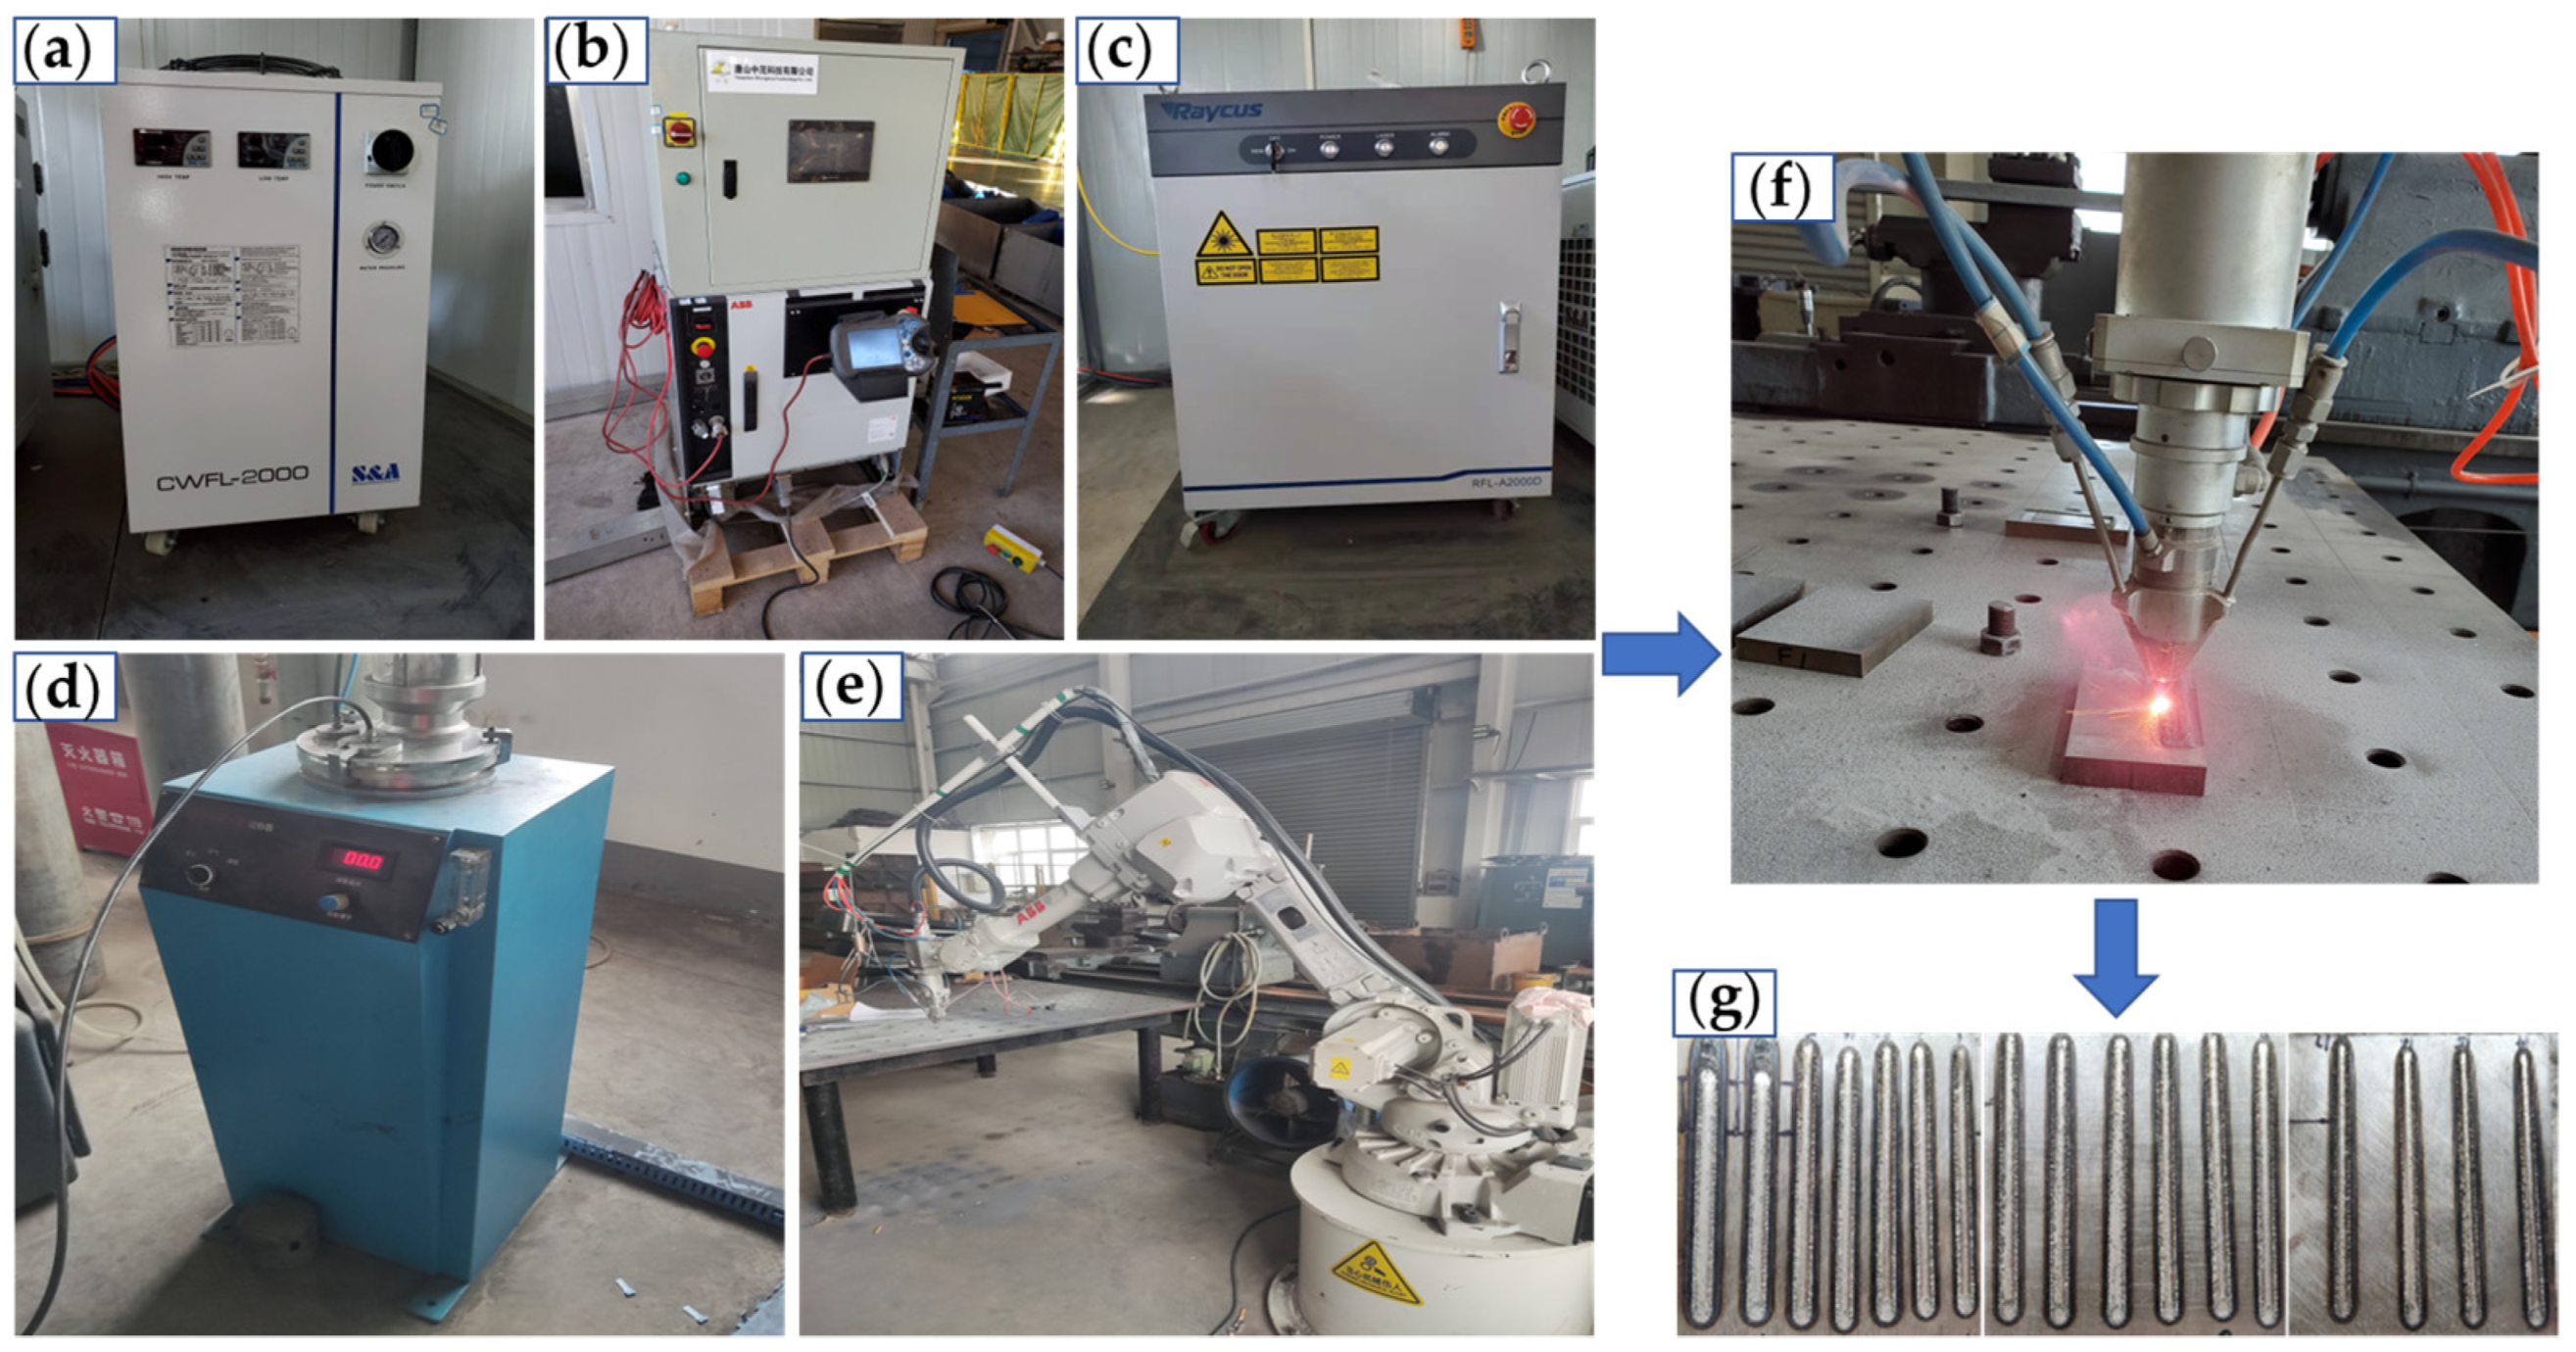
2.1. Experimental Conditions

The substrate material selected for the experiment was 45 steel. Its size was 100 mm × 100 mm × 10 mm. Before the test, sandpaper was used to remove oxides on the surface. Anhydrous ethanol was used to clean the surface stain. The cladding material tested was spherical Ni60PTA alloy powder with a particle size of 100~270 mesh. The alloy powder was dried in a drying oven at a constant temperature of 100 °C for 6 h before the experiment. The chemical compositions of 45 steel and Ni60PTA are listed in Table 1 and Table 2, respectively.
The equipment included a TSR-2000-1 fiber laser equipped with an ABB five-axis manipulator, a disc powder feeder, and a cooling system. The laser wavelength was 915 nm, the maximum power was 2000 W, the spot diameter was 2 mm, and argon was used as the powder feeding gas and protective gas during the experiment. The compositions of the laser cladding system and 17 groups of experimental samples are shown in Figure 2.
After the cladding experiment, a section of the specimen was obtained using wire electrical discharge machining (WEDM) in the scanning direction. The samples were ground with 100–3000 mesh sandpaper, polished with a diamond polishing agent, and etched with aqua regia (HCl/HNO3 = 3:1). After chemical etching, the samples were cleaned with alcohol and dried with a blower. Image-Pro software was used to measure the width, height, and depth of the coatings.
The phase was detected by X-ray diffraction (XRD) with Cu-Kα radiation and operated at 60 kV and 300 mA. The scanning 2θ range was 20–90°. The microstructures and components were characterized by scanning electron microscopy (SEM) and energy dispersive spectroscopy (EDS). The microhardness was tested with a Vickers hardness tester, and a load of 200 g was applied for 10 s.

2.2. Experimental Scheme Design

In the process of laser cladding, the properties of coatings are affected by many parameters. However, the laser power (A), powder feeding rate (B), and scanning speed (C) are the most critical factors [18]. Based on previous studies, the range of process parameters was firstly determined. Then, cladding experiments were conducted to further narrow the range of process parameters. Finally, the laser power was 1400–1600 W, the scanning speed was 3–5 mm/s, and the powder feeding rate was 16–20 mg/s. The effects of the process parameters on the coating dilution ratio (D), the ratio of the layer width to height (W/H), and the contact angle (θ) were investigated using Box–Behnken Design (BBD). Table 3 shows the experimental factors and levels. A total of 17 groups of experiments were designed using BBD. The center point was set and repeated 5 times to investigate the fitting of the central region and ensure the accuracy of the result. Considering the accuracy of the data, the experiment was repeated three times to obtain the average value. Table 4 shows the measurement data results.
RSM is a simple method for solving multi-variable problems. In most cases, the relationship between the response target and the independent variable is not a simple linear relationship but a complex nonlinear relationship. Therefore, the second-order response surface model was used for fitting. The model is as follows: (Equation (1)) [19,20,21].
y = a 0 + i = 1 n a i x i u + i = 1 n a i i x i u 2 + i < j n a i j x i u x j u + ε
where y is the response value, x is the input variable, n is the number of factors, u is the number of experimental designs, and a0 is a constant term. ai, aii, and aij are the regression coefficients of the primary, quadratic, and interaction terms, respectively. ε is the error.
In this study, the dilution ratio, W/H, and the contact angle were considered responses. The dilution ratio directly affects the performance of the coating. As shown in Figure 3, the dilution ratio can be expressed as Equation (2):
η = h / ( h + H ) × 100 %
where W is the width of the cladding layer, H is the height of the cladding layer, and h is the depth of the molten pool.

3. Results and Discussion

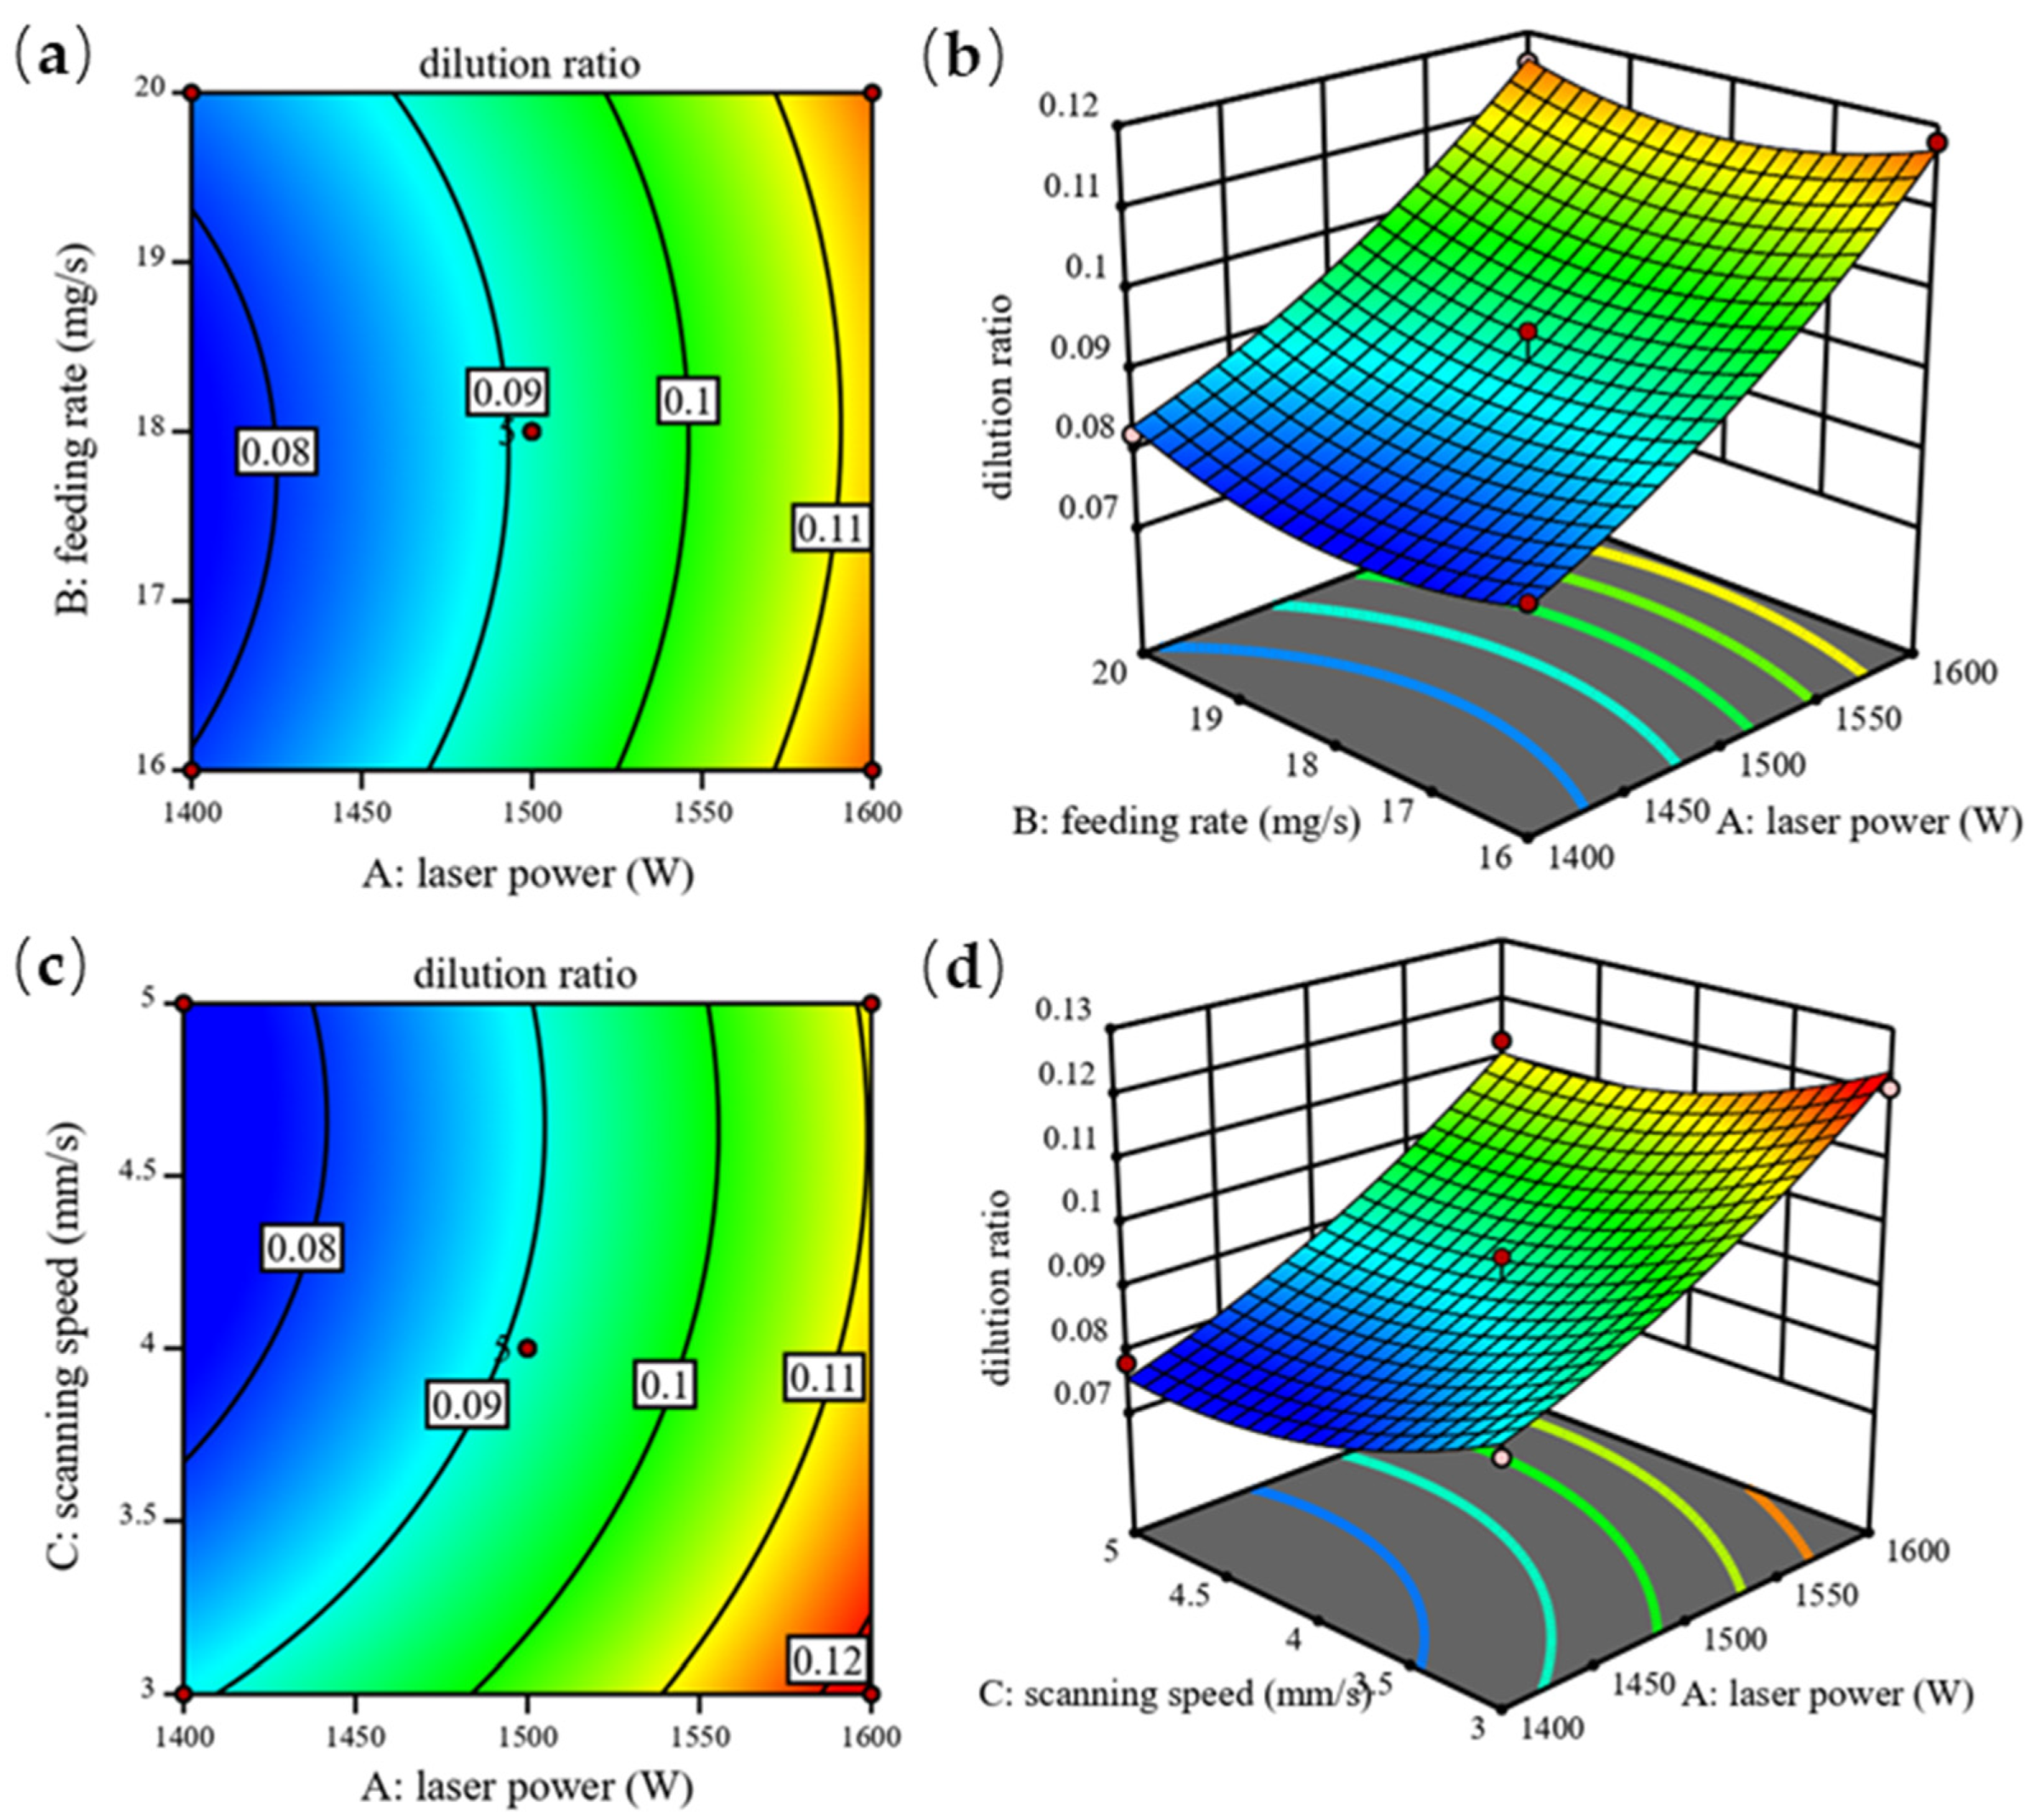
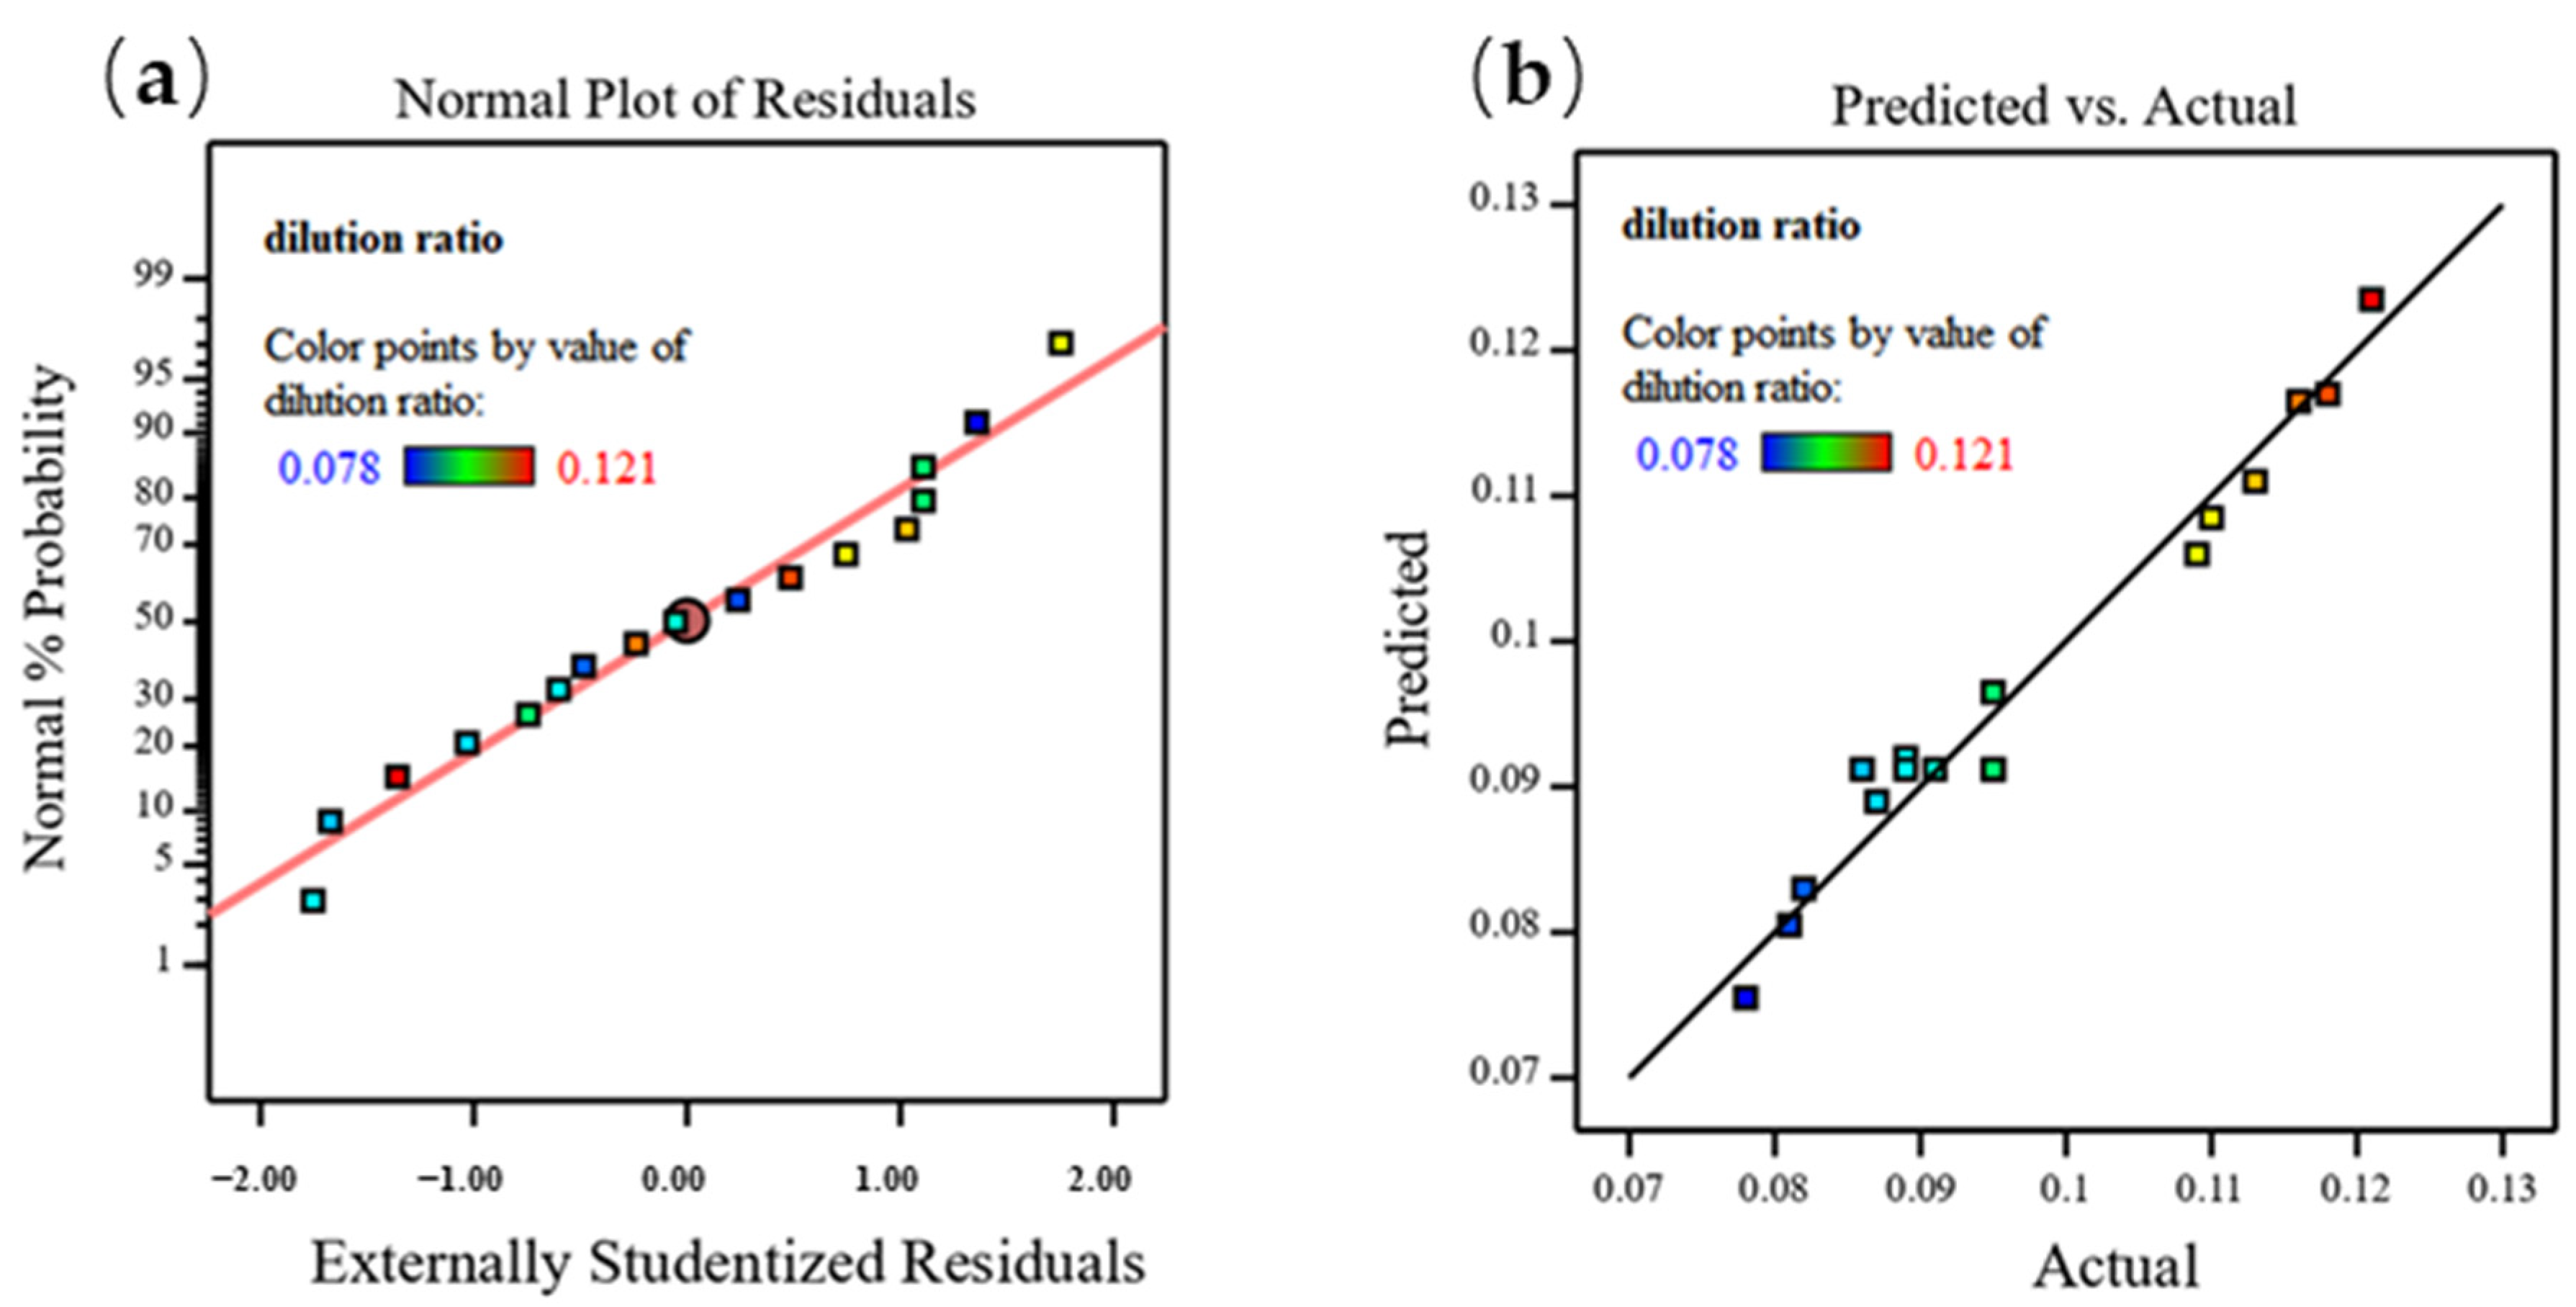
3.1. Analysis of the Dilution Ratio

3.1.1. Variance Analysis for Cladding Layer Dilution Ratio

Table 5 shows the variance analysis of the dilution ratio. It can be concluded that the p value of the mathematical regression model is 0.0002, indicating that the fitting result is ideal. The lack of fit is 0.4797, which is greater than 0.05, indicating that the degree of model mismatch is not significant, and the further response surface model is reliable and stable. The R2 value is 0.9666, indicating that there is a strong correlation between the test results and the fitting model. The difference between the predicted R2 and adjusted R2 is less than 0.2, indicating that the model has high accuracy and can meet the requirements. The signal-to-noise ratio is obviously greater than 4, indicating that the established regression model is highly identifiable. A p value of less than 0.05 shows that the model item is significant. In this case, the laser power (A), scanning speed (C), B2, and C2 are significant model terms. In addition, it can be seen that the laser power (A) had the greatest influence on the response value. Finally, the fitting regression equation of the dilution ratio is shown in Equation (3).
D = 0.912 + 0.0175 × A 0.0065 × C + 0.0033 × AC + 0.0045 × B 2 0.005 × C 2

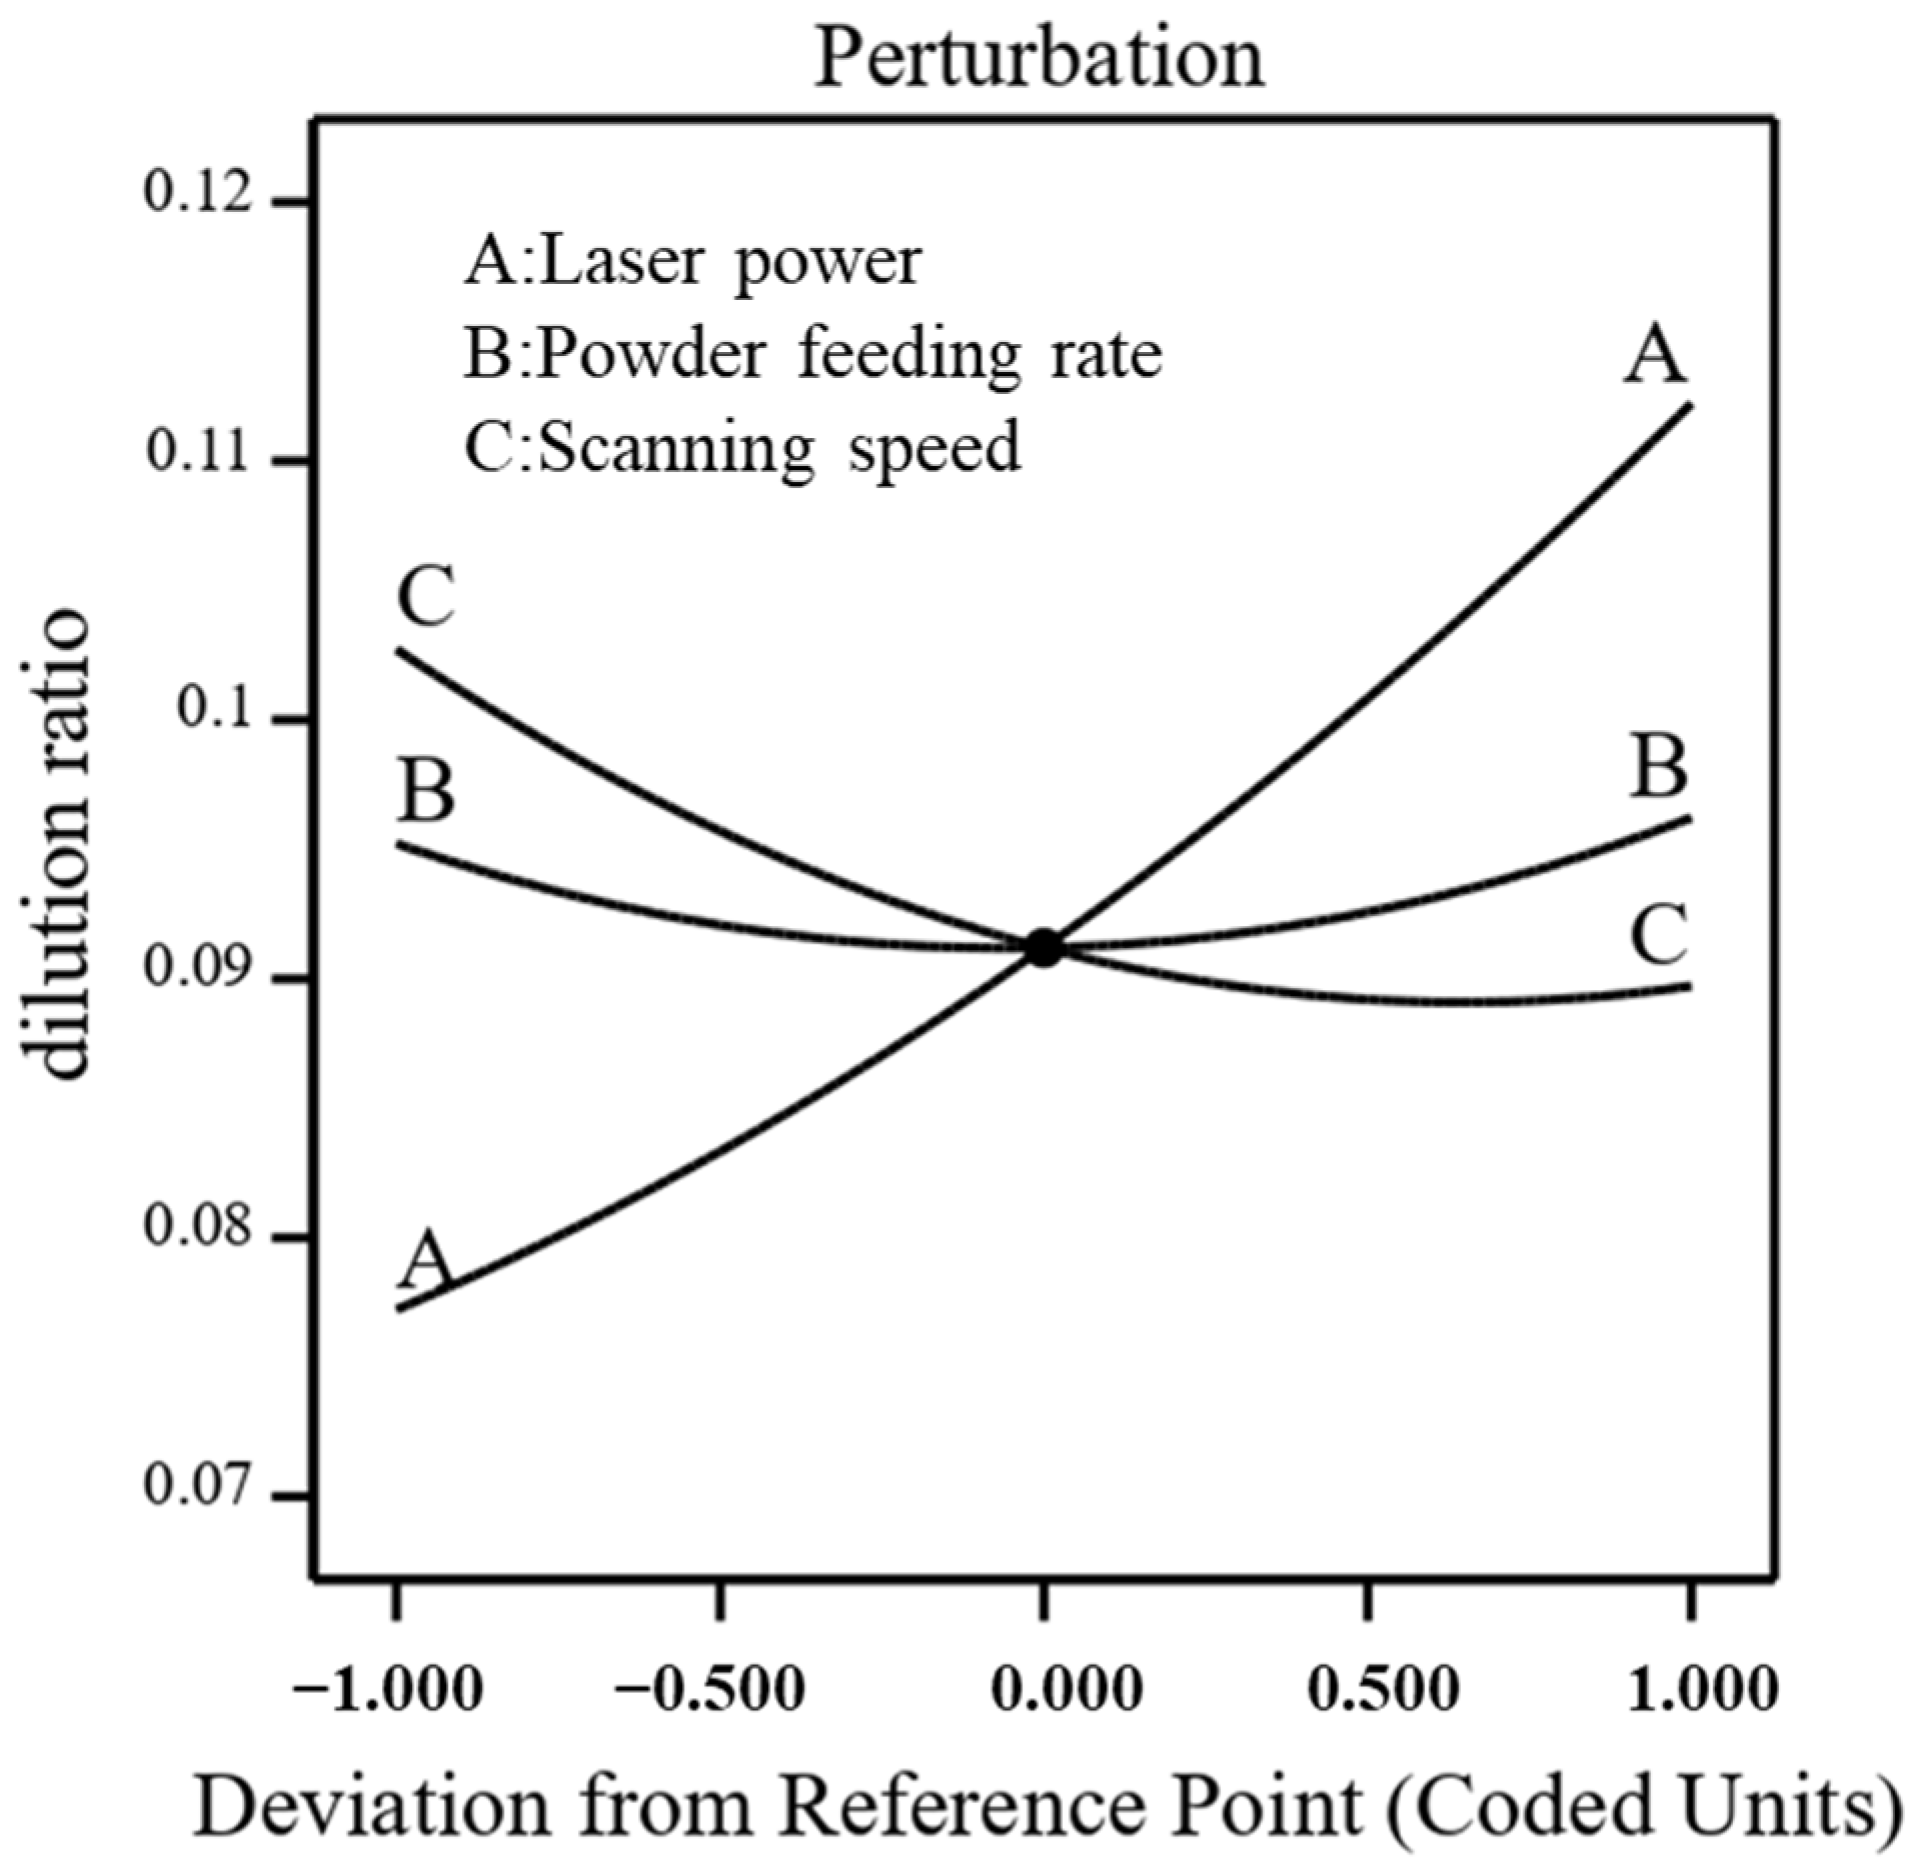
3.1.2. Influence of Various Factors on Cladding Layer Dilution Ratio

The perturbation diagram, contour map, and 3D influence curve obtained using Design Expert software clearly portray the relevance of the parameters and response value. Figure 4 shows the perturbation of three process parameters to the dilution ratio. It can be found that the laser power was proportional to the dilution ratio. A higher laser power increased the heat input rate. At the same time, the substrate obtained more heat, which caused the liquid metal to be hotter at the top of the molten pool surface than at the boundary between the substrate and the molten pool. However, the density of the molten alloy decreased with the increase in temperature. The melt inevitably rose along the central axis of the molten pool under the Marangoni convection. As a result, the effect of buoyancy on the fluid increased and higher turbulence was created. At this time, the energy was more uniformly stored in the molten pool. The average temperature and temperature gradient of the melt front attachment increased. The substrate excessively melted under the combined influence of the laser and the alloy liquid, resulting in a substantial increase in the coating dilution ratio. On the contrary, the scanning speed was negatively correlated with the dilution ratio. Increasing the scanning speed reduced both the laser energy density and the feed amount. In the selected range, since the change of feed rate was not obvious, the reduced laser energy was the main factor. Thus, the dilution ratio decreased. The dilution ratio first decreased and then increased with the increase in the powder feeding rate, indicating that there was an optimal value to minimize the dilution ratio.
Figure 5a,b presents the influence of the interactions between the laser power and powder feeding rate on the dilution ratio. It can be concluded that maintaining a lower laser power lower and appropriate powder feeding rate acquired the minimum dilution ratio. Figure 5c,d shows the effects of the interactions between the laser power and scanning speed on the dilution ratio while the powder feeding rate was at the center value. The figure indicates that the dilution ratio decreased with the decrease in laser power while decreasing the scanning speed.
Figure 6a shows the residual distribution of the dilution ratio. The residual values of the test group are distributed on both sides of the straight line in an S-shape, indicating that the model has a good fit. In Figure 6b, the actual value is basically around the straight line, indicating that the predicted value of the mathematical model is consistent with the actual value of the experiment, and the accuracy of the model is high.

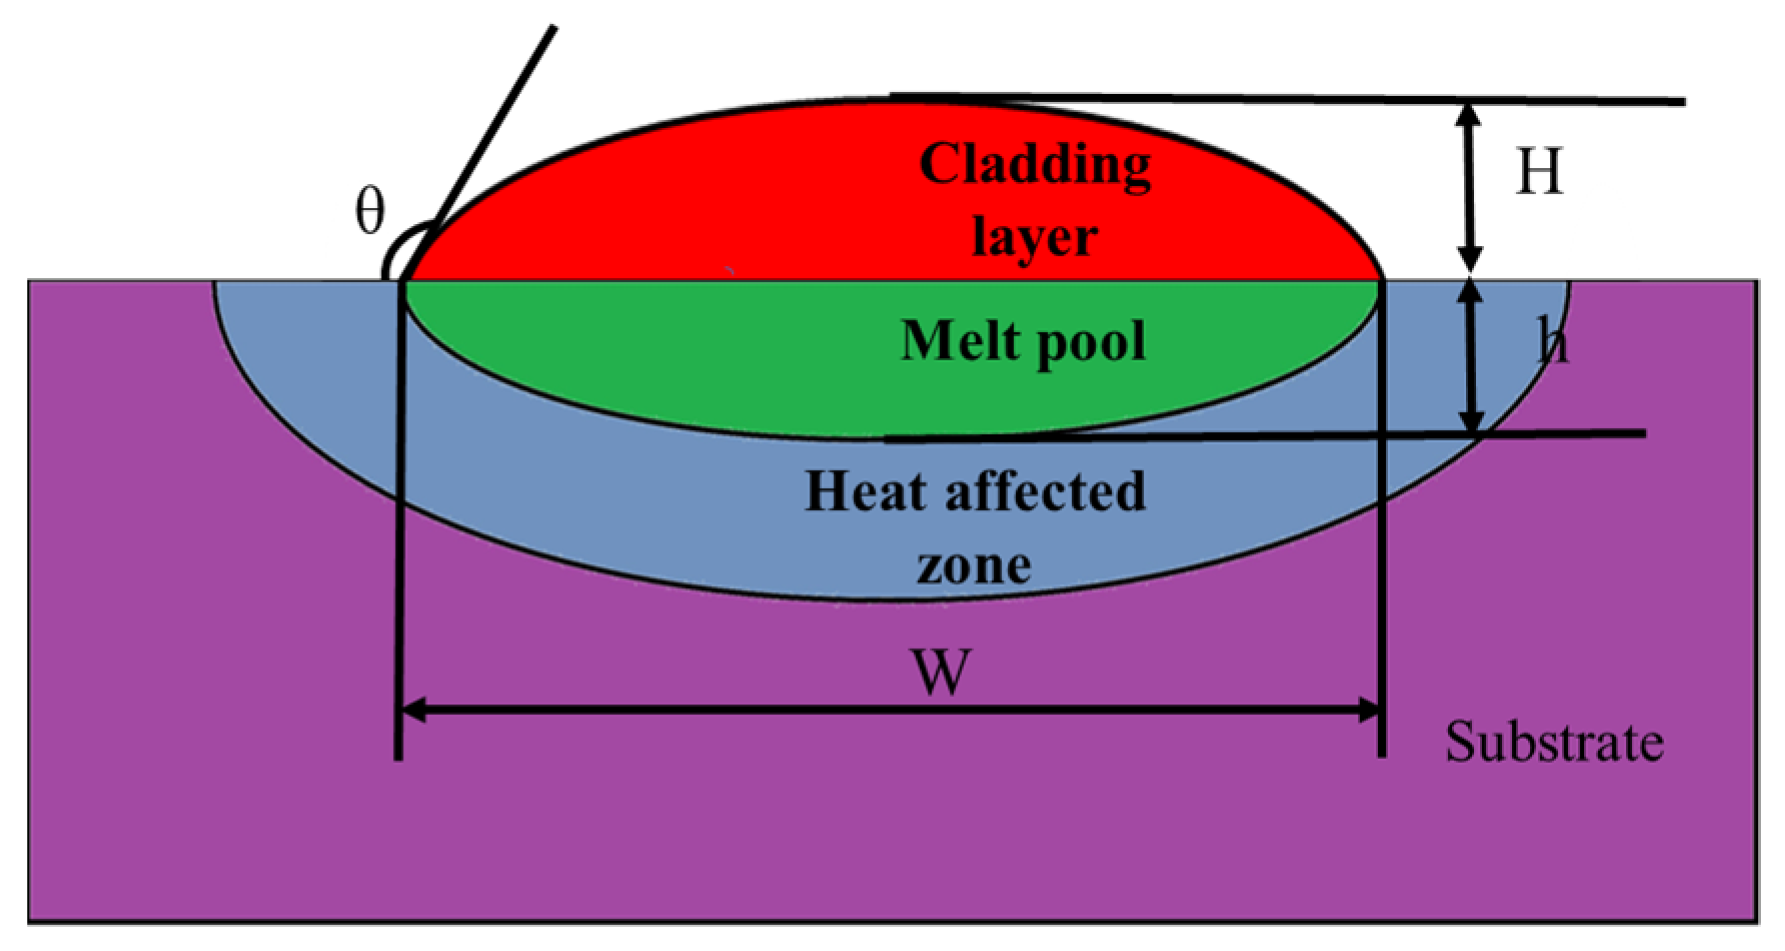
3.2. Analysis of the Ratio of Layer Width to Height (W/H)

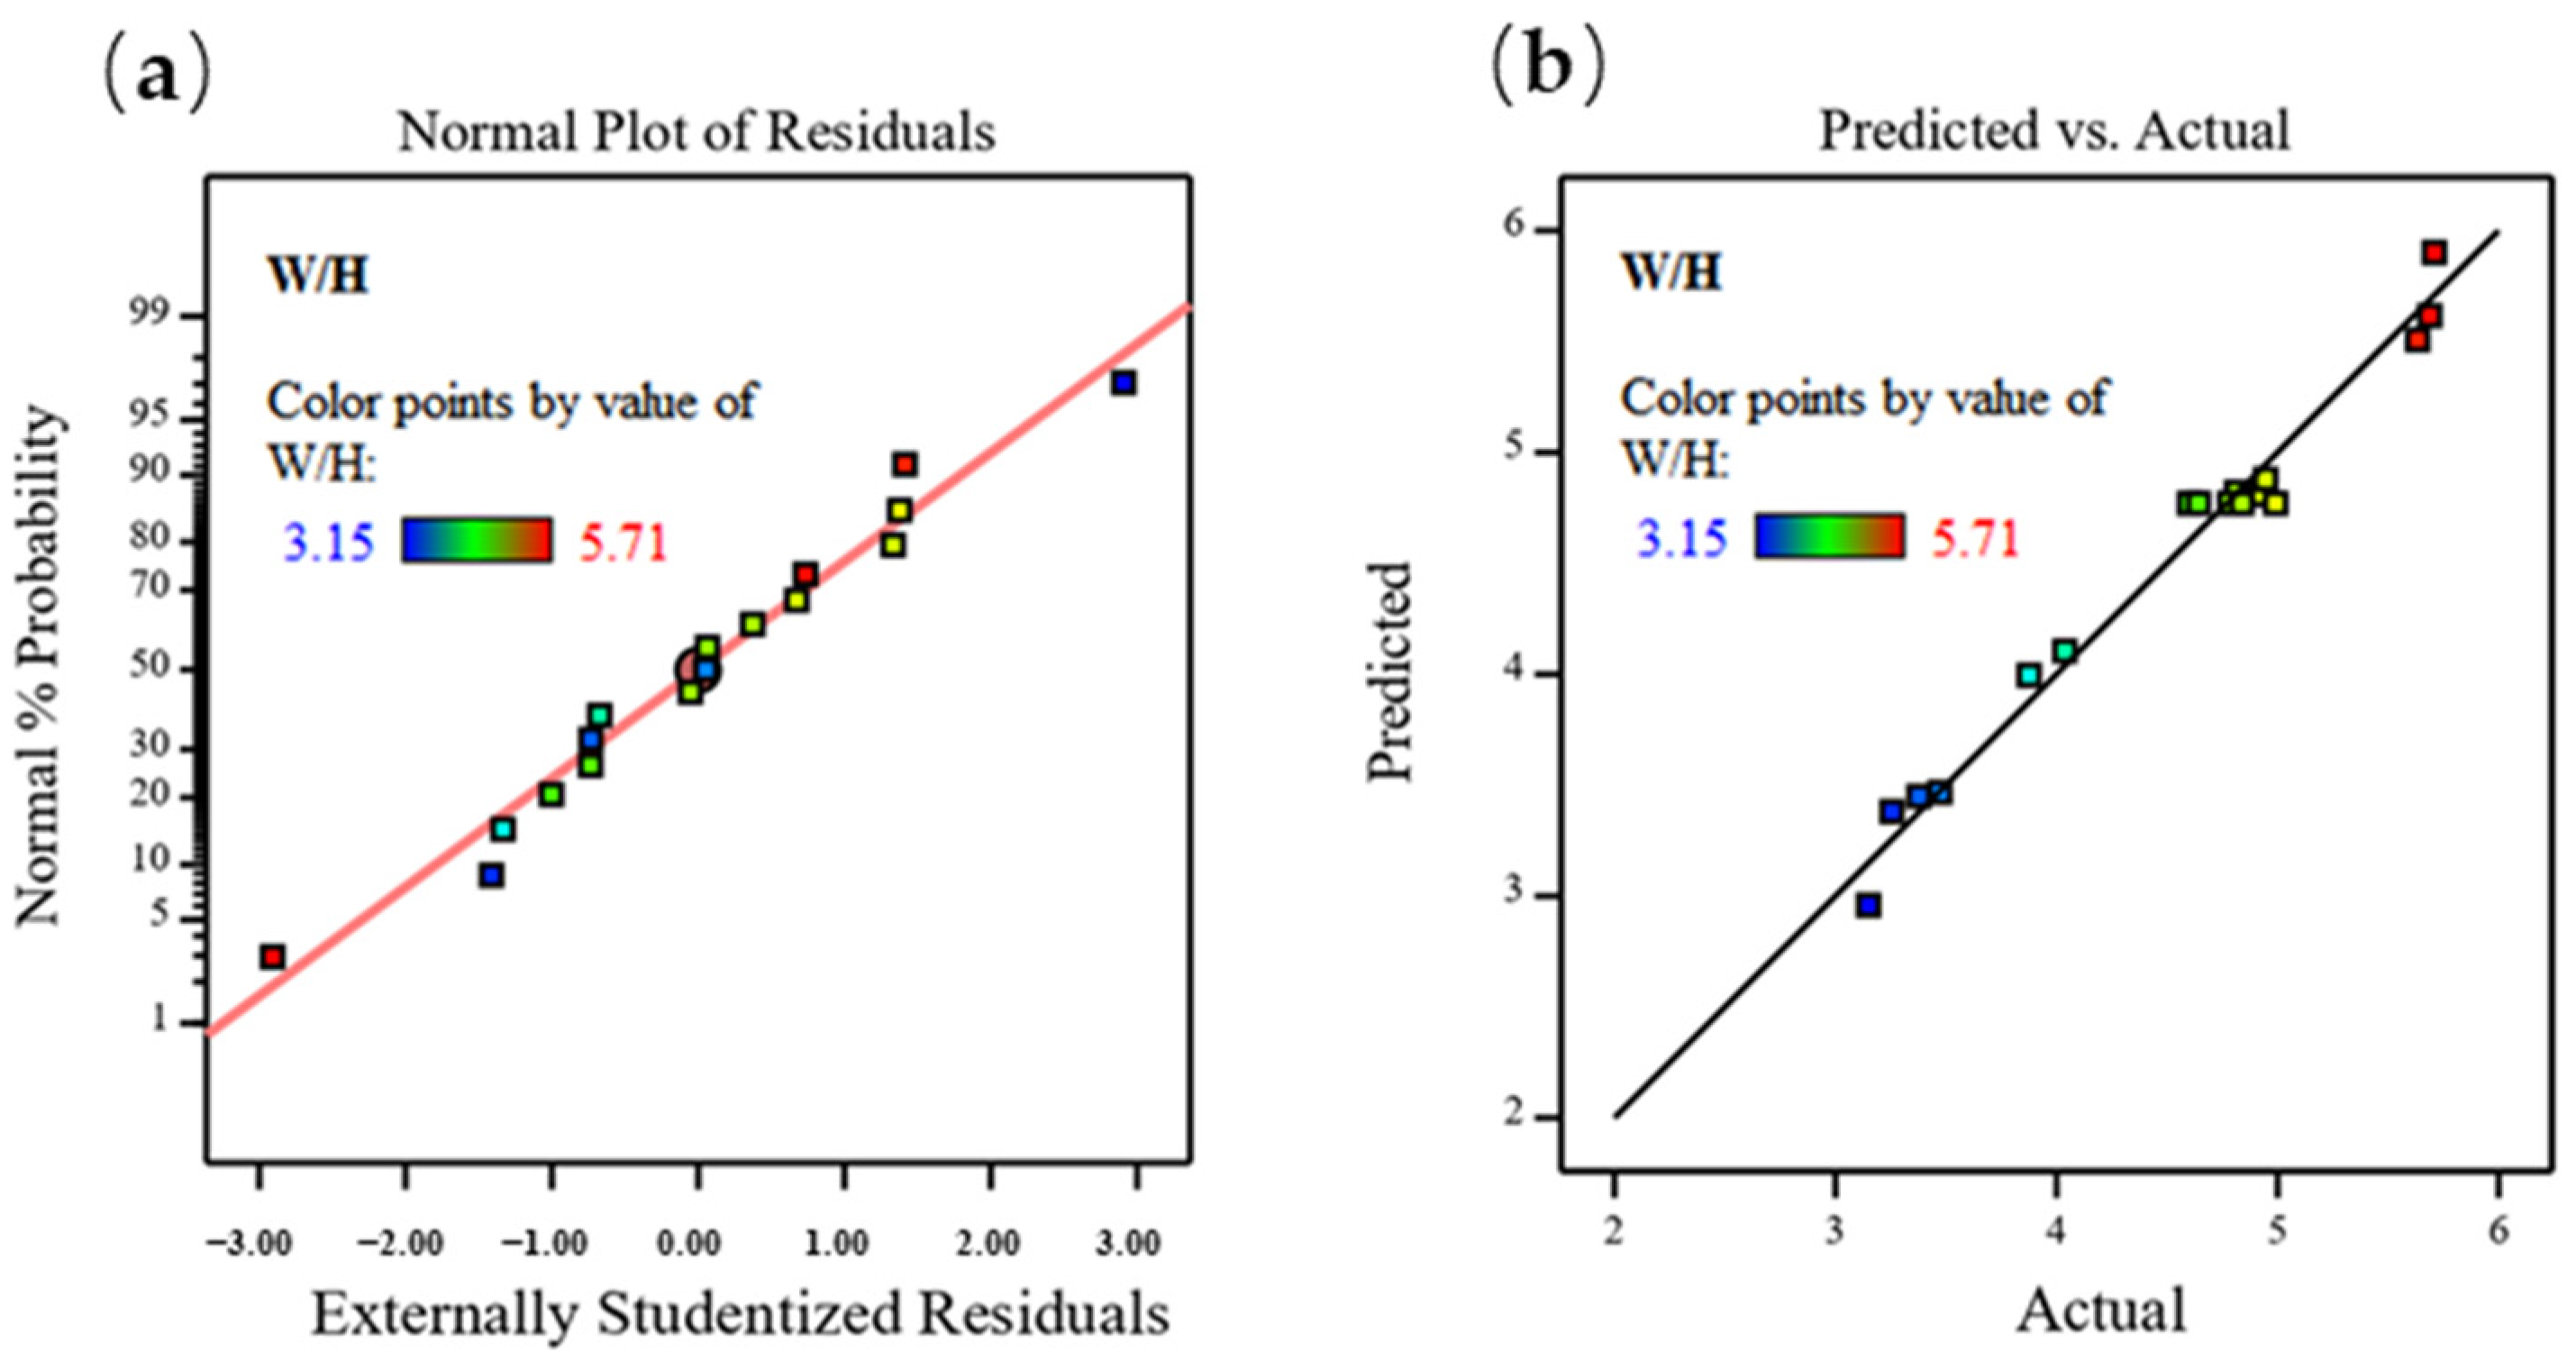
3.2.1. Variance Analysis for Cladding Layer W/H

Table 6 shows the variance analysis of the W/H. The F value is 13.99, indicating that the model predicted the experimental results well. The p value is less than 0.0001, indicating that the selected model predicted a significant height. The p value of the lack of fit is 0.247, indicating that the error of the experimental model is small and the accuracy of the model is high. The R2 value is 0.978, indicating the model has good correlation and high reliability. The difference between the predicted R2 and adjusted R2 is 0.177, which is less than 0.2. The signal-to-noise ratio is 20.2868 (greater than 4), indicating that the proposed model has sufficient accuracy. Two effective linear parameters, laser power and scanning speed, were determined by the analysis of variance. The scanning speed had a significant effect on the W/H. Finally, the regression equation of the W/H to the actual value is represented in Equation (4).
W / H = 4.77 + 0.3975 × A + 1.07 × C 0.2632 × A 2 0.2214 × C 2

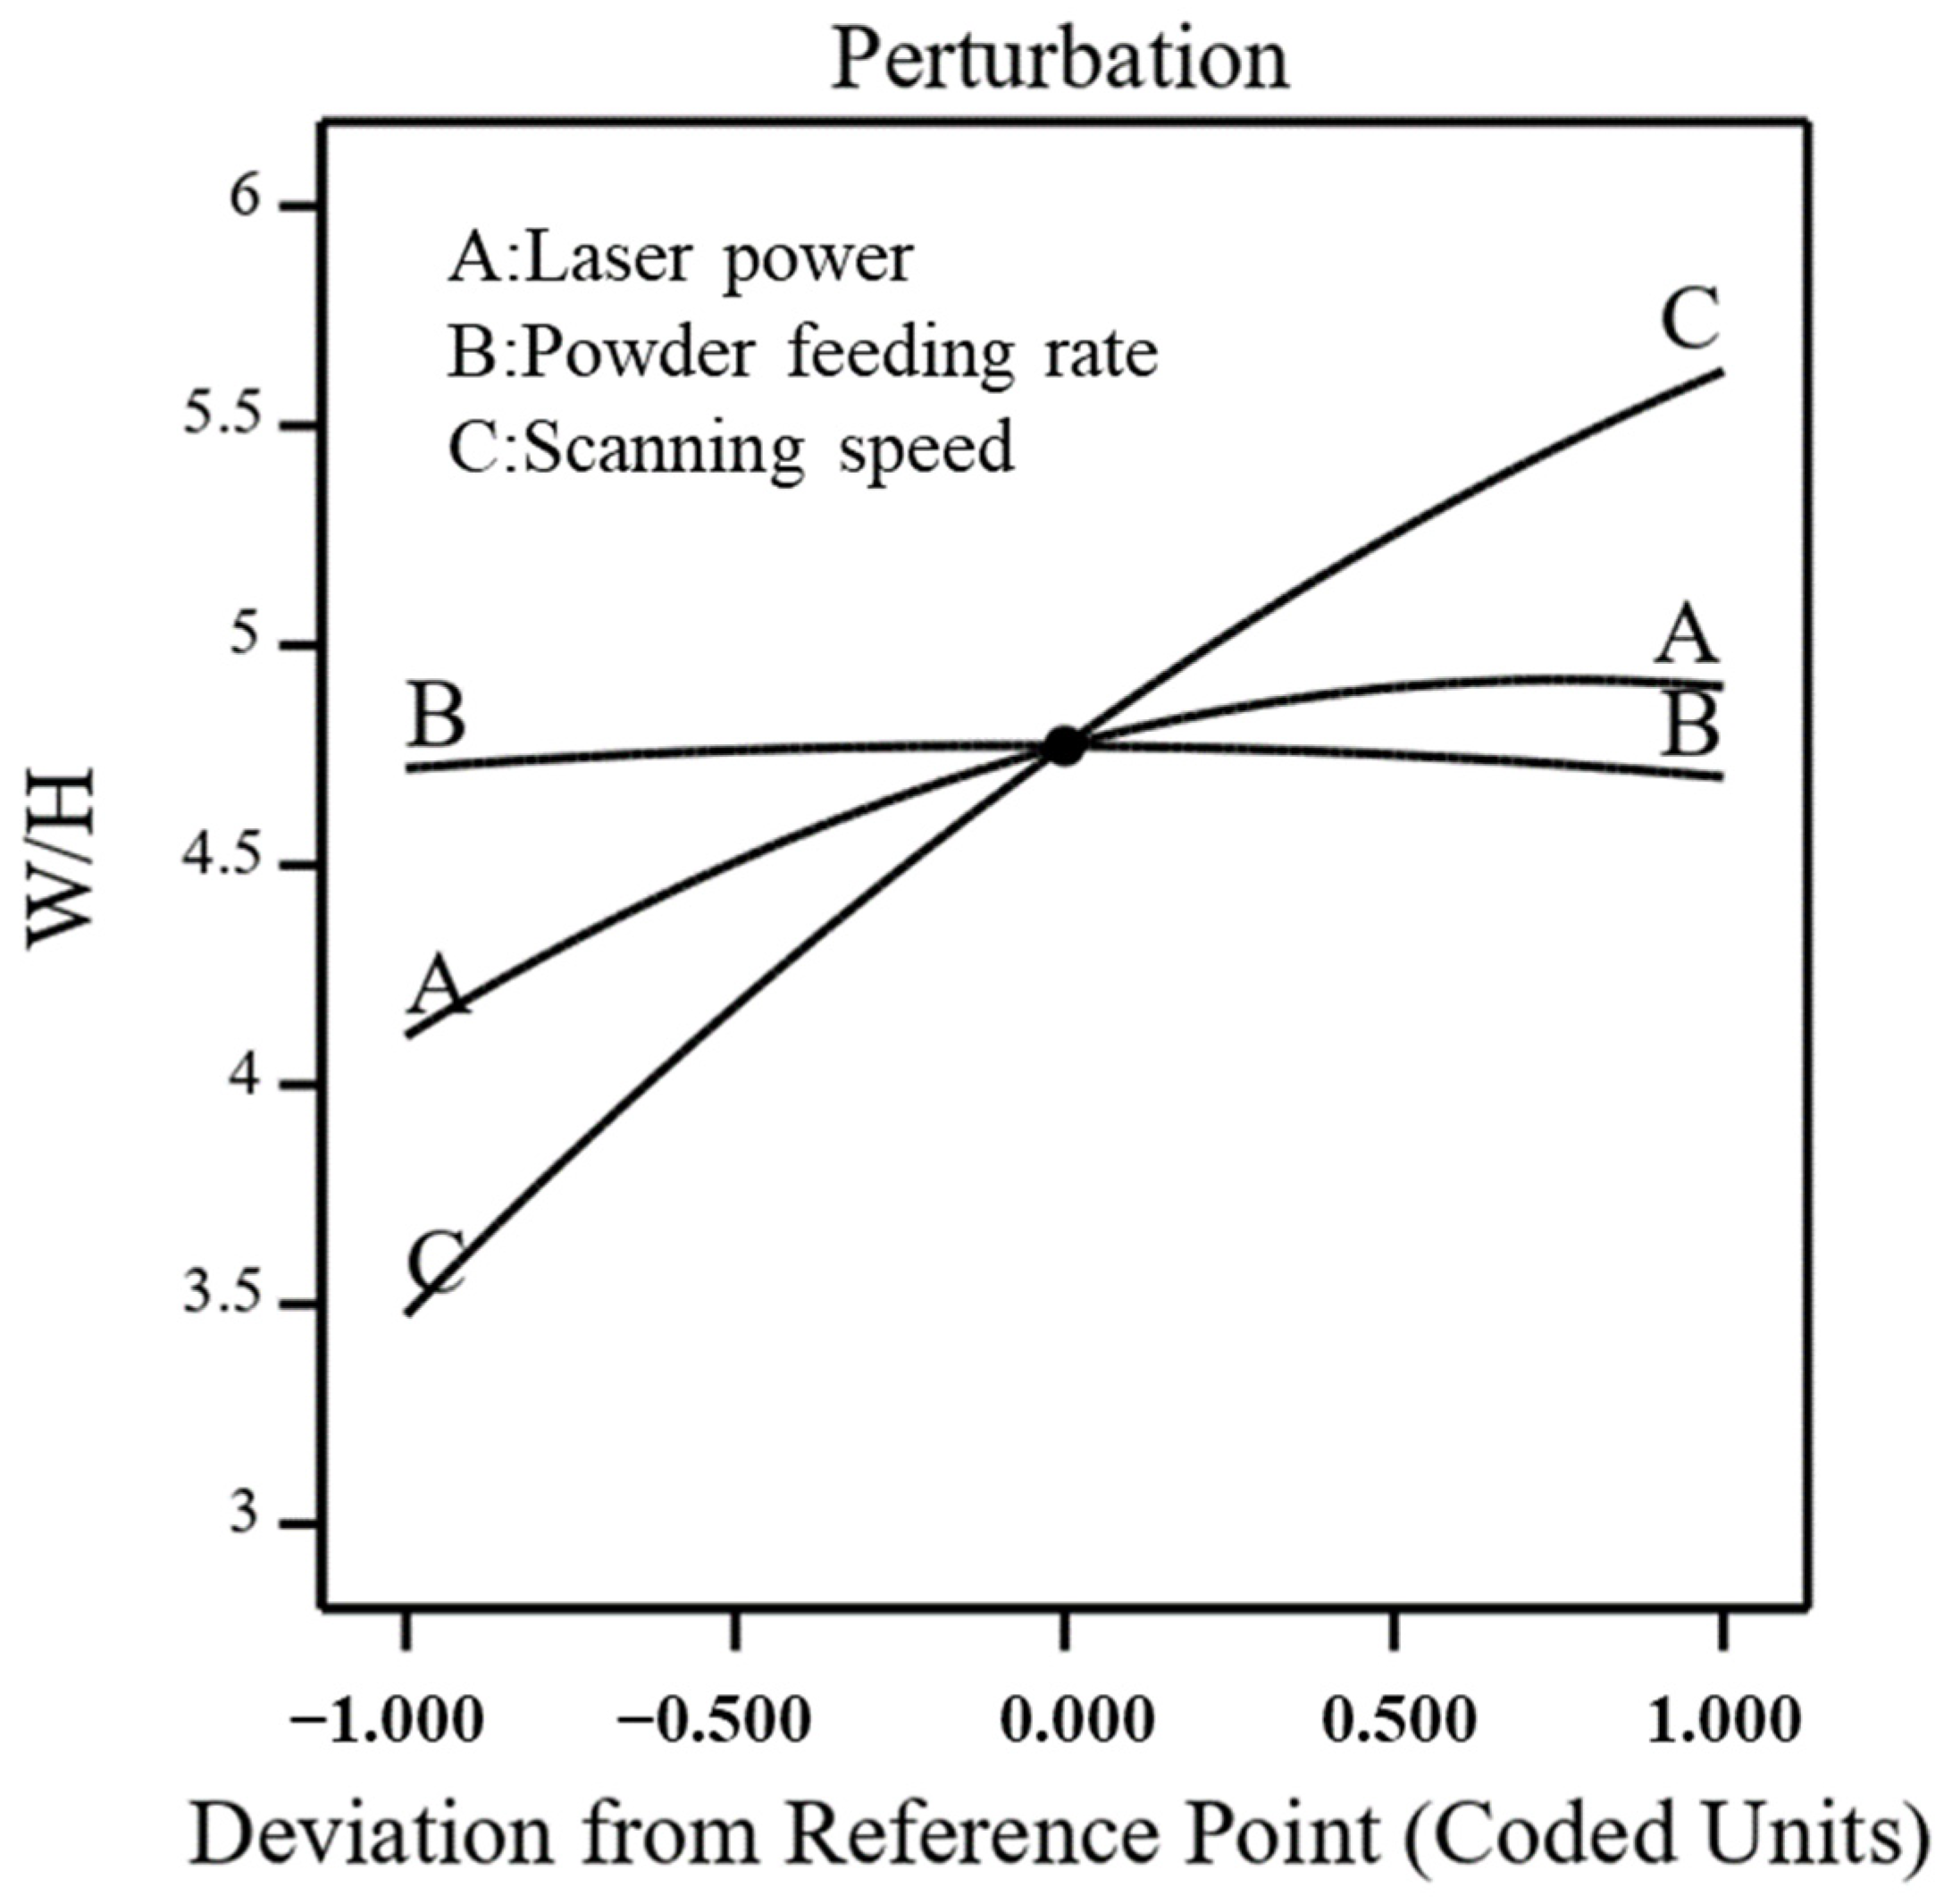
3.2.2. Influence of Various Factors on Cladding Layer W/H

The perturbation plot shown in Figure 7 compares the influence of the process parameters on the W/H. It can be seen that the W/H increased with the increase in the laser power and scanning speed. Within the selected laser power range, the higher the laser power, the higher the fluidity of the molten pool. The surface tension of liquid metal cannot restrain its gravity, so the molten pool will flow down along both sides, and the molten pool will become wider. However, the melt height remained relatively constant, so the W/H became larger. With the increase in the scanning speed, the energy received in the unit area and the powder fed into the unit area were reduced, so the fluidity and the melting width were reduced. The reduction of powder also reduced the melting height. Because the melting width is mainly restricted by the laser spot size, the melting height is not controlled by this system. The melting width decreased slower than the melting height. Therefore, the W/H increased with the increase in the scanning rate. In addition, it can be observed that the influence of the powder feeding rate on the W/H was very small.
The W/H reflects the quality of the coating. When it is greater than 3 [22], good metallurgical bonding can be formed between the coating and the substrate. It can be clearly seen in Figure 8a,b that when the power feeding rate is kept at a level of zero, the interaction between higher laser power and scanning speed will lead to a greater W/H. Figure 8c,d describes the effects of the interaction between the powder feeding rate and the scanning speed on the W/H. Obviously, increasing the scanning speed will increase the W/H.
Figure 9a,b shows the distribution of the residual error of the W/H and the corresponding relationship between the predicted data and the actual data. It can be seen in Figure 8 that the residual error of the experimental group is basically distributed in the same straight line or nearby, indicating that the model has a good fit. Figure 9b shows that the actual values are basically on or around the y = X-ray property function graph, indicating that the errors between the actual values of the experimental group and the predicted data of the model are small, which proves that the prediction accuracy of the model is high. The results show that the model can well reveal the relationship between the cladding process parameters and the W/H.

3.3. Analysis of the Contact Angle

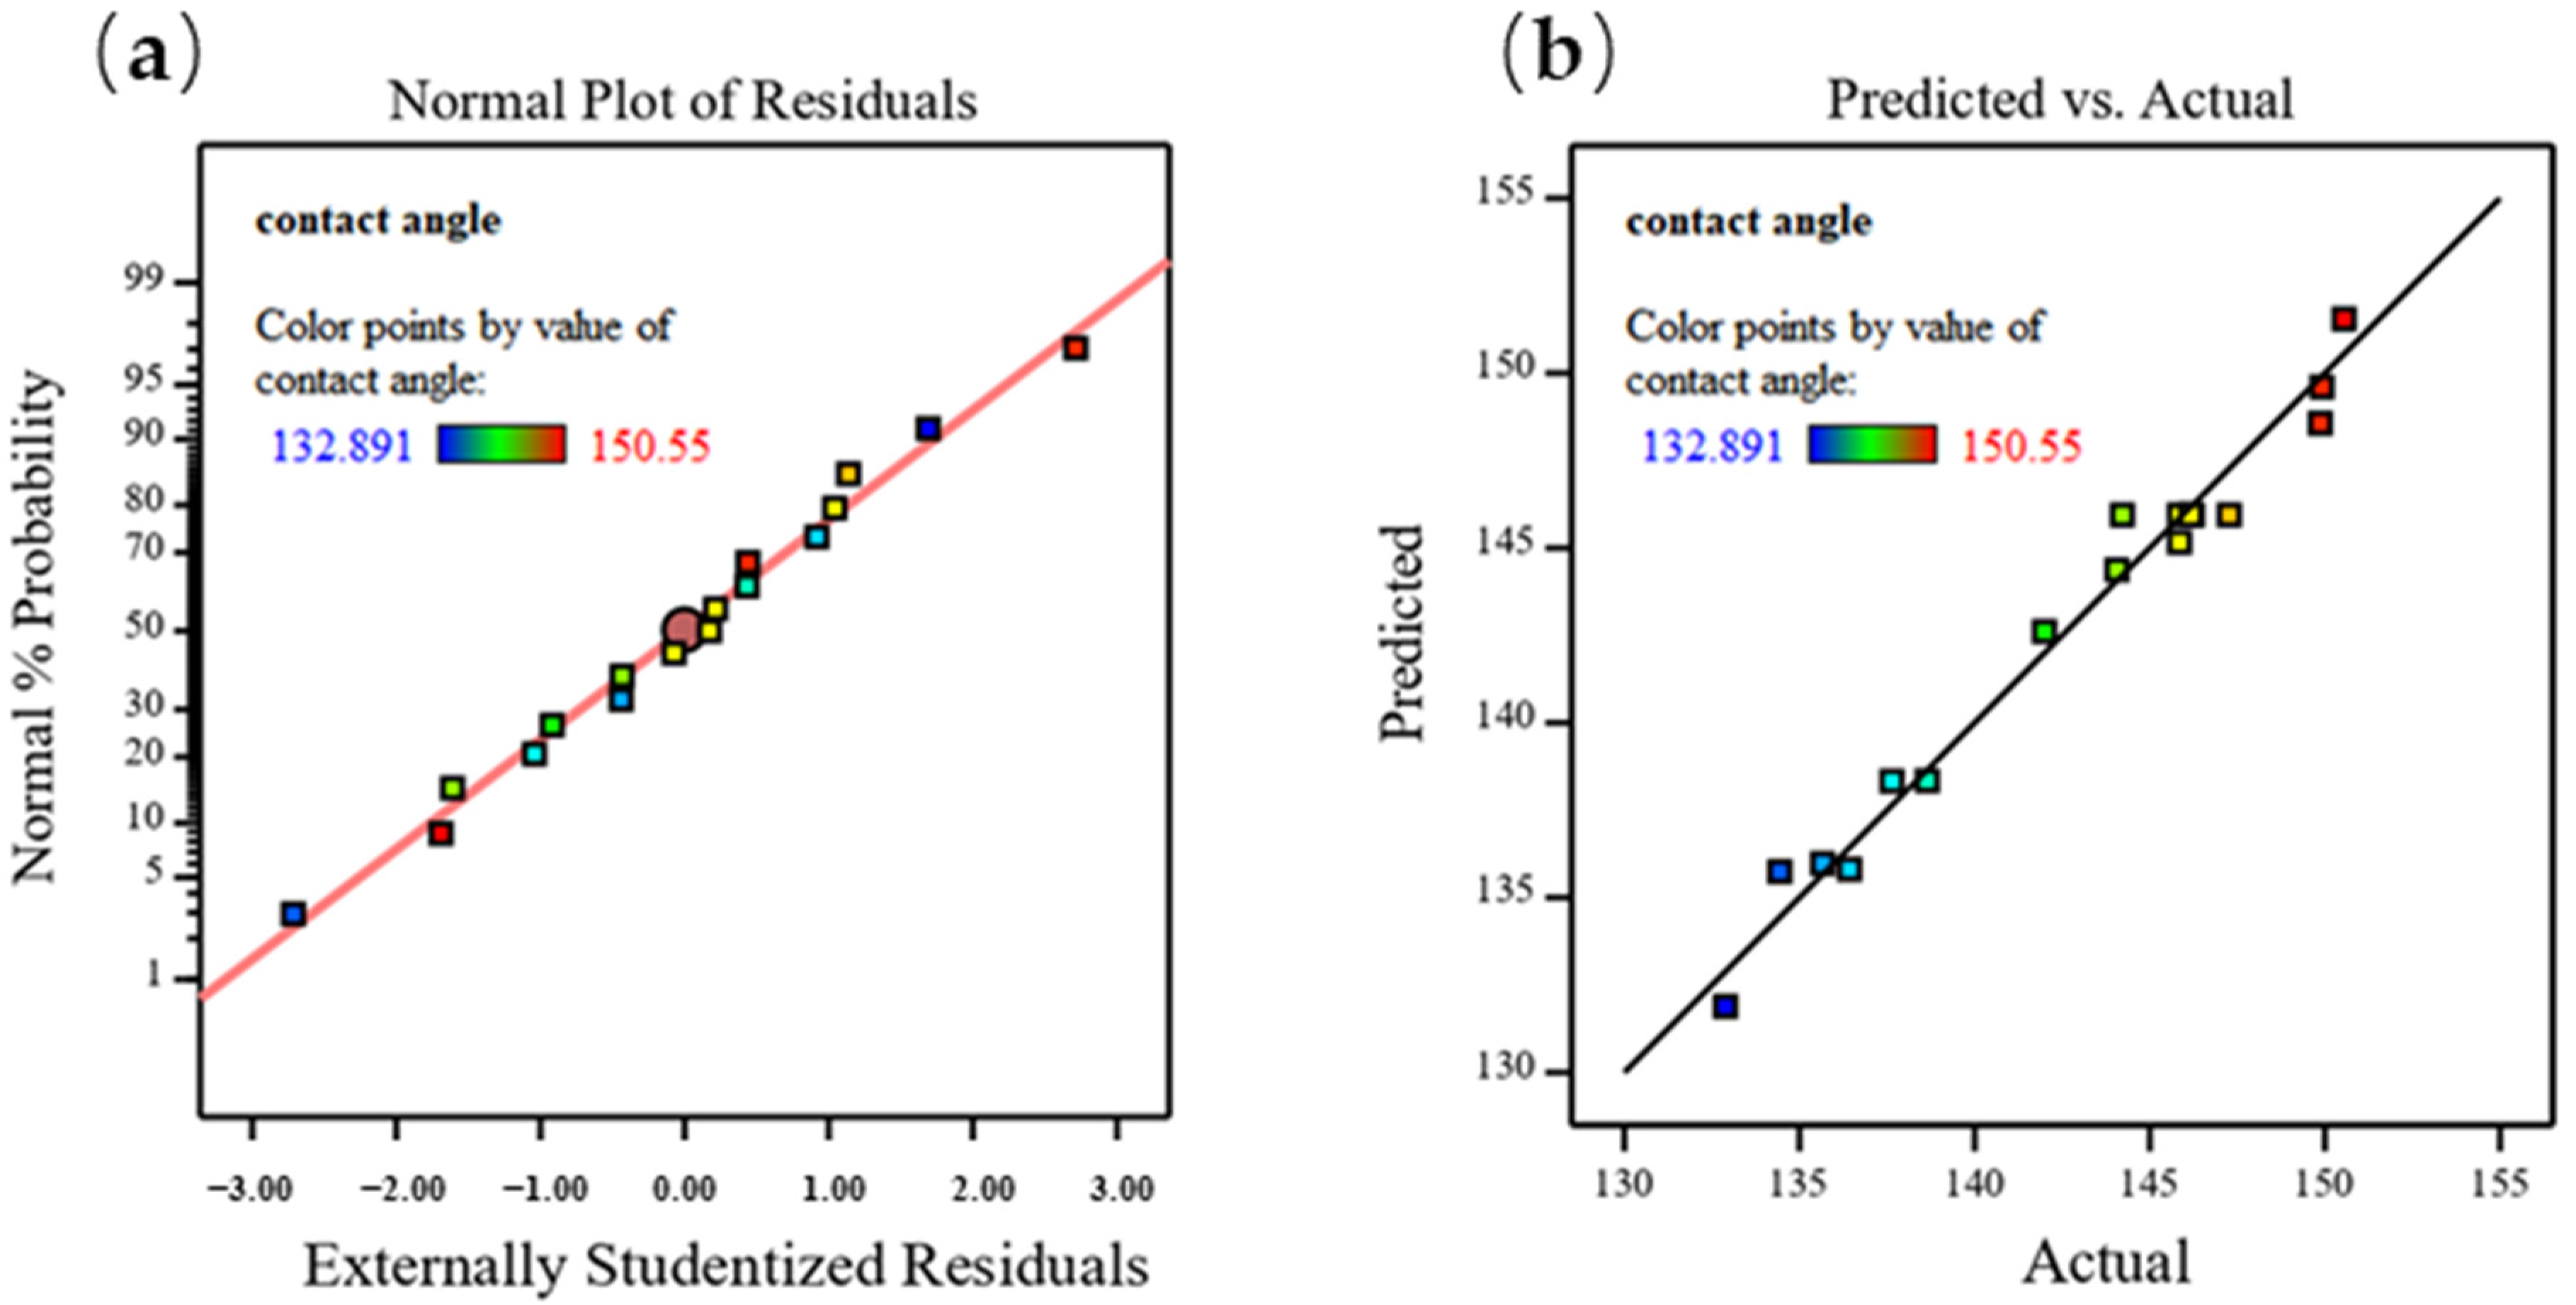
3.3.1. Variance Analysis for Cladding Layer Contact Angle

Table 7 shows the variance analysis of the contact angle. The F value is 32.59 and the p value is less than 0.0001, indicating that the corresponding model is significant. The p value of the lack of fit is 0.2496, indicating that the fitting accuracy of the established model is high. The ratio of effective signal to noise is greater than 4, indicating that the model has a high identification rate. The difference between the predicted R2 and adjusted R2 is less than 0.2. Similar to the W/H, the scanning speed has a great influence on the contact angle. Finally, the fitting regression equation of the contact angle model is shown in Equation (5).
θ = 145.95 + 3.22 × A + 6.61 × C 3.2 × A 2 2.28 × C 2

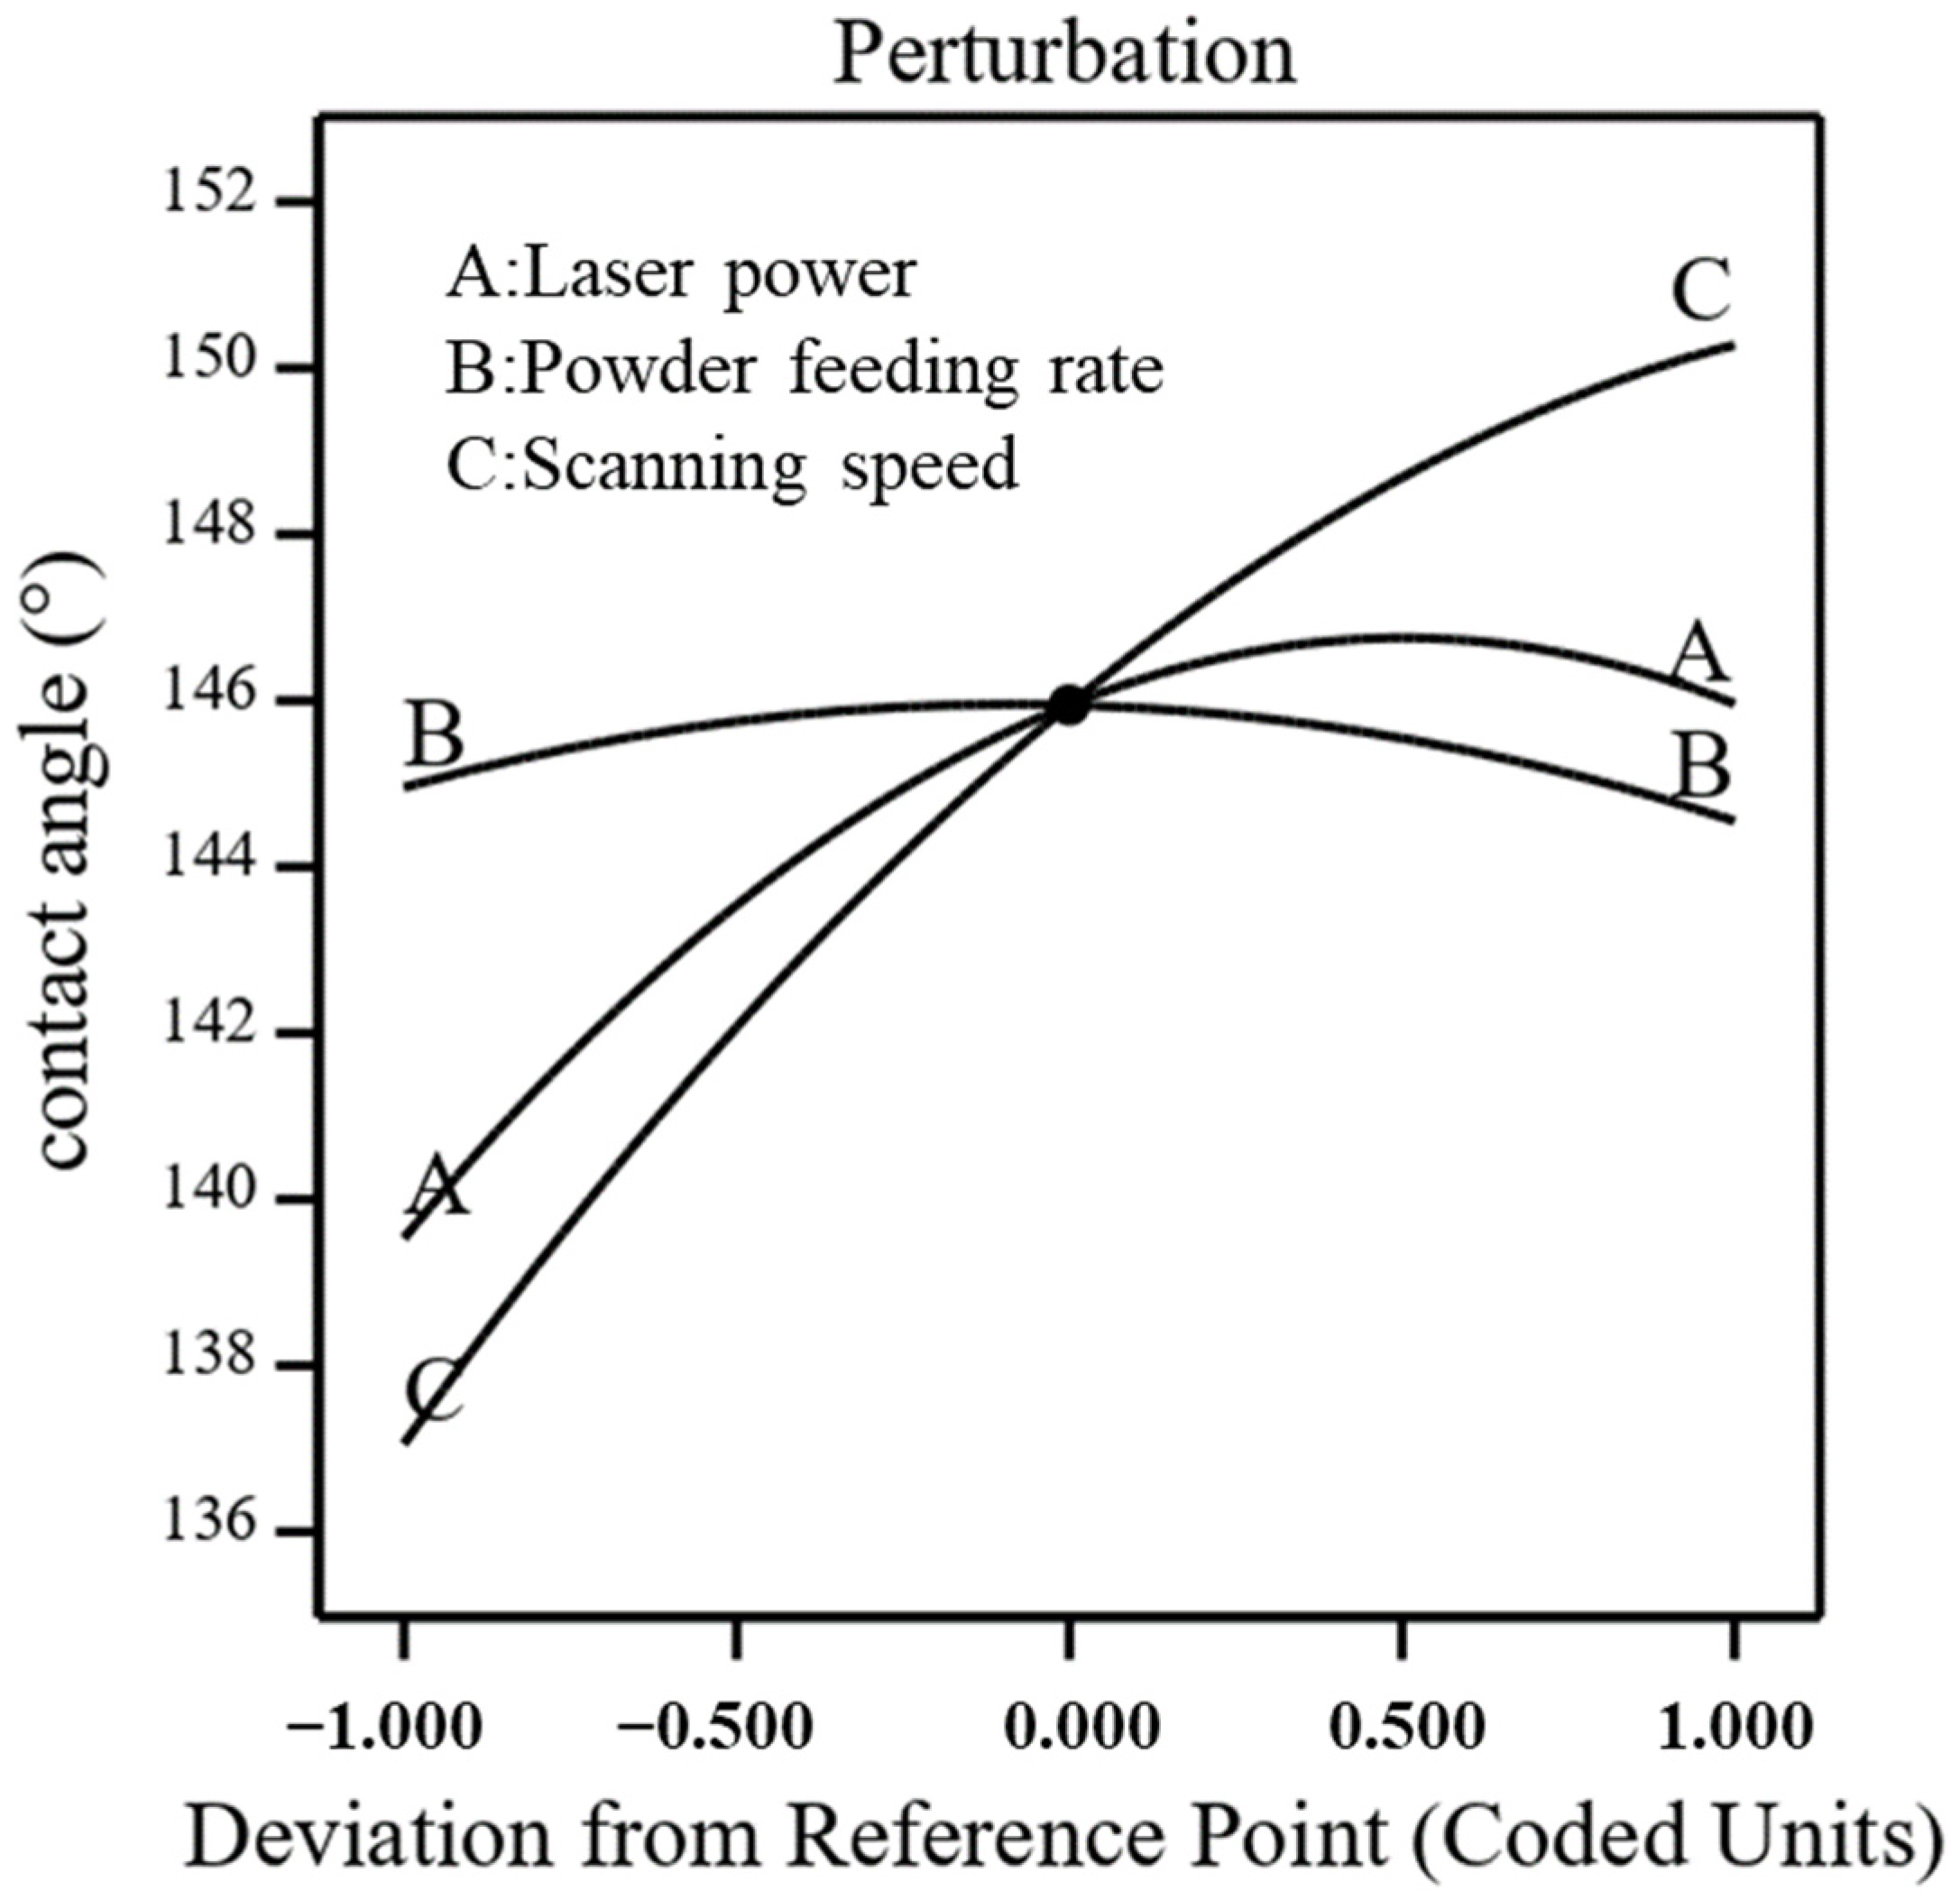
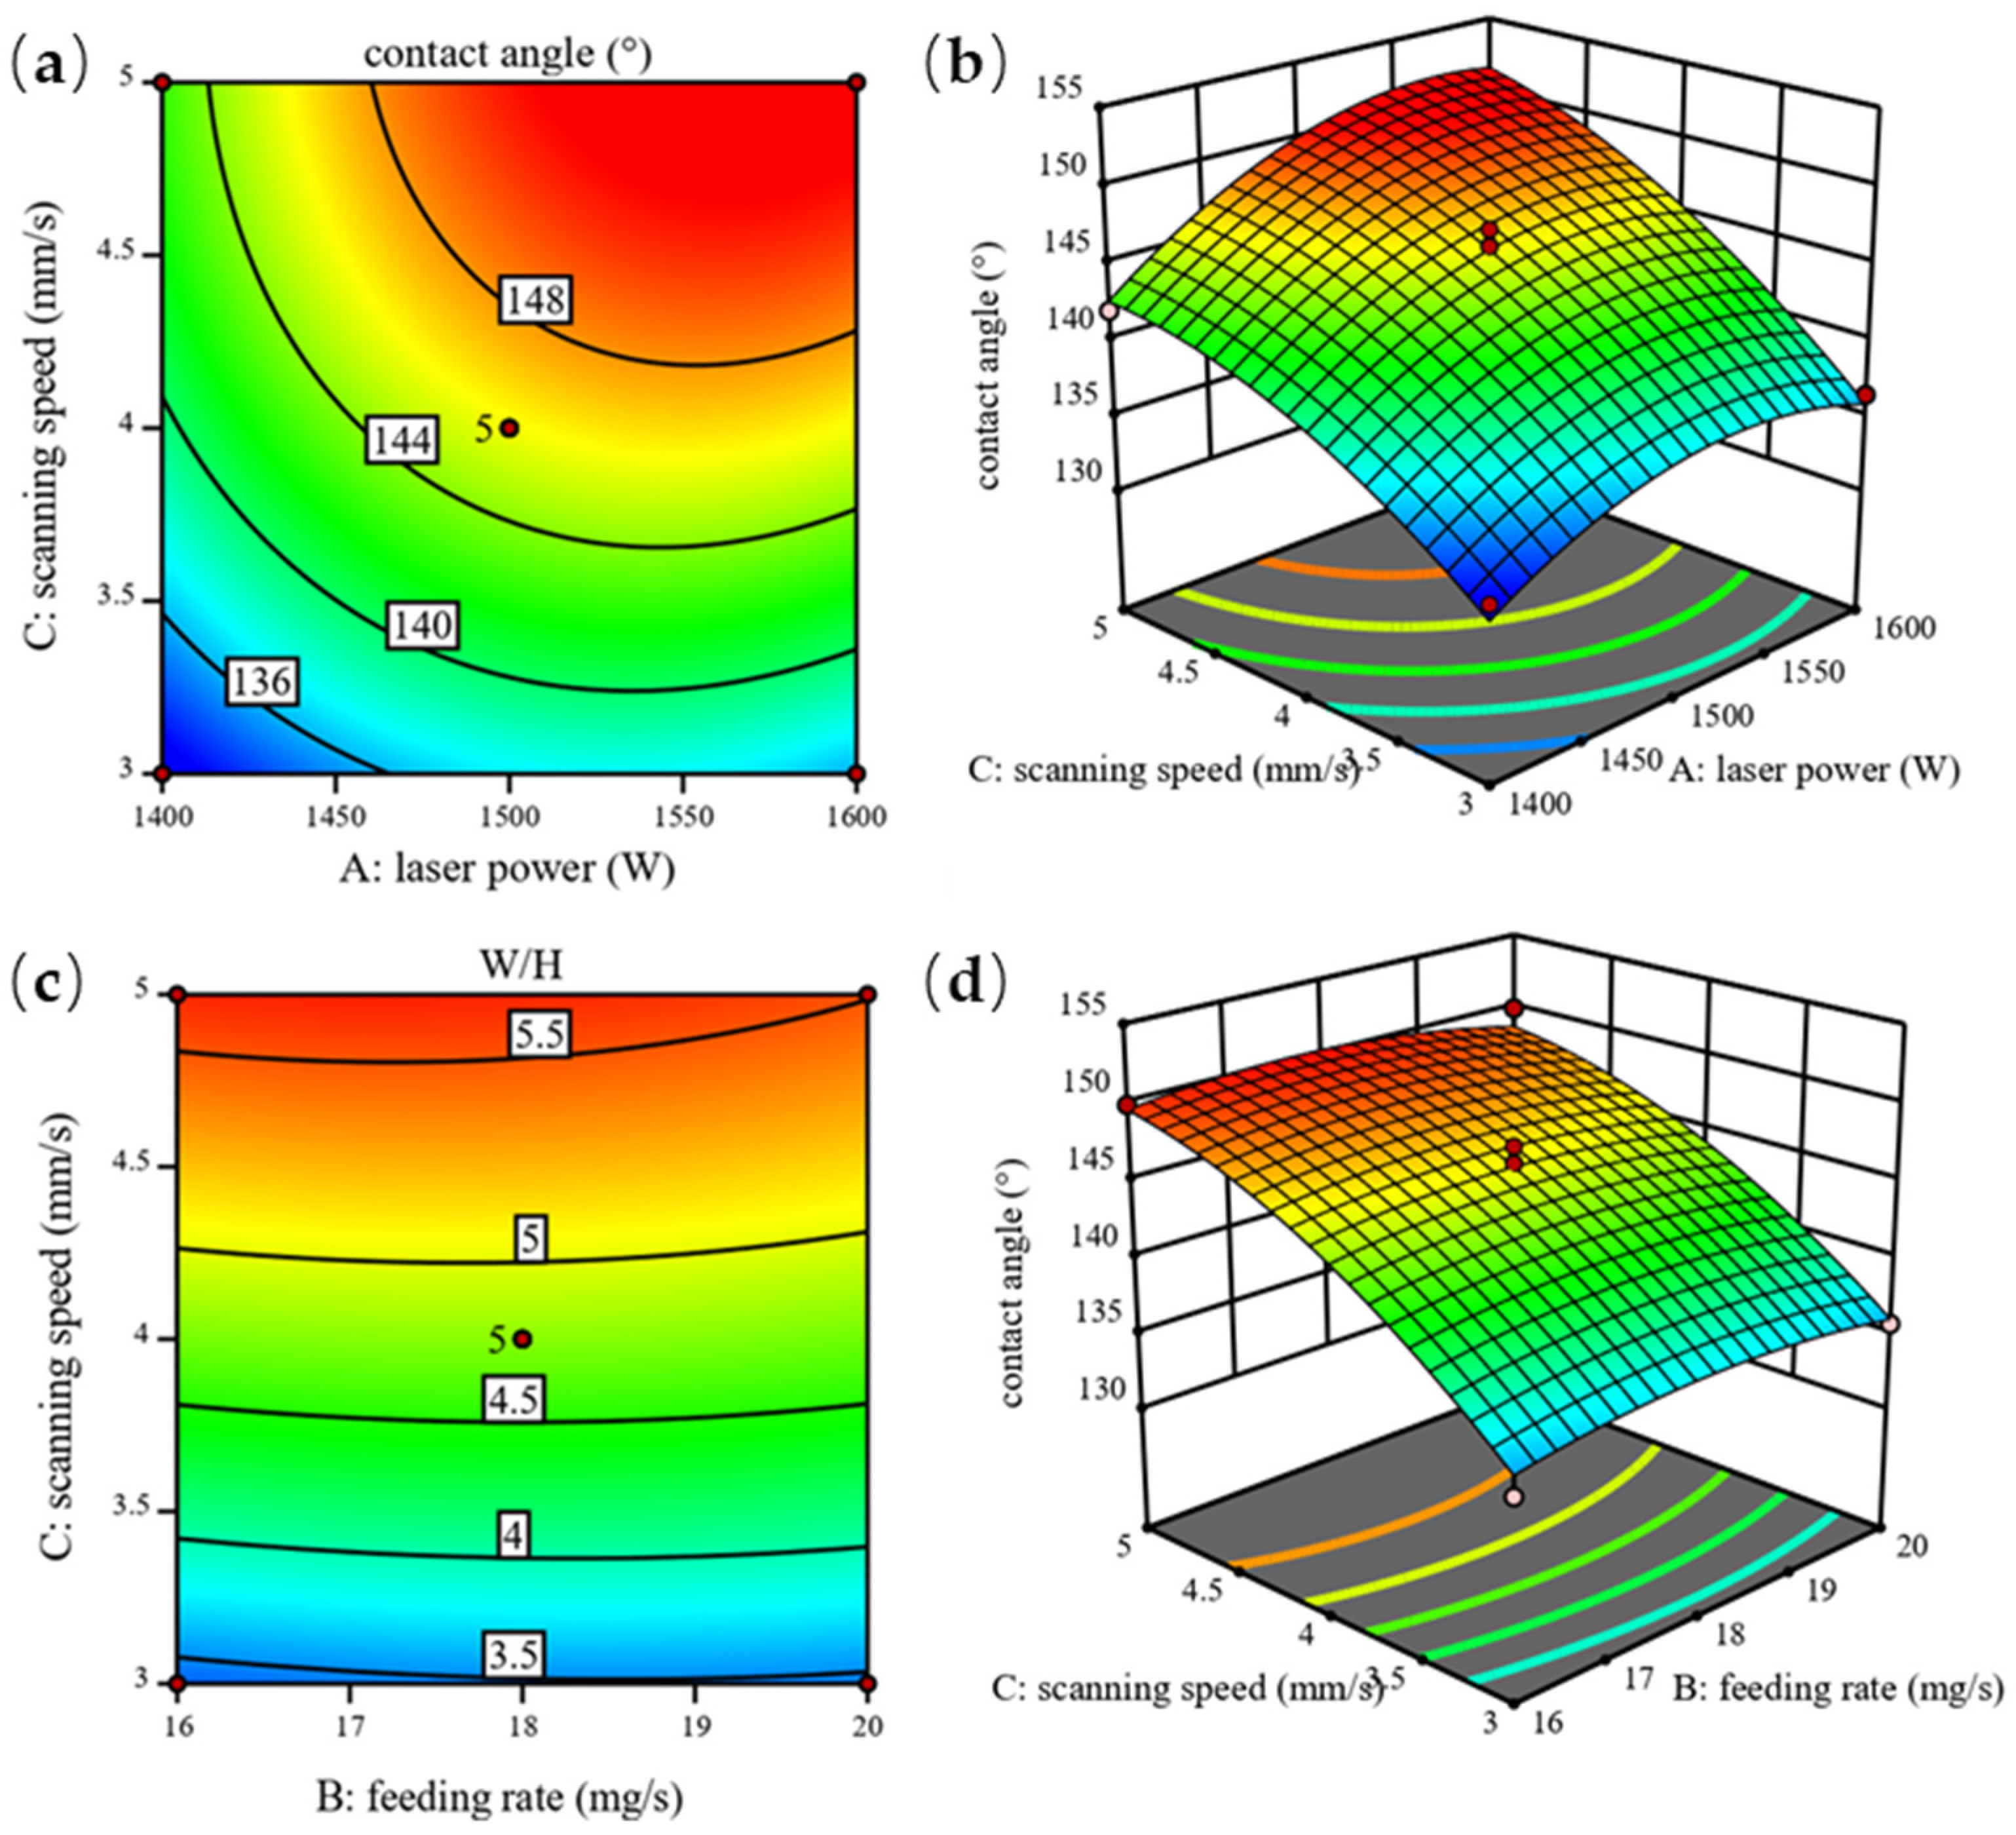
3.3.2. Influence of Various Factors on Cladding Layer Contact Angle

Figure 10 is a perturbation diagram of the influence of the process parameters on the contact angle. It can be seen that the contact angle increased with the increase in the laser power. As the power increased, the temperature of the molten pool increased. The high temperature in the molten pool reduced the viscosity of the liquid metal, resulting in a decrease in the height of the cladding layer. Therefore, the contact angle increased. With the increasing scanning speed, the contact angle displays an upward trend. When the scanning speed increased, the laser action time per unit time decreased. The cooling rate of the molten pool increased, and the internal convection action time became shorter, which slowed down the flow trend in the upper half of the molten pool, thus increasing the contact angle. Similar to the W/H, the effect of the powder feeding rate on the contact angle was not significant.
The contact angle reflects the wettability of the coating. The research shows that the contact angle should be 120–150°. Otherwise, a gap will form between each track. Figure 11a,b shows that a larger contact angle can be obtained by increasing the scanning speed and appropriately increasing the laser power. From Figure 11c,d, it can be seen that increasing the scanning speed can obtain a large contact angle.
Figure 12a is a normal graph of the residuals of the contact angle. The data points in the figure are close to the fitting line, which reflects that the predicted data are close to the actual data. The response value model obtained through verification has certain accuracy. Figure 12b shows the corresponding predicted data and actual data, indicating that the model has high prediction accuracy.

3.4. Test Verification and Process Parameter Optimization

Based on RSM, the morphology of the single-pass cladding layer selected in this paper was optimized according to the multi-response satisfaction function method. The satisfaction function method is also called the craving function method. It transforms each response into individual satisfaction on the interval by introducing the satisfaction function. If the response is exactly equal to its target value, then di = 1; If the response exceeds its specification range, then di = 0. Derringer and Suich provided a more reasonable polynomial satisfaction function that has been widely used, and the single indicator satisfaction function is as follows [23]:
d i ( Y i ) = { 1   i f   Y i     L i Y i Y i , max L i Y i , max   i f   L i Y i   Y i , max   0   i f   Y i   Y i , max
d i ( Y i ) = { 1   i f   Y i   Y i , max Y i Y i Y i , max L i   i f   Y i Y i   Y i , max 0   i f   Y i     L i
where di is the satisfaction function, Li is the lower limit of response, Yi,max is the upper limit of response, and Yi is the response value. The dilution ratio is calculated by Equation (6); the smaller the response value, the higher the satisfaction. The aspect ratio and contact angle are calculated by Equation (7); the greater the response value, the higher the satisfaction. Then, a multi-objective satisfaction function is established according to the following Equation (8) [24].
Desirability = [ i = 1 n d i r i ] 1 / r i
where di is the satisfaction function for each predicted response, n is the number of responses, and ri is the weight of the response.
Table 8 shows the conditions and targets of optimization. The processing parameters of all significance levels were assigned the default value of 3. The dilution ratio is a very important factor to evaluate the performance of a coating. The mixing of molten substrate will cause a change in the composition of the cladding alloy, which will destroy the good performance of the coating. Therefore, the dilution ratio was reduced and its weight was set to 5. The contact angle reflects the wettability. The larger the contact angle, the better the liquid fluidity and the easier it is to obtain a smooth cladding layer. Therefore, its weight was set to 4. The optimization goals were a smaller dilution ratio, a larger aspect ratio, and a larger contact angle.
The optimized process parameters were selected as follows: the laser power, scanning speed, and powder feeding rate were 1477 W, 5 mm/s, and 17.5 mg/s, respectively. The comparison between the predicted optimization results and actual results is shown in Table 9. The errors of the dilution ratio, W/H, and contact angle were all less than 10%.

3.5. Microstructures of Coatings

Figure 13 shows the microstructure of the coating with the best process parameters. The results show that the quality of the whole coating is good; no cracks, deformation, pores, or other defects were found.
The temperature gradient (G) and solidification rate (R) play very important roles in the formation of the microstructure of a coating. The G/R ratio determines the morphology, and the G*R (cooling rate) determines the size of the grain [25]. Figure 13b–d shows SEM images of the microstructure of different zones of the coating. Because the top of the cladding was in contact with air, the cooling rate was fast, and equiaxed crystals were formed. The cooling rate in the middle of the coating was slower, and the cellular crystals transformed into cellular dendrites. Due to the thermal conduction of the substrate, the temperature gradient at the interface between the cladding layer and the substrate was large, so coarse columnar crystals formed at the bottom of the coating.
Figure 13e shows the microstructure of the bonding zone. It can be clearly seen that there is a bright bonding zone. Due to the convection mass transfer effect in the molten pool during cladding, the molten pool was fully stirred, so that the molten pool solidified along the reverse heat flow direction, with the heat-affected zone in a non-uniform nucleation position, forming a white bright structure. There was sufficient component diffusion between the Ni-based alloy powder and the molten substrate surface due to the molten pool stirring, forming a metallurgical bond.
Figure 14 shows the XRD pattern of the Ni60PTA coating. The results of the XRD pattern analysis show that the Ni60PTA coating mainly comprises a γ-(Ni) solid solution composed of FeNi3, M (M = Fe, Ni, Cr)23C6, M7C3, and CrB.
It can be observed in Figure 13b–d that black hard phases with different shapes, such as granular and massive, are dispersed on the gray-white matrix in the structure of the Ni60PTA cladding layer. In order to determine the composition of the A1, A2, and A3 phases in Figure 13c, energy spectrum analysis was first carried out on the coating. Figure 15 displays the element distribution map of the Ni-based laser cladding layer determined by EDS surface scanning. It can be concluded that the structure of the coating is rich with a large amount of Cr. In addition, the structures with brighter colors are rich with large amounts of Ni and Fe. In order to determine the mass percentages of different elements in each phase, the EDS point energy spectrum test was further carried out for the three phase structures.
Figure 16 shows the EDS analysis of points A1, A2, and A3 respectively. The cellular dendrites marked as A1 had a high content of Ni, so it was determined as γ(Ni) solid solution. Ni and γ(Fe) both have a face-centered cubic lattice structure and can be infinitely miscible with each other. In the melt pool, Ni preferentially formed a solid solution crystal nucleus on the surface of γ(Fe), and the crystal nucleus continuously absorbed a large number of Ni atoms from the melt pool in a melt state to form a γ(Ni) solid solution. The black hard phase marked as A2 had high Cr and B elements, as well as a certain amount of Fe, Ni, and C. It can be concluded that the black hard phases were M32C6, M7C3, and CrB. The γ(Ni) solid solution existed in the cladding layer as the matrix phase. With the progress of the solidification process, a large amount of Ni was absorbed and gradually decreased. Fe, Ni, and Cr have a certain affinity with C, B, and other elements, and gradually formed CrB, M23C6, and M7C3 hard phases. Network eutectic structures marked with A3 were distributed around the Ni-based matrix, and they can be recognized as NieBeSi eutectic [26].

3.6. Microhardness of Coatings

Figure 17 shows the change in microhardness along the depth gradient of the Ni60PTA coating. The average microhardness of the cladding layer (620 HV0.2) is about three times that of 45 steel (200 HV0.2). The increase in hardness was due to the existence of the hard ceramic phase (CrB). These hard phases were distributed in the γ Ni solid solution, and the hardness of the coating was significantly improved by dispersion strengthening. The hardness from the top of the coating to the substrate interface shows a downward trend. This phenomenon is called the “graded” feature [27]. Compared to the Ni-based matrix, ceramic particles have low density and a high melting point. Ceramic particles accumulate more densely near the upper surface of the coating, which causes this phenomenon [28]. The transition from the higher hardness value of the cladding layer to the lower hardness value of the substrate presents a smooth gradient, which is due to the existence of the bonding zone (B) and the heat-affected zone (C) between the cladding layer and the substrate. Due to the transformation of the substrate surface [29], the hardness value of the heat-affected zone is higher than the initial hardness value of the substrate.

4. Conclusions

The influence of the process parameters (dilution ratio, ratio of layer width to height, and contact angle) on the morphology of the composite cladding layer were analyzed based on RSM. The mathematical models of the process parameters and the dilution ratio, ratio of layer width to height, and contact angle of the cladding layer were established, providing a theoretical basis for the prediction and control of the forming quality of the cladding layer. The main conclusions are as follows:
(1)
Variance analysis showed that the laser power had the greatest influence on the dilution ratio, and the scanning speed was the most significant factor affecting the W/H and the contact angle.
(2)
The target value and significance of the response index were set using Design Expert software based on RSM. The optimal combination of process parameters included a laser power of 1477 W, a powder feeding rate of 17.5 mg/s, and a scanning speed of 5 mm/s. The errors between the predicted data and the experimental data were all less than 10%. The cladding layer obtained under the optimal parameters had good quality with a low dilution ratio and a large W/H and contact angle.
(3)
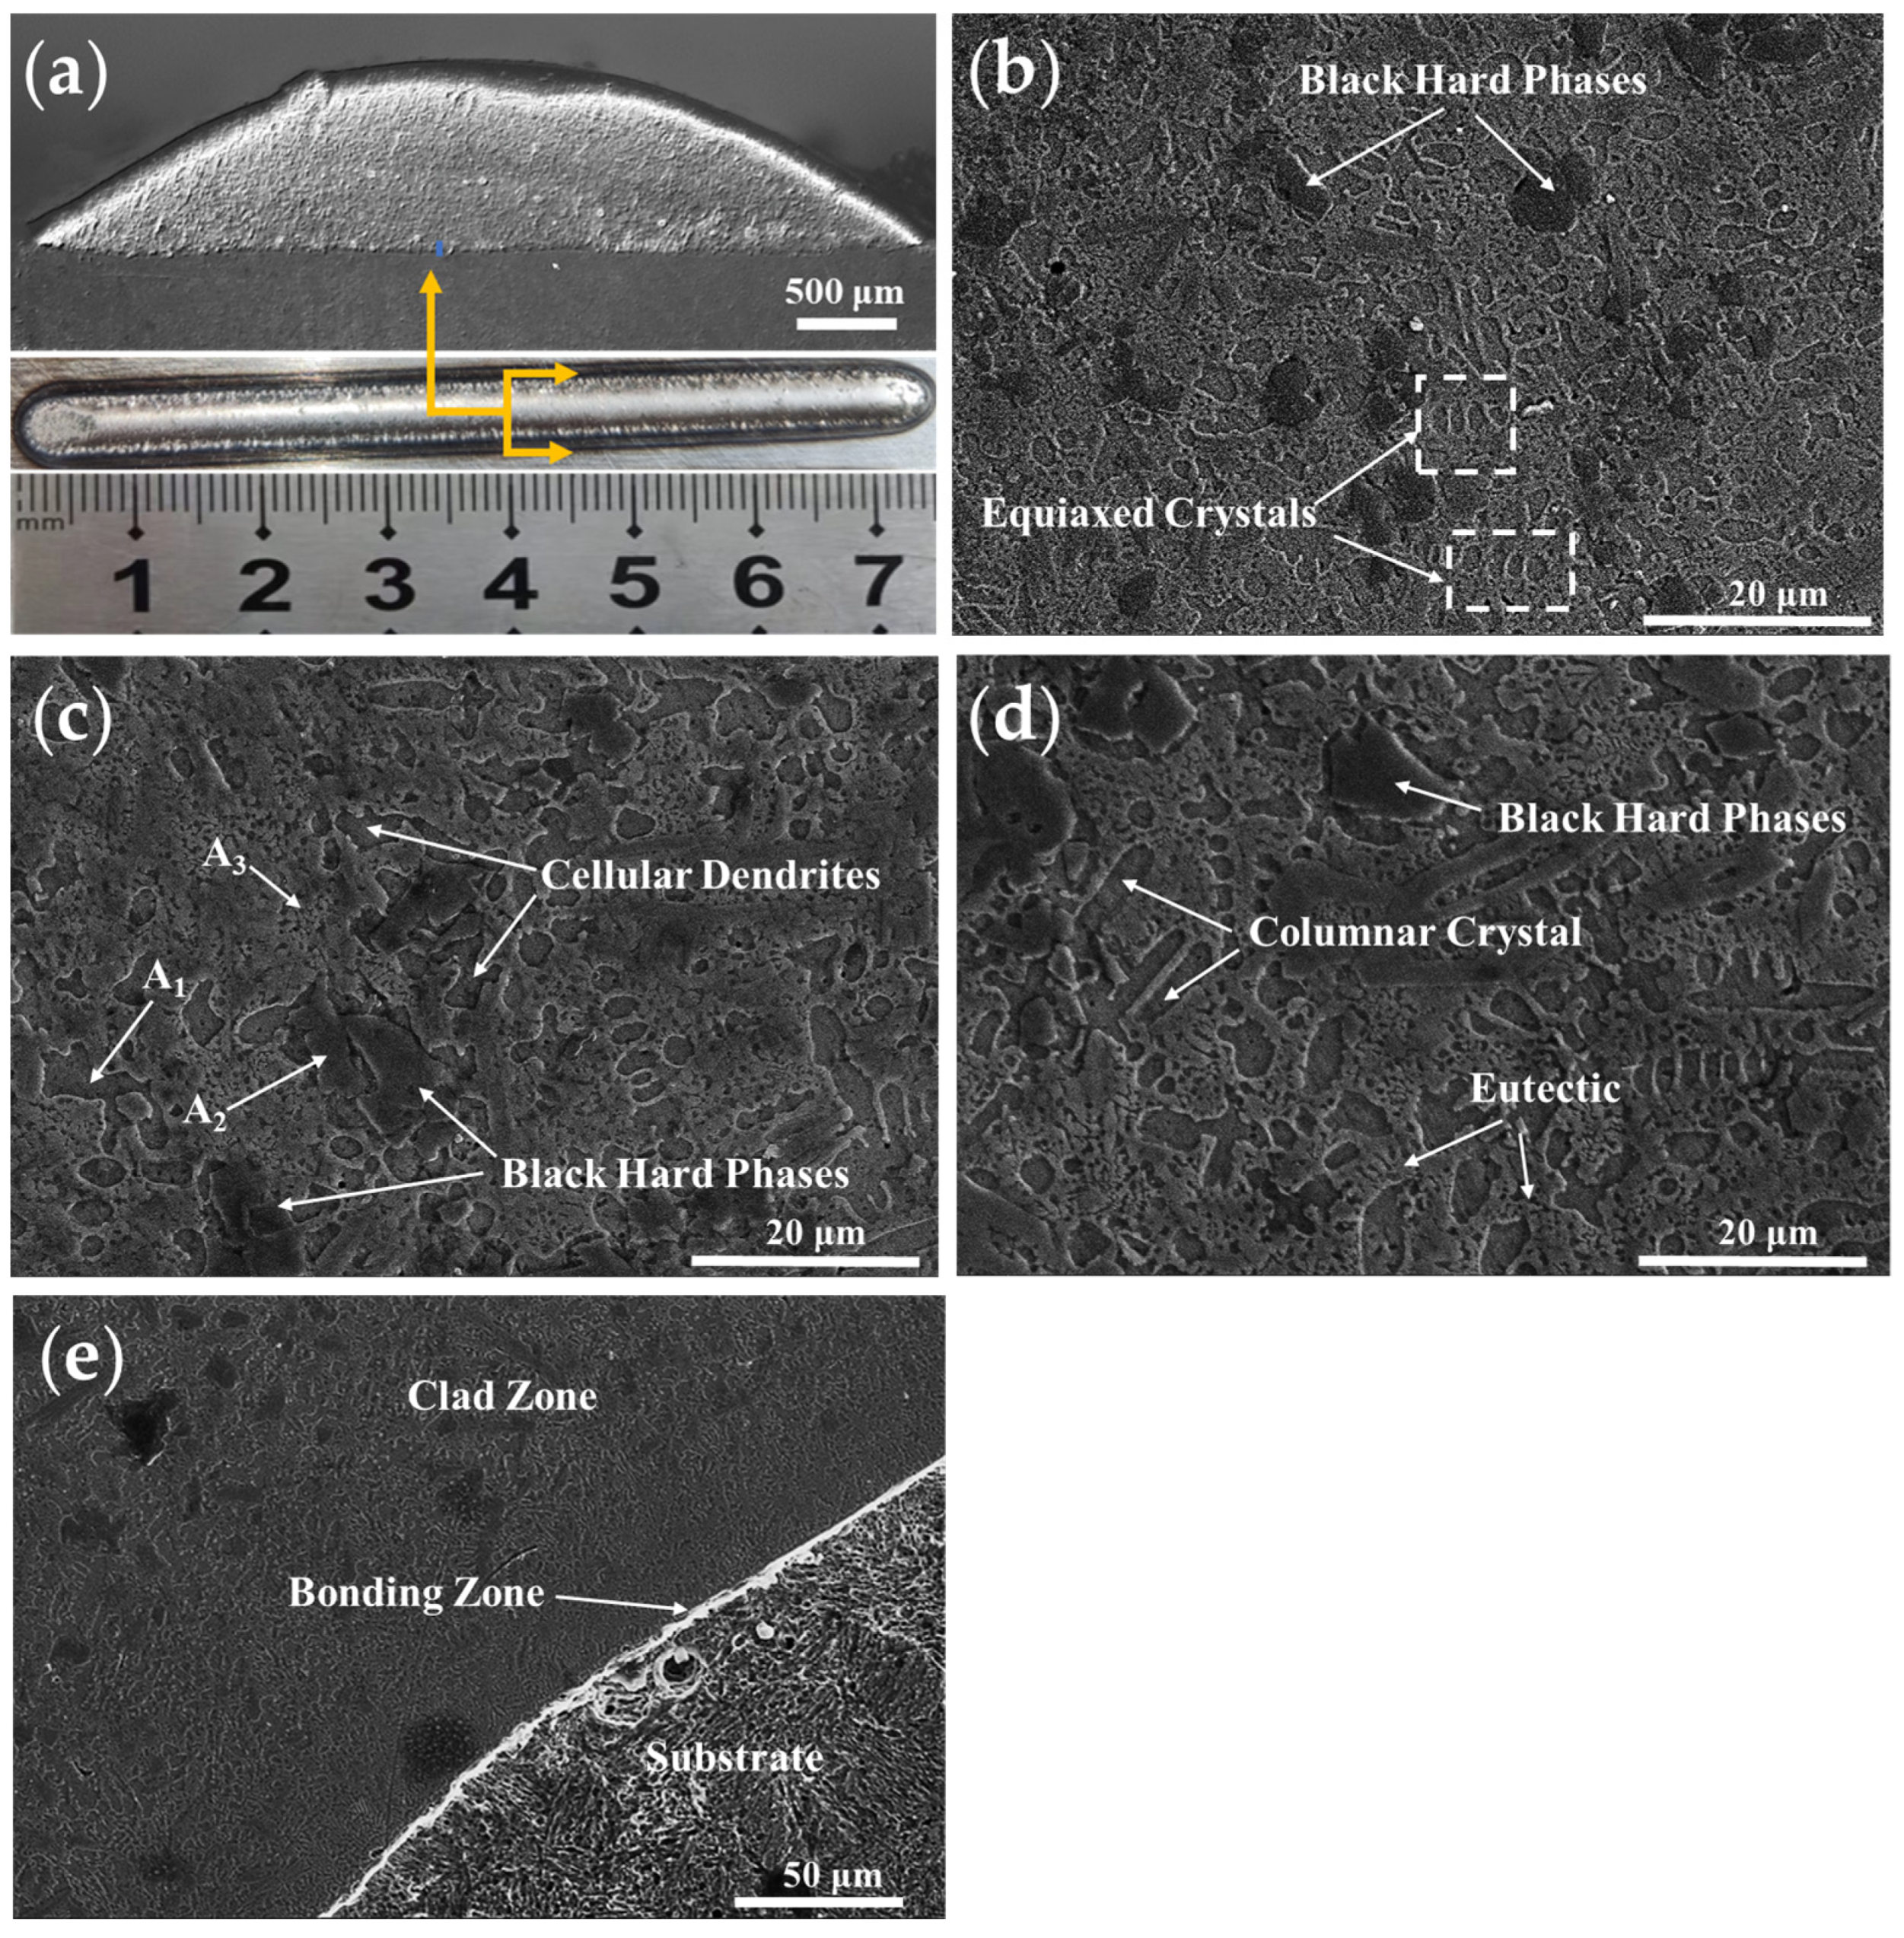
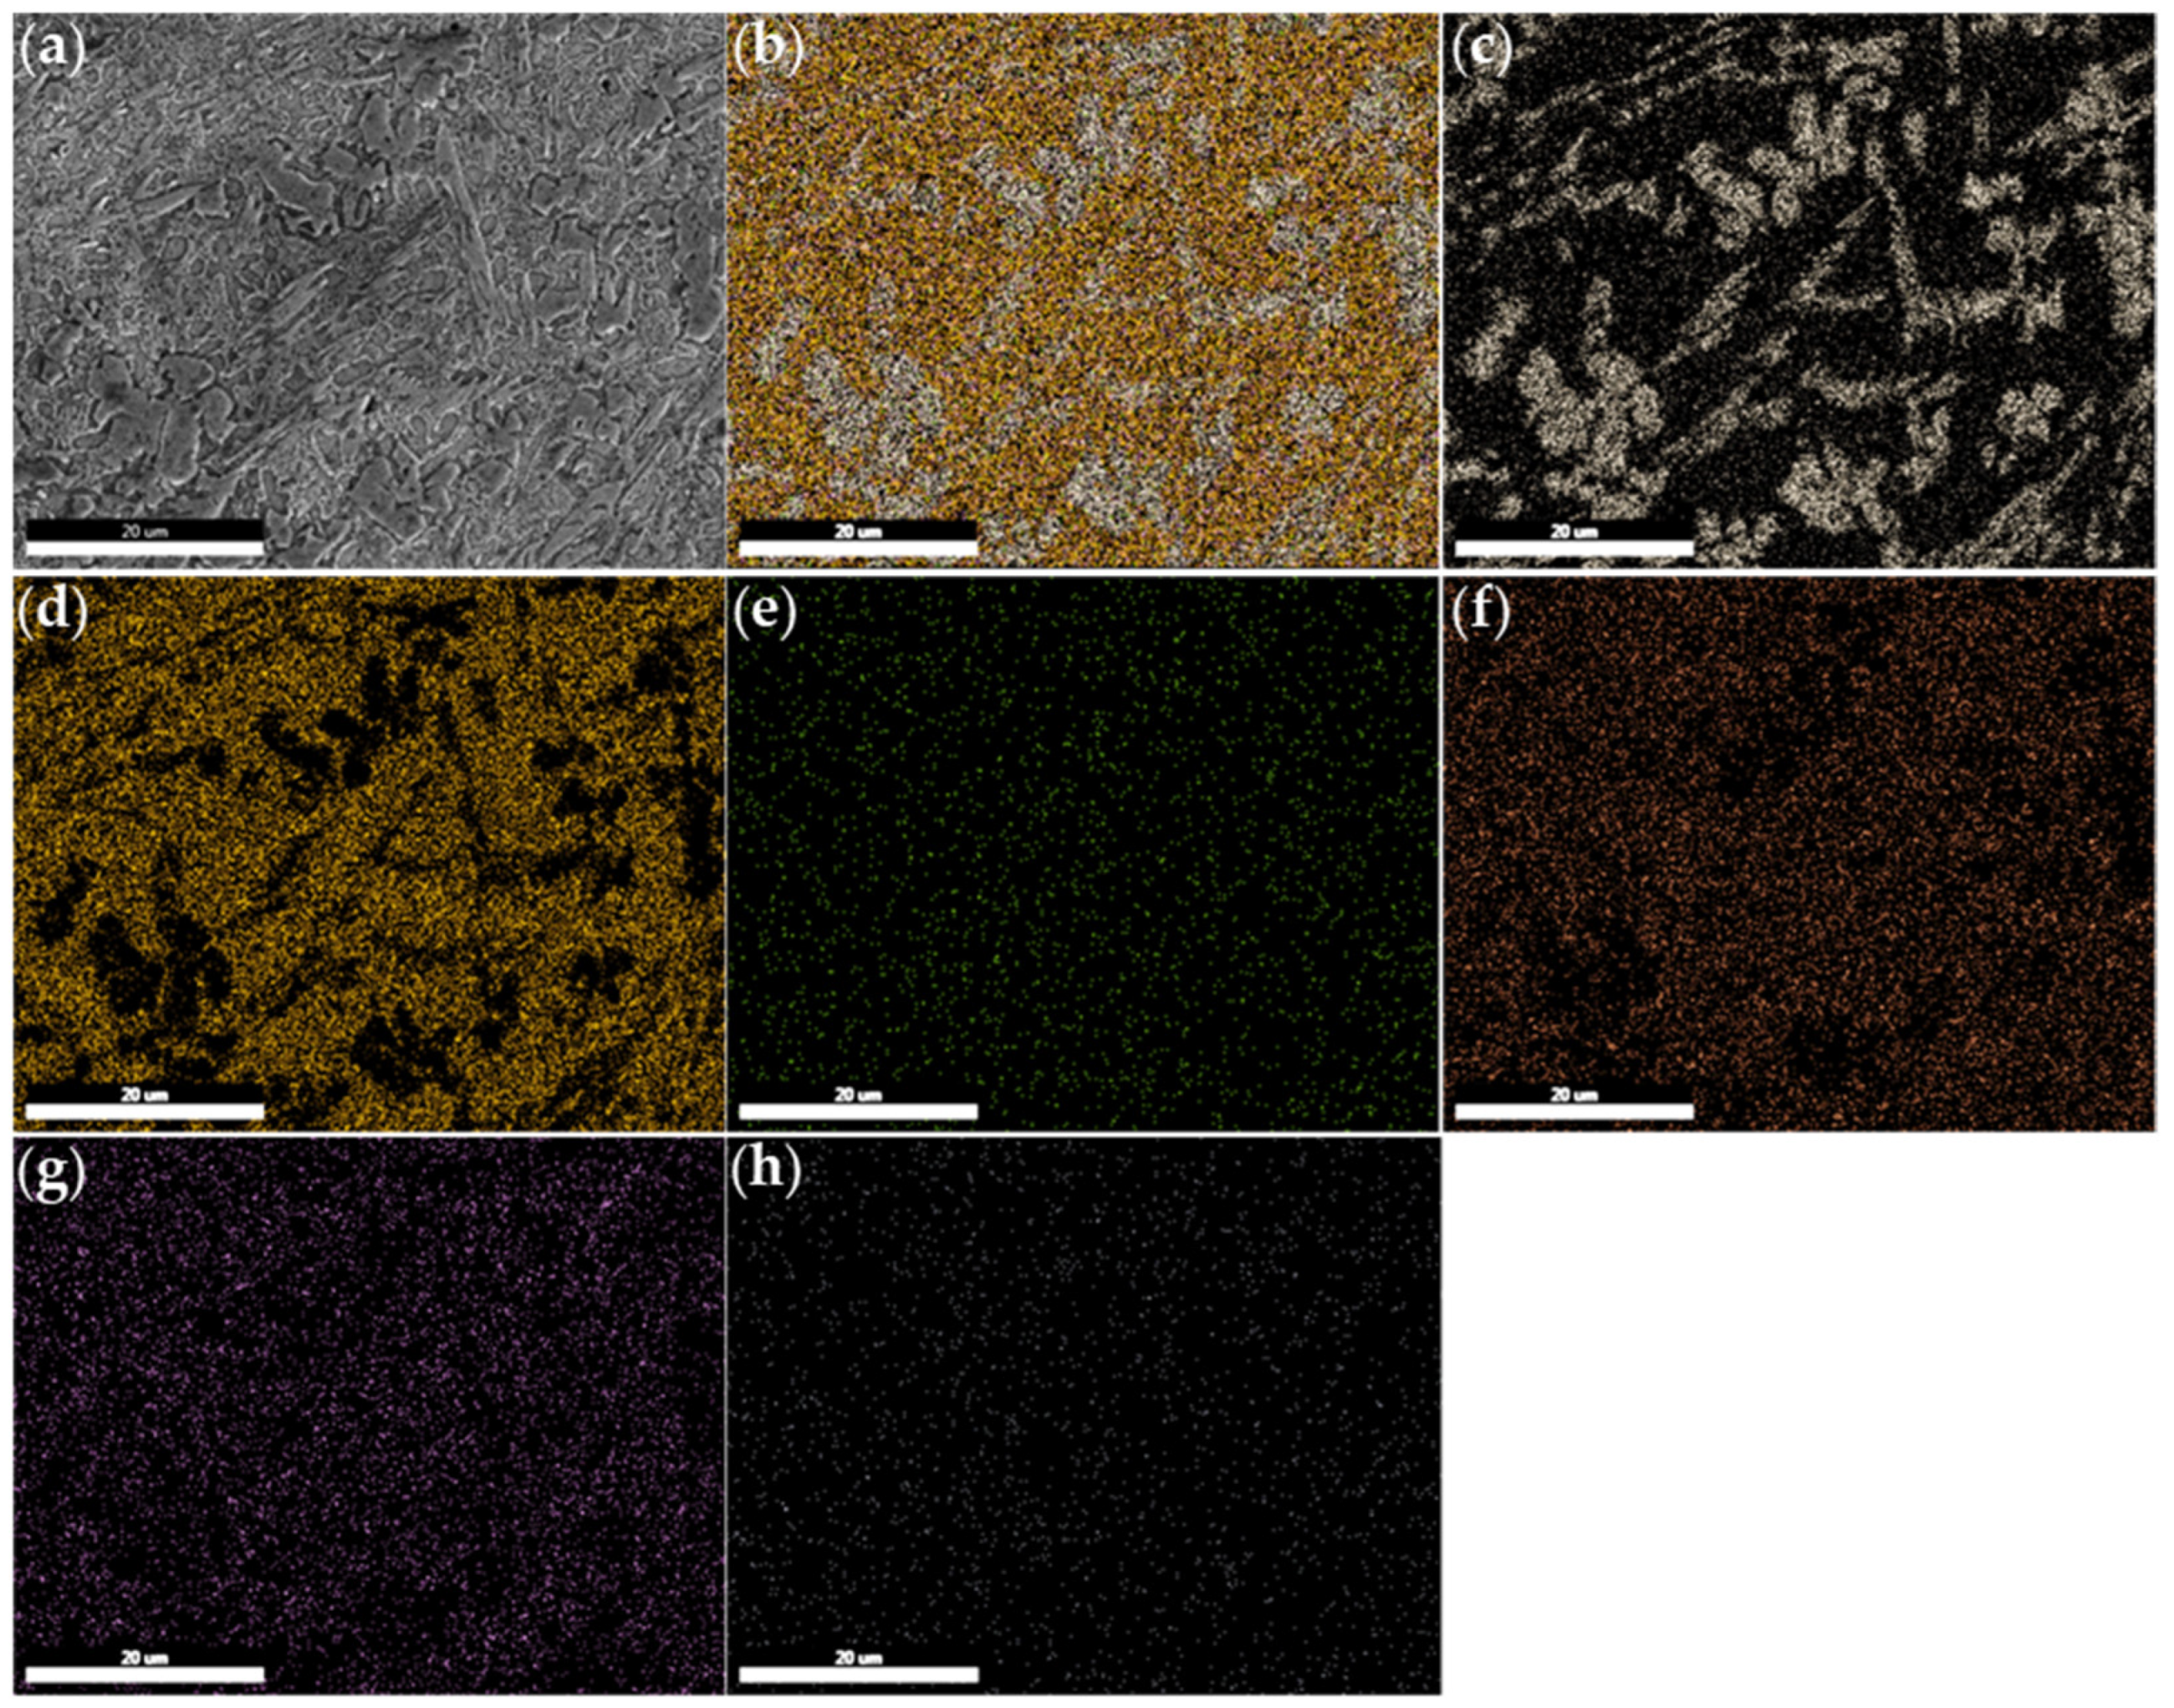
The microstructure of the cladding layer was different in different zones. Equiaxed crystals formed due to the rapid cooling rate of the upper surface of the cladding. The cooling rate in the middle zone slowed down, and the cellular crystal changed into cellular dendritic crystal. The temperature gradient at the bottom was large and the structure was relatively coarse.
(4)
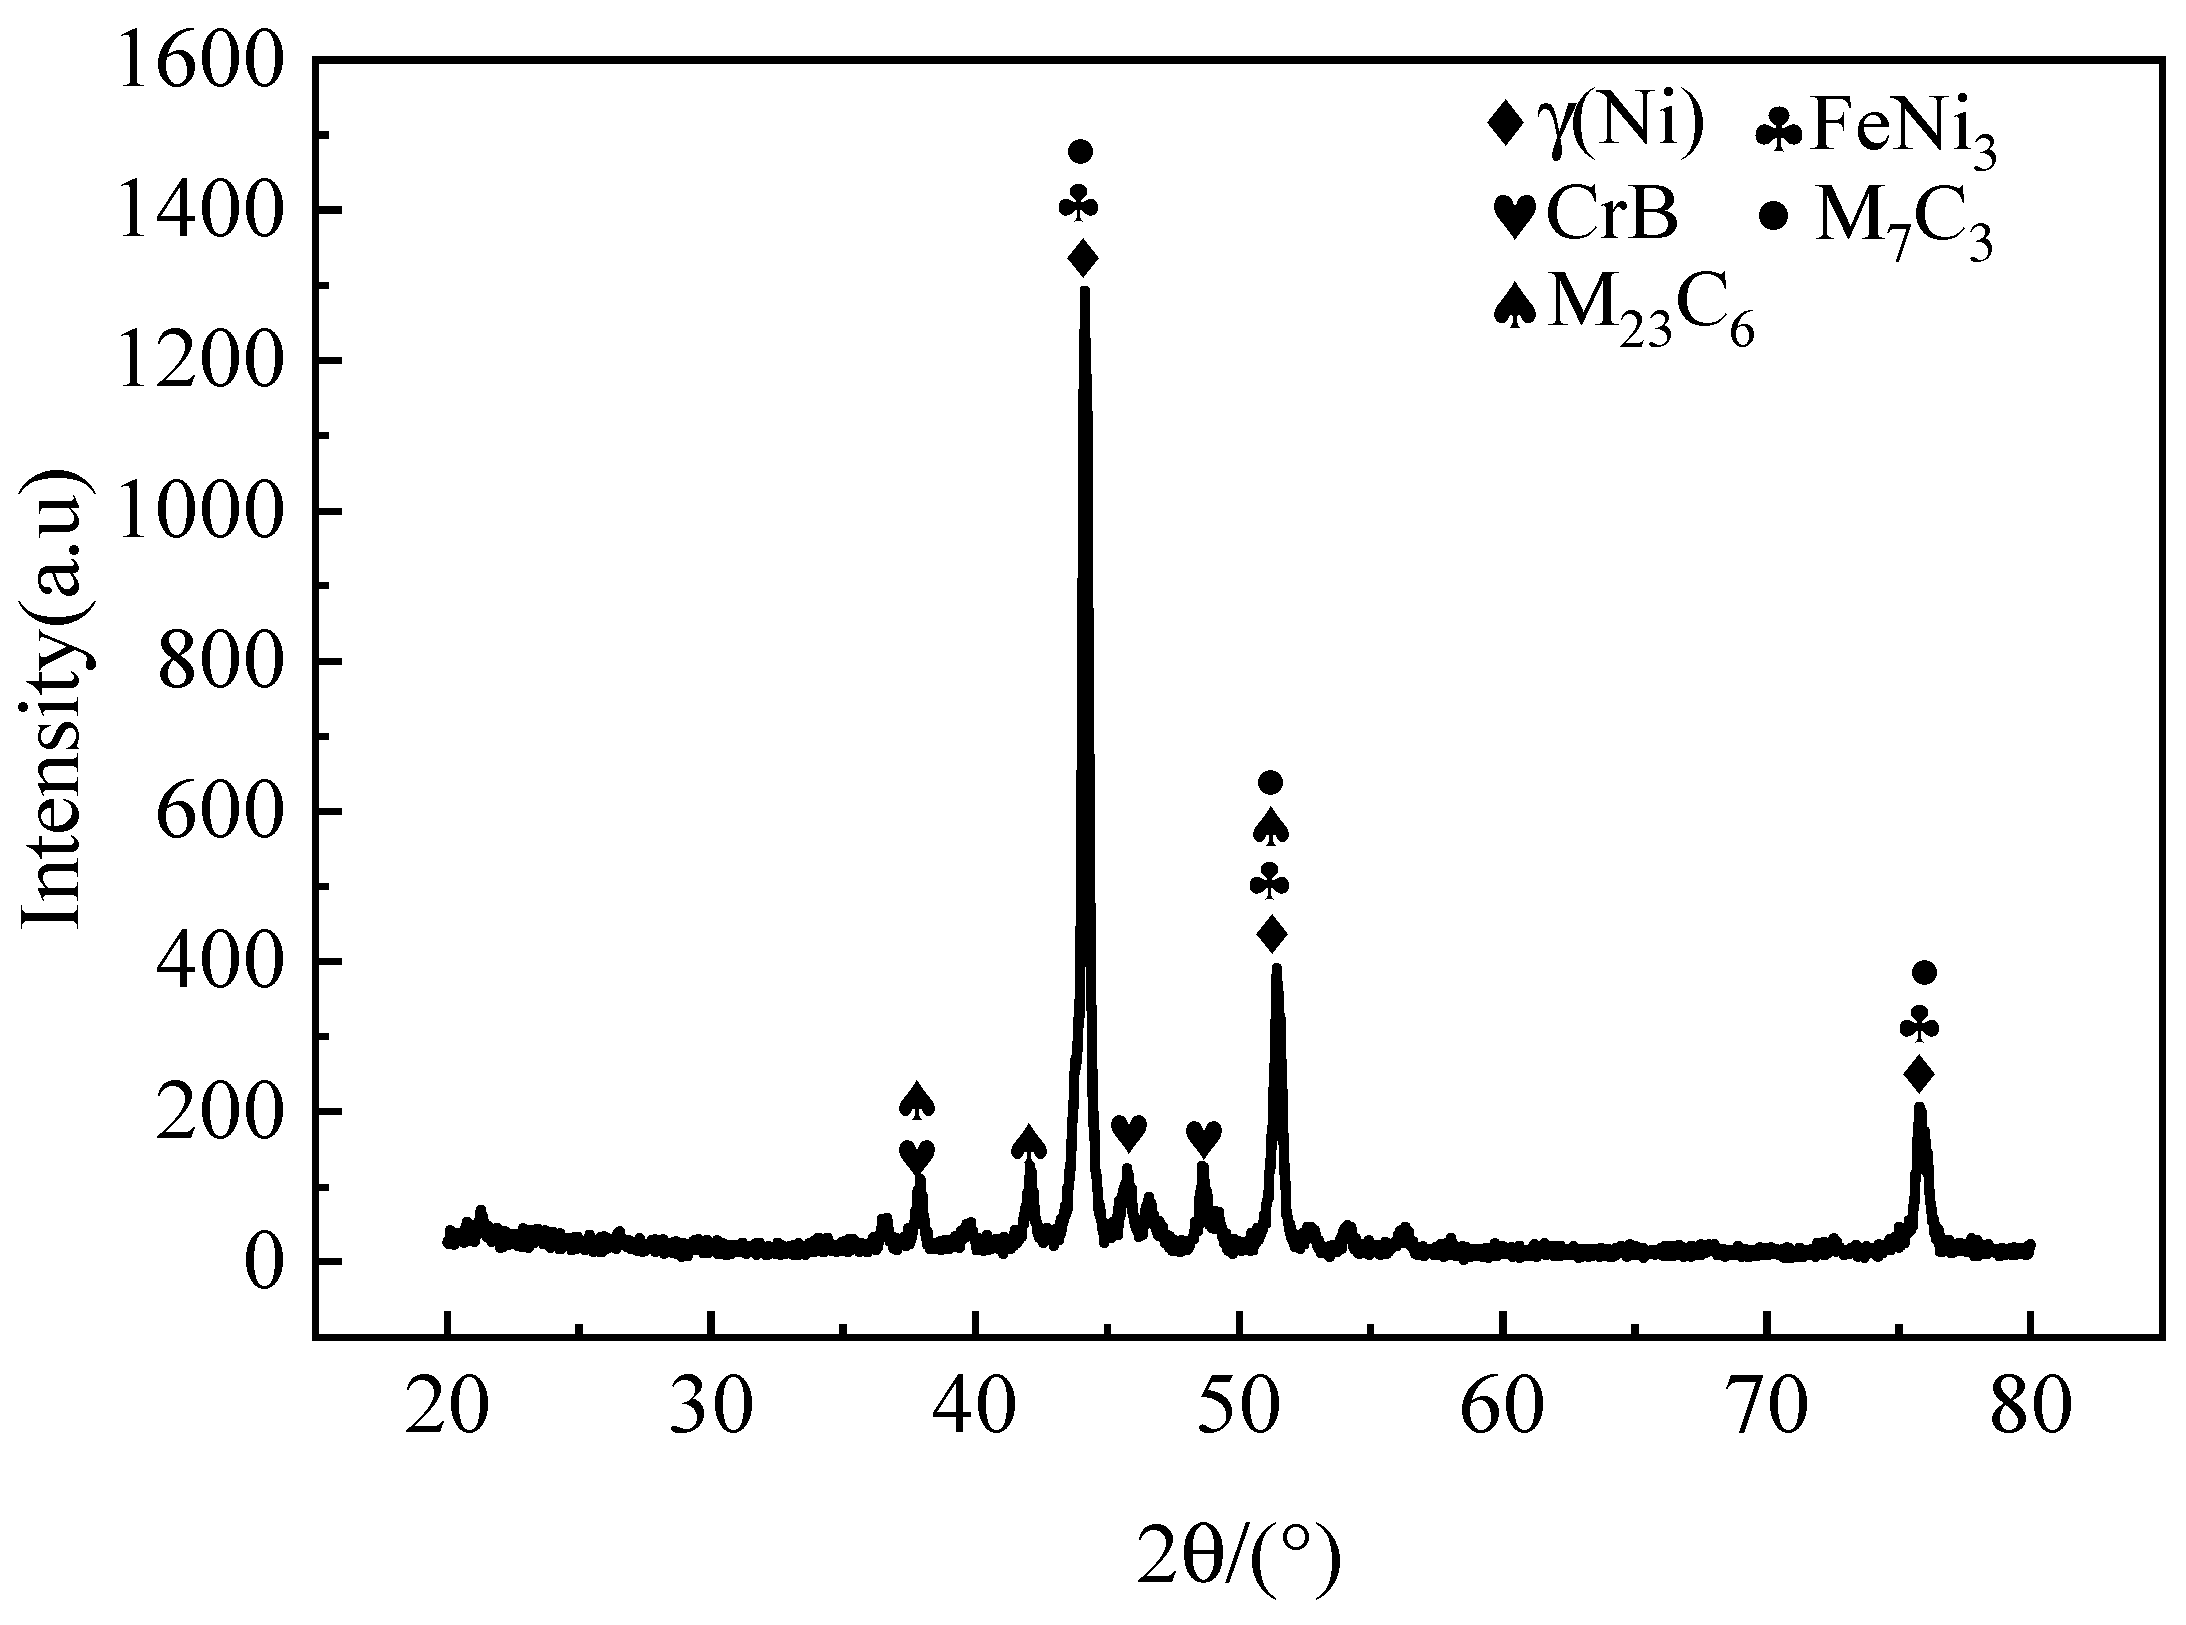
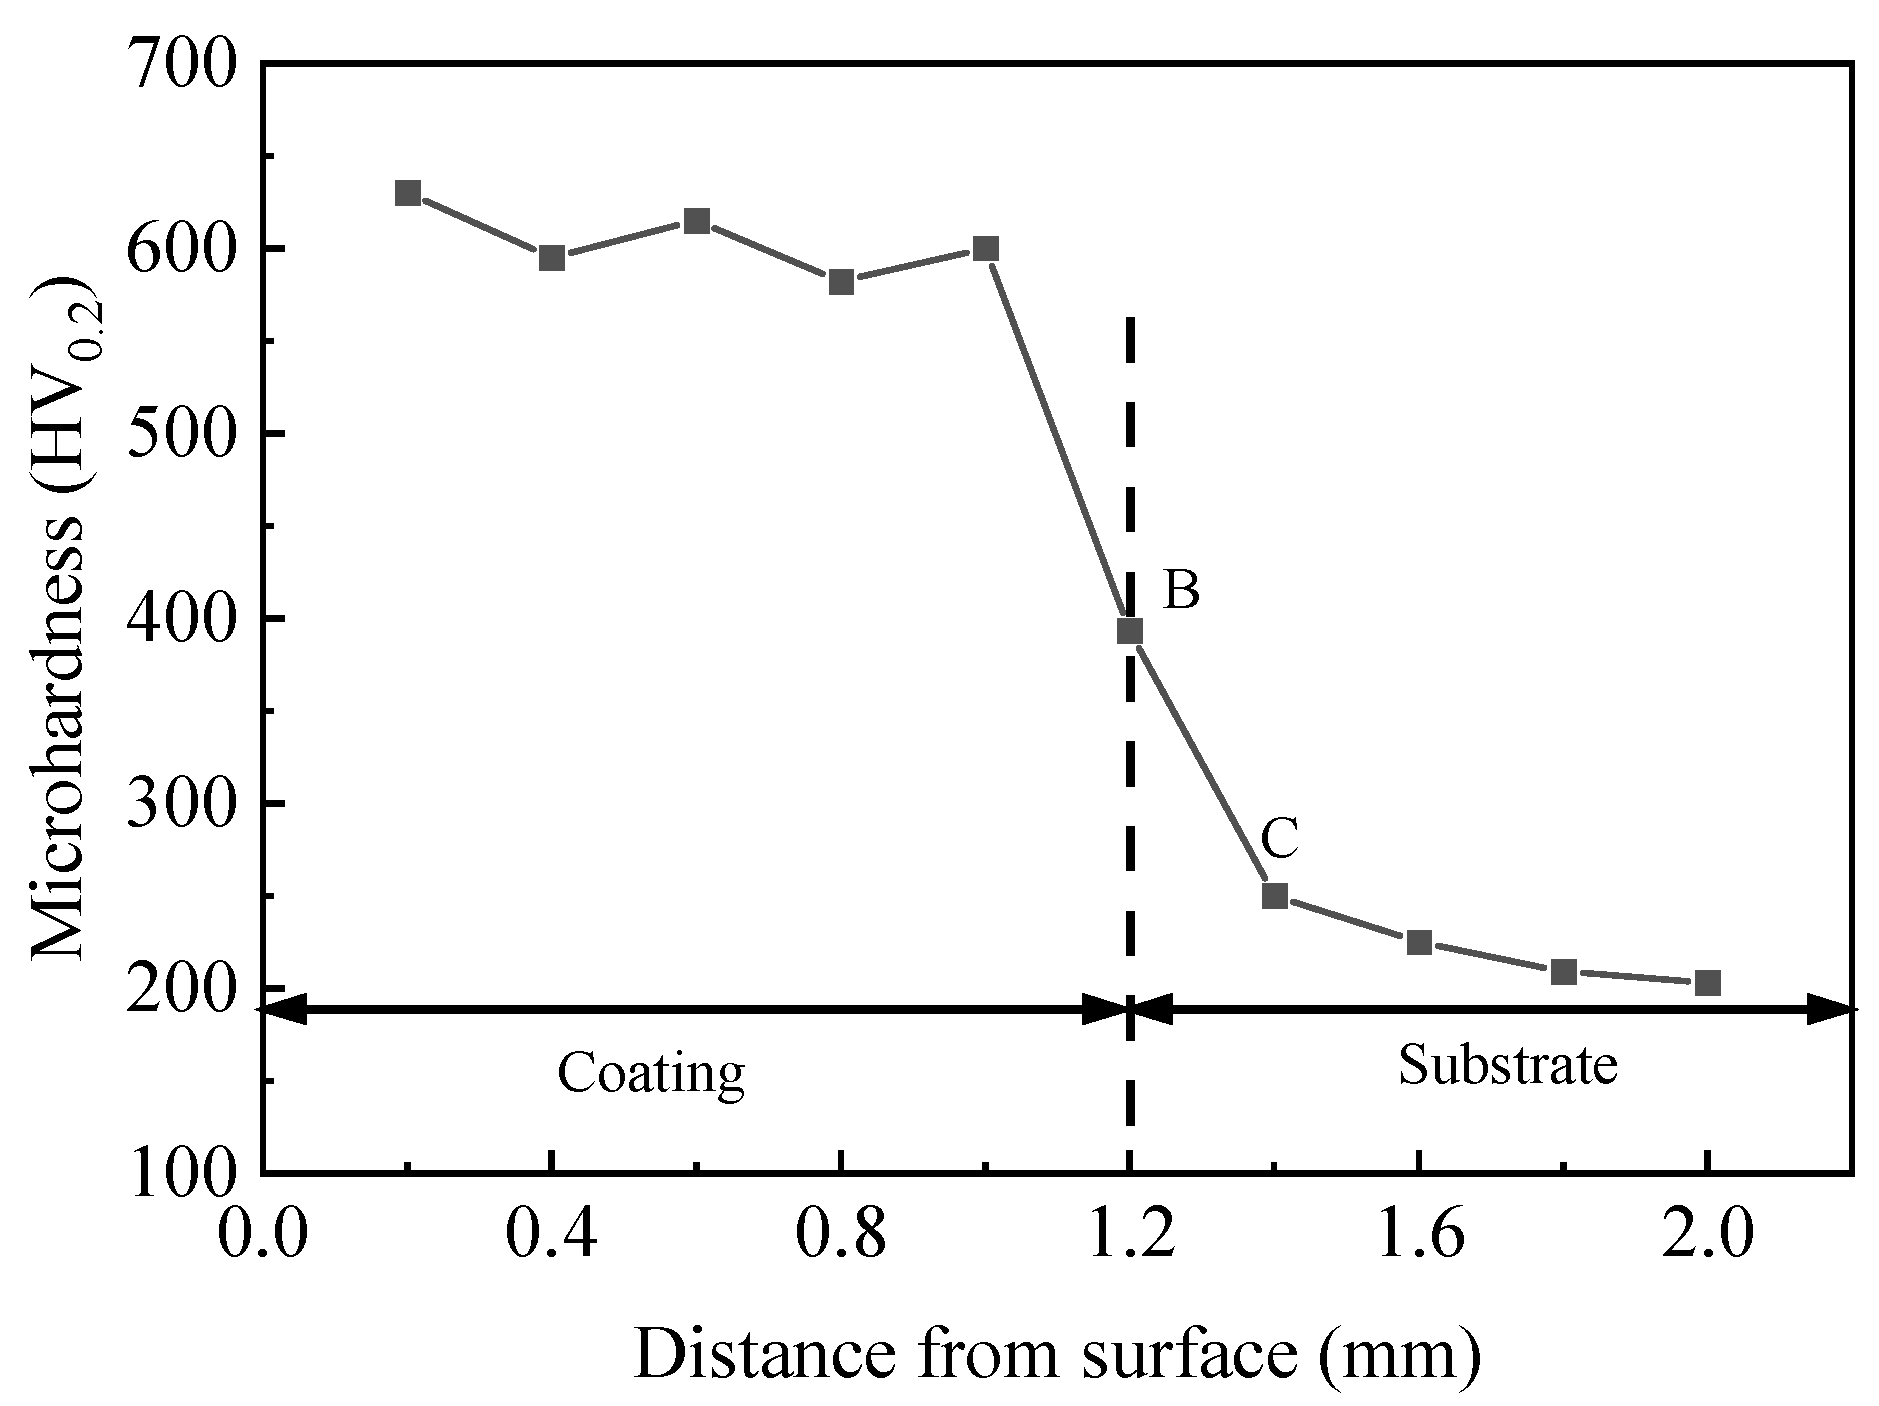
The microstructure of the cladding layer was mainly composed of γ(Ni), FeNi3, M (M = Fe, Ni, Cr)23C6, M7C3, and CrB. Under the optimal process parameters, the microhardness of the cladding layer was 3.1 times that of 45 steel substrate.
At present, the research on laser cladding for the remanufacturing of equipment parts is still in the initial stage. This study used the repair of parts as the background and obtained the optimal combination of process parameters on the basis of a large number of experimental analyses. This research can provide a reference for the remanufacturing laser cladding of more equipment parts and can also provide a reference for remanufacturing laser cladding technology, providing a theoretical basis for further extensive application.

Author Contributions

Conceptualization, T.L., M.W. and H.L.; methodology, T.L.; software, T.L., M.W. and H.L.; validation, Z.D. and D.L.; formal analysis, H.L., C.Q. and D.L.; investigation, T.L. and Z.D.; resources, T.L., H.L. and Y.G.; data curation, M.W. and D.L.; writing—original draft preparation, T.L.; writing—review and editing, H.L. and D.L.; visualization, H.L.; supervision, Y.G.; project administration, C.Q.; funding acquisition, H.L. and Y.G. All authors have read and agreed to the published version of the manuscript.

Funding

This work was supported by the Hebei Natural Science Funds for Distinguished Young Scholars (grant number. E2019209473); One Hundred Excellent Talents of Innovation in Hebei Provincial Universities (III) (grant number. SLRC2019030); High-level Talent Funding Program of Hebei (grant number A201905010); Key R&D Program of Hebei (grant number 20321902D); the Plan Program of Tangshan Science and Technology (grant number 19140203F).

Institutional Review Board Statement

Not applicable.

Informed Consent Statement

Not applicable.

Data Availability Statement

Not applicable.

Conflicts of Interest

The authors declare no conflict of interest.

References

  1. Lu, Y.Z.; Li, H.G.; Zhang, H.; Huang, G.K.; Xu, H.D.; Qin, Z.X.; Lu, X. Zr-based metallic glass coating for corrosion resistance improvement of 45 Steel. Mater. Trans. 2017, 58, 1319–1321. [Google Scholar] [CrossRef] [Green Version]
  2. Huang, G.K.; Qu, L.D.; Lu, Y.Z.; Wang, Y.Z.; Li, H.G.; Qin, Z.X.; Lu, X. Corrosion resistance improvement of 45 steel by Fe-based amorphous coating. Vacuum 2018, 153, 39–42. [Google Scholar] [CrossRef]
  3. Li, H.Y.; Chen, H.; Wu, Y.; Chen, Y.; Yi, W. Prediction of two-dimensional topography of laser cladding based on neural network. Int. J. Mod. Phys. B 2019, 33, 1940034. [Google Scholar]
  4. Lian, G.F.; Zhang, H.; Zhang, Y.; Huang, X.; Chen, C.R.; Jiang, J.B. Investigation of geometric characteristics in curved surface laser cladding with curve path. Metals 2019, 9, 947. [Google Scholar] [CrossRef] [Green Version]
  5. Li, Y.J.; Dong, S.Y.; Yan, S.X.; He, P.; Xu, B.S. Phase evolution of ductile iron during laser cladding processing. Surf. Coat. Technol. 2018, 339, 37–47. [Google Scholar] [CrossRef]
  6. Liu, R.; Zhang, M.; Yu, J.; Yang, Q.; Gao, S. Microstructural transformation and high-temperature aluminum corrosion properties of Co-based alloy coating prepared by laser cladding. Coatings 2022, 12, 603. [Google Scholar] [CrossRef]
  7. Sun, M.; Pang, M. Defect formation mechanism and performance study of laser cladding Ni/Mo composite coating. Coatings 2021, 11, 1460. [Google Scholar] [CrossRef]
  8. Zhu, C.; Zhang, B.; Zheng, S. Laser cladding nickel-titanium carbide composite coating on a 45 carbon steel:Preparation, microstructure and wear behavior. Mater. Werkst. 2020, 51, 247–256. [Google Scholar] [CrossRef]
  9. Zhang, J.; Hu, Y.; Tan, X.J.; Guo, L.; Zhang, Q.M. Microstructure and high temperature tribological behavior of laser cladding Ni60A alloys coatings on 45 steel substrate. Trans. Nonferrous Met. Soc. China 2015, 25, 1525–1532. [Google Scholar] [CrossRef]
  10. Bourahima, F.; Helbert, A.L.; Rege, M.; Ji, V.; Solas, D.; Baudin, T. Laser cladding of Ni based powder on a Cu-Ni-Al glassmold: Influence of the process parameters on bonding quality and coating geometry. J. Alloy. Compd. 2019, 771, 1018–1028. [Google Scholar] [CrossRef] [Green Version]
  11. Chen, T.; Wu, W.N.; Li, W.P.; Liu, D.F. Laser cladding of nanoparticle TiC ceramic powder: Effects of process parameters on the quality characteristics of the coatings and its prediction model. Opt. Laser. Technol. 2019, 116, 345–355. [Google Scholar] [CrossRef]
  12. Riquelme, A.; Escalera-Rodriguez, M.D.; Rodrigo, P.; Rams, J. Role of laser cladding parameters in composite coating (Al-SiC) on aluminum alloy. J. Therm. Spray Technol. 2016, 25, 1177–1191. [Google Scholar] [CrossRef]
  13. Hebbale, A.M.; Srinath, M.S. Taguchi analysis on erosive wear behavior of cobalt based microwave cladding on stainless steel AISI-420. Measurement 2017, 99, 98–107. [Google Scholar] [CrossRef]
  14. Yao, F.P.; Fang, L.J. Thermal stress cycle simulation in laser cladding process of Ni-based coating on H13 steel. Coatings 2021, 11, 203. [Google Scholar] [CrossRef]
  15. Erfanmanesh, M.; Abdollah-Pour, H.; Mohammadian-Semnani, H.; Shoja-Razavi, R. An empirical-statistical model for laser cladding of WC-12Co powder on AISI 321 stainless steel. Opt. Laser. Technol. 2017, 97, 180–186. [Google Scholar] [CrossRef]
  16. Nabhani, M.; Razavi, R.S.; Barekat, M. An empirical-statistical model for laser cladding of Ti-6Al-4V powder on Ti-6Al-4V substrate. Opt. Laser. Technol. 2018, 100, 265–271. [Google Scholar] [CrossRef]
  17. Khorram, A.; Jamaloei, A.D.; Paidar, M.; Cao, X. Laser cladding of Inconel 718 with 75Cr3C2 + 25(80Ni20Cr) powder: Statistical modeling and optimization. Surf. Coat. Technol. 2019, 378, 124933. [Google Scholar] [CrossRef]
  18. Singh, A.K.; Bal, K.S.; Dey, D.; Das, A.K.; Pal, A.R.; Pratihar, D.K.; Choudhury, A.R. Experimental investigation and parametric optimization for minimization of dilution during direct laser metal deposition of tungsten carbide and cobalt powder mixture on SS304 substrate. Powder Technol. 2021, 390, 339–353. [Google Scholar] [CrossRef]
  19. Meng, G.R.; Zhu, L.D.; Zhang, J.D.; Yang, Z.C.; Xue, P.S. Statistical analysis and multi-objective process optimization of laser cladding TiC-Inconel718 composite coating. Optik 2021, 240, 166828. [Google Scholar] [CrossRef]
  20. Nyadongo, S.T.; Olakanmi, E.O.; Pityana, S.L. Experimental and numerical analyses of geometrical and microstructural features of Tribaloy T-800 composite coating deposited via laser cladding-assisted with pre-heat (LCAP) process. J. Manuf. Process. 2021, 69, 84–111. [Google Scholar] [CrossRef]
  21. Olakanmi, E.O.; Nyadongo, S.T.; Malikongwa, K.; Lawal, S.A.; Botes, A.; Pityana, S.L. Multi-variable optimisation of the quality characteristics of fiber-laser cladded Inconel-625 composite coatings. Surf. Coat. Technol. 2019, 357, 289–303. [Google Scholar] [CrossRef]
  22. Sun, Y.W.; Hao, M.Z. Statistical analysis and optimization of process parameters in Ti6Al4V laser cladding using Nd:YAG laser. Opt. Laser. Eng. 2012, 50, 985–995. [Google Scholar] [CrossRef]
  23. Derringer, G.C.; Suich, R.R. Simultaneous optimization of several response variable. J. Qual. Technol. 1980, 12, 214–219. [Google Scholar] [CrossRef]
  24. Guo, C.G.; He, S.Z.; Yue, H.T.; Li, Q.; Hao, G.B. Prediction modelling and process optimization for forming multi-layer cladding structures with laser directed energy deposition. Opt. Laser. Technol. 2021, 134, 106607. [Google Scholar] [CrossRef]
  25. Liu, H.M.; Li, M.B.; Qin, X.P.; Huang, S.; Hong, F. Numerical simulation and experimental analysis of wide-beam laser cladding. Int. J. Adv. Manuf. Tech. 2019, 100, 237–249. [Google Scholar] [CrossRef]
  26. Wang, Q.; Zhai, L.L.; Zhang, L.; Zhang, J.W.; Ban, C.Y. Effect of steady magnetic field on microstructure and properties of laser cladding Ni-based alloy coating. J. Mater. Res. Technol. 2022, 17, 2145–2157. [Google Scholar] [CrossRef]
  27. Xuan, H.F.; Wang, Q.Y.; Bai, S.L.; Liu, Z.D.; Sun, H.G.; Yan, P.C. A study on microstructure and flame erosion mechanism of a graded Ni–Cr–B–Si coating prepared by laser cladding. Surf. Coat. Technol. 2014, 244, 203–209. [Google Scholar] [CrossRef]
  28. Lim, L.C.; Ming, Q.; Chen, Z.D. Microstructures of laser-clad nickel-based hardfacing alloys. Surf. Coat. Technol. 1998, 106, 183–192. [Google Scholar] [CrossRef]
  29. Wu, Z.P.; Li, T.; Li, Q.; Shi, B.W.; Li, X.B.; Wang, X.L.; Lu, H.T.; Zhang, H.C. Process optimization of laser cladding Ni60A alloy coating in remanufacturing. Opt. Laser. Technol. 2019, 120, 105718. [Google Scholar] [CrossRef]
Figure 1. Laser cladding principle.
Coatings 12 00939 g001
Figure 2. Experimental setup. (a) Cooling system; (b) control cabinet; (c) laser generator; (d) synchronous powder feeder; (e) ABB five axis manipulator; (f) cladding process; (g) laser cladding specimens.
Coatings 12 00939 g002
Figure 3. Typical cross-section of single cladding.
Coatings 12 00939 g003
Figure 4. Perturbation of three process parameters to the dilution ratio.
Coatings 12 00939 g004
Figure 5. Contour lines for effects of the interactions of (a) laser power and powder feeding rate and (c) laser power and scanning speed on the dilution ratio. Impact of the correlation between (b) laser power and powder feeding rate and (d) laser power and scanning speed on the response surface of the dilution ratio.
Coatings 12 00939 g005
Figure 6. (a) Residual distribution of the dilution ratio. (b) Relationship between the predicted and actual values of the dilution ratio.
Coatings 12 00939 g006
Figure 7. Perturbation of three process parameters to the W/H.
Coatings 12 00939 g007
Figure 8. Contour line for effects of the interaction of (a) laser power and scanning speed and (c) powder feeding rate and scanning speed on the W/H. Impact of the correlation between (b) laser power and scanning speed and (d) powder feeding rate and scanning speed on the response surface of W/H.
Coatings 12 00939 g008
Figure 9. (a) Residual distribution of the W/H. (b) Relationship between the predicted and actual values of the W/H.
Coatings 12 00939 g009
Figure 10. Perturbation of three process parameters to the contact angle.
Coatings 12 00939 g010
Figure 11. Contour lines for the effects of the interactions of (a) the laser power and scanning speed and (c) the powder feeding rate and scanning speed on the contact angle. Impact of the correlation between (b) the laser power and scanning speed and (d) the powder feeding rate and scanning speed on the response surface of the contact angle.
Coatings 12 00939 g011
Figure 12. (a) Residual distribution of the contact angle. (b) Relationship between the predicted and actual values of the contact angle.
Coatings 12 00939 g012
Figure 13. Morphologies of different regions under optimal process parameters. (a) Cross-section morphology; (b) top microstructure; (c) middle microstructure; (d) bottom microstructure; (e) microstructure of bonding zone.
Coatings 12 00939 g013
Figure 14. XRD pattern of Ni60PTA laser cladding layer.
Coatings 12 00939 g014
Figure 15. EDS mapping results of the Ni60PTA coating. (a) Morphologies of selected regions; (b) overall elements; (c) Cr; (d) Ni; (e) C; (f) Fe; (g) Si; (h) B.
Coatings 12 00939 g015
Figure 16. EDS analysis of three points. (a) A1; (b) A2; (c) A3.
Coatings 12 00939 g016
Figure 17. The microhardness variation along the depth gradient.
Coatings 12 00939 g017
Table 1. Chemical composition of 45 steel (wt.%).
SteelCSiMnPSCrNiFe
45 steel0.420.20.70.0250.0240.230.14Bal.
Table 2. Chemical composition of Ni60PTA (wt.%).
PowderCSiCrFeBMoNi
Ni60PTA1.215.8320.174.132.790.21Bal.
Table 3. Experimental factors and levels.
Level of Factor −101
A (W)140015001600
B (mg/s)161820
C (mm/s)345
Table 4. BBD experimental designs and results.
StdRunLaser Power
(W)
Feeding Rate
(mg/s)
Scanning Speed
(mm/s)
Dilution RatioW/Hθ (°)
11314001640.0814.038138.652
2716001640.1184.93145.852
31414002040.0823.876137.642
4116002040.1164.946144.066
51714001830.0873.15132.891
6116001830.1213.473136.433
7414001850.0784.815141.993
8616001850.1135.71150.55
9315001630.113.256134.442
10515002030.1093.378135.666
11815001650.0895.689149.916
121615002050.0955.634149.871
131515001840.0954.783146.22
141115001840.0864.602144.22
15915001840.0894.839145.852
16215001840.0914.991147.271
171015001840.0954.643146.168
Table 5. Analysis of variance of the dilution ratio.
Sum of SquaresdfMean SquareF Valuep Value
Model0.003190.000322.520.0002Significant
A 0.002510.0025161.34<0.0001
C0.000310.000322.260.0022
B20.000110.00015.680.0487
C20.000110.00017.000.0331
Residual0.000170.0000
Lack of fit0.000030.00000.99780.4797Not significant
Pure error0.000140.0000
Total0.003216
Std. dev0.0039 R20.9666
Mean0.0974 Adjusted R20.9237
C.V.%4.00 Predicted R20.7415
Press0.0008 Adequate precision16.0601
Table 6. Analysis of variance of W/H.
Sum of SquaresdfMean SquareF Valuep Value
Model11.1591.2434.62<0.0001Significant
A 1.2611.2635.340.0006
C 9.2319.23257.91<0.0001
A20.291610.29168.150.0245
C20.206410.20645.770.0473
Residual0.250470.0358
Lack of fit0.152330.05082.070.2470Not significant
Pure error0.098140.0245
Total11.4016
Std. dev0.1891 R20.9780
Mean4.51 Adjusted R20.9498
C.V.%4.19 Predicted R20.7728
Press2.59 Adequate precision20.2868
Table 7. Analysis of variance of the contact angle.
Sum of SquaresdfMean SquareF Valuep Value
Model517.57957.5132.59<0.0001Significant
A82.71182.7146.880.0002
C349.771349.77198.25<0.0001
A243.12143.1224.440.0017
C221.88121.8812.400.0097
Residual12.3571.76
Lack of fit7.4832.492.050.2496Not significant
Pure error4.8741.22
Total529.9216
Std. dev1.33 R20.9767
Mean142.81 Adjusted R20.9467
C.V.%0.9301 Predicted R20.7597
Press127.32 Adequate precision19.2937
Table 8. Conditions and targets of optimization.
Variables or ResponsesGoalLower LimitUpper LimitImportance
Laser powerIn range140016003
Powder feeding rateIn range16203
Scanning speedIn range353
Dilution ratioMinimize0.0780.1215
W/HMaximize3.155.713
Contact angleMaximize132.891153.554
Table 9. Comparison between the predicted optimization results and experimental verification results.
SourceActualPredictedError %
D0.0790.0869%
W/H5.135.4997%
θ (°)145149.133%
Publisher’s Note: MDPI stays neutral with regard to jurisdictional claims in published maps and institutional affiliations.

