1. Introduction
Assessing, managing, and eliminating wind turbine blade leading edge erosion is a major challenge within the wind energy sector. Eroded blades perform at a reduced aerodynamic efficiency [
1,
2,
3,
4,
5], leading to a lower energy harvest and in turn less revenue for the wind farm owner. Additionally, the maintenance cost of repairing an eroded blade can be very expensive due to the requirement of technicians and vessels for offshore installations. This also affects the levelized cost of energy for the wind turbine/farm. It is therefore crucial to be able to detect the onset of early stage erosion on a wind turbine blade and to be able to measure the progression of erosion damage, if any, and ultimately decide whether intervention is required and a costly repair is necessary. An increasing value is placed upon data captured regarding blade condition as this data can be used as an input to condition monitoring and prediction models.
Currently wind turbines are assessed for blade erosion mainly by visual methods, such as a rope access technician, a drone, or a telescopic camera (onshore) [
6,
7]. A general inspection is carried out by a team of technicians who scale the turbine and rappel down each blade in turn. A report is then produced on the condition of each blade, including photographs taken by the technician in situ. However, there is no quantitative measurement made on the turbine by means of assessing the state of erosion on the blade.
Before a blade is put into operation and coated with an “erosion-resistant” coating; the coating system must be tested in a laboratory to assess the erosion performance [
8,
9,
10]. Rain erosion testing (RET) is typically conducted in a whirling arm rain erosion rig (WARER), where representative samples of the glass fiber composite substrate are topped with the coating system under consideration. During RET, the erosion state is assessed by capturing photographs of the test specimen and measuring the mass change of the test specimen at set time intervals. Typically, there is no further detailed assessment or analysis of the test samples. RET photographs give a good visual indication of how the coating performs when erosion has advanced to a stage with visible damage. Consequently, this method is inhibited from establishing early detections of erosion and limits further fundamental understanding of erosion evolution. The initial period of erosion, through the incubation stage, is difficult to detect by photographs alone. Measuring the mass of the sample at each time interval does not give an accurate measurement of any erosion-related material lost [
11], particularly at the early erosion stage as the sample typically absorbs some of the water from the test, therefore, potentially contaminating any result for the sample mass measurement. Nevertheless, measuring the mass of the sample can provide useful information when the sample has started to erode and has passed the incubation stage. The sample would therefore require to be dried, post-test, to provide an accurate measurement.
A novel method for erosion measurement on wind turbine blade coatings is developed by using surface glossiness and is proposed as an alternative to RET and sample mass testing. Measuring the surface gloss gives a quantitative measurement of the state of the coating and has been shown to identify key erosion stages through the incubation period and beyond into active erosion. As such, this approach can provide useful information for a wind turbine owner to know, with confidence, what stage of erosion the coating is at and when the coating is likely to reach active erosion stage and ultimately require a repair intervention. Additionally, quantitative measurements of erosion can be used as inputs to numerical modelling tools, allowing a repair intervention date and overall coating lifetime to be predicted.
2. Glossmeter Working Principle
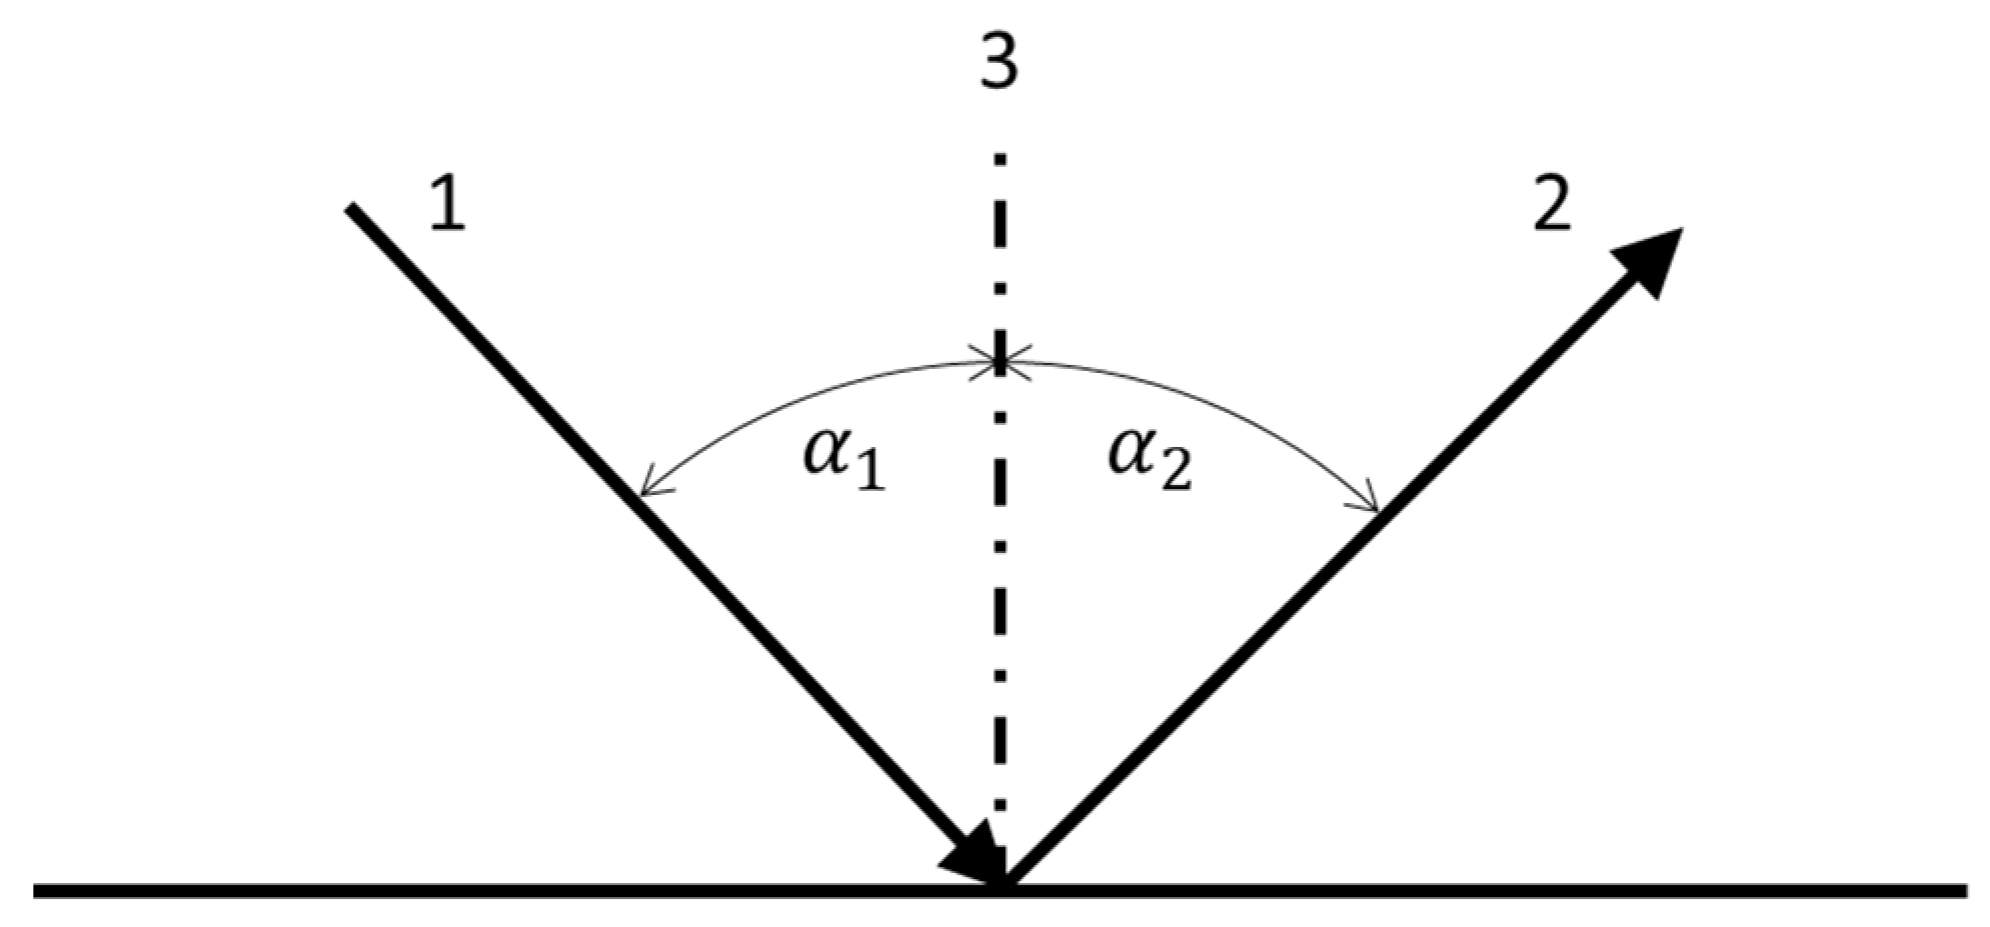
The working principle of a glossmeter is based upon a beam of light which is cast on a surface, at a known angle from the normal. The specular reflection of the light beam is then captured by the glossmeter where the intensity and quantity of light at the detector are measured [
12,
13,
14] as shown in
Figure 1. Gloss is quantified by Gloss Units (GU). Gloss Units range from a scale of 0 GU—where the surface is fully matt, to 100 GU—where the surface is a perfect mirror.
The angle of measurement for gloss is also an important parameter to consider. Typically, for plastic materials, angles of 20°, 60°, and 85° are used [
15]. The angles refer to the incident angle of the beam of light, where in
Figure 1, line 1 with angle α
1 is the incident angle and line 2 with angle α
2 is the specular reflection, which for a perfectly smooth surface is always the same as the incident angle, α
1 = α
2 for specular reflectance. Line 3 is the normal line, a perpendicular line to the measured surface.
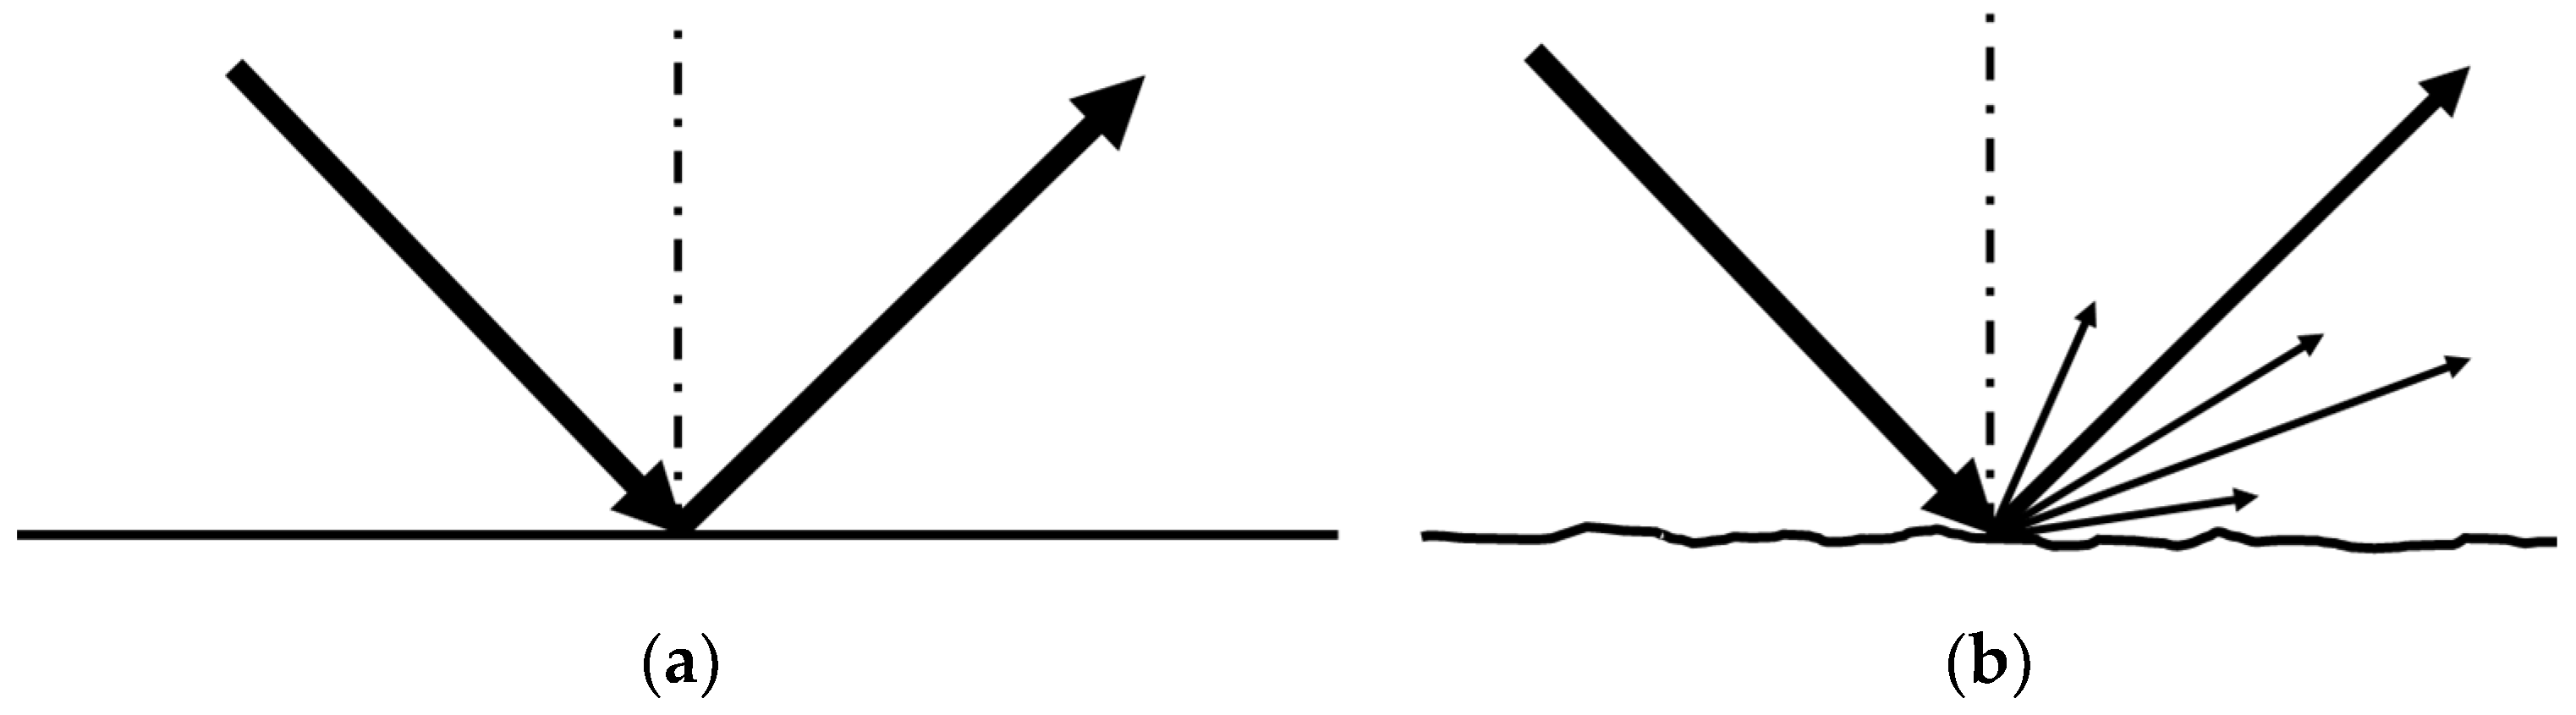
The intensity of the specular reflection is dependent on the surface which the beam is reflected off. If the surface is smooth and uniform, a high quantity of the incident beam is reflected as the specular reflectance and has a low diffuse reflectance as shown in
Figure 2a. If the surface is uneven or has an irregular or unsmooth pattern, the amount of the incident beam reflected as specular reflection is low and there is a high diffuse reflectance as in
Figure 2b.
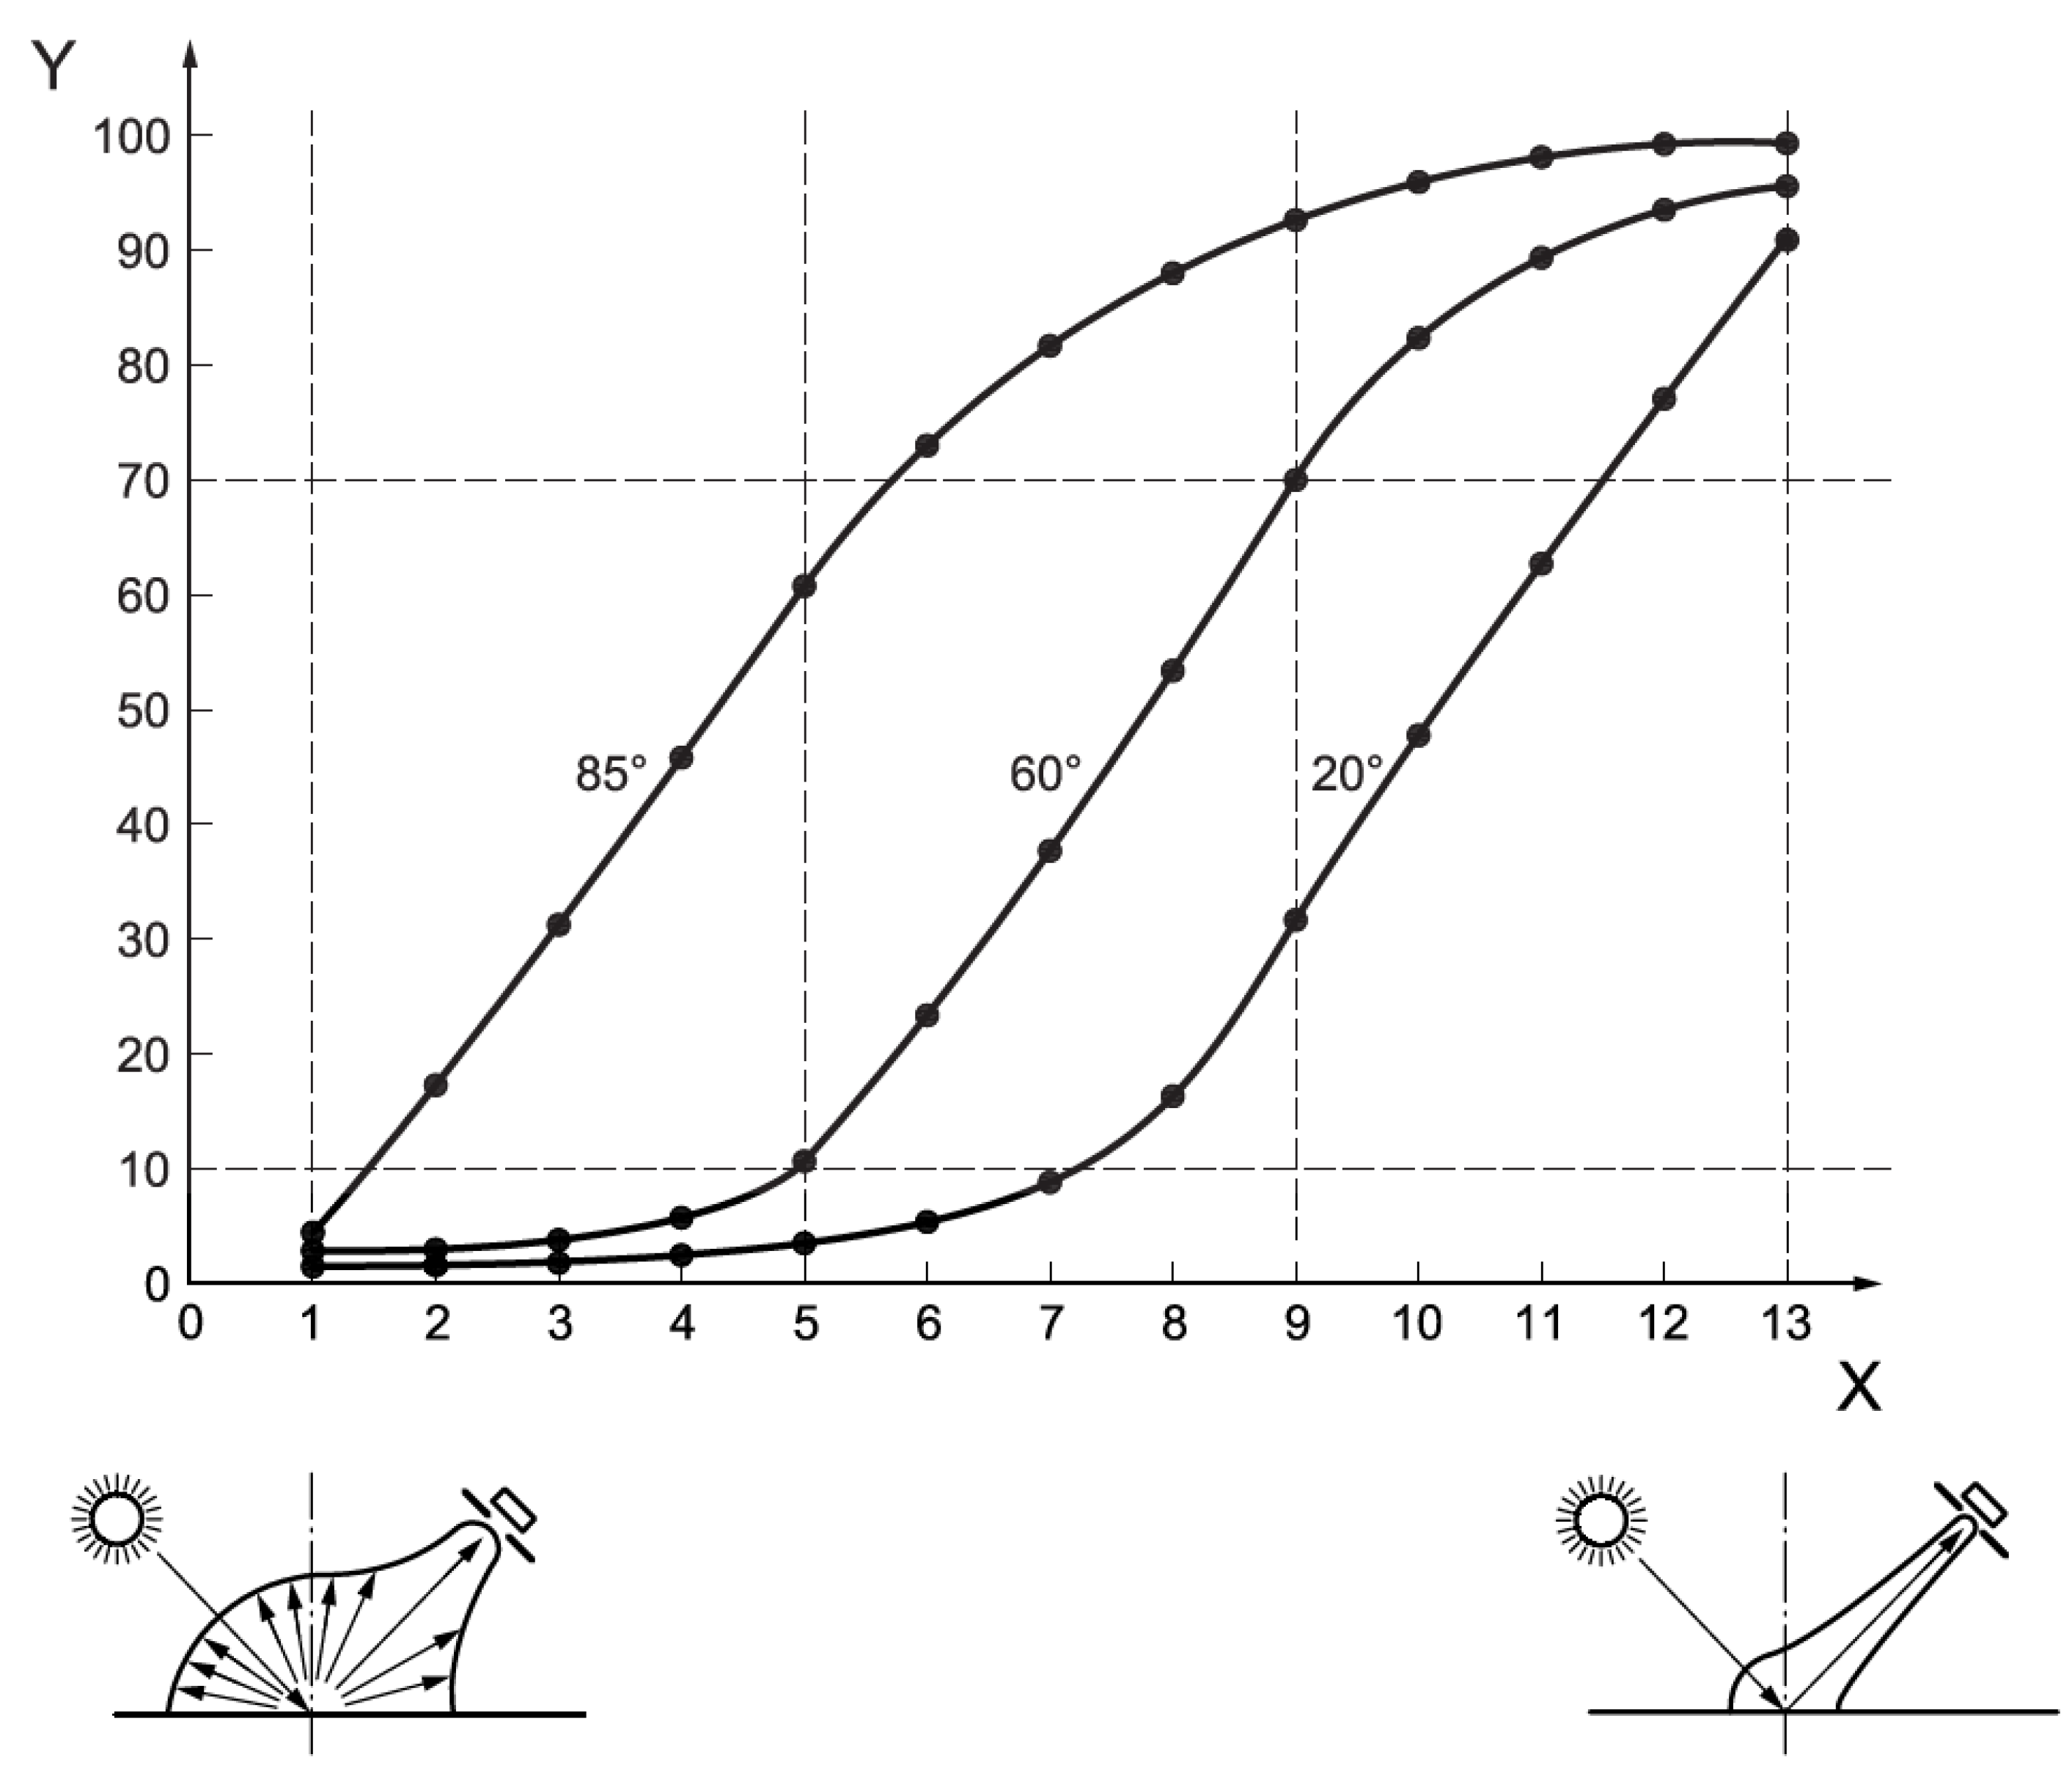
The angle selected to measure gloss will influence the gloss measurement obtained. First, the perceived glossiness of the surface is obtained by a visual check. If the surface is matt, 85° is used. If the surface is mid gloss, 60° is used. If the surface is high gloss, 20° is used. Different angles give a larger usable range of gloss, as shown by the linear portions of
Figure 3. Working within the linear region is particularly useful when measuring gloss over a range of time or conditions that will cause a change in the gloss value, as the linear region offers the greatest range of gloss units for the perceived surface glossiness. Similarly, the linear region allows for the greatest measurement accuracy due to the larger operational gloss unit range, the Y-axis on
Figure 3, versus operating on the curved section. It is therefore important to select the appropriate angle when conducting a gloss analysis.
3. Experimental Approach and Methodology
3.1. Sample Preparation
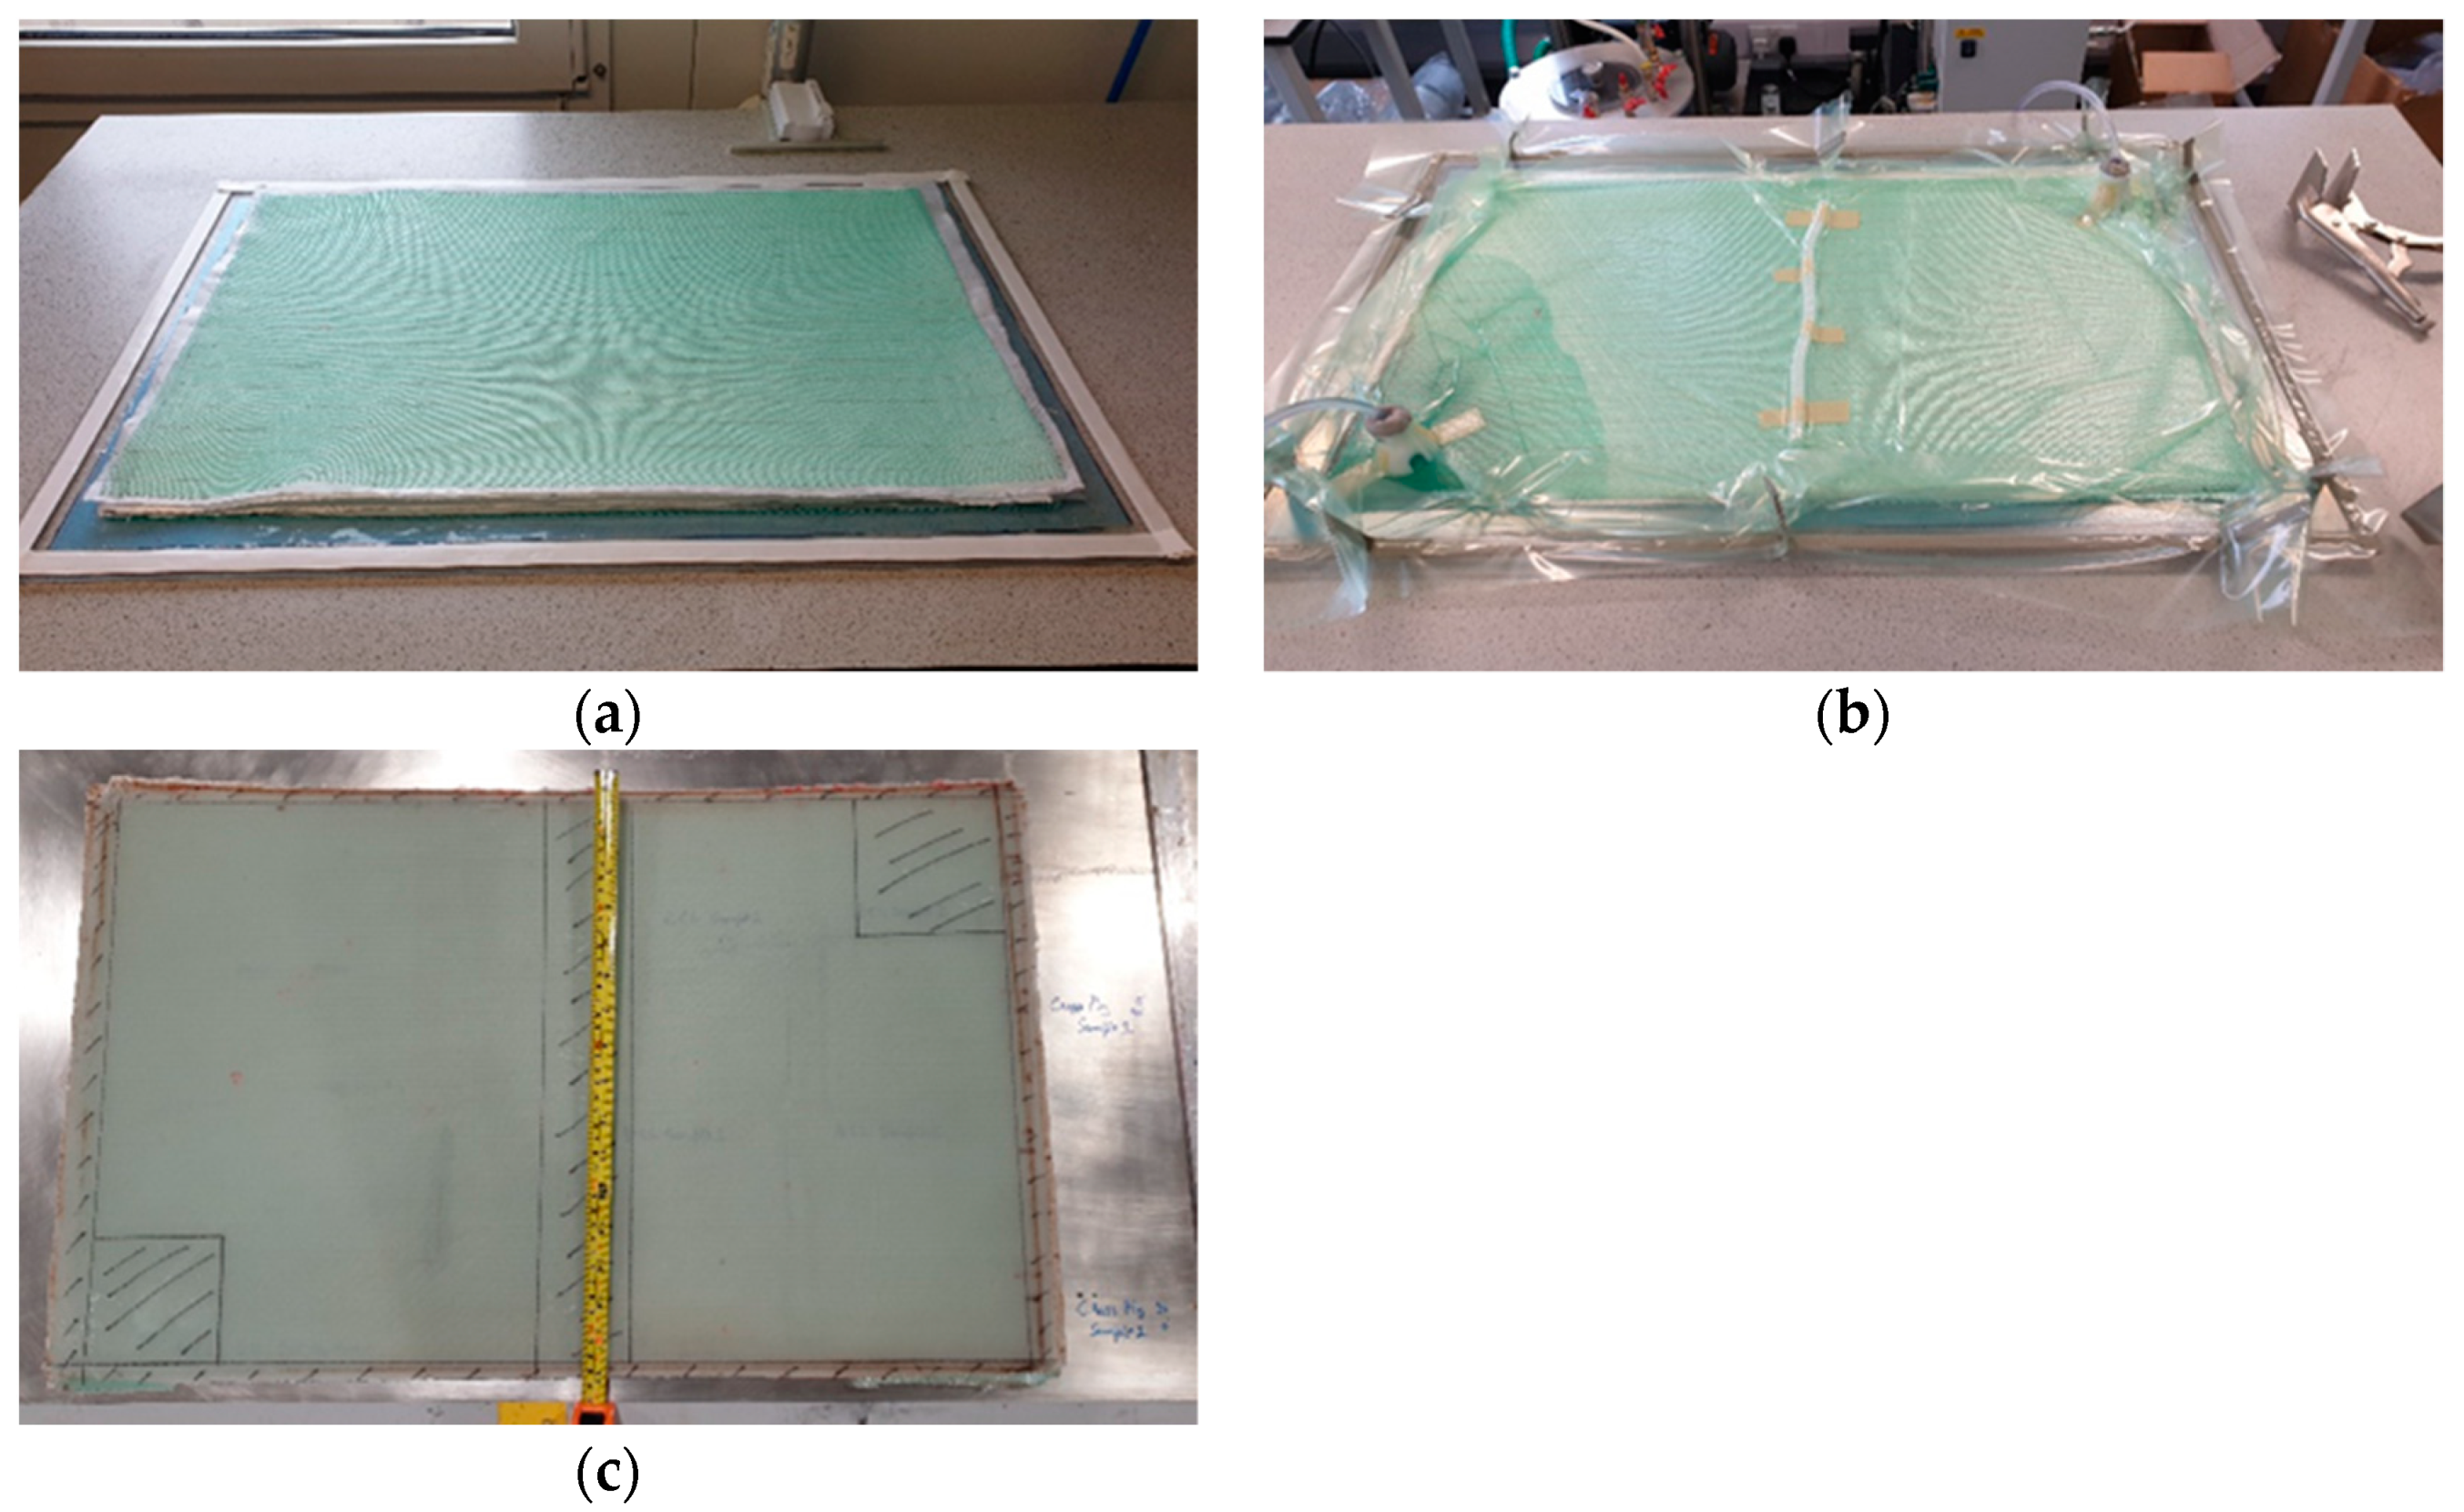
The substrate of the test specimens used within this experiment were constructed using two layers of 591 g/m
2 uni-directional (UD) glass fiber sheet and four layers of 616 g/m
2 bi-axial (BX) glass fiber sheet, each supplied by Cristex Composite Materials, Blackburn, UK. The fiber sheets were arranged in a layup of BX/UD/BX/BX/UD/BX, shown in
Figure 4a. The layup, measuring 600 mm × 400 mm, was then impregnated using an epoxy resin in a vacuum-assisted resin infusion process, as displayed in
Figure 4b. The epoxy resin system used was Hexion resin M135 with Hexion hardeners M134 and M137, and was supplied by PRF Composite Materials, Poole, UK. The epoxy resin impregnated panel was cured in an oven at 50 °C for 24 h. The finished glass fiber epoxy composite substrate measured 2.7 mm thick, and any unusable sections of the panel were removed, as shown in
Figure 4c, prior to coating application.
The wind turbine blade coating system, including leading edge protection (LEP), was then applied to the composite substrate as per the coating manufacturer’s guidelines. Three wind turbine blade coating systems have been tested in this piece of work—Coating A, Coating B, and Coating C. The manufacturers and specific coating details of each system are proprietary information. All three coating systems are industrially relevant and are specifically designed for wind turbine blade protection by major coatings manufacturers.
Each coating system consisted of three distinct layers, a filler layer, a topcoat layer, and an LEP layer. The filler layer was applied using a putty knife and the other coating layers were applied using a fine napped 10 cm roller. After the full coating system application, the coated panels were left for two weeks at ambient conditions to cure.
The cured coated substrate was then cut into smaller specimens measuring 60 mm × 15 mm using a water-jet cutter. The smaller specimens are easily fitted into the rain erosion test rig.
3.2. Rain Erosion Testing
The accelerated rain exposure testing was carried out at the Energy Technology Centre (ETC), East Kilbride, Glasgow, UK. This test rig is of WARER design and is highly characterized with information on water droplet size, droplet rate, the droplet strike rate, and strike location on the specimen known [
16]. This test rig is slightly different to others, such as the more commonly used rig developed by R&D A/S, in that there is a single circumference of needles to create water droplets as opposed to the R&D A/S rig which has multiple circumferences of needles [
17]. As a result, the ETC rig gives a more focused water droplet creation pattern. Within testing at the ETC facility, pure water was used for the droplet creation as to eliminate any uncertainty linked to water contamination, dissolved pollutants, and suspended solids.
A staged approach to rain exposure testing has been proposed by the authors [
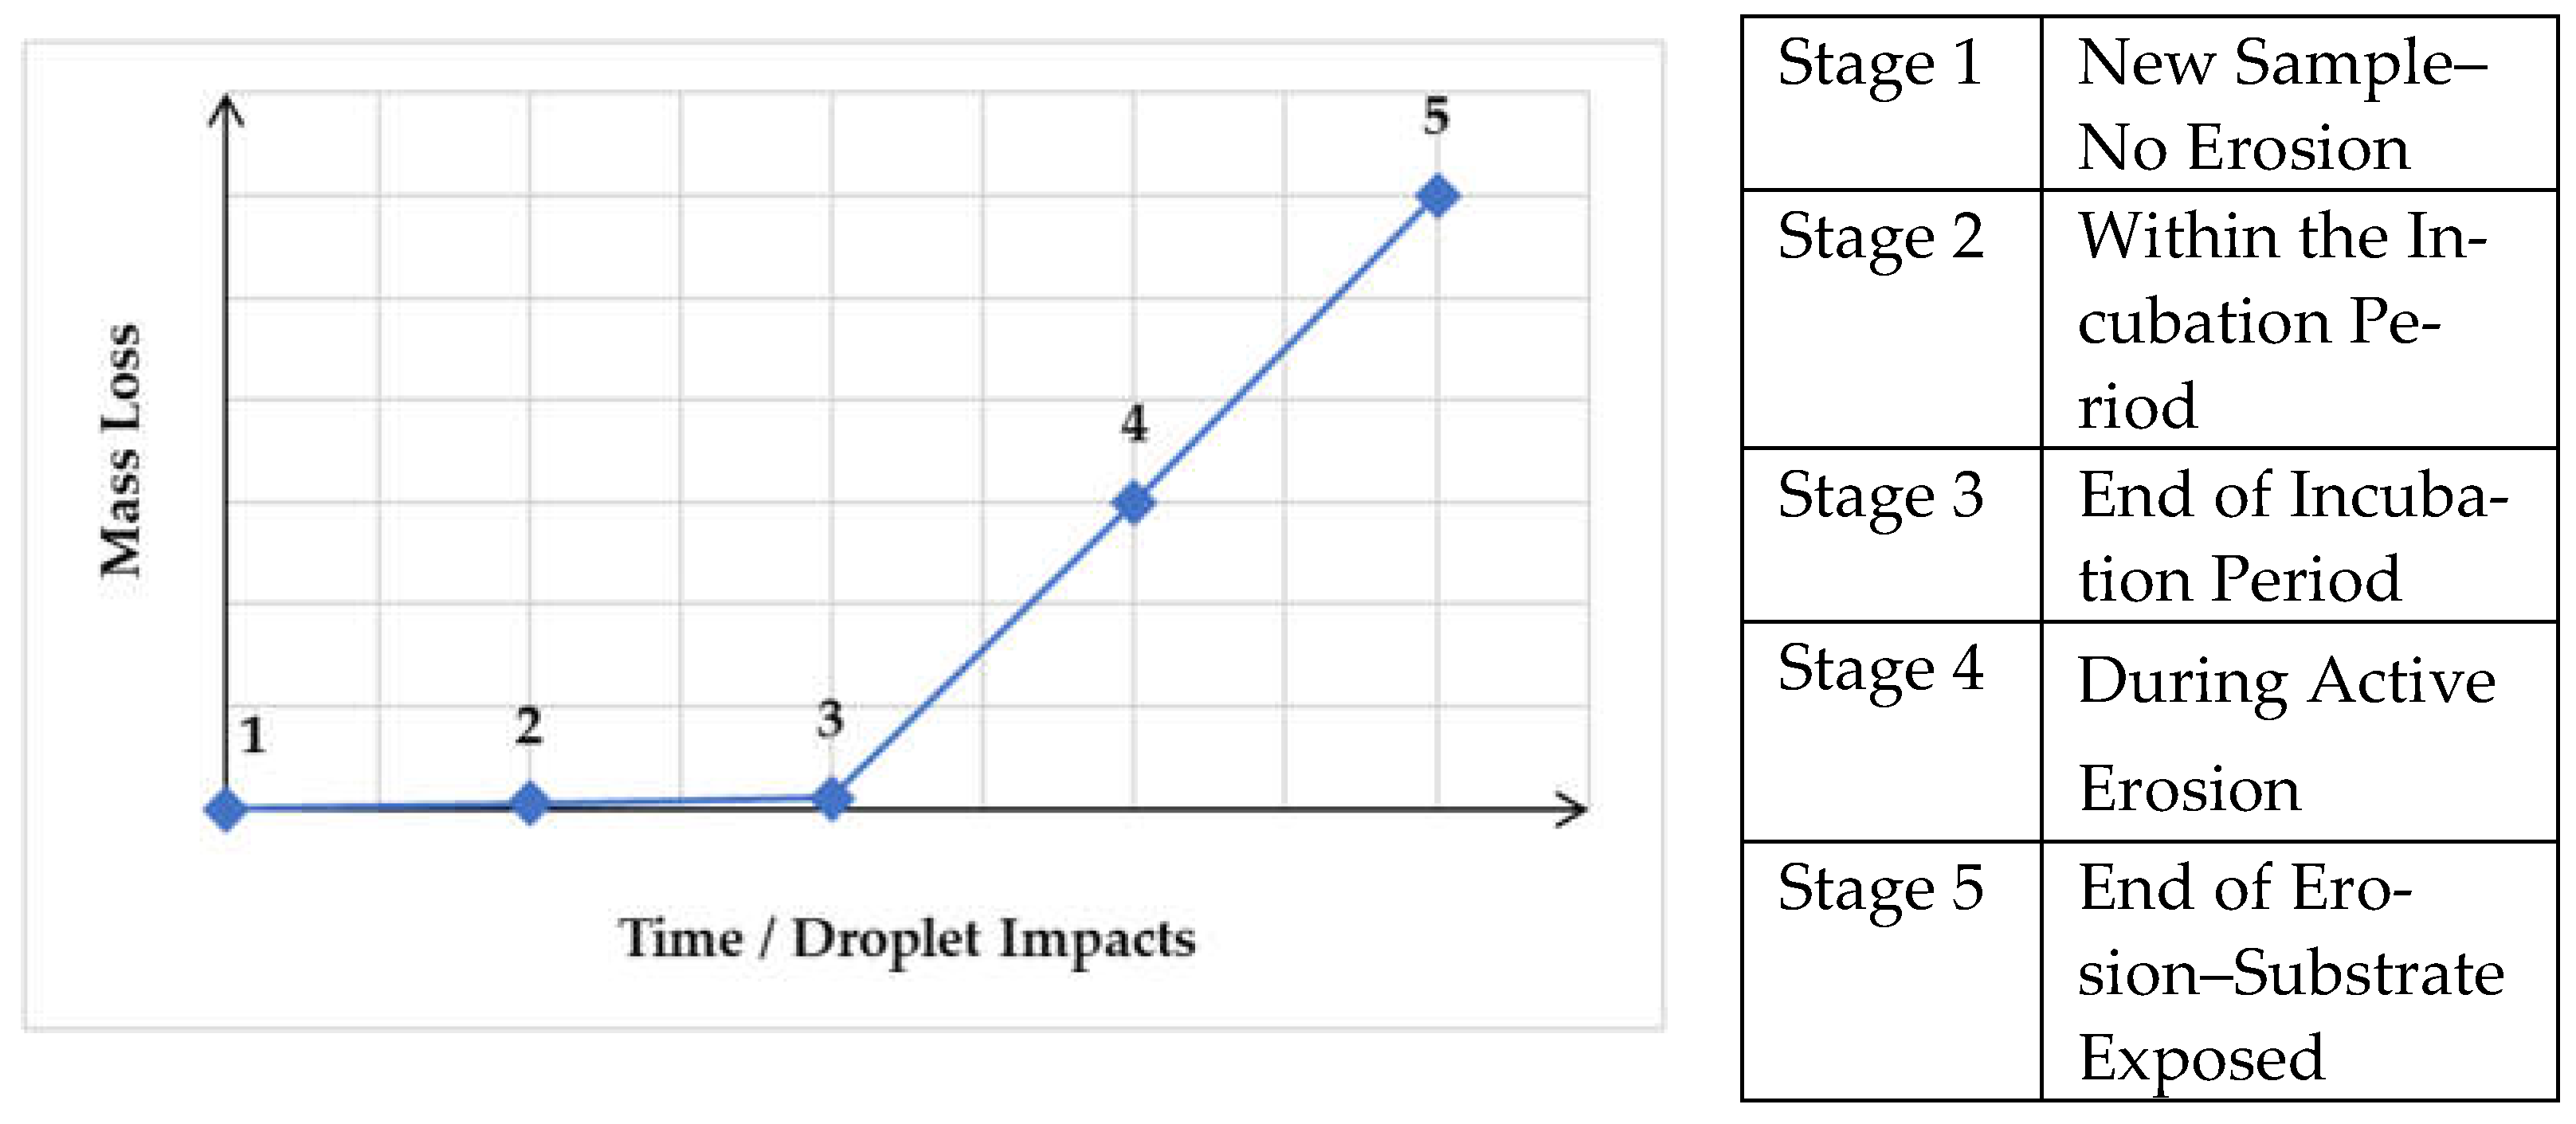
18] where stages of erosion were identified and assessed, and the specimens were exposed in the rig until a specific erosion stage was reached. The staged approach to erosion testing can be visualized on
Figure 5, where the plot of the number of droplet impacts vs. specimen mass loss is used. The erosion stages range from 1 to 5, where stage 1 is a specimen with no erosion at all—a new, fresh sample with a pristine surface; stage 2 is within the incubation period, the period where the specimen is exposed to RET but no visual damage or mass loss is observable; stage 3 is at the end of incubation period/the beginning of active erosion; stage 4 is during active erosion; and stage 5 is towards the end of active erosion where the composite substrate of the specimens begins to be exposed.
The amount of impact energy from the water droplets required to reach each erosion stage on every individual specimen was calculated. The number of droplets which have impacted the specimen are estimated by multiplying the time spent in the rig with the characterized droplet strike rate, this was known from previous work on the ETC test rig [
19]. Now that the amount of droplet impacts is known, the total amount of impact energy caused by the droplets on the specimen can be calculated. This is done by calculating the kinetic energy of an impact—the droplet mass multiplied by the impact velocity squared—then multiplying through for the total amount of droplet impacts. Note that the impact velocity of the droplets was taken to be the linear velocity of the test rig rotating arm.
Four specimens per stage were tested for coating A and five specimens per stage were tested for coatings B and C. The testing was not cumulative; therefore, a new specimen was exposed from stage 1 to the targeted stage during each test.
3.3. Measurement of Surface Glossiness
The measurement device used to quantify the surface gloss was a Rhopoint Instruments (St. Leonards, UK) IQ Goniophotometer 20°/60°/85°. This device was selected as it can measure multiple angles during one measurement period and it is also capable of measuring haze and reflected image quality.
Prior to the measurement of samples, the glossmeter was calibrated against the calibration tile for the device to ensure correct working order. First, the gloss of each specimen was measured using the Rhopoint IQ at 60° before the specimen was exposed to any accelerated rain testing to allow for a baseline of glossiness to be obtained. 60° was selected as the coating surfaces appeared to have a mid-gloss finish from visual inspection. All specimens were measured five times, each time moving the measurement zone slightly. The active area for each measurement is small, at around 2 mm2. The five measurements were then averaged to find the mean glossiness of the coating. This allows for a representative measurement of glossiness for the whole sample.
The glossiness was then measured for each specimen, again using 60°, after the specimen was exposed to the accelerated rain period in the RET. The same method of measurement was used where five measurements were taken and then averaged to find the mean glossiness per specimen. The measurement zone for the specimens that were exposed to accelerated rain was focused on where the rain droplets hit the specimen—due to the nature of the erosion rig (single droplets, not a spread of droplets) there is a defined zone on each specimen which received the majority of the rain droplet impacts.
The mass of all specimens was also measured before and after each period of accelerated rain exposure. The mass measurements were taken after a period of two weeks at ambient conditions to allow the specimens to fully dry out eliminating any water retention. An A&D Instruments (Abingdon, UK) GR-120-EC mass balance was used to weigh all specimens.
A Leitz Ergolux optical microscope with a Leitz NPL FLUOTAR 10x/0.22 lens was used to capture magnified images of each specimen’s surface. The magnified surface images allow for a detailed visual observation of the surface at each stage of erosion which are used for comparison between stages.
Additionally, photographs of each specimen were taken, using the rear 12-megapixel camera on a Samsung Galaxy S9, to allow for a more general visual comparison between erosion stages.
4. Results
4.1. Photograph Imaging
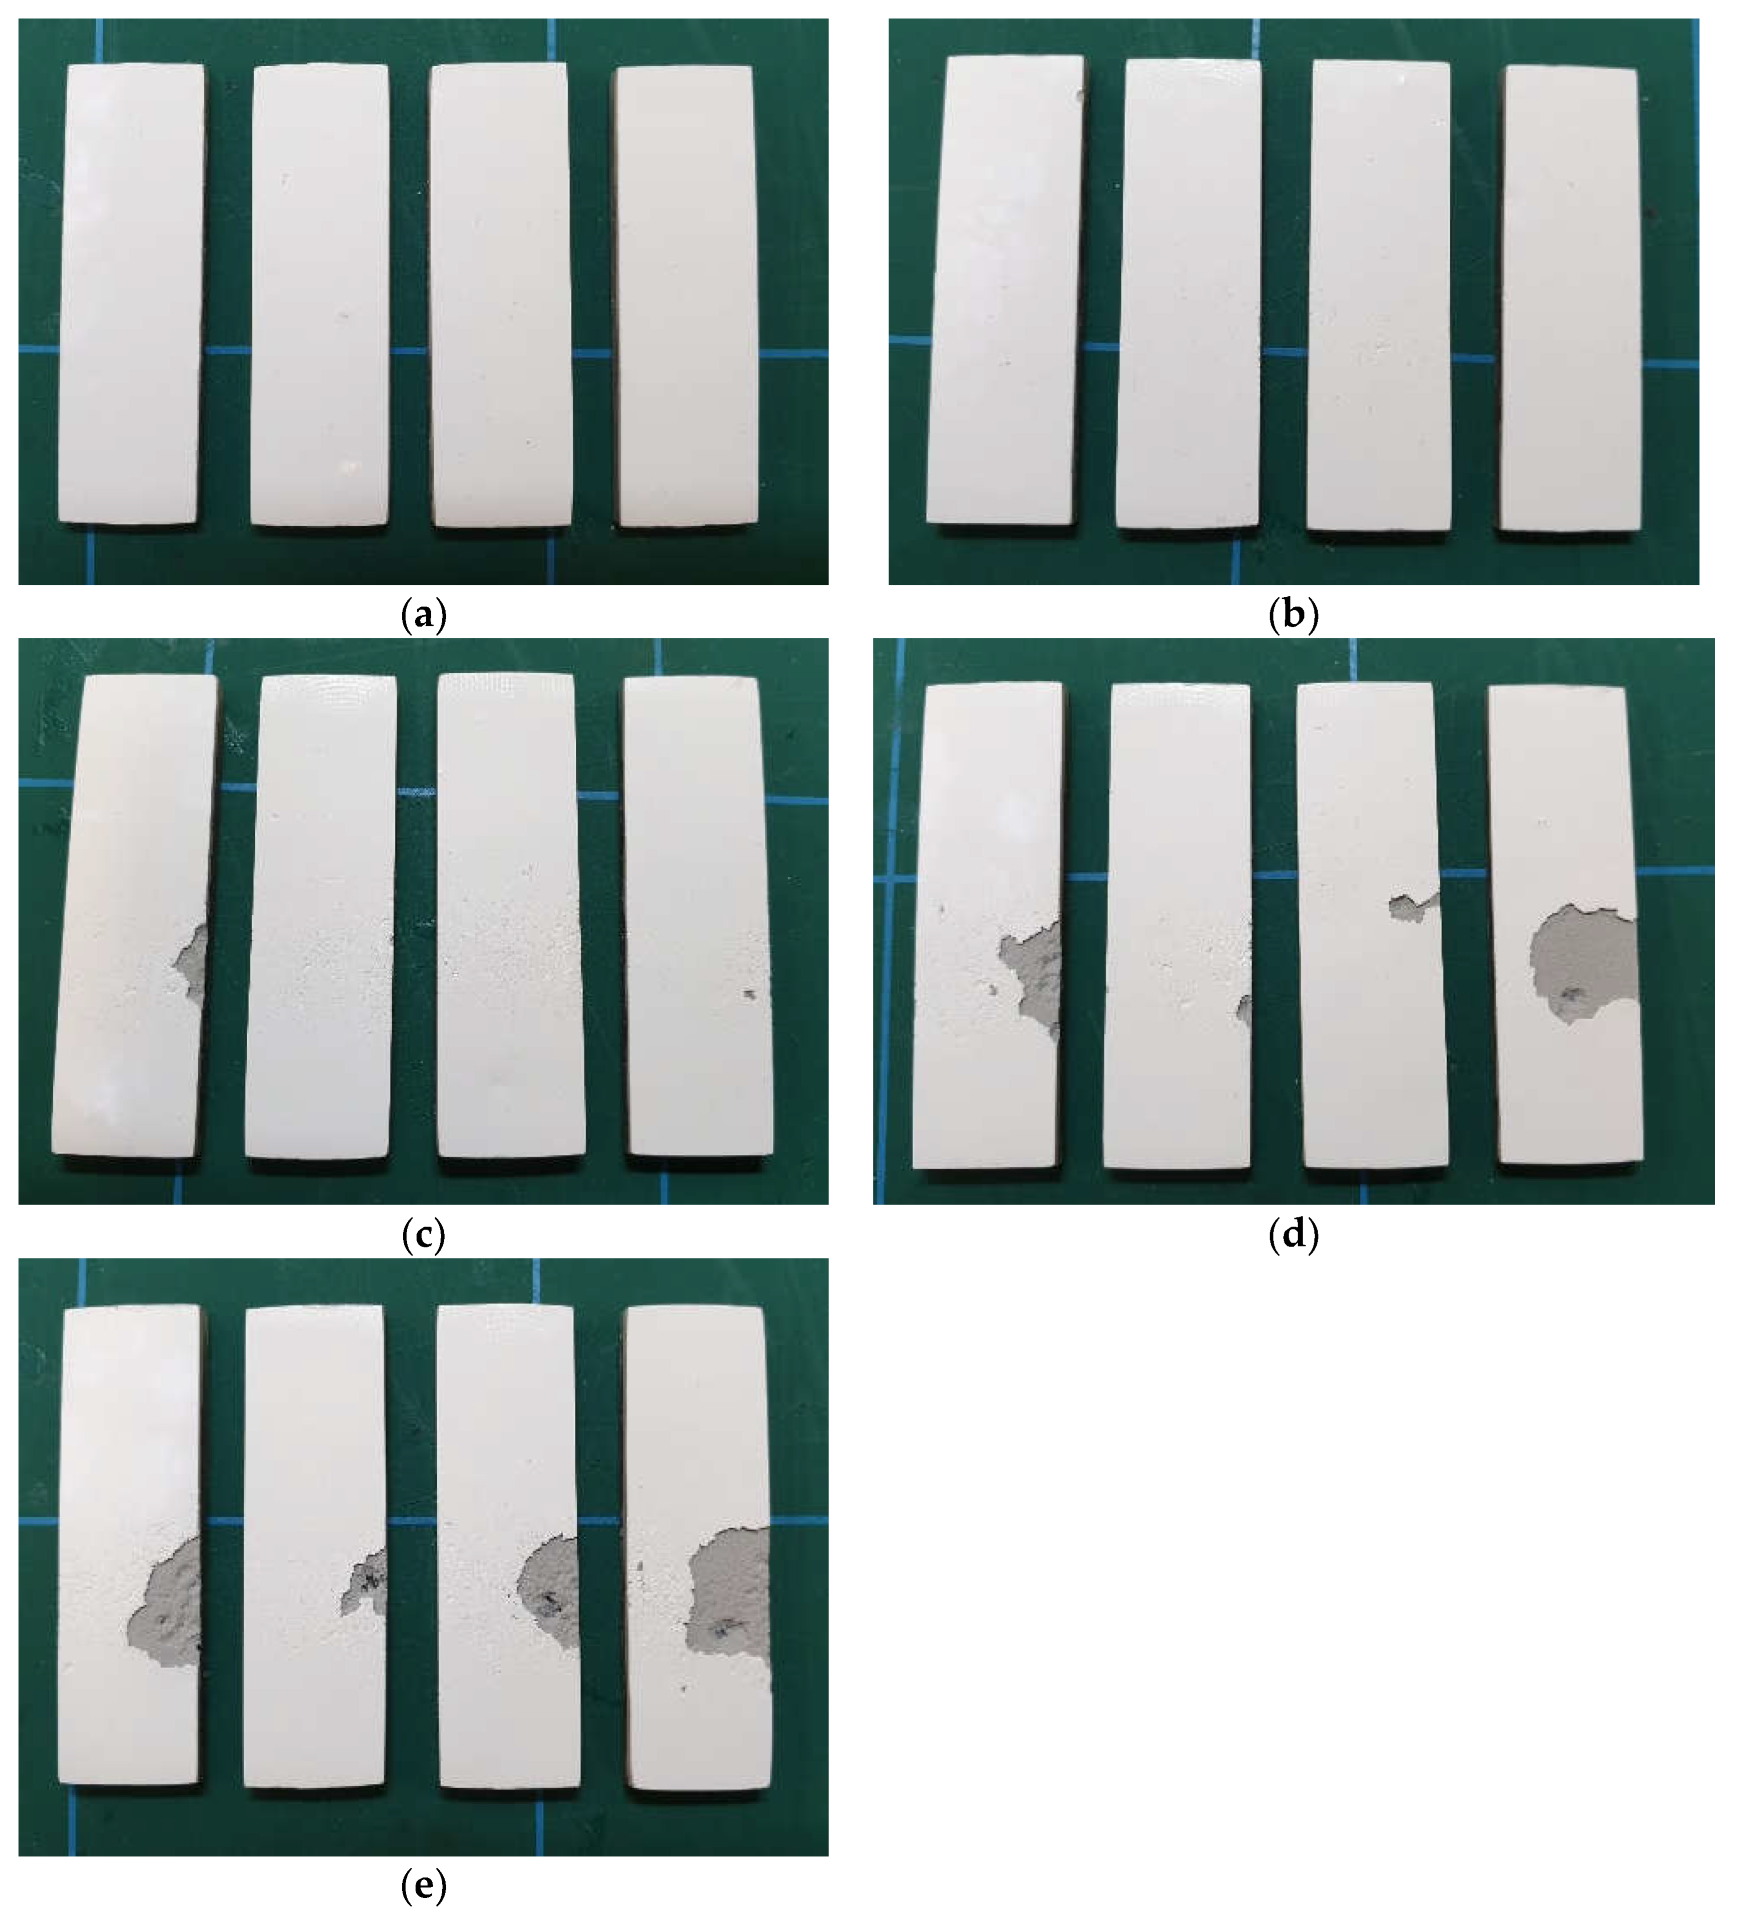
Figure 6 presents images of four individual specimens with coating A after each erosion stage.
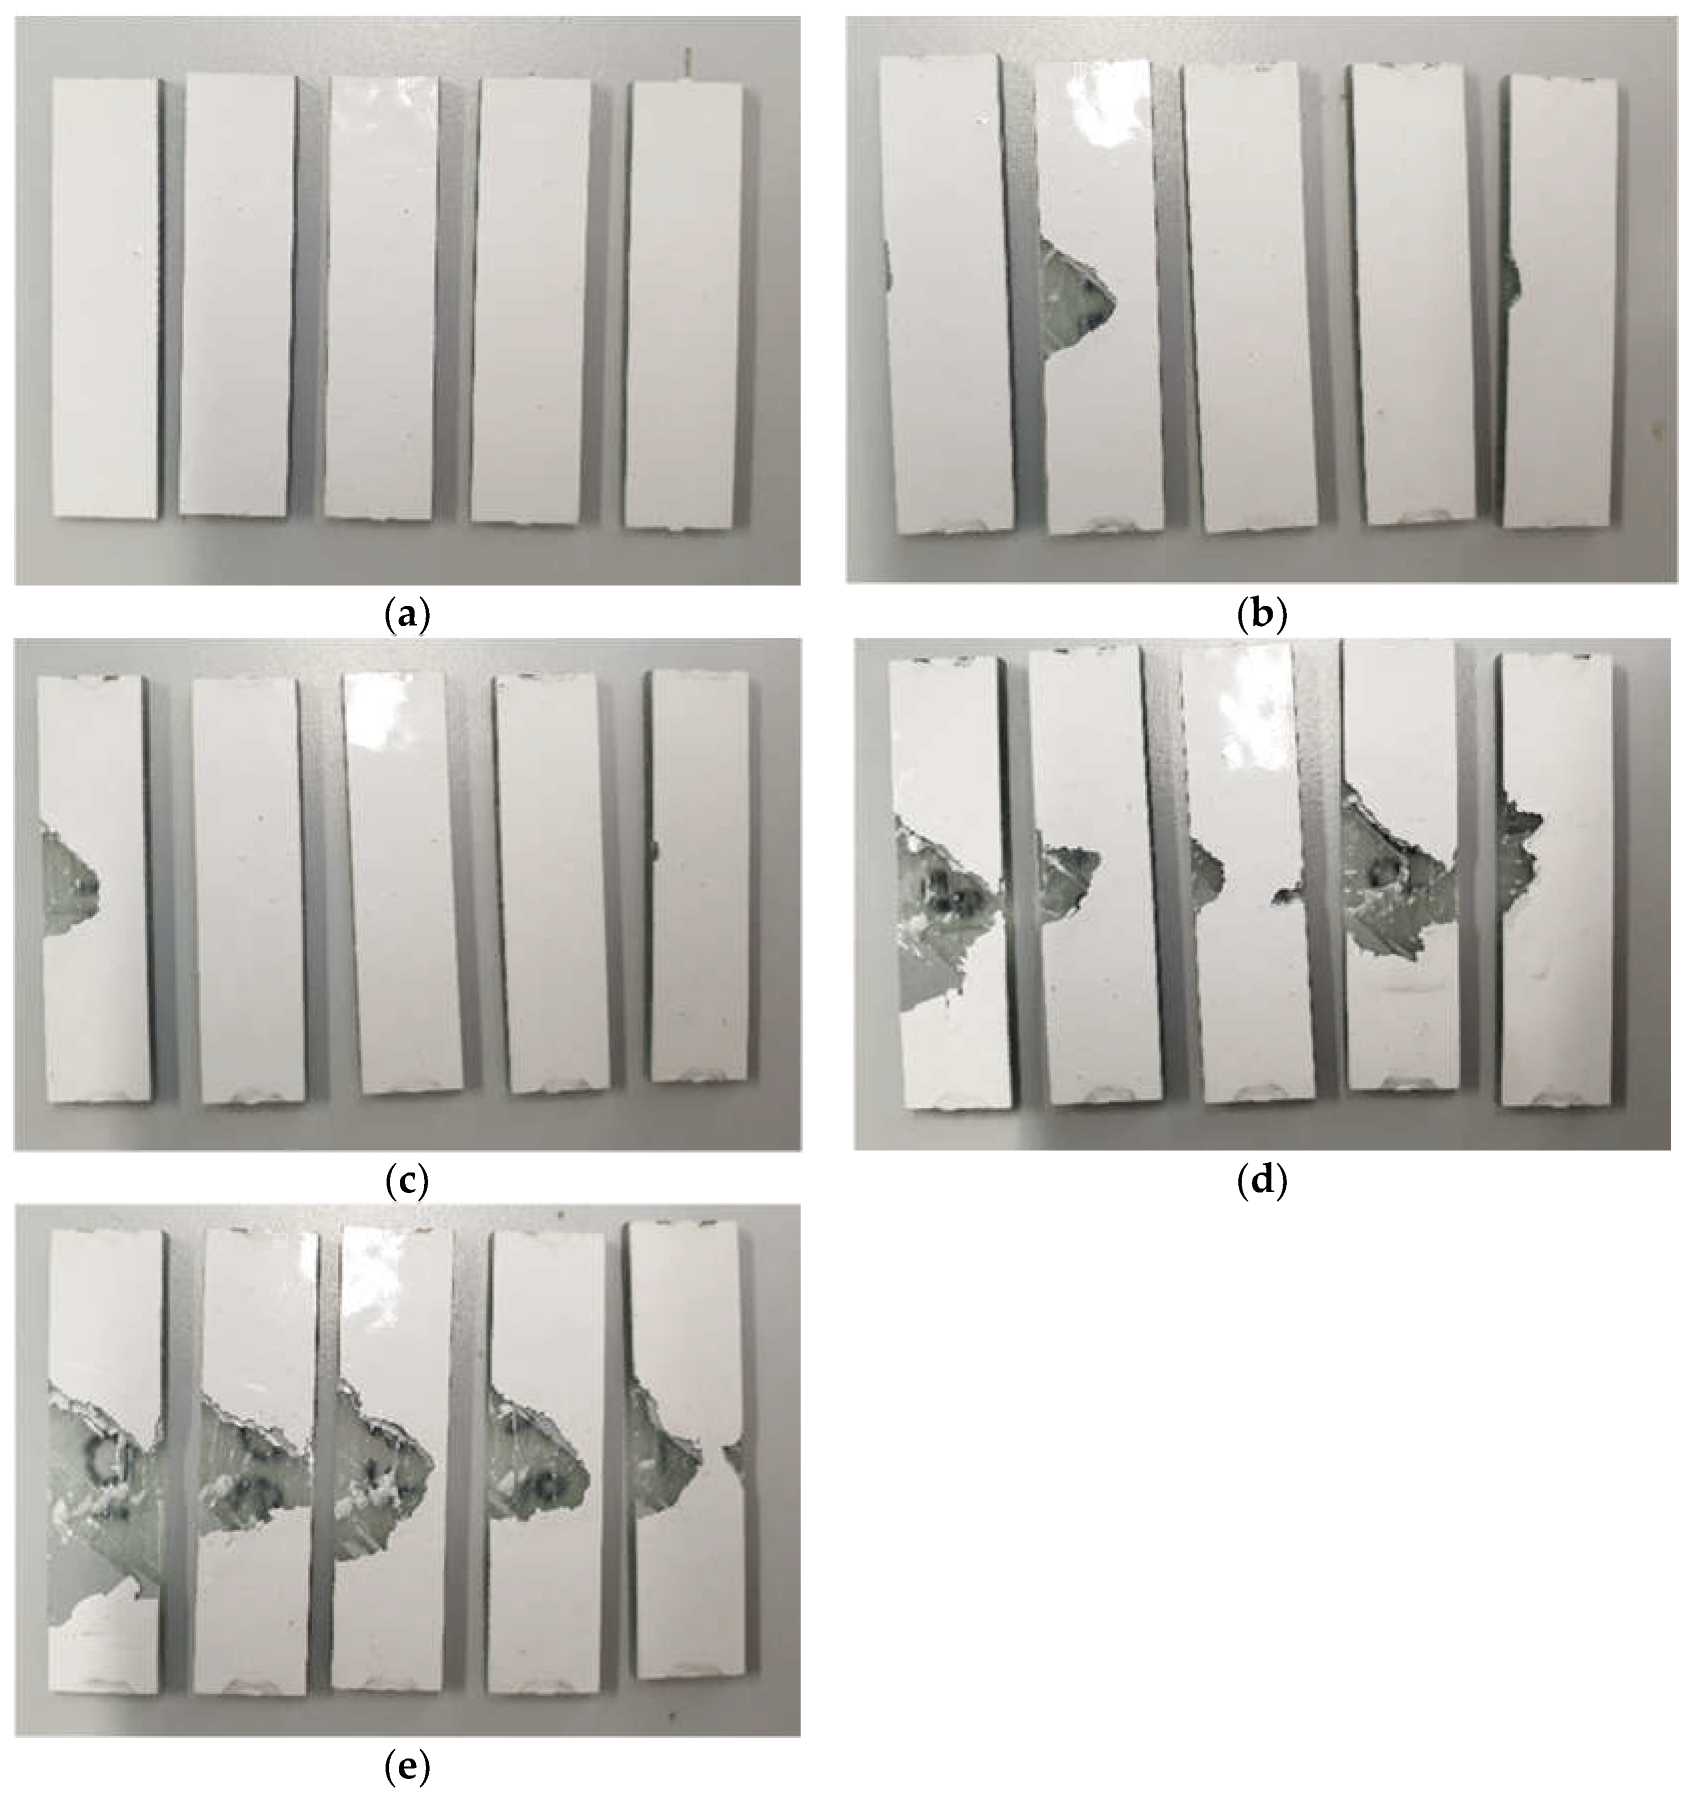
Figure 7 presents images of five individual specimens with coating B after each erosion stage.
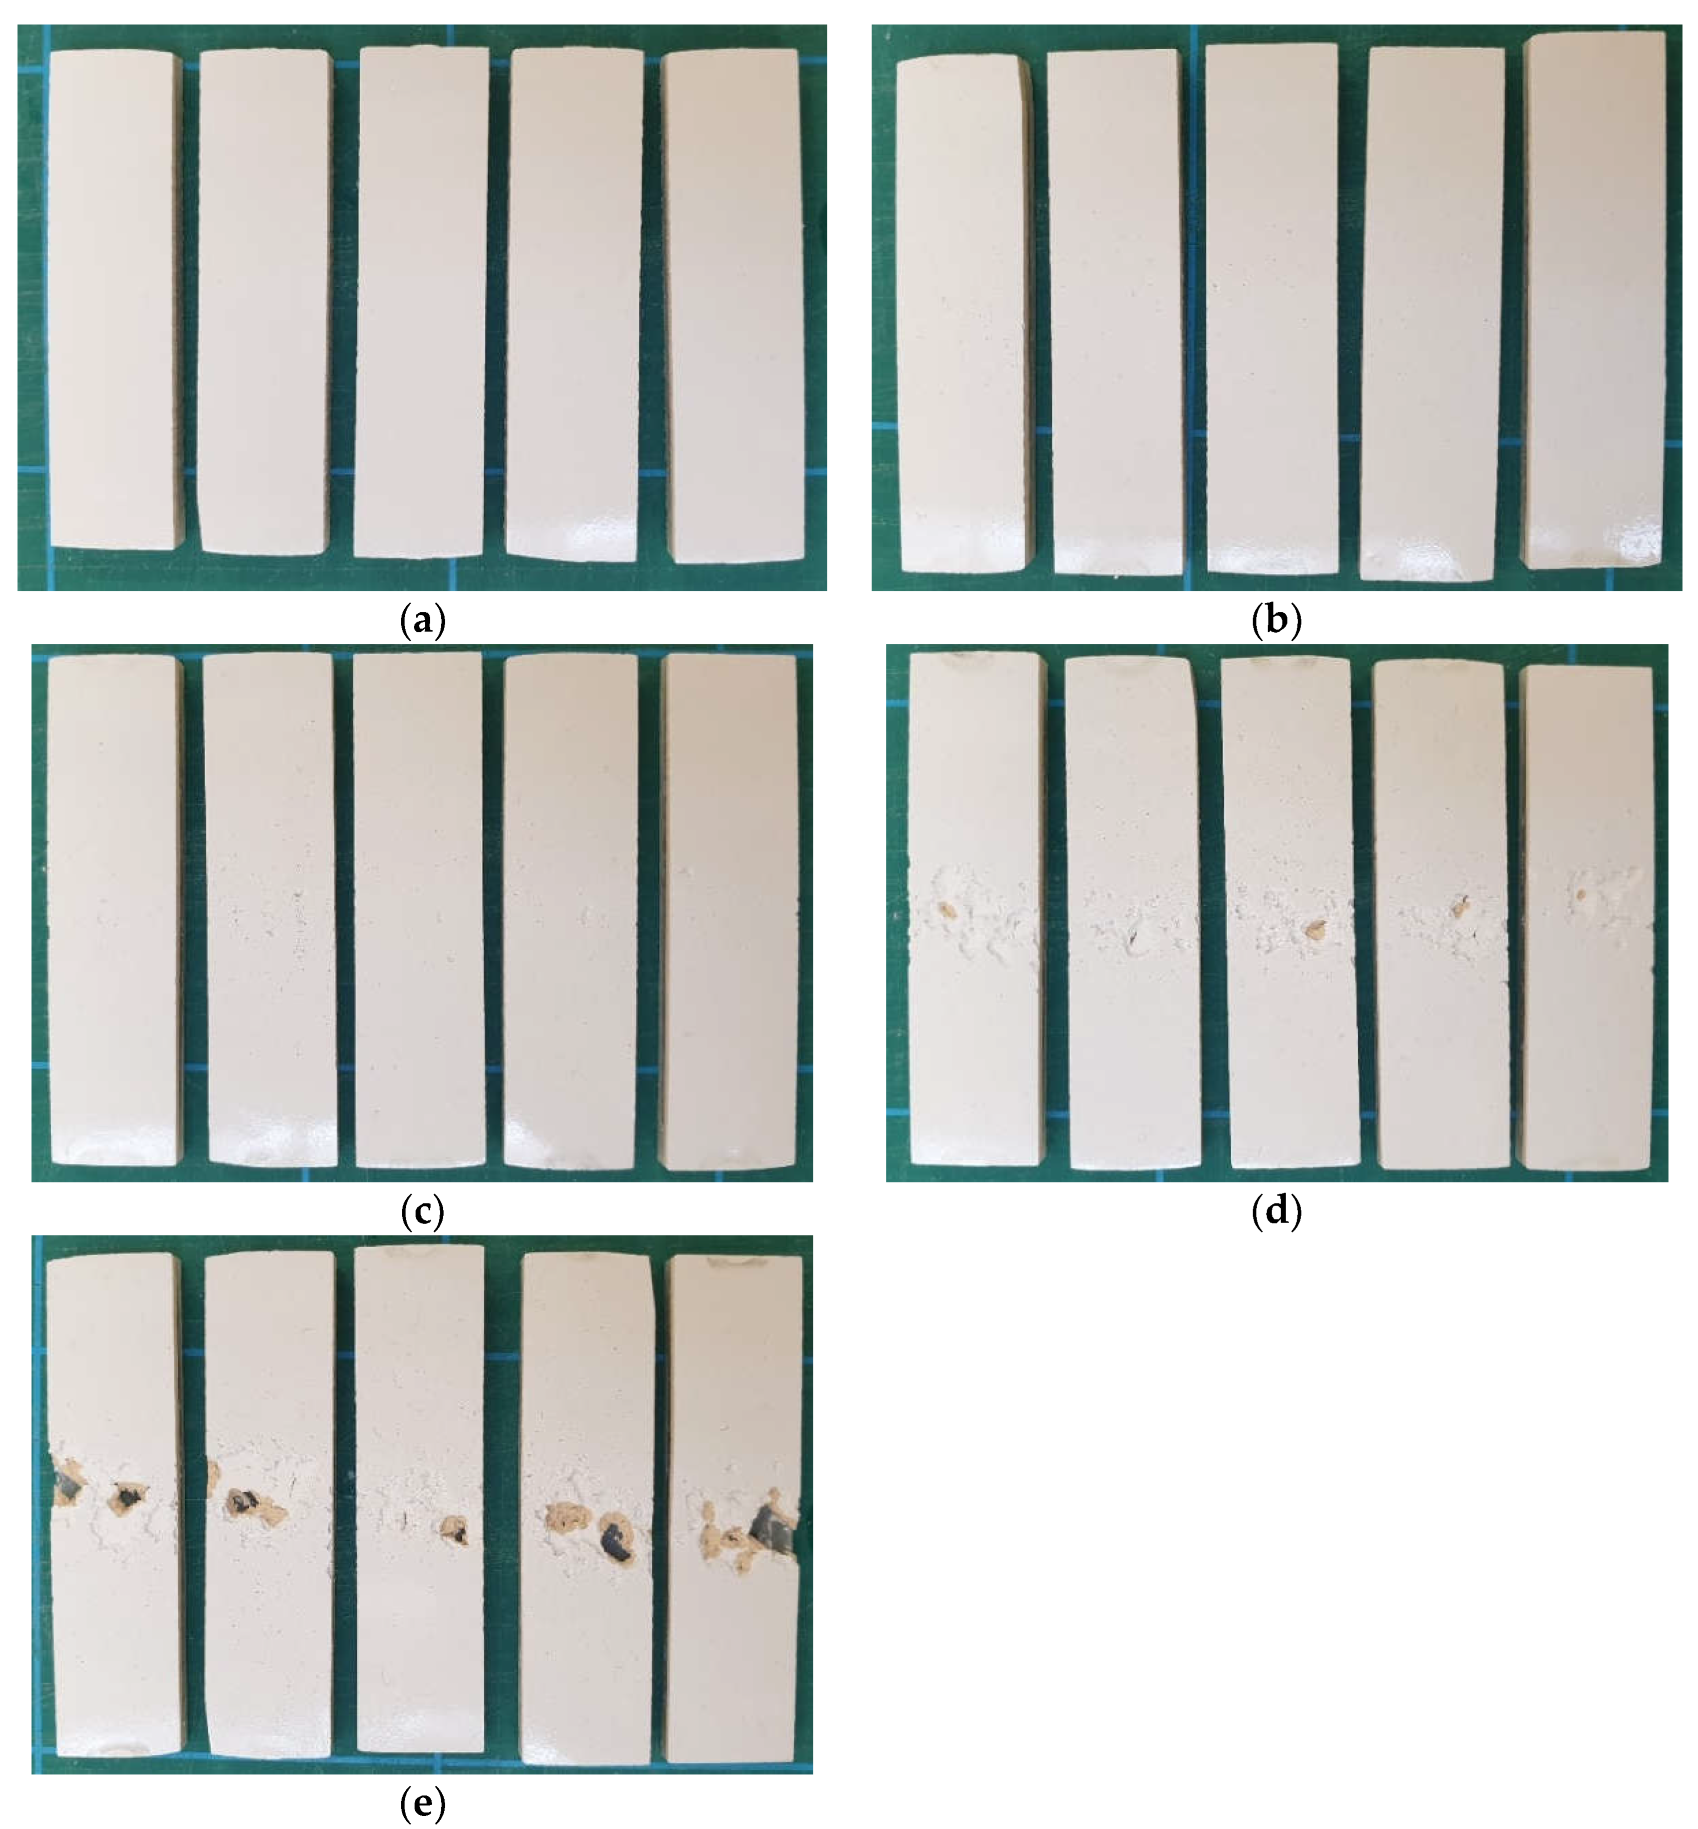
Figure 8 presents images of five individual specimens with coating C after each erosion stage.
4.2. Microscopic Imaging
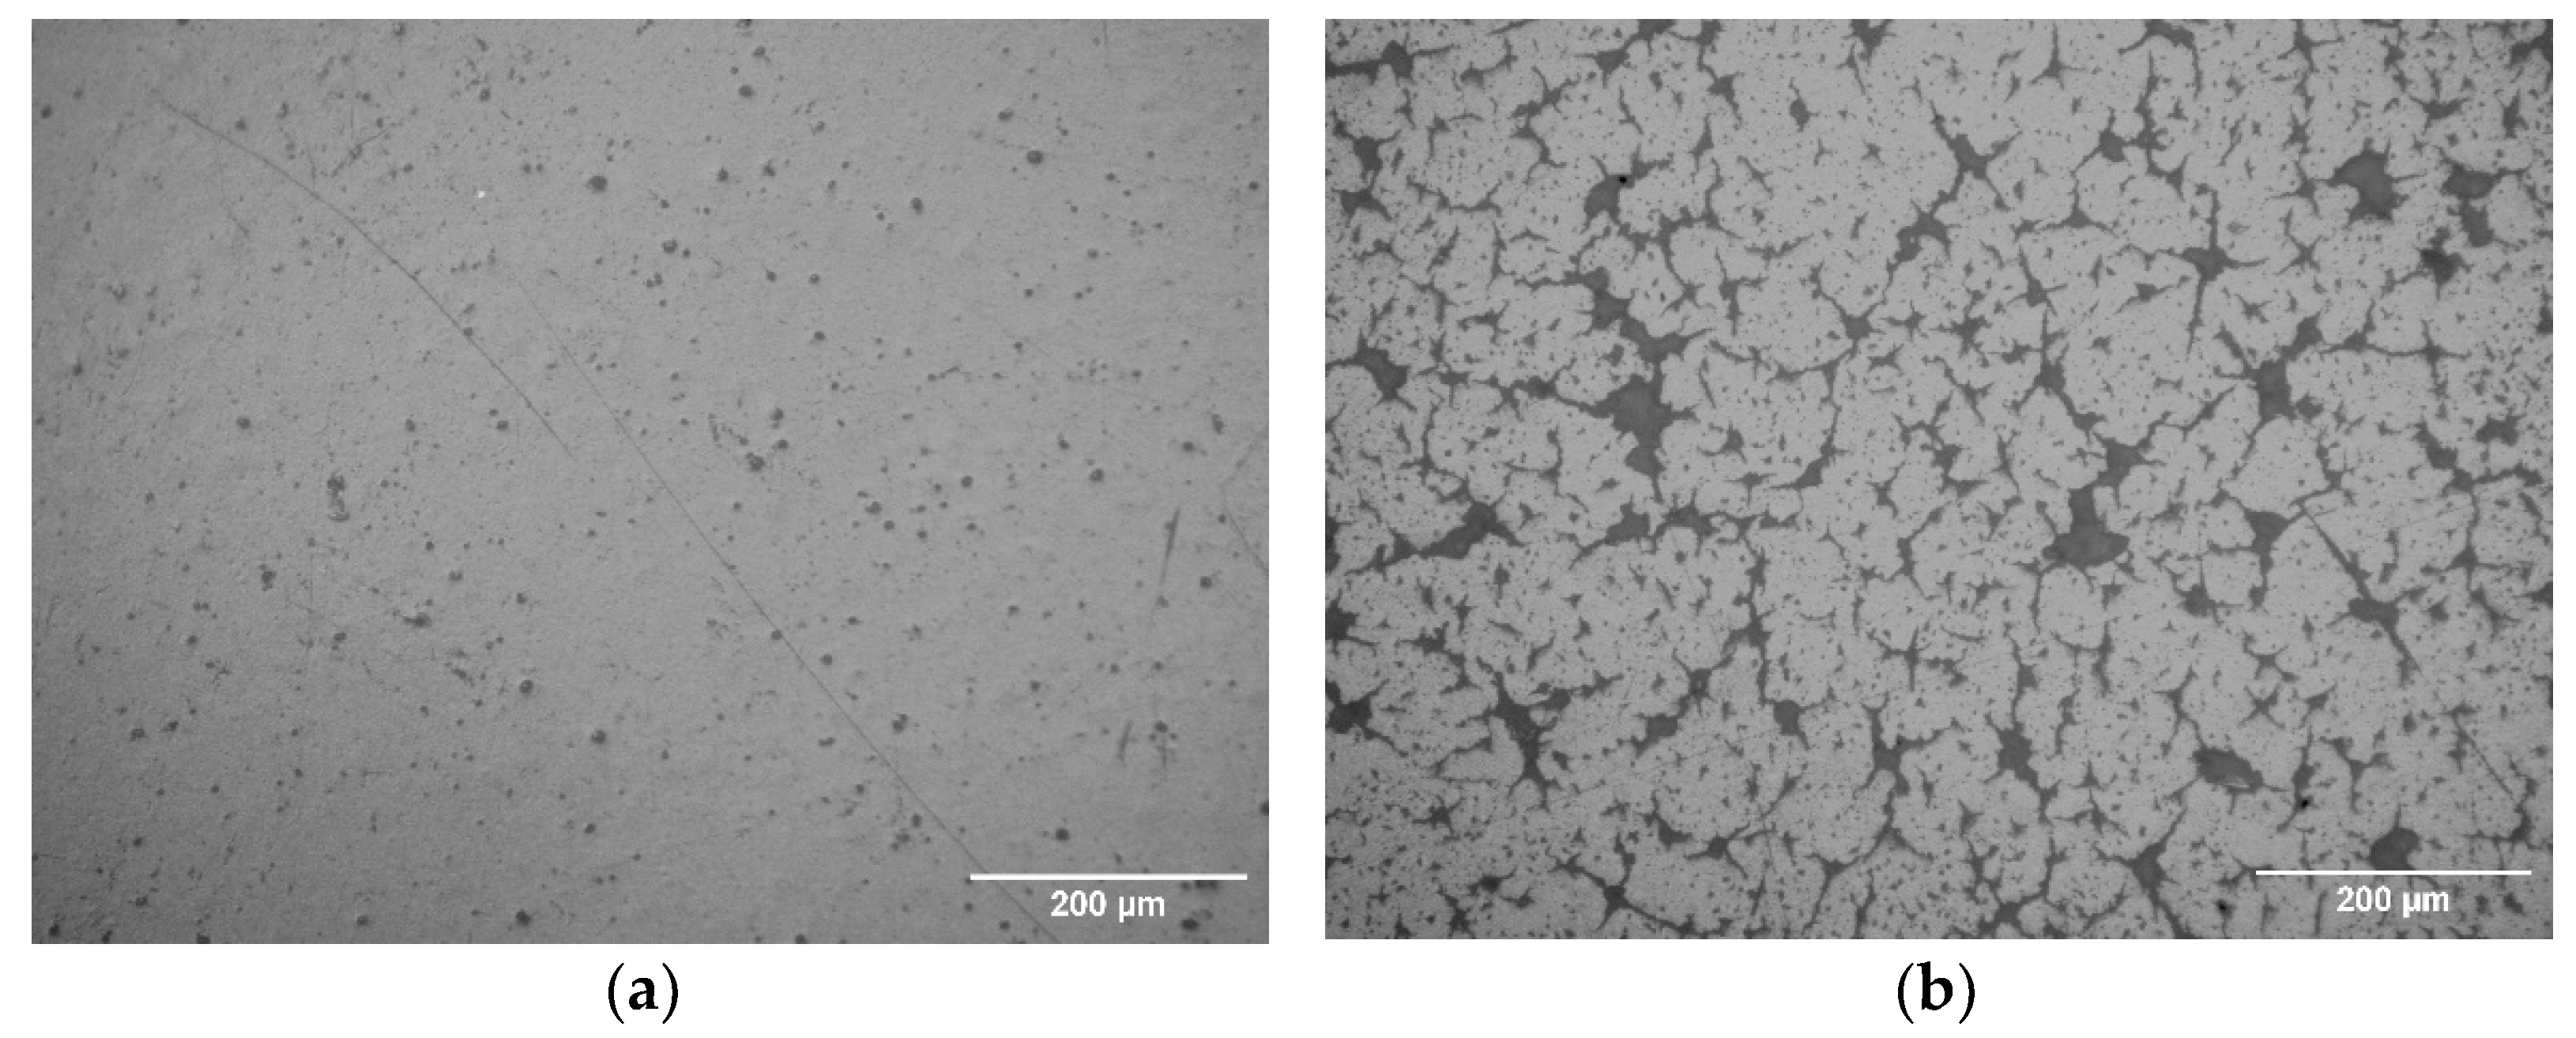
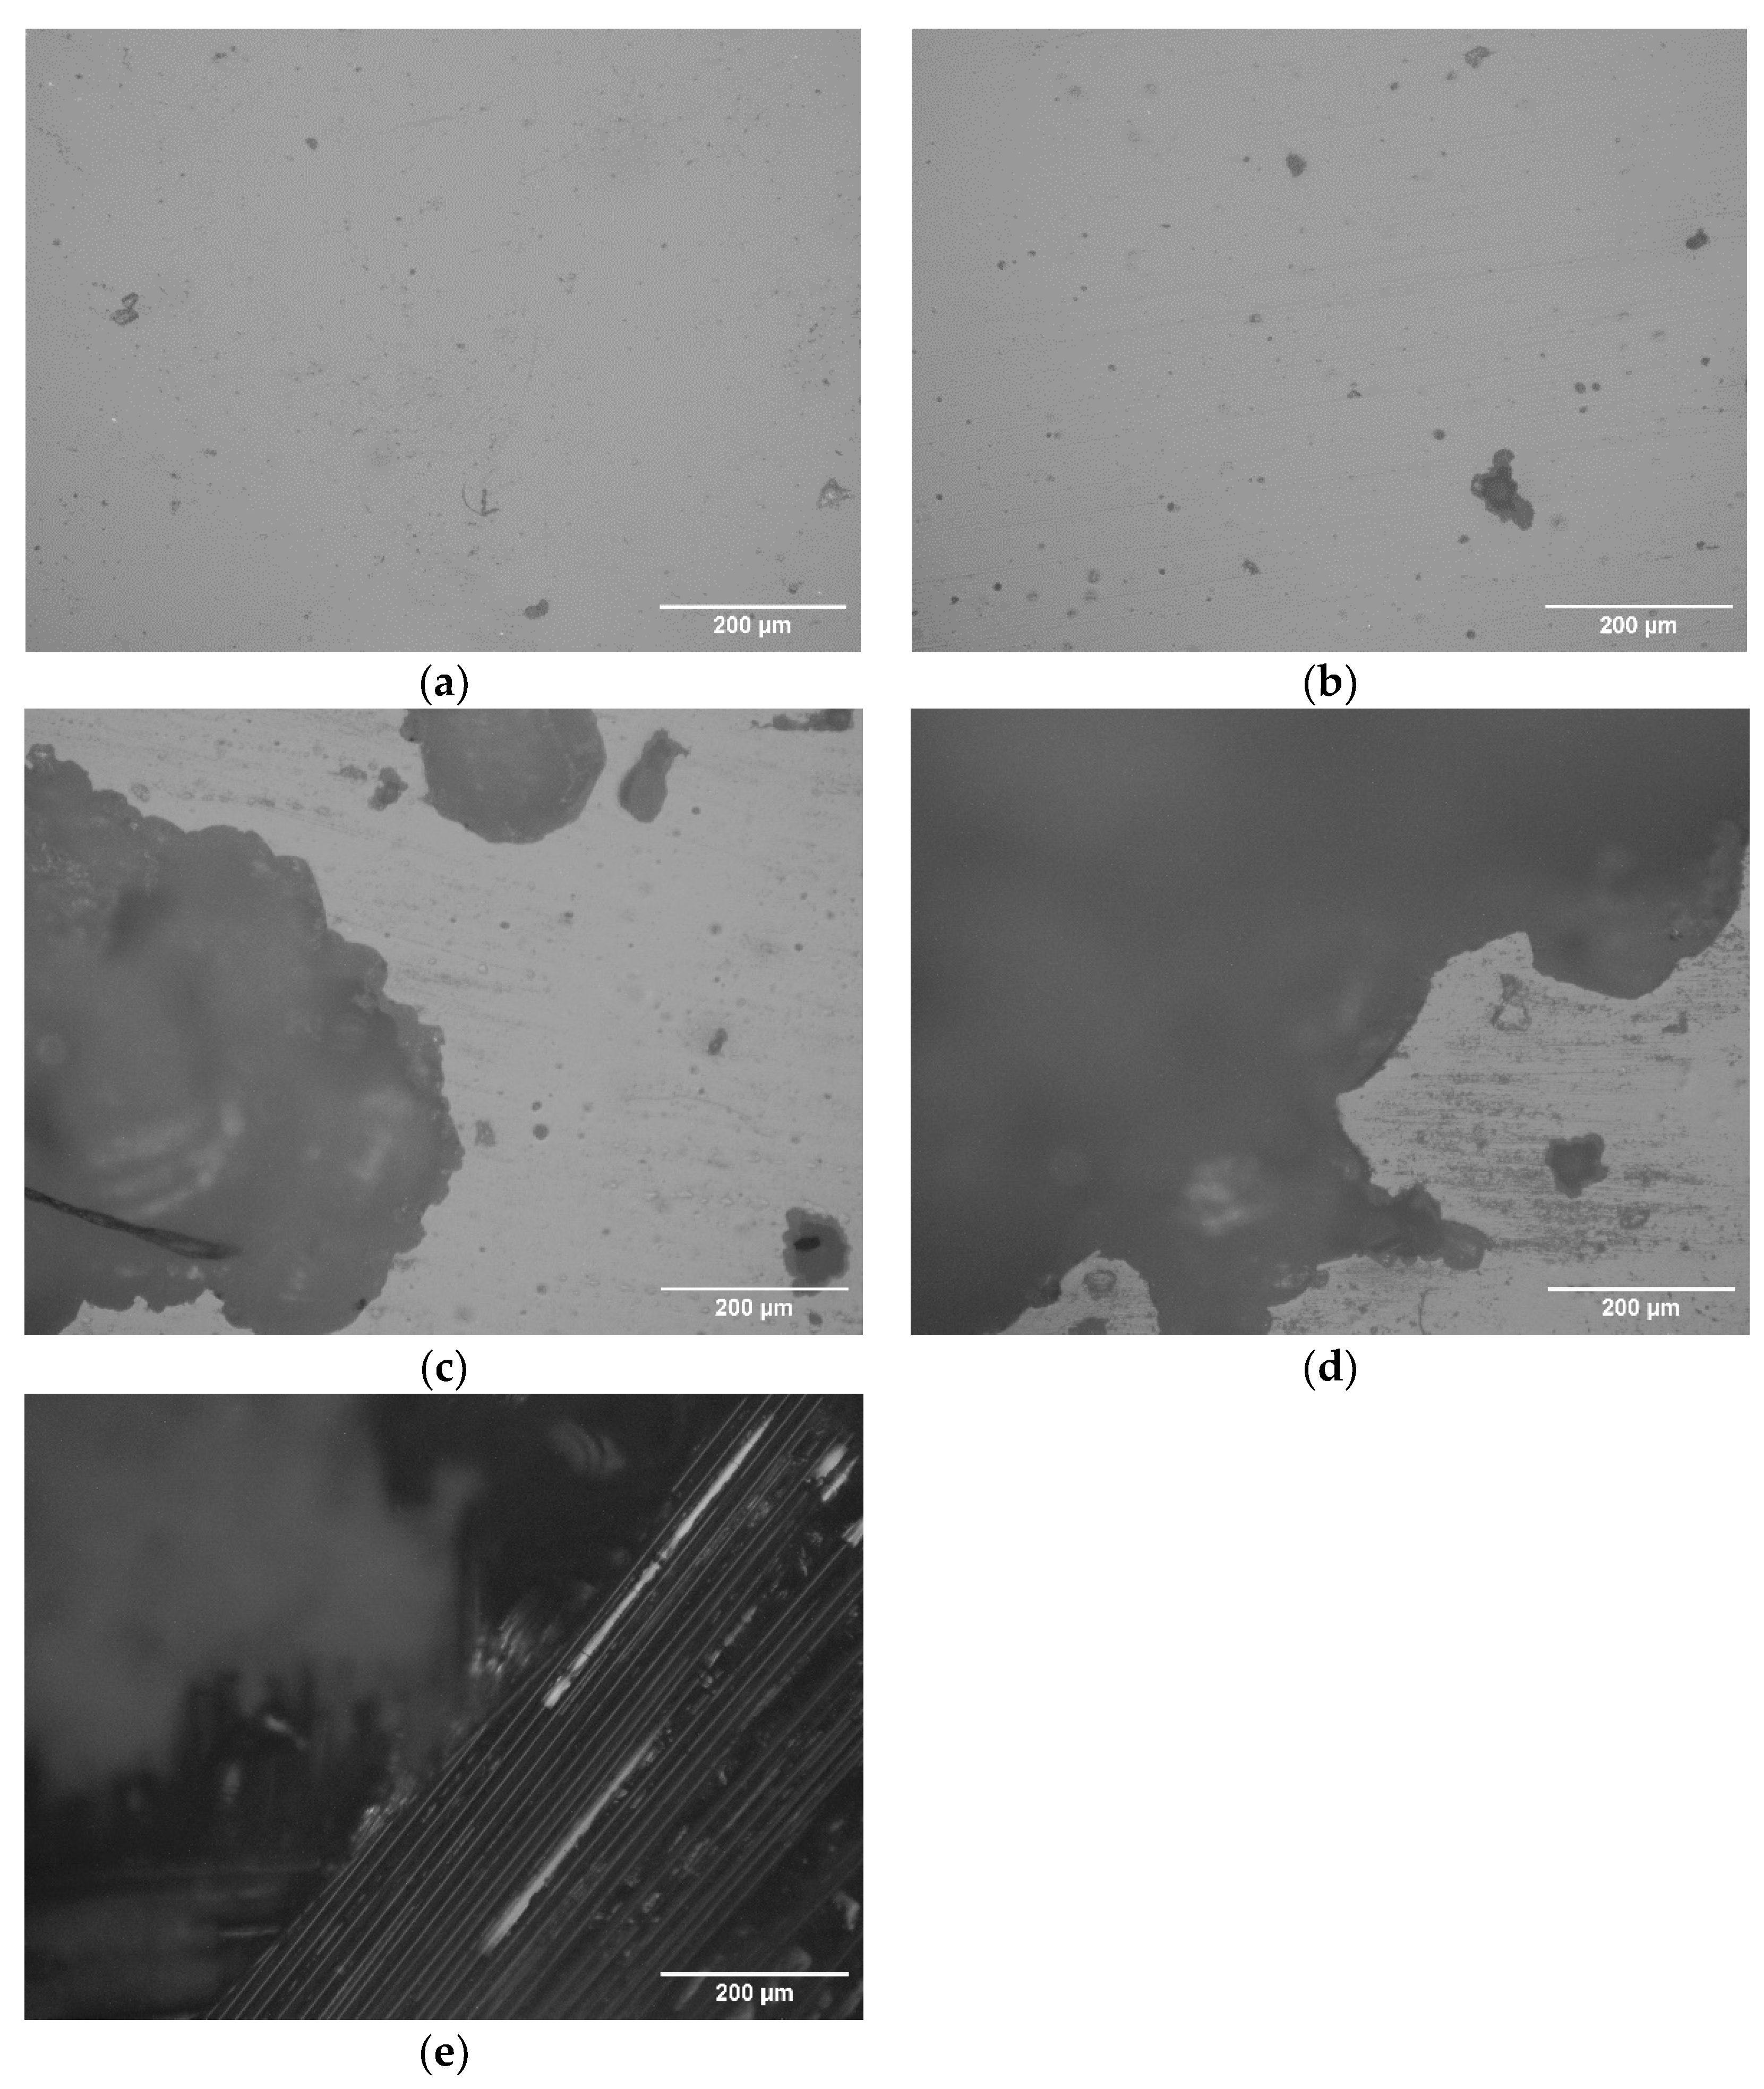
Figure 9 presents a microcopy image of a representative sample with coating A after each erosion stage.
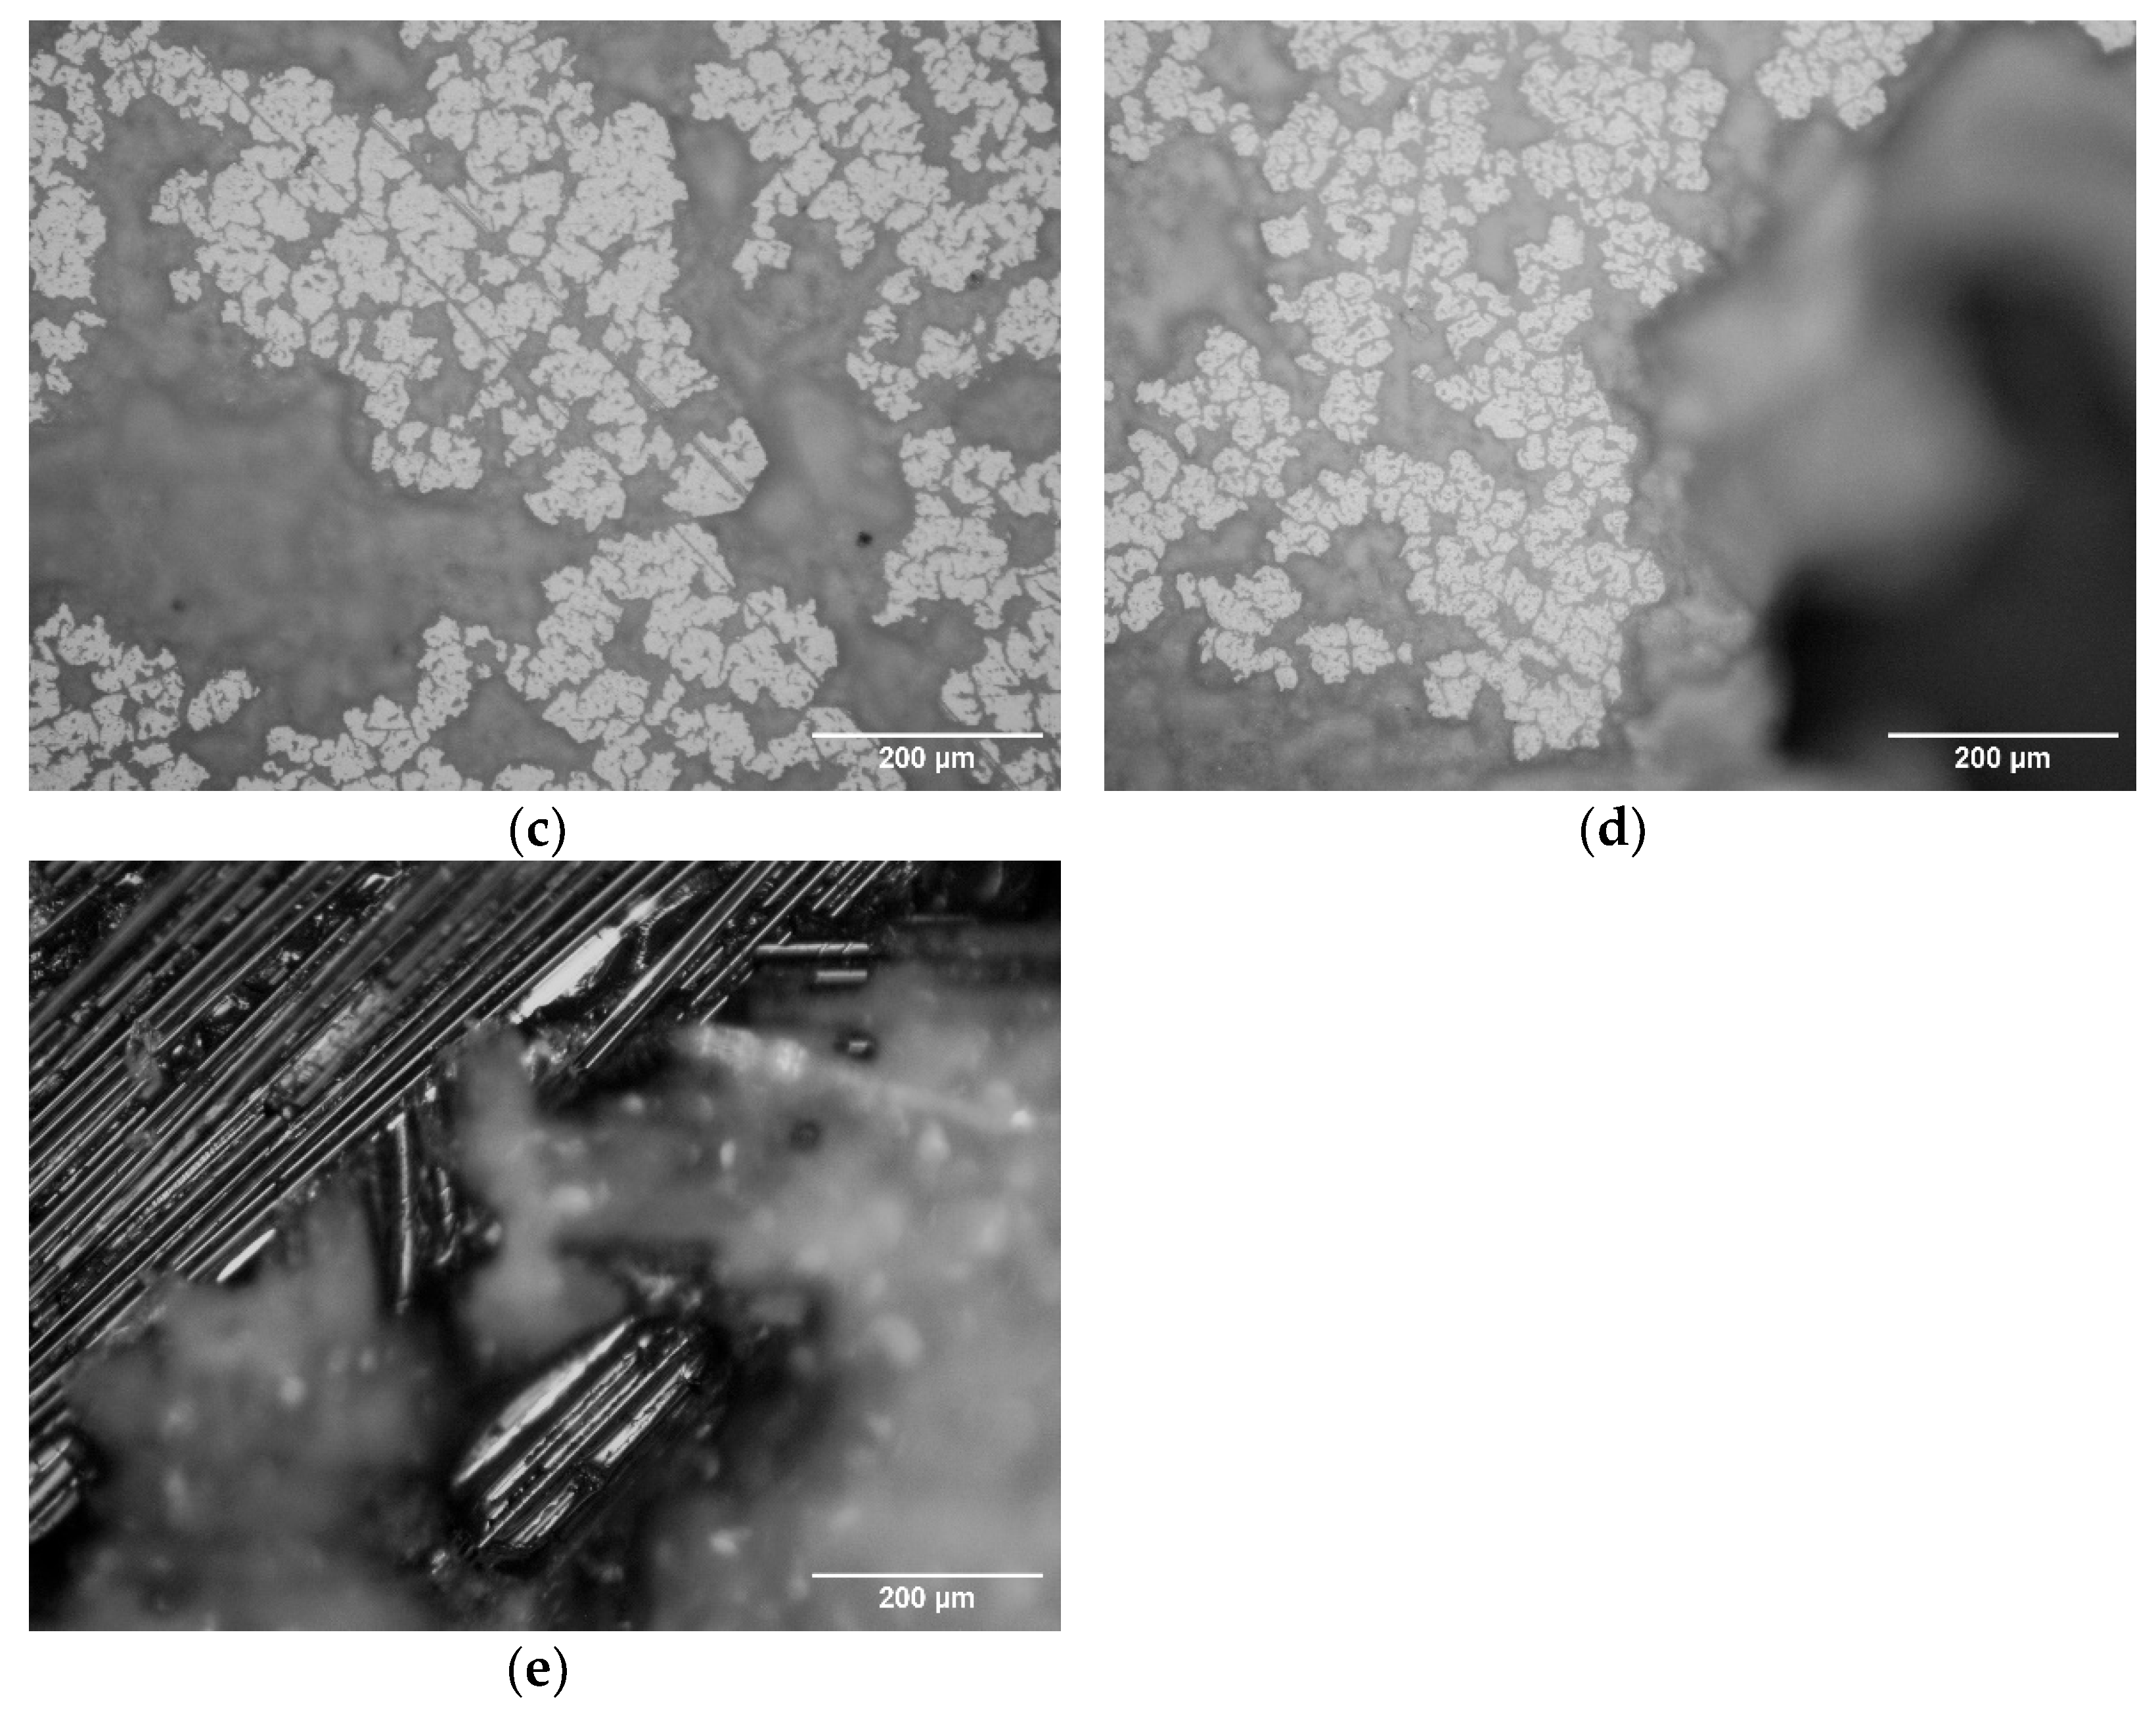
Figure 10 presents a microcopy image of a representative sample with coating B after each erosion stage.
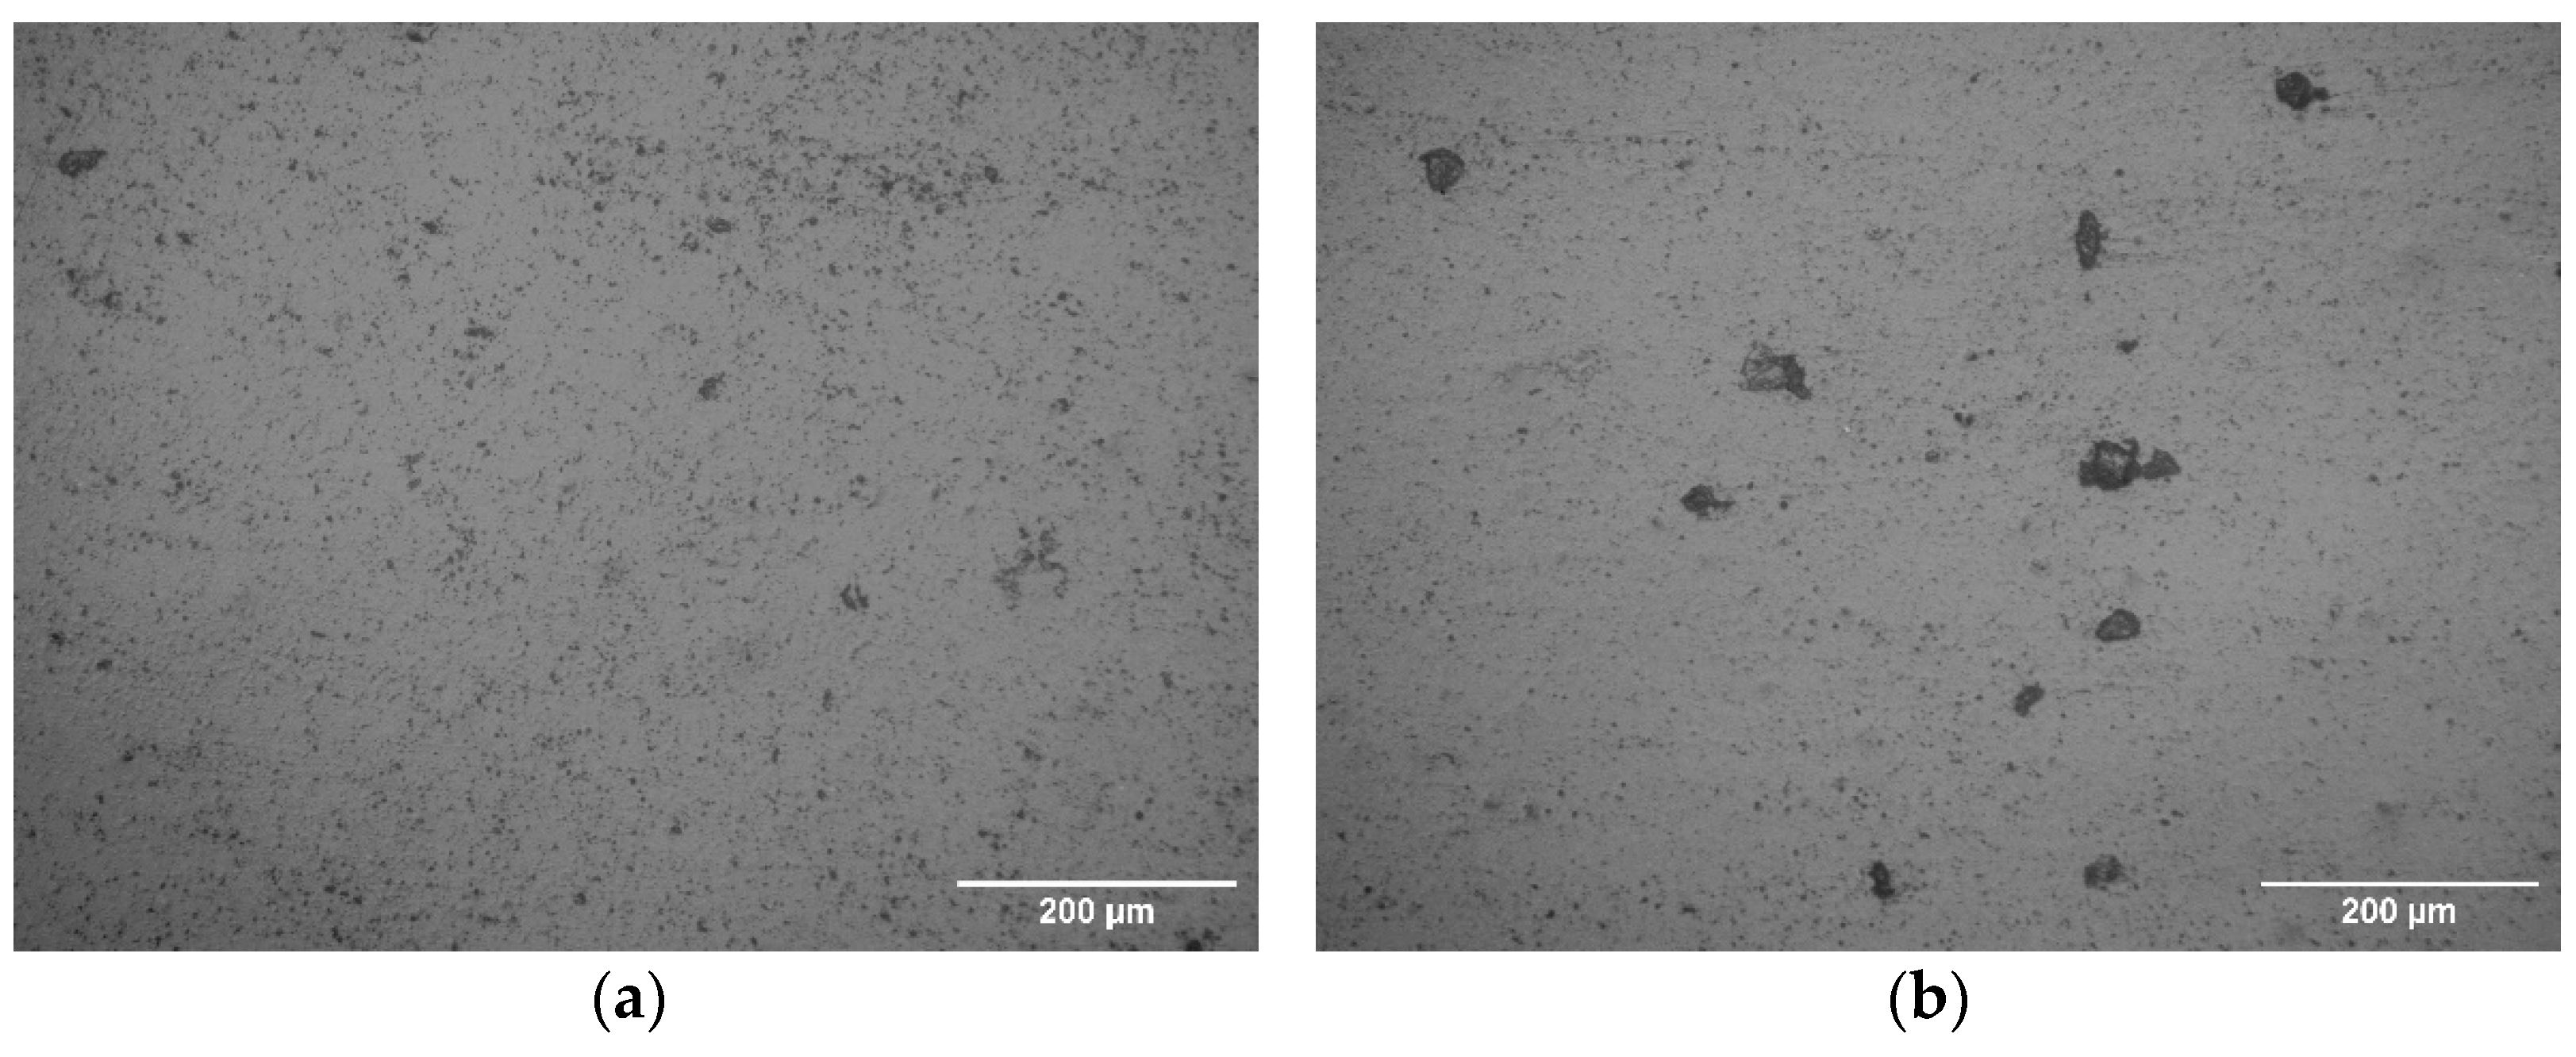
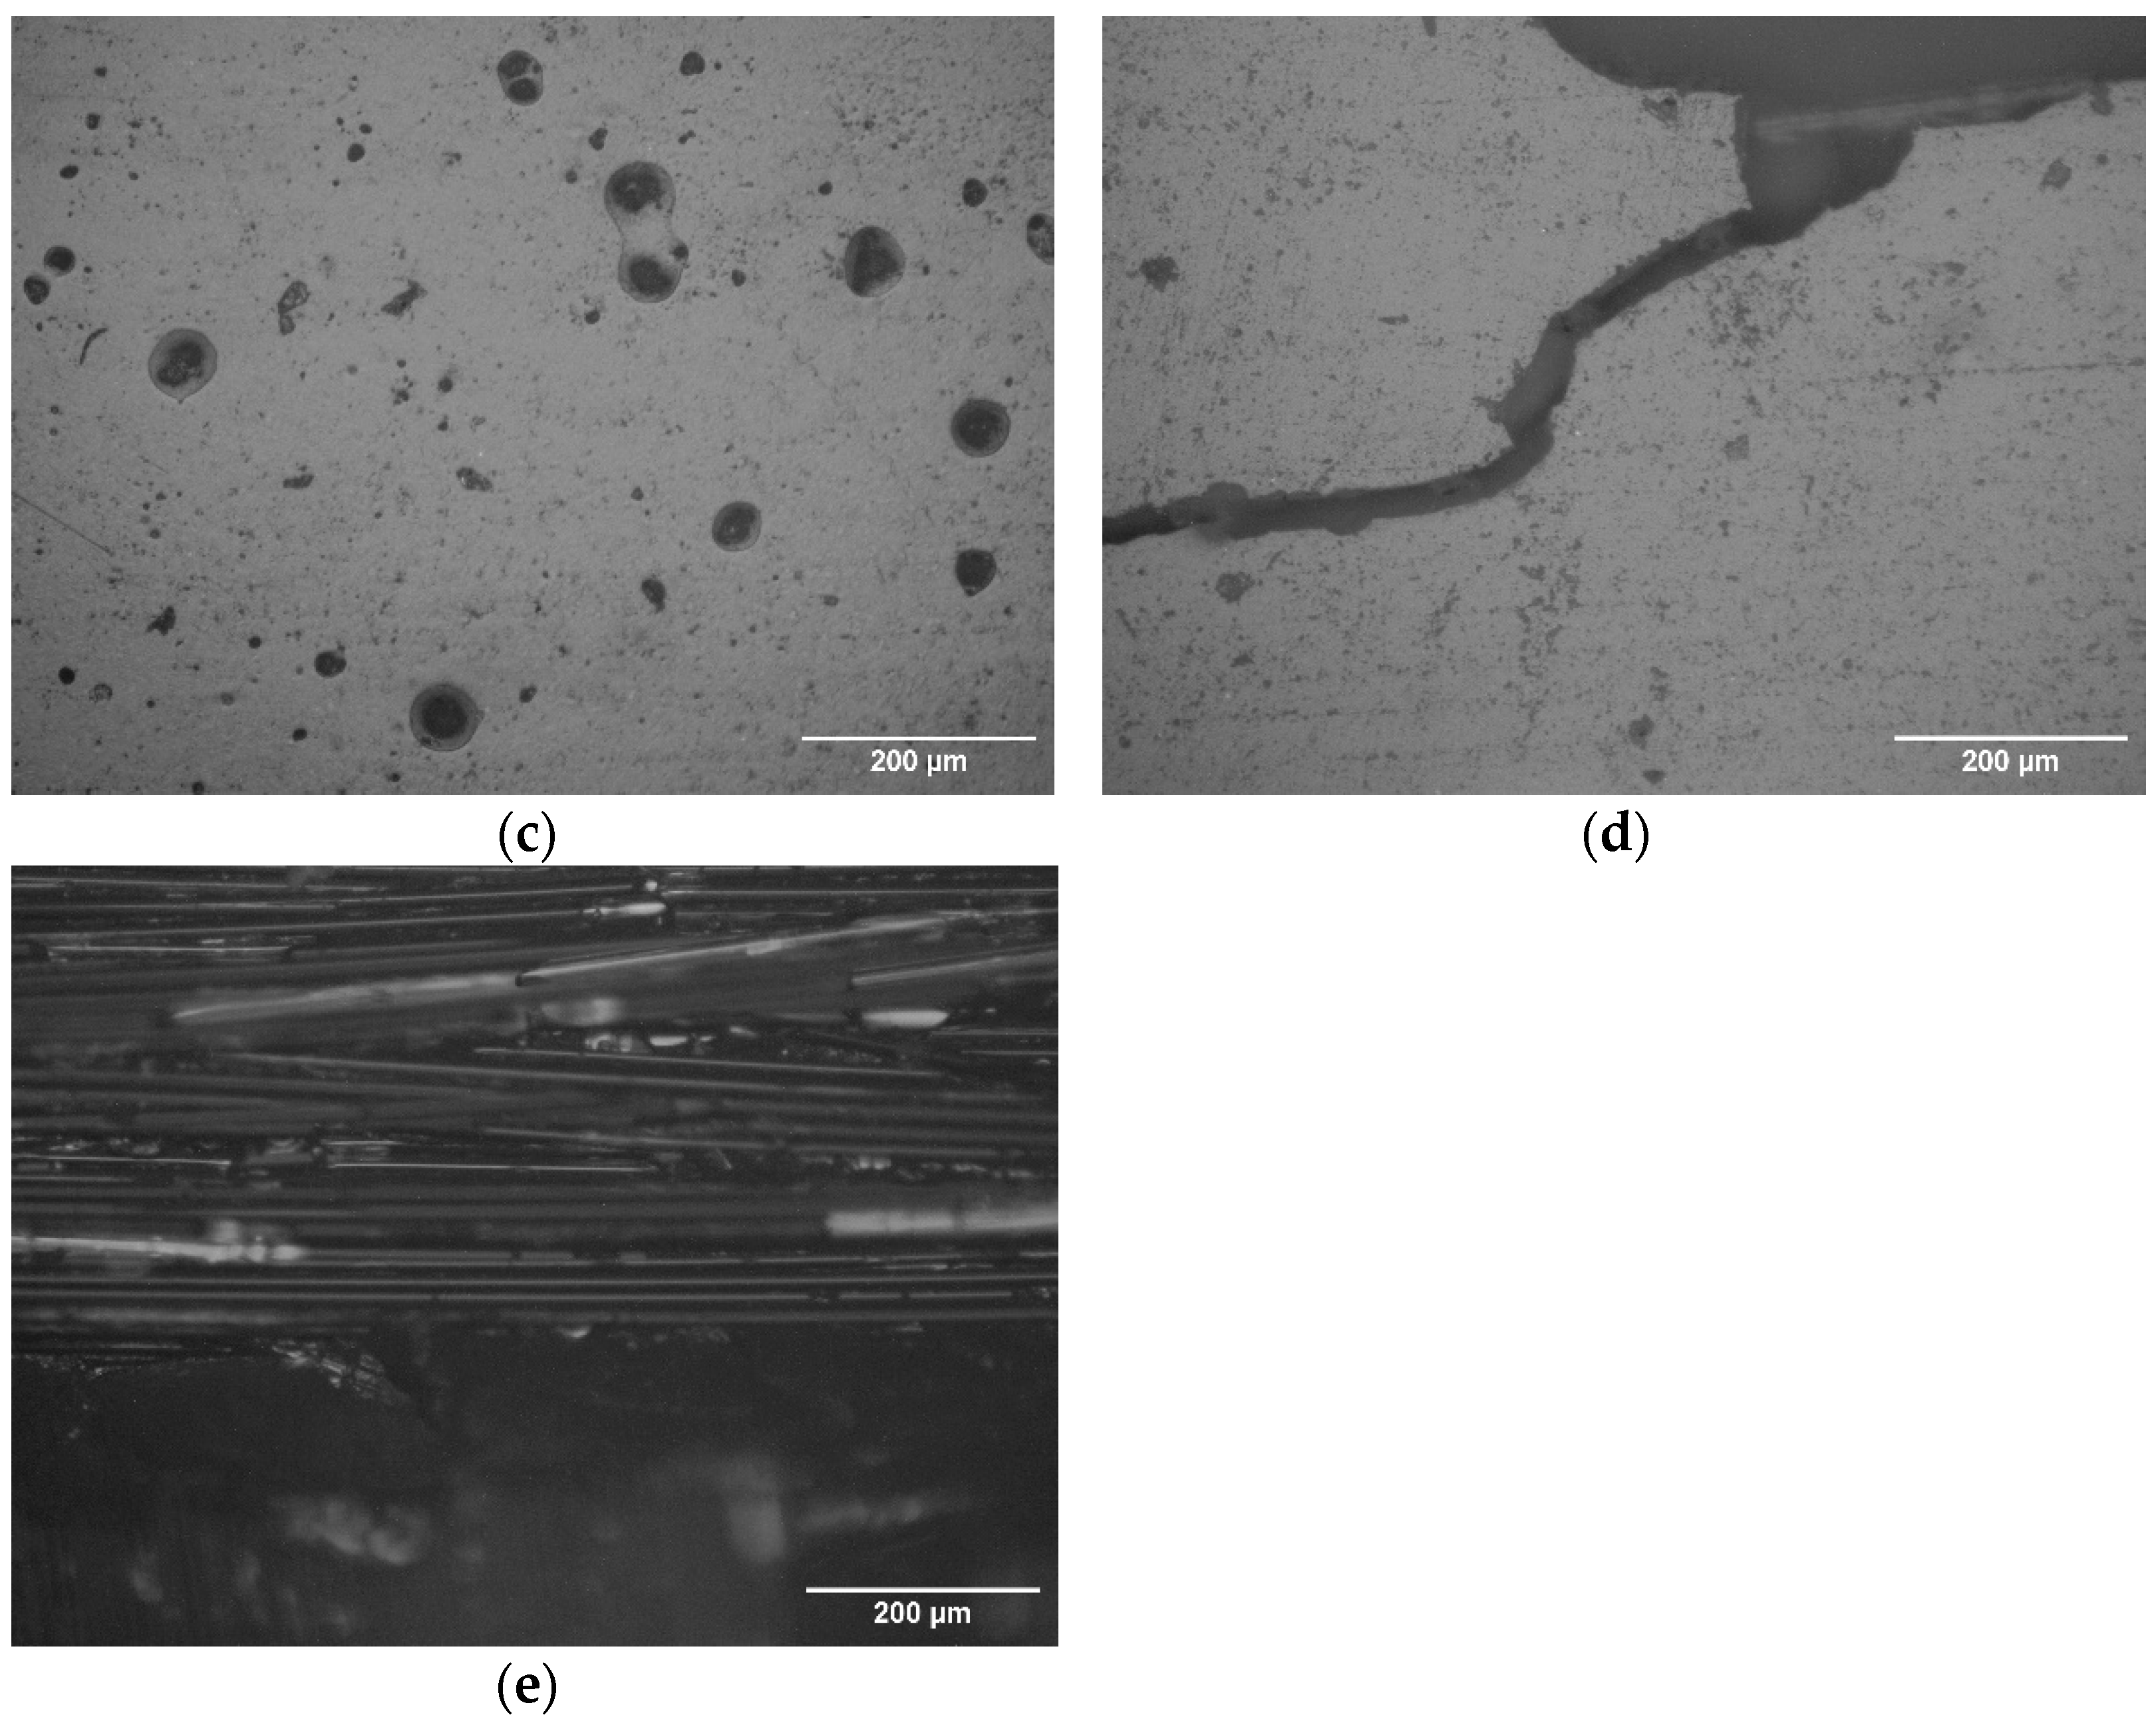
Figure 11 presents a microcopy image of a representative sample with coating C after each erosion stage.
4.3. Effect of Erosion on Surface Gloss
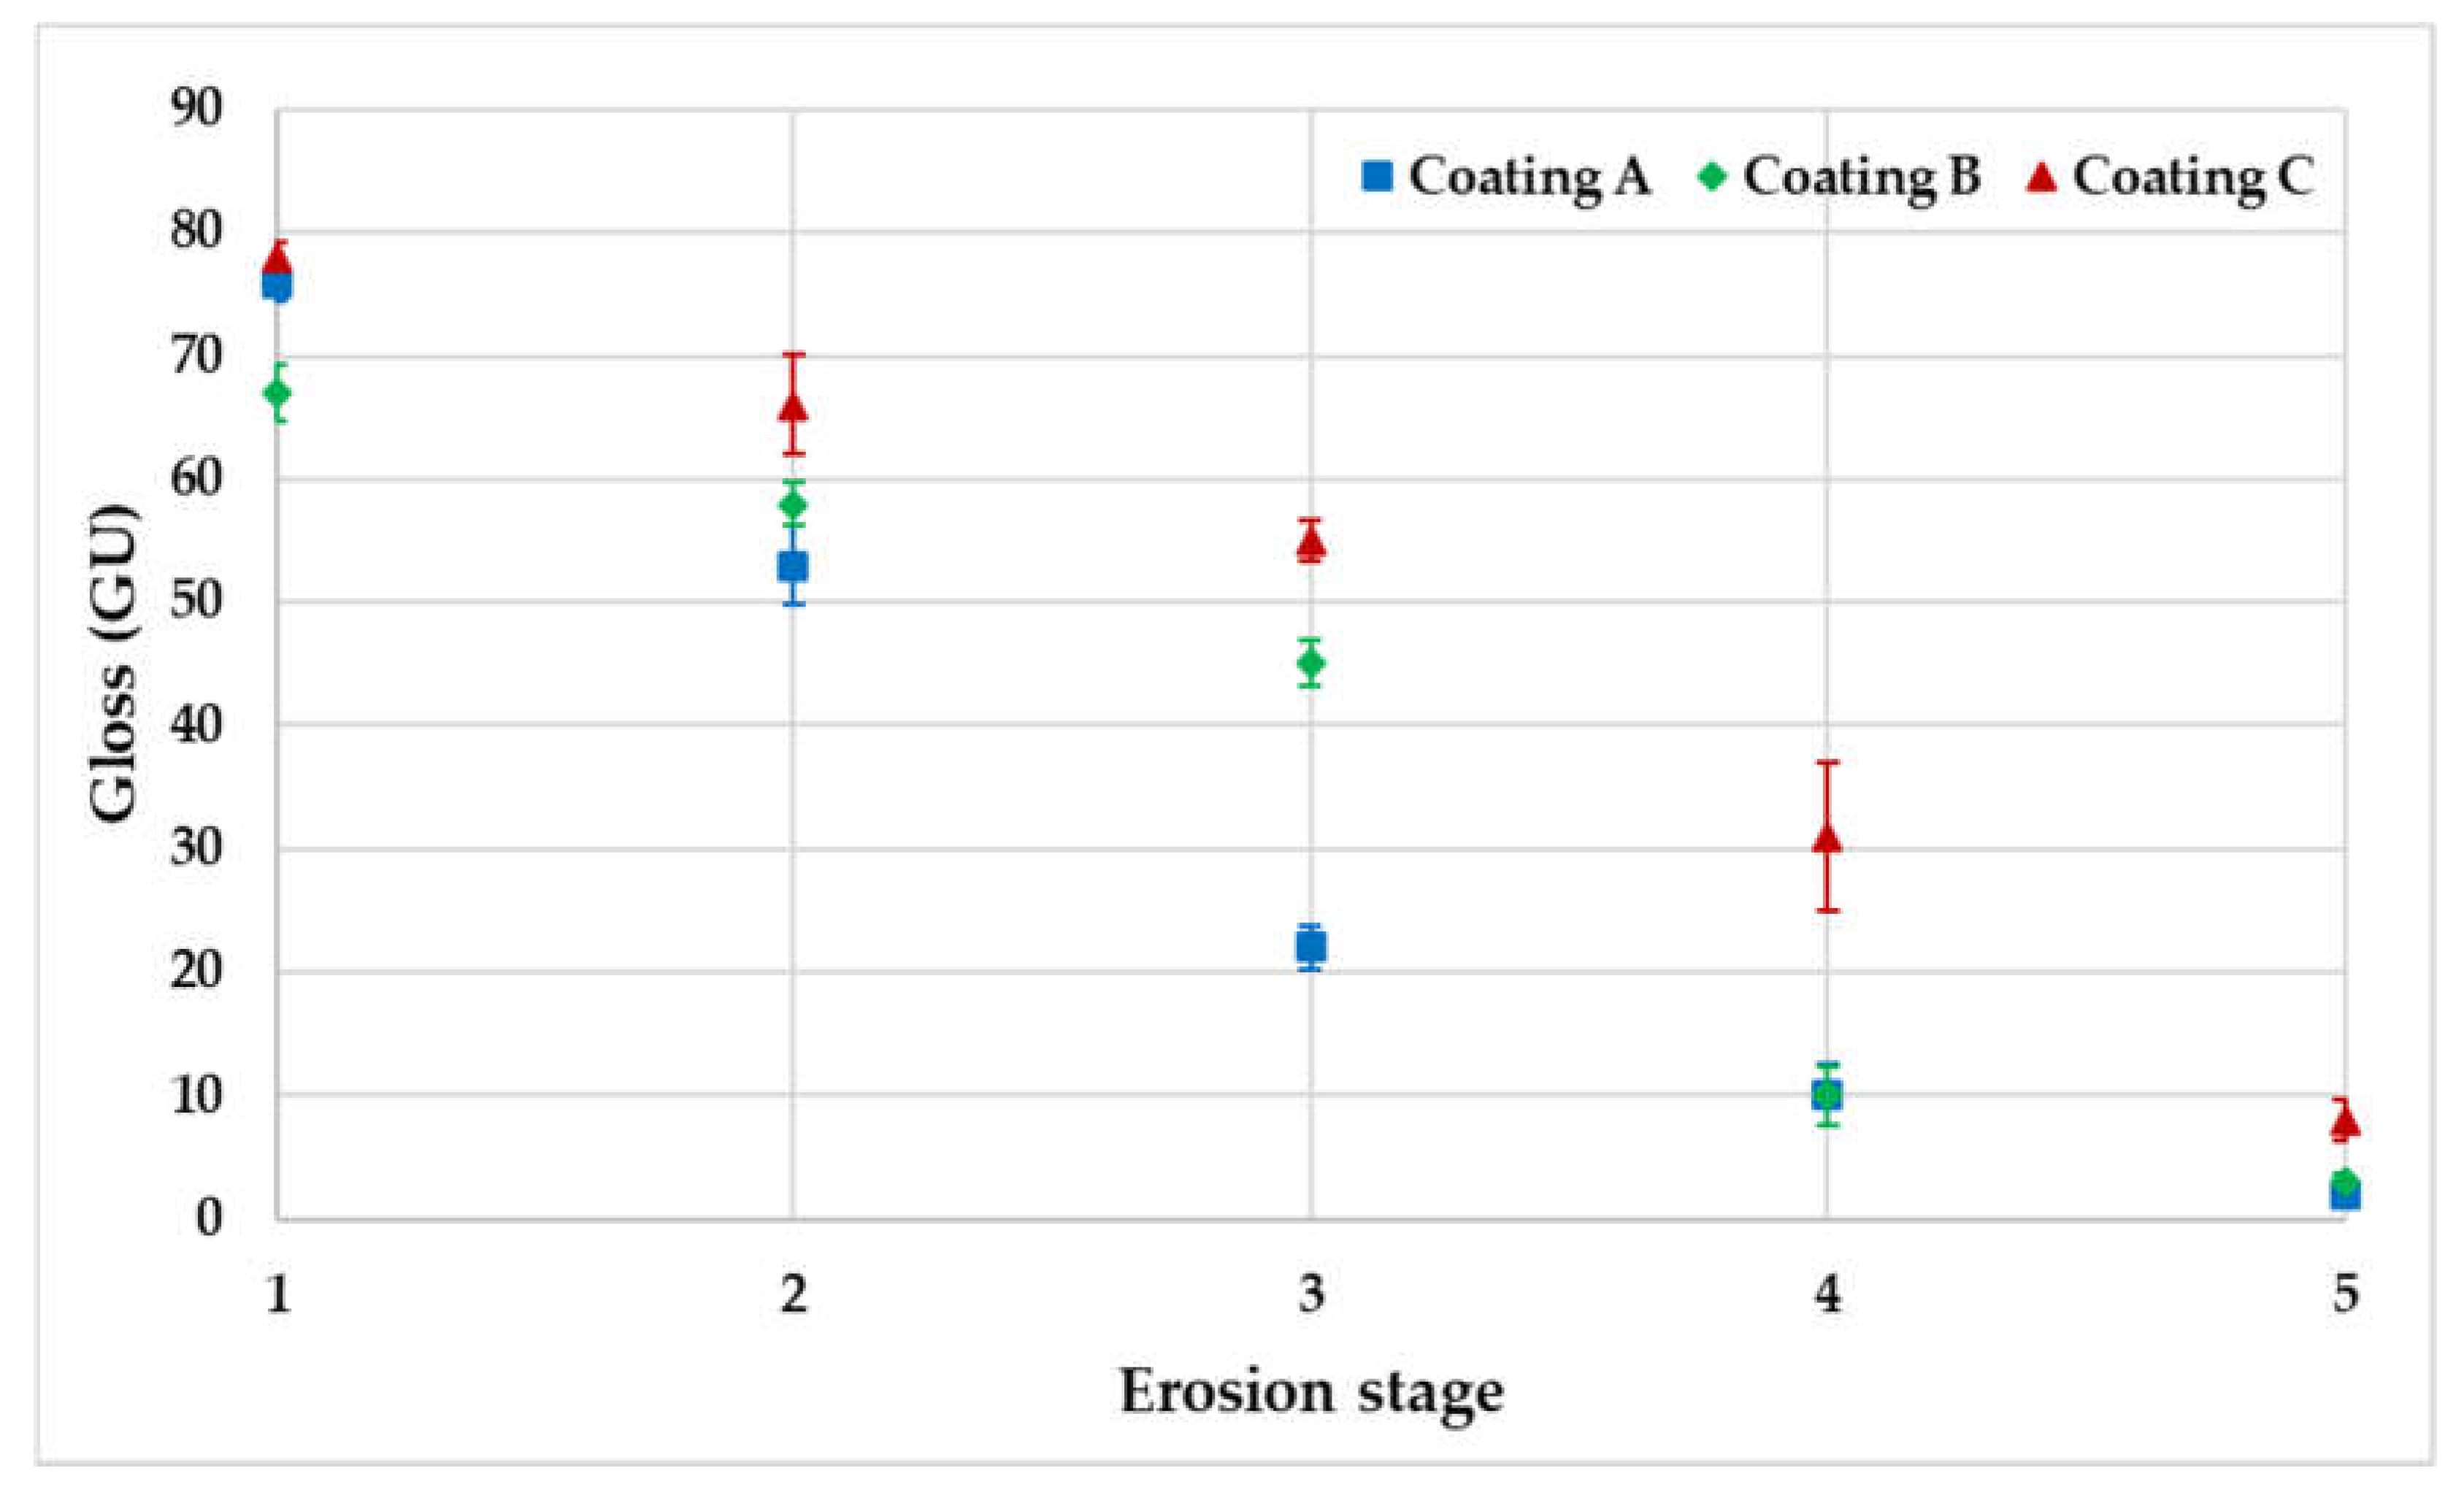
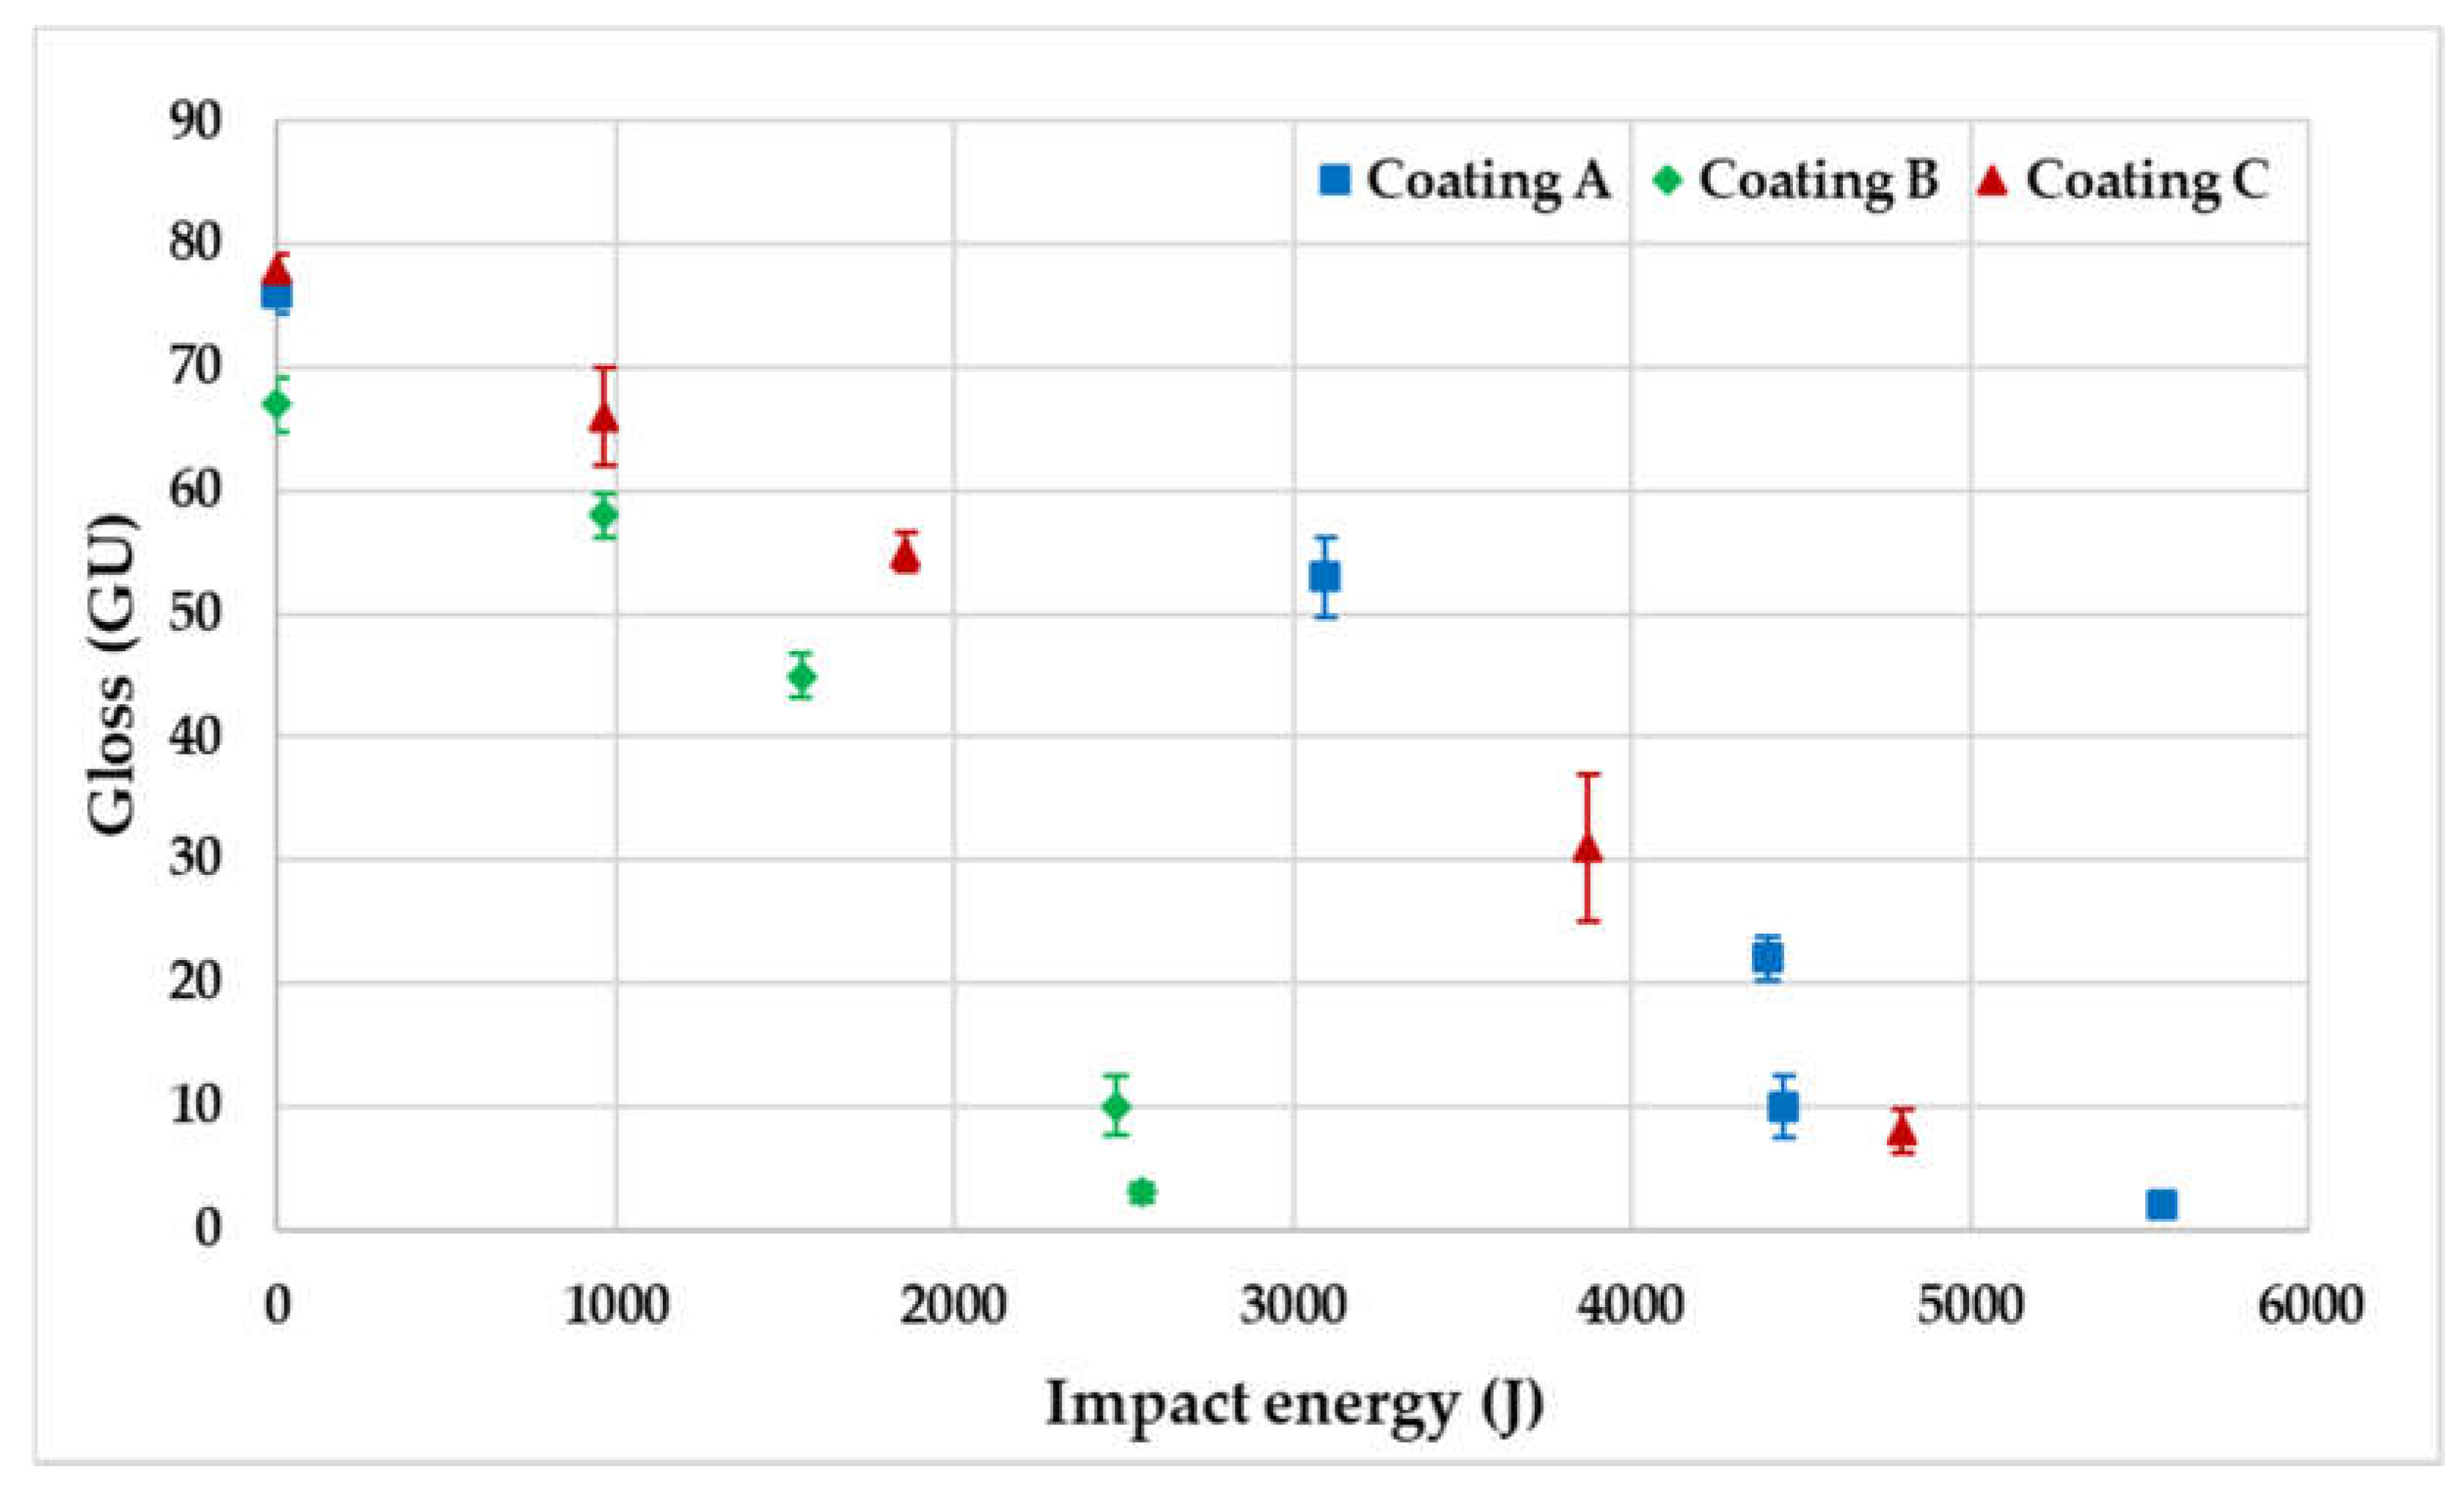
Figure 12 presents the gloss data recorded at each erosion stage, and
Figure 13 presents the gloss data recorded at a given impact energy on the specimen. Error bars represent a 95% confidence limit on the results.
4.4. Effect of Erosion on Mass Change
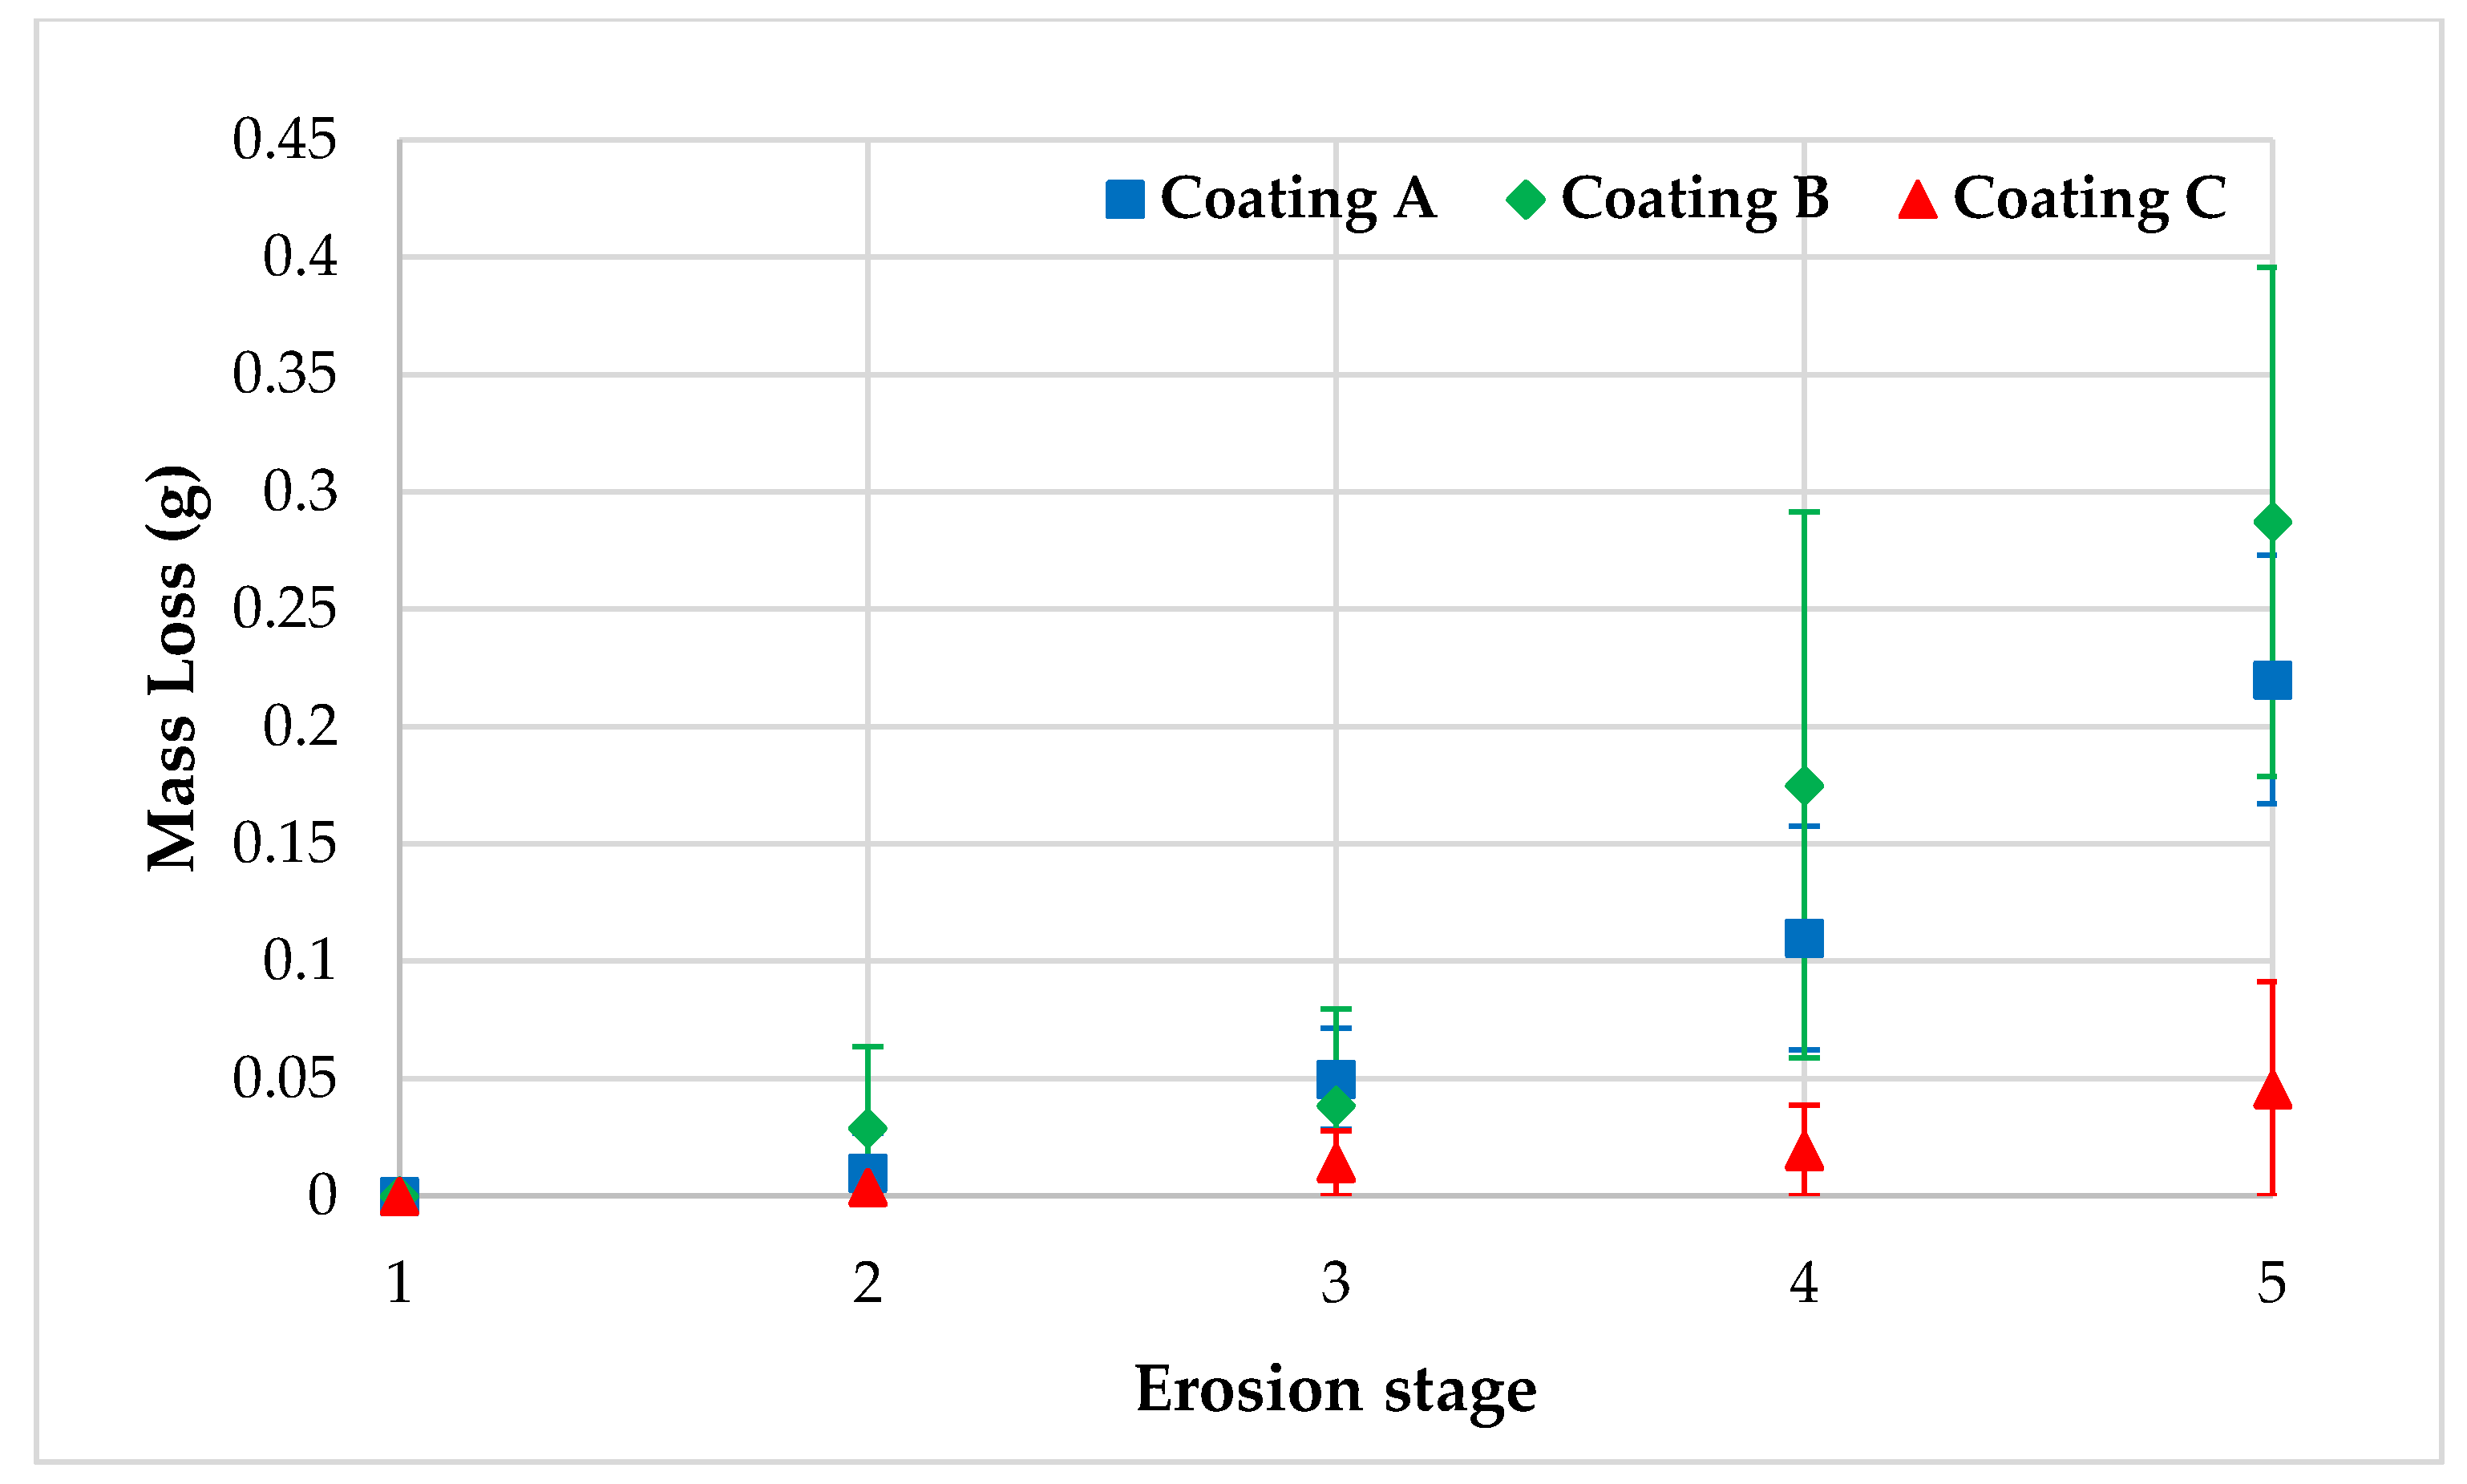
Figure 14 presents the mass loss data at each erosion stage.
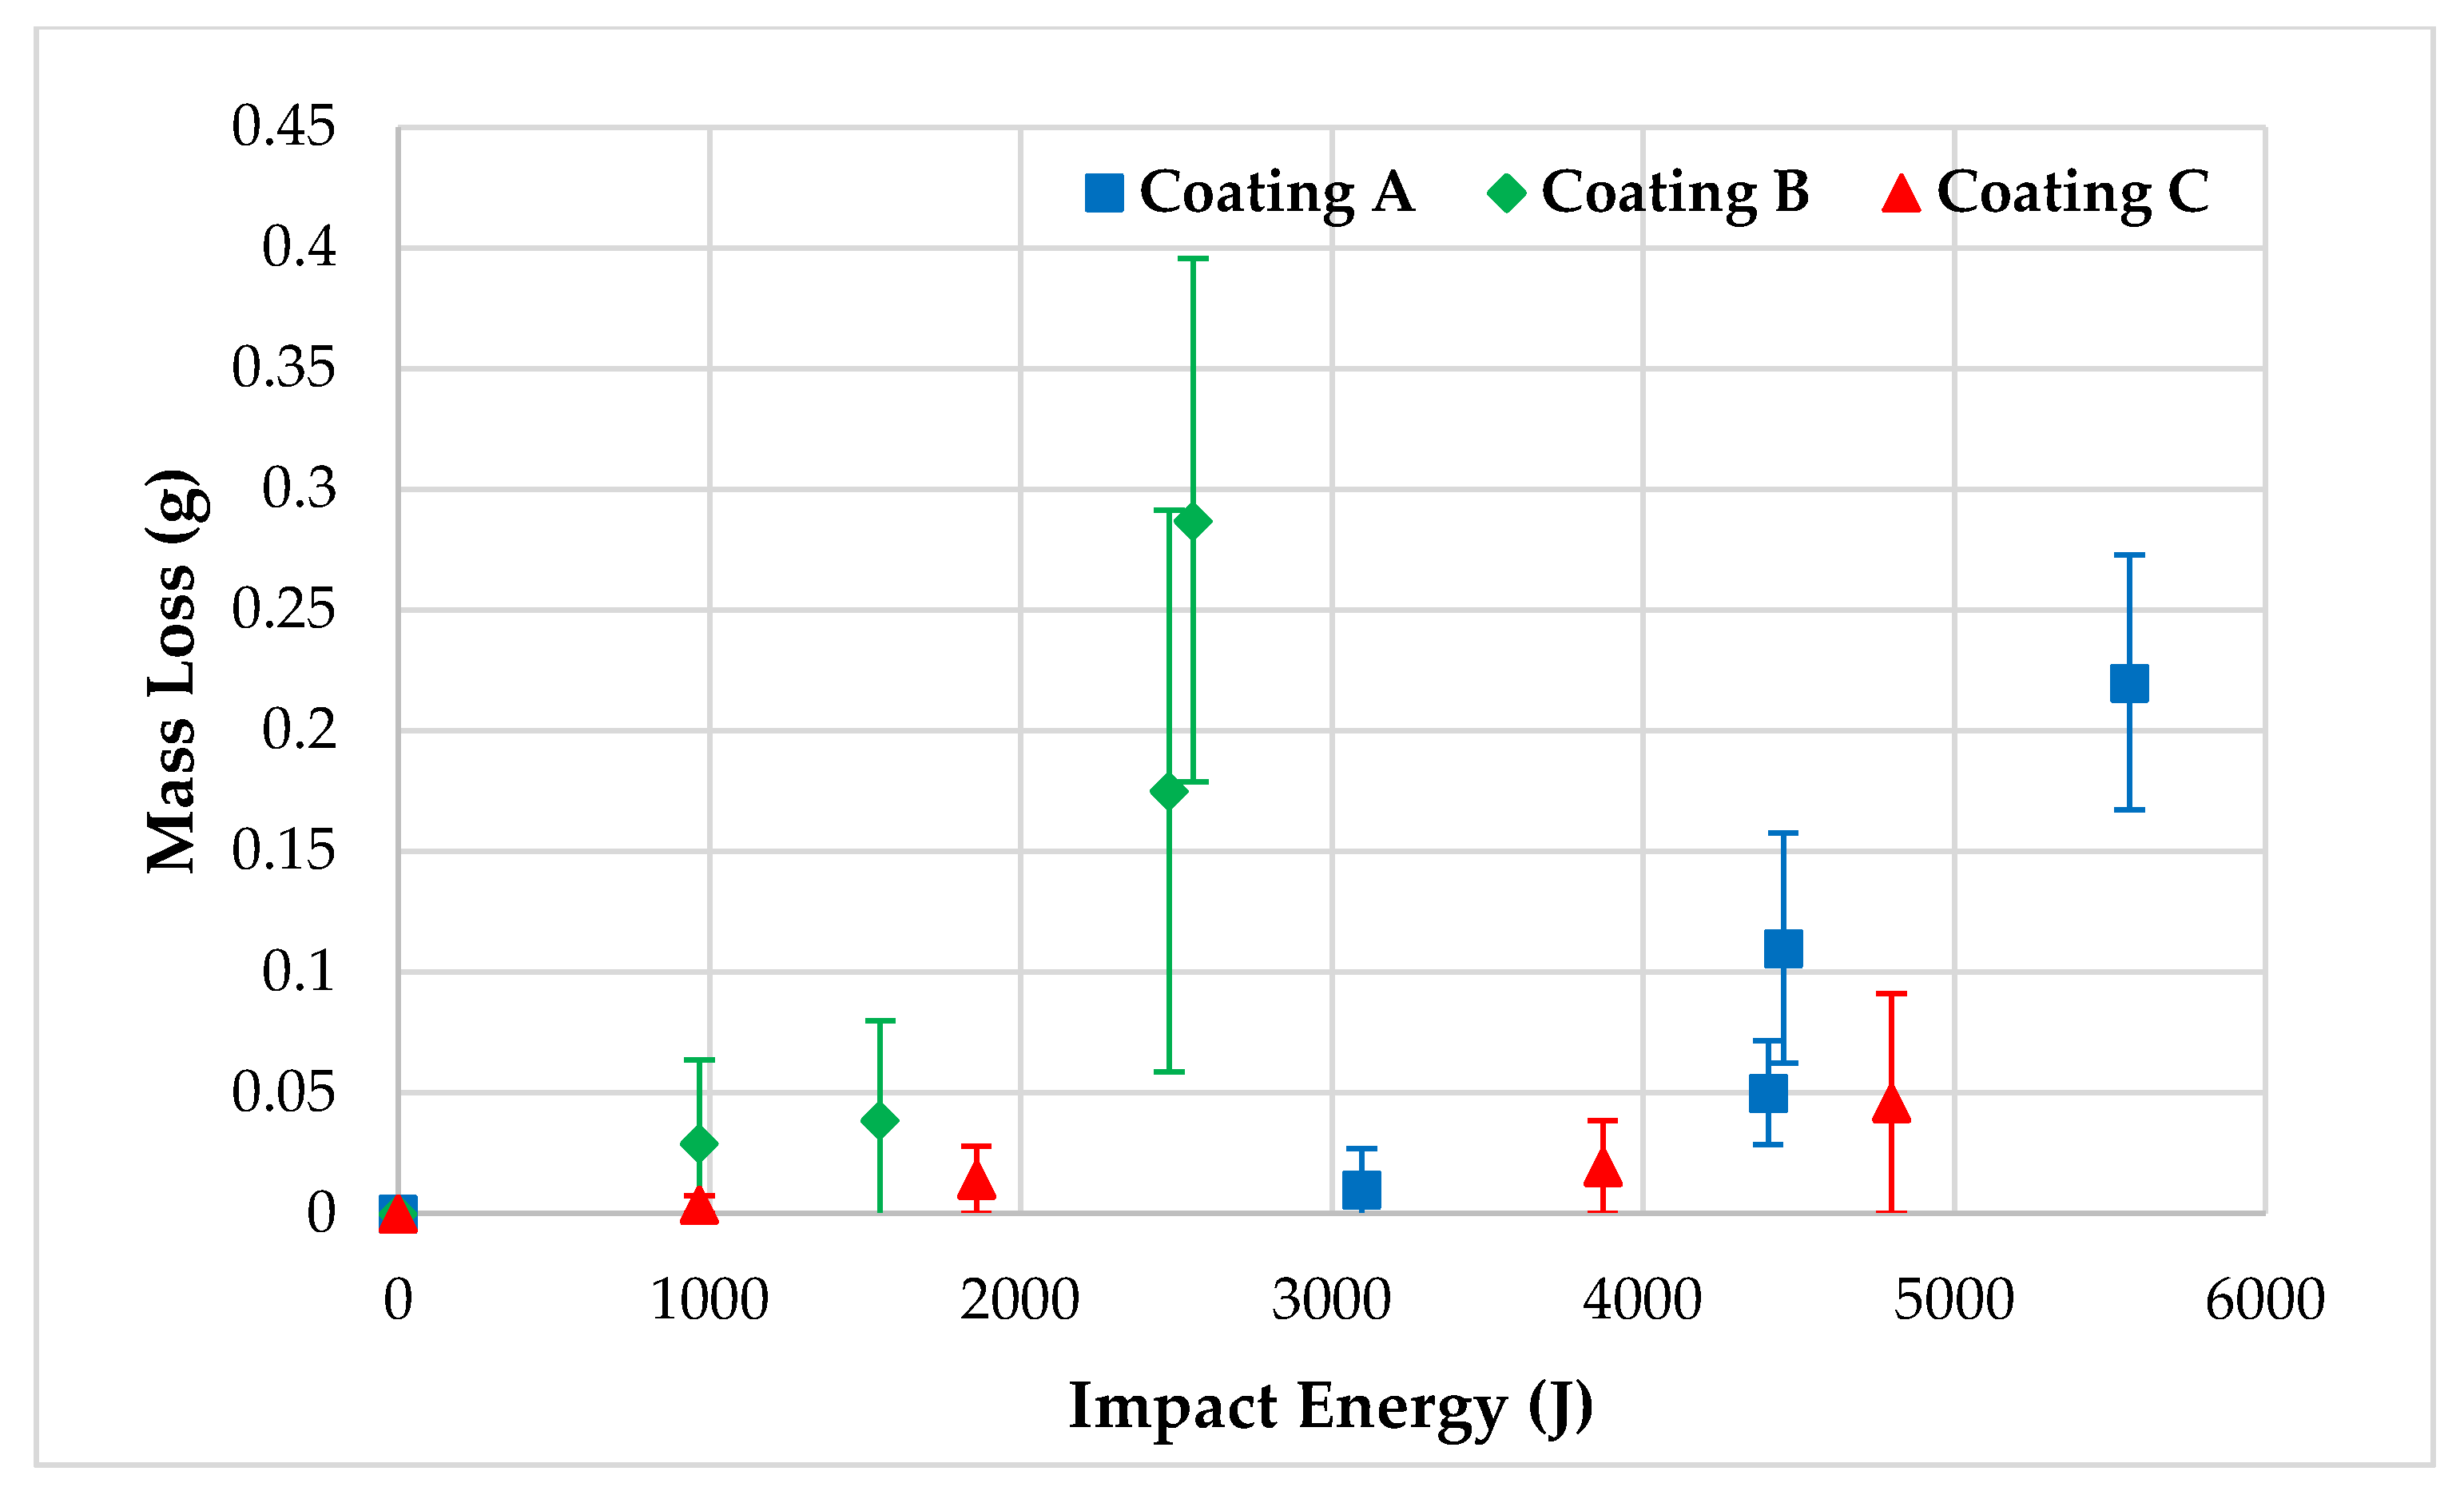
Figure 15 presents the mass loss data at a given impact energy. Error bars represent a 95% confidence limit on the results.
5. Discussion
From consideration of
Figure 6 showing coating A,
Figure 7 showing coating B and
Figure 8 showing coating C, it is clear that as the specimens spend a greater amount of time in the RET, their surface condition changes drastically due to progressive coating erosion. Current methods of assessing coating erosion rely mainly on visual inspection, a qualitative measurement. A quantitative measurement of coating erosion provides more valuable information on the state of erosion, as it allows for the direct comparison between stages of erosion, but more importantly directly indicates the onset of erosion and identifies which erosion stage the specimen currently experiences.
Using microscopy for surface examination, it is clear there are major changes in the surface texture as erosion takes hold and progresses as shown in
Figure 9 presenting coating A,
Figure 10 presenting coating B and
Figure 11 presenting coating C.
5.1. Coating A
Examining coating A stage 1 under the microscope,
Figure 9a, shows that the surface is not perfect. There are small pinholes/defects present on the coating surface, which are likely due to trapped air bubbles as a result of the application method of the coating and the coating consistency at the time of application. The coating manufacturers application guidelines were followed as per recommendations and it is recognized that some level of surface roughness is to be expected. Air bubbles present in the coating are known to have a negative effect on erosion performance [
20]. It is noted however to the naked eye, as shown in
Figure 6a, the surface appears in good condition with no observable pinholes/defects. The average gloss measurement for this stage is 76 GU.
As the erosion progresses to stage 2, the incubation period,
Figure 9b shows a total change in the surface texture. The surface has changed from showing small pin holes and bubbles to small cracks which have joined up between the pin holes and bubbles. Here, the surface change is
not visible to the naked eye, as observed in
Figure 6b. However, the surface change from stage 1 to stage 2 is clearly defined by the gloss measurement,
Figure 12, the gloss measurement drops by around 20 GU. This quantifiable change in the coating surface is detected by the glossmeter due to a change in the surface texture of the coating. This surface change causes more of the incident light beam from the glossmeter to be dispersed, as illustrated in
Figure 2b, thus lowering the amount of light received at the spectral reflectance detector and in turn the gloss unit measurement.
Figure 9c–e show the specimen’s surface after erosion stages 3, 4, and 5, respectively. It is evident that the surface texture changes as the erosion progresses, causing increases in the number of cracks and pits which collate and deepen, ultimately leading to layers of the coating system being removed. This surface texture change is directly shown in the glossmeter measurements as the gloss unit value of the coating decreases when the surface roughness increases.
5.2. Coating B
Coating B did not erode in a predictable manner, as seen in
Figure 7b. Here, the samples were eroded to stage 2; however, three of the five samples began to show signs of stage 5 (where the substrate is exposed) with one sample showing a large amount of the coating system removed due to the rain droplet impacts. This non-conformity continues in stage 3, where again one sample is showing signs of stage 5 erosion. In stage 4, the samples are actually at stage 5 where the substrate is exposed. This untimely erosion can be attributed to the nature of the testing in the test rig at ETC in that the samples were placed in the rig for a set amount of time. The amount of time to reach each erosion stage was calibrated against five test samples. These calibration samples lasted the set amount of time and showed stage 4 signs of erosion.
It is considered that this unpredictable, premature failure of the coating system is down to poor adhesion between the coating system and the substrate. By looking at
Figure 7b–e, the coating does not erode but delaminates from the substrate. The microscopy images show a change in the surface of the coating system as the erosion stages progress,
Figure 10a–e, however, these were captured using the remaining samples which had not immediately progressed to erosion stage 5.
5.3. Coating C
Considering coating C,
Figure 8a–e, this coating has eroded in the most predictable manner of those tested. The samples at each erosion stage are as expected, with no samples prematurely eroding. From the microscopy,
Figure 11a–e, it is evident that before any erosion,
Figure 11a, the surface is not perfectly smooth nor uniform. There are small surface defects and although they are not visible to the naked eye, they can be detected using a microscope. As with coating A, these initial surface defects are most likely due to the coating application, whether this is due to the application method by roller or brush, or due to trapped air bubbles in the coating during the mixing and preparation step. The average gloss measurement of coating C stage 1 is 78 GU.
With coating C stage 2 erosion,
Figure 8b, the surface appears similar to stage 1, and there is
no observable change to the naked eye. However, examining the microscopy image,
Figure 11b, there is a clear change in the surface condition. The defects which were present in stage 1 have widened and deepened, turning them into pits on the coating surface. This change in the coating surface is also observable from looking at the gloss measurement for this stage, 66 GU, a drop of over 10 GU from stage 1. The average mass lost between stage 1 and stage 2 is 0.0988 g. By comparing the gloss measurement and the mass loss, both against the impact energy,
Figure 13 and
Figure 15 respectively, it is clear that there is a larger deviation from stage 1 to stage 2 using gloss rather than mass lost. This allows for a larger measurement range, thus providing a more accurate measurement. Additionally, the samples do not require to be dried out prior to measurement if the gloss technique is used, whereas with the mass lost approach, the samples must be fully dried in order to obtain a realistic measurement.
Considering coating C erosion stages 3–5,
Figure 8c–e respectively, visible coating damage begins to be observable to the naked eye and progresses through to coating loss and substrate exposure. The microscopy of stage 3,
Figure 11c, shows that the small pits which were created in stage 2 have now collated and deepened, leading to much larger pits which are now visible to the naked eye as observable in
Figure 8c. The erosion progresses through to stage 4 where chunks of the top coating layer have been removed and the filler layer of the coating system is visible,
Figure 8d. As the erosion further progresses, the filler layer is eroded leading to the substrate exposure at erosion stage 5. Again, comparing the gloss measurements to the mass loss measurements, the gloss provides greater accuracy, owing to a larger difference in gloss units between stages than that of the mass loss.
5.4. Erosion Assessment
The mass loss of coatings A, B, and C at each defined erosion stage are shown in
Figure 14, and the mass loss with impact energy is shown in
Figure 15. The first observation to be made is that the size of the error bars on coating B is large. This is due to the high variation in measurements obtained for mass at each stage, mostly due to the unpredictability of the erosion on the coating. Second, the change in mass in coating C at each erosion stage is small, giving a narrow range for identification of each erosion stage. Coating A has a larger range of mass loss at each erosion stage, allowing for easier stage identification.
Combining the mass loss with the photographs of the samples provides a reasonable measure of coating performance. In this, the qualitative visual assessment as well as the quantitative mass loss measurement can be obtained. However, the range of mass lost between erosion stages falls within a narrow band, which often overlaps, providing uncertainty on the state of erosion. In addition, the samples must be thoroughly dried out in order to get an accurate mass measurement without any effect from water retention.
The decline in gloss unit value as erosion progresses is clearly seen from
Figure 12. This allows for a quantitative measurement, with clearly defined boundaries, of coating erosion at each stage.
Figure 13 shows the gloss unit value of all three coating systems plotted against erosion progression in the form of impact energy. It is evident that coating B did not perform as well as coating A or coating C. Coating B required less impact energy to reach erosion stage 5, meaning that coating B required less droplet impacts to erode the coating and expose the substrate. Both coatings A and C were able to withstand a much greater number of impacts, approximately double that of coating B, until the coating was fully eroded and the substrate exposed.
For any given coating system, if the gloss values at each erosion stage are known, as in
Figure 12, then this could be used as an assessment tool for erosion characterization on a real world wind turbine blade—provided the coating system type used on the turbine is known and the gloss unit value with erosion progression has been pre-determined. This method of assessment provides a much more accurate and physically representative measurement of the state of erosion on the blade and can predict when the blade will enter a phase of active erosion, provided enough data on the coating system has been gathered. It is anticipated that dirt and grime has an effect on the gloss measurement, which requires further consideration.
The gradient of a best fit straight-line on plots of gloss units versus impact energy,
Figure 13, may be used as a performance indicator of the assessed coating system. The gradient indicates how much impact energy the coating has received and the associated gloss unit value—which translates into surface texture and damage due to erosion. The gradient of this best fit straight-line can be considered as a coating system property. A shallower slope indicates a better performing coating system. It is noted that the stoppage interval of the RET plays an important role in the erosive mechanism.
Overall, the glossmeter approach has several advantages over existing methods of erosion quantification on a wind turbine blade. There are, however, some disadvantages associated with the glossmeter technique. Both are outlined in
Table 1.
6. Conclusions
The glossmeter approach makes use of an existing technology which is not currently used for erosion assessment and quantification. Additionally, it is cost-effective and simple to operate, and provides an erosion measurement rather than a rudimentary visual inspection. The use of glossmeter measurements in erosion evaluation allows for a quantitative assessment of the state of erosion and, provided the baseline data are known, can indicate when the coating is likely to fail.
In the laboratory, the gloss methodology provides a more accurate measure of erosion than the current best practice of mass loss measurement. In situ, the gloss methodology can be used for erosion quantification, whereas mass loss cannot. Another benefit of the gloss methodology is that the incubation period is measurable, due to the ongoing changes in surface microstructure. Again, this is not possible using mass loss measurement nor visual inspection.
The glossmeter can be integrated into a remote inspection drone/blade climbing device which allows for a remote erosion assessment of a wind turbine blade to be made whilst avoiding the need for human in situ intervention.
For the glossmeter to have a wide-ranging impact on the sector, a catalogue of coating systems needs to be developed. The catalogue would require having details of the coating system surface gloss level at various stages of erosion, as in
Figure 14 and
Figure 15, for each coating system in use at a particular wind farm site. This catalogue could be made available to wind farm owners/operators for blade inspection which can then indicate the current erosion stage of the blade and be directly compared against an already known gloss level erosion degradation rate. This would allow for blade maintenance to be scheduled to conduct a repair or replacement as necessary. Additionally, the quantitative data captured with the gloss measurement can be used as inputs to a numerical model used to predict coating lifetime and repair intervention.
Author Contributions
Conceptualization, G.L., D.N., L.Y. and K.D.; methodology, G.L., D.N., L.Y. and K.D.; validation, G.L., D.N., L.Y. and K.D.; formal analysis, G.L.; investigation, G.L.; resources, D.N., L.Y. and K.D.; data curation, G.L.; writing—original draft preparation, G.L.; writing—review and editing, D.N., L.Y. and K.D.; supervision, D.N., L.Y. and K.D.; project administration, D.N., L.Y. and K.D.; funding acquisition, D.N. All authors have read and agreed to the published version of the manuscript.
Funding
This research was part funded by EPSRC Centre for Doctoral Training in Wind and Marine Energy Systems grant number EP/L016680/1.
Institutional Review Board Statement
Not applicable.
Informed Consent Statement
Not applicable.
Data Availability Statement
Data is contained within the article.
Acknowledgments
The authors would like to thank the Energy Technology Centre (ETC), based in East Kilbride near Glasgow, Scotland, for their assistance with rain erosion testing. The authors note that permission to reproduce extracts from British Standards is granted by BSI Standards Limited (BSI). No other use of this material is permitted. British Standards can be obtained in PDF or hard copy formats from the BSI online shop:
www.bsigroup.com/Shop.
Conflicts of Interest
The authors declare no conflict of interest. The funders had no role in the design of the study; in the collection, analyses, or interpretation of data; in the writing of the manuscript, or in the decision to publish the results.
References
- Herring, R.; Dyer, K.; Martin, F.; Ward, C. The increasing importance of leading edge erosion and a review of existing protection solutions. Renew. Sustain. Energy Rev. 2019, 115, 109382. [Google Scholar] [CrossRef]
- Mishnaevsky, L.; Hasager, C.; Bak, C.; Tilg, A.; Bech, J.; Doagou Rad, S.; Fæster, S. Leading edge erosion of wind turbine blades: Understanding, prevention and protection. Renew. Energy 2021, 169, 953–969. [Google Scholar] [CrossRef]
- Elhadi Ibrahim, M.; Medraj, M. Water Droplet Erosion of Wind Turbine Blades: Mechanics, Testing, Modeling and Future Perspectives. Materials 2019, 13, 157. [Google Scholar] [CrossRef] [PubMed] [Green Version]
- Keegan, M.; Nash, D.; Stack, M. On erosion issues associated with the leading edge of wind turbine blades. J. Phys. D Appl. Phys. 2013, 46, 383001. [Google Scholar] [CrossRef] [Green Version]
- Campobasso, M.; Castorrini, A.; Cappugi, L.; Bonfiglioli, A. Experimentally validated three-dimensional computational aerodynamics of wind turbine blade sections featuring leading edge erosion cavities. Wind Energy 2021, 25, 168–189. [Google Scholar] [CrossRef]
- Mishnaevsky, L.; Branner, K.; Petersen, H.N.; Beauson, J.; McGugan, M.; Sørensen, B.F. Materials for Wind Turbine Blades: An Overview. Materials 2017, 10, 1285. [Google Scholar] [CrossRef] [PubMed] [Green Version]
- Stout, C.; Thompson, D. UAV Approaches to Turbine Inspection: Reducing Reliance on Rope-Access ORE Catapult. Available online: https://ore.catapult.org.uk/analysisinsight/cyberhawk-uav-turbine-inspection/ (accessed on 15 February 2022).
- ISO/TS 19392-1:2018; Paints and Varnishes—Coating Systems for Wind-Turbine Rotor Blades. BSI Standards Publication: London, UK, 2018.
- ASTM G73-10; Standard Test Method for Liquid Impingement Erosion Using Rotating Apparatus. ASTM International: West Conshohocken, PA, USA, 2017.
- DNVGL-RP-0171; Testing of Rotor Blade Erosion Protection Systems. DNVGL: Bærum, Norway, 2018.
- Pugh, K.; Nash, J.; Reaburn, G.; Stack, M. On analytical tools for assessing the raindrop erosion of wind turbine blades. Renew. Sustain. Energy Rev. 2021, 137, 110611. [Google Scholar] [CrossRef]
- Hanson, A.R. Good Practice Guide for the Measurement of Gloss; National Physical Laboratory: Middlesex, UK, 2006. [Google Scholar]
- Nadal, M.E.; Thompson, E.A. New primary standard for specular gloss measurements. J. Coat. Technol. 2000, 72, 911. [Google Scholar] [CrossRef]
- Yong, Q.; Chang, J.; Liu, Q.; Jiang, F.; Wei, D.; Li, H. Matt Polyurethane Coating: Correlation of Surface Roughness on Measurement Length and Gloss. Polymers 2020, 12, 326. [Google Scholar] [CrossRef] [PubMed] [Green Version]
- BS EN ISO 2813:2014; Paints and varnishes—Determination of Gloss Value at 20 Degrees, 60 Degrees and 85 Degrees. BSI Standards Publication: London, UK, 2014.
- Mackie, C.; Nash, D.; Boyce, D.; Wright, M.; Dyer, K. Characterisation of a Whirling Arm Erosion Test Rig. In Proceedings of the 2018 Asian Conference on Energy, Power and Transportation Electrification (ACEPT), Singapore, 30 October–2 November 2018. [Google Scholar]
- Rain Erosion Tester—Improve the longevity of Leading Edge Protection. Available online: https://www.rd-as.com/rain-erosion-tester/ (accessed on 3 March 2022).
- Nash, D.; Leishman, G.; Mackie, C.; Dyer, K.; Yang, L. A Staged Approach to Erosion Analysis of Wind Turbine Blade Coatings. Coatings 2021, 11, 681. [Google Scholar] [CrossRef]
- Mackie, C. Establishing the Optimal Conditions for Rotating Arm Erosion Testing. Materials Characterisation and Computational Modelling of Wind Turbine Blade Rain Erosion. Ph.D. Thesis, University of Strathclyde, Glasgow, UK, 2020. [Google Scholar]
- Fæster, S.; Johansen, N.; Mishnaevsky, L.; Kusano, Y.; Bech, J.; Madsen, M. Rain erosion of wind turbine blades and the effect of air bubbles in the coatings. Wind Energy 2021, 24, 1071–1082. [Google Scholar] [CrossRef]
Figure 1.
Spectral reflectance.
Figure 1.
Spectral reflectance.
Figure 2.
(a) Low diffuse reflectance; (b) high diffuse reflectance.
Figure 2.
(a) Low diffuse reflectance; (b) high diffuse reflectance.
Figure 3.
Incident angle for gloss measurement. Y-axis represents the gloss value. X-axis represents gloss perception, from matt to glossy. Image taken from [
15].
Figure 3.
Incident angle for gloss measurement. Y-axis represents the gloss value. X-axis represents gloss perception, from matt to glossy. Image taken from [
15].
Figure 4.
(a) Substrate fiber layup on mold; (b) substrate fiber layup under vacuum with resin injection; (c) completed substrate with unusable sections marked for removal.
Figure 4.
(a) Substrate fiber layup on mold; (b) substrate fiber layup under vacuum with resin injection; (c) completed substrate with unusable sections marked for removal.
Figure 5.
Erosion stages outlined on a mass versus test time/droplet impacts plot.
Figure 5.
Erosion stages outlined on a mass versus test time/droplet impacts plot.
Figure 6.
(a) Samples with coating A at stage 1; (b) samples with coating A at stage 2; (c) samples with coating A at stage 3; (d) samples with coating A at stage 4; (e) samples with coating A at stage 5.
Figure 6.
(a) Samples with coating A at stage 1; (b) samples with coating A at stage 2; (c) samples with coating A at stage 3; (d) samples with coating A at stage 4; (e) samples with coating A at stage 5.
Figure 7.
(a) Samples with coating B at stage 1; (b) samples with coating B at stage 2; (c) samples with coating B at stage 3; (d) samples with coating B at stage 4; (e) samples with coating B at stage 5.
Figure 7.
(a) Samples with coating B at stage 1; (b) samples with coating B at stage 2; (c) samples with coating B at stage 3; (d) samples with coating B at stage 4; (e) samples with coating B at stage 5.
Figure 8.
(a) Samples with coating C at stage 1; (b) samples with coating C at stage 2; (c) samples with coating C at stage 3; (d) samples with coating C at stage 4; (e) samples with coating C at stage 5.
Figure 8.
(a) Samples with coating C at stage 1; (b) samples with coating C at stage 2; (c) samples with coating C at stage 3; (d) samples with coating C at stage 4; (e) samples with coating C at stage 5.
Figure 9.
Microcopy image of representative sample with coating A at (a) stage 1; (b) stage 2; (c) stage 3; (d) stage 4; (e) stage 5.
Figure 9.
Microcopy image of representative sample with coating A at (a) stage 1; (b) stage 2; (c) stage 3; (d) stage 4; (e) stage 5.
Figure 10.
Microcopy image of representative sample with coating B at (a) stage 1; (b) stage 2; (c) stage 3; (d) stage 4; (e) stage 5.
Figure 10.
Microcopy image of representative sample with coating B at (a) stage 1; (b) stage 2; (c) stage 3; (d) stage 4; (e) stage 5.
Figure 11.
Microcopy image of representative sample with coating C at (a) stage 1; (b) stage 2; (c) stage 3; (d) stage 4; (e) stage 5.
Figure 11.
Microcopy image of representative sample with coating C at (a) stage 1; (b) stage 2; (c) stage 3; (d) stage 4; (e) stage 5.
Figure 12.
Coating surface gloss at each erosion stage for coatings A, B, and C.
Figure 12.
Coating surface gloss at each erosion stage for coatings A, B, and C.
Figure 13.
Coating surface gloss at impact energy for coatings A, B, and C.
Figure 13.
Coating surface gloss at impact energy for coatings A, B, and C.
Figure 14.
Sample mass loss at each erosion stage.
Figure 14.
Sample mass loss at each erosion stage.
Figure 15.
Sample mass loss with impact energy.
Figure 15.
Sample mass loss with impact energy.
Table 1.
Advantages and disadvantages of using a glossmeter to measure wind turbine blade erosion.
Table 1.
Advantages and disadvantages of using a glossmeter to measure wind turbine blade erosion.
| Advantages | Disadvantages |
|---|
1. Quantitative measurement
2. Highly portable
3. Fast measurement
4. Low skill requirement
5. Low cost | 6. Small measurement zone relative to a wind turbine blade
7. Multiple measurements required
8. Measurement could be affected by surface dirt/grime |
| Publisher’s Note: MDPI stays neutral with regard to jurisdictional claims in published maps and institutional affiliations. |
© 2022 by the authors. Licensee MDPI, Basel, Switzerland. This article is an open access article distributed under the terms and conditions of the Creative Commons Attribution (CC BY) license (https://creativecommons.org/licenses/by/4.0/).


