
Numerical Analysis of Multifunctional Biosensor with Dual-Channel Photonic Crystal Fibers Based on Localized Surface Plasmon Resonance

 and
and 
Abstract
:1. Introduction
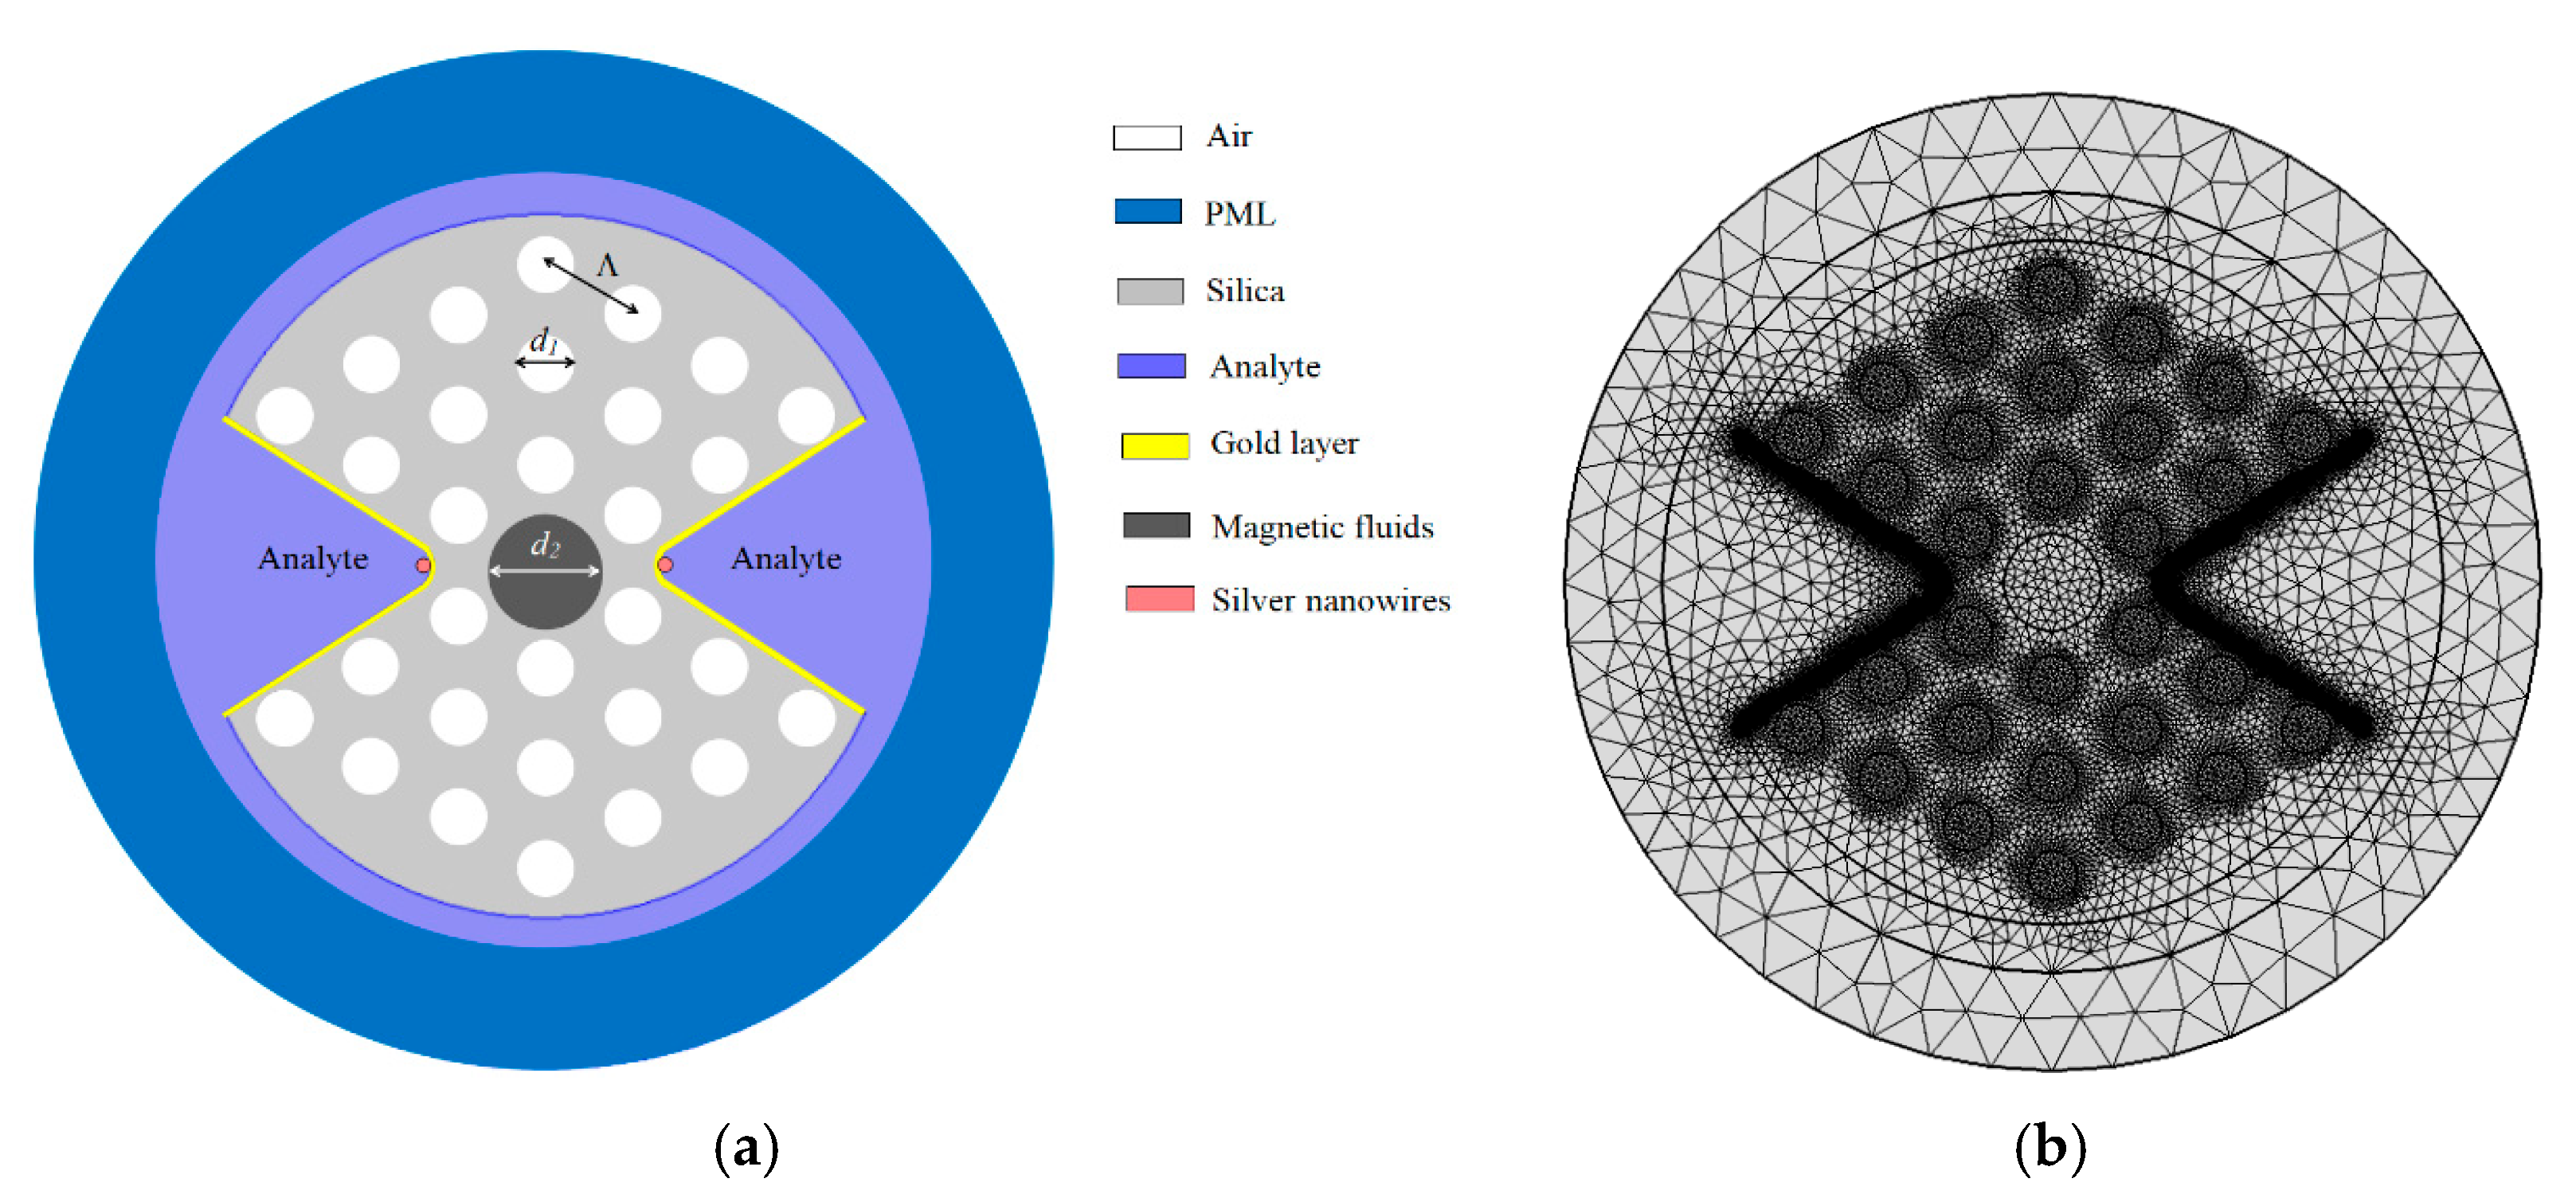
2. Model and Method
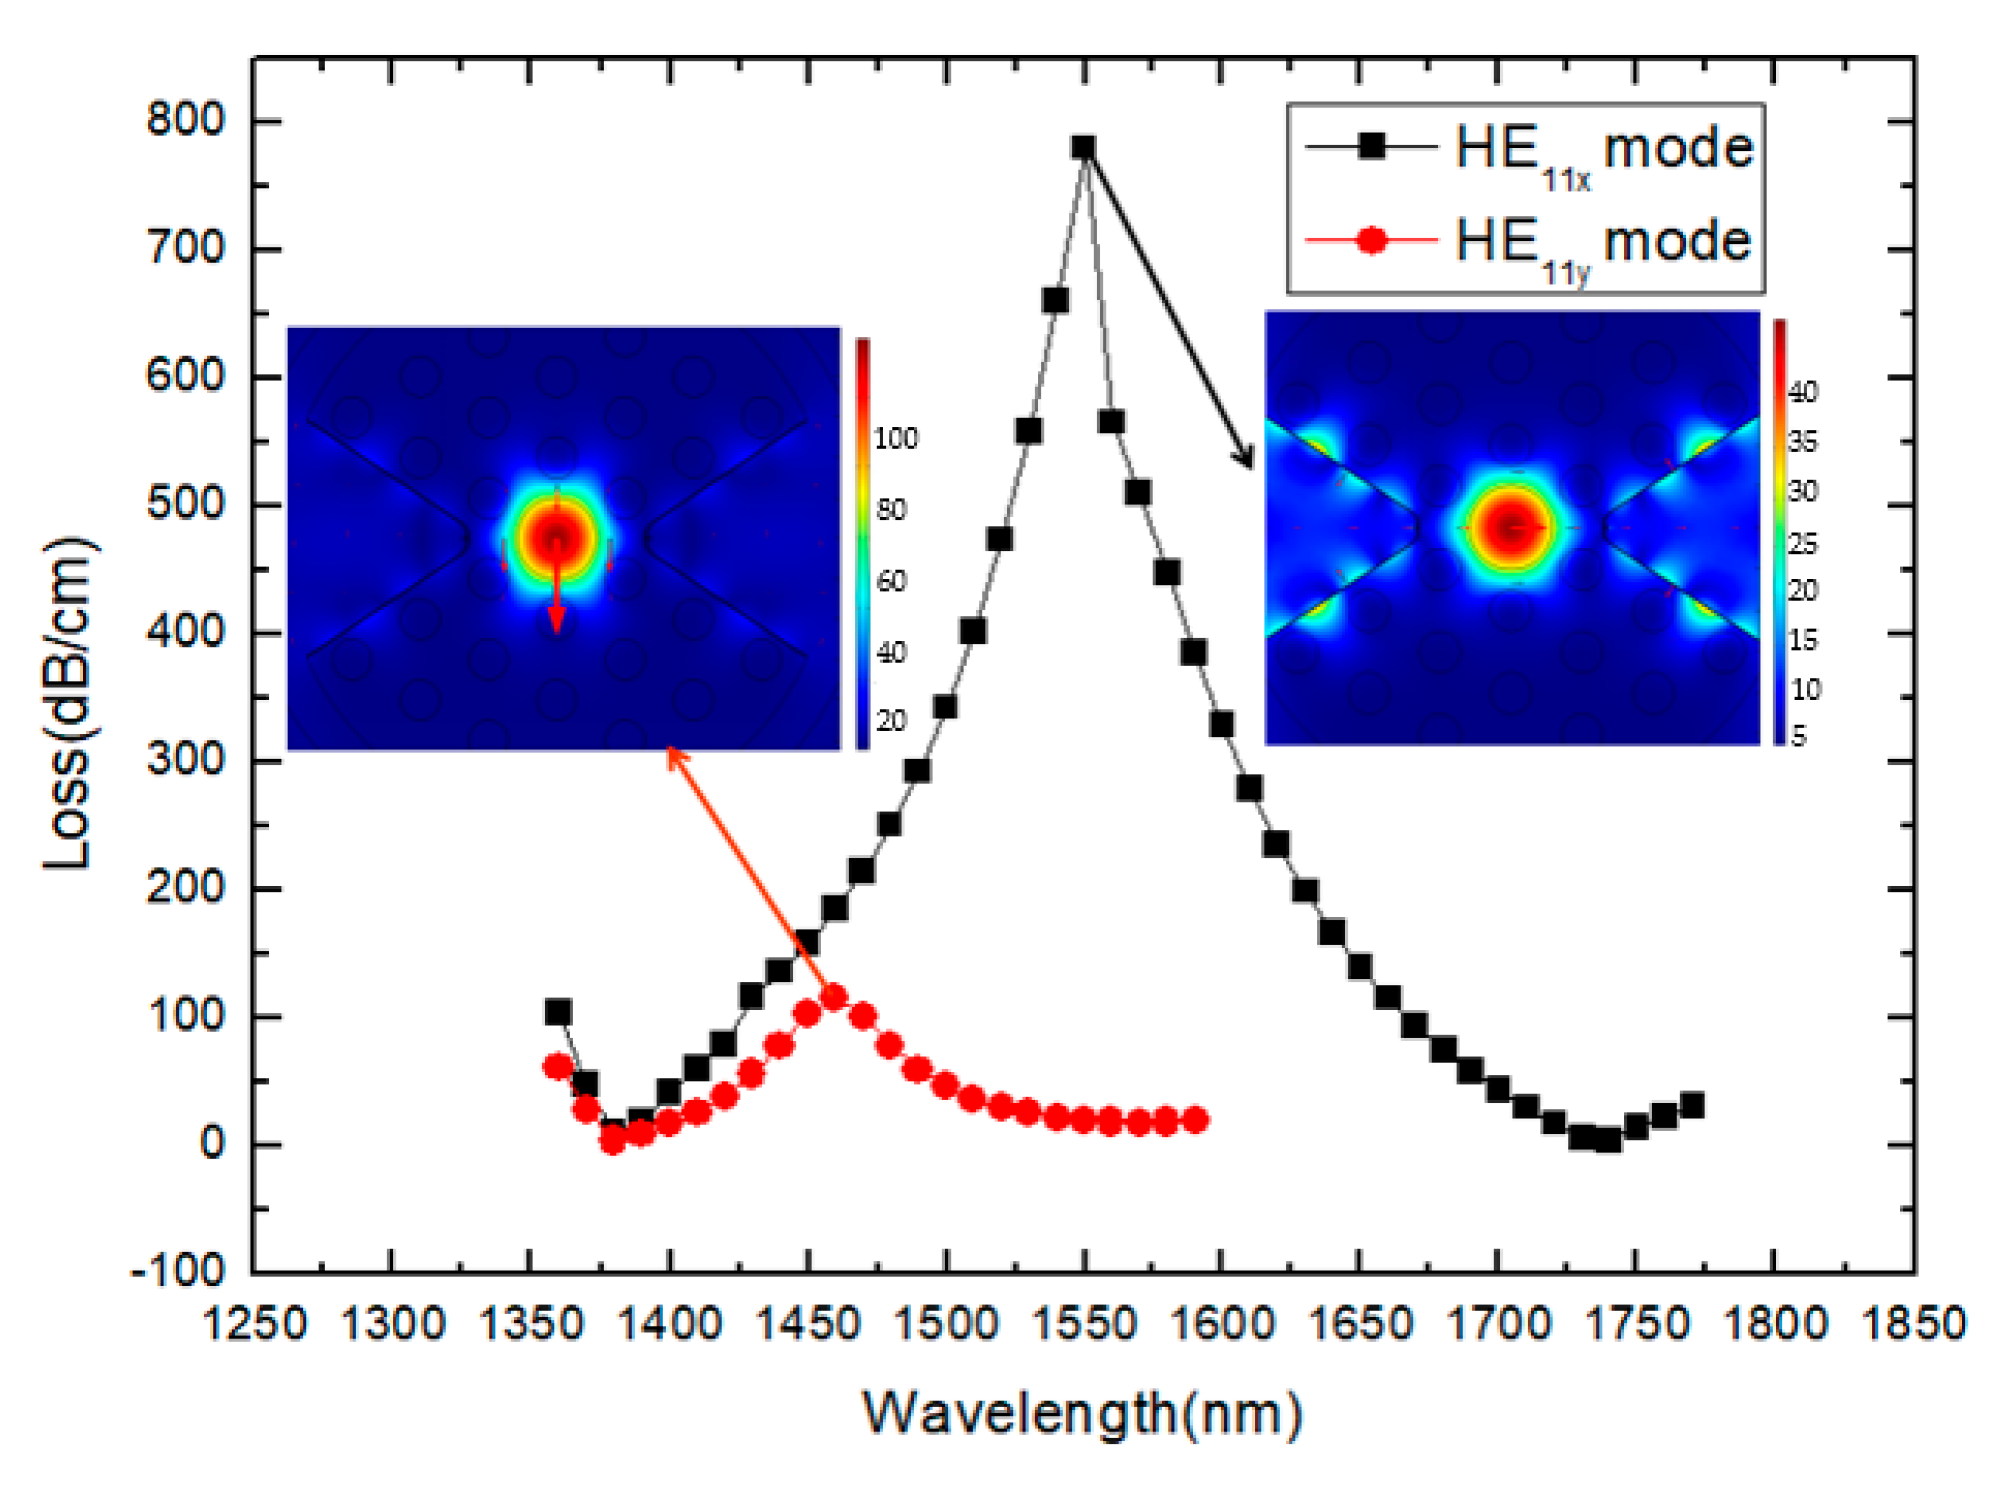
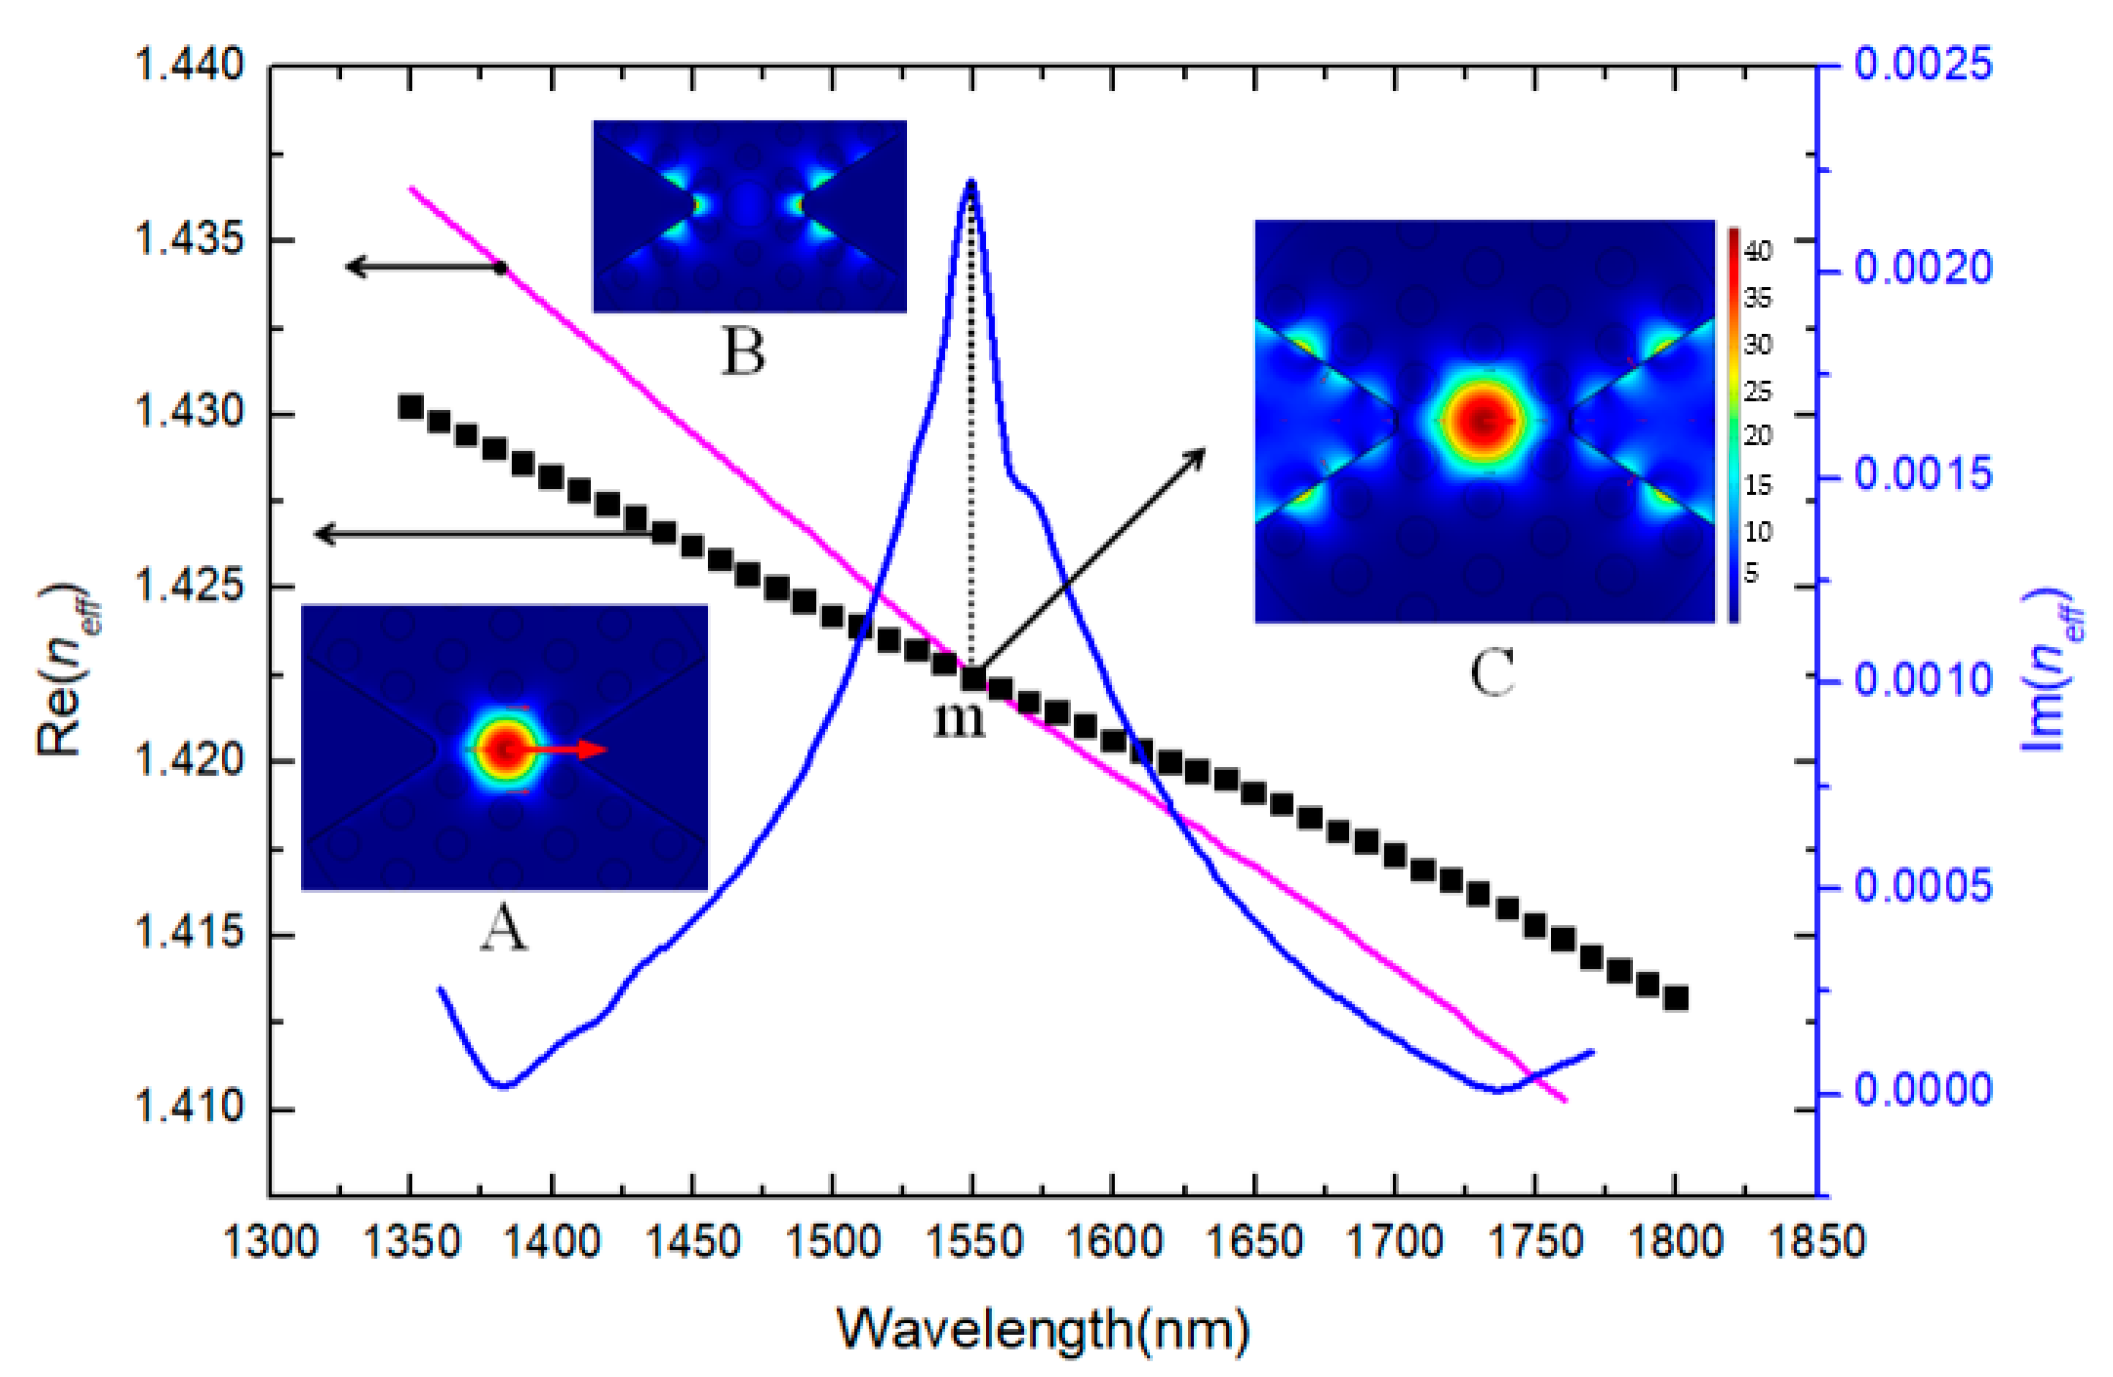
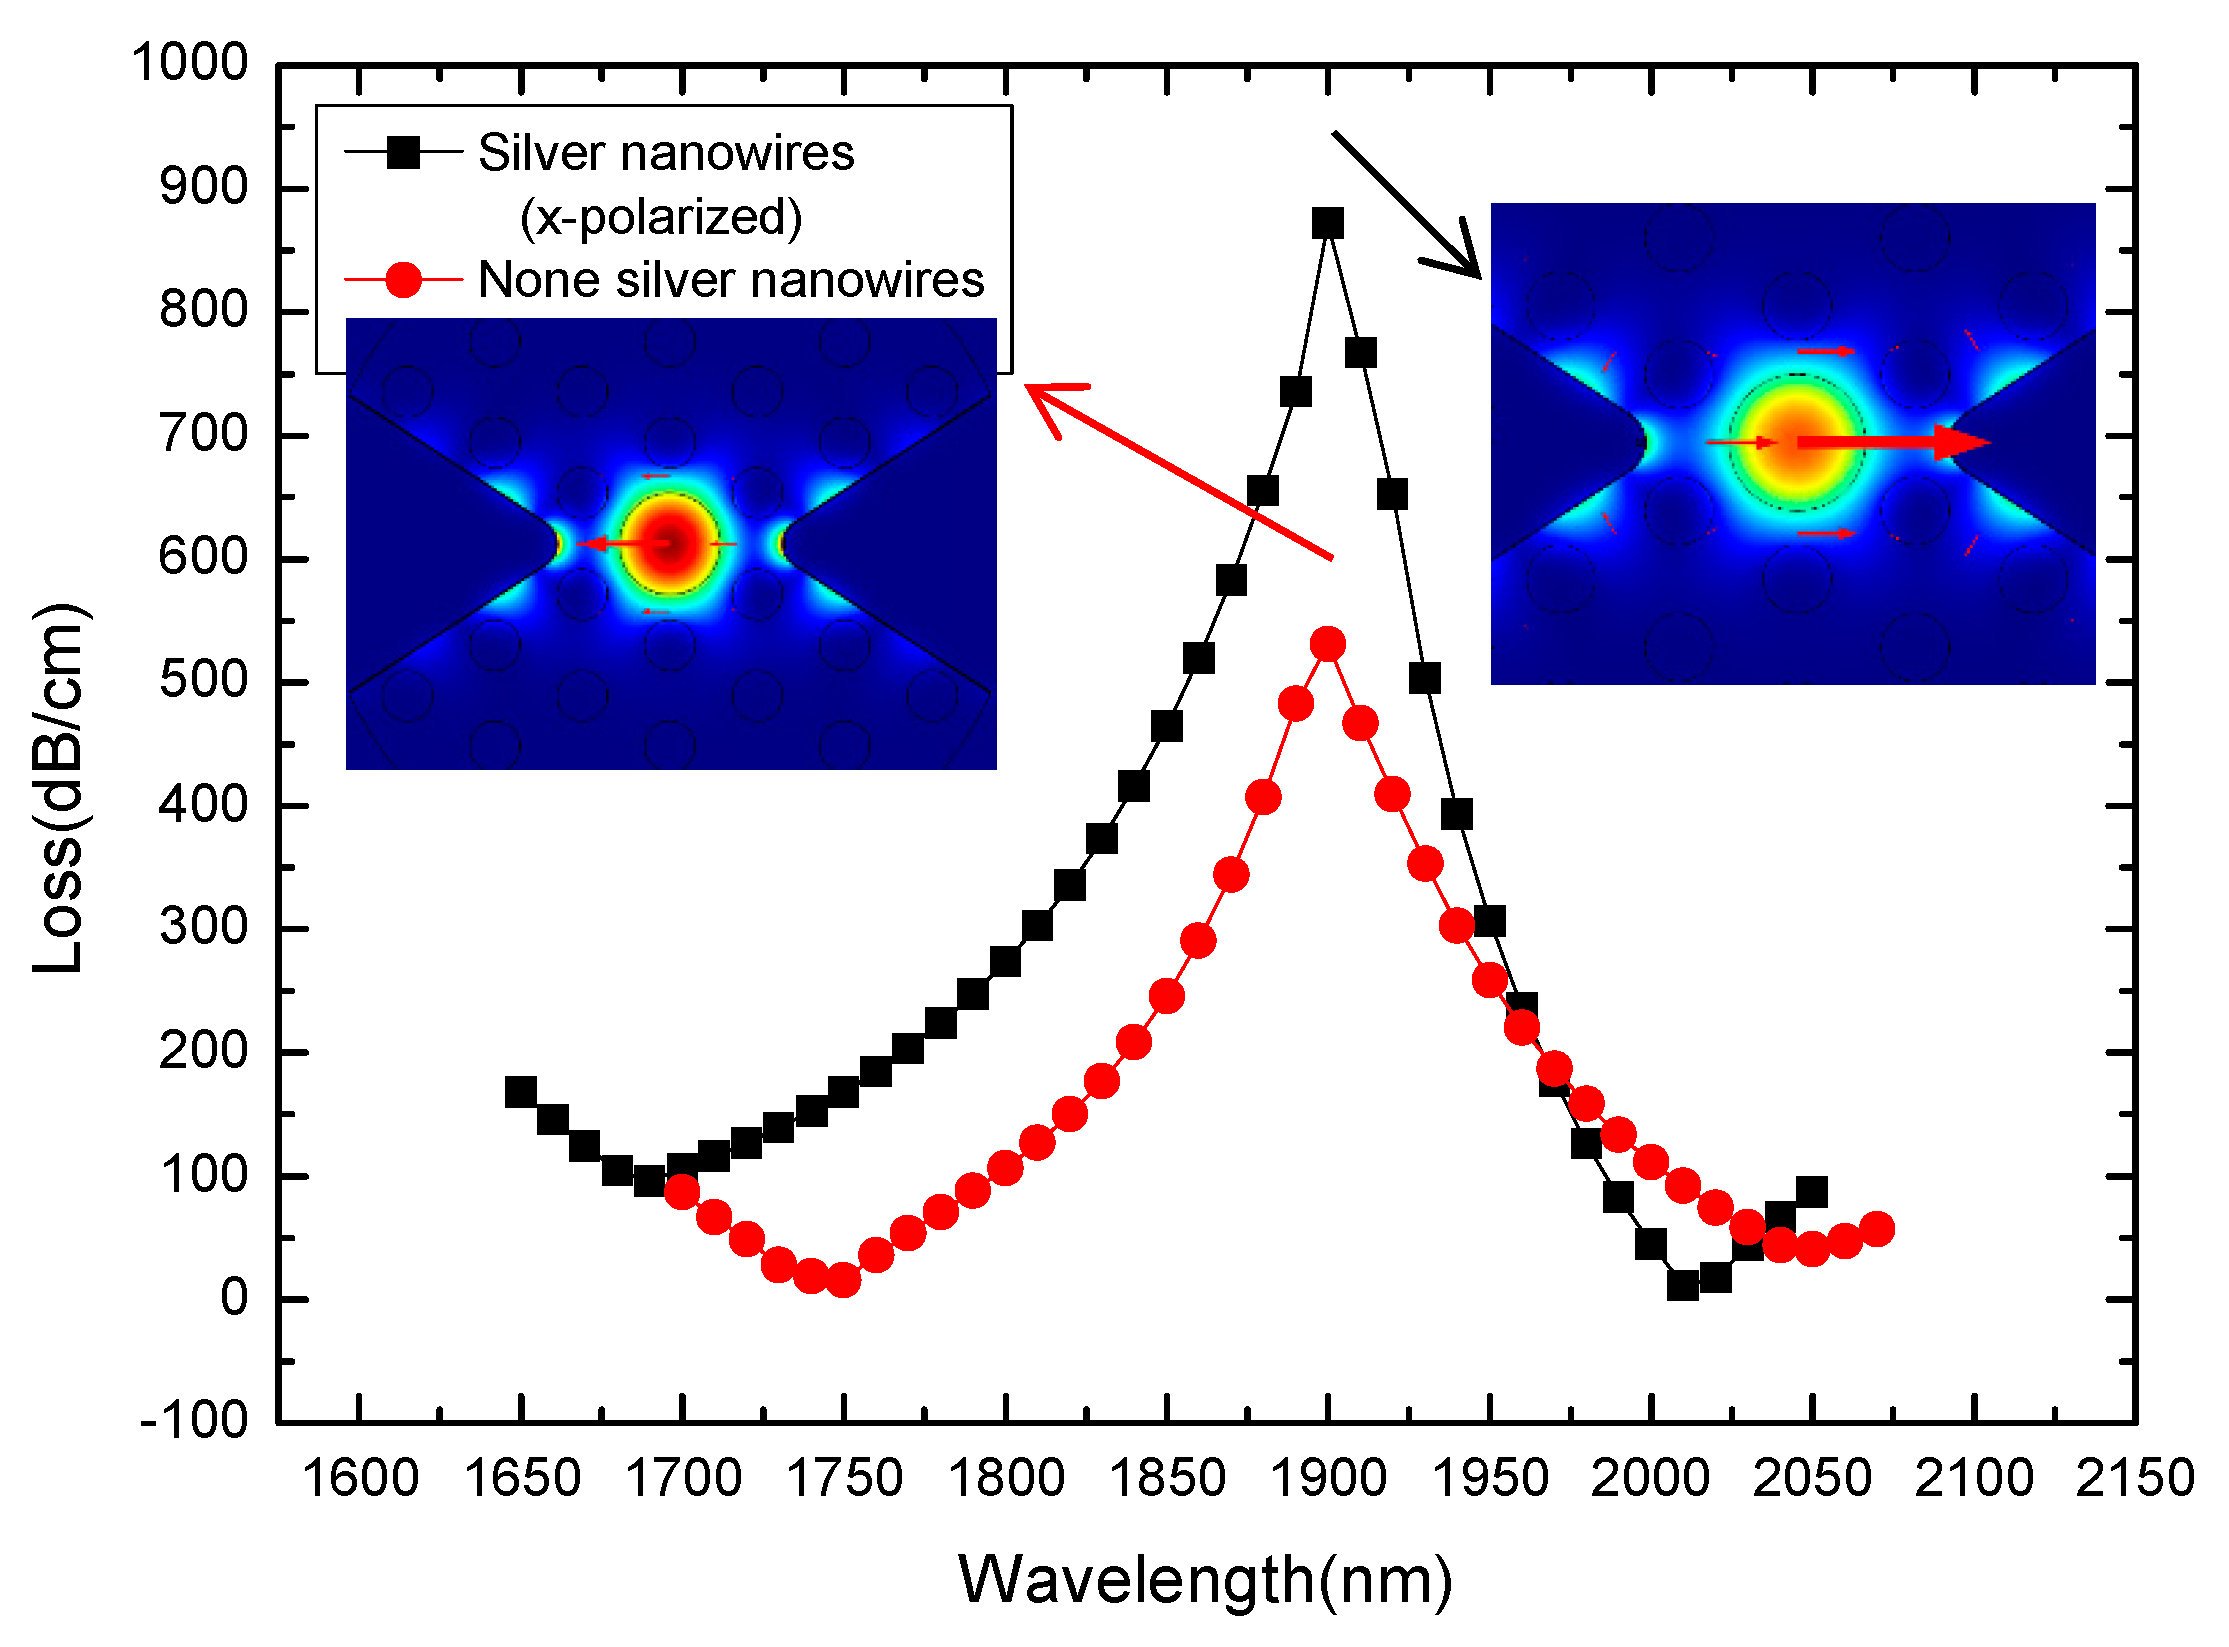
3. Results and Discussion
4. Conclusions
Supplementary Materials
Author Contributions
Funding
Institutional Review Board Statement
Informed Consent Statement
Data Availability Statement
Conflicts of Interest
References
- Wang, X.X.; Wu, Y.; Wen, X.L.; Zhu, J.K.; Bai, X.L.; Qi, Y.P.; Yang, H. Surface plasmons and SERS application of Au nanodisk array and Au thin film composite structure. Opt. Quant. Electron. 2020, 52, 238. [Google Scholar] [CrossRef]
- Chen, H.; Chen, Z.H.; Yang, H.; Wen, L.H.; Yi, Z.; Zhou, Z.G.; Dai, B.; Zhang, J.G.; Wu, X.W.; Wu, P.H. Multi-mode surface plasmon resonance absorber based on dart-type single-layer graphene. RSC Adv. 2022, 12, 7821–7829. [Google Scholar] [CrossRef] [PubMed]
- Wang, X.X.; Zhu, J.K.; Xu, Y.Q.; Qi, Y.P.; Zhang, L.P.; Yang, H.; Yi, Z. A novel plasmonic refractive index sensor based on gold/silicon complementary grating structure. Chin. Phys. B 2021, 30, 024207. [Google Scholar] [CrossRef]
- Liu, C.; Lü, J.; Liu, W.; Wang, F.M.; Chu, P.K. Overview of refractive index sensors comprising photonic crystal fibers based on the surface plasmon resonance effect. Chin. Opt. Lett. 2021, 19, 102202. [Google Scholar] [CrossRef]
- Liu, W.; Shi, Y.; Yi, Z.; Liu, C.; Wang, F.M.; Li, X.L.; Lv, J.W.; Yang, L.; Chu, P.K. Surface plasmon resonance chemical sensor composed of a microstructured optical fiber for the detection of an ultra-wide refractive index range and gas-liquid pollutants. Opt. Express 2021, 29, 40734–40747. [Google Scholar] [CrossRef]
- Zheng, Z.P.; Luo, Y.; Yang, H.; Yi, Z.; Zhang, J.G.; Song, Q.J.; Yang, W.X.; Liu, C.; Wu, X.W.; Wu, P.H. Thermal tuning of terahertz metamaterial properties based on phase change material vanadium dioxide. Phys. Chem. Chem. Phys. 2022, 24, 8846–8853. [Google Scholar] [CrossRef]
- Dash, J.N.; Jha, R. Graphene-based birefringent photonic crystal fiber sensor using surface plasmon resonance. IEEE Photonic. Technol. Lett. 2014, 26, 1092–1095. [Google Scholar] [CrossRef]
- Zhao, J.; Cao, S.; Liao, C.; Wang, Y. Surface plasmon resonance refractive sensor based on silver-coated side-polished fiber. Sens. Actuat. B-Chem. 2016, 230, 206–211. [Google Scholar] [CrossRef]
- Hassani, A.; Skorobogatiy, M. Design criteria for microstructured-optical-fiber-based surface-plasmon-resonance sensors. J. Opt. Soc. Am. B 2007, 24, 1423–1429. [Google Scholar] [CrossRef]
- Shuai, B.B.; Li, X.; Zhang, Y.Z.; Liu, D.M. A multi-core holey fiber based plasmonic sensor with large detection range and high linearity. Opt. Express 2012, 20, 5900–5974. [Google Scholar] [CrossRef]
- Wu, Y.; Town, G.E.; Bang, O. Refractive index sensing in an all-solid twin-core photonic bandgap fiber. IEEE Sens. J. 2010, 10, 1192–1199. [Google Scholar]
- Peng, Y.; Zhao, Y.; Hu, S. Low-cost high-performance temperature sensor based on unsymmetrical U-shaped microfiber. Opt. Fiber Technol. 2021, 65, 102597. [Google Scholar] [CrossRef]
- Liu, C.; Yang, L.; Liu, Q.; Wang, F.M.; Sun, Z.J.; Sun, T.; Mu, H.W.; Chu, P.K. Analysis of a surface plasmon resonance probe based on photonic crystal fibers for low refractive index detection. Plasmonics 2018, 13, 779–784. [Google Scholar] [CrossRef]
- He, J.; Brimmo, A.T.; Qasaimeh, M.A.; Chen, P.Y.; Chen, W.Q. Recent advances and perspectives in microfluidics-based single-cell biosensing techniques. Small Methods 2017, 1, 1700192. [Google Scholar] [CrossRef]
- Yang, X.; Lu, Y.; Wang, M.; Yao, J. An exposed-core grapefruit fibers based surface plasmon resonance sensor. Sensors 2015, 15, 17106–17114. [Google Scholar] [CrossRef] [Green Version]
- Yang, X.C.; Lu, Y.; Wang, M.T.; Yao, J.Q. SPR sensor based on exposed-core grapefruit fiber with bimetallic structure. IEEE Photon. Tech. Lett. 2016, 28, 649. [Google Scholar] [CrossRef]
- Homola, J. Present and future of surface plasmon resonance biosensors. Anal. Bioanal. Chem. 2003, 377, 528–539. [Google Scholar] [CrossRef]
- Rakhshani, M.R.; Mansouri-Birjandi, M.A. Engineering hexagonal array of nanoholes for high sensitivity biosensor and application for human blood group detection. IEEE Trans. Nanotechnol. 2018, 17, 475–481. [Google Scholar] [CrossRef]
- Zhou, Z. Laser chemical vapor deposition of film. Laser J. 1985, 4, 45–47. [Google Scholar]
- Hong, S.H.; Bae, B.J.; Yang, K.Y.; Jeong, J.H.; Kim, H.S.; Lee, H. Fabrication of sub-50 nm Au nanowires using thermally curing nanoimprint lithography. Electron. Mater. Lett. 2009, 5, 139–143. [Google Scholar] [CrossRef]
- Wang, B.T.; Wang, Q. Sensitivity-enhanced optical fiber biosensor based on coupling effect between SPR and LSPR. IEEE Sens. J. 2018, 18, 8303–8310. [Google Scholar] [CrossRef]
- Portosi, V.; Laneve, D.; Falconi, M.C.; Prudenzano, F. Advances on photonic crystal fiber sensors and applications. Sensors 2019, 19, 1892. [Google Scholar] [CrossRef] [PubMed] [Green Version]
- Ott, J.R.; Heuck, M.; Agger, C.; Rasmussen, P.D.; Bang, O. Label-free and selective nonlinear fiber-optical biosensing. Opt. Express 2008, 16, 20834. [Google Scholar] [CrossRef] [PubMed]
- Rindorf, L.; Bang, O. Sensitivity of photonic crystal fiber grating sensors: Biosensing, refractive index, strain, and temperature sensing. J. Opt. Soc. Am. B 2008, 25, 310–324. [Google Scholar] [CrossRef] [Green Version]
- Ghosh, G. Sellmeier coefficients and chromatic dispersions for some tellurite glasses. J. Am. Ceram. Soc. 1995, 78, 2828–2830. [Google Scholar] [CrossRef]
- Hassani, A.; Skorobogatiy, M. Design of themicrostructured optical fiber-based surface plasmon resonance sensors with enhanced microfluidics. Opt. Express 2006, 14, 11616–11621. [Google Scholar] [CrossRef] [PubMed] [Green Version]
- Lin, K.; Lu, Y.; Luo, Z.; Zheng, R.; Wang, P.; Ming, H. Numerical and experimental investigation of temperature effects on the surface plasmon resonance sensor. Chin. Opt. Lett. 2009, 7, 428–431. [Google Scholar]
- Beach, R.; Christy, R. Electron-electron scattering in the intraband optical conductivity of Cu, Ag, and Au. Phys. Rev. B 1977, 16, 5277. [Google Scholar] [CrossRef]
- Lawrence, W.E. Electron-electron scattering in the lowtemperature resistivity of the noble metals. Phys. Rev. B 1976, 13, 5316–5319. [Google Scholar] [CrossRef]
- Holstein, T. Optical and infrared volume absorptivity of metals. Phys. Rev. 1954, 96, 535. [Google Scholar] [CrossRef]
- Ujihara, K. Reflectivity of metals at high temperatures. J. Appl. Phys. 1972, 43, 2376–2383. [Google Scholar] [CrossRef]
- Peng, Y.; Hou, J.; Huang, X.; Lu, Q. Temperature sensor based on surface plasmon resonance within selectively coated photonic crystal fiber. Appl. Optics 2012, 51, 6361–6367. [Google Scholar] [CrossRef] [PubMed]
- Rifat, A.A.; Ahmed, R.; Yetisen, A.K.; Butt, H.; Sabouri, A. Photonic crystal fiber based plasmonic sensors. Sens. Actuat. B-Chem. 2017, 243, 311–325. [Google Scholar] [CrossRef]
- Zhao, Y.; Deng, Z.Q.; Li, J. Photonic crystal fiber based surface plasmon resonance chemical sensors. Sens. Actuat. B-Chem. 2014, 202, 557–567. [Google Scholar] [CrossRef]
- Zhang, P.P.; Yao, J.Q.; Cui, H.X.; Lu, Y. A surface plasmon resonance sensor based on a multi-core photonic crystal fiber. Opt. Lett. 2013, 35, 1673–1905. [Google Scholar] [CrossRef]
- Yu, X.; Zhang, Y.; Pan, S.S.; Shum, P.; Yan, M.; Leviatan, Y.; Li, C.M. A selectively coated photonic crystal fiber based surface plasmon resonance sensors. J. Optics 2010, 12, 015005. [Google Scholar] [CrossRef] [Green Version]
- Liu, Y.; Wei, J.G.; Wu, B.B.; Wu, X.H.; Lan, F.F.; Zhu, Y.C. Density alteration in non-physiological cells. Nat. Preced. 2011, 47, 533–536. [Google Scholar]
- Zhao, F.; Lin, J.; Lei, Z.H.; Yi, Z.; Qin, F.; Zhang, J.G.; Liu, L.; Wu, X.W.; Yang, W.X.; Wu, P.H. Realization of 18.97% theoretical efficiency of 0.9 µm Thick c-Si/ZnO Heterojunction Ultrathin-film Solar Cells via Surface Plasmon Resonance Enhancement. Phys. Chem. Chem. Phys. 2022, 24, 4871–4880. [Google Scholar] [CrossRef]
- Xia, F.; Song, H.; Zhao, Y.; Zhao, W.M.; Dai, Z.X. Ultra-high sensitivity SPR fiber sensor based on multilayer nanoparticle and Au film coupling enhancement. Measurement 2020, 164, 108083. [Google Scholar] [CrossRef]
- Rifat, A.; Mahdiraji, G.; Chow, D.; Shee, Y.; Ahmed, R.; Adikan, F. Photonic Crystal Fiber-Based Surface Plasmon Resonance Sensor with Selective Analyte Channels and Graphene-Silver Deposited Core. Sensors 2015, 15, 11499–11510. [Google Scholar] [CrossRef] [Green Version]
- Luan, N.; Yao, J. A Hollow-Core Photonic Crystal Fiber-Based SPR Sensor with Large Detection Range. IEEE Photonics J. 2017, 9, 6802107. [Google Scholar] [CrossRef]


| Parameters | Gold | Silver |
|---|---|---|
| 1.36 × 10¹⁶ (rad/s) | 1.3724 × 10¹⁶ (rad/s) | |
| 4.26 × 10⁻⁵ (K−1) | 5.67 × 10⁻⁵ (K−1) | |
| 170 K | 215 K | |
| 5.51 eV | 5.48 eV | |
| 0.55 | 0.55 | |
| 0.77 | 0.73 |
Publisher’s Note: MDPI stays neutral with regard to jurisdictional claims in published maps and institutional affiliations. |
© 2022 by the authors. Licensee MDPI, Basel, Switzerland. This article is an open access article distributed under the terms and conditions of the Creative Commons Attribution (CC BY) license (https://creativecommons.org/licenses/by/4.0/).
Share and Cite
Lv, J.; Wang, F.; Hu, C.; Yang, L.; Fu, H.; Zeng, Y.; Chu, P.K.; Liu, C. Numerical Analysis of Multifunctional Biosensor with Dual-Channel Photonic Crystal Fibers Based on Localized Surface Plasmon Resonance. Coatings 2022, 12, 742. https://doi.org/10.3390/coatings12060742
Lv J, Wang F, Hu C, Yang L, Fu H, Zeng Y, Chu PK, Liu C. Numerical Analysis of Multifunctional Biosensor with Dual-Channel Photonic Crystal Fibers Based on Localized Surface Plasmon Resonance. Coatings. 2022; 12(6):742. https://doi.org/10.3390/coatings12060742
Chicago/Turabian StyleLv, Jingwei, Famei Wang, Chunjie Hu, Lin Yang, Haihao Fu, Yanshu Zeng, Paul K. Chu, and Chao Liu. 2022. "Numerical Analysis of Multifunctional Biosensor with Dual-Channel Photonic Crystal Fibers Based on Localized Surface Plasmon Resonance" Coatings 12, no. 6: 742. https://doi.org/10.3390/coatings12060742
APA StyleLv, J., Wang, F., Hu, C., Yang, L., Fu, H., Zeng, Y., Chu, P. K., & Liu, C. (2022). Numerical Analysis of Multifunctional Biosensor with Dual-Channel Photonic Crystal Fibers Based on Localized Surface Plasmon Resonance. Coatings, 12(6), 742. https://doi.org/10.3390/coatings12060742