Article

Proposals of Frequency-Based and Direction Methods to Reduce the Influence of Surface Topography Measurement Errors

by
Przemysław Podulka
Faculty of Mechanical Engineering and Aeronautics, Rzeszow University of Technology, Powstancow Warszawy 8 Street, 35-959 Rzeszów, Poland
Coatings 2022, 12(6), 726; https://doi.org/10.3390/coatings12060726
Submission received: 21 March 2022 / Revised: 20 May 2022 / Accepted: 23 May 2022 / Published: 25 May 2022

Abstract

:
Various methods, based on both surface frequency and direction, can be alternatively proposed to reduce the influence of high-frequency measurement and data analysis errors. Various types of details were studied, e.g., cylinder liners after the plateau-honing process, plateau-honed cylinder liners with additionally burnished oil pockets (dimples), turned, ground, milled or laser-textured. They were measured with stylus or non-contact (optic) techniques. It was suggested to support various frequency-based methods, e.g., Frequency Spectrum, Power Spectral Densities or Autocorrelation Function, with direction techniques to provide reduction of errors in both detection and extraction of high-frequency measurement errors. Results can be especially valuable for regular studies when frequency-based measurement errors are difficult to be identified.

1. Introduction

Assessment of the surface topography, which is received in the last stage of the manufacturing process, can be especially valuable because many surface properties depend on their creating accuracy, like friction [1], sealing [2], lubricant retention [3], wear resistance [4,5], corrosion [6], fatigue [7] or, generally, material contact (tribological) performance [8] and material properties. Processes of analysis of surface topography can be, roughly, divided into several stages. Firstly, the measurement process [9] can be studied, and then, respectively, the accuracy of the data analysis [10] can be carefully considered. Even highly precise measurement equipment may not provide reliable results when data processing errors occur that properly manufactured parts can be classified as a lack and flatly rejected. In practice, both types of errors, that measurement and when raw data are processed, can be placed on an equal footing with each other, however, the impact of each of them individually was not compared previously.
From all errors related to the surface topography measurement and analysis, the main classification can be provided according to the factors that influence the accuracy of the results assessments. In that case, surface topography (measurement and data analysis) errors can be divided into those straightly related to the measuring method(s) [11], caused by the digitisation [12] or data processing [13], software [14], measuring object [15] or other errors [16]. Errors found when the measurement process occurs are defined as noise, measurement noise [17] in particular.
There are many types of measurement noise in surface topography analysis, considering both stylus and non-contact (e.g., optic) methods in the evaluation of surface roughness. They were comprehensively studied and, correspondingly, extensively reviewed in many previous papers [18,19,20,21]. Generally, the measurement noise can be defined as the noise added to the output signal when the normal use of the measuring instrument occurs [22]. Moreover, various types of environmental disturbance can introduce noise in different bandwidths [23]. One of the errors caused by the environment of the measuring system is the high-frequency noise [24]. This type of noise can be caused by instability of the mechanics with any influences from the environment or by internal electrical noise, however, in most cases, the high-frequency noise is the result of vibration and, respectively, in real measurement, can greatly affect the stability of slope estimation [25]. Some general strategies to reduce vibration noise are to minimise vibration sources, isolate the vibration sources and/or isolate the instrument [26]. Vibration isolation can be realised by optimising the mechanical structure of the instrument [27]. Another proposal is to compensate for the vibrational effect, like, a piezoelectric transducer has been used for an on-machine wavelength scanning interferometer to compensate for the fluctuations in the optical path length caused by vibration from the surrounding environment [28]. However, extensive studies of environmental noise, such as thermal variation and vibration, in the definition of the accuracy of in-process measurement results, seem to be challenging to develop fast and accurate optical in-process instruments, methods or guidance’s [29].
An engineering surface is composed of a large number of wavelengths of roughness that are superimposed on each other [30]. Therefore, analysis of surface topography, based on the frequency methods is common. There are many papers considering the assessment of the surface roughness with an application of a power spectral density (PSD). Introducing, PSD is an alternative method for specifying optical surfaces and quantifying the contribution of each spatial regime to the total surface error [31] and, primarily, the PSD, in its two-dimensional form, has been designated as the preferred quantity for specifying surface roughness on a draft international drawing standard for surface texture [32]. PSD approach, based on Fourier analysis [33] of surface topography data acquired by both stylus profilometry and atomic force microscopy (AFM [34]) was introduced, among others, to distinguish the scale-dependent smoothing effects, resulting in a novel qualitative and quantitative description of surface topography [35].
The utility of the PSD is that it contains statistical information that is unbiased by the particular scan size and pixel resolution chosen by the researcher [36]. Moreover, the application of PSD can be valuable in directly comparing surface roughness measured by various techniques even isolated particles affect the instruments in different ways [37]. Establishing a thorough framework to quantify the similarity of 3D surface topography measurements and determining whether they are from the same surface or not based on the frequency domain representations can be also resolved with PSD and 2D Fourier transformation so, respectively, feature extraction in the frequency domain is received [38]. Some anomalies in the PSD spectra can be related to aspects of the polishing process as well [39].
The power spectral method was used for the fractal characterization of the surface roughness and anisotropy of ground surfaces using the atomic force microscope data obtained from ground specimens [40]. PSD based fractal dimension obtained using AFM data was proposed for the surface characterization of brake plunger manufactured using a rolling process [41]. What is crucial, the surface quality can be compared using PSD for the dry and MQCL (Minimum Quantity Cooling Lubrication) turning process [42]. In some cases, the PSD enabled the derivation of the surface roughness and thus provide useful information on characteristic features which compose the microstructure of the films [43]. PSD can also be used to indicate how the process modifies topography at different scales [44].
Almost all the traditional noise reduction methods have the problem of energy loss [45]. The measurement noise was studied with a fractal dimension and, respectively, it was found that the noise has a significant influence on the amplitude and, correspondingly, the estimated fractal dimension of low-dimensional surfaces, but has relatively less influence on the high-dimensional surfaces. Thus, denoising for low-dimensional surfaces was required prior to fractal analysis [46].
In spectral analysis, circular spectra and/or accumulation spectra are suitable for the analysis of sample surfaces from isotropic machining processes [47]. PSD and autocorrelation function (ACF) are Fourier transform pairs and are related to the frequency or, respectively, spectral analysis. It was found valuable to use frequency-based procedures for analysing turned or ground surfaces with the application of a profile (2D) or areal (3D) performance [48].
From the literature review, it was found that there were no studies if the surface topography direction (dominant direction) influences high-frequency measurement noise detection and, respectively, reduction processes. Falsely applied methods, e.g., commonly used (available in the commercial software) filters, can cause huge errors in surface topography parameters computing. Moreover, analysis of surface topography, especially when roughness evaluation [49] is required, with the application of frequency or direction methods, desire a very reliable and thorough analysis, therefore should be presented in detail. Even experienced users, when not guided on how to use common methods, can falsely estimate the properties of properly made parts and reject its suitability to further processing.

2. Materials and Methods

2.1. Studied Details

Various types of surfaces were studied, as follows: cylinder liners after the plateau-honing process, plateau-honed cylinder liners with additionally burnished oil pockets (dimples) with various sizes (width ranging from 70 to 800 µm and depth between 7 and 100 µm), turned, ground, milled or, respectively, laser-textured (with 60- or 120-angle texturing processes).
According to the preliminary analysis, all of the studied details were provided with an areal form removal process [50]. Types of procedures for extraction of long-frequency components from the raw measured data were widely studied in previous papers [51], so, correspondingly, were not considered in this research. From the action above, studied surfaces were, in general, flat that did not contain form and, correspondingly, waviness. However, the accuracy of form and waviness removal on the results obtained was not currently studied. If the surface contained non-measured points [52] or other, like individual peaks (spikes [16]), errors, were extracted and removed from the data.
More than 10 (usually between 10 and 15) surfaces from each type of topographies were measured and studied to provide some repeatability in the analysis of the results, but only some of them were presented in detail. Moreover, all of the analyses were improved with modelled data as well and, subsequently, compared with those measured to find some general proposals.

2.2. Measurement Process

Studied details were measured by stylus or optical techniques. The stylus instrument was Talyscan 150 having a nominal tip radius of 2 μm, with a height resolution equal to 10 nm, the measured area 5 by 5 mm with, respectively, 1000 × 1000 measured points. The sampling interval was 5 μm. The measurement velocity was 1 mm/s and, appropriately, its influence was not considered that it was not the preliminary of the research provided, it issue was extensively studied in previous studies.
Secondly, the non-contact measurement equipment was a white light interferometer, Talysurf CCI Lite. Its height resolution was 0.01 nm. The measured area was 3.35 by 3.35 mm with, proportionately, 1024 × 1024 measured points. The spacing was 3.27 μm and, suitably, the effect of sampling or spacing on values of an areal surface texture parameters were not studied in this paper.

2.3. Applied Methods and Procedures

2.3.1. Regular Methods and Procedures

Studied surfaces were analysed by various methods. All of the procedures applied for data processing are commonly used by metrologists and, simultaneously, available in the commercial software (measuring equipment) dedicated to the analysis of the results of surface topography measurements. One of the main purposes of the studies performed was to present some valuable guidance on how to use those approaches with minimisations of the errors in a measured data processing that even precise measuring equipment may not provide relevant results when obtained data are not processed accurately.
Very popular and, correspondingly, available in measuring equipment are PSD and ACF methods, corresponding to the Fourier Transform characterisation, as an outstanding example of frequency-based analysis. Frequency characteristics with spectrum performance, e.g., the FS method, can be an excellent complement for the two above techniques. Another method, an angular spectrum gives quantitative information about the character of surfaces (isotropic or anisotropic) and surface directionality [53]. Therefore, the texture direction (TD) graph can be applied in the processes of surface topography characterisation when a high-frequency noise is studied.
Generally available filters, proposed for a definition of S-F surface [54] (received by definition of S-surface and F-surface) with software equipment performance, are Gaussian (GF), with its robust (RGF) modification, regular isotropic spline (SF), median denoising (MDF) or, continuing, fast Fourier transform (FFTF) algorithms. Those, widely used filters, can be compared by supporting them with proposed techniques for minimisation of errors in surface roughness parameters calculations.

2.3.2. Proposed Approaches for Surface Topography Characterisation

Even surface topography is often analysed with an areal (3D) performance that many issues concerning material contact, in general, is also in areal meaning, much valuable information can be received when selected profiles are studied. The 2D characterisation can be valuable for the definition of L-surface or, respectively, S-surface, both with properly defined bandwidth filtration. The distortion of some features, e.g., dimples [55], can be also more visible when a 2D analysis is provided.
Comparing the 2D analysis against the 3D, it should be considered when PSD, ACF, FS or, consequently, the isometric (profile) view is applied simultaneously. Some multithreaded aspects were also found ad recommended previously. When an areal PSD, ACF and FS method was proposed, differences between a surface containing high-frequency noise and a surface where that type of measurement error was not defined were negligible or, correspondingly, did not exist. Considering areal studies, which can give a more suitable response to the tribological performance that, consequently, the contact is areal, in general. Nevertheless, some analysis must be based on the selected and extracted features, that can be provided with profile (2D) performance.
The process of definition or, generally, detection of high-frequency measurement errors from the results of surface topography measurement, was already proposed with profile characterisation. Except for the number and size of surface topography features, e.g., valleys, the 2D analysis could give a crucial response to the occurrence of the high-frequency error. Even though the PSD calculation was provided in all directions, the 3D characteristic was not convenient and the required frequencies were not visible on the graph. From that point of view, the 3D PSD characterisation was useless and an areal tribological characterisation was limited to the measurement errors caused by the environment vibrations.
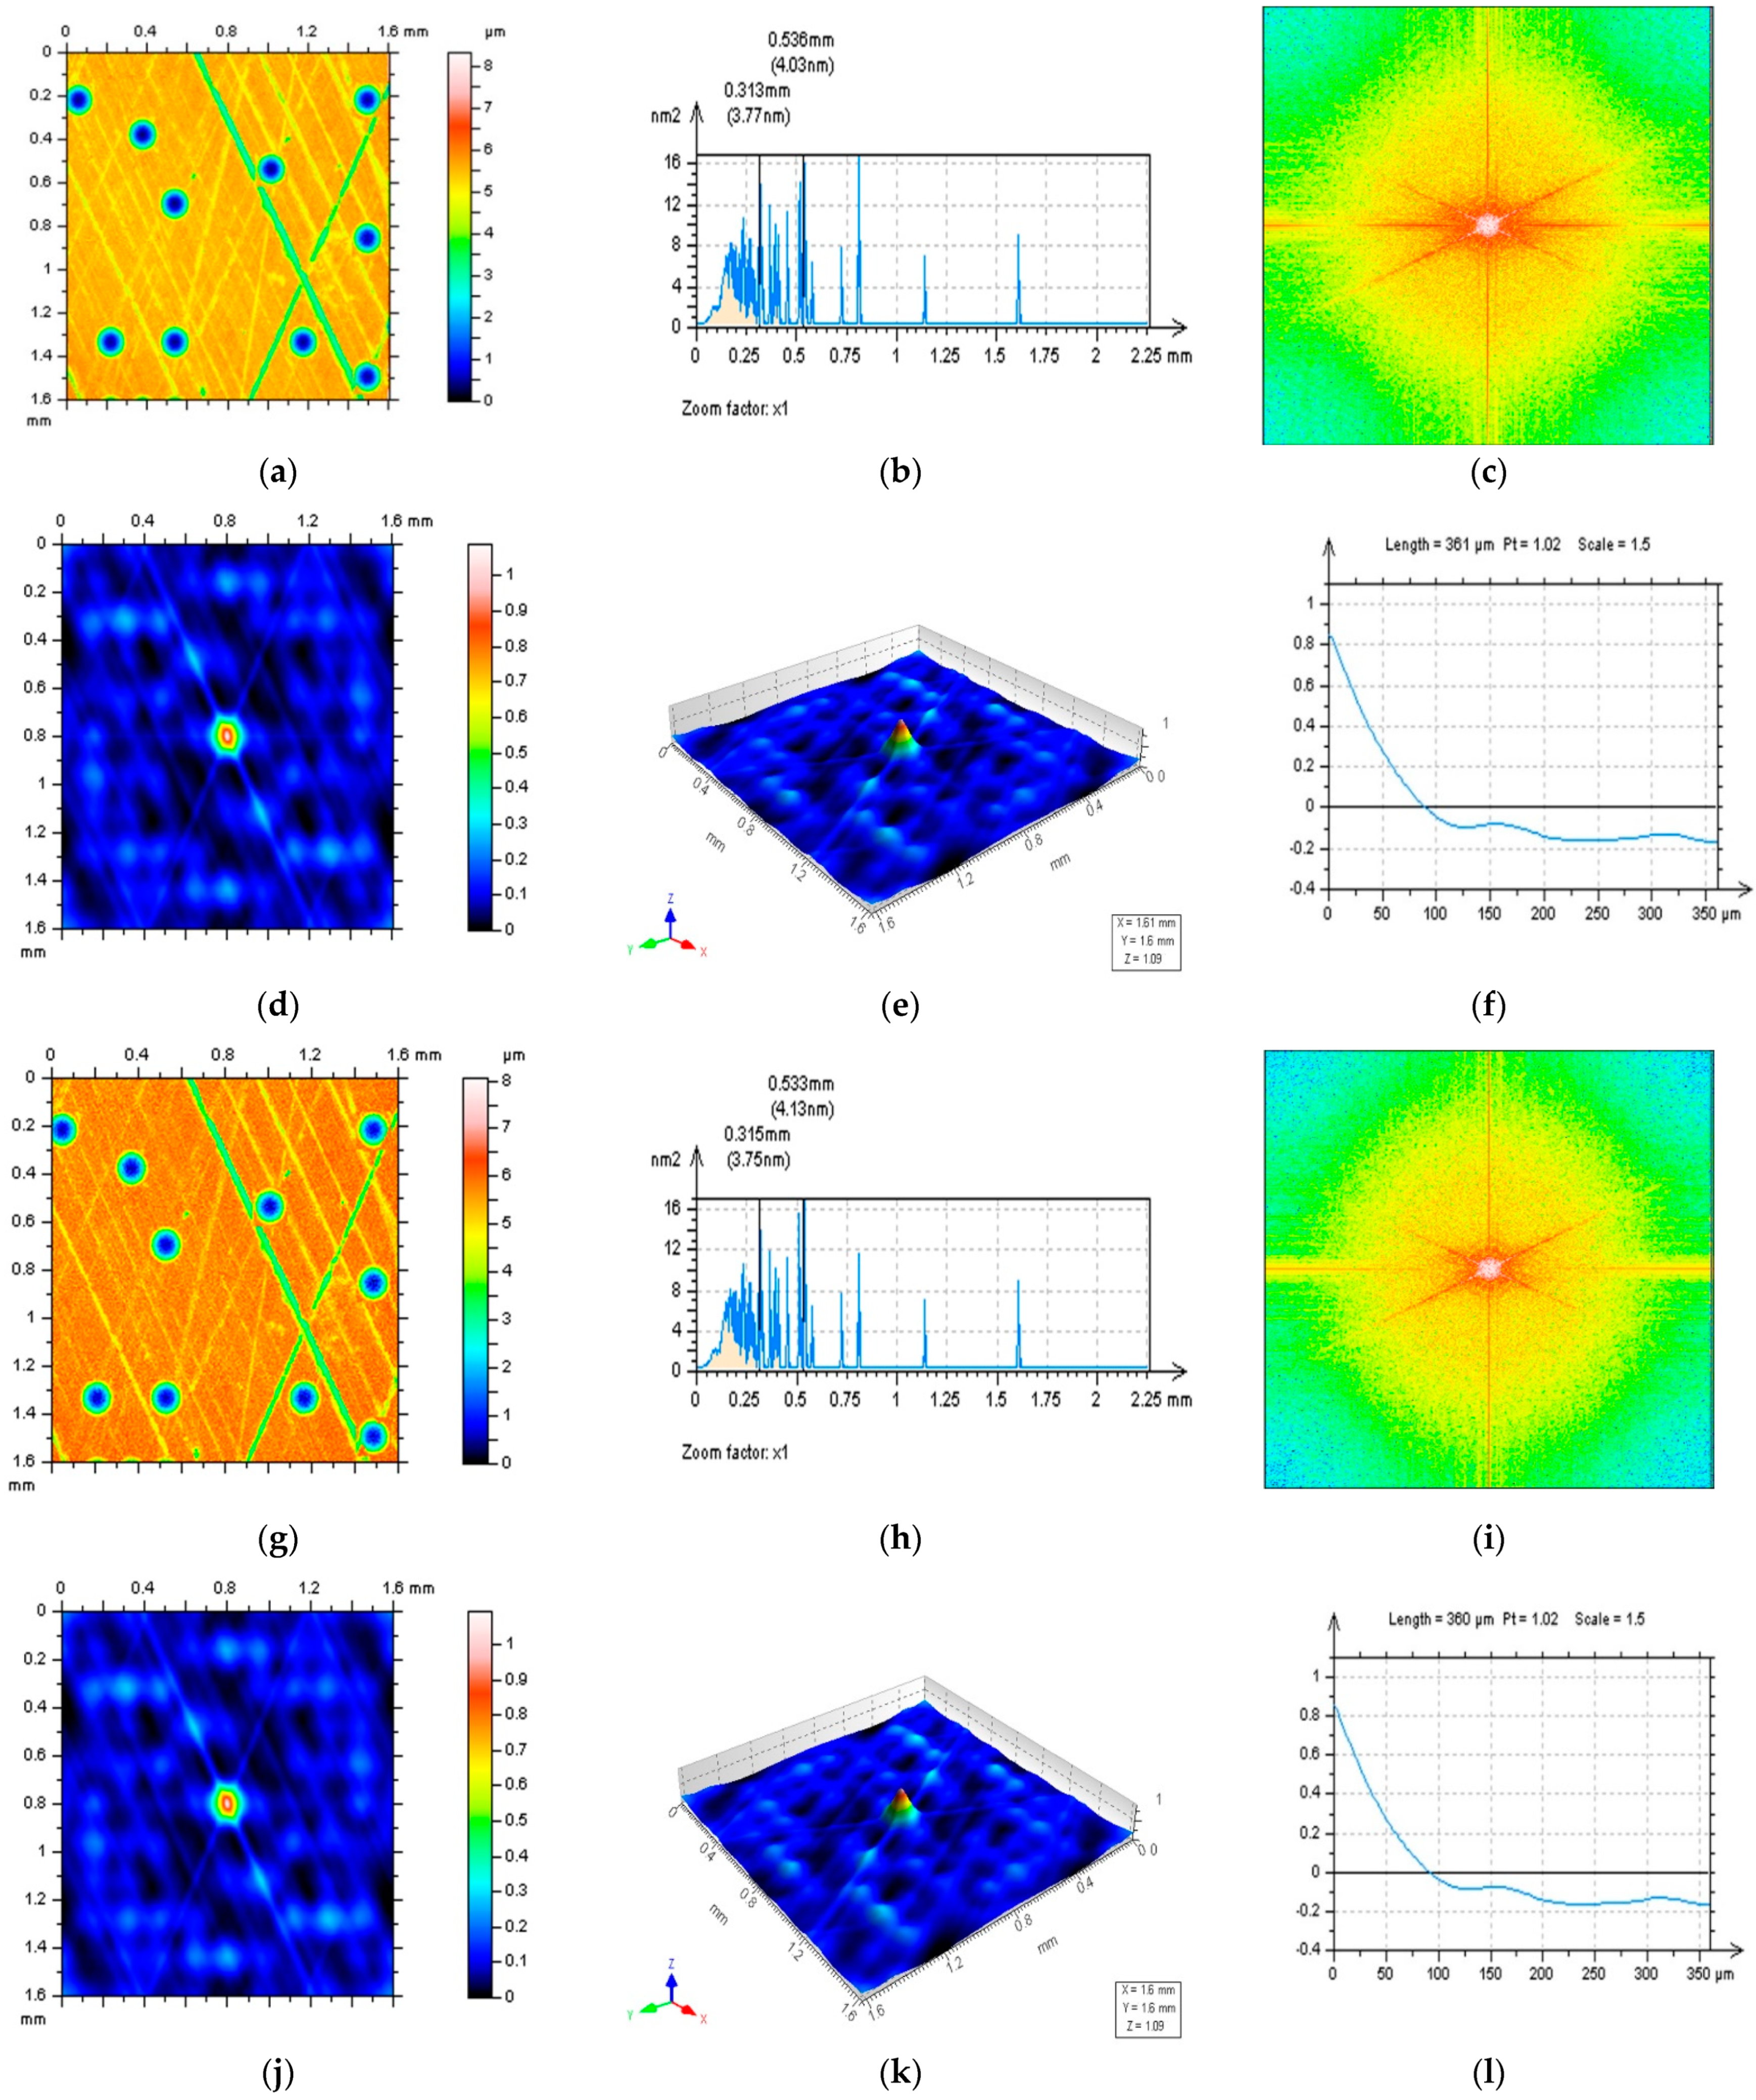
Some similar limitations were observed for ACF analysis. In Figure 1 areal ACF graphs were applied for the characterisation of a milled surface. Differences from ACF calculated for surface containing high-frequency errors (j, k) and the same surface but without this type of noise (d, e) were negligible. For this type of analysis, extraction of the centre (located in the middle of the analysed 3D data) profile gave more unambiguous results that extreme (middle) values increase more rapidly when a high-frequency noise is found (f and l).
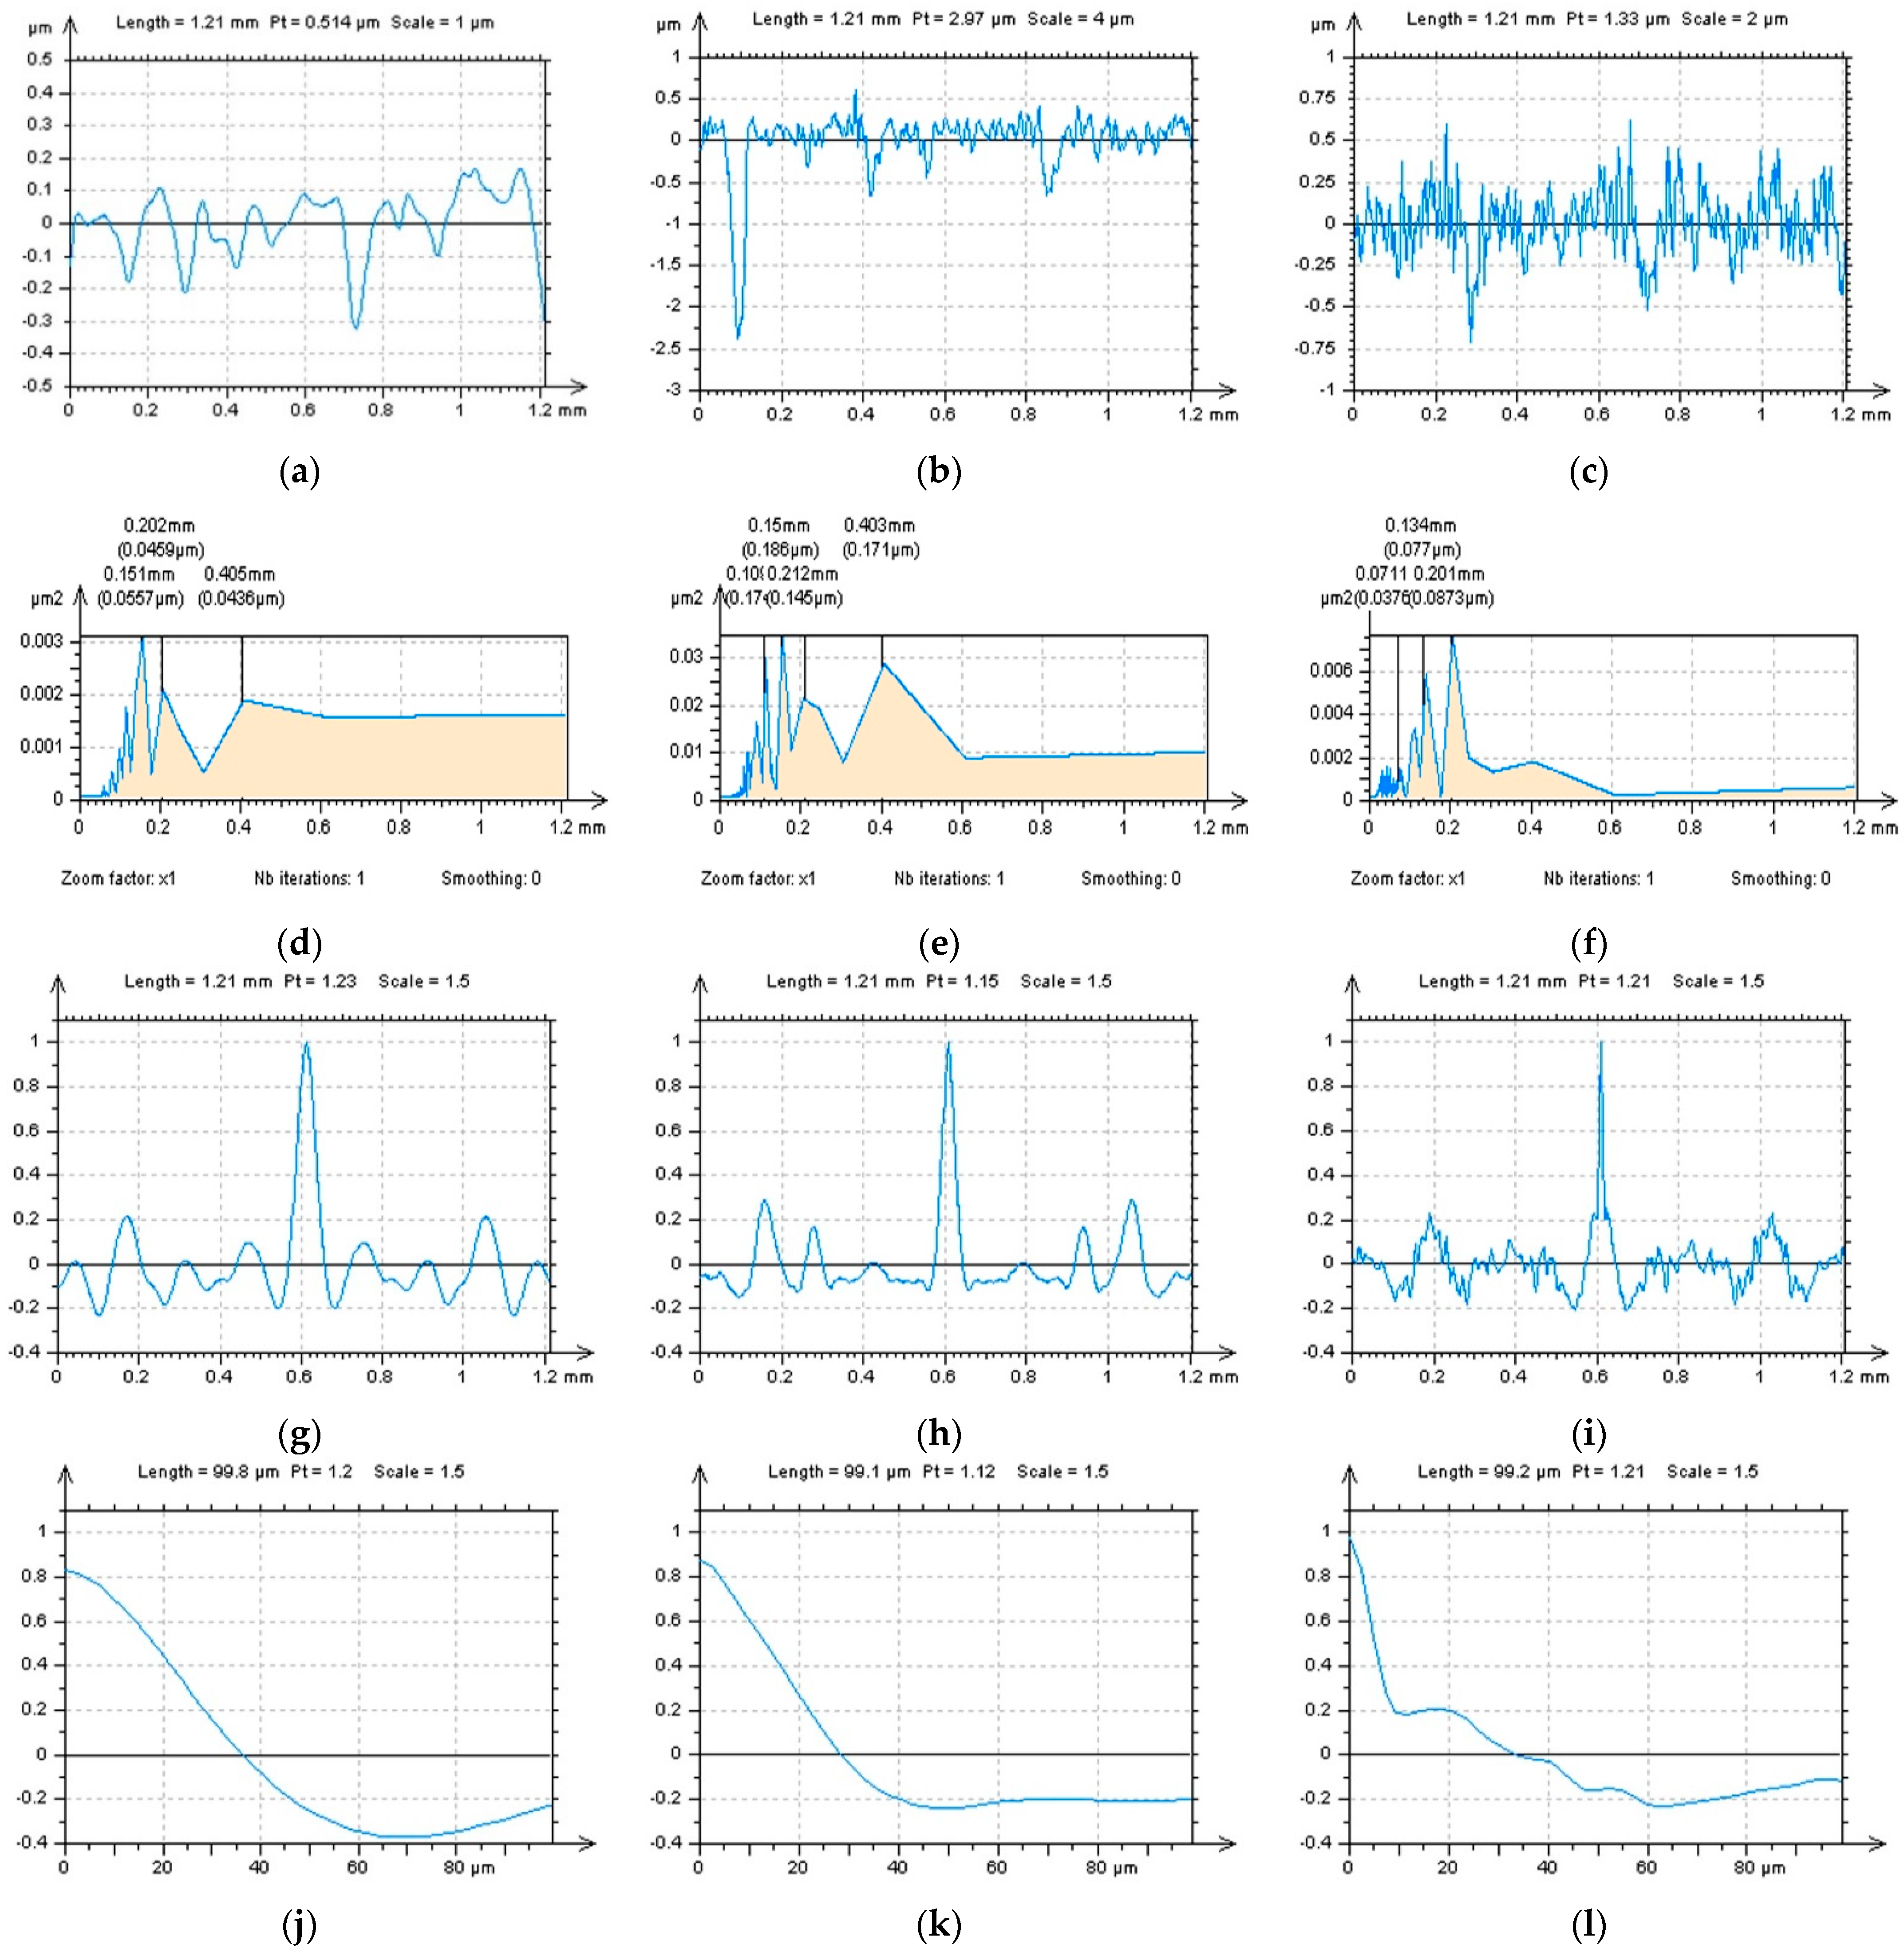
The 3D analysis can be valuable only when FS or eye-view studies are performed, nonetheless, this technique may require experienced users. Moreover, the PSD, ACF and FS methods did not always give clear results, e.g., for plateau-honed surface topography (Figure 2), an areal analysis was useless instead of a profile (Figure 3). Therefore, for some cases, the profile (2D) studies are proposed instead of an areal (3D).
Not only analysis of the PSD and ACF graphs can be valuable in processes of surface topography data studies. It was provided in previous studies that the direction of the profile extraction can affect the accuracy of the high-frequency measurement noise detection [56]. Moreover, the direction can also have a considerable influence on the validation of noise removal algorithms that, when using a noise surface characterisation, TD graph can provide relevant results that can be exceedingly valuable in the analysis of surface texture isotropy. The process of detection of high-frequency noise can be improved with an analysis of the high-frequency noise surface (HFNS). The HFNS is a surface received when applying an algorithm for a high-frequency noise separation, e.g., regular digital fileting methods. In practice, the HFNS is a surface removed from the raw measured data when a noise-removal procedure is applied. Previously, when defining the properties of HFNS, it was assumed that it should consist only of the frequencies that noise surfaces are defined, in this case, of the frequencies in the high domain. This property can be described by the PSD analysis. Moreover, the effect of the shape of the centre part of the ACF can be also crucial. According to the further studies it is suggested to deeply analyse the directional properties of the HFNS with a TD graph consideration. If HFNS is defined properly, containing only the high-frequency components should be isotropic as well. This can be verified by calculation and presenting the TD graph.
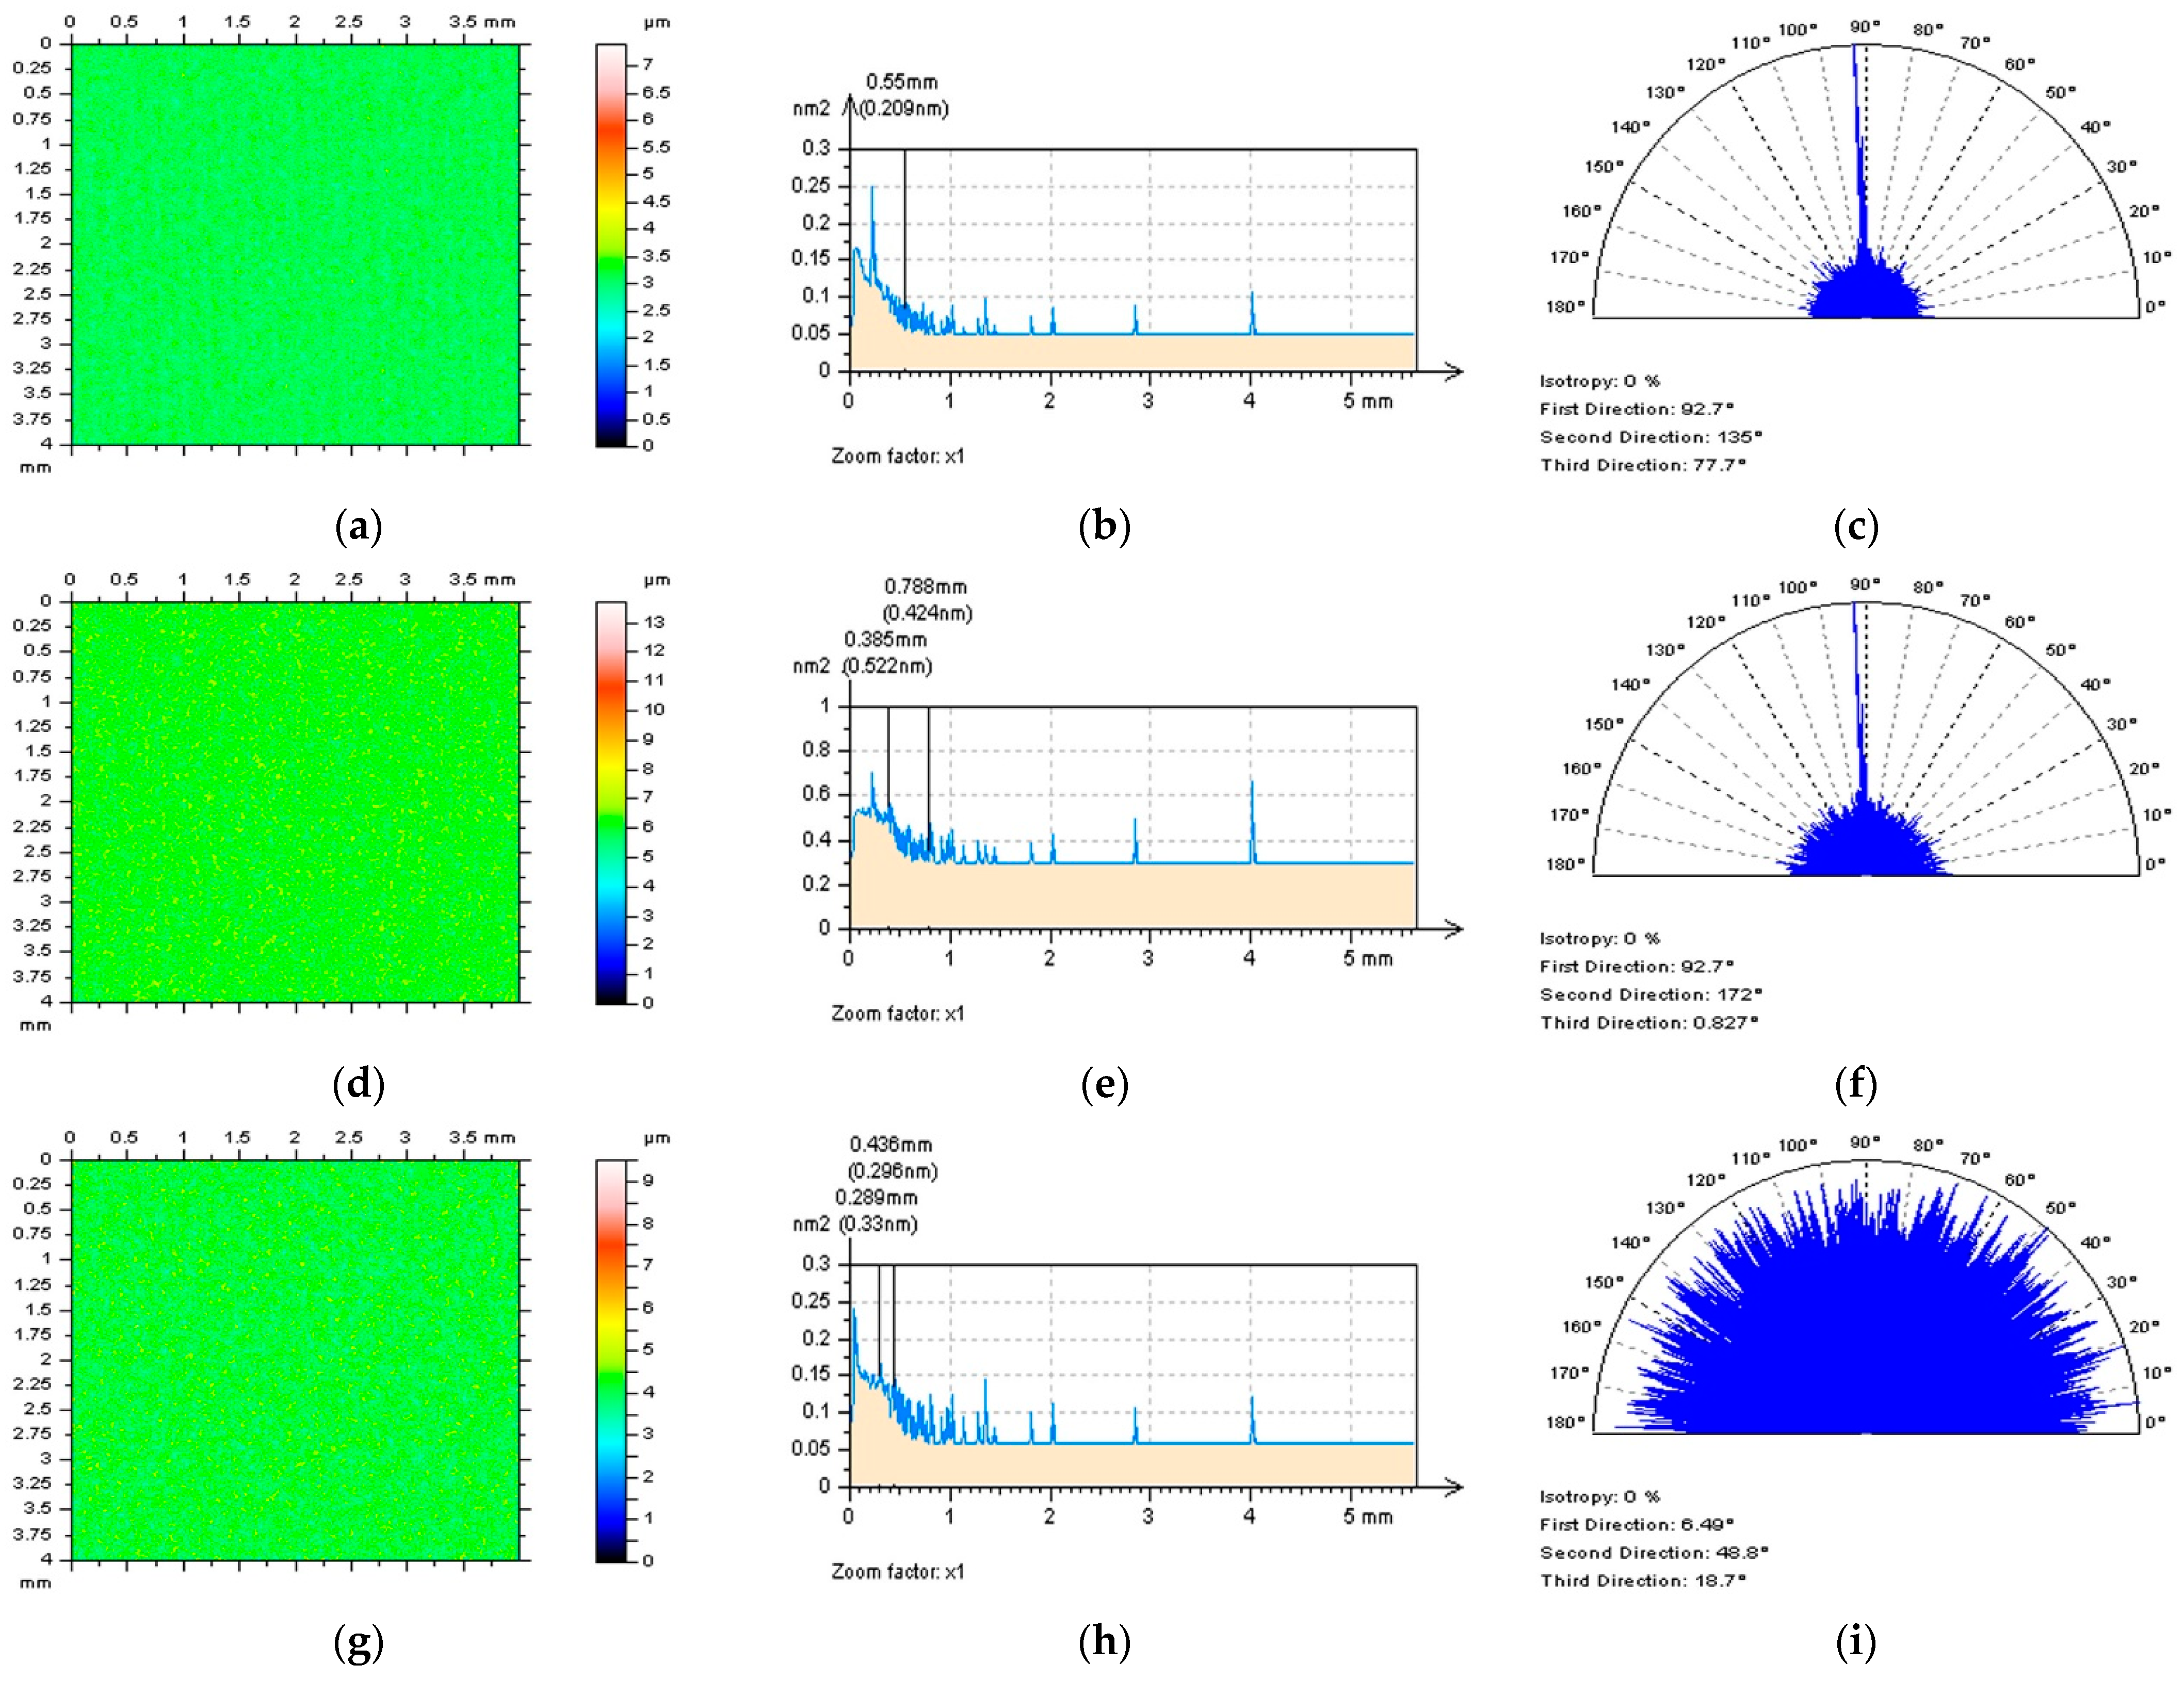
In previous, provided in already presented results, it was assumed that PSD and ACF characterisation of selected (e.g., those from the centre part of the analysed detail) extracted profiles can give some valuable information about the high-frequency noise occurrence. However, even though the high frequencies are visible in the PSD and ACF graphs, the HFNS can not be isotropic which was shown with plenty of TD graph characterisations. This property can be especially visible when a surface with a determined direction is comprehensively considered. In Figure 4 ground surface is presented. Each type of filtering (GF, SF or MDF) defined an HFNS with no isotropic performance that the TD graph indicates no isotropic textures. This technique can indicate that in the HFNS other than noise features can be found. This is not expected that some required surface features may be removed and surface quality falsely estimated, the values of surface topography parameters can be calculated erroneously as well. Therefore, from the above property, it is suggested to use all of the available techniques, like PSD, ACF, FS and TD methods, in the process of detection of high-frequency measurement errors occurrence and, respectively, to evaluate the surface roughness parameters with minimisation of high-frequency errors influence. One of the most important tasks to be resolved in the presented studies is to select the value of filter bandwidth. The cut-off value was studied in many previous papers, nevertheless, there is extremely difficult to remove the measurement noise without any distortion of the surface texture features, like valleys, dimples, and treatment traces in general. Very popular in surface topography analysis are plenty of Gaussian filters [57]. Many current studies are performed by comparing plenty of methods and approaches to the ISO-defined general Gaussian filtering technique. Some alternatives can be proposed with Fast Fourier Transform and its filtering methods (FFTF). In practice, it is extremely difficult to propose a relevant cut-off value when selecting an appropriate filter for noise removal that, even optimized, a filter can always affect other frequencies (features) of an analysed detail. Removing some of the features can be especially disadvantageous that in the process of control, properly made parts can be classified as lacks and rejected.
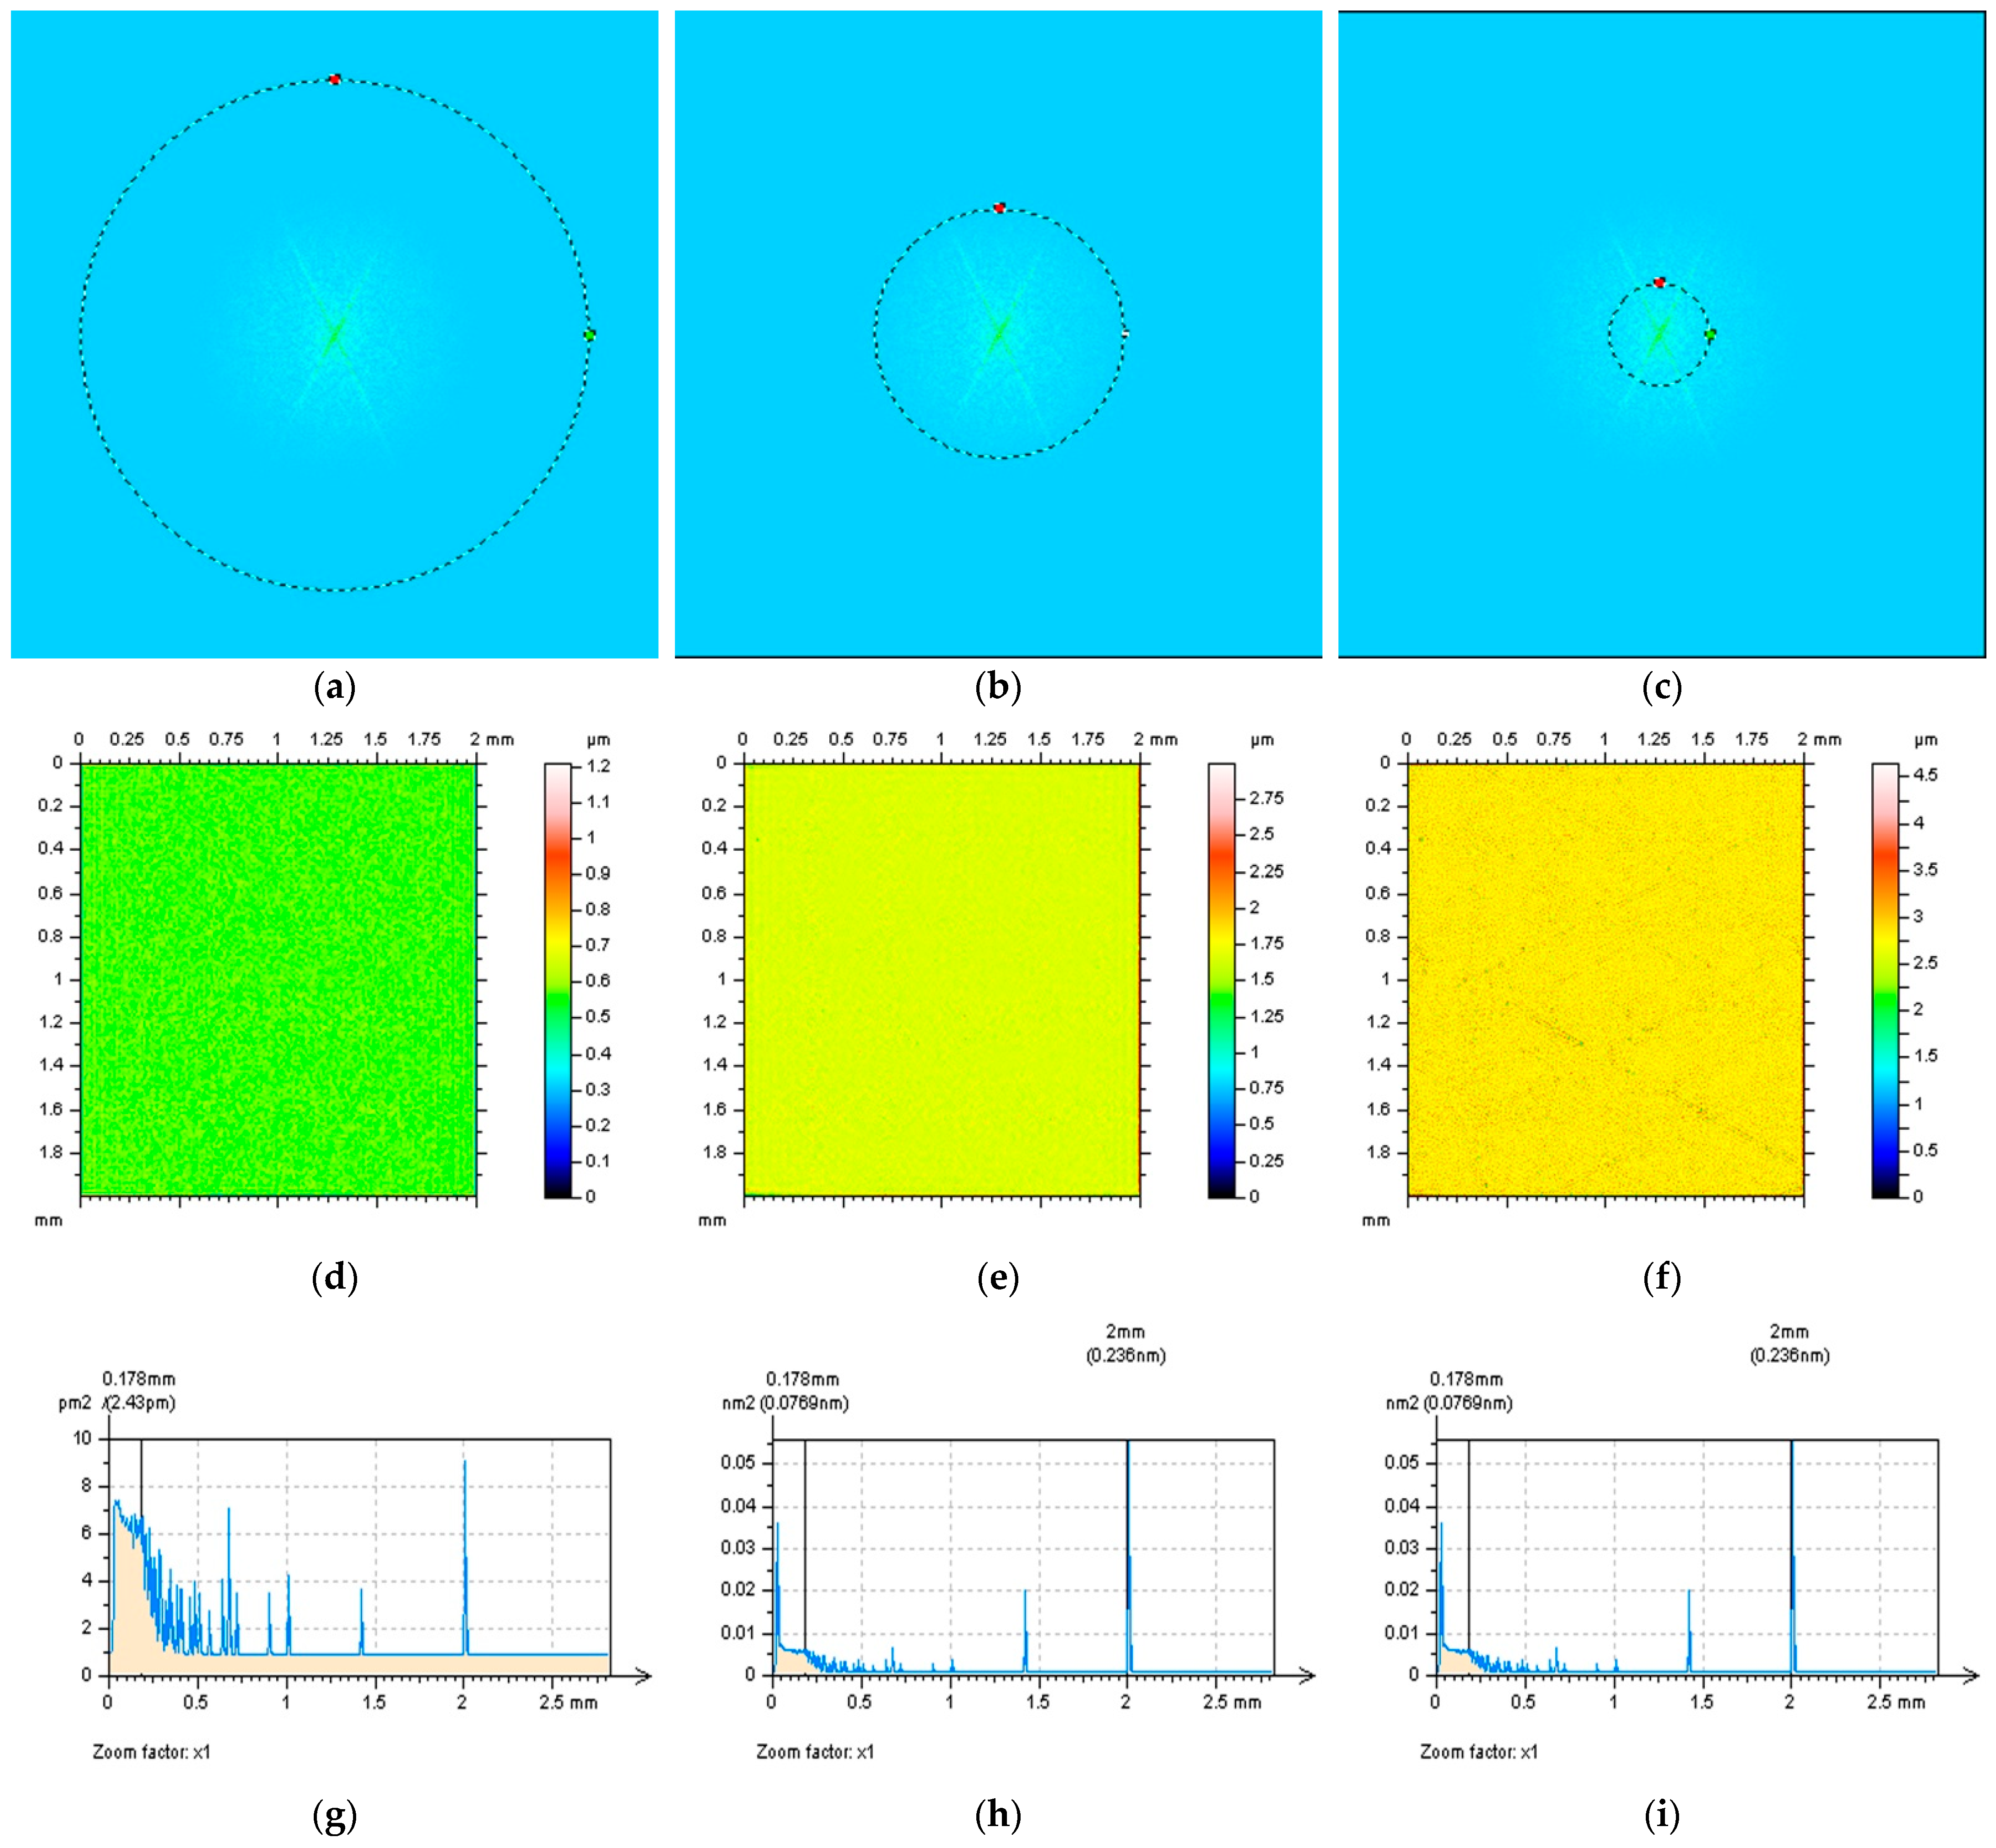
Therefore, in the presented studies, the technique based on the analysis of FS is suggested to select the most appropriate cut-off value when a digital filter is used. In Figure 5 FS technique was presented for HFNS received by FFTF filtering of a plateau-honed cylinder liner raw measured surface data. The FS-based technique (FSBT) proposes to select the bandwidth of the filter with the filter selector range. When the range is too big (a) and exceeds the FFT graph features with known direction, the filter can not remove the entire noise data. However, on the other hand, when a range is too small (c) other features can be also separated from measured data. This can be especially visible when an isometric view of HFNS is studied (d, f) or, respectively, TD graphs (j, l) are considered. Application of the filter range equal to the size (length) of the features in the FFT graph (b) turns out to be essential in an accurate definition of HFNS, which is isotropic (TD), is primarily composed of the high-frequencies (PSD) and, correspondingly, has no traces of the treatment trace features (isometric view analysis). The FSBT can be especially valuable for topographies with a determined direction but can be not convincing when isotropic surfaces are studied.

3. Results and Discussions

Processes of data analysis were proposed for raw measured data received straightly from the measurement and, respectively, for modified data. Modification of the raw measured data is presented as the raw data with rotational actions to improve the validity of the methods proposed. As was mentioned previously, presented methods can be especially valuable for surfaces with a directional performance. Therefore, proposed studies were performed for cylinder liners after the plateau-honing process, plateau-honed cylinder liners with additionally burnished dimples (oil pockets), turned, ground, milled or laser-textured with various angles (60 or 120 in particular).

3.1. Analysis of Raw Measured Data with Proposed Directional Technique

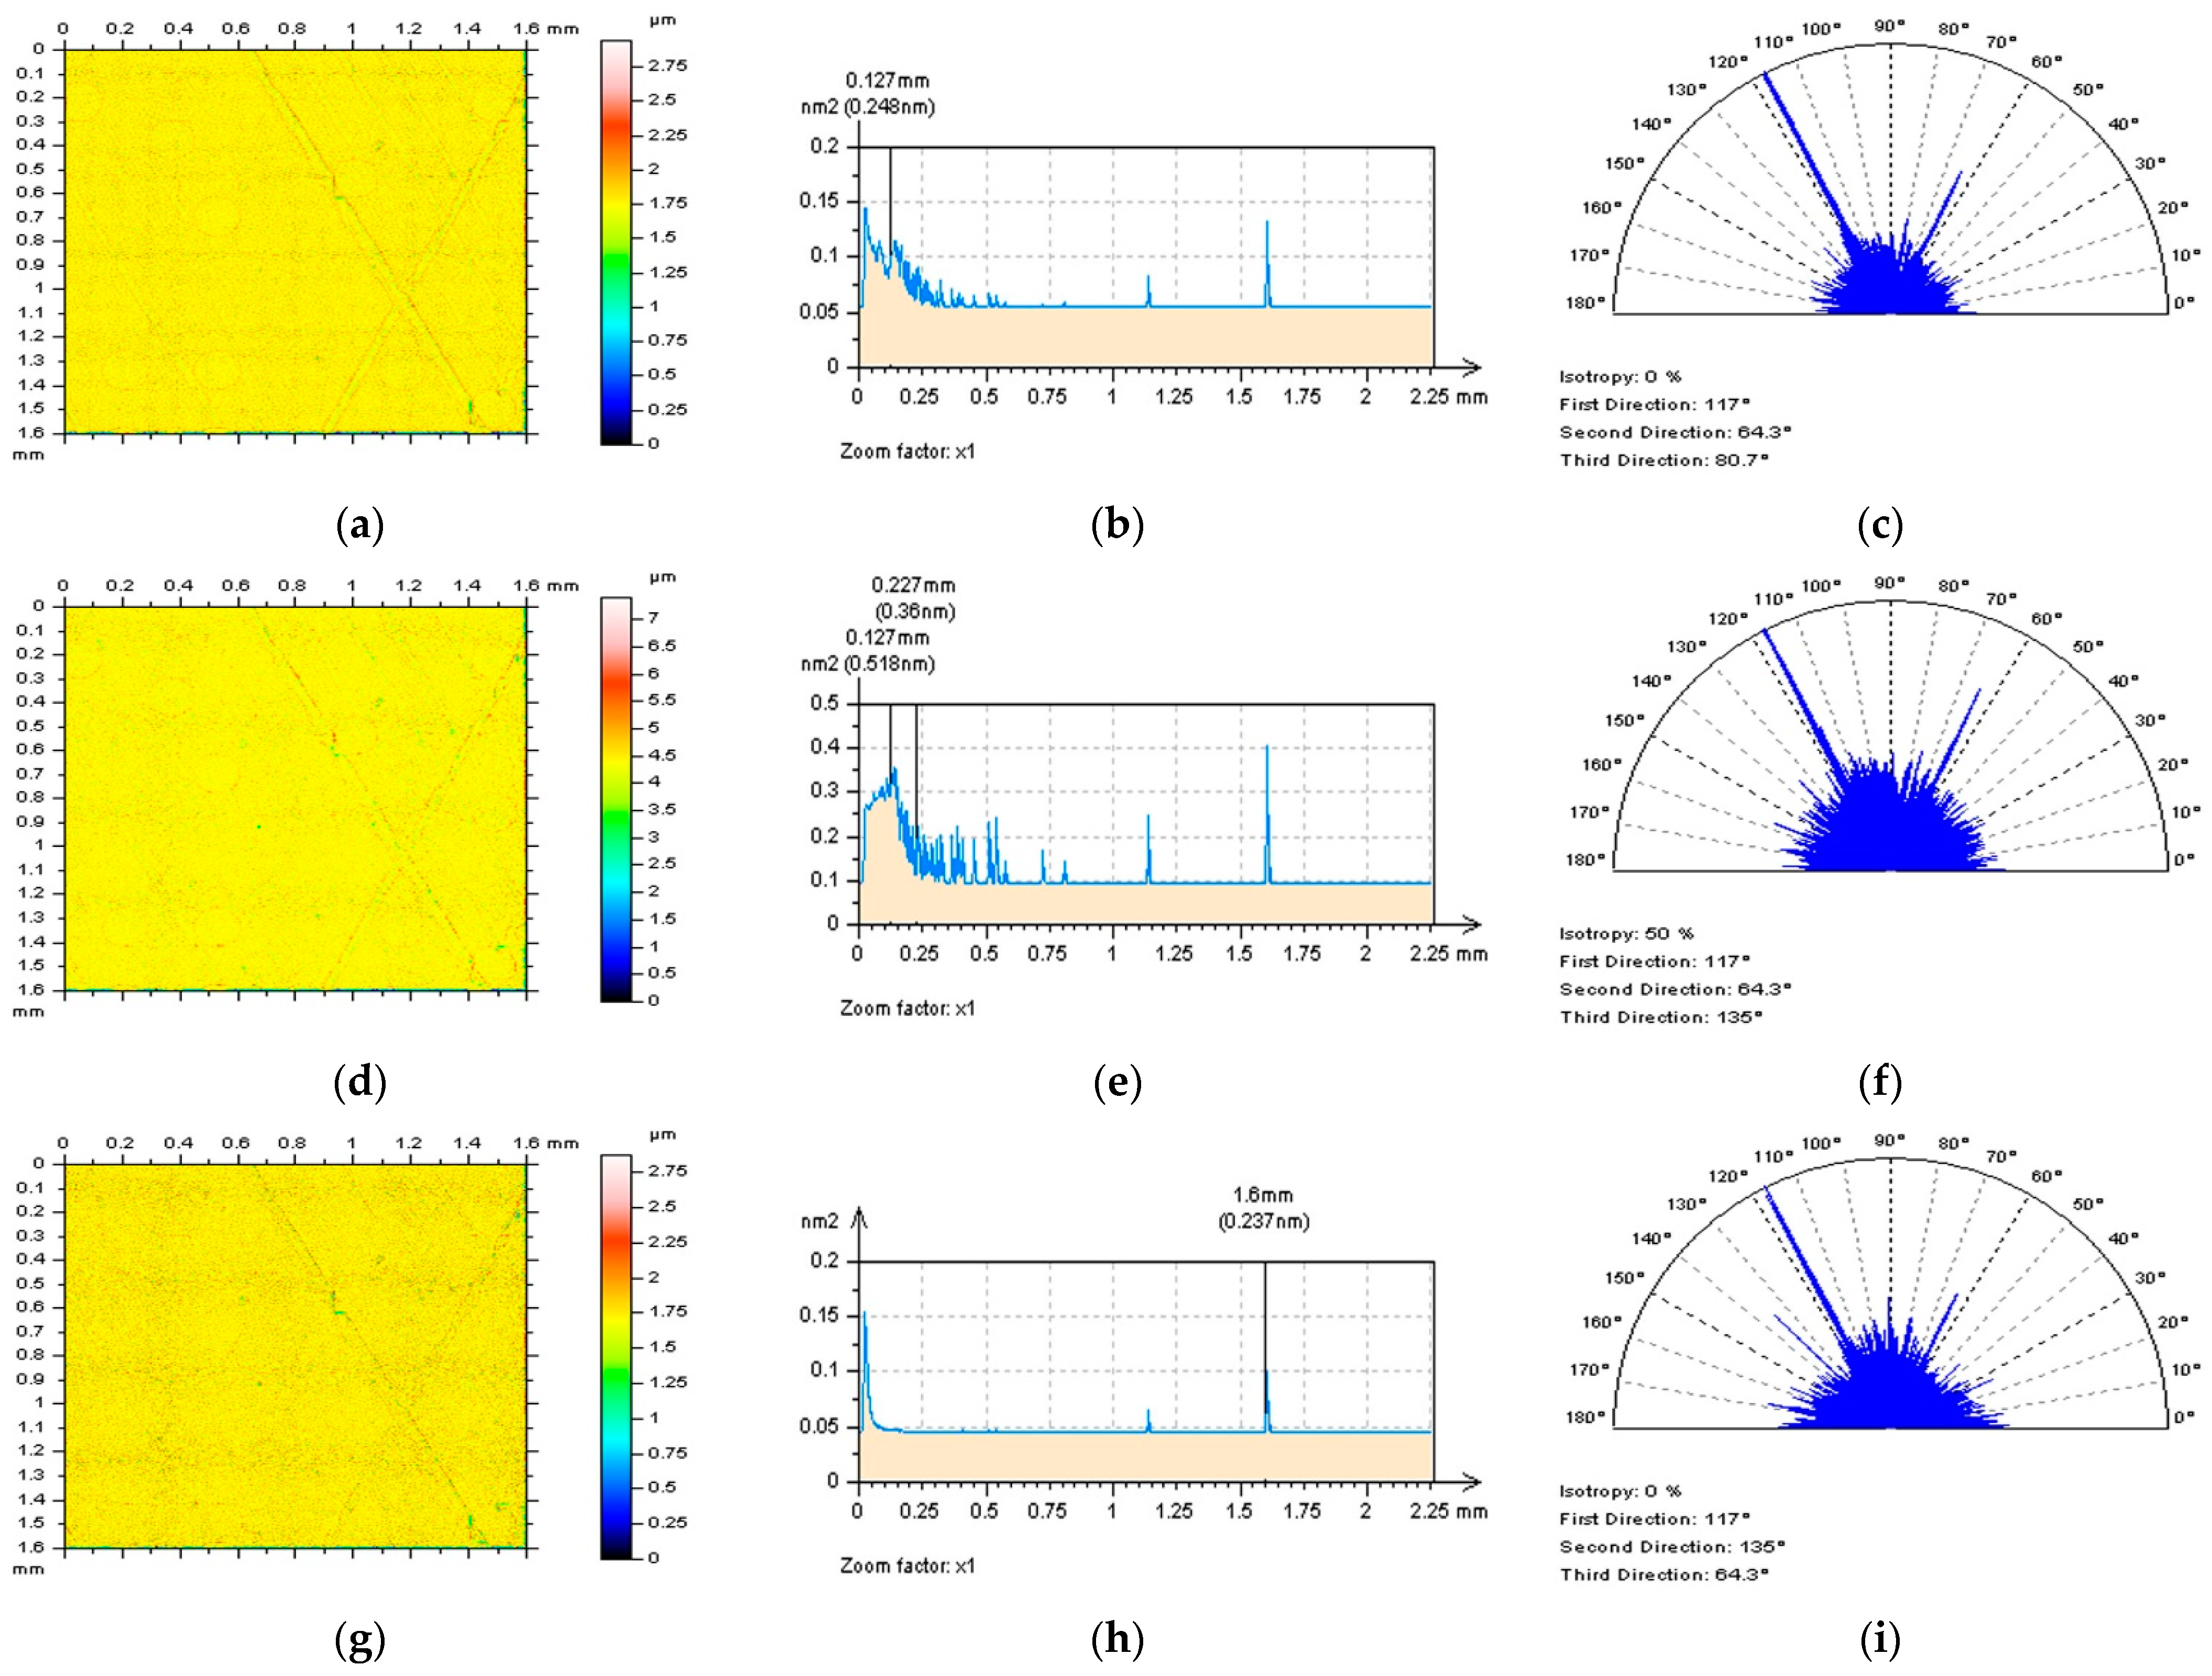
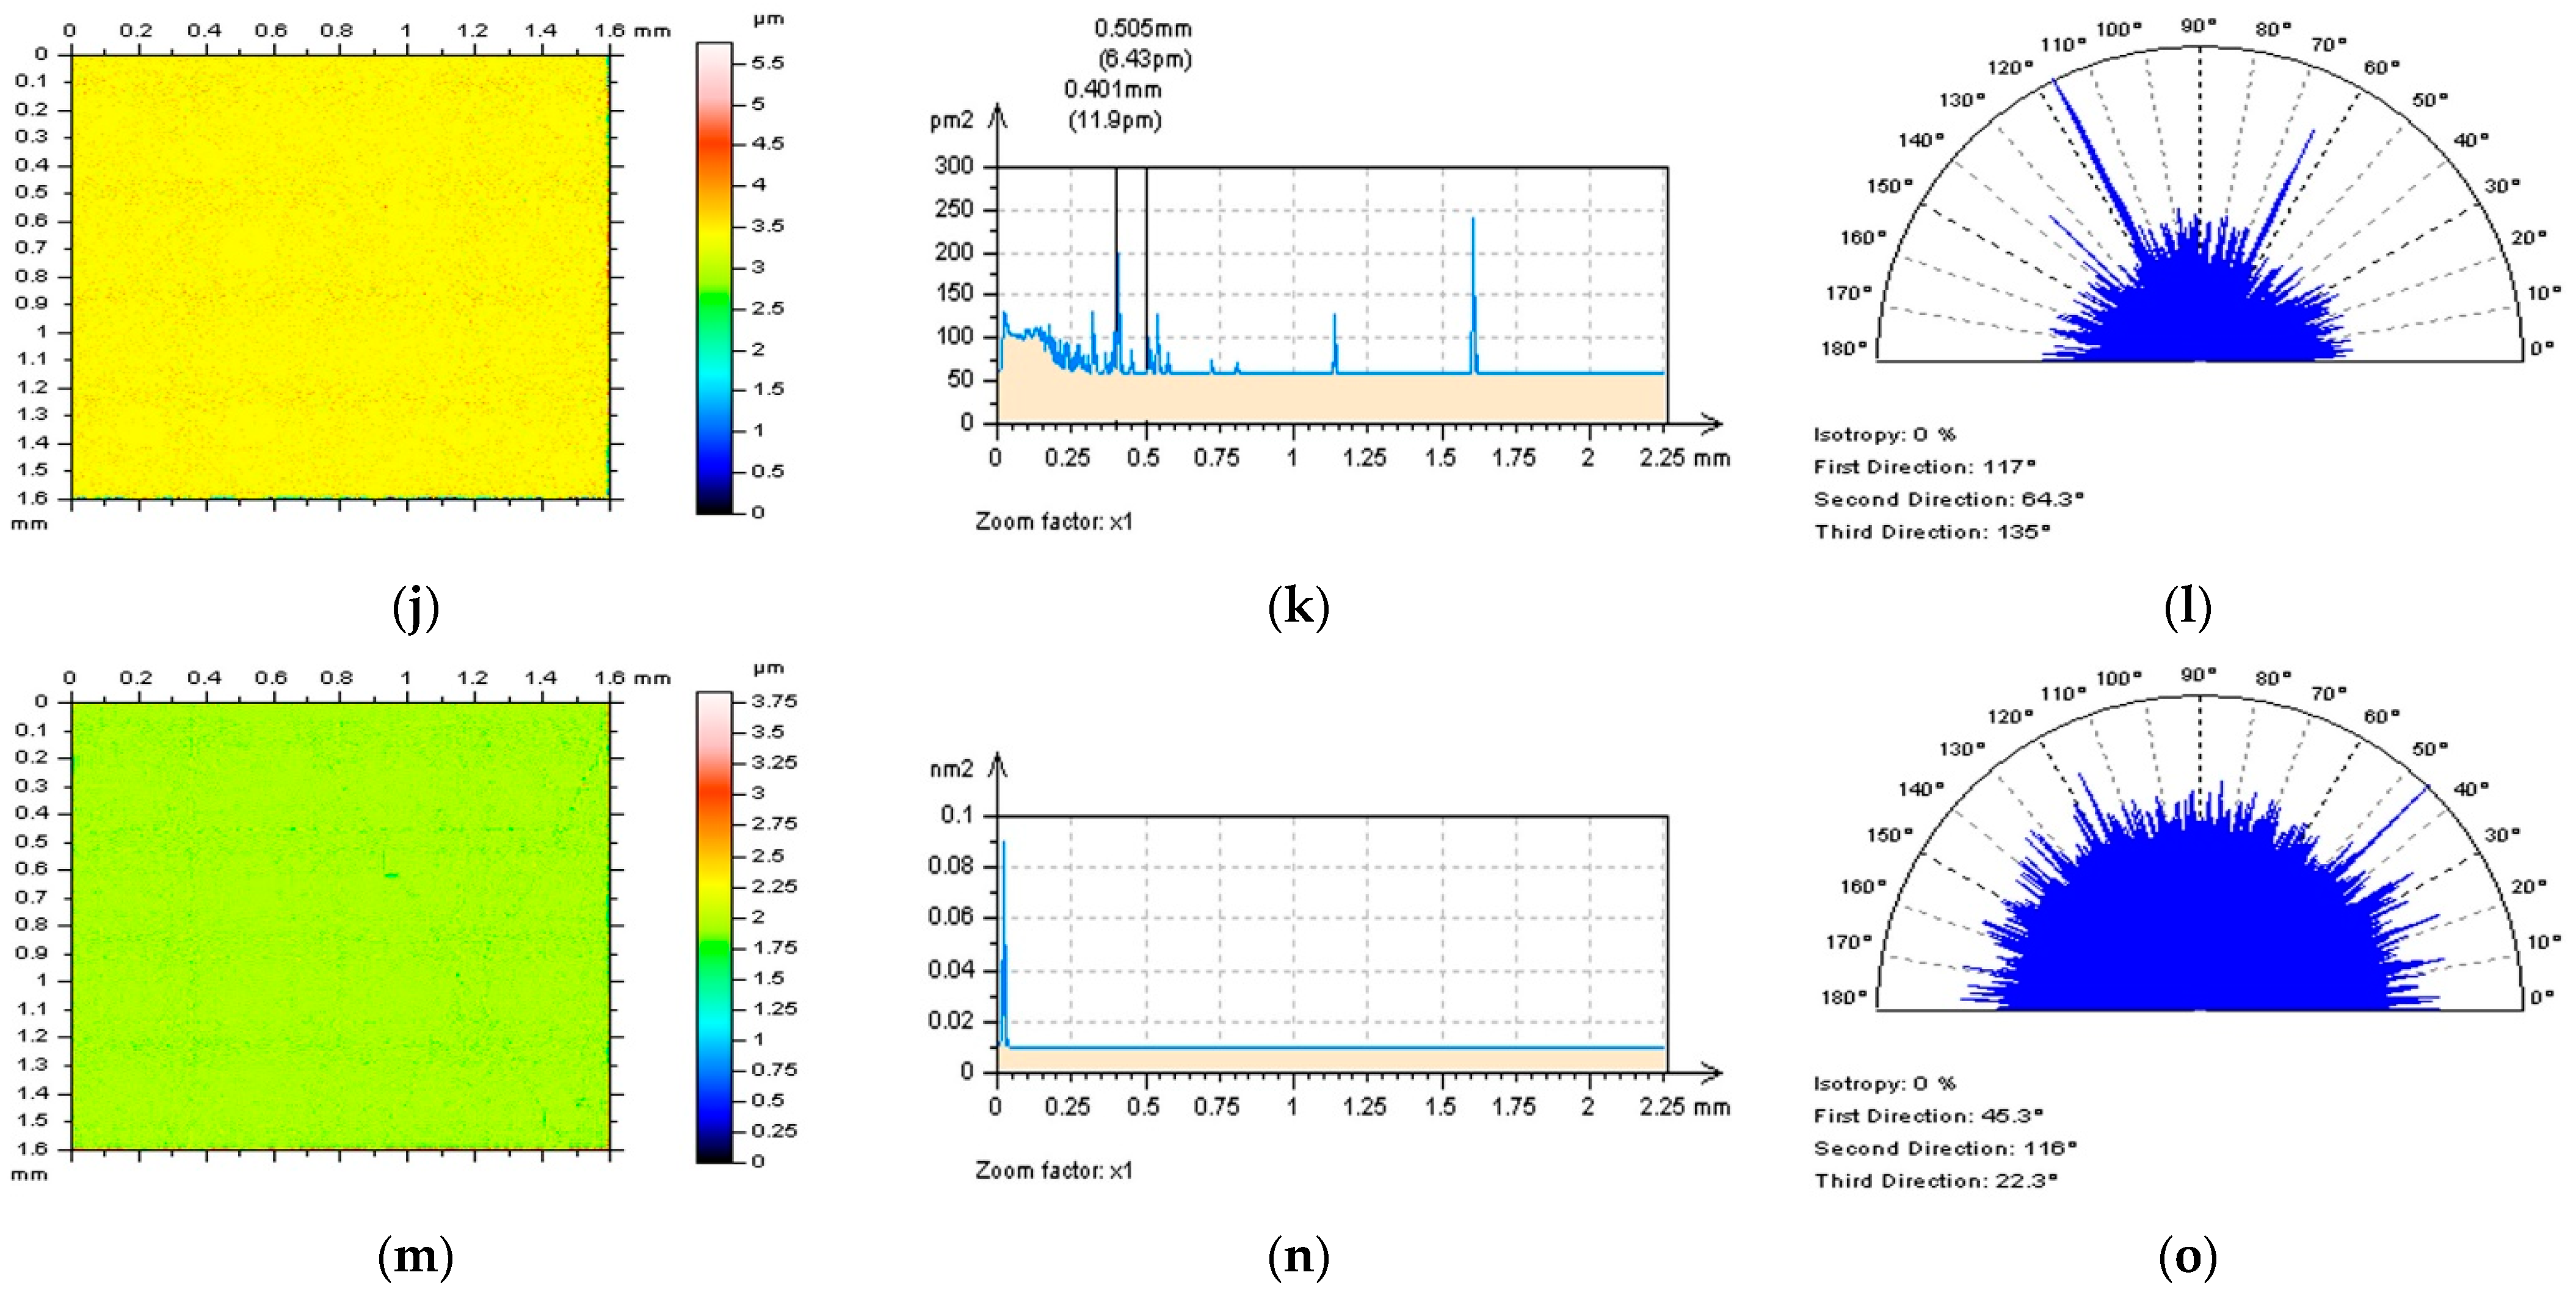
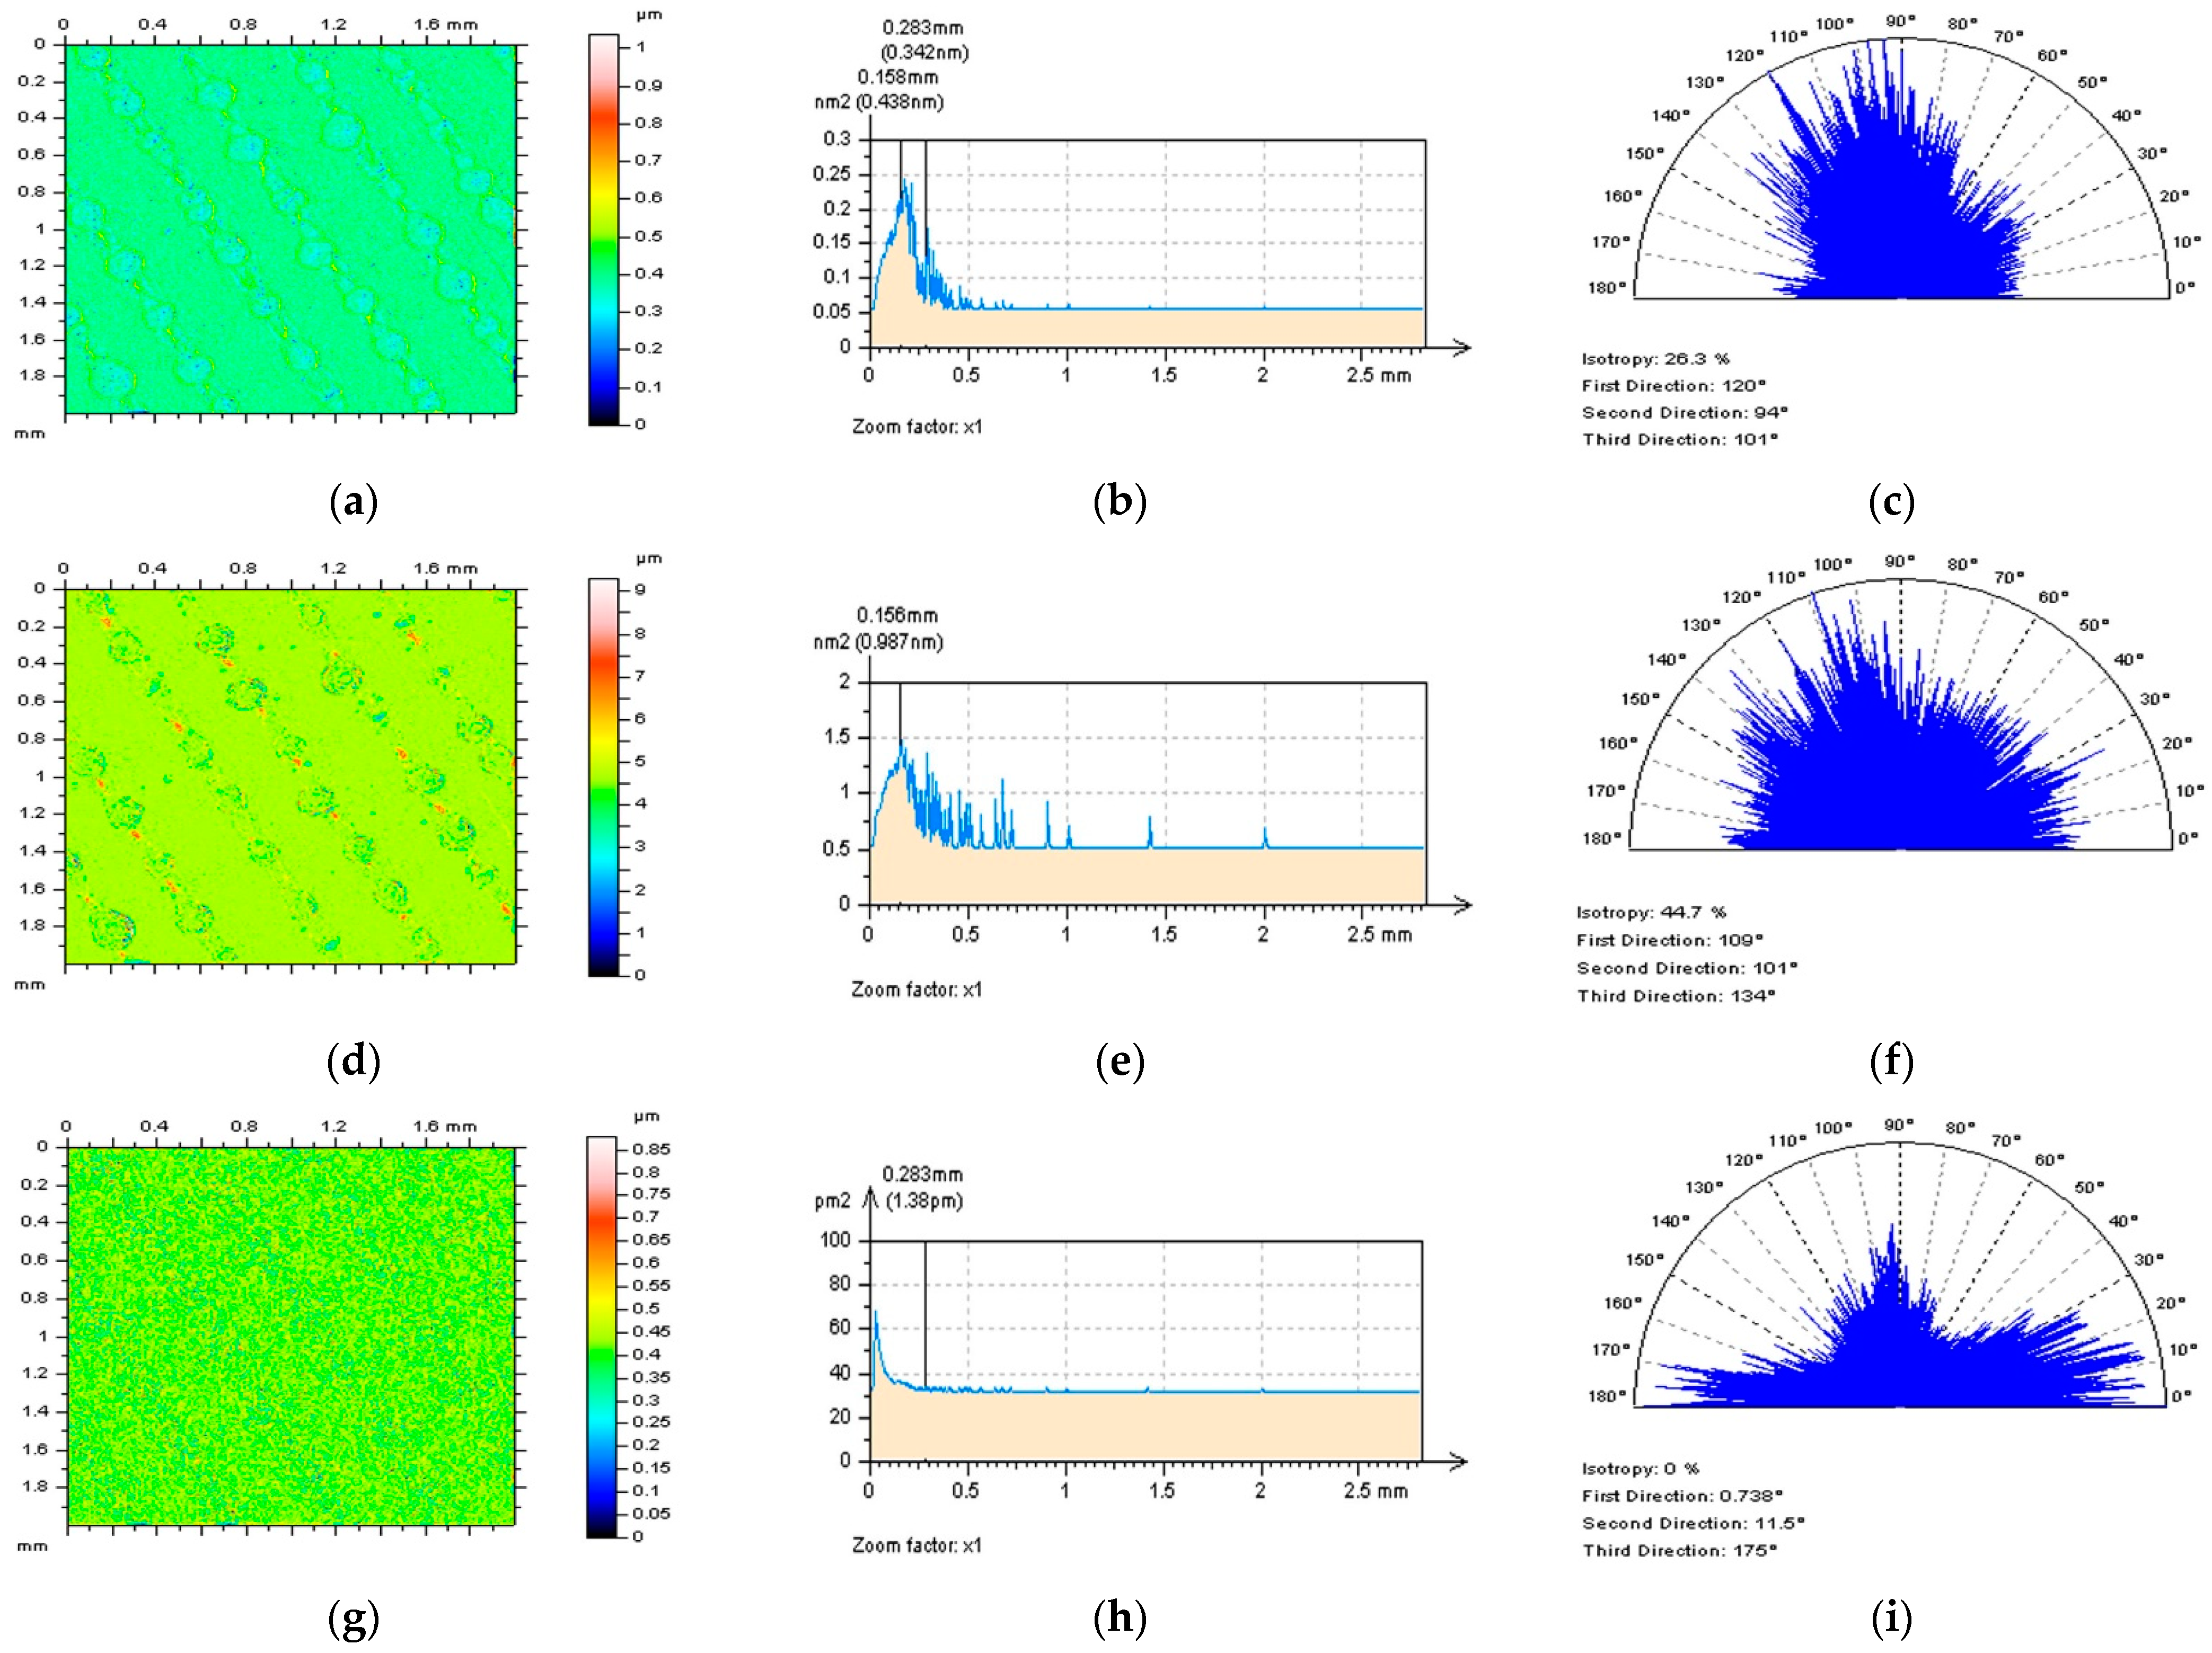
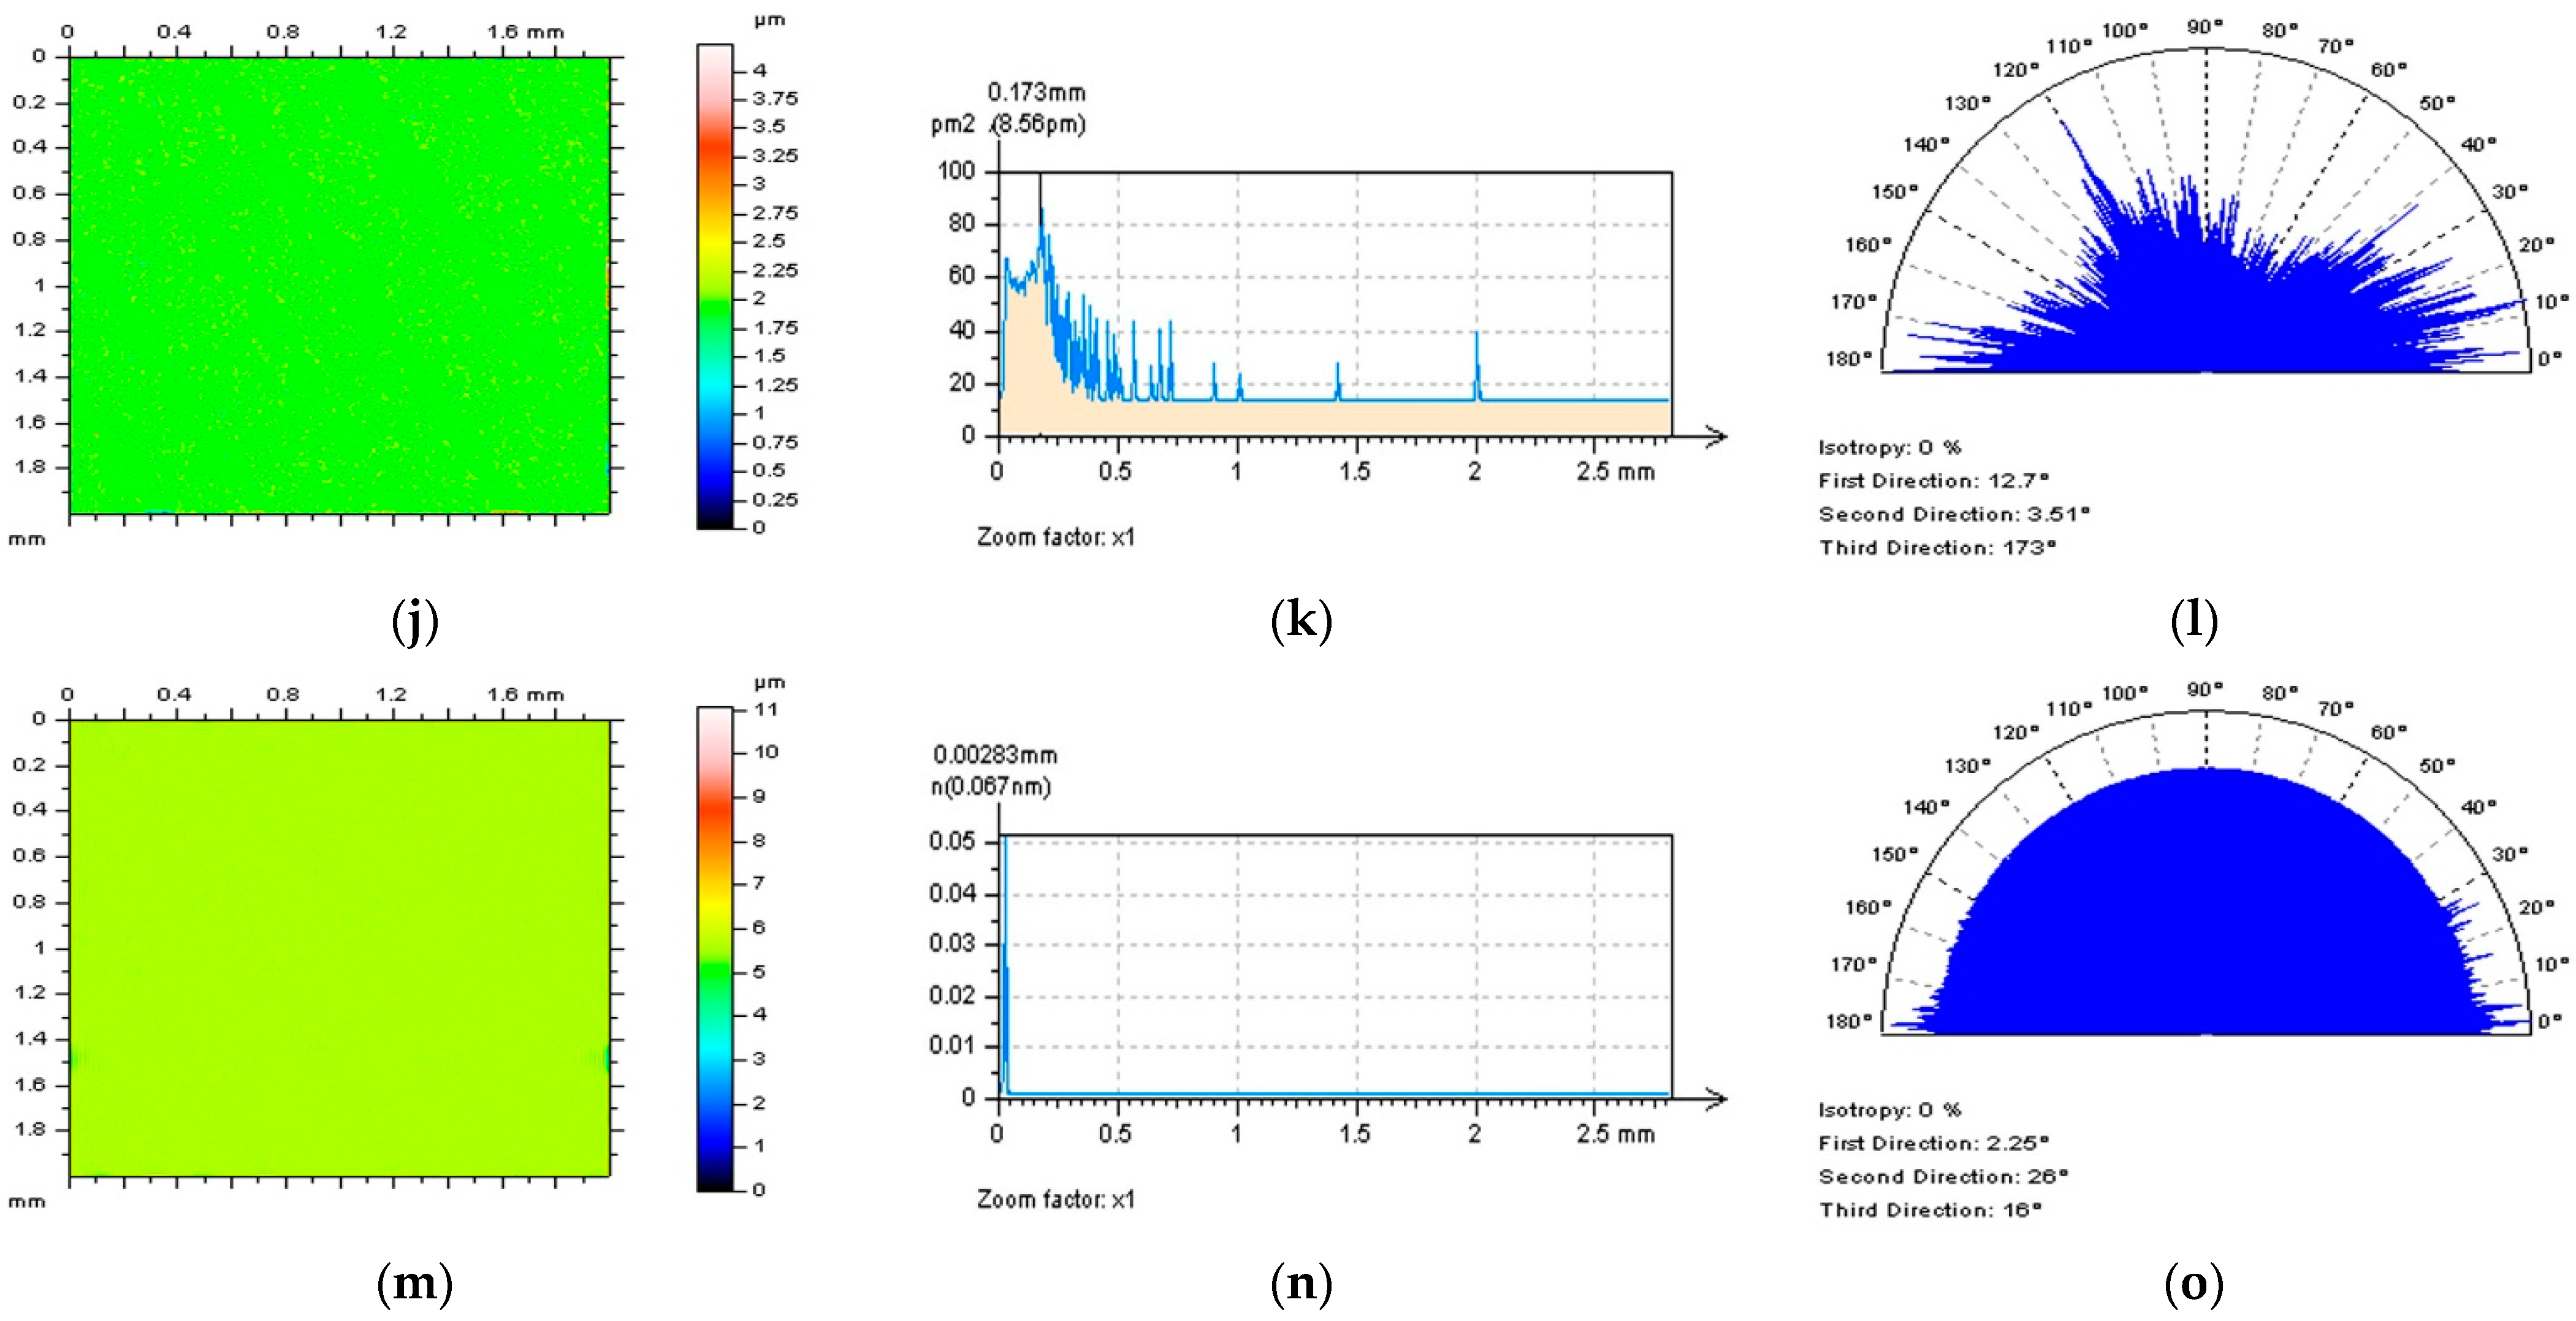
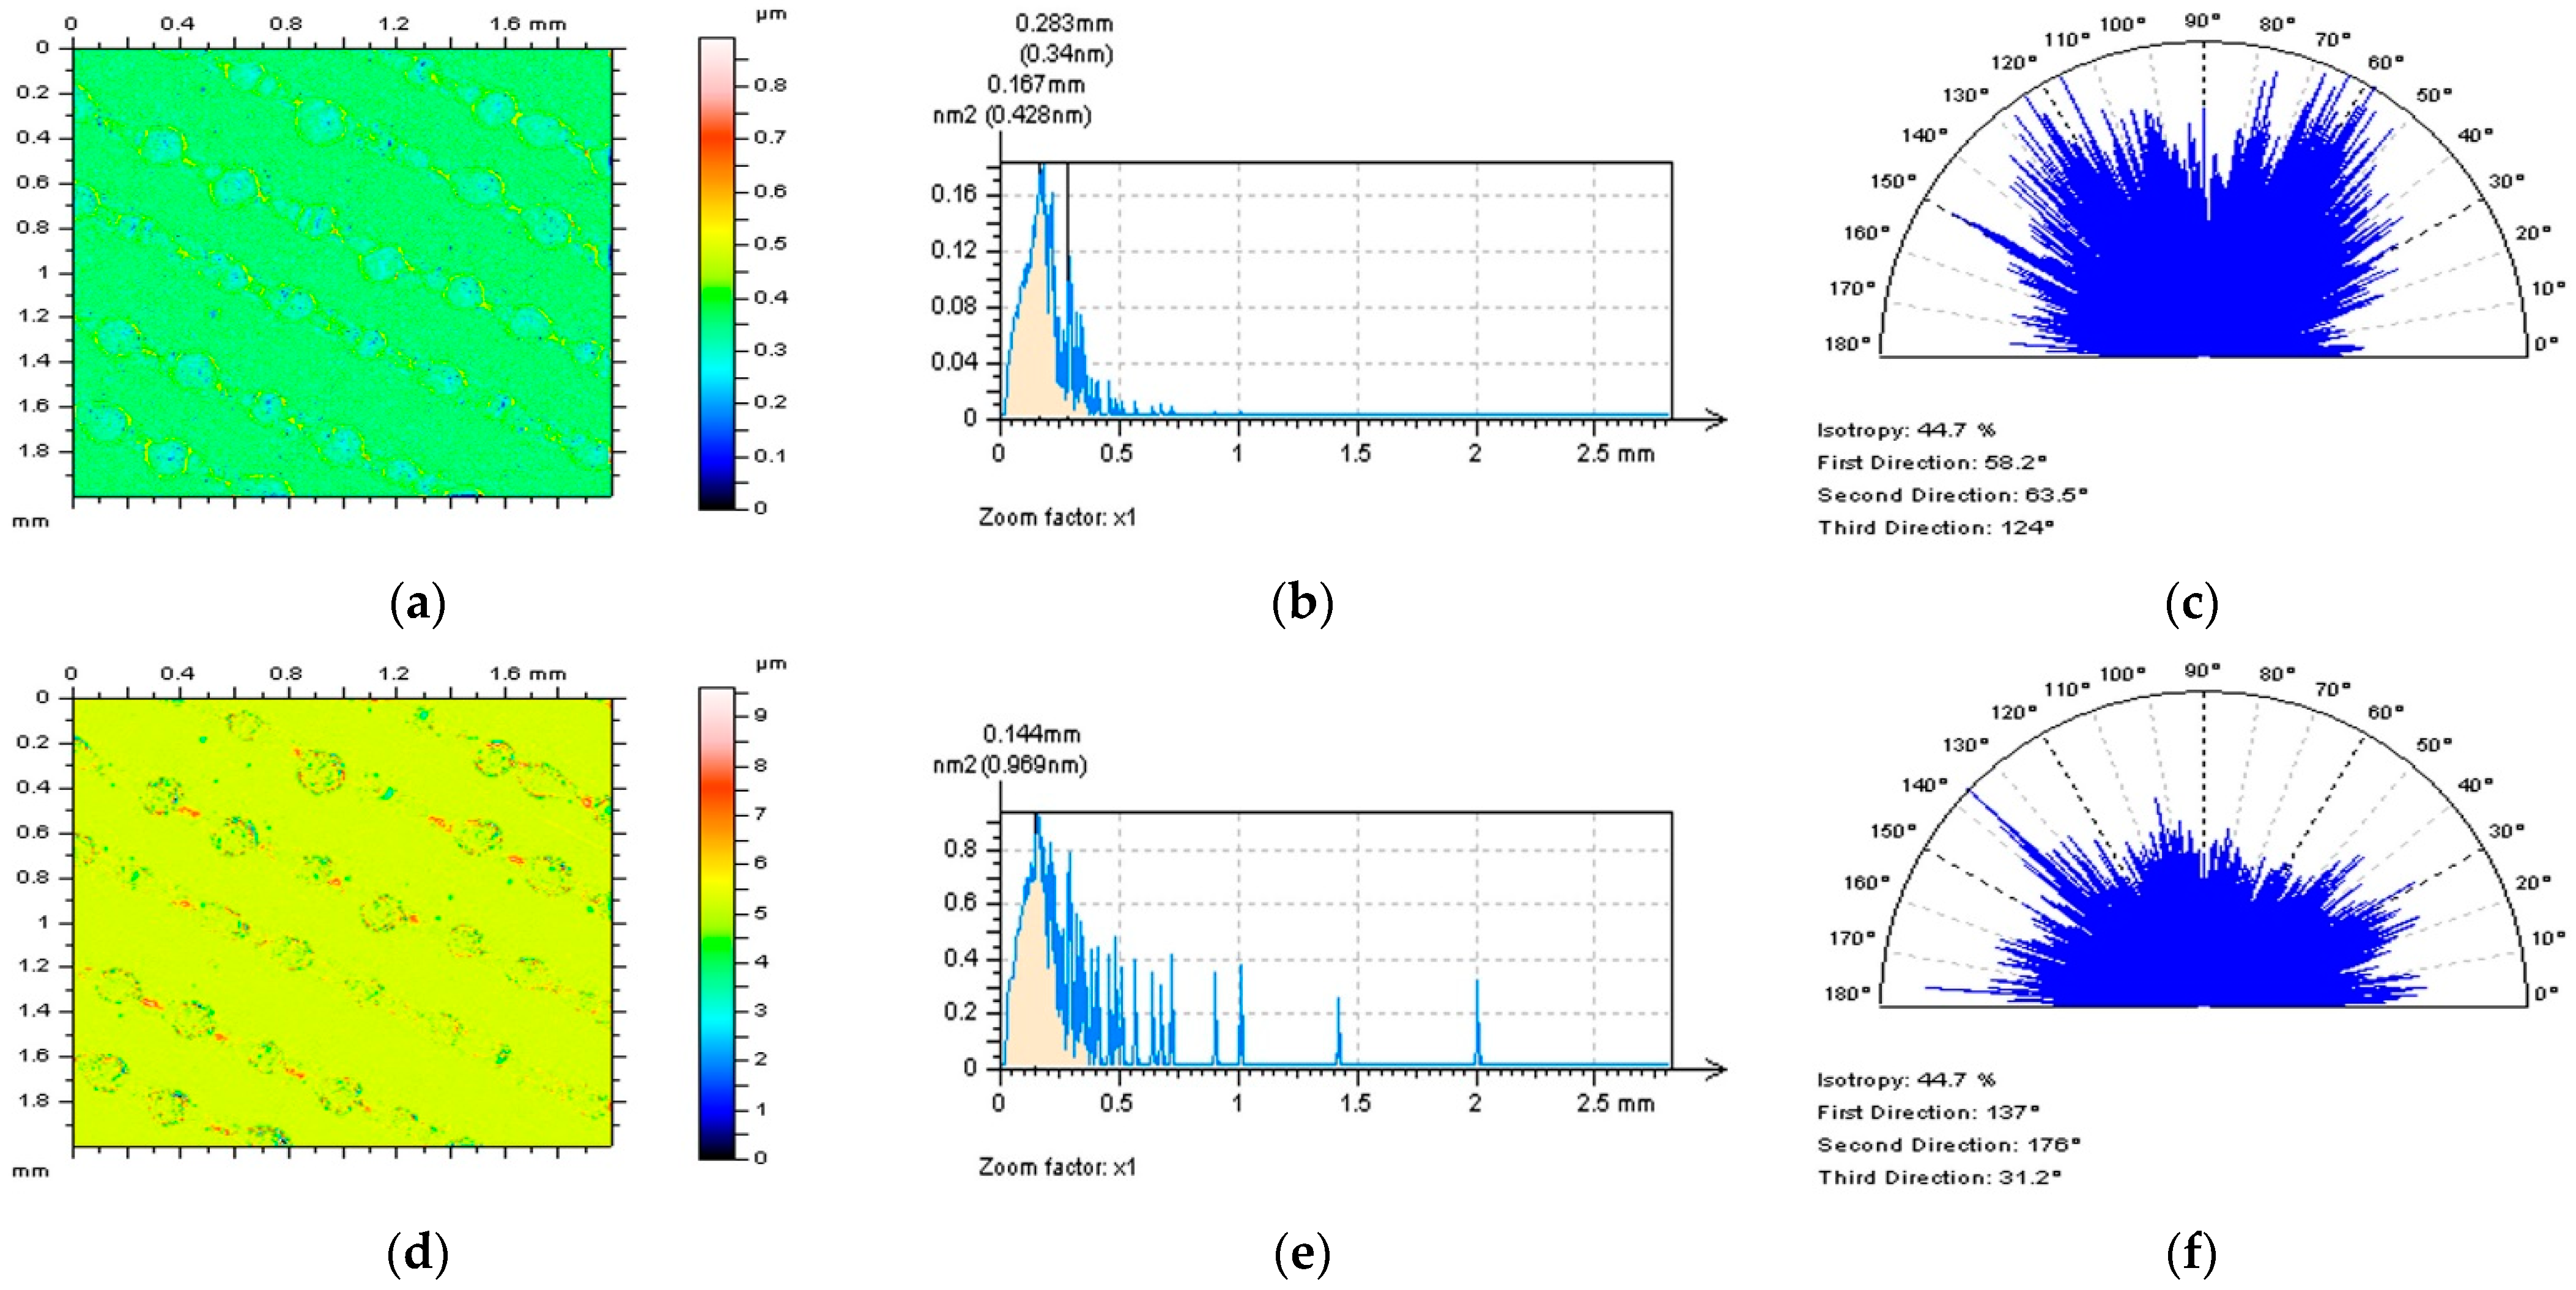
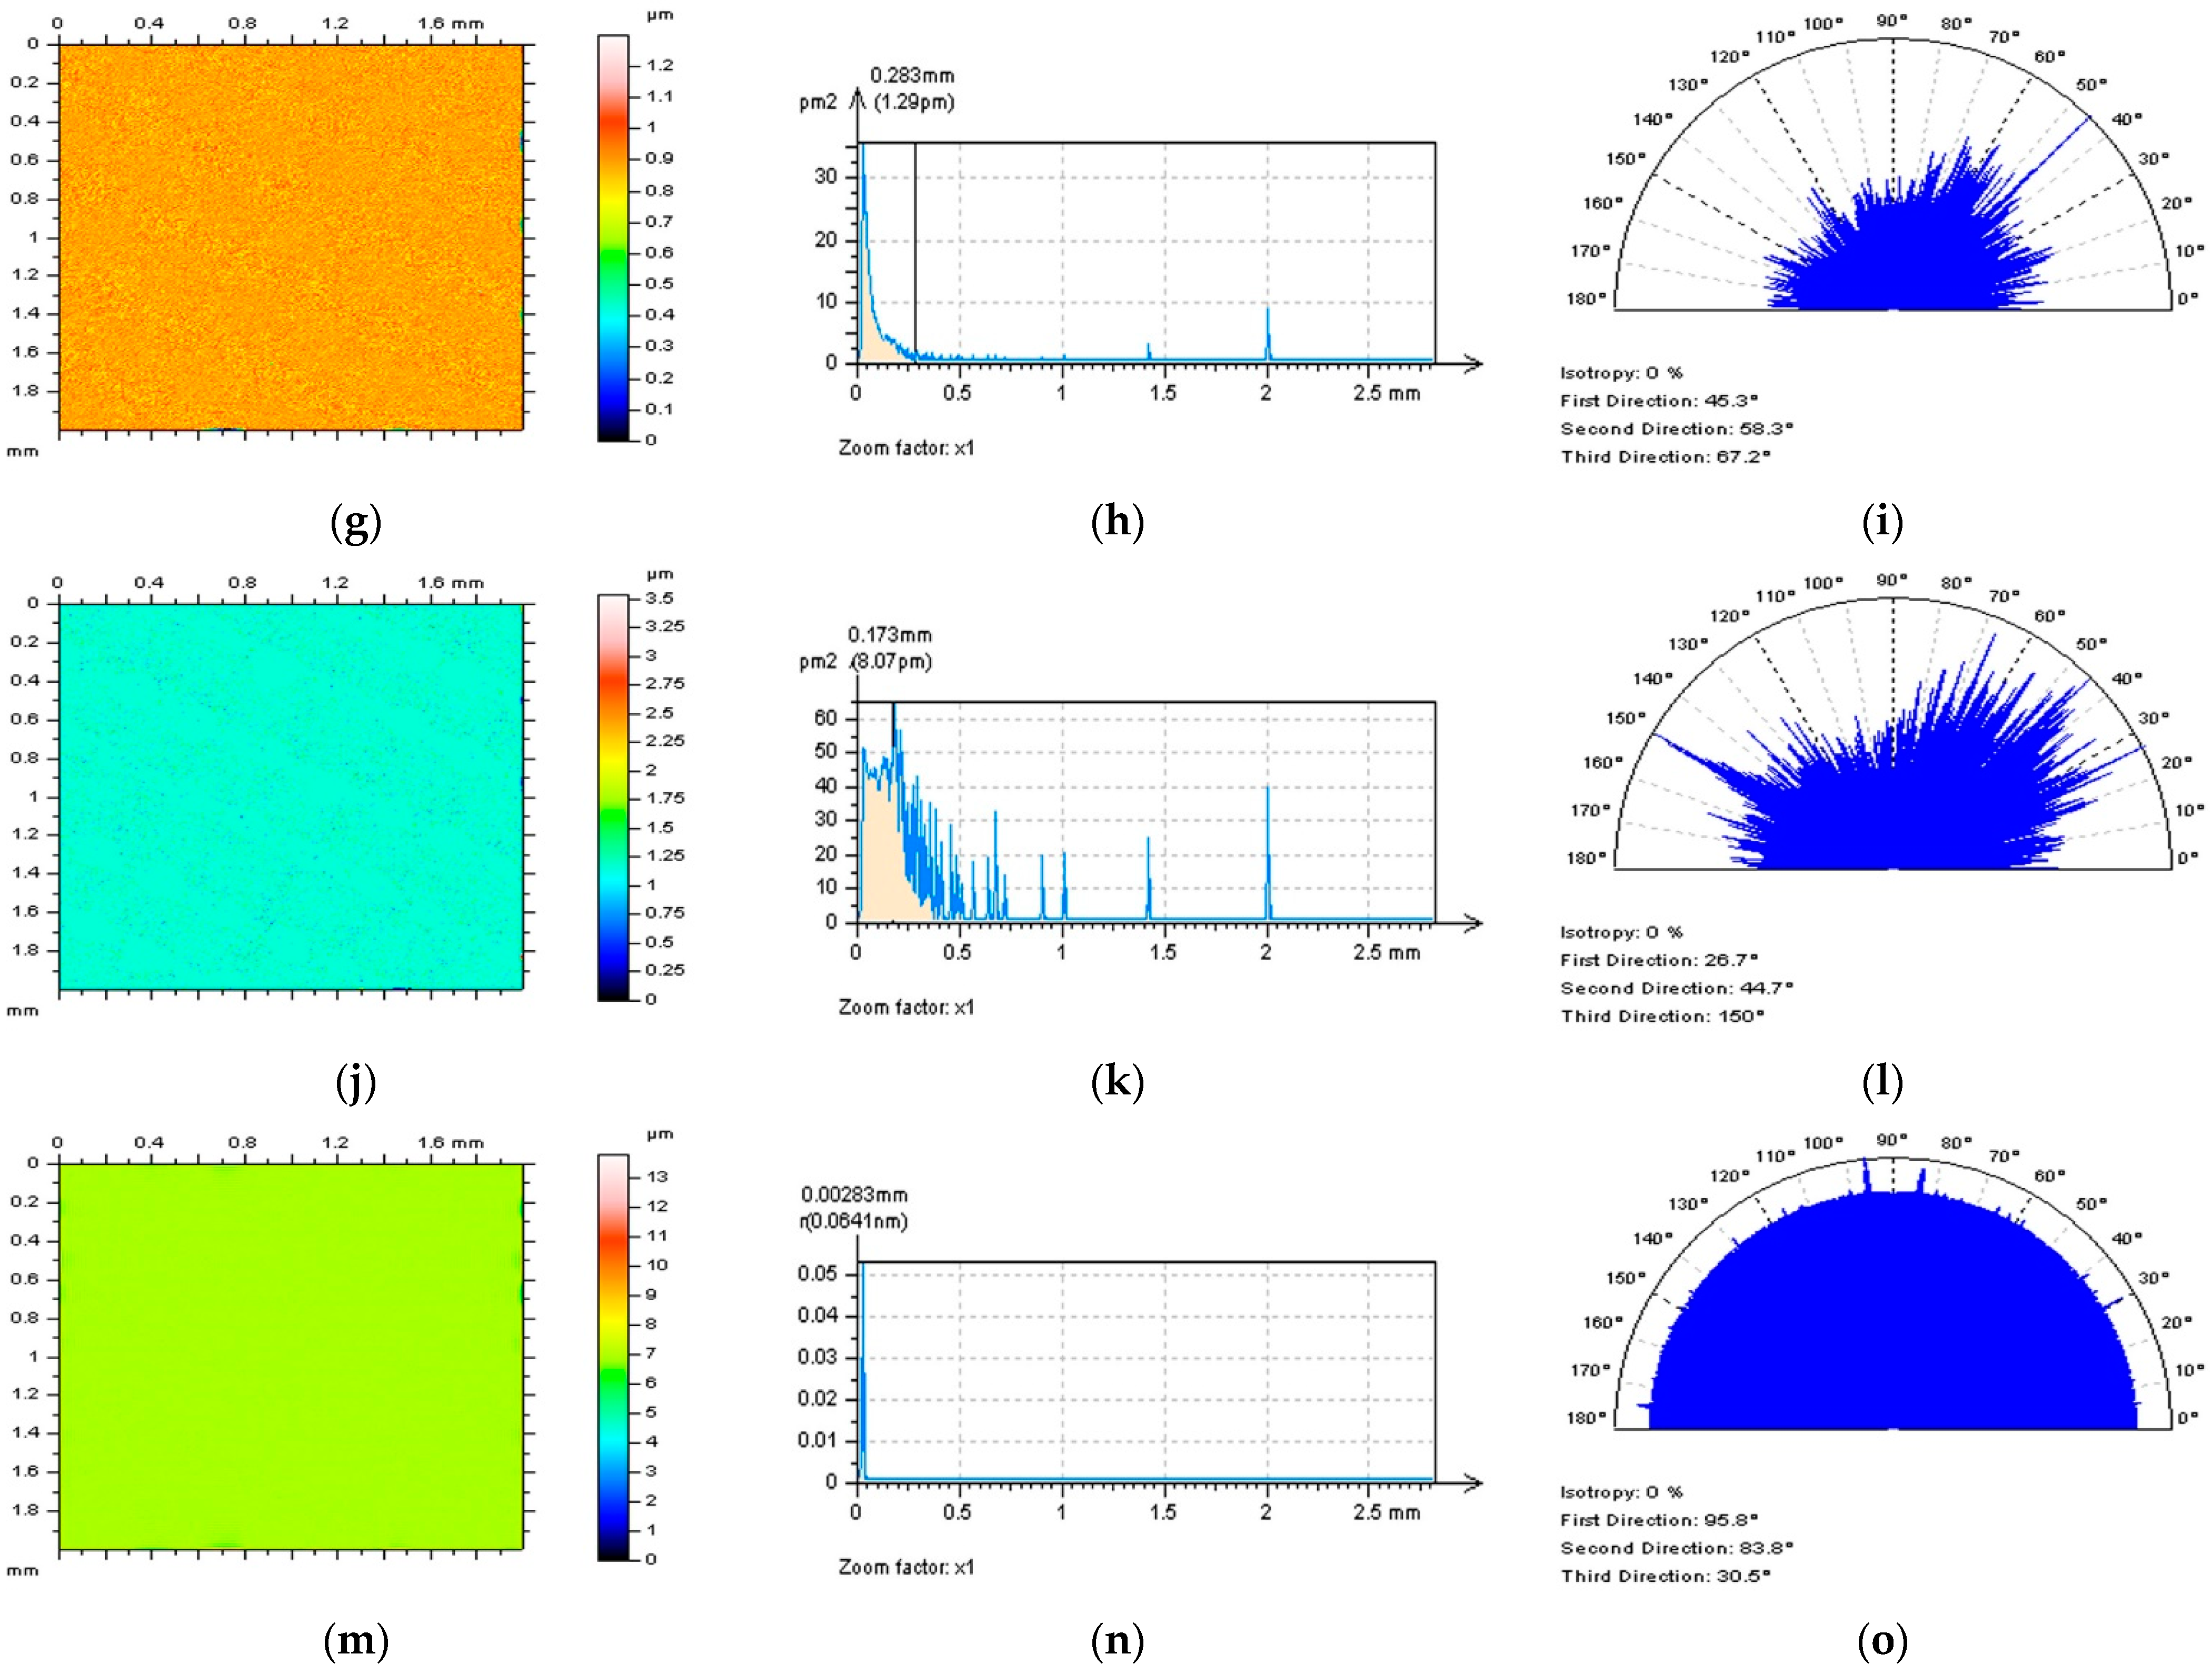
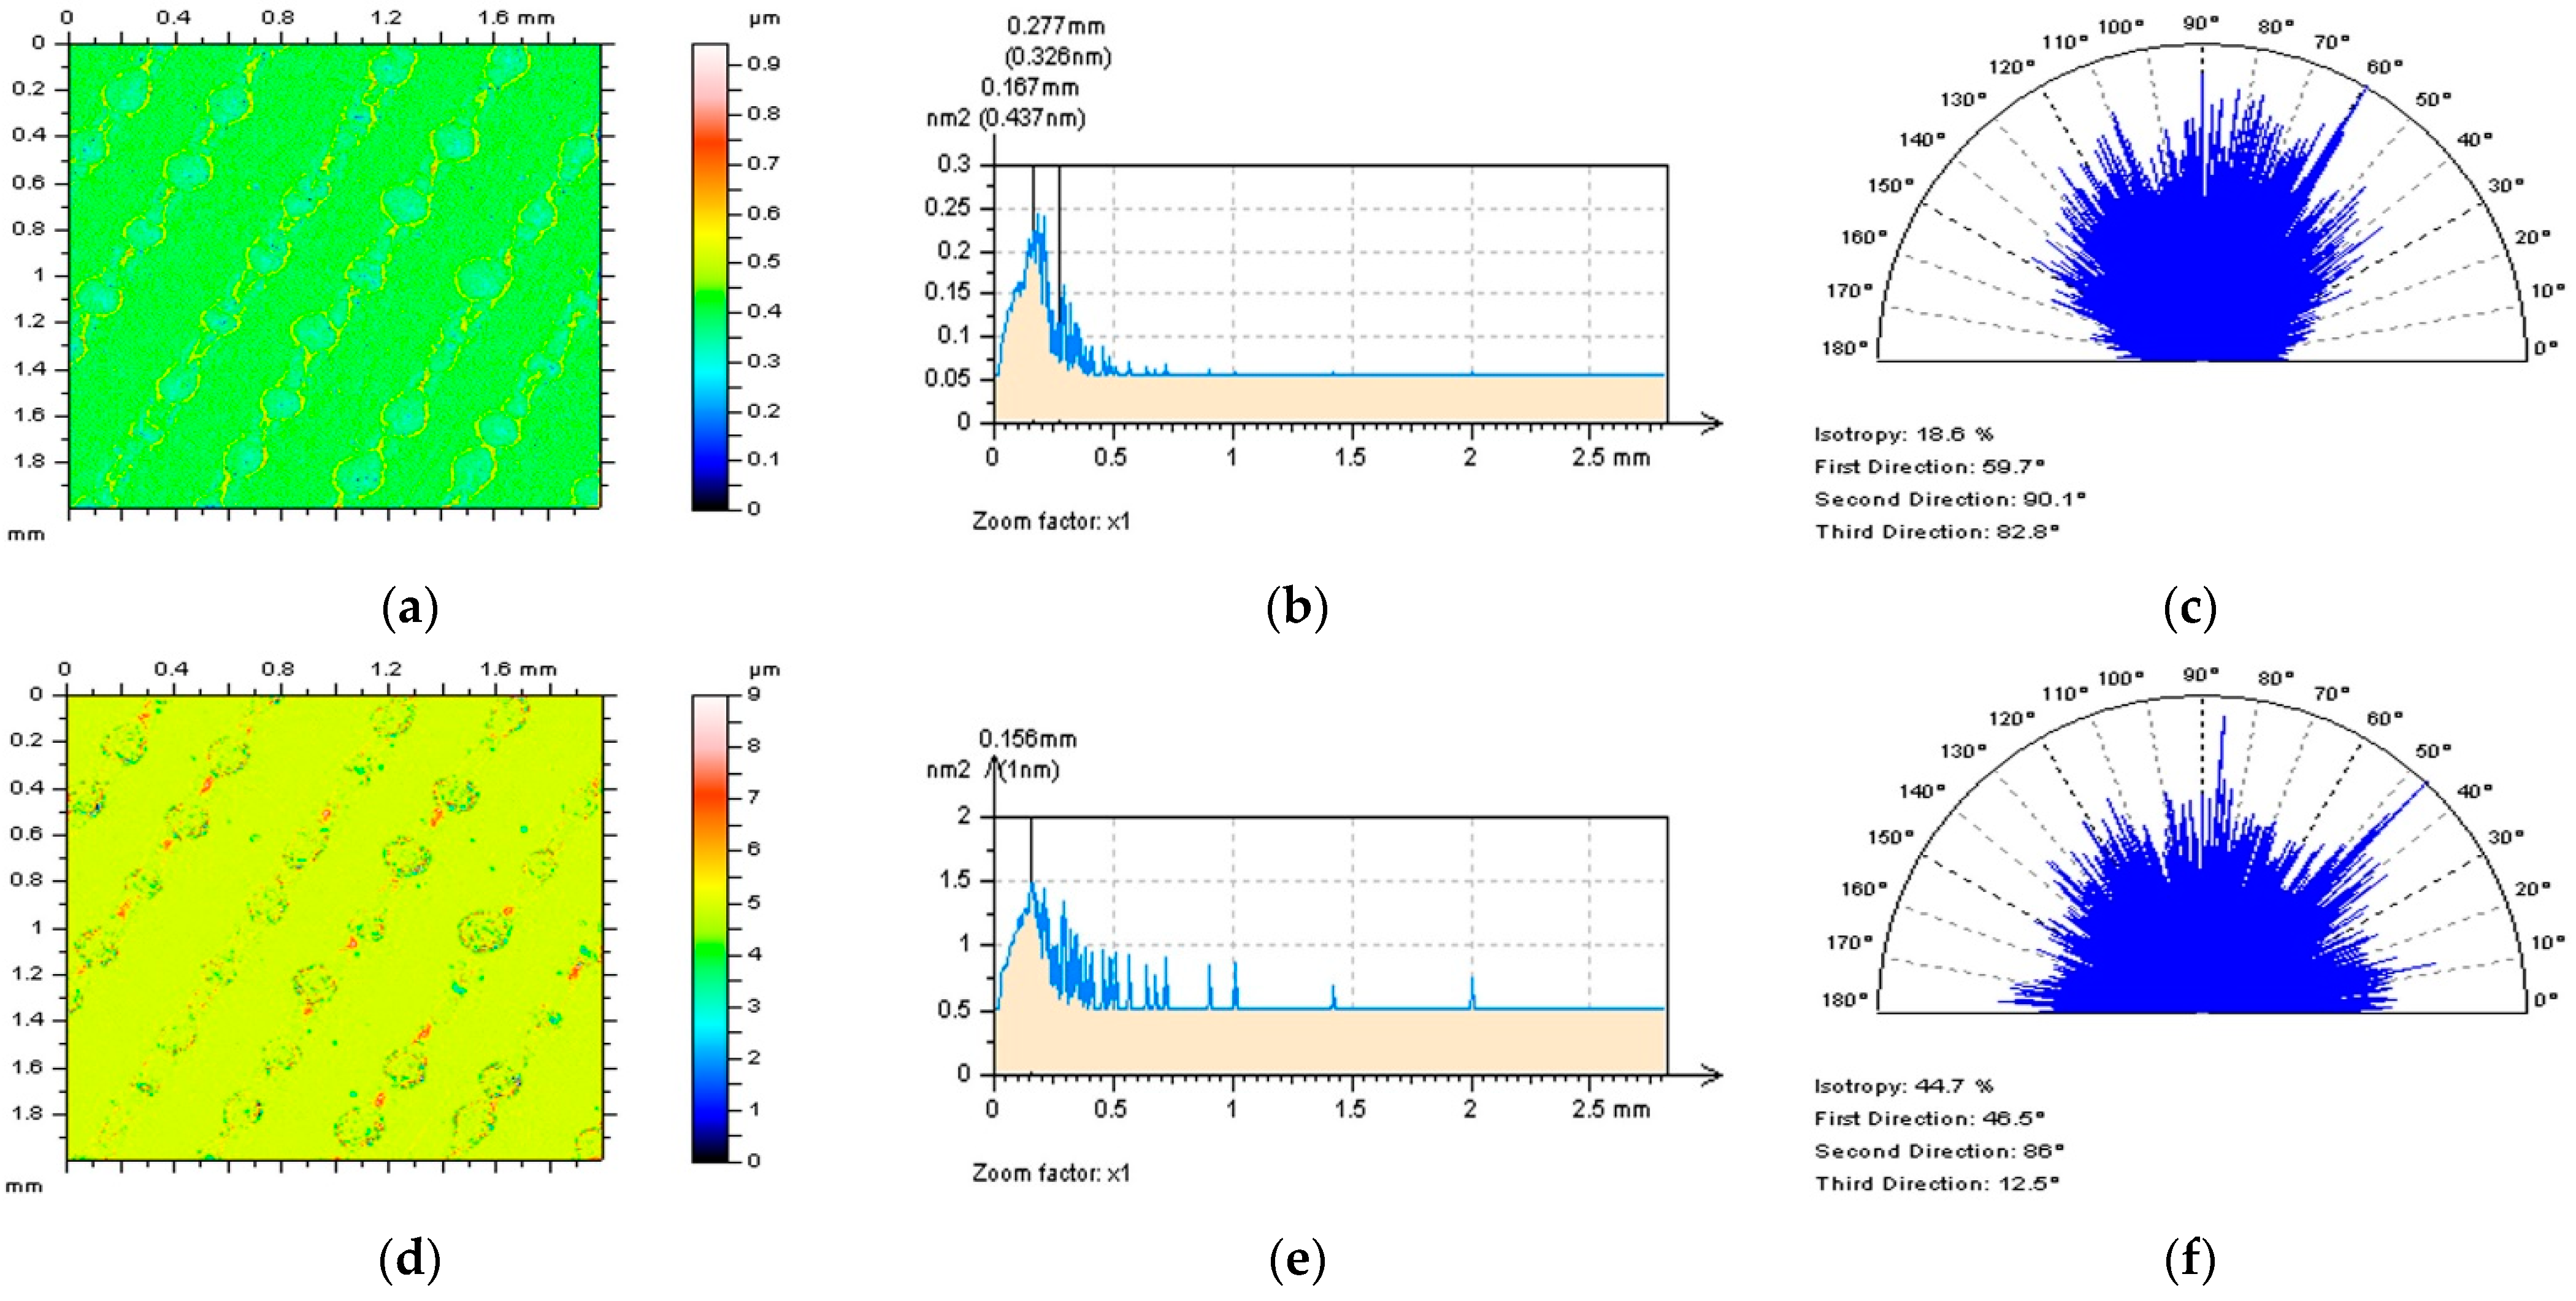
From the performed analysis it was found that PSD areal (3D) characterisation could give some responses for selected types of both surfaces or filtering methods, like GF (Figure 6b and Figure 7b), SF (Figure 6h and Figure 7h) and FFTF (Figure 6n and Figure 7n) for turned or plateau honed cylinder liner with additionally burnished oil pockets surfaces or, respectively, SF (Figure 8h) and FFTF (Figure 8n) for laser-textured topographies. However, when GF or SF was used for the definition of the HFNS from the results of plateau-honed cylinder liner topographies (Figure 7a,d) there were features visible on the isometric views so, simultaneously, those techniques may be not suitable that removing pattern other than the noise in required (high) frequencies. Similar to the above, the application of the RGF technique caused a separation of treatment trace features from the surface topography of a plateau-honed cylinder liner with additionally created valleys (Figure 7d) or laser-textured details (Figure 8d).
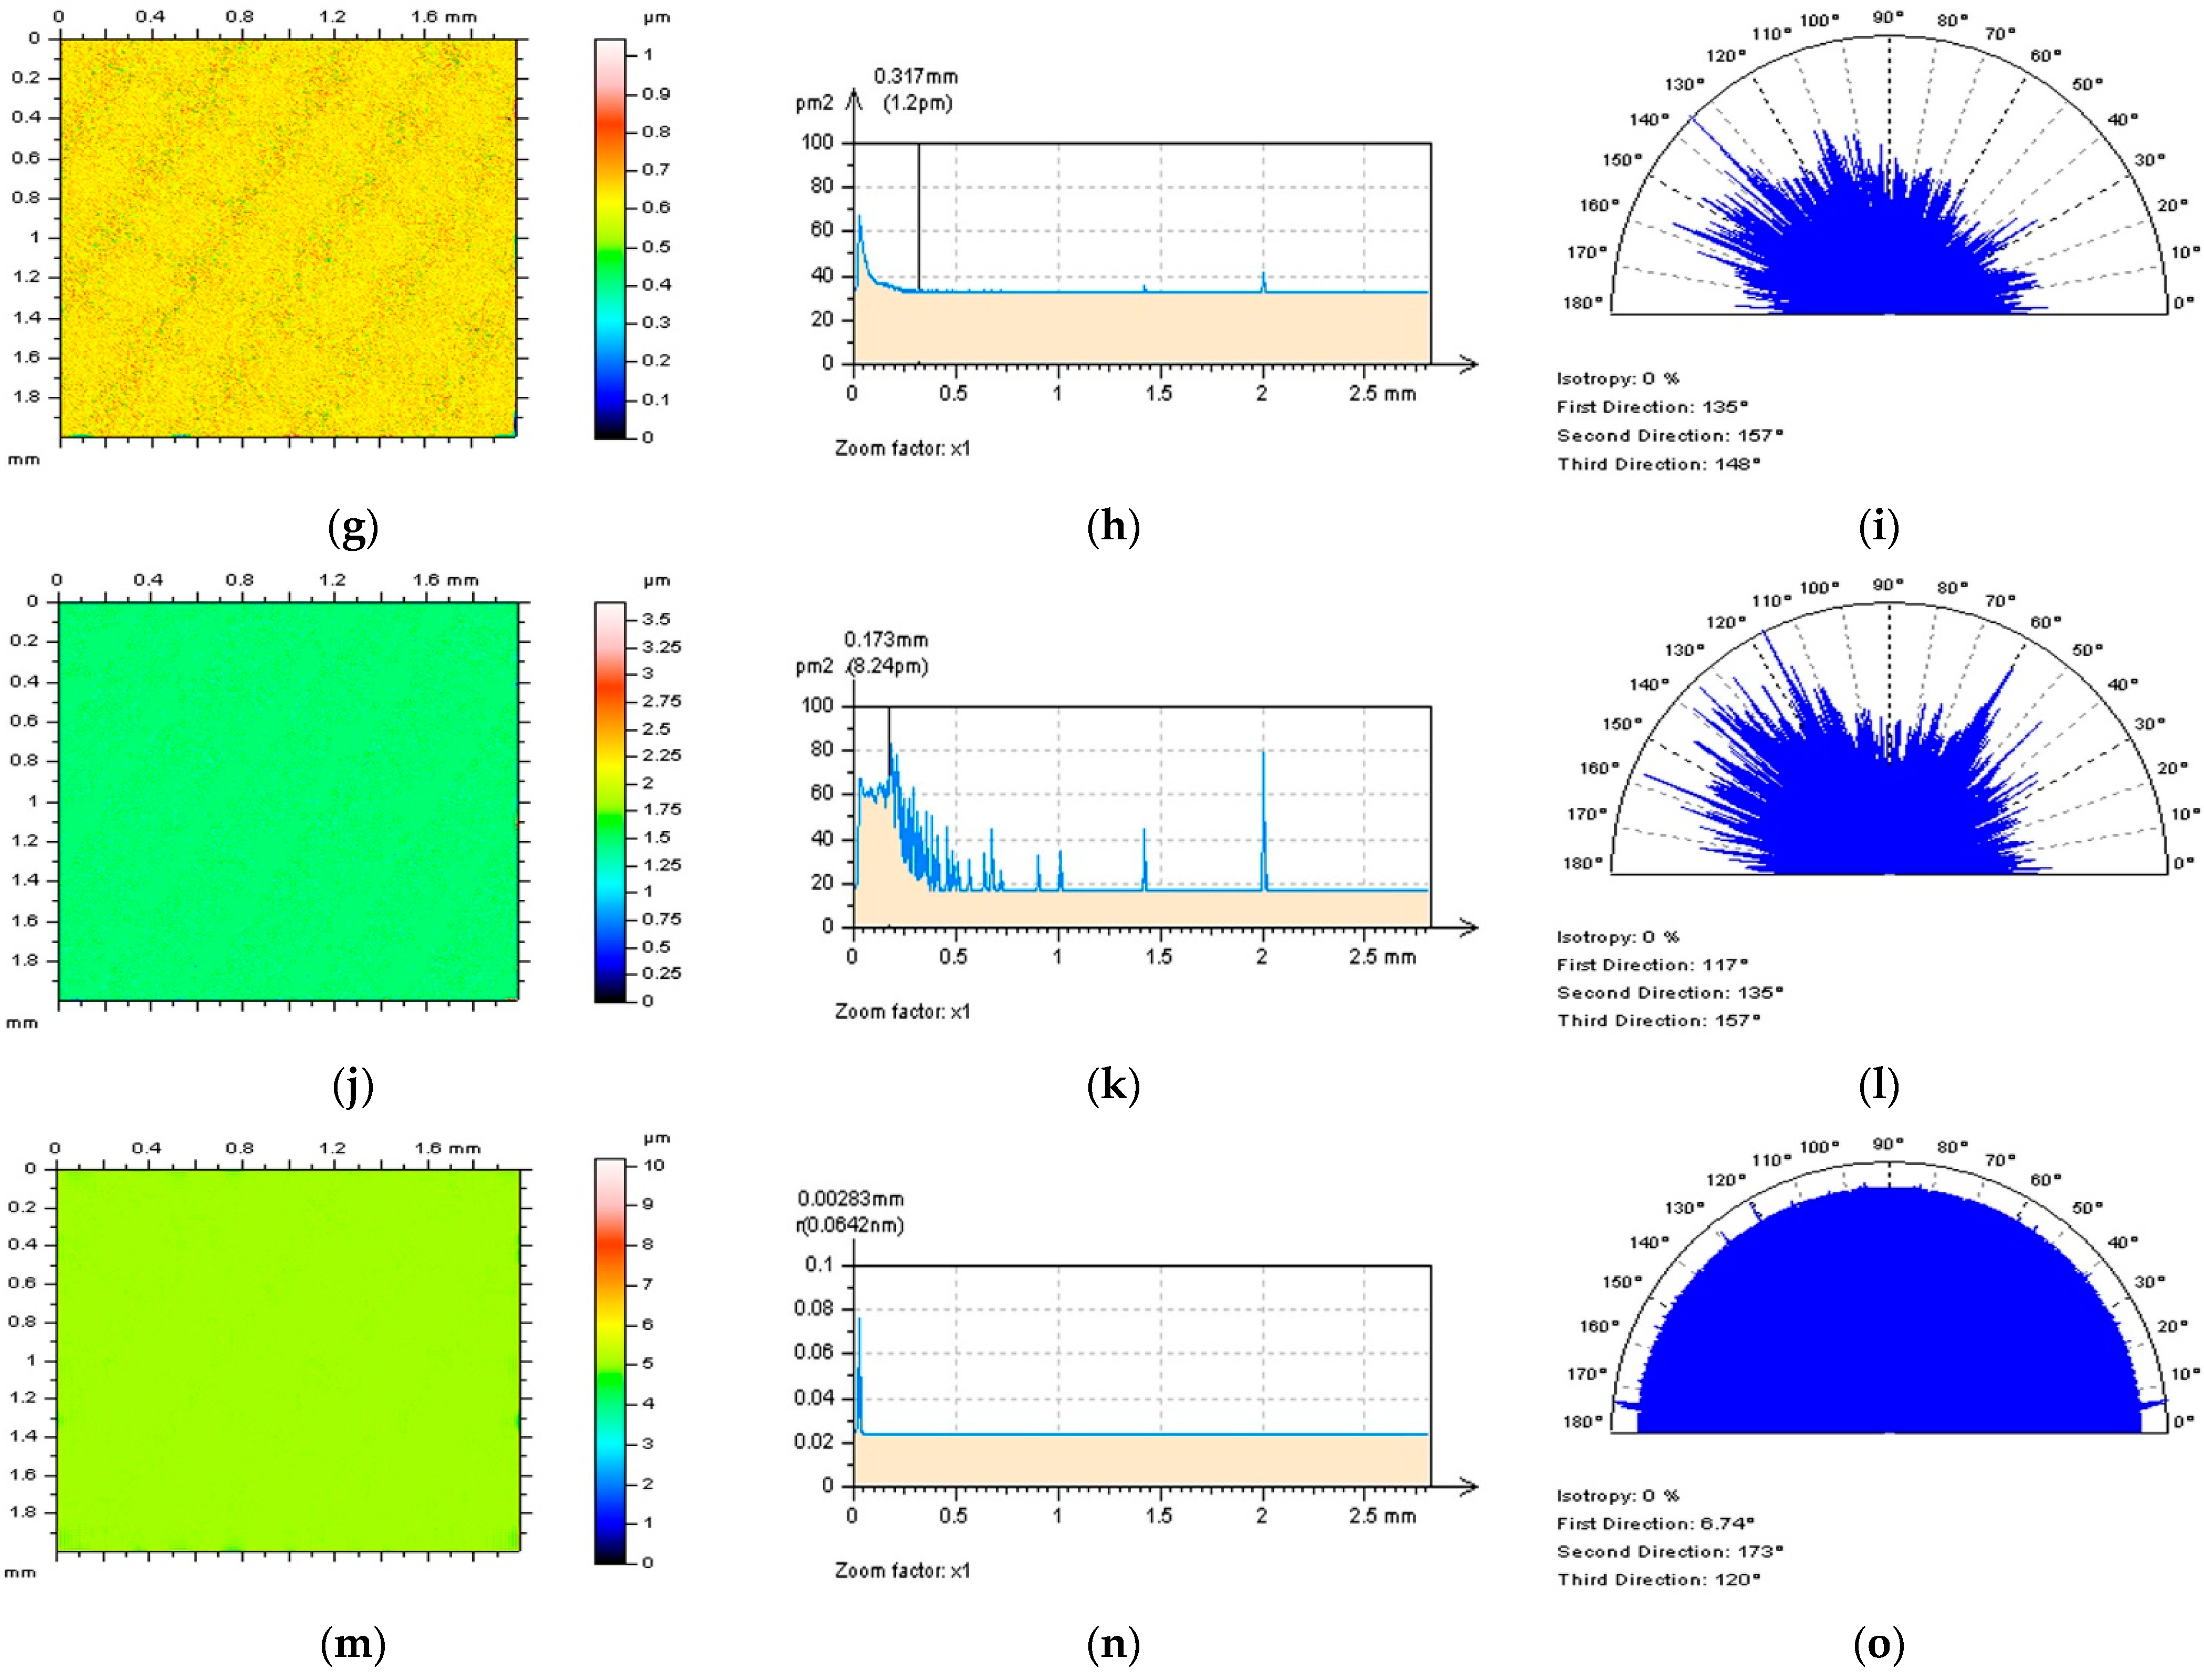
For reduction of the influence of high-frequency measurement errors, the FSBT method with application of the FFTF filtration technique was proposed. From the analysis of the 3D PSD graphs, it was found that the high-frequency components were dominant for all of the analysed types of surfaces (Figure 6n, Figure 7n and Figure 8n) when an FFTF method was applied and, correspondingly, there were no non-noise features in the HFNS (Figure 6m, Figure 7m and Figure 8m). Analysing a high-frequency error occurrence can be also improved with an application of the direction-based method with TD graph studies. Generally, when the surface does not contain any direction features, the TD graph is presented in an isotropic performance for both raw measured surface or HFNS characterisation. For each of the types of considered direction surface, like cylinder liners after the plateau-honing process, plateau-honed cylinder liners with additionally burnished oil pockets (valleys), turned, ground, milled or laser-textured with various angles surfaces, application of the FFTF filtration technique with a selection of the cut-off value according to the FSBT approach gave encouraging results.
The 3D PSD analysis provided dominant frequency in the high domain, the TD graphs presented the HFNS as an isotropic surface (Figure 6o, Figure 7o and Figure 8o) and, respectively, no treatment traces were found in the HFNS isometric view. Fulfilment of all these properties simultaneously can minimise the errors in a high-frequency measurement noise definition and, correspondingly, reduction by a digital filtration. Roughly chosen bandwidth can not be convenient when surface feature densities are different. Applications of various filtration techniques, like those plenties of Gaussian filters and their modifications, may not be relevant when not required features are also removed from the raw measured data. Therefore, the FSBT method seems to be fairly advantageous for a regular user.
The best method to validate the FSBT technique’s suitability is to analyse the HFNS with a PSD, ACF, FS and TD characterisation simultaneously, the more characteristics are fulfilled the more a high-frequency measurement noise procedure can be classified as sufficiently precise. Application of the FSBT scheme was not considered for isotropic surfaces, nevertheless, an isotropic performance of the HFNS can be also valuable and may be considered in further studies.

3.2. Validation of Proposed Method with a Data Rotation Process

The proposed HFNS directional method shortly named the FSBT scheme, can be improved with studies performed for raw measured data with the rotation process. For isotropic topographies, the rotation validation was not required that, respectively, data usually have isotropic properties and direction does not influence the actions made. However, when the surface has not had an isotropic characteristic, rotation of the data can be proposed. Therefore, for plateau-honed, ground, milled or laser-textured surfaces, the rotational validation of the HFNS direction method can be applied. For this type of surface texture data, a rotation equal to 30 degrees on the left and right was provided.
Generally, the application of 3D PSD analysis improved that the rotation has no significant influence on the validation of the high-frequency noise detection process. For each type of analysed (directional) surface, differences were not found or they were negligible, even the PSD was calculated as in all directional methods. Usually, the PSD gave some response to the occurrence of the high-frequency noise in the results of surface topography measurements.
Analysis of the isometric view of the HFNS showed that Gaussian filters and their modifications, e.g., GF and RGF, caused a removal of the relevant features from the raw measured surface topography data that, correspondingly, there were found on the HFNS (Figure 9a,d and Figure 10a,d). The occurrence of the non-high-frequency features caused differences in the 3D PSD graphs, some frequencies with bandwidths greater than 0.015 µm were visible (Figure 9b,e and Figure 10b,e). A similar tendency could be found when an MDF was used, the isometric view did not present any non-noise features, nevertheless, from the analysis of the 3D PSD graph, it can be concluded that contain greater than the proposed cut-off (0.015 µm) value features (Figure 9j,k, and Figure 10j,k). In all of those three cases, the isotropy was also lost (Figure 9c,f,l and Figure 10c,f,l). Some encouraging results were obtained when the spline approach (SF) was proposed. Both, PSD and TD graphs gave interesting proposals.
The cut-off value was proposed with an application of the FSBT scheme that, respectively, bandwidth was selected with a technique widely presented in Figure 5. The rest of the algorithms (filters) were proposed with similar cut-off values to correspond to the newly applied approach. In fact, each of the filters can be used with different bandwidths, nonetheless, some general conclusions may be difficult to be suggested in this manner. Therefore, bandwidth characteristic is defined according to the FSBT requirements.
From the studies of TD graphs, it was concluded that the direction (rotation) has a considerable influence on the isotropy of the HFNS when Gaussian filters (GF and RGF) were applied. In some cases, when the angle of the features (e.g., scratches) was changed, the isotropy could be found more than in the rest of the feature directions. Therefore, for these types of filtering methods, the TD and, correspondingly, FSBT scheme, must be improved with an analysis of the isometric view and PSD of the HFNS.
Application of SF and MDF techniques gave more encouraging results that direction and, especially, isotropy received in the TD graph were proportional to the rotation direction. From that matter, those techniques were influenced by the angle of the rotation process and their proportionality can indicate the usefulness of those filters.
The most encouraging results were received when an FFTF method was applied. All of the requirements, containing analysis of the isometric view of HFNS, their PSD, ACF, FS and TD, gave a straight response to the occurrence of the high-frequency measurement errors. When considering PSD, the noise frequency (high-frequency) was entirely dominant. There were no non-noise features on the HFNS and, respectively, the HFNS was isotropic in general. All of the requirements were not met simultaneously when other methods (GF, RGF, SF and MDF) were proposed. From that point of view, considering all of the analysed, commonly-used (available in commercial software) filters, the FFTF method can be the most suitable for definition and, correspondingly, reduction of the high-frequency measurement errors from the results of surface topography measurement of plateau-honed, turned, ground, milled or laser-textures surfaces.

4. The Outlook

There are still many issues that require more sophisticated studies and must be resolved in future. Of those, the most important are:
  • Studies of isotropic surface topography are still an encouraging issue when a high-frequency noise must be defined and reduced. There are no direction features that can be useful for defining the HFNS properties. From that point of view, other, non-feature-based methods must be proposed for this type of surface.
  • The high-frequency measurement errors can be difficult to detect as suggested in paper methods when the amplitude of the noise is relatively small. Some improvement of the proposed method must be included with modifications of the noise amplitude.
  • Furthermore, the effect of the high-frequency measurement noise amplitude on the results of applied techniques was not considered. The influence of the amplitude of noise on the results of filter application and, correspondingly, on the surface topography parameters (from ISO 25178 standard) must be also considered to provide more surface functional advantages.

5. Conclusions

The following conclusions can be proposed:
  • General functions, available in the commercial software, like Power Spectral Density, Autocorrelation Function, Frequency Spectrum or Texture Direction, are very useful in the processes of definition and then reduction of the high-frequency measurement errors. The most important criteria for the selection of relevant procedures is to remove (reduce) the high-frequency noise without any modification of the other feature of the characterized surface data.
  • For a high-frequency measurement noise characterisation, both profile (2D) and an areal (3D) analysis can offer other benefits. The 3D analysis can be valuable only when Frequency Spectrum or eye-view studies are performed, nonetheless, this technique may require experienced users. The Power Spectral Densities, Autocorrelation Function and Frequency Spectrum methods did not always give clear results, e.g., for plateau-honed surface topography, an areal analysis was useless instead of a profile. Therefore, for some cases, the profile (2D) analysis is proposed contrary to an areal (3D).
  • The technique based on the analysis of the Frequency Spectrum is suggested to select the most appropriate cut-off value when a digital filter is used for a high-frequency measurement noise reduction. The Frequency Spectrum-based technique proposes to select the bandwidth of the filter with the filter selector range. When the range is too big and exceeds the Fast Fourier Transform graph features with a known direction, the filter can not separate the entire noise data and, respectively, on the other hand, when a range is too small other features can be also removed from the raw measured data. From that matter, it is difficult to propose one cut-off value for each type of surface that should be dependent on the density and direction of the surface topography features. The main purpose is to increase the value of the cut-off until the non-noise data is detected on the high-frequency noise surface.
  • Considering the studies of Texture Direction graphs, it was found that the rotation (direction) has a significant influence on the isotropy of the high-frequency noise surface when Gaussian filters were applied. When the angle of the surface features (e.g., those after honing process) was changed, the isotropy could be defined more than in the rest of the feature directions so, respectively, for these types of filtering methods, the Texture Direction and Frequency Spectrum Based Technique, must be improved with analysis of the isometric view and Power Spectral Density of the high-frequency noise surface.
  • Generally, the usage of 3D Power Spectral Density characterisation improved that the rotation process has no significant influence on the validation of the process of high-frequency noise detection. For analysed types of directional surfaces, differences were not found or, respectively, they were negligible. Usually, analysis of the Power Spectral Density graph can give some encouraging response to the high-frequency noise occurrence.
  • The most encouraging results were received when a Fast Fourier Transform Filter method was applied. All of the high-frequency noise surface requirements, containing analysis of the isometric view, their Power Spectral Density, Autocorrelation Function, Frequency Spectrum and Texture Direction, gave an appropriate response to the occurrence of the high-frequency measurement errors. Considering all of the analysed, commonly used or, in the other words, available in commercial software, filters, the Fast Fourier Transform Filter method can be the most suitable for definition (detection and removal) of the high-frequency measurement errors from the results of surface topography measurement of plateau-honed, turned, ground, milled or laser-textures surfaces.

Funding

This research received no external funding.

Institutional Review Board Statement

Not applicable.

Informed Consent Statement

Not applicable.

Data Availability Statement

Data sharing is not applicable to this article.

Conflicts of Interest

The author declares no conflict of interest.

Nomenclature

The following abbreviations (left) are used in the manuscript:
ACFautocorrelation function
AFMatomic force microscopy
F-surfaceform surface
FFTFFast Fourier Transform Filter
FSFrequency spectrum characterisation
FSBTFrequency Spectrum-Based Technique
GFGaussian filter
HFNShigh-frequency noise surface
L-surfacelong-wavelength surface
MDFmedian denoising filter
MQCLMinimum Quantity Cooling Lubrication
PSDpower spectral density
RGFrobust Gaussian filter
S-F surfaceis a surface after S- and F- filtering
S-surfaceshort-wavelength noise surface
SFspline filter
TDtexture direction graph

References

  1. Trzepieciński, T.; Fejkiel, R. On the influence of deformation of deep drawing quality steel sheet on surface topography and friction. Tribol. Int. 2017, 115, 78–88. [Google Scholar] [CrossRef]
  2. Shao, Y.; Yin, Y.; Du, S.; Xia, T.; Xi, L. Leakage Monitoring in Static Sealing Interface Based on Three Dimensional Surface Topography Indicator. ASME J. Manuf. Sci. Eng. 2018, 140, 101003. [Google Scholar] [CrossRef]
  3. Morehead, J.; Zou, M. Superhydrophilic surface on Cu substrate to enhance lubricant retention. J. Adhes. Sci. Technol. 2014, 28, 833–842. [Google Scholar] [CrossRef]
  4. Zheng, M.; Wang, B.; Zhang, W.; Cui, Y.; Zhang, L.; Zhao, S. Analysis and prediction of surface wear resistance of ball-end milling topography. Surf. Topogr. Metrol. Prop. 2020, 8, 025032. [Google Scholar] [CrossRef]
  5. Dzierwa, A.; Galda, L.; Tupaj, M.; Dudek, K. Investigation of wear resistance of selected materials after slide burnishing process. Eksploat. Niezawodn. 2020, 22, 432–439. [Google Scholar] [CrossRef]
  6. Szala, M.; Świetlicki, A.; Sofińska-Chmiel, W. Cavitation erosion of electrostatic spray polyester coatings with different surface finish. Bull. Pol. Acad. Sci. Tech. Sci. 2021, 69, e137519. [Google Scholar] [CrossRef]
  7. Macek, W. Correlation between Fractal Dimension and Areal Surface Parameters for Fracture Analysis after Bending-Torsion Fatigue. Metals 2021, 11, 1790. [Google Scholar] [CrossRef]
  8. Liewald, M.; Wagner, S.; Becker, D. Influence of Surface Topography on the Tribological Behaviour of Aluminium Alloy 5182 with EDT Surface. Tribol. Lett. 2010, 39, 135–142. [Google Scholar] [CrossRef]
  9. Leach, R.K.; Evans, C.; He, L.; Davies, A.; Duparré, A.; Henning, A.; Jones, C.W.; O’Connor, D. Open questions in surface topography measurement: A roadmap. Surf. Topogr. Metrol. Prop. 2015, 3, 013001. [Google Scholar] [CrossRef]
  10. Podulka, P. Selection of Methods of Surface Texture Characterisation for Reduction of the Frequency-Based Errors in the Measurement and Data Analysis Processes. Sensors 2022, 22, 791. [Google Scholar] [CrossRef]
  11. Pawlus, P.; Wieczorowski, M.; Mathia, T. The Errors of Stylus Methods in Surface Topography Measurements; Zapol: Szczecin, Poland, 2014. [Google Scholar]
  12. Pawlus, P. Digitisation of surface topography measurement results. Measurement 2007, 40, 672–686. [Google Scholar] [CrossRef]
  13. Podulka, P. Bisquare robust polynomial fitting method for dimple distortion minimisation in surface quality analysis. Surf. Interface Anal. 2020, 52, 875–881. [Google Scholar] [CrossRef]
  14. Podulka, P. The effect of valley depth on areal form removal in surface topography measurements. Bull. Pol. Acad. Sci. Tech. Sci. 2019, 67, 391–400. [Google Scholar] [CrossRef]
  15. Magdziak, M. Selection of the Best Model of Distribution of Measurement Points in Contact Coordinate Measurements of Free-Form Surfaces of Products. Sensors 2019, 19, 5346. [Google Scholar] [CrossRef] [Green Version]
  16. Podulka, P.; Pawlus, P.; Dobrzanski, P.; Lenart, A. Spikes removal in surface measurement. J. Phys. Conf. Ser. 2014, 483, 012025. [Google Scholar] [CrossRef] [Green Version]
  17. De Groot, P.; DiSciacca, J. Definition and evaluation of topography measurement noise in optical instruments. Opt. Eng. 2020, 59, 064110. [Google Scholar] [CrossRef]
  18. Servin, M.; Estrada, J.C.; Quiroga, J.A.; Mosiño, J.F.; Cywiak, M. Noise in phase shifting interferometry. Opt. Express 2009, 17, 8789–8794. [Google Scholar] [CrossRef] [Green Version]
  19. Šarbort, M.; Holá, M.; Pavelka, J.; Schovánek, P.; Rerucha, Š.; Oulehla, J.; Fo, T.; Lazar, J. Comparison of three focus sensors for optical topography measurement of rough surfaces. Opt. Express 2019, 27, 33459. [Google Scholar] [CrossRef]
  20. Podulka, P. Comparisons of envelope morphological filtering methods and various regular algorithms for surface texture analysis. Metrol. Meas. Syst. 2020, 27, 243–263. [Google Scholar] [CrossRef]
  21. Podulka, P. Suppression of the High-Frequency Errors in Surface Topography Measurements Based on Comparison of Various Spline Filtering Methods. Materials 2021, 14, 5096. [Google Scholar] [CrossRef]
  22. ISO 2016 25178-600; Geometrical Product Specification (GPS)—Surface Texture: Areal Part 600: Metrological Characteristics for Areal-Topography Measuring Methods. International Organization for Standardization: Geneva, Switzerland, 2016.
  23. De Groot, P.J. The Meaning and Measure of Vertical Resolution in Optical Surface Topography Measurement. Appl. Sci. 2017, 7, 54. [Google Scholar] [CrossRef]
  24. Podulka, P. Reduction of Influence of the High-Frequency Noise on the Results of Surface Topography Measurements. Materials 2021, 14, 333. [Google Scholar] [CrossRef] [PubMed]
  25. Pawlus, P. An analysis of slope of surface topography. Metrol. Meas. Syst. 2005, 12, 295–313. [Google Scholar]
  26. Santoso, T.; Syam, W.P.; Darukumalli, S.; Leach, R. Development of a compact focus variation microscopy sensor for on-machine surface topography measurement. Measurement 2022, 187, 110311. [Google Scholar] [CrossRef]
  27. Syam, W.P.; Jianwei, W.; Zhao, B.; Maskery, I.; Elmadih, W.; Leach, R. Design and analysis of strut-based lattice structures for vibration isolation. Precis. Eng. 2018, 52, 494–506. [Google Scholar] [CrossRef]
  28. Muhamedsalih, H.; Jiang, X.; Gao, F. Vibration compensation of wavelength scanning interferometer for in-process surface inspection. In Proceedings of the 10th Proceedings of Computing and Engineering Annual Researchers’ Conference 2010; University of Huddersfield: Huddersfield, UK, 2010; pp. 148–153. [Google Scholar]
  29. Syam, W.P. In-process surface topography measurements. In Advances in Optical Surface Texture Metrology; Leach, R.K., Ed.; IOP Publishing: Bristol, UK, 2020. [Google Scholar]
  30. Zhang, Z.; Zhang, Y.; Zhu, Y. A new approach to analysis of surface topography. Precis. Eng. 2010, 34, 807–810. [Google Scholar] [CrossRef]
  31. Alcock, S.G.; Ludbrook, G.D.; Owen, T.; Dockree, R. Using the power spectral density method to characterise the surface topography of optical surfaces. Proc. SPIE 2010, 7801, 780108. [Google Scholar] [CrossRef]
  32. Elson, J.; Bennett, J. Calculation of the power spectral density from surface profile data. Appl. Opt. 1995, 34, 201–208. [Google Scholar] [CrossRef]
  33. Podulka, P. Fast Fourier Transform detection and reduction of high-frequency errors from the results of surface topography profile measurements of honed textures. Eksploat. Niezawodn. 2021, 23, 84–89. [Google Scholar] [CrossRef]
  34. Románszki, L.; Klébert, S.; Héberger, K. Estimating Nanoscale Surface Roughness of Polyethylene Terephthalate Fibers. ACS Omega 2020, 5, 3670–3677. [Google Scholar] [CrossRef]
  35. Tian, H.; Ribeill, G.; Xu, C.; Reece, C.E.; Kelley, M.J. A novel approach to characterizing the surface topography of niobium superconducting radio frequency (SRF) accelerator cavities. Appl. Surf. Sci. 2011, 257, 4781–4786. [Google Scholar] [CrossRef]
  36. Jacobs, T.D.B.; Junge, T.; Pastewka, L. Quantitative characterisation of surface topography using spectral analysis. Surf. Topogr. Metrol. Prop. 2017, 5, 013001. [Google Scholar] [CrossRef]
  37. Duparré, A.; Ferre-Borrull, J.; Gliech, S.; Notni, G.; Steinert, J.; Bennett, J. Surface characterization techniques for determining the root-mean-square roughness and power spectral densities of optical components. Appl. Opt. 2002, 41, 154–171. [Google Scholar] [CrossRef] [PubMed] [Green Version]
  38. Jiang, Y.; Wang, S.; Qin, H.; Li, B.; Li, Q. Similarity quantification of 3D surface topography measurements. Measurement 2021, 186, 110207. [Google Scholar] [CrossRef]
  39. Walsh, C.; Leistner, A.; Oreb, B. Power spectral density analysis of optical substrates for gravitational-wave interferometry. Appl. Opt. 1999, 38, 4790–4801. [Google Scholar] [CrossRef]
  40. Jiang, Z.; Wang, H.; Fei, B. Research into the application of fractal geometry in characterising machined surfaces. Int. J Mach. Tool Manu. 2001, 41, 2179–2185. [Google Scholar] [CrossRef]
  41. Czifra, Á.; Goda, T.; Garbayo, E. Surface characterisation by parameter-based technique, slicing method and PSD analysis. Measurement 2011, 44, 906–916. [Google Scholar] [CrossRef]
  42. Krolczyk, G.M.; Maruda, R.W.; Nieslony, P.; Wieczorowski, M. Surface morphology analysis of Duplex Stainless Steel (DSS) in Clean Production using the Power Spectral Density. Measurement 2016, 94, 464–470. [Google Scholar] [CrossRef]
  43. Raoufi, D. Fractal analyses of ITO thin films: A study based on power spectral density. Phys. B Condens. Matter 2010, 405, 451–455. [Google Scholar] [CrossRef]
  44. Xu, C.; Tian, H.; Reece, C.E.; Kelley, M.J. Enhanced characterization of niobium surface topography. Phys. Rev. Accel. Beams 2011, 14, 123501. [Google Scholar] [CrossRef] [Green Version]
  45. Sun, J.; Song, Z.; Heb, G.; Sang, Y. An improved signal determination method on machined surface topography. Precis. Eng. 2018, 51, 338–347. [Google Scholar] [CrossRef]
  46. Zuo, X.; Peng, M.; Zhou, Y. Influence of noise on the fractal dimension of measured surface topography. Measurement 2020, 152, 107311. [Google Scholar] [CrossRef]
  47. Lin, T.Y.; Blunt, L.; Stout, K.J. Determination of proper frequency bandwidth for 3D topography measurement using spectral analysis. Part I: Isotropic surfaces. Wear 1993, 166, 221–232. [Google Scholar] [CrossRef]
  48. Podulka, P. Proposal of frequency-based decomposition approach for minimization of errors in surface texture parameter calculation. Surf. Interface Anal. 2020, 52, 882–889. [Google Scholar] [CrossRef]
  49. Baofeng, H.; Haibo, Z.; Siyuan, D.; Ruizhao, Y.; Zhaoyao, S. A review of digital filtering in evaluation of surface roughness. Metrol. Meas. Syst. 2021, 28, 217–253. [Google Scholar] [CrossRef]
  50. Podulka, P. Selection of reference plane by the least squares fitting methods. Adv. Sci. Technol. Res. J. 2016, 10, 164–175. [Google Scholar] [CrossRef] [Green Version]
  51. Podulka, P. The Effect of Surface Topography Feature Size Density and Distribution on the Results of a Data Processing and Parameters Calculation with a Comparison of Regular Methods. Materials 2021, 14, 4077. [Google Scholar] [CrossRef]
  52. Pawlus, P.; Reizer, R.; Wieczorowski, M. Problem on non-measured points in surface texture measurements. Metrol. Meas. Syst. 2017, 24, 525–536. [Google Scholar] [CrossRef]
  53. Pawlus, P.; Reizer, R.; Wieczorowski, M. Functional Importance of Surface Texture Parameters. Materials 2021, 14, 5326. [Google Scholar] [CrossRef]
  54. ISO 25178-3:2012; Geometrical Product Specifications (GPS)—Surface Texture: Areal—Part 3: Specification Operators. International Organization for Standardization: Geneva, Switzerland, 2012.
  55. Podulka, P. Edge-area form removal of two-process surfaces with valley excluding method approach. Matec. Web. Conf. 2019, 252, 05020. [Google Scholar] [CrossRef]
  56. Podulka, P. Improved Procedures for Feature-Based Suppression of Surface Texture High-Frequency Measurement Errors in the Wear Analysis of Cylinder Liner Topographies. Metals 2021, 11, 143. [Google Scholar] [CrossRef]
  57. ISO 16610-21:2011; Geometrical Product Specifications (GPS)—Filtration—Part 21: Linear Profile Filters: Gaussian Filters. International Organization for Standardization: Geneva, Switzerland, 2011.
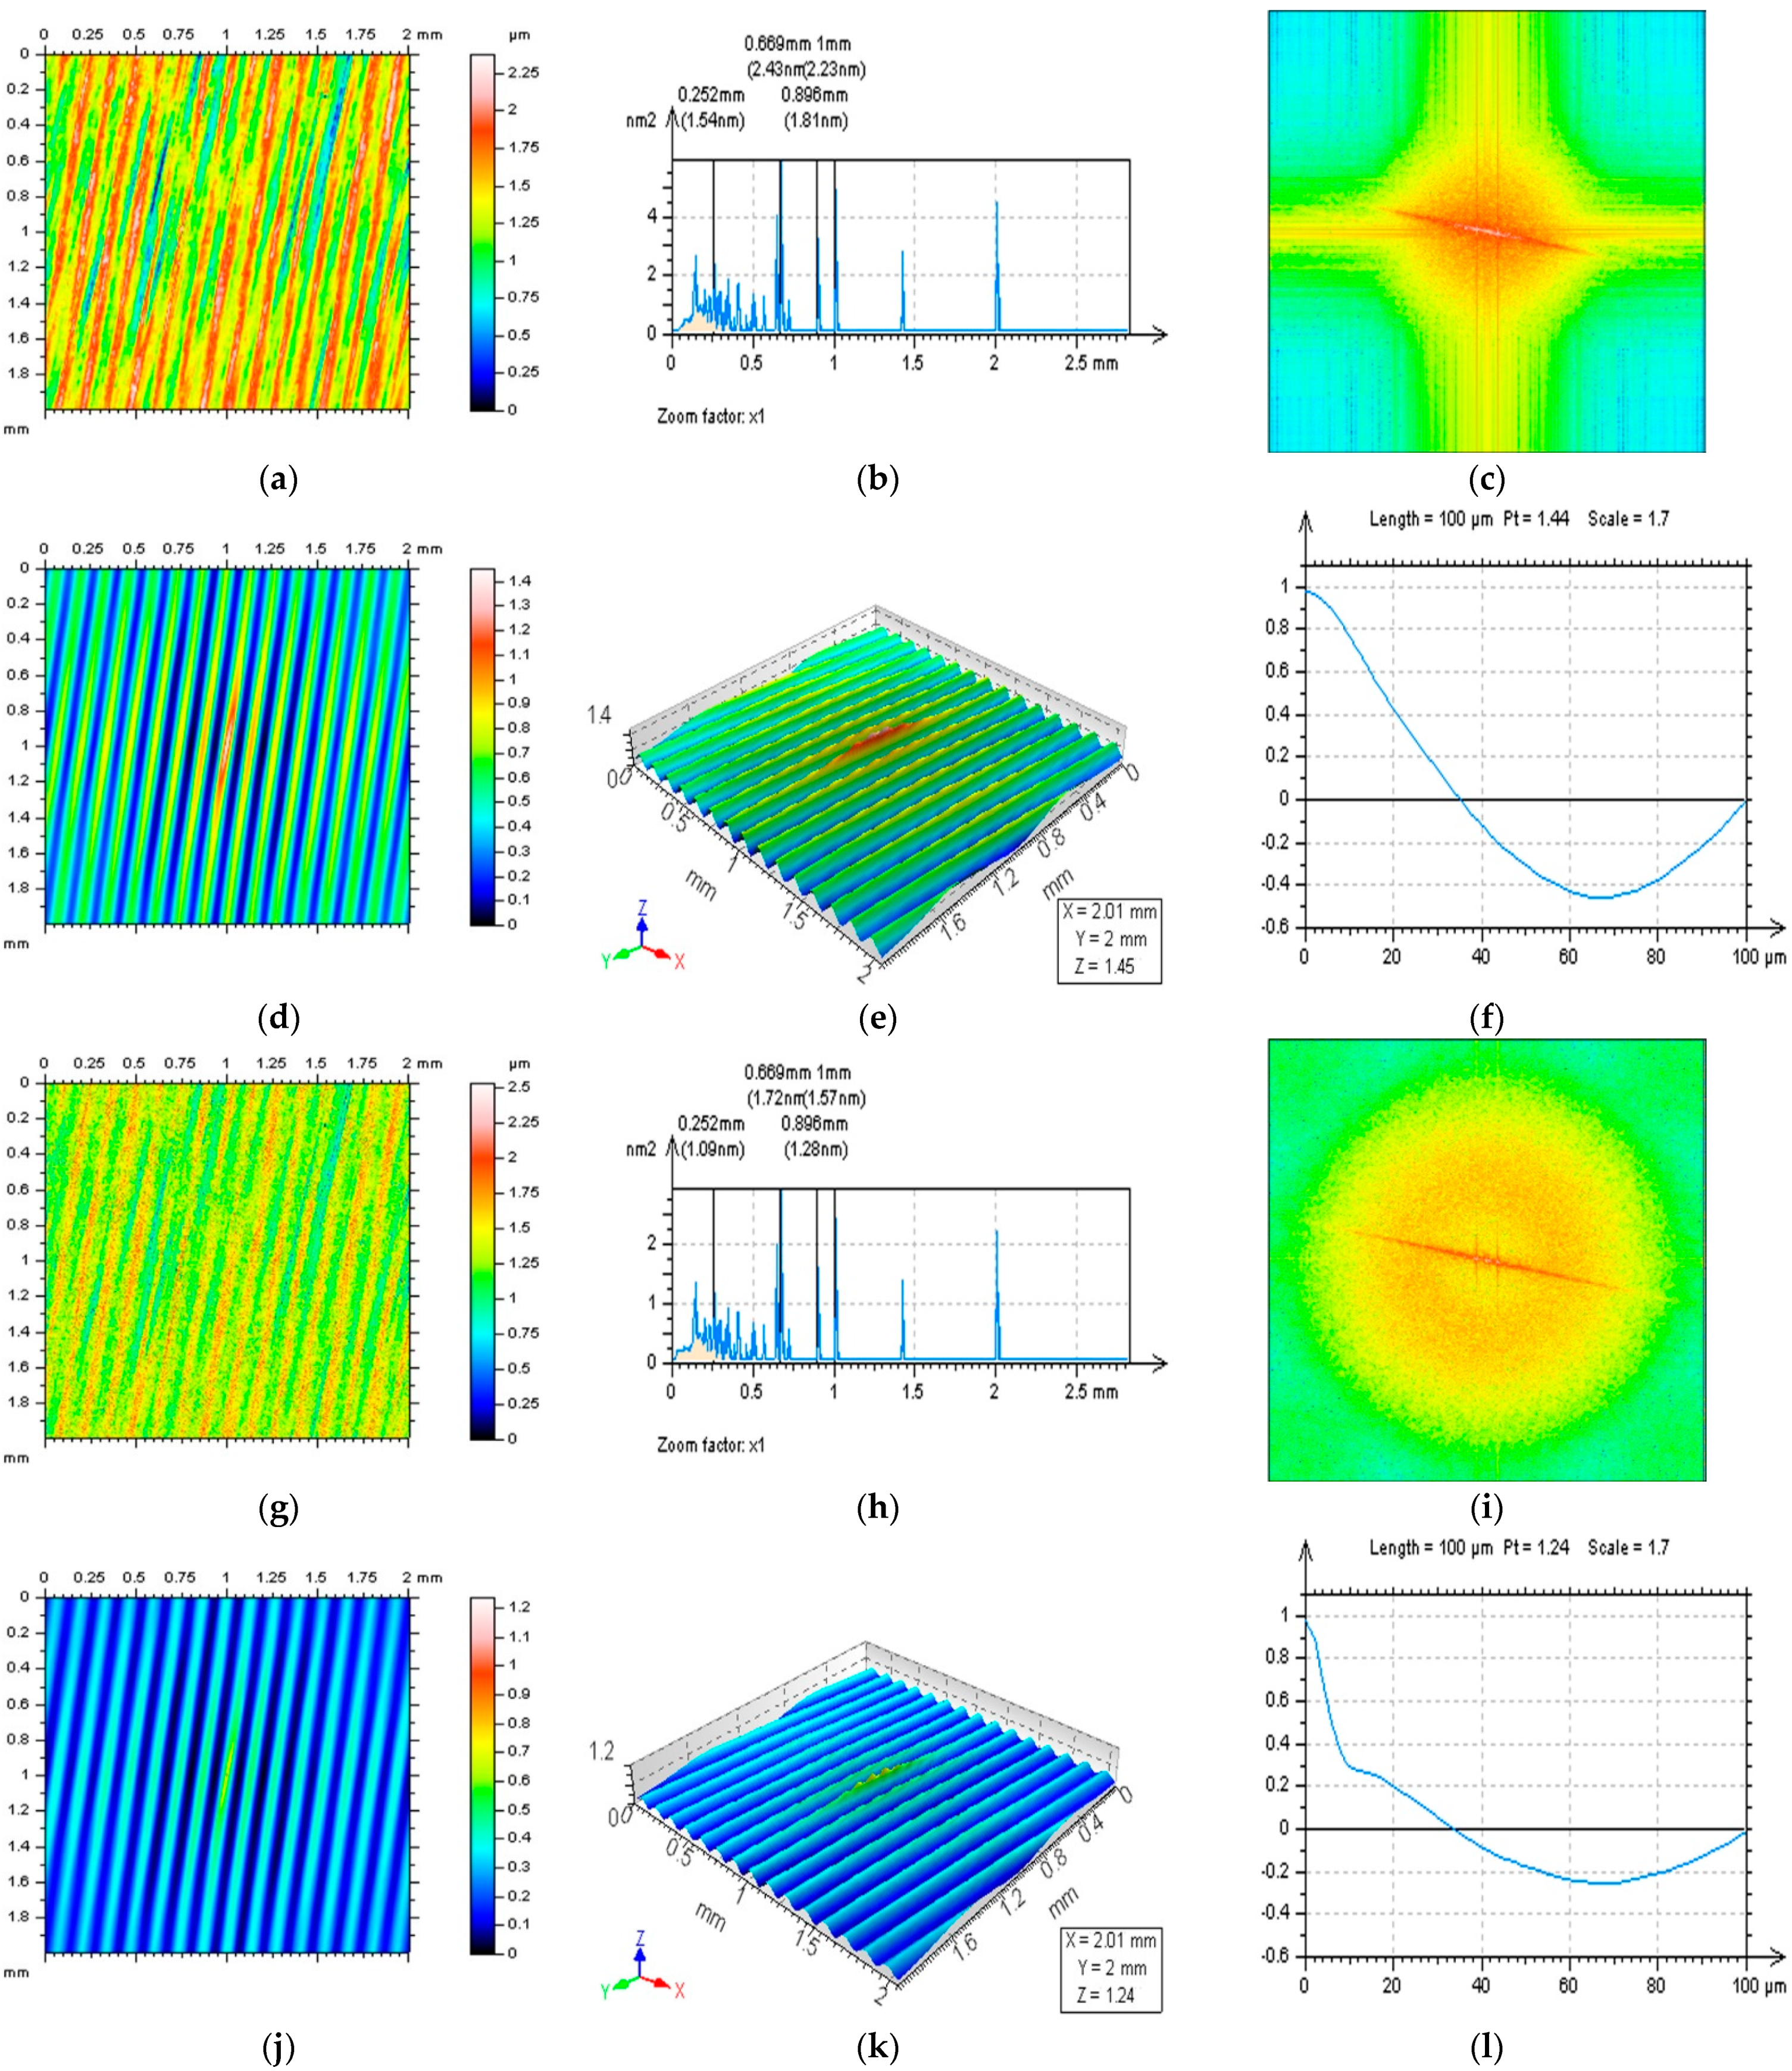
Figure 1. Contour map plots (a,g), PSDs (b,h), FS (c,i) and map plots (d,j), isometric view (e,k) and centre–profiles (f,l) of ACFs received from raw measured data of milled surface (af) and the same surface with a high-frequency noise (gl).
Coatings 12 00726 g001
Figure 2. Contour map plots (a,g), PSDs (b,h), FS (c,i) and map plots (d,j), isometric view (e,k) and centre–profiles (f,l) of ACFs received from raw measured data of plateau–honed cylinder liner surface containing oil pockets (af) and the same surface with a high-frequency noise (gl).
Coatings 12 00726 g002
Figure 3. Extracted from a plateau-honed cylinder liner surface with additionally burnished dimples profiles (ac): raw measured data (left column), containing high–frequency noise with a dimple (middle) and free-of-feature (right column), their PSDs (df), ACFs (gi) and centre–part of ACFs (jl) respectively.
Coatings 12 00726 g003
Figure 4. Contour map plots (ac) of HFNS received from ground surface after application of GF (left column), SF (middle) and MDF (right column), their PSDs (df), ACFs (gi), extraction of ACFs based on direction of the treatment traces (jl) and TD graphs (mo), respectively, cut–off = 0.025 mm.
Coatings 12 00726 g004aCoatings 12 00726 g004b
Figure 5. Spectrum edition (ac), HFNS (df), their PSDs (gi) and TDs (jl) from a plateau-honed cylinder liner surface texture received after application of FFTF method.
Coatings 12 00726 g005aCoatings 12 00726 g005b
Figure 6. Analysis of a HFNS (left column), their PSDs (middle) and TDs (right column) received from a turned piston skirt surface by application of: GF (ac), RGF (df), SF (gi), MDF (jl) and FFTF (mo) method, cut–off = 0.025 mm.
Coatings 12 00726 g006aCoatings 12 00726 g006b
Figure 7. Analysis of a HFNS (left column), their PSDs (middle) and TDs (right column) received from a plateau-honed cylinder surface containing oil pockets by usage of: GF (ac), RGF (df), SF (gi), MDF (jl) and FFTF (mo) approach, cut–off = 0.015 mm.
Coatings 12 00726 g007aCoatings 12 00726 g007b
Figure 8. Analysis of a HFNS (left column), their PSDs (middle) and TDs (right column) received from a laser-textured surface by filtering: GF (ac), RGF (df), SF (gi), MDF (jl) and FFTF (mo) approach, cut–off = 0.015 mm.
Coatings 12 00726 g008aCoatings 12 00726 g008b
Figure 9. Analysis of a HFNS (left column), their PSDs (middle) and TDs (right column) received from a 30° left rotated laser-textured surface by application of the following filtering method: GF (ac), RGF (df), SF (gi), MDF (jl) and FFTF (mo) approach, cut–off = 0.015 mm.
Coatings 12 00726 g009aCoatings 12 00726 g009b
Figure 10. Analysis of a HFNS (left column), their PSDs (middle) and TDs (right column) received from a 30° right rotated laser-textured surface by usage of the following filtering approaches: GF (ac), RGF (df), SF (gi), MDF (jl) and FFTF (mo) approach, cut–off = 0.015 mm.
Coatings 12 00726 g010aCoatings 12 00726 g010b
Publisher’s Note: MDPI stays neutral with regard to jurisdictional claims in published maps and institutional affiliations.