Article

Shear Behavior of Stud-PBL Composite Shear Connector for Steel–Ceramsite Concrete Composite Structure

1
School of Urban Construction, Wuhan University of Science and Technology, Wuhan 430065, China
2
School of Civil Engineering, Central South University, Changsha 410075, China
3
National Engineering Laboratory for High Speed Railway Construction, Central South University, Changsha 410075, China
*
Author to whom correspondence should be addressed.
Coatings 2022, 12(5), 583; https://doi.org/10.3390/coatings12050583
Submission received: 29 March 2022 / Revised: 18 April 2022 / Accepted: 21 April 2022 / Published: 24 April 2022
(This article belongs to the Special Issue Current Research in Cement and Building Materials)

Abstract

:
For steel–concrete composite structure, a new type of stud–PBL composite shear connector can improve the shear resistance of steel–concrete interface, and polypropylene fiber ceramsite concrete can reduce the self-weight. Therefore, investigating the shear behavior of stud–PBL composite shear connectors for steel–ceramsite concrete composite structures bears significance. In this study, static testing and numerical simulation of the composite shear connector push-out specimen of polypropylene fiber ceramsite concrete were first conducted. The influencing factors of the shear bearing capacity were then analyzed. The formula for determining the shear bearing capacity of the steel–ceramsite concrete composite structure stud–PBL composite shear connectors was ultimately established. The results indicated that the new composite shear connector exhibited excellent shear resistance and good deformation ability. In addition, increasing concrete’s strength, stud’s diameter, and perforated plate’s thickness could significantly improve the shear bearing capacity of the composite shear connector. The calculated value of the shear bearing capacity of the composite shear connector was well correlated the measured value of the test. Overall, the stud–PBL composite shear connector could effectively improve the interfacial shear bearing performance of the steel–ceramsite concrete composite structure. Moreover, the established formula demonstrated broad applicability.

1. Introduction

Steel–concrete composite structures are characterized by reasonable stress and have been widely used in recent years. Shear connectors are the pivotal elements that bond the steel beam to the concrete slab. Stud and Perfobond Leiste (PBL) shear connectors are mostly used in engineering thus far [1]. Stud shear connectors can resist longitudinal shear force through the stud rod, and a large part resists the lifting force of the concrete slab. To resist the longitudinal shear force and the interface separation force, a PBL shear connector mainly consists of three parts: a perforated steel plate, the concrete tenon, and the penetrating steel bars [2].
Comprehensive studies have been conducted on the combined structural performance of studs or solely PBL shear connectors, and these reports have been verified in various engineering practices [1,2,3,4,5,6]. To meet engineering requirements such as large shear and pull-out resistance for a composite structure interface, flexible stud shear connectors have been combined with rigid PBL shear connectors; this integration is aimed at forming composite shear connectors that can be used in steel–concrete composite structures. However, the process of combining stud shear connectors and PBL shear connectors in space remains inconclusive. Zhang [7] added two rows of studs to both sides of the perforated steel plate to improve the shear bearing capacity; this connector, which was composed of the perforated plate and the studs, was used in the Nakano Viaduct Project in Japan. For this method, push-out tests and finite element simulation analysis were performed by Deng [8] and Zheng [9]. Their study verified the superior shear resistance of the perforated plate + stud shear connector. Meanwhile, to strengthen the vertical shear resistance of the transition between the longitudinal steel box girder section and the concrete girder section in the hybrid box girder bridge, Jin [10] arranged the studs and PBL shear connectors alternately vertically in the web of a hybrid box girder bridge and studied the ratio of the shear force borne by the PBL shear connectors to the studs. Chen [11] proposed a composite shear connector in which studs were transversely welded to the perforated plate. The formula for the shear bearing capacity of the composite shear connector was derived by finite element simulation analysis of push-out tests. The aforementioned studies demonstrated that the combination of studs and PBL to form a composite shear connector can indeed improve shear resistance; however, existing composite shear connectors (mainly used in special stress parts of the structure) are not universal. The PBL shear connectors arranged lengthwise can divide the concrete slab into strips longitudinally, reducing the integrity of the concrete slab. Meanwhile, the PBL shear connectors arranged lengthwise may increase the amount of steel. Widely distributed welding residual stresses also exist in PBL shear connectors and steel beams. Therefore, it is of good engineering value to design a more reasonable stud–PBL composite shear connector, which can optimize the welding residual stresses, enhance the connection between concrete and steel beams, and improve the force performance of the steel–concrete interface.
In this study, PBL and stud were alternately arranged in the same plane to form a new composite shear connector. The intermittently arranged PBL shear connectors can reduce the amount of steel used and increase the integrity of the concrete slab. The bearing effect of the end concrete can also enhance the shear resistance of the shear connectors [12,13]. Meanwhile, the combination of rigid PBL shear connectors and flexible studs can complement the advantages of the two shear connectors, endowing the interface between the concrete slab and the steel beam with sufficient stiffness, good ductility, and toughness.
Shear bearing capacity is an important performance index of shear connectors. Therefore, it is very important for its popularization and application to accurately evaluate the shear resistance of shear connectors and obtain a reliable calculation formula of shear bearing capacity. In a previous study, Xue [14] proposed the load–slip curve formula for the sheared stud and the calculation formula for the shear bearing capacity, considering the length to diameter ratio of the stud by testing the stud push-out specimen. Using push-out testing, Lee [15] and Hu [16] presented formulas for calculating the shear bearing capacity of high-strength concrete stud shear connectors and ultra-high-performance concrete stud shear connectors, respectively. Huo [17] studied the shear bearing capacity of stud connectors under impact loading. Based on integrating some group studs push-out tests and theoretical analysis results [18,19,20,21], “Code for Design of Steel and Concrete Composite Bridges” (GB 50917-2013) also provided the formula for calculating the shear bearing capacity of ordinary concrete composite beams when the studs were damaged, and highlighted that the diameter of the stud is an important influencing factor. The effects of diameter [12,13,22,23,24,25,26,27,28,29,30], quantity [22] and strength [25,26] of penetrating steel bars, diameter of openings [12,13,22,23,24,25,26,27,29,30], concrete strength [12,13,22,23,25,26,28,29], number of openings [12,27], thickness of perforated plates [13,21,22,23,25,27,30], spacing of perforated plates [26], and concrete stress state [12] on the shear bearing capacity of PBL shear connectors have been evaluated in other reports. Moreover, formulas for calculating the shear bearing capacity of PBL shear connectors have been proposed. The influencing factors and function forms considered in each calculation formula are essentially identical, but vary in coefficients. No mature formulas are currently recognized in the industry. Therefore, the formula for the shear bearing capacity of stud shear connectors is highly mature. By contrast, the formula for the shear bearing capacity of the PBL shear connector has yet to be verified by more tests and engineering examples. After the stud and the PBL shear connector are integrated into a composite shear connector, adding both in the shear bearing capacity is evidently inappropriate. Therefore, the determination of the mutual influence of the stud and the PBL shear connector still needs to be clarified by experimental and analytical research.
The ceramsite concrete with an appropriate number of polypropylene fibers presents several advantages, including lightness, high strength, and good seismic performance [31]. However, the physical and mechanical properties of ceramsite concrete still differ from those of ordinary concrete. Thus, the performance of composite structures made from it needs to be further defined using experiments and theoretical analysis. Applying the stud–PBL composite shear connector in a composite structure consisting of steel–ceramsite concrete can form a structural system characterized by lightweight, dead weight, and high bearing capacity. Accordingly, studying its mechanical properties is highly crucial.
This study explores the following three aspects. (i) First, push-out tests of one stud shear connector (LT-S), one PBL shear connector (LT-P), and three stud-PBL composite shear connectors (LT-C) were performed to research the interfacial shear resistance of steel–ceramsite concrete composite structures with different shear connectors. The finite element software Abaqus was then used to simulate push-out tests with 5 samples. The test phenomenon, load–slip curve, shear bearing capacity, stress illustration, and damage illustration (among others) were compared and then verified among one another. Finally, the shear damage mechanism and the failure form of shear connectors were revealed from multiple angles. (ii) Nine groups of orthogonal test simulations with four factors and three levels were conducted for 49 finite element push-out samples. Subsequently, the influences of parameters such as the stud diameter, PBL perforated plate thickness, opening diameter, penetrating steel bar diameter, and concrete strength on the shear resistance of the composite shear connector were analyzed. (iii) Multivariate linear regression analysis was performed on the analysis results of 49 finite element models. Subsequently, the formula for the shear bearing capacity of the stud–PBL composite shear connector in the steel–polypropylene fiber ceramsite concrete composite structure was derived. The formula was then verified by the test results. The objectives of the study are to clarify the shear resistance of composite shear connectors, to obtain their influencing factors, and to establish reasonable calculation formulas. The significance of this paper is to provide a new and scientific reference for the design of steel–concrete composite structure interfaces.

2. Push-Out Experiment

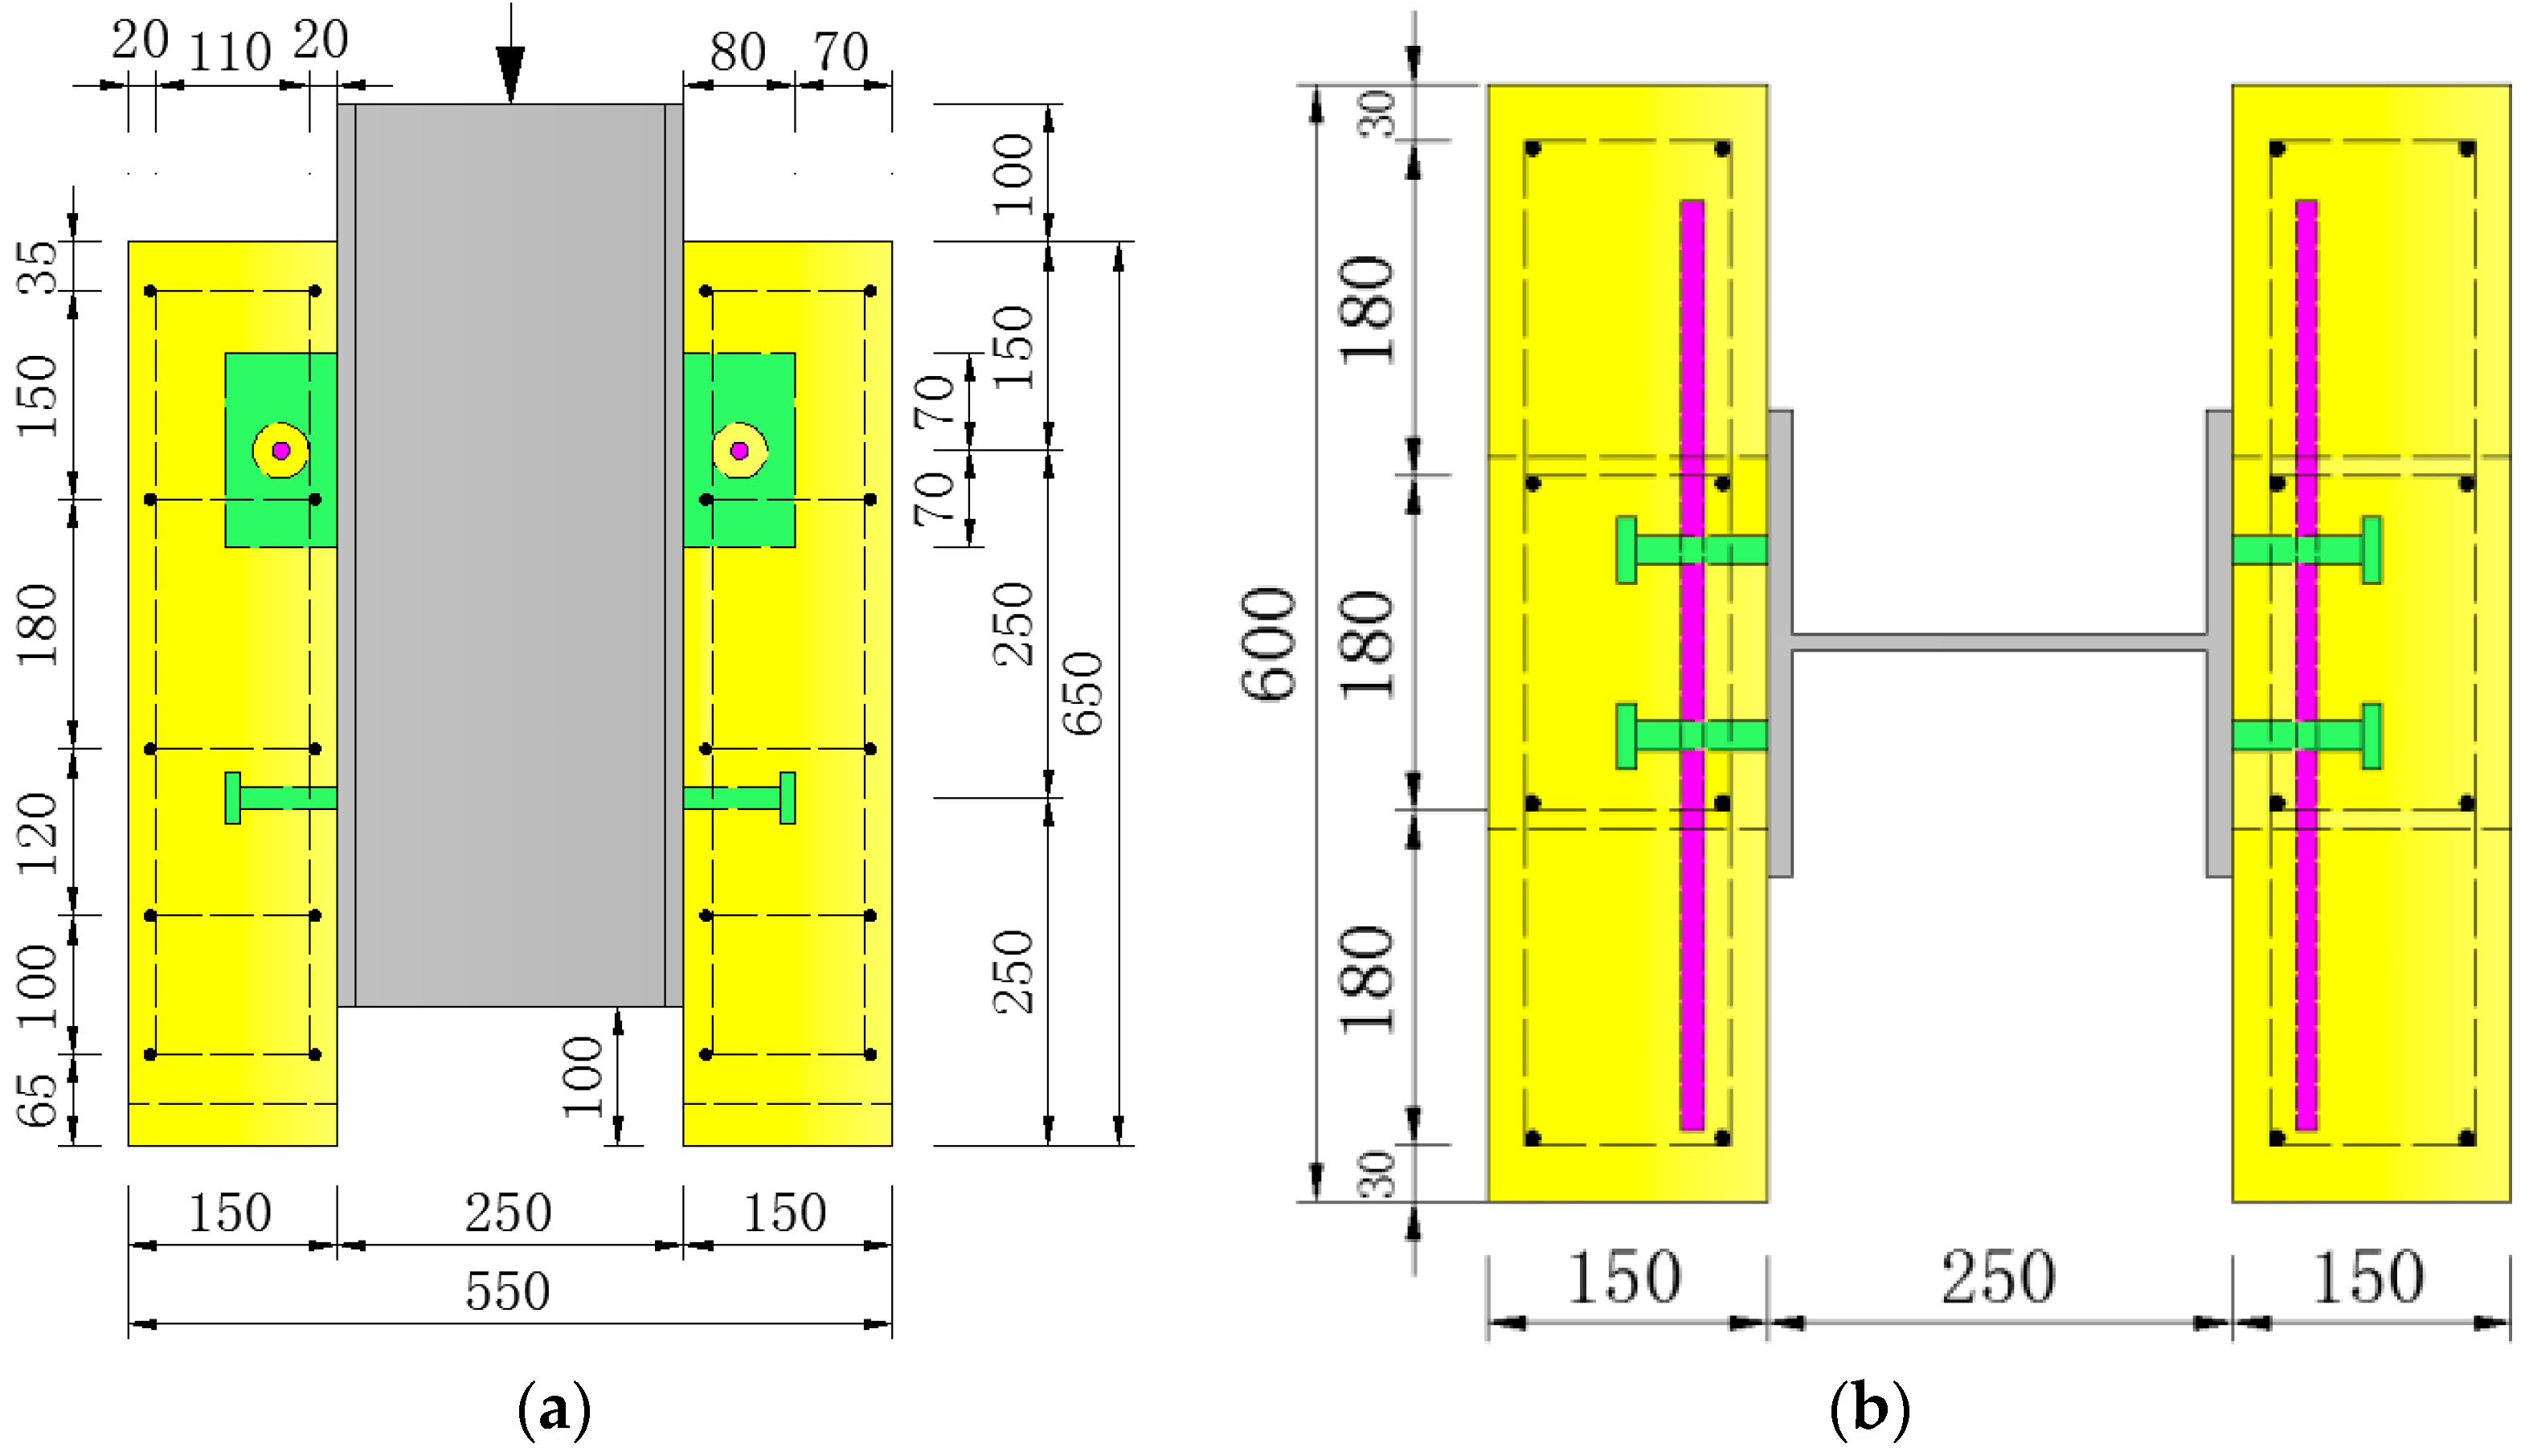
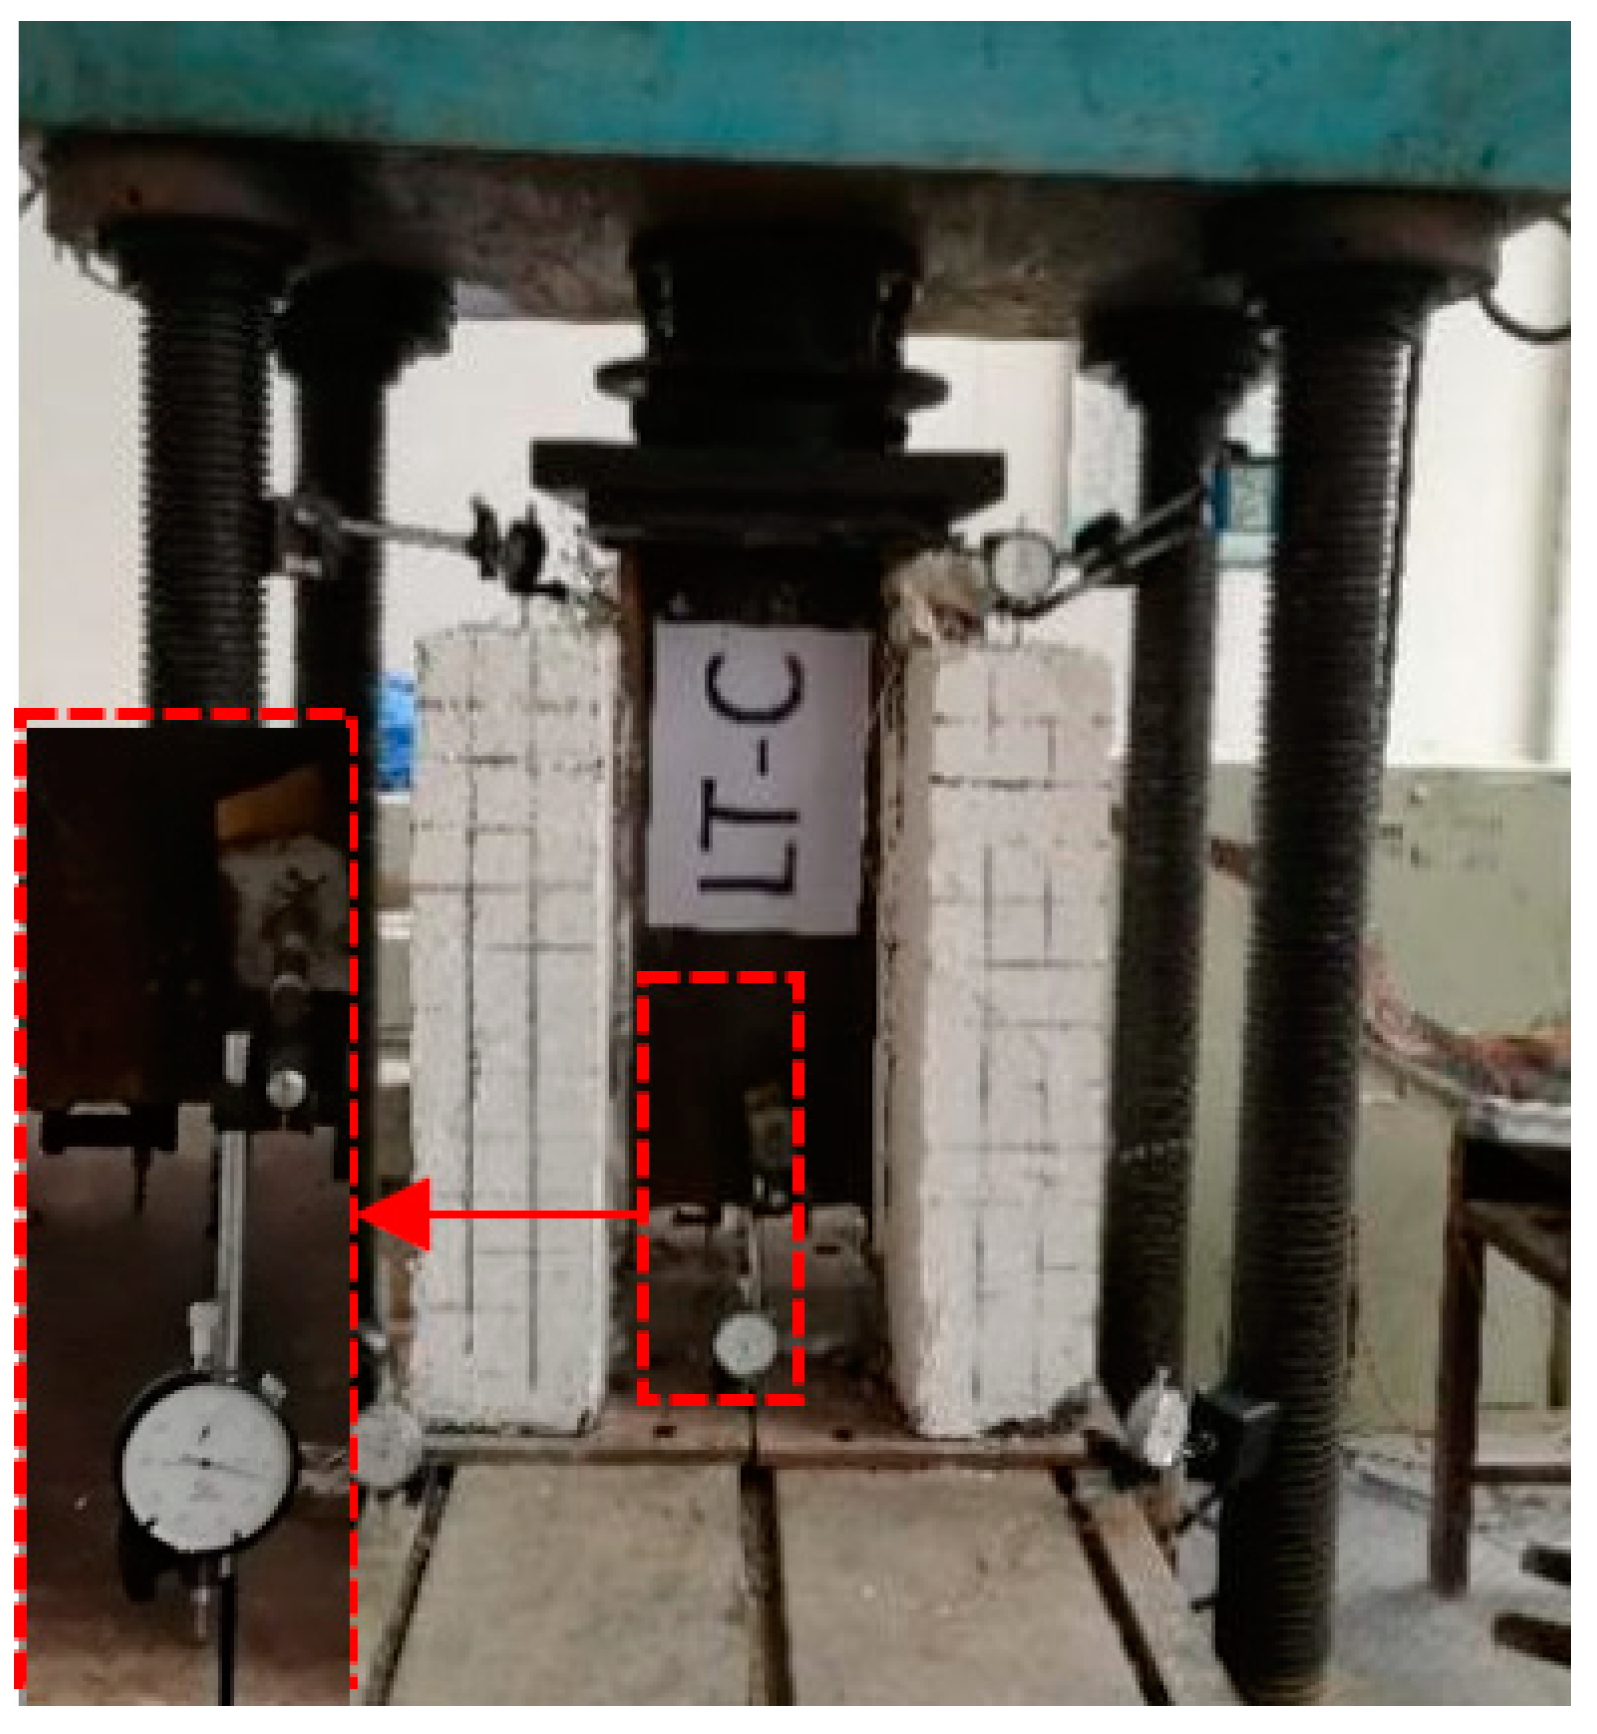
2.1. Experimental Design

To study the shear resistance of the combined arrangement of studs and PBL, five push-out specimens were designed, with reference to Eurocode 4 (EN 1994-2: 2005, Eurocode 4) [32]. They were divided into three groups based on the type of the shear connector: the LT-S group (studs shear connector, one specimen), the LT-P group (PBL shear connector, one specimen), and the LT-C group (composite shear connector with the combined studs and PBL, three specimens).
The polypropylene fiber ceramsite concrete used in the test had a 28-d cube compressive strength of 52.3 MPa and a content of 0.9 kg/m3 (the volume content was 0.1%). The model of the penetrating steel bar was HPB300 and its diameter was 12 mm. Its measured yield strength, ultimate tensile strength, and elastic modulus of the penetrating steel bar were 328, 480, and 209.2 GPa, respectively. Both H-beam and PBL perforated plates consisted of Q235 steel, and their thickness was 16 mm. They had the following measurements: yield strength, 330.9 MPa; ultimate tensile strength, 440 MPa; elastic modulus, 205.7 GPa. The material of the stud was ML15A1 and the diameter of the rod part of the stud was 16 mm. Its measurements were as follows: yield strength, 360 MPa; ultimate tensile strength, 400 MPa; elastic modulus, 205 GPa. The opening of the perforated plate was set to 40 mm.
The structural form of the LT-C (composite shear connector) specimen is presented in Figure 1. Each sample contained four PBL shear connectors and four stud shear connectors. To ensure that the studs as flexible connectors could fully exert their shear resistance when the sample was under compression, the studs in the specimen were arranged in the lower part of the specimen. The PBL shear connectors on the upper layer of the LT-C specimen were replaced with studs, which comprised the LT-S specimen. Similarly, the studs on the lower layer of the LT-C specimen were replaced with PBL shear connectors, which comprised the LT-P specimen. (See Table 1).
As displayed in Figure 2, a 2000 kN electrohydraulic servo pressure testing machine is used for loading. Three preloads were conducted before the official loading (the loading step was 20 kN. During preloading, after loading to 60 kN, it was unloaded to 0 kN, and the loading rate was 0.5 kN/s). After preloading, monotonic hierarchical loading was employed for the formal loading. First, the loading level distance was set to 1/10 of the limit load, which was calculated using the finite element method. Moreover, the sample was loaded to 80% of the calculated limit load value, step by step (loading rate was 1 kN/s) in accordance with this loading level distance. The loading level distance was then set to 20 kN (0.2 kN/s), and the sample was loaded to the measured value of the limit load. Finally, loading continued after this and the test was terminated when the load was reduced to 85% of the actual ultimate load, or the sample was unloaded after the appearance exhibited obvious damage. The data of dial indicators were recorded, and the development of cracks was observed after each level of loading was stable for 3 min.

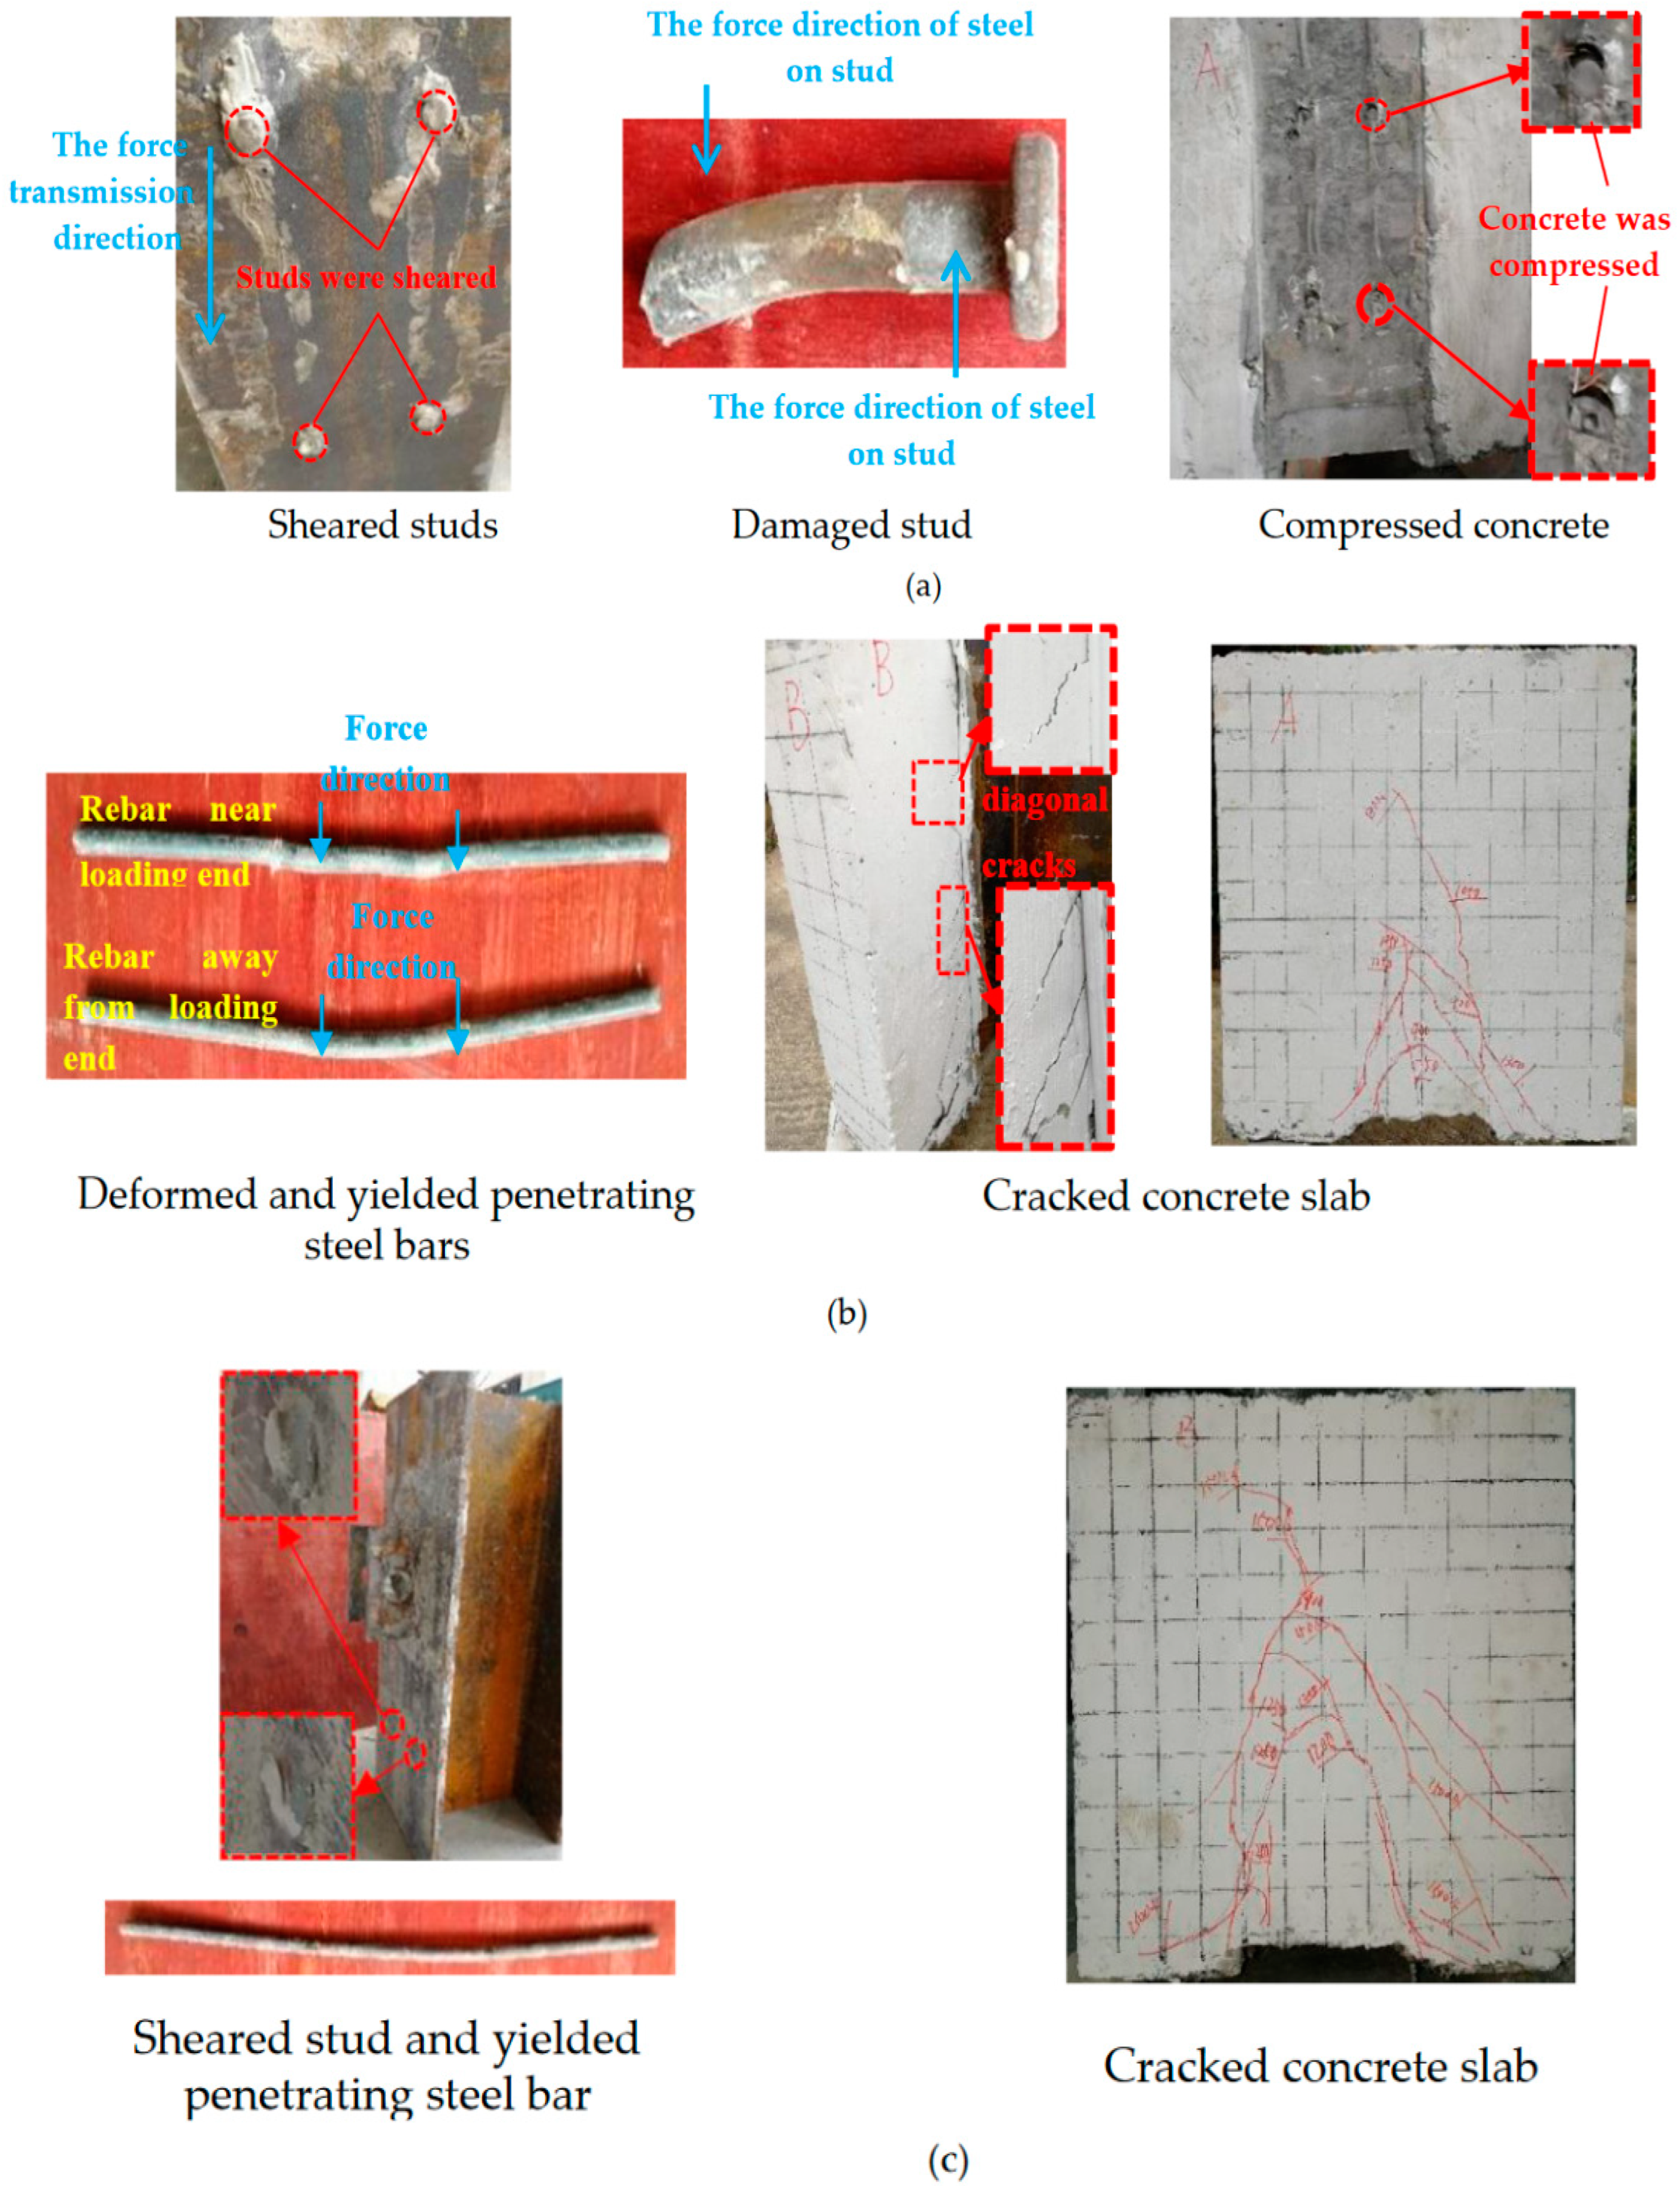
2.2. Experimental Phenomena

The test demonstrated that the three types of shear connector specimens included the three working stages: elasticity, plasticity, and failure. At the initial stage of loading, small relative displacement was present between the H-beam and the concrete slab. The load increased substantially and varied linearly with the relative slip value. Diagonal cracks in concrete slabs were small in width and short in length and developed slowly. After the elastic phase, the relative slip value of the specimen and the load increment exhibited a nonlinear behavior. Meanwhile, the width and length of the diagonal cracks continued to increase. The loading progressed gradually, but the relative slip value increased rapidly, and both again exhibited a linear change. In addition, vertical cracks appeared, and each crack developed rapidly to penetrate the entire specimen in the height direction until a loud “bang” was heard from the specimen. Concrete spalling, concrete slab and H-beam detachment, and specimen and loading equipment shaking then occurred. The three types of shear connector specimens ultimately demonstrated different damage phenomena.
Figure 3 presents in detail the failure of the push-out specimen. The studs on one side of the LT-S specimen were sheared from the root, and those on the other side exhibited plastic deformation. Moreover, the studs on both sides indicated large plastic deformation at the root in the H-beam direction. The concrete under the studs was compressed, leading to plastic deformation, and fine cracks were observed at the bottom of the concrete slab. When the LT-P specimen was damaged, no apparent deformation of the perforated plate occurred, and the concrete tenon in the hole was crushed. In addition, the penetrating steel bars between the PBL shear connectors were deformed and yielded in the H-beam direction, and grooves appeared in the corresponding part of the PBL. The bottom of the concrete slab was also crushed. The studs of the LT-C group were broken at the root or had major plastic deformation. The concrete around the studs had plastic deformation, and the concrete tenon was crushed. Similarly, the penetrating steel bars exhibited plastic deformation, and the bottom of the concrete slab was crushed.

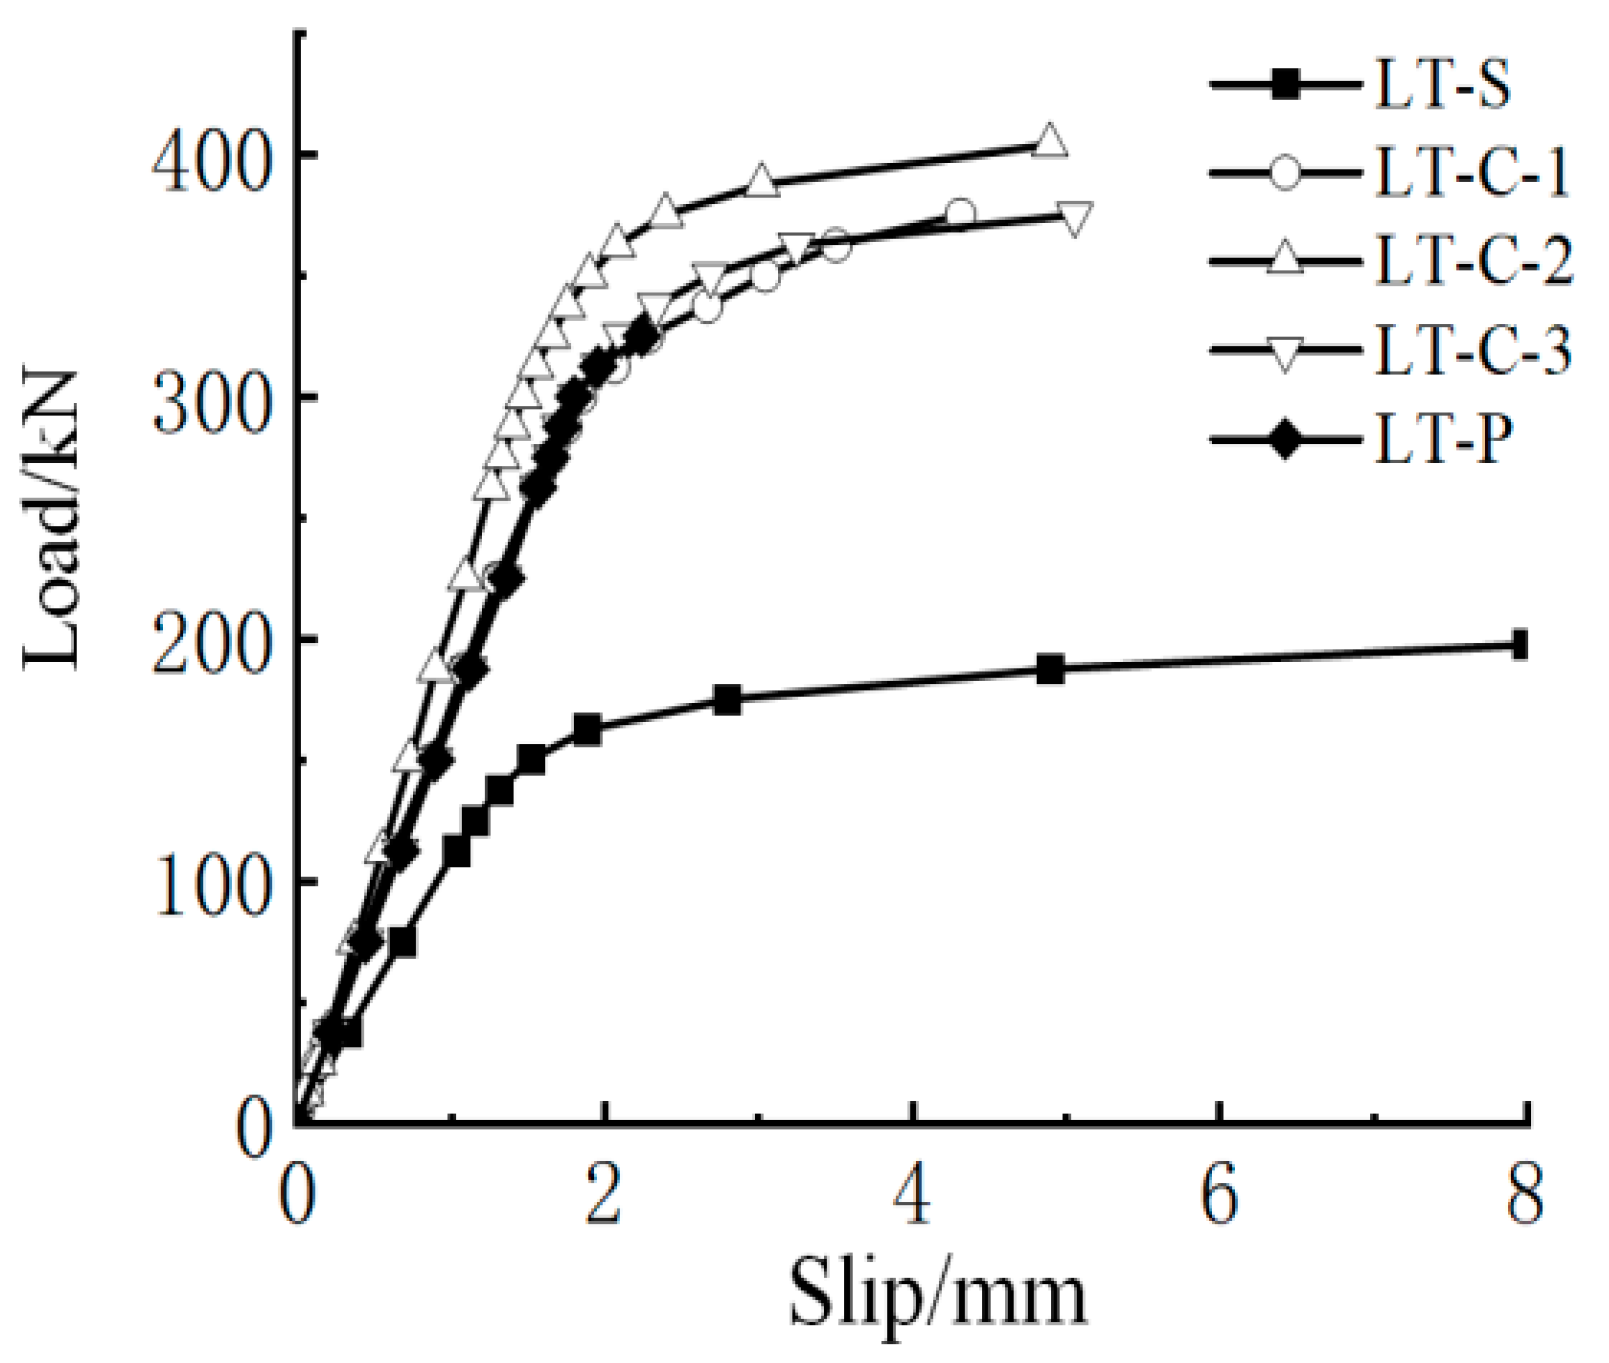
2.3. Experimental Results

Table 2 listed the shear bearing capacity of the specimens.
As listed in Table 2, the measured shear bearing capacities of LT-S and LT-P are 197.3 and 325.0 kN, respectively. By superimposing the bearing capacity of a single stud and a single PBL, (Pu, LT-S + Pu, LT-P)/2 = 261.2 kN (1 stud + 1 PBL)—that is less than the average shear capacity of LT-C (384.7 kN). This observation indicates the high shear resistance of the LT-C shear connector. The shear bearing capacity of LT-C was 18.4% higher than that of LT-P. The reason might be attributed to the high strength of the PBL shear connector. In addition, the concrete at the bottom of the perforated plate was in a state of concentrated stress, rendering it prone to cracking. Consequently, the effective bearing area of the concrete slab was reduced. Therefore, the shear bearing capacity of the specimen was decreased [9]. However, the flexible studs in LT-C could relieve the stress concentration of the rigid PBL to a certain extent to fully use the advantages of both the PBL and studs. This finding also suggests that the shear connector composed of studs and PBL could be better combined with the concrete slab and achieve the optimal performance of both the shear connector and the concrete slab.
Figure 4 illustrates the load–slip curve measured in the test. Only the load–slip curves of the samples in the elastic and plastic working stages were generated because of limitations to the equipment. The plastic stage of LT-S was the longest, followed by that of LT-C, and that of LT-P was the shortest. This reveals that under the condition of certain concrete strength, replacing the lower perforated plate with studs could improve the deformation performance of the push-out specimen. In the elastic stage, the stiffness of LT-S was significantly lower than that of LT-P, whereas the stiffness of the three LT-C specimens was similar to that of LT-P. It could be observed that the LT-C specimens were superior to the LT-P specimen in shear bearing capacity and ductility. However, they still had the same level of stiffness as that of LT-P.
After comprehensive analysis of the shear bearing capacity and deformation capacity of the three specimens, it was discovered that the composite shear connectors could improve the integrity of the concrete slab, and we also made full use of the flexibility of the stud and the rigidity of the PBL shear connector to improve the interface force performance. This made the LT-C specimen have the highest shear bearing capacity and stiffness while keeping an excellent deformation capacity.

3. Push-Out Experimental Finite Element Numerical Simulation

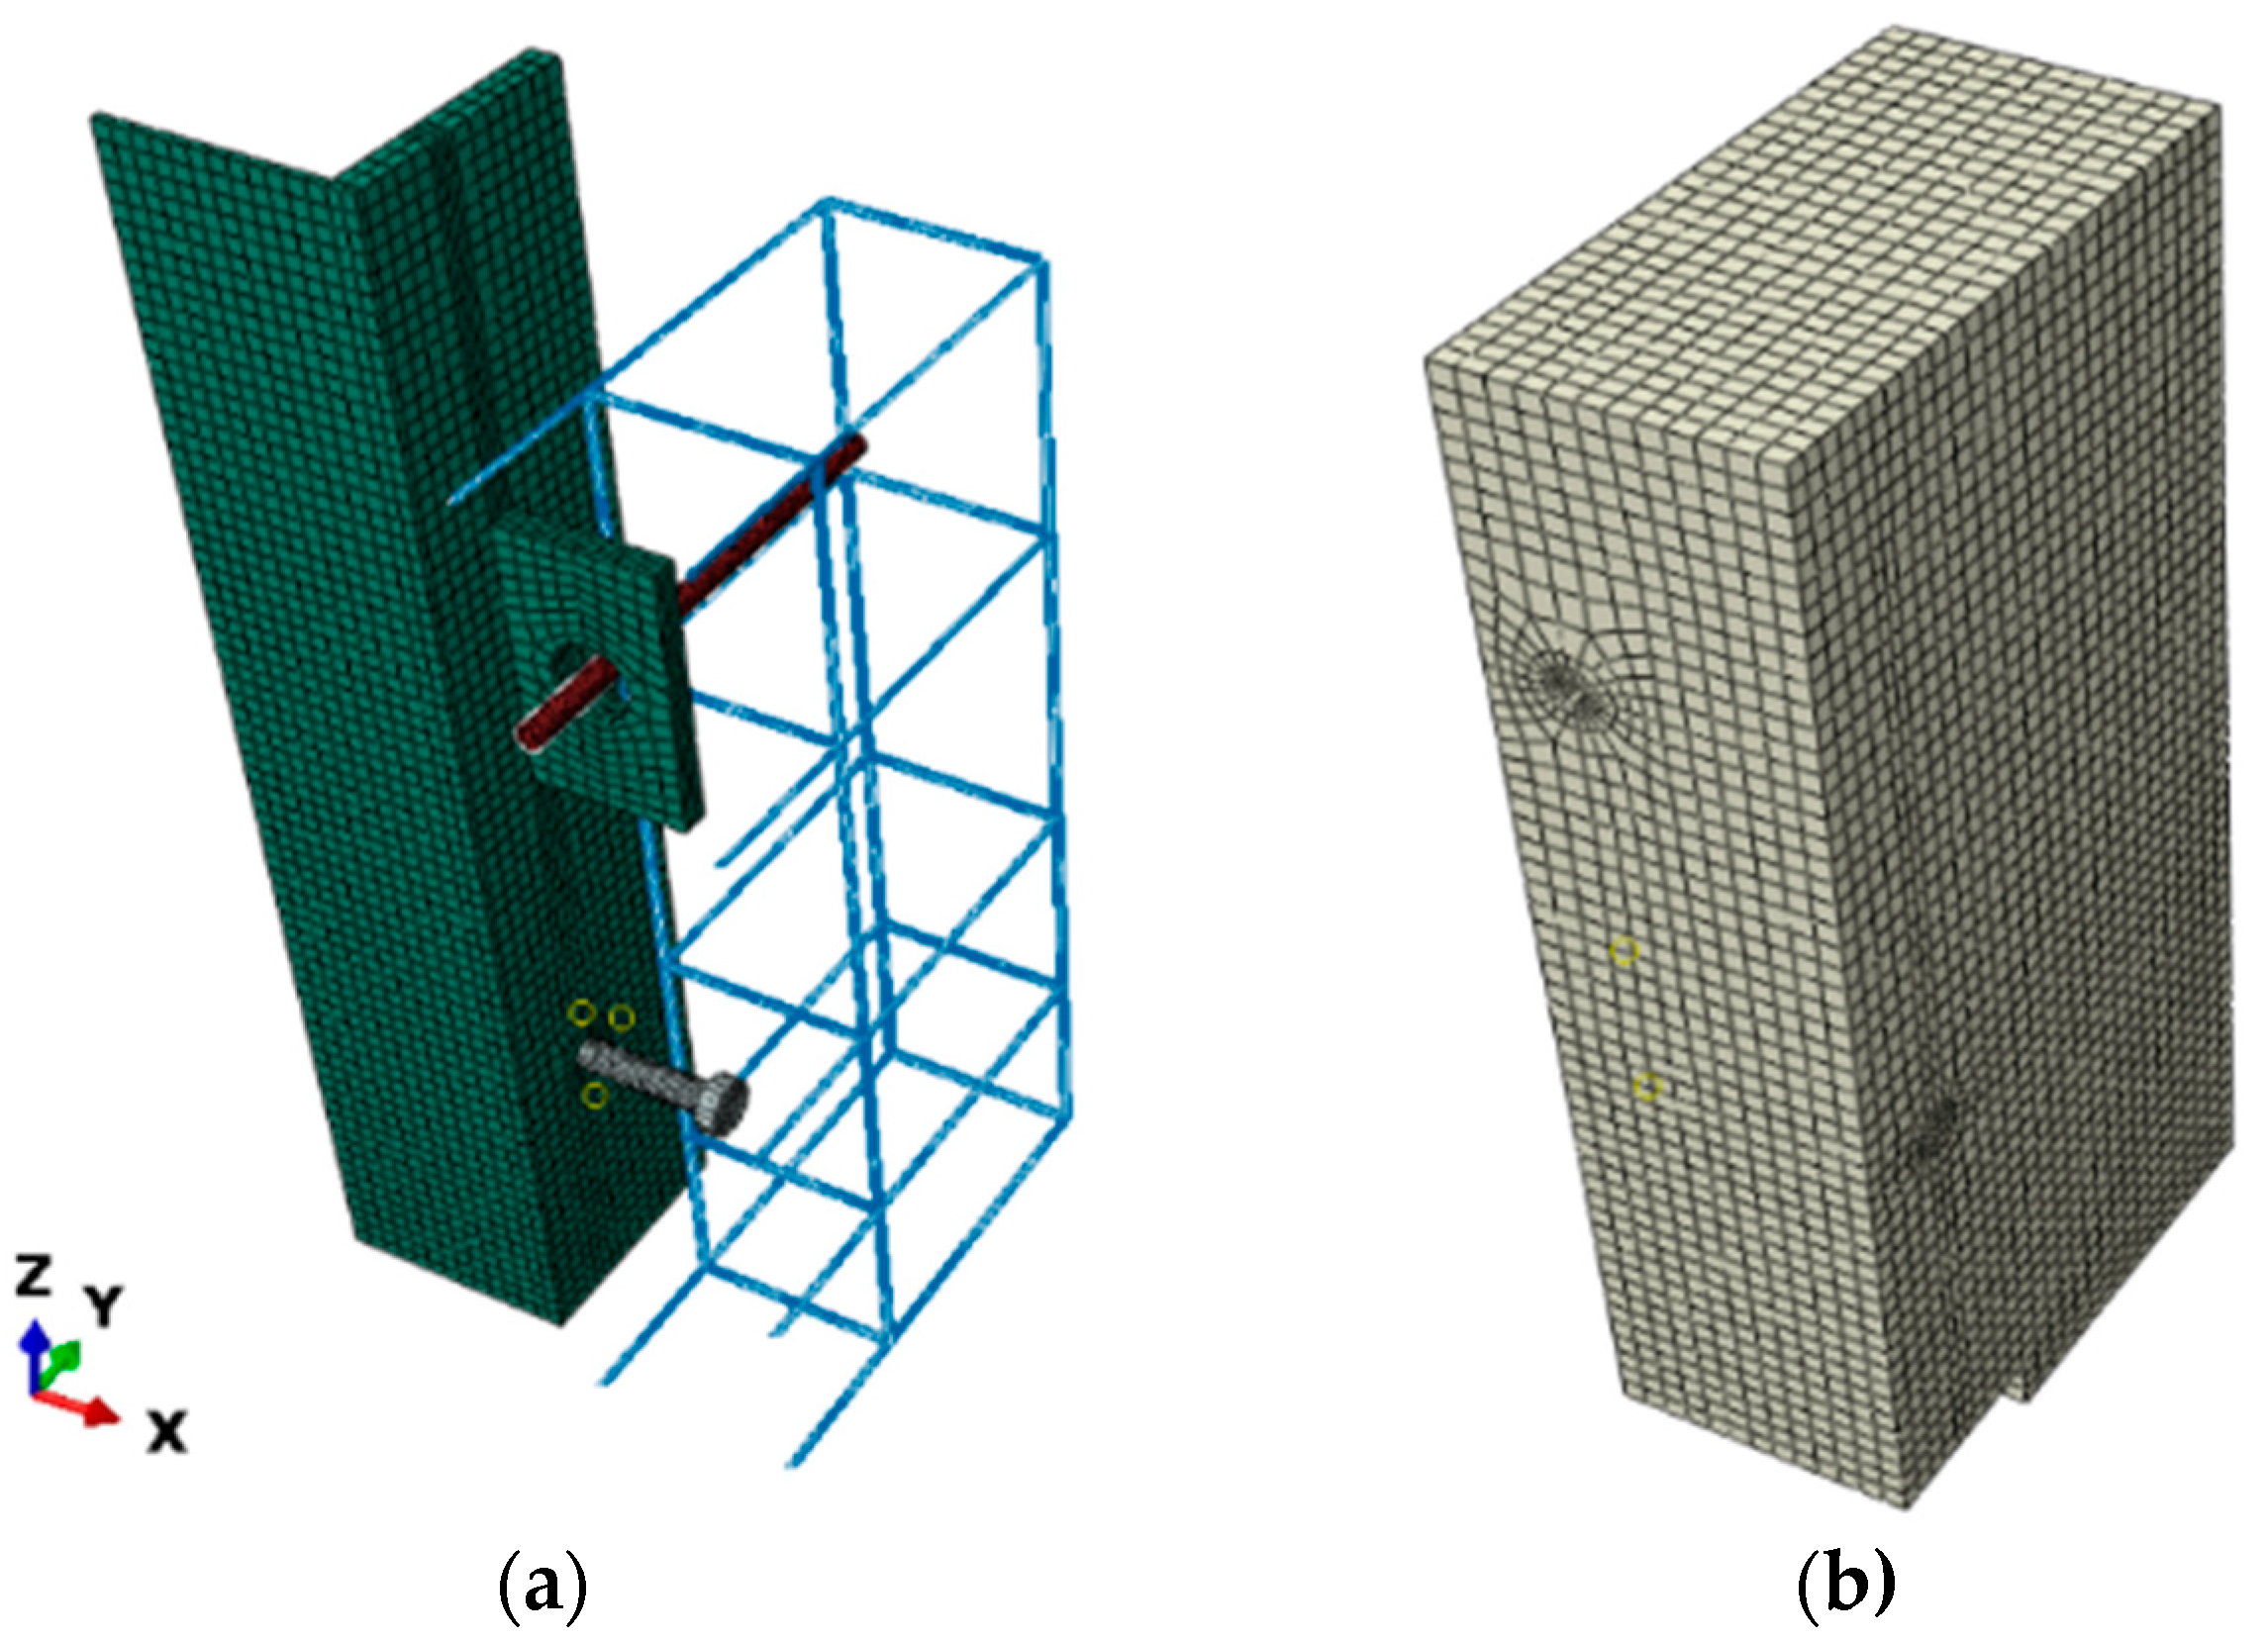
3.1. Overview of the Finite Element Model

As shown in Figure 5, a 1/4 model was established based on the actual size of the test sample, including H-beam, concrete slab, PBL shear connector, stud, penetrating steel bar, and rebar cages.
(1)
Material constitutive model
The plastic damage model was selected as the concrete material model in the Abaqus finite element software. Polypropylene fibers have previously been proven to strongly influence the control parameters of the descending section of the concrete stress–strain curve section [33,34]. Therefore, the stress–strain relationship of the concrete used in the test adopted the formula suggested by Ding [35], and the Poisson’s ratio was taken as 0.2. Moreover, the damage factor was obtained by referring to the calculation method previously studied [36].
The stress–strain relationship of H-beam, the PBL shear connector, the penetrating steel bar, and the rebar cage adopted the tri-polyline model, and that of the studs used the double-line model. In addition, the elastic modulus used the measured value in Section 2.1, and Poisson’s ratio was calculated as 0.3. All of the above used the von Mises yield surface to define isotropic yielding.
(2)
Element type and mesh division
The H-beam, PBL shear connector, stud, concrete slab, and penetrating steel bar were simulated using the 3D eight-node reduced-integration element (C3D8R). The rebar cage was simulated using the 3D two-node truss element (T3D2). The size of the seeds was 10 mm. The meshes in the contact areas of different components were refined and divided.
(3)
Interaction and boundary conditions
Bond contacts were applied between the penetrating steel bar and the surrounding concrete. The rebar cage was placed inside the concrete slab. The H-shaped steel was combined with stud shear connectors and PBL shear connectors to form a component. General contact was also used to simulate contact with concrete. The contact property was normal “hard” contact, and tangential friction was simulated using the penalty function.
Two symmetric surfaces of the model were positive symmetric constraints. After the top surface of the H-shaped steel was fixed (the actual test was the upward loading force on the bottom platform of the sample, and the simulation was consistent with the test), an upward displacement load was applied on the bottom surface of the concrete.

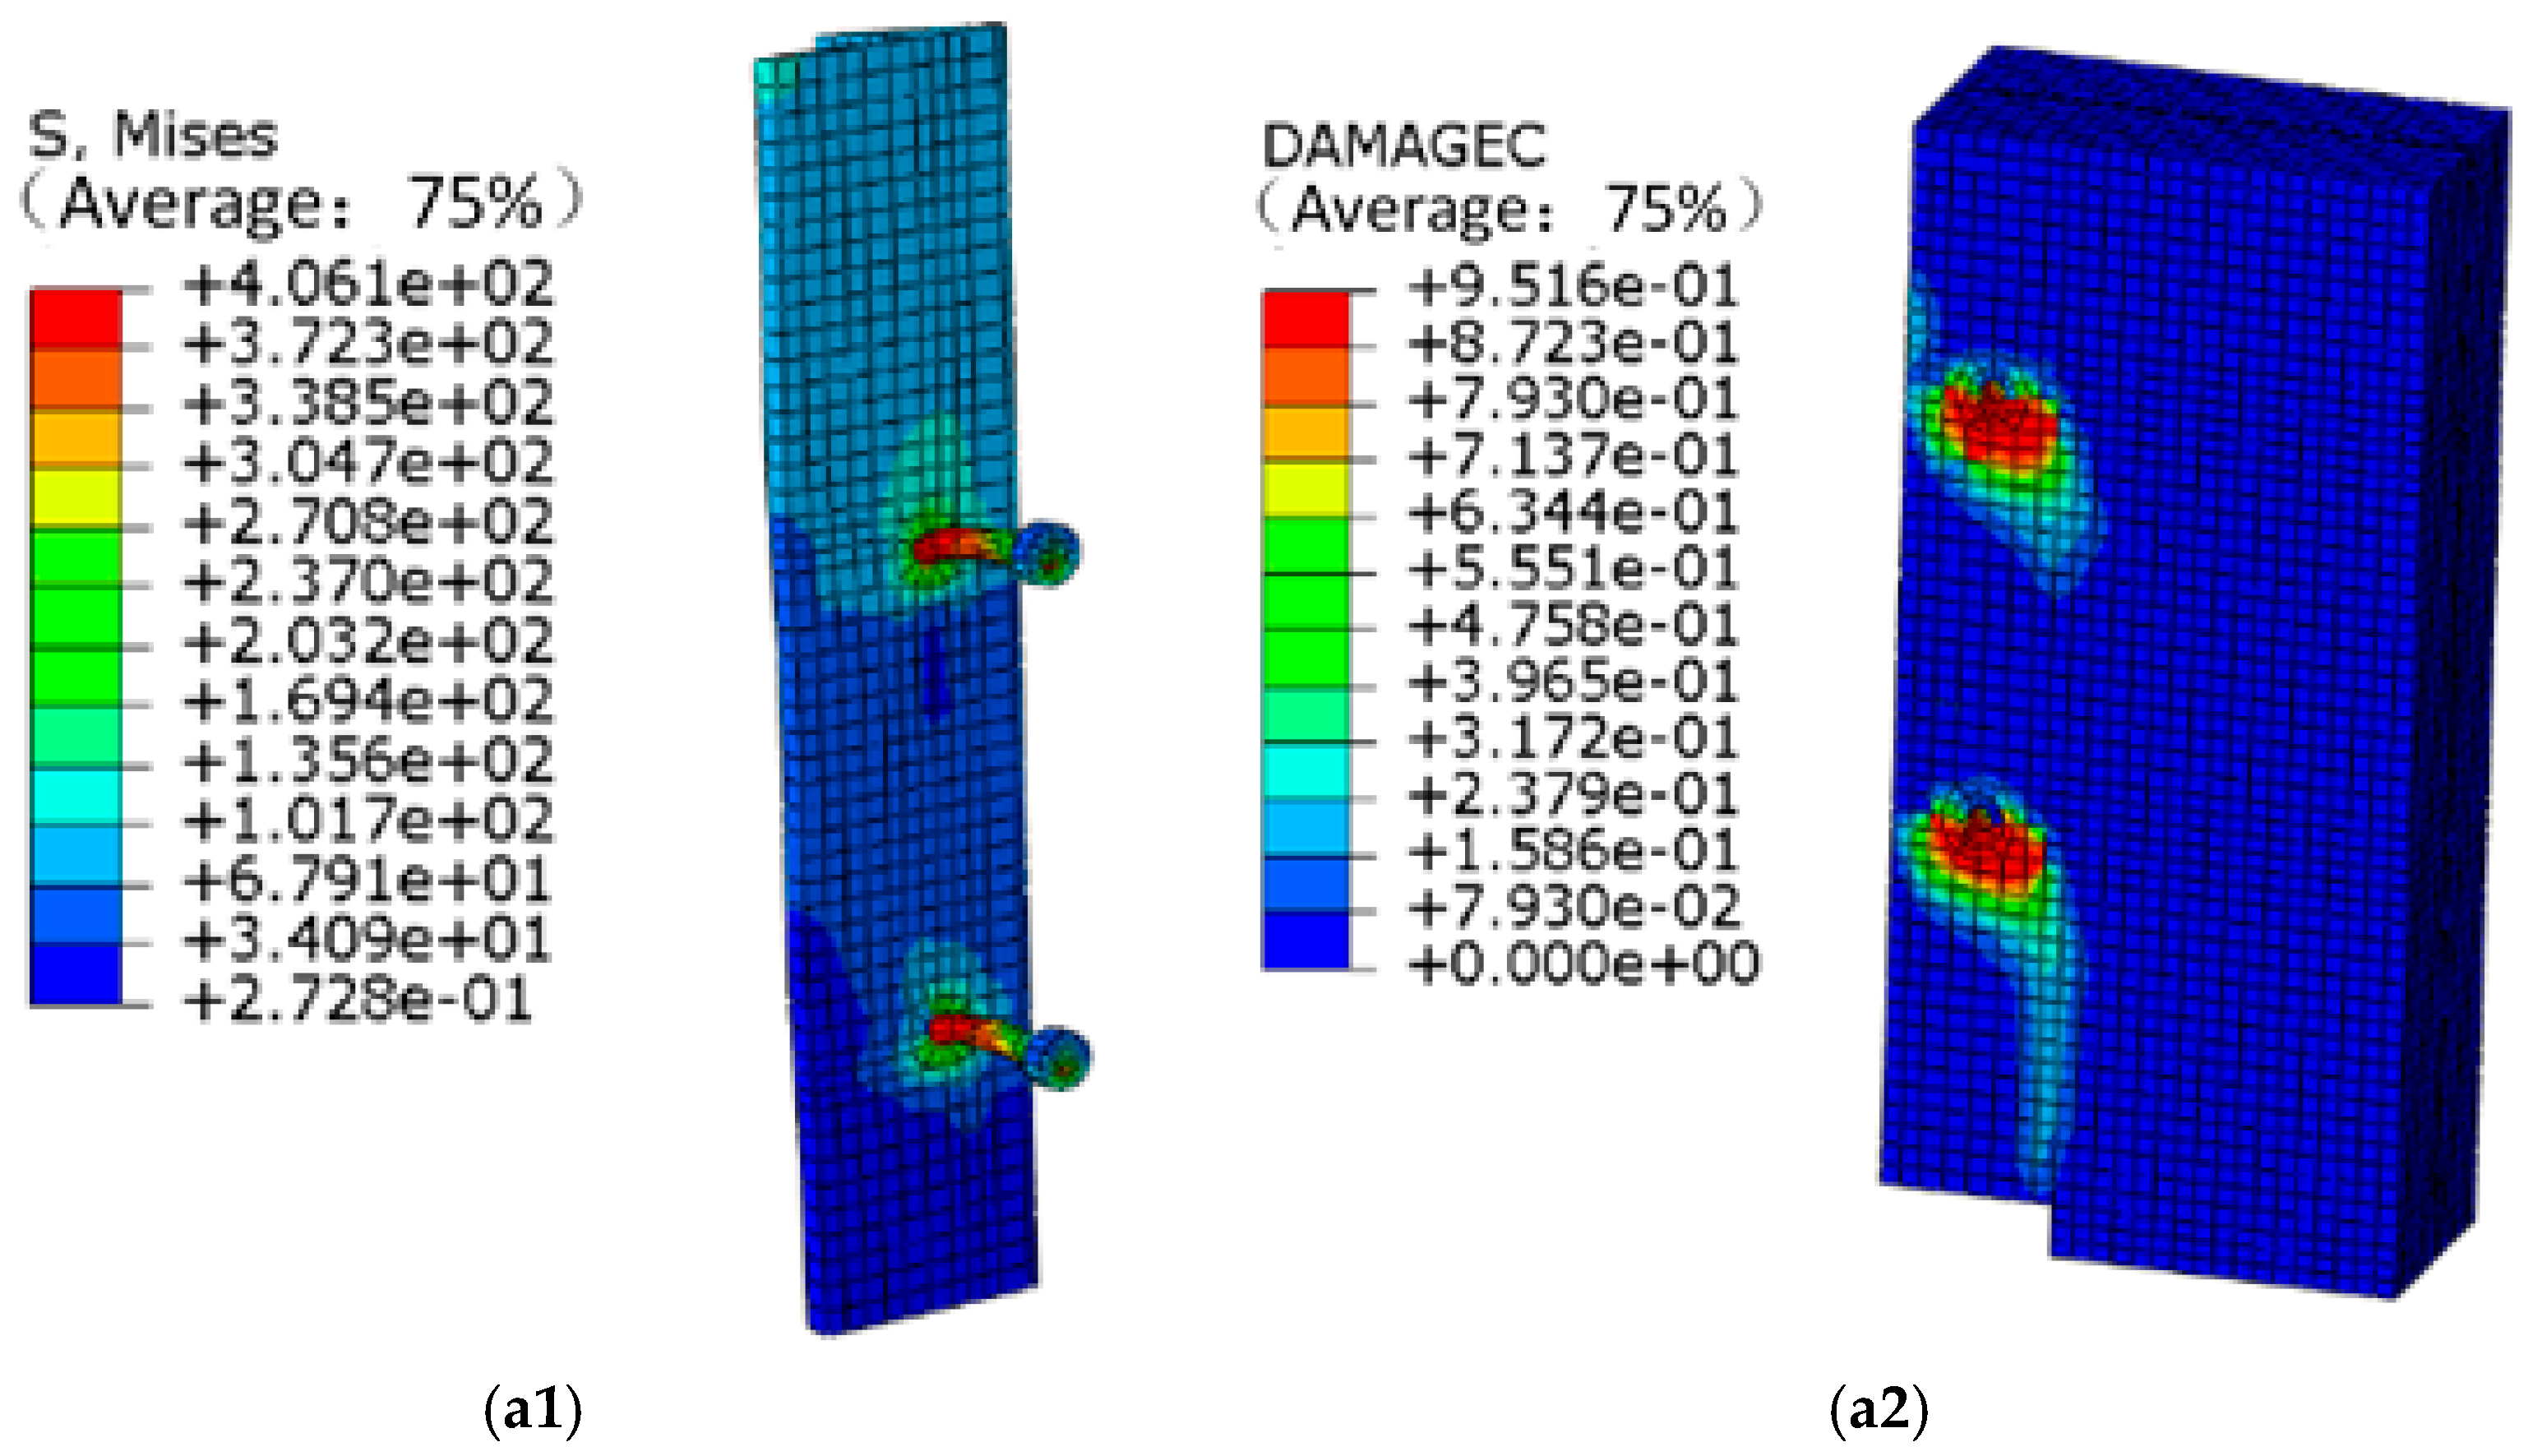
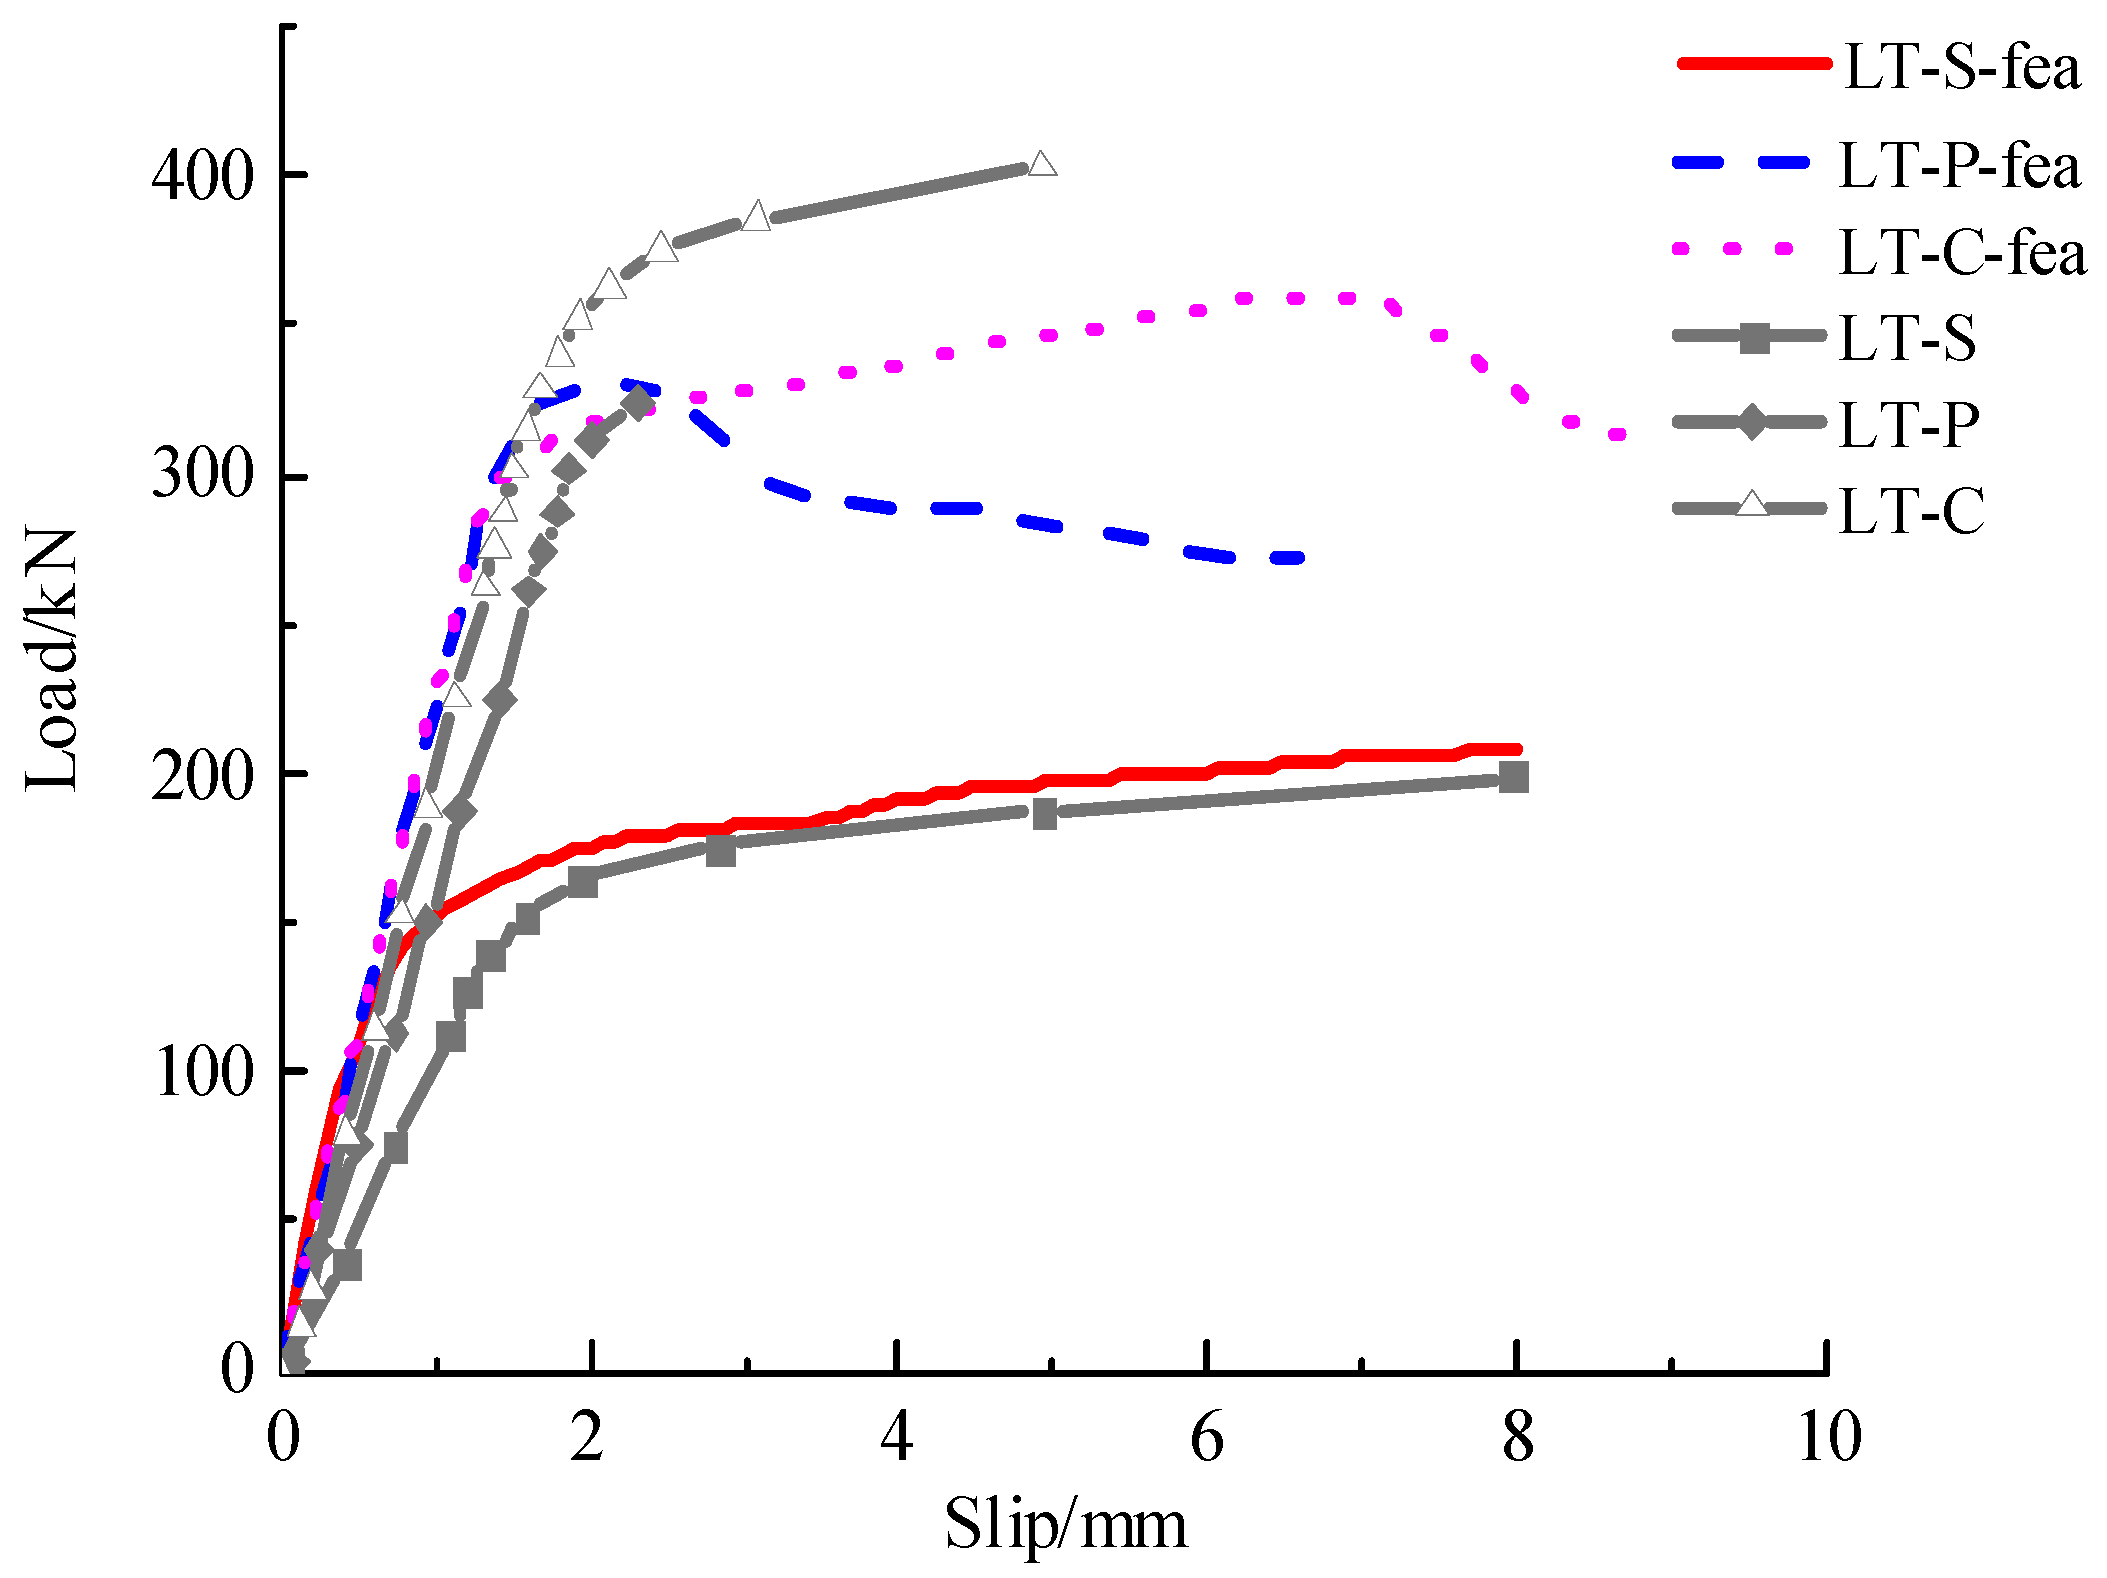
3.2. Analysis of Finite Element Results

Figure 6 indicates the failure mode of the finite element simulation of the samples, including the von Mises stress diagram of the steel member and the damagec and damaget diagrams of the concrete when the specimen reached the shear bearing capacity. The von Mises stress illustration indicates the following: (i) Among the three types of shear connectors, the stud root had the largest stress, which was consistent with the stud in Figure 3. (ii) The stress level of PBL steel plate was small, and practically no significant deformation occurs. (iii) The penetrating steel bar located within the PBL opening indicated the largest stress, which was consistent with the larger yield bending deformation of the penetrating steel bar in the test. The illustrations of damagec (LT-S specimen) and damaget (LT-P and LT-C specimens of the concrete) indicate that the concrete around the studs has different degrees of compressive damage. However, the concrete at the bottom of PBL was mostly damaged by tension. These were consistent with the failure modes such as plastic deformation of the concrete near the studs due to compression, and cracking of the concrete slab in the test. The above demonstrated that the failure modes of the samples simulated by the finite element were consistent with the test results.
Figure 7 presents the load–slip curves of the five specimens in Table 2, which were generated by finite element simulation. The rising stage of the simulated curve roughly resembled the experimental curve. Moreover, the curve variation conditions of the descending section were obtained by the element simulation. After the peak load was reached, the LT-P sample immediately entered the descending stage. In this stage, with the increase of the slip value, the load value displayed a tendency of first accelerating down and then decelerating down. However, the LT-C specimen did not enter the decreasing phase immediately after reaching the peak load; it entered the holding stage first. In this stage, the load changed very slowly with the slip value, and the decreasing trend was not obvious. The decreasing stage of LT-C specimen was similar to that of LT-P.
The EC4 specification stipulates that the slip value corresponding to 0.9 Pu in the descending section of the load–slip curve of the shear connector is the slip characteristic value. The characteristic slip value of the composite shear connector exceeded 6 mm, as stated in the specification, which could be determined easily from Figure 7. Therefore, the composite shear connector had good deformation ability.
The shear bearing capacity results of the specimens obtained from the test and the finite element simulation (Table 2) illustrated that the composite shear connector possessed the highest shear bearing capacity, followed by the PBL shear connector and then by the stud shear connector. For the PBL shear connector specimen, the ratio of the finite element result to the test result was 1.03; for the stud shear connector specimen, the ratio was 1.05; and for the composite shear connector specimens, the ratio was 0.90–0.97. Therefore, the correlation between the simulated and measured values is excellent.
With the failure mode, load–slip curve, and shear bearing capacity of the specimen considered, the finite element simulation was consistent with the experimental phenomenon and results. Thus, finite element simulation was a feasible tool to reveal the force mechanism of the composite shear connector and conduct parametric analysis.

4. Finite Element Parameters Analysis

4.1. Parameters Design of Orthogonal Test Analysis Model

A total of 49 finite element models were established to evaluate the effects of different connector structures and different material parameters on the shear resistance of the specimens. According to existing research, the structural parameters set in this paper included the stud diameter, perforated plate opening diameter, perforated plate thickness, penetrating steel bar diameter, and concrete strength. Although the laws and mechanisms of the above parameters on the shear capacity of shear connectors have been revealed, they were for PBL shear connectors or stud shear connectors. For stud–PBL composite shear connectors, the above parameters were set in one member at the same time, and the effect on the shear resistance of the member would be variable and unclear, which was valuable to study. The first four factors were used to design nine groups of orthogonal experiments with four factors and three levels. In addition, the finite element analysis of changing a single parameter in the same finite element model (RP-C52.3) as the test sample construction was added. Table 3 lists the results of the finite element parametric analysis.

4.2. Analysis of the Orthogonal Test Simulation Results

With the C50 concrete grade as an example, the results in Table 3 were analyzed using the orthogonal test results of the experiment (4 factors, 3 levels).
As displayed in Table 4, Kij is the sum of Pu corresponding to the level of factor i in column j, and κij = Kij/3. The optimal solution of each column of factors could be determined by analyzing the magnitude of κij. Moreover, combining them yielded the optimal combination. Thus, the optimal structure of the composite shear connector was ds19-D50-t24-d16, which was obtained easily. Among them, the range Rj denotes the difference between the maximum value and the minimum value in the jth column factor, which can reflect the change in Pu when the level of the jth column factor changes. Rj in Table 4 indicates that the thickness of the perforated plate affects Pu the most, whereas the diameter of the opening influences Pu the least.
The results of the variance analysis indicate that the test could be used to assess for significance. All columns of this orthogonal table contain factors; thus, the sum of the squared deviation Sj of the factors in the second column is regarded as the sum of the squared deviations of the errors Se. fj is the degree of freedom of the jth column factor, and fj is equal to the number of levels of the j factor minus 1. The ratio F of the variance of each column factor could also be calculated. The factors could then be tested for significance F~Fα(fj/fe).
The results in Table 4 indicate that F3 > F1 > F4 > F0.10 (2,2) = 9.00, indicating that the thickness of the perforated plate, the diameter of the stud, and the diameter of the penetrating steel bar significantly affect shear capacity at α = 0.10. Among the parameters, the thickness of the perforated plate has the greatest influence on the shear bearing capacity, followed by the diameter of the stud and then by the diameter of the penetrating steel bar.

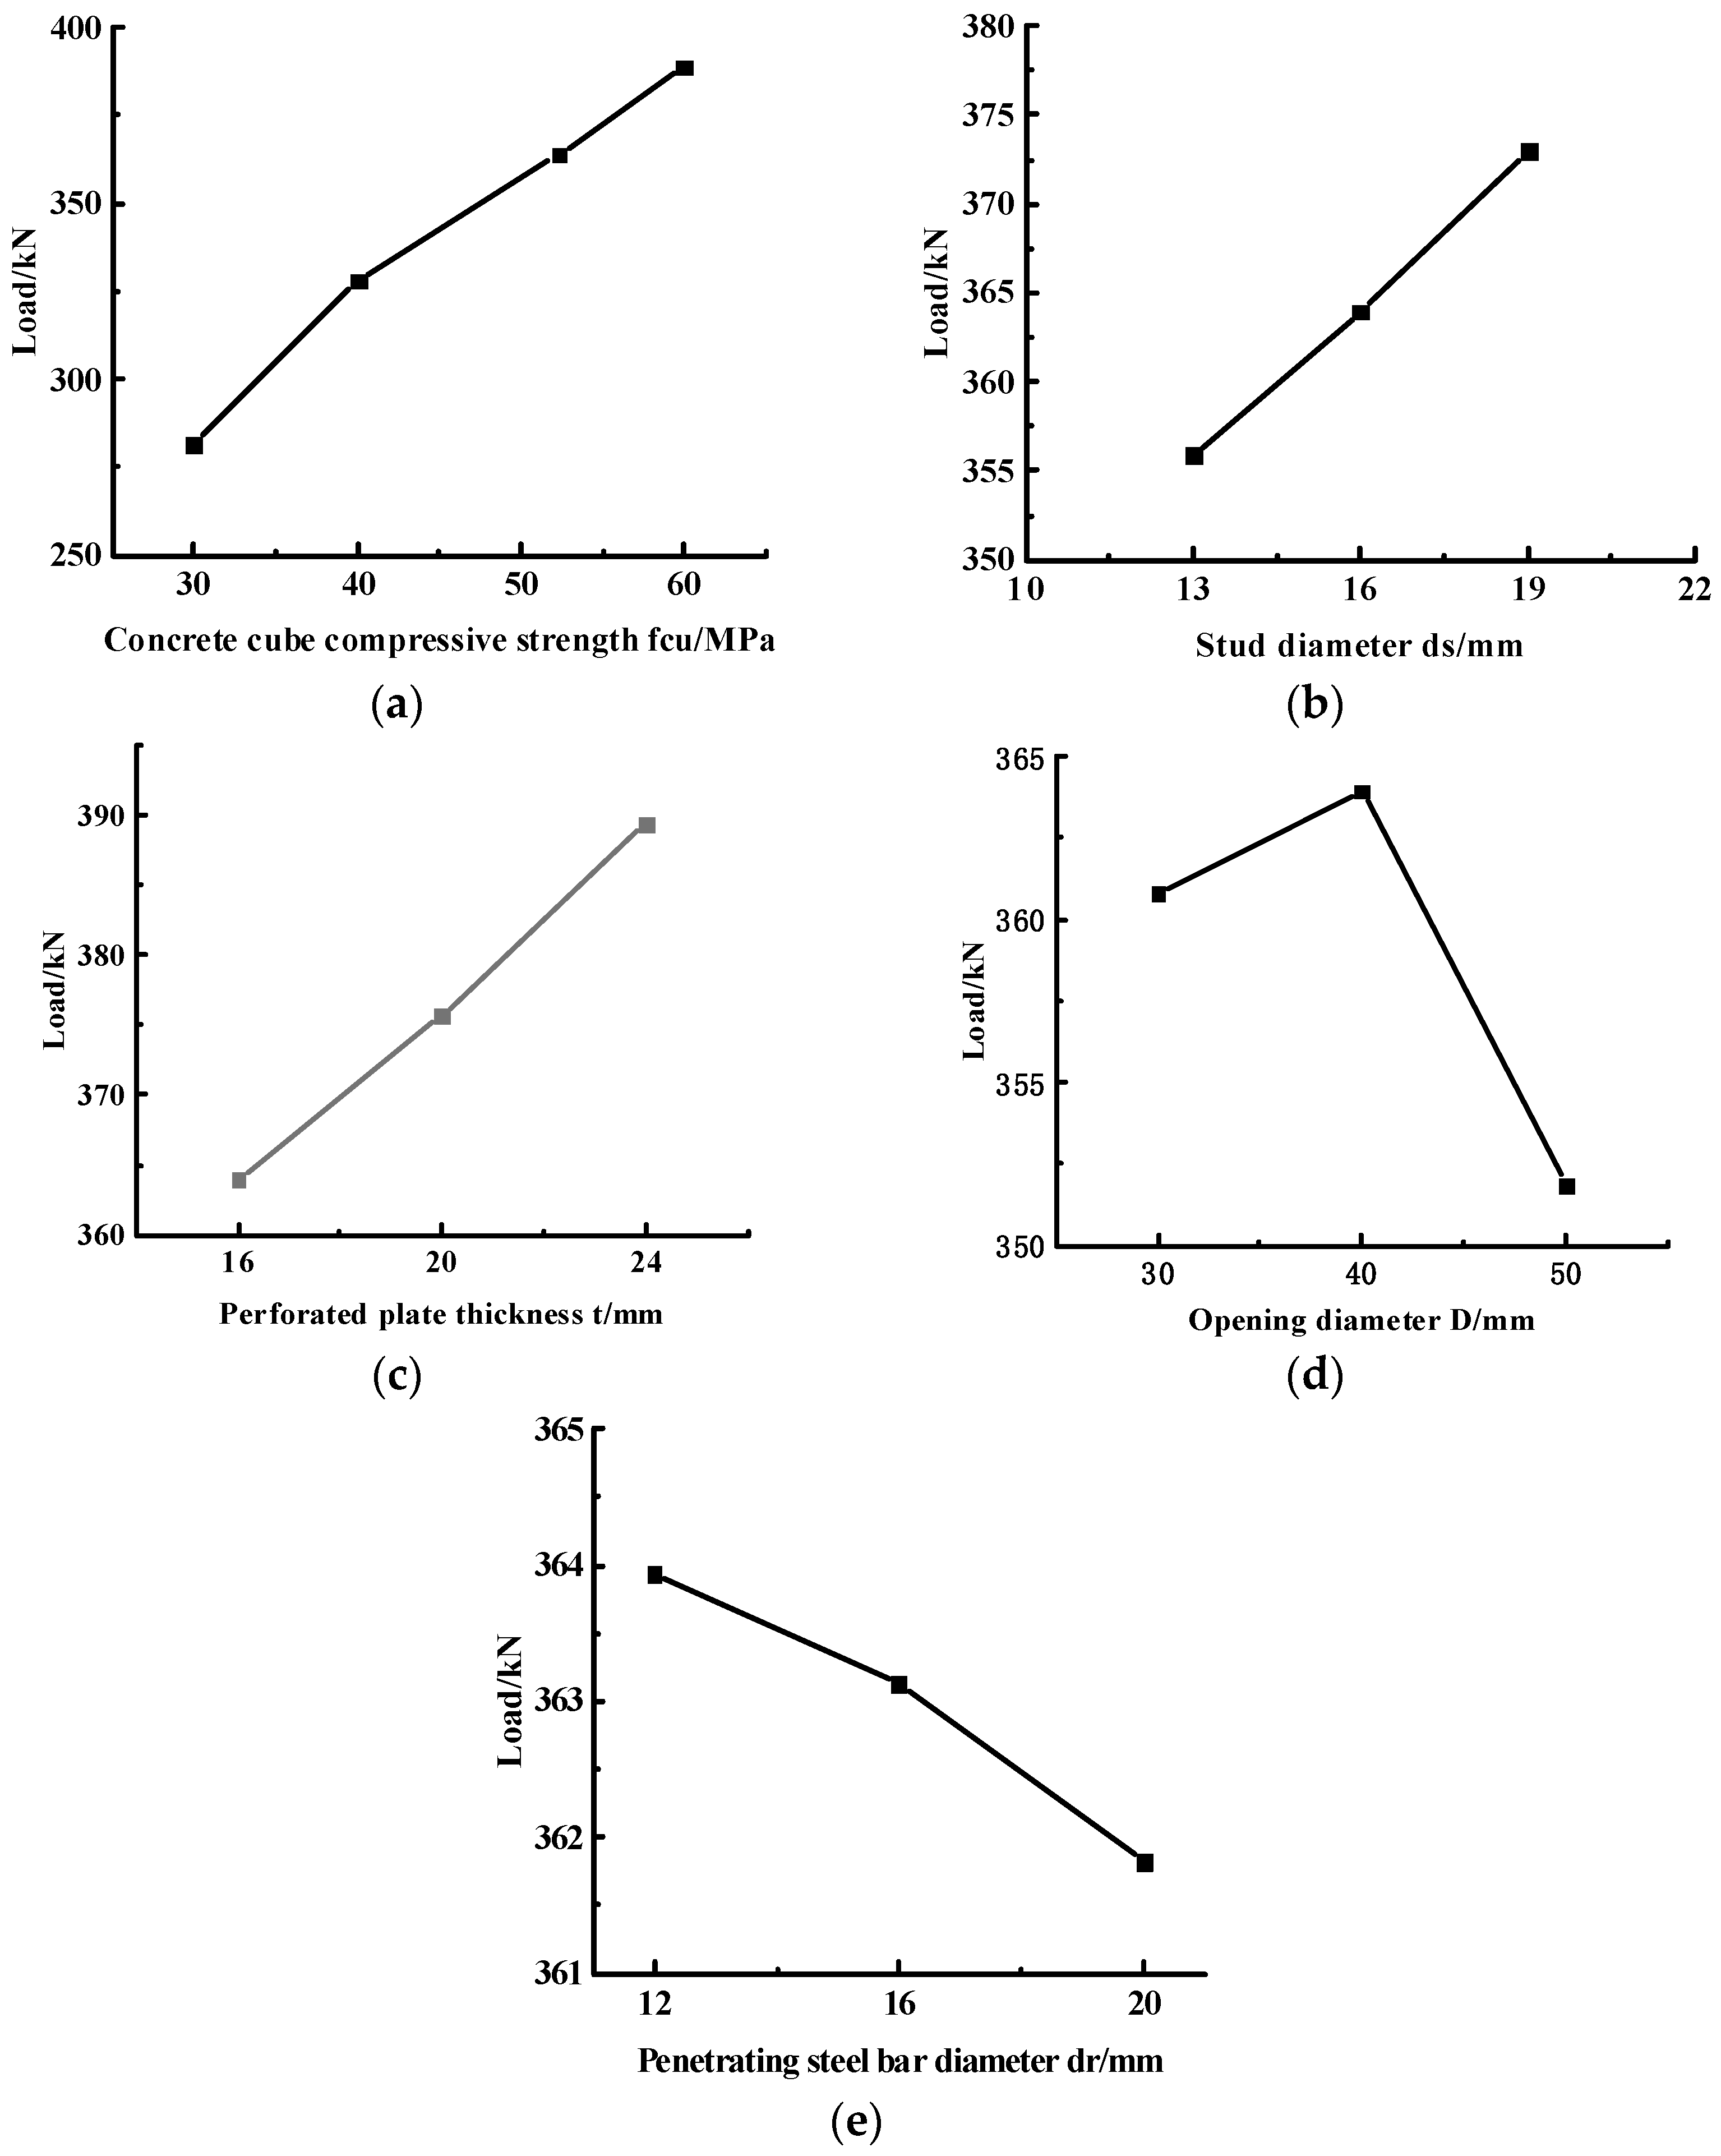
4.3. Analysis of the Influencing Factors on the Shear Bearing Capacity of Composite Shear Connectors

By further parameter analysis of the model, the influencing factors of the shear bearing capacity of the composite shear connector were identified (Figure 8).
(1)
Influence of the strength of the concrete
The shear bearing capacities of the specimens RP-C30, RP-C40, RP-C52.3, and RP-C60 were 281.6, 327.93, 363.93, and 388.74 kN, respectively (Table 3 and Figure 8a). These results indicate that increasing the compressive strength of the concrete could improve the shear bearing capacity of the composite shear connector. When the concrete strength was increased from 30 to 52.3 MPa, the shear bearing capacity improved by about 29.2%.
(2)
Influence of the diameter of the stud
The shear bearing capacities of the specimens LT-ds13-C52.3, RP-C52.3, and LT-ds19-C52.3 were 355.88, 363.93, and 372.94 kN, respectively (Table 3 and Figure 8b). These results indicate that increasing the diameter of the stud could improve the shear bearing capacity of the composite shear connector. When the diameter of the stud was increased from 13 mm to 19 mm, the shear bearing capacity improved by about 4.8%.
(3)
Influence of the thickness of the perforated plate
The shear bearing capacities of the specimens RP-C52.3 and LT-t24-C52.3 were 363.93 and 389.41 kN, respectively (Table 3 and Figure 8c). These results reveal that increasing the thickness of the perforated plate could improve the shear bearing capacity of the composite shear connector. When the thickness of the perforated plate was increased from 16 mm to 24 mm, the shear bearing capacity improved by about 7%.
(4)
Influence of the diameter of the opening
The bearing capacities of the specimens LT-D30-C52.3, RP-C52.3, and LT-D50-C52.3 were 360.78, 363.93, and 351.84 kN, respectively (Table 3 and Figure 8d). These results indicate that increasing the diameter of the opening could improve the shear bearing capacity, but an excessively large diameter could exert adverse effects. The reason was that increasing the diameter could enlarge the shear bearing area of the concrete tenon, thereby improving the shear bearing capacity. However, if the opening was too large, the strength of the perforated plate would decrease, reducing the shear bearing capacity.
(5)
Influence of the diameter of the penetrating steel bar
The shear bearing capacities of the specimens RP-C52.3, LT-dr16, and LT-dr20 were 363.93, 363.12, and 361.82, respectively (Table 3 and Figure 8e). This demonstrated that increasing the diameter of the penetrating steel bar exerted no noticeable effect on the shear bearing capacity. The reason was that the shear bearing area of the concrete tenon in the hole would decrease with an increase in the diameter of the penetrating steel bar under the premise of a constant opening diameter; however, both the shear resistance of the concrete tenon and the flexural resistance of the penetrating steel bar could influence the shear bearing capacity of the specimen.
Based on the aforementioned analysis results, it can be observed that the concrete strength had the greatest influence on the shear bearing capacity, followed by the thickness of the perforated plate. When the concrete strength was constant in the actual project, it was the key to controlling the thickness of the perforated plate considering the structure of the composite shear connector.

5. Calculation Formula for Shear Resistance

The composite shear connector consists of studs and PBL shear connectors. The longitudinal shear resistance consists of the following parts: the dowel action of the concrete tenon in the hole of the perforated plate and the penetrating steel bar, the bearing effect of the bottom of the perforated plate, and the mechanical engagement of the stud. More research and theoretical analyses regarding these two shear connectors has been conducted by domestic and foreign scholars.
First, the “Code for Design of Steel-Concrete Composite Bridges” (GB 50917-2013) specified the formula for calculating the shear bearing capacity when the stud breaks:
P u = 1.19 A st ( E c E s ) 0.2 ( f c u f s t ) 0.1
where Pu is the shear bearing capacity (N) when the stud breaks; Ast, fst, Es are the cross-sectional area (mm2), ultimate tensile strength (MPa), and elastic modulus (GPa) of the stud, respectively; fcu and Ec are the cubic compressive strength (MPa) and elastic modulus (GPa) of concrete, respectively.
Moreover, Xue [13] produced the calculation formula of shear bearing capacity under the failure mode of stud rupture considering the length to diameter ratio of studs by push- the experimental study as follows:
P u = 3 A st ( E c E s ) 0.4 ( f c u f s t ) 0.2 λ = { 6 H 1.05 d s                       ( H / d 5 ) 1                                         ( 5 < H / d < 7 ) H d s 6                                       ( H / d 7 )  
where H/ds is the aspect ratio of the stud, and the meanings of other symbols are the same as those of Equation (1).
Subsequently, Al-Darzi [37] performed a parametric analysis of PBL shear connectors by using the Ansys software. Based on the multiple linear regression analysis of the simulation results, the formula for calculating the shear bearing capacity of the PBL shear connectors with concrete end bearing effect is expressed as follows:
P u = 255.31 + 7.62 × 10 4 h t f c 7.59 × 10 7 A r f r y + 2.53 × 10 3 A s c f c
where Pu is the shear bearing capacity of PBL shear connector with concrete end bearing effect (kN); h and t are the height and thickness of the perforated plate (mm); Asc and fcare the area of the concrete tenon in the hole [2nπ(D2-dr2)/4, where n is the number of openings] (mm2) and cylinder compressive strength of concrete (MPa); Ar and fry are the cross-sectional area (mm2) and yield strength (MPa) of the penetrating steel bar, respectively.
In addition, Zhang [38] conducted a multiple linear regression analysis of the experimental and finite element simulation results and then proposed a formula for calculating the shear bearing capacity of the intermittently arranged PBL shear connectors as follows:
P u = 3.5 h t f c u , k   + 32 A s c f c u , k + 5.2 A r f r y
where Pu is the shear bearing capacity of the intermittently arranged PBL shear connectors; fcu,k is the standard value of cubic compressive strength of concrete (MPa); the meanings of other symbols are the same as those of Equation (3).
Therefore, based on the aforementioned research results and the failure form of the test specimens, the formula for calculating the shear bearing capacity of the composite shear connector is proposed as follows:
P u = β 1 h t f c u + β 2 A r f r y + β 3 A s c f c u 0.5 + β 4 A s t ( E c E s ) 0.2 ( f c u f s t ) 0.1
where Pu is the shear bearing capacity of the combined shear key (N); h and t are the height and thickness of the perforated plate (mm); Ar and Ast are the cross-sectional area of the penetrating steel bar and the stud rod, respectively (mm2); Asc is the area of the concrete tenon in the hole [2nπ(D2-dr2)/4, where n is the number of openings] (mm2); fcu is the cubic compressive strength of concrete (MPa); fry is the yield strength (MPa) of the penetrating steel bar; fst is the ultimate tensile strength of the stud (MPa); Ec and Es are the elastic modulus (GPa) of concrete and stud, respectively; β1, β2, β3, β4 are undetermined coefficients.
The results of the 49-model analysis in Table 3 were subjected to multivariate linear regression on Equation (5), resulting in the formula for calculating the shear bearing capacity of the composite shear connectors as Equation (6). The Pearson correlation coefficient of the regression analysis was 0.87 (see Figure 9), which demonstrates that the calculated value is consistent with the value obtained using finite element analysis.
P u = 2.55 h t f c u + 5.21   ×   10 1 A r f r y + 2.05 A s c f c u 0.5 + 2.34 A s c f s t ( E c E s ) 0.2 ( f c u f s t ) 0.1
Table 5 compares the measured shear bearing capacity of the specimens and the results calculated using Equation (6). The outcome indicates that the calculation results of Equation (6) are well correlated with the test results of the composite shear connector push-out specimens; however, the calculation results are conservative—about 0.85 times the measured value. With the safety factor considered, Equation (6) could be used to calculate the shear bearing capacity of the composite shear connector in practical engineering.

6. Conclusions

Through the tests and numerical simulations of the shear bearing performance of the steel–polypropylene fiber ceramsite composite bonding interface, the following major conclusions are drawn:
(1)
The push-out test on one stud shear connector (LT-S), one PBL shear connector (LT-P), and three stud–PBL composite shear connectors (LT-C) reveals the superior shear resistance of the composite shear connector. In addition, composite shear connectors have excellent plastic deformation properties.
(2)
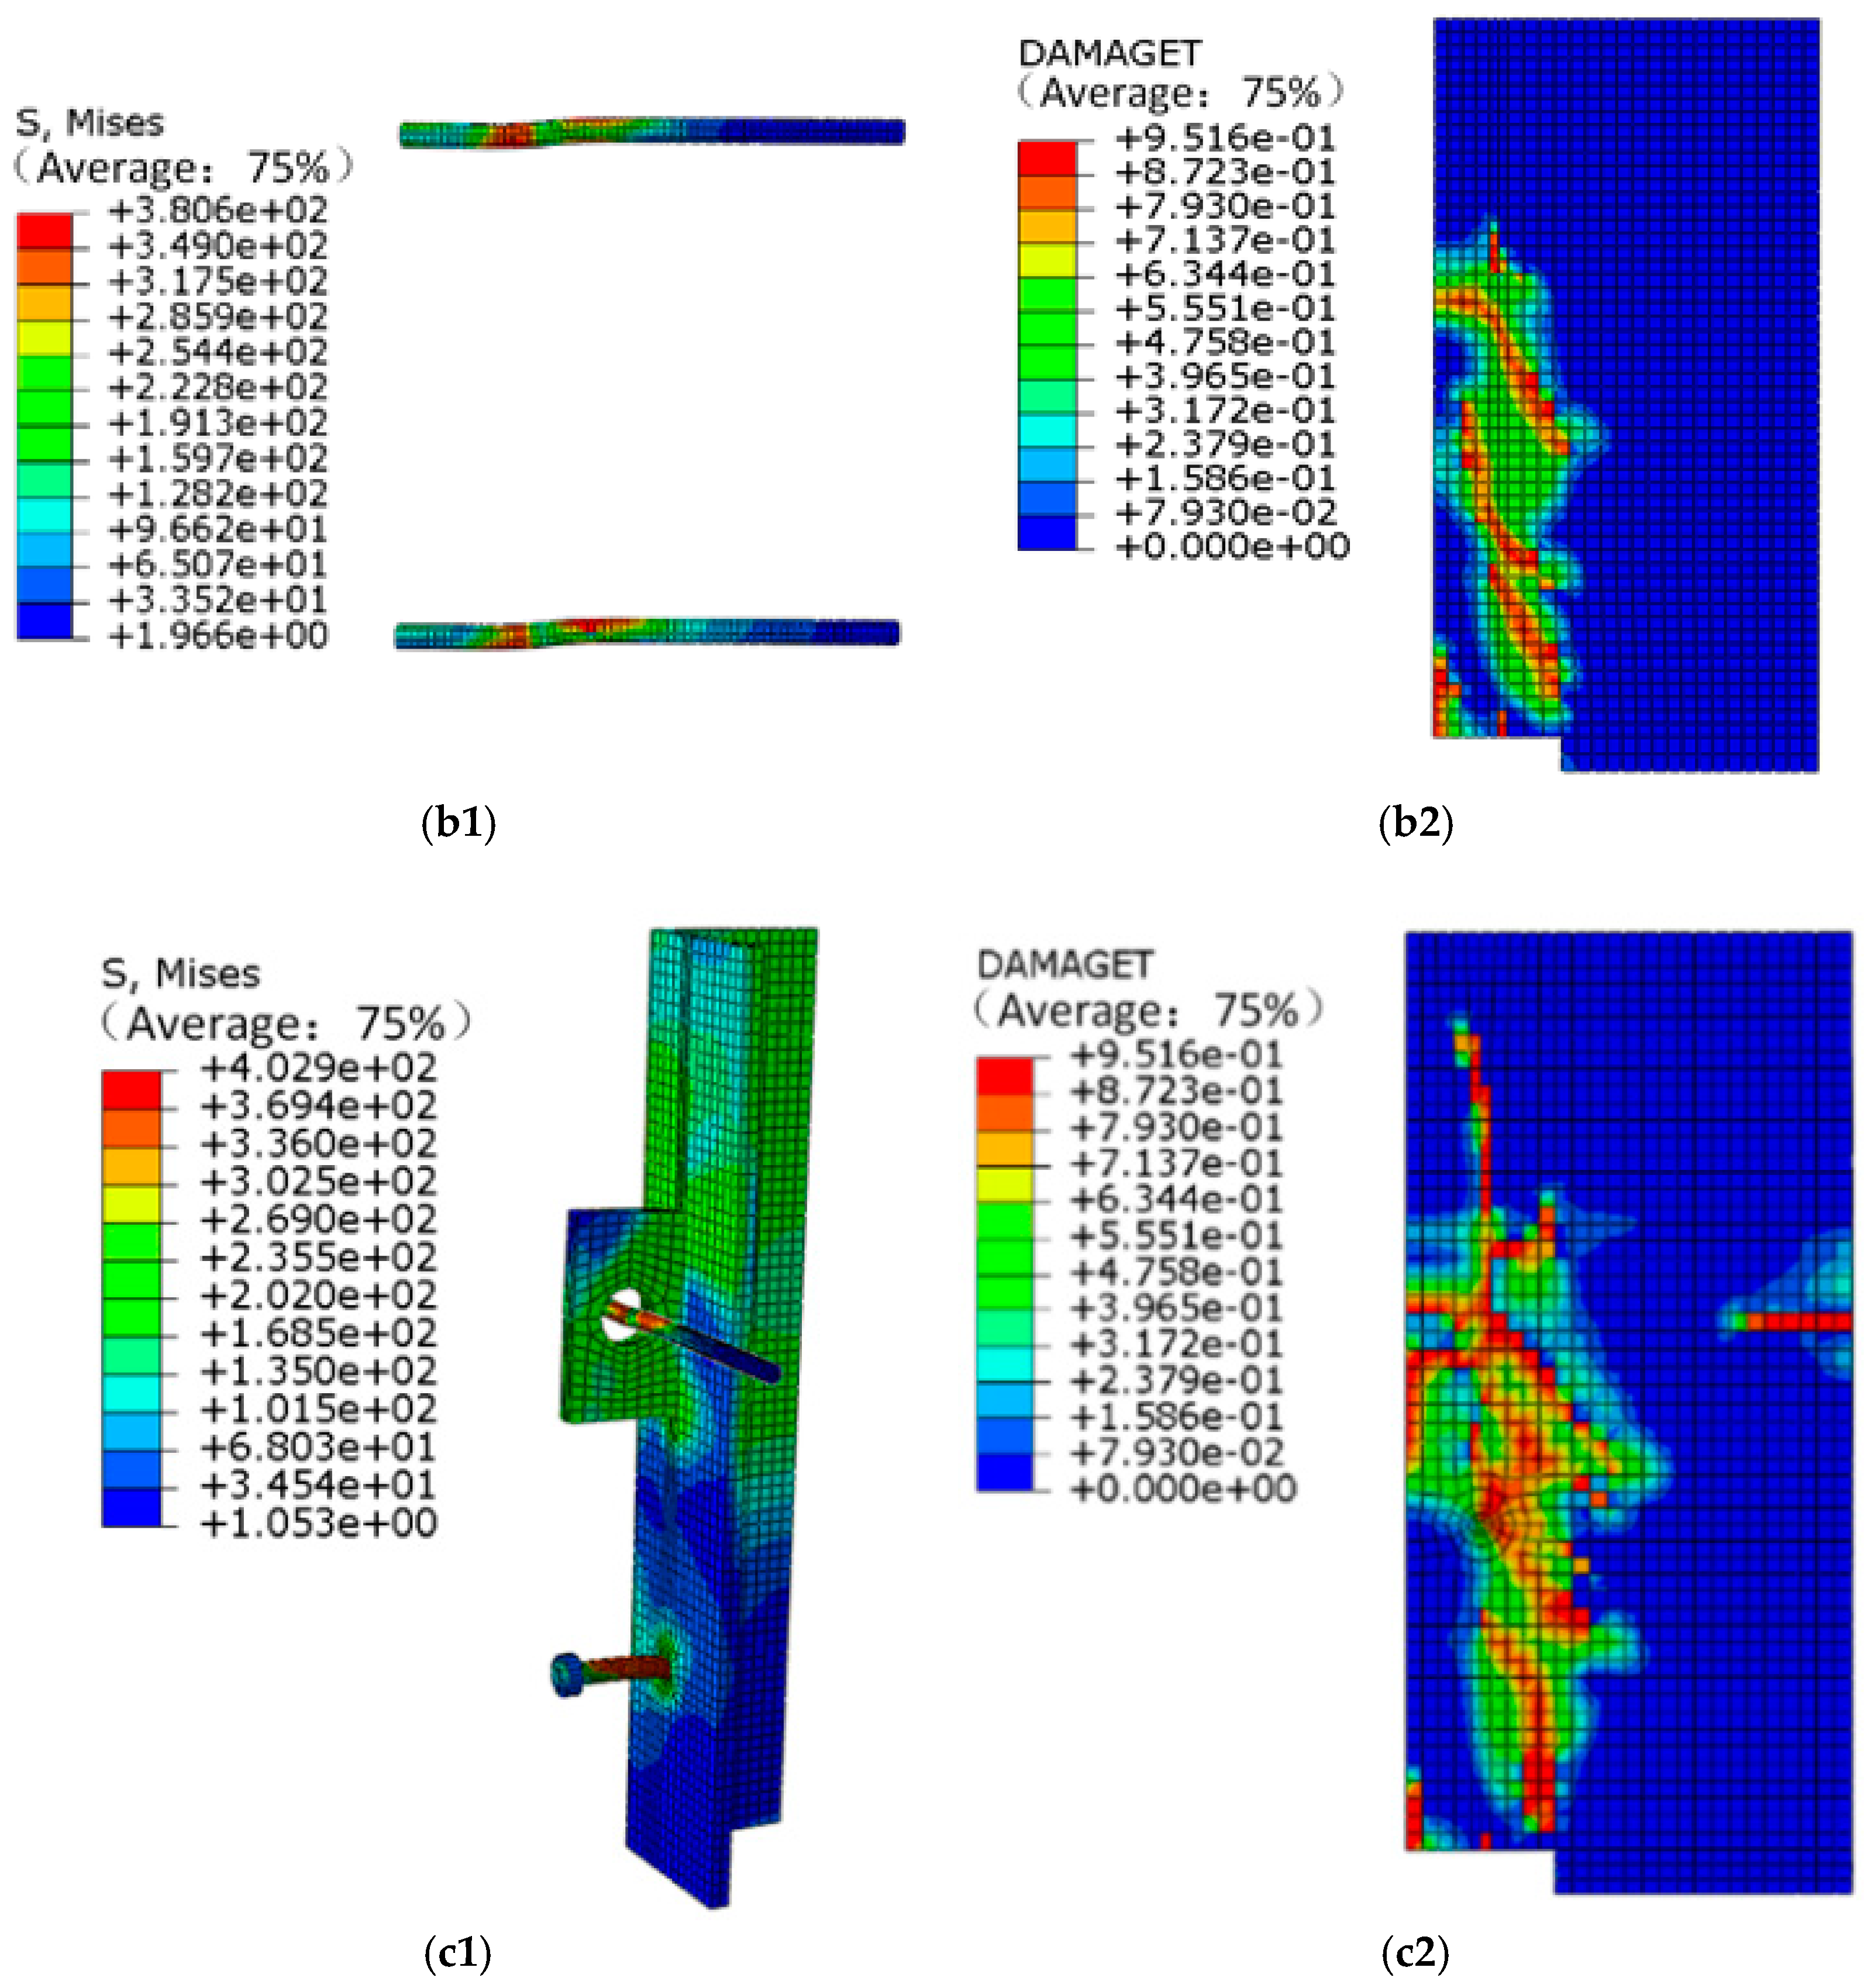
The finite element software Abaqus was used to simulate the push-out test with five specimens. The analysis results were in agreement with the experimental phenomenon, load–slip curve, and shear bearing capacity of the push-out test. In addition, the illustrations of stress and concrete damage can reveal the shear damage mechanism and failure form of the shear connector. It is feasible to use finite element simulation to reveal the force mechanism of the composite shear connector and perform parametric analysis.
(3)
According to the results of the orthogonal test simulation analysis, increases in the stud diameter, perforated plate thickness, and concrete strength can improve the shear bearing capacity of the composite shear connector, among which the concrete strength has the most obvious effect. However, an increase in the diameter of the penetrating steel bar exerts no apparent effects on shear capacity. Regarding the opening diameter, the shear bearing capacity increases first and then decreases with its increase. When the diameter of the opening was nearly 40 mm, the shear bearing capacity was more favorable. The optimal construction combination for the composite shear connector is the stud with 19 mm diameter, the opening with 50 mm diameter, the perforated plate with 24 mm thickness, and the penetrating steel with 16 mm diameter. Moreover, when the concrete strength was constant in the actual project, it was the key to controlling the thickness of the perforated plate, considering the structure of the composite shear connector.
(4)
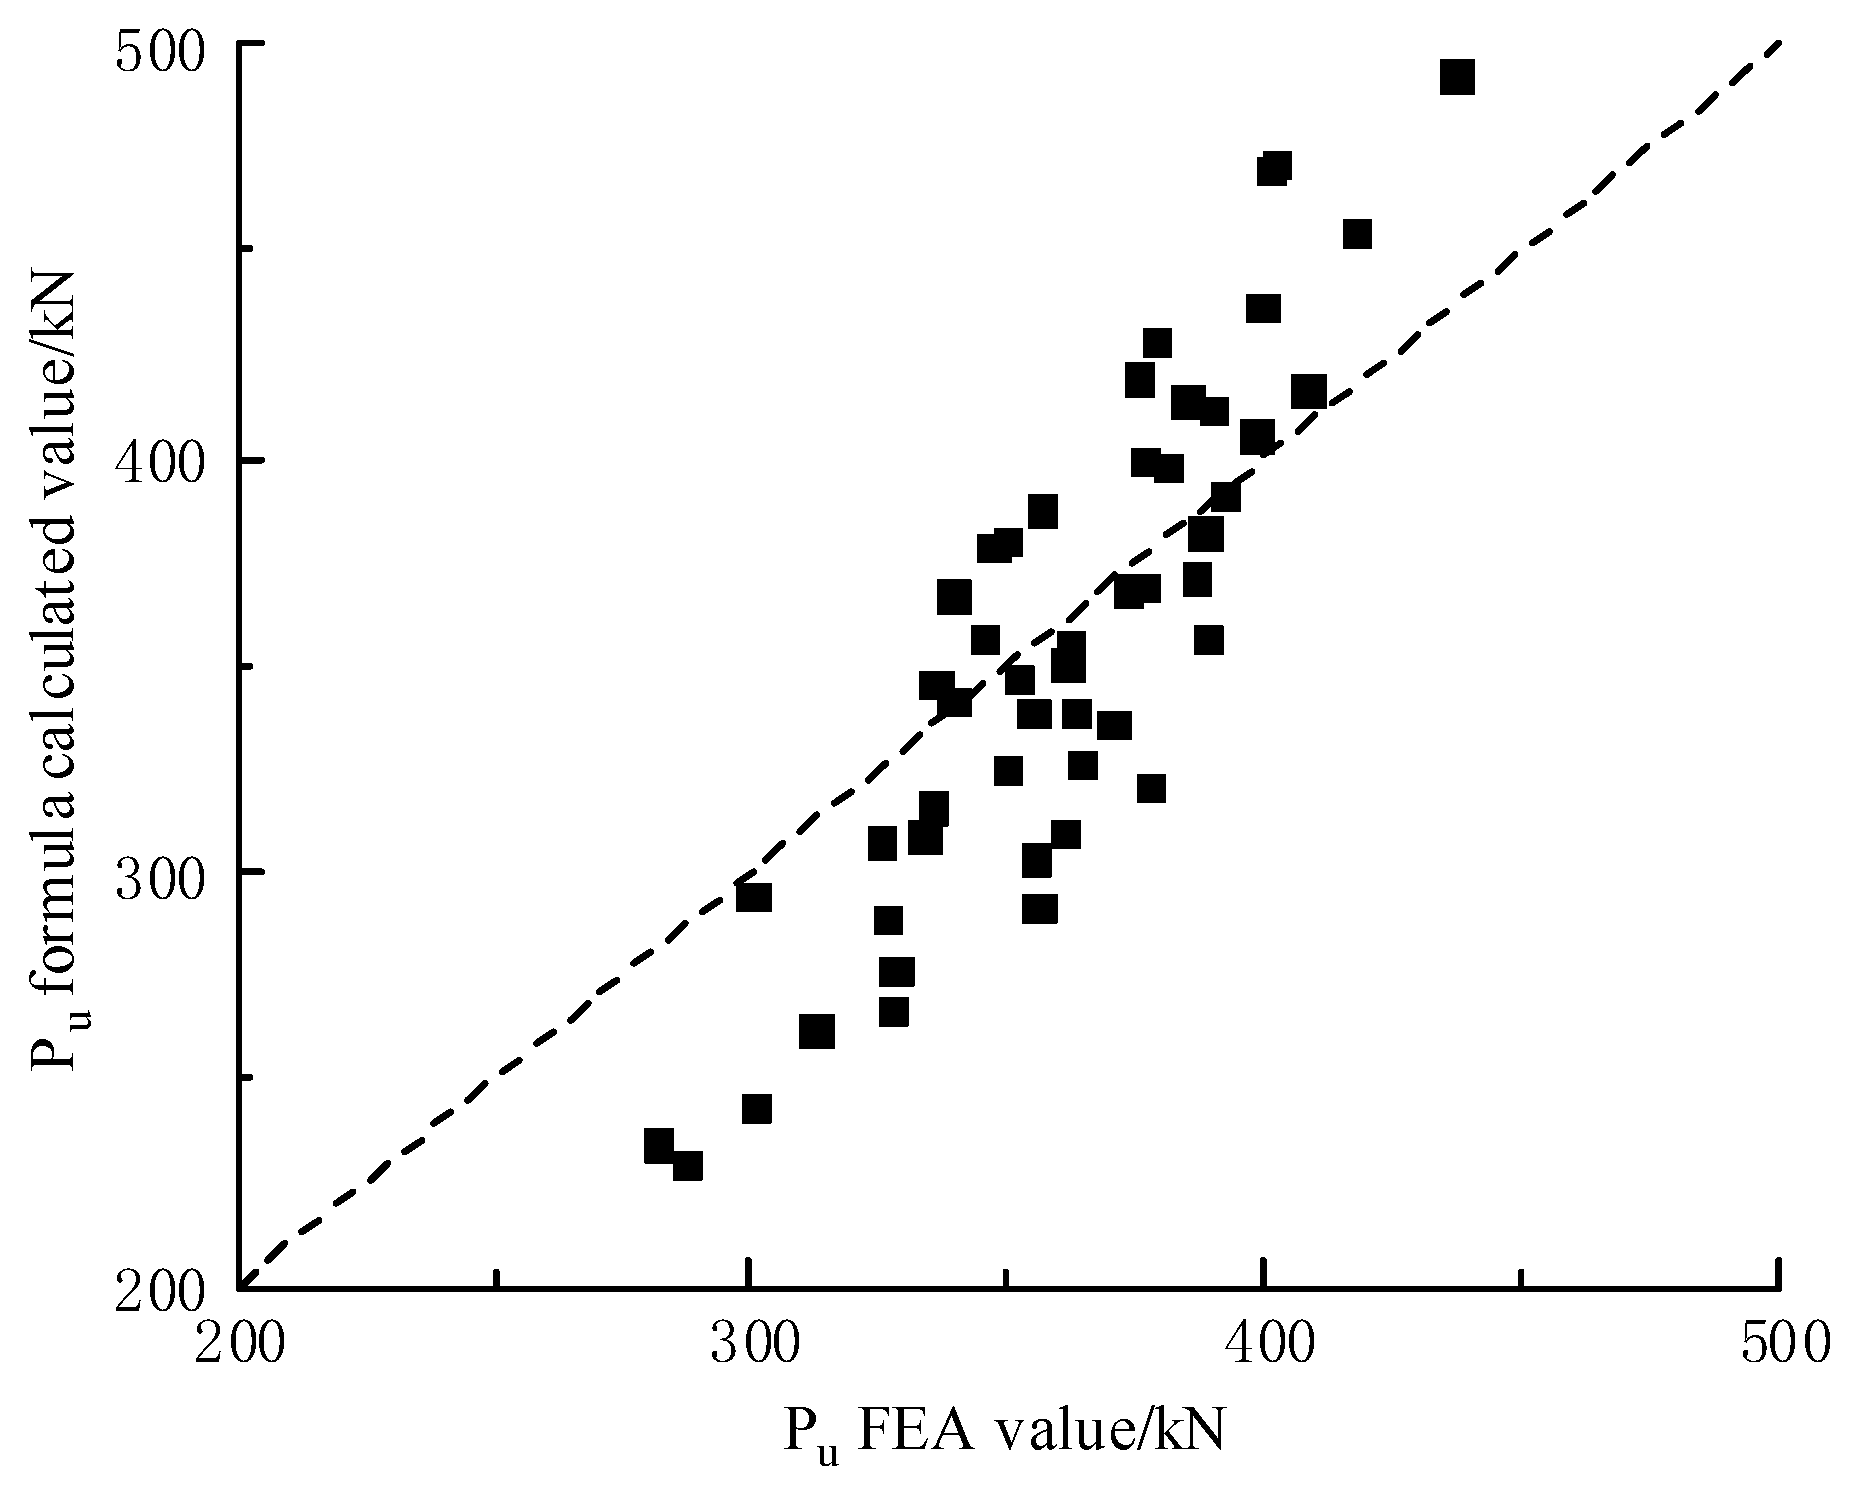
By conducting multivariate linear regression analysis on the results of the finite element parameter analysis, the calculation formula of the shear bearing capacity of the composite shear connector was obtained. The calculated value is about 85% of the measured value, which displays a good correlation and verifies the feasibility of the calculation formula. The calculation results are conservative, and a formula can be used to calculate the shear bearing capacity of the composite shear connector in practical engineering with the safety factor considered.
(5)
The experimental results, numerical simulation outcomes, and calculation formulas have a certain promoting effect on further reducing the self-weight of the composite structure and improving the shear resistance of the composite structure interface. However, the number of push-out test specimens is relatively small. In subsequent studies, experiments will be performed to further discuss the shear resistance of the stud–PBL composite shear connector and the method for calculating the shear bearing capacity.

Author Contributions

Conceptualization, H.Z. and Z.F.; methodology, H.Z.; software, P.L.; validation, Z.F. and B.Z.; formal analysis, Z.F.; investigation, Z.F.; resources, Y.L. and B.Z.; data curation, Z.F., Y.L. and B.Z.; writing—original draft preparation, Z.F. and Y.L.; writing—review and editing, H.Z. and Z.F.; visualization, Y.L.; supervision, H.Z.; project administration, H.Z.; funding acquisition, H.Z. All authors have read and agreed to the published version of the manuscript.

Funding

This study was funded by the National Natural Science Foundation of China (grant numbers 51778630, 52178182, and U1934217), China Railway Science and Technology Research and Development Plan Project (grant numbers 2020-Major project-02, 2021-Major project-02, 2021-Key projects-11).

Institutional Review Board Statement

Not applicable.

Informed Consent Statement

Not applicable.

Data Availability Statement

The data presented in this study are available on request from the corresponding author.

Conflicts of Interest

The authors declare no conflict of interest.

References

  1. Liang, F.; Zhou, Z.X. New Shear Connectors Based on PBL Shear Connector for Composite Arch Members. Struct. Eng. Int. 2014, 2, 281–284. [Google Scholar]
  2. Wu, F.; Liu, S.; Xue, C.; Yang, K.; Feng, Y.; Zhang, H. Experimental Study on the Mechanical Properties of Perfobond Rib Shear Connectors with Steel Fiber High Strength Concrete. Materials 2021, 14, 3345. [Google Scholar] [CrossRef] [PubMed]
  3. Zhan, Y.L.; Yin, C.; Liu, F.; Song, R. Push out tests on headed studs and PBL shear connectors considering external pressure. J. Bridge Eng. 2020, 25, 04019125. [Google Scholar] [CrossRef]
  4. Fang, Z.C.; Jiang, H.B.; Chen, G.F.; Dong, X.T.; Shao, T.F. Behavior of grouped stud shear connectors between precast high-strength concrete slabs and steel beams. Steel Compos. Struct. Int. J. 2020, 34, 837–851. [Google Scholar]
  5. Kim, S.H.; Jung, C.Y.; Ann, J.H. Ultimate strength of composite structure with different degrees of shear connection. Steel Compos. Struct. Int. J. 2011, 11, 375–390. [Google Scholar] [CrossRef]
  6. Ahn, J.H. Shear resistance of the perfobond-rib shear connector depending on concrete strength and rib arrangement. J. Constr. Steel. Res. 2010, 66, 1295–1307. [Google Scholar] [CrossRef]
  7. Zhang, J.D.; Shoji, A.; Kobayashi, K. Design of a PC box girder bridge with corrugated steel webs in Hanshin expressway. In Proceedings of the First International Structural Engineering and Construction Conference, Honolulu, HI, USA, 24–27 January 2001; pp. 581–586. [Google Scholar]
  8. Deng, W.Q.; Gu, J.C.; Liu, D.; Hu, J.; Zhang, J. Study of single perfobond rib with head stud shear connectors for a composite structure. Mag. Concrete. Res. 2019, 71, 920–934. [Google Scholar] [CrossRef]
  9. Zheng, S.J.; Zhao, C.; Liu, Y.Q. Parametric push-out analysis on perfobond rib with headed stud mixed shear connector. Adv. Civ. Eng. 2019, 2019, 1–16. [Google Scholar] [CrossRef] [Green Version]
  10. Jin, L.D. Analysis on spatial mechanical properties of steel-concrete segment with composite connectors. Steel. Constr. 2019, 34, 69–74. [Google Scholar]
  11. Chen, H.; Guo, Z.X.; Liu, Y.; Guo, L.-T. Study on the shear resisting mechanism and strength for an innovative composite shear connector. Eng. Mech. 2019, 36, 159–168. [Google Scholar]
  12. Gu, J.C.; Liu, D.; Deng, W.Q.; Zhang, J.D. Experimental study on the shear resistance of a comb-type perfobond rib shear connector. J. Constr. Steel. Res. 2019, 158, 279–289. [Google Scholar] [CrossRef]
  13. Yang, Y.; Chen, Y. Experimental study on mechanical behavior of PBL shear connectors. J. Bridge. Eng. 2018, 23, 04018062. [Google Scholar] [CrossRef]
  14. Xue, W.C.; Ding, M.; Wang, H.; Ziwen, L. Static behavior and theoretical model of stud shear connectors. J. Bridge. Eng. 2008, 13, 623–634. [Google Scholar] [CrossRef]
  15. Young, H.L.; Min, S.K.; Heecheul, K.; Dae-Jin, K. Shear resistance of stud connectors in high strength concrete. Struct. Eng. Mech. 2014, 52, 647–661. [Google Scholar]
  16. Hu, Y.; Yin, H.; Ding, X.; Li, S.; Wang, J.Q. Shear behavior of large stud shear connectors embedded in ultra-high-performance concrete. Adv. Struct. Eng. 2020, 23, 136943322093920. [Google Scholar] [CrossRef]
  17. Huo, J.; Wang, H.; Zhu, Z.; Liu, Y. Experimental Study on Impact Behavior of Stud Shear Connectors between Concrete Slab and Steel Beam. J. Struct. Eng. 2018, 144, 04017203. [Google Scholar] [CrossRef]
  18. Su, Q.T.; Yang, G.T.; Bradford, M.A. Static behaviour of multi-row stud shear connectors in high- strength concrete. Steel Compos. Struct. Int. J. 2014, 17, 967–980. [Google Scholar] [CrossRef]
  19. Xu, C.; Sugiura, K.; Masuya, H.; Hashimoto, K. Experimental Study on the Biaxial Loading Effect on Group Stud Shear Connectors of Steel-Concrete Composite Bridges. J. Bridge. Eng. 2015, 20, 04014110. [Google Scholar] [CrossRef]
  20. Xu, C.; Sugiura, K. FEM analysis on failure development of group studs shear connector under effects of concrete strength and stud dimension. Eng. Fail. Anal. 2013, 35, 343–354. [Google Scholar] [CrossRef]
  21. Ding, J.; Zhu, J.; Kang, J.; Wang, X. Experimental study on grouped stud shear connectors in precast steel- UHPC composite bridge. Eng. Struct. 2021, 242, 112479. [Google Scholar] [CrossRef]
  22. Zhang, Y.Z.; Li, Q.; Xia, S. Research on the Influence Factors to the Working Performance of PBL Shear Connectors. Appl. Mech. Mater. 2012, 178–181, 2192–2198. [Google Scholar] [CrossRef]
  23. Xiao, L.; Qiang, S.Z.; Xu, X. Experimental Research on PBL Shear Connector for Steel-Concrete Composite Structures. Adv. Mater. Res. 2011, 163–167, 2137–2141. [Google Scholar] [CrossRef]
  24. Zhang, Z.H.; Liu, P.; He, S.H.; Ji, T.G. Research on Influence Factors and Formulae for the Bearing Capacity of Twin-PBL Shear Connectors. Appl. Mech. Mater. 2013, 253–256, 3167–3171. [Google Scholar] [CrossRef]
  25. Yu, B.C.; Zhang, Y.L. The Capacity Calculation and Finite Element Analysis to PBL Shear Key. Appl. Mech. Mater. 2014, 501–504, 722–726. [Google Scholar] [CrossRef]
  26. Zhang, W.J.; Du, E.X.; Liu, B.Z.; Yang, S.C. Failure Mode Attribution Analysis of PBL Shear Connector. Appl. Mech. Mater. 2013, 351–352, 683–686. [Google Scholar] [CrossRef]
  27. Zhao, C.; Li, Z.; Deng, K.; Wang, W. Experimental investigation on the bearing mechanism of Perfobond rib shear connectors. Eng. Struct. 2018, 159, 172–184. [Google Scholar] [CrossRef]
  28. Li, Z.X.; Zhao, C.H.; Deng, K.L.; Wang, W. Load Sharing and Slip Distribution in Multiple Holes of a Perfobond Rib Shear Connector. J. Struct. Eng. 2018, 144, 264–276. [Google Scholar] [CrossRef]
  29. Zhang, J.; Hu, X.; Kou, L.; Zhang, B.; Jiang, Y.; Yu, H. Experimental study of the short-term and long-term behavior of perfobond connectors. J. Constr. Steel Res. 2018, 150, 462–474. [Google Scholar] [CrossRef]
  30. Wang, X.; Zhu, B.; Cui, S.; Lui, E.M. Experimental Research on PBL Connectors Considering the Effects of Concrete Stress State and Other Connection Parameters. J. Bridge Eng. 2018, 23, 04017125. [Google Scholar] [CrossRef]
  31. Du, C.; Tian, W.L.; Wang, X.W.; Wang, D.J. Experimental Research on Ceramsite Concrete Beams. Appl. Mech. Mater. 2012, 166–169, 708–711. [Google Scholar] [CrossRef]
  32. Eurocode 4: Design of Composite Steel and Concrete Structures – Part 2: General Rules and Rules for Bridges. European Standard: Brussels, Belgium, 2005; pp. 56–66.
  33. Xu, L.H.; Li, B.; Ding, X.X.; Chi, Y.; Li, C.; Huang, B.; Shi, Y. Experimental Investigation on Damage Behavior of Polypropylene Fiber Reinforced Concrete under Compression. Inter. J. Concr. Struct. Mater. 2018, 12, 1–20. [Google Scholar] [CrossRef]
  34. Cifuentes, H.; Garcia, F.; Maeso, O.; Medina, F. Influence of the properties of polypropylene fibres on the fracture behaviour of low-, normal- and high-strength FRC. Constr. Build. Mater. 2013, 45, 130–137. [Google Scholar] [CrossRef]
  35. Ding, F.X.; Ying, X.Y.; Yu, Z.W. Unified calculation method of uniaxial mechanical properties of lightweight aggregate concrete. J. Cent. South Univ. (Sci. Tec.). 2010, 41, 1973–1979. [Google Scholar]
  36. Qin, H.; Zhao, X.Z. Numerical analysis of composite columns with high steel ratio under cyclic loading. Struct. Eng. 2014, 30, 25–31. [Google Scholar]
  37. Al-Darzi, S.Y.K.; Chen, A.R.; Liu, Y.Q. Finite element simulation and parametric studies of perfobond rib connector. Am. J. Appl. Sci. 2007, 4, 122–127. [Google Scholar] [CrossRef] [Green Version]
  38. Zhang, J.D.; Gu, J.C.; Deng, W.Q.; Fu, H. Shear behavior of perfobond rib shear connectors for pre-fabricated composite bridges. China J. Highw. Transp. 2018, 31, 71–80. [Google Scholar]
Figure 1. Details of push-out specimen (LT-C) (Unit: mm): (a) Side view of LT-C; (b) Top view of LT-C.
Coatings 12 00583 g001
Figure 2. Sketch of loading.
Coatings 12 00583 g002
Figure 3. Typical failure model of push-out test specimens: (a) The failure details of LT-S specimen; (b) The failure details of LT-P specimen; (c) The failure details of LT-C specimen.
Coatings 12 00583 g003
Figure 4. Load–slip curves of the push-out test.
Coatings 12 00583 g004
Figure 5. 1/4 Finite element model (FEM) of push-out test for the composite shear connector: (a) The model of Steel member and steel bars; (b) Concrete slab model.
Coatings 12 00583 g005
Figure 6. Von Mises stress and damage illustration of FEA models: (a1) The stress distribution of penetrating steel bars; (a2)The compressive damage to concrete; (b1) The stress distribution of penetrating steel bars; (b2) The Tensile damage to concrete slab; (c1) The Stress distribution of stud penetrating steel bar; (c2) The Tensile damage to concrete slab.
Coatings 12 00583 g006aCoatings 12 00583 g006b
Figure 7. Load–slip curves of FEA models and push-out specimens.
Coatings 12 00583 g007
Figure 8. Results of FEM parametric analysis: (a) Influence of concrete cube compressive strength; (b) Influence of stud diameter; (c) Influence of perforated plate thickness; (d) Influence of opening diameter; (e) Influence of penetrating steel bar diameter.
Coatings 12 00583 g008
Figure 9. Results comparison of shear capacity Equation (6) and FEA.
Coatings 12 00583 g009
Table 1. Parameters of push-out test specimen.
GroupNumber of Studs in a SpecimenNumber of PBL Shear Connectors and Openings in a SpecimenNumber of Penetrating Steel Bars in a Specimen
LT-S8--
LT-P-84
LT-C442
Table 2. Results of push-out test and finite element analysis (FEA).
Specimen NumberTest Value
Pu/kN
Finite Element Calculation Value Pu,fea/kNPu,fea/Pu
LT-S197.3207.61.05
LT-P325.0334.01.03
LT-C-1404.0363.90.90
LT-C-2375.10.97
LT-C-3375.10.97
LT-C Average384.7363.90.95
Noted: Pu in the table was 1/4 of the shear bearing capacity of the test specimen. It meant the specimen LT-S contained 2 studs, the specimen LT-P contained 2 PBL, and the specimen LT-C contained 1 stud and 1 PBL.
Table 3. FEA parametric analysis results of shear bearing capacity of composite shear connectors.
GroupStud Diameter ds/mmOpening Diameter D/mmPerforated plate Thickness t/mmPenetrating Steel Bar Diameter dr/mmConcrete Cube Compressive Strength fcu/MPaFEA Shear Bearing Capacity Values Pu,fea/kNEquation (6) Calculated Value of Shear Bearing Capacity Pu,c/kNPu,c/Pu,fea
11330161240287.4229.310.80
50327.1266.630.82
60355.0303.370.85
21340201640326.2289.210.89
50370.2336.100.91
60388.0382.270.99
31350242040345.1356.921.03
50384.9413.771.08
60401.0469.731.17
41630202040349.9324.600.93
50386.6370.960.96
60408.3416.581.02
51640241240339.1341.591.01
50380.9398.391.05
60417.2454.241.09
61650161640325.2307.750.95
50361.4350.140.97
60391.7391.411.00
71930241640349.4380.041.09
50399.3436.701.09
60437.2492.341.13
81940162040335.7345.871.03
50356.3387.561.09
60378.6428.111.13
91950201240339.2366.931.08
50375.1419.541.12
60401.9470.751.17
RP1640161230281.6234.390.83
40327.9276.380.84
52.3363.9326.370.90
60388.7356.430.92
LT-ds131340161240300.9243.550.81
52.3355.9291.610.82
60377.2320.810.85
LT-ds191940161240335.2316.010.94
52.3372.9368.310.99
60376.6399.421.06
LT-D301630161240312.4262.140.84
52.3360.8310.080.86
60354.8338.990.96
LT-D501650161240300.3294.690.98
52.3351.8347.300.99
60346.9378.861.09
LT-t201640201240333.7308.990.93
52.3375.7369.000.98
60398.0405.341.02
LT-t241640241252.3389.4411.621.06
LT-dr161640161652.3363.1339.100.93
LT-dr201640162052.3361.8355.480.98
Pu in the table was 1/4 of the shear bearing capacity of the push-out specimen—that is, the specimen LT-C contained one stud and one PBL.
Table 4. Analysis of orthogonal test results.
Specimen Numberj = 1j = 2j = 3j = 4FEA Shear Bearing Capacity Values Pu,fea/kN
Stud Diameter ds/mmOpening Diameter D/mmPerforated Plate Thickness t/mmPenetrating Steel Bar Diameter dr/mm
1-C5013301612327.1
2-C5013402016370.2
3-C5013502420384.9
4-C5016302020386.6
5-C5016402412380.9
6-C5016501616361.4
7-C5019302416399.3
8-C5019401620356.3
9-C5019502012375.1
K1j1082.211131044.81083.1 P u = 371.3
K2j1128.91107.41131.91130.9
K3j1130.71121.41165.11127.8
κ1j360.7371348.3361.0
κ2j376.3369.1377.3377.0
κ3j376.9373.8388.4375.9
Rj16.24.740.115.9 S j = i = 1 3 ( P u i P u ) 2
  F = s j f j / s e f e
Sj504.033.12573.4476.9
Se/33.1//
F15.2/77.714.4
Pu in the table is 1/4 of the shear bearing capacity of the push-out specimen—that is, the specimen LT-C contains 1 stud and 1 PBL.
Table 5. Results comparison of Equation (6) and push-out test.
Specimen NumberThe Test Measured Value of Shear Bearing Capacity Pu/kNThe Calculated Value of Equation (6) Pu,c/kNPu,c/Pu
LT-C-1404.0326.30.81
LT-C-2375.1326.30.87
LT-C-3375.1326.30.87
LT-C384.7326.30.85
Pu in the table is 1/4 of the shear bearing capacity of the push-out specimen—that is, the specimen LT-C contains one stud and one PBL.
Publisher’s Note: MDPI stays neutral with regard to jurisdictional claims in published maps and institutional affiliations.

