Abstract
This paper presents a thermal stress analysis of the adhesive structure to study the effect of temperature change on the performance of the resin layer. The adhesive structure’s finite element model (FEM) is established, and the verified test is conducted in an environmental chamber. The simulated predictions are in good agreement with the experimental data. Subsequently, the effect of thickness of the resin layer, the elastic modulus of sheet materials, and vertex angle on the thermal behavior of the adhesive structure are discussed. The results show that the stiffness of sheet materials and vertex angle have a limited influence on the thermal stress of the resin layer. It is beneficial to reduce its thermal stress by increasing the height of the resin layer. In addition, the difference in thermal expansion coefficients between the upper and bottom sheets is the major cause of thermal stress in the resin layer.
1. Introduction
Because of the different performance requirements of structural parts in advanced instruments in various fields such as aerospace and astronomy, other metals and composites are used nowadays to discover advanced materials. A connection unit is necessary between two different materials. As to the connection unit, mechanical fastening, adhesive bonding, and a combination thereof have been used [1]. Since no cut-outs for bolts are required in an adhesive bonding unit, the two interfaces remain intact, whereby a refined joint geometry is obtained. However, because of the coefficient of thermal expansion (CTE) difference of materials, thermal stress will emerge in the resin layer when ambient temperature changes, which causes the destruction of the adhesive interface unit after repeated cycles of large temperature variation. Therefore, the long-term durability of adhesive structures has hindered their widespread application.
Sophisticated instruments with internal adhesive interface units are operated in extreme weather conditions due to various special needs. Aircraft experience significant temperature variation when they take off and land. High-orbit satellites that operate in severe environments sustain damage in environments with significant temperature variations over 200 °C caused by sunshine. High-frequency telescopes on the ground are usually located on extreme plateau sites, where severe seasonal temperature differences also exist. For instance, a Dome A 5 m Terahertz Explorer (DATE5) antenna proposed to explore new terahertz windows will be deployed at Dome A, Antarctica, with the seasonal temperature difference of 70 °C [2]. The adhesive interfaces between aluminum reflecting coating and carbon fiber-reinforced plastics (CFRP) sheet, CFRP sheet, and aluminum honeycomb in the sandwiched structure of panel will run a high risk of fatigue damage in extreme conditions, which is what occurred on the panels of Institut de Radioastronomie Millimétrique (IRAM) telescopes several years ago.
The weakest region of composite structures is the interface unit between the composite element and the metal/composite member bonded using epoxy resin adhesives. Therefore, considerable research has been conducted to investigate the fatigue performance of adhesive interface units, mostly on fiber reinforced plastics (FRP) composite joints [3,4,5,6,7,8,9,10]. It was suggested that more research should be conducted to understand bonded joint behavior and to improve joint design [11]. In addition, because of the unique environment that antennas and satellites need to operate, they may take several hours or even days to experience a temperature variation cycle. Based on this condition, the effect of creep during t service life must be considered as well as thermal fatigue [12].
In 1954, Manson and Coffin were the first to independently propose the exponential law of cyclic plastic strain range and cyclic life, now known as the Manson–Coffin equation [13]. In 1962, Taira proposed for the first time to take into account both creep fracture and cyclic strain fatigue to predict structural life [14]. Later, with the promotion of the HOST program of NASA, more advanced creep-fatigue life prediction models made great progress [15,16,17].
The location of the initial damage in the unit is closely related to the humidity of the environment [18]. The interface between the sheets and resin layer may be weakened in the presence of moisture [19]. Thermal effects are also considered in the fabrication processes of fiber-reinforced composites [20,21]. On the contrary, the primary damage will occur in the resin layer. The structure of the adhesive interface unit in practical applications is very diverse, where the temperature loads are also variable. Although many studies have been conducted to improve the long-term durability of the adhesive structure, the service strength limit cannot be accurately predicted. The key issue that must be solved is that the simulation accuracy of the stress distribution of the interface layer in the unit shall be improved.
This paper proposes an accurate method for predicting the thermal stress of the resin layer in the adhesive interface unit. The effect of the thickness of the resin, the elastic modulus of the material, and the vertex angle of the thermal behavior of the unit are investigated and discussed. Experiments on thermal stress were conducted to verify the accuracy of the finite element model (FEM).
2. FE Model
To perform the thermal stress analysis of the resin layer in the adhesive interface unit, numerical simulations based on the commercial software ABAQUS (Version 6.14) were carried out and will be described in this section.
2.1. Geometric Structure
The adhesive structure studied in this paper consists of three layers: upper sheet, a resin layer and bottom sheet, as shown in Figure 1. CFRP, aluminum and glass fiber reinforced plastics (GFRP) are the optional materials for the sheet. The resin layer material is assumed to be an epoxy resin.
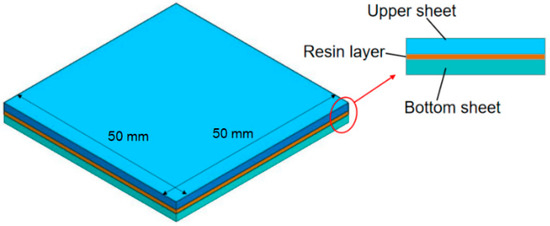
Figure 1.
Diagram of the adhesive structure.
The length and width of the structure are both 50 mm, and the thicknesses of the upper and bottom sheets are 2 mm. The thickness of the resin layer varies from 0.5 to 1.5 mm with intervals of 0.5 mm. The models with different parameter combinations are shown in Table 1.

Table 1.
Parameter combinations of the adhesive structure.
2.2. Boundary Conditions
The temperature–displacement coupling method was used to study the stress distribution of the adhesive structure. The whole model is modeled by 3D solid elements, where the resin layer has 25,000 elements and 28,611 nodes. The corresponding element type is C3D8T, as shown in Figure 2. To avoid rigid-body motion, the central node of the bottom sheet was fixed. Steady-state modeling is applied for the calculation of thermal stress. The field temperature was 60 °C initially and decreased by 10 °C at each subsequent analysis step until −10 °C.
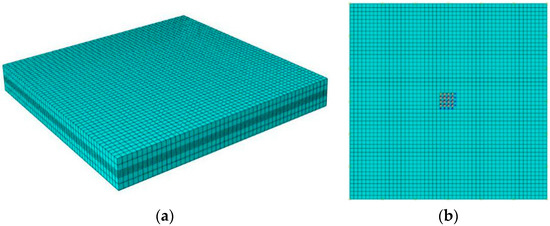
Figure 2.
FEM mesh (a) and boundary condition of the adhesive structure model (b).
2.3. Material Properties
The mechanical and thermal properties of CFRP (Carbon fiber type is T300), aluminum, and GFRP are listed in Table 2, which were obtained from the experiments and manufacturer’s parameters. In order to maintain the consistency of CTE in different directions, quasi-isotropic layers are used in the sheets.
Table 2.
Mechanical and thermal properties of component materials.
In Table 2, α1 and α2 are the CTE in the two main in-plane directions of laminate; α3 is the CTE in the thickness direction of laminate; E1 and E2 are the elastic moduli in two main in-plane directions of laminate; E3 is the elastic modulus in the thickness direction of laminate; G12, G13, and G23 are the shear moduli of laminate; γ12, γ13 and γ23 are the Poisson’s ratios of the laminate.
2.4. Thermal Stress Analysis Model
The adhesive structure can be considered as a special laminate. The constitutive equation of the lamina is given by:
where Q is the stiffness matrix, [σ] is stress, [ε] is strain, and [ε]t is the thermal strain.
Since steady-state analysis is used, it is considered that the temperature difference of all parts inside the material is consistent. The thermal strain can be calculated as:
where ΔT is temperature difference and [α] is coefficient of expansion.
After thermal deformation is taken into account, the constitutive relationship of the adhesive structure can be written as:
where N and M are the internal force and internal moment, respectively. Nt and Mt are the internal force and internal moment caused by thermal expansion. A is the tensile stiffness matrix, B is the coupling stiffness matrix, D is the bending stiffness matrix, ε0 is the surface strain of the structure, and K is the bending twist rate of the middle surface.
For the model analyzed in this paper, the thermal expansion of the structure is close to the unconstrained working conditions. In the steady-state analysis, the primary source of thermal stress is the difference in the thermal expansion coefficient of different layers in the adhesive structure.
3. Experiments
3.1. Specimens
To verify the results of FEM, three kinds of samples corresponding to model 1-3, model 2-3, and model 3-3 were manufactured and tested. Stress cannot be directly measured, which must be calculated indirectly from the strain measurement. The arrangement of strain gauges is shown in Figure 3. Two strain gauges were arranged at the corner point of the side, and the other two were arranged at the midpoint of the side, respectively.
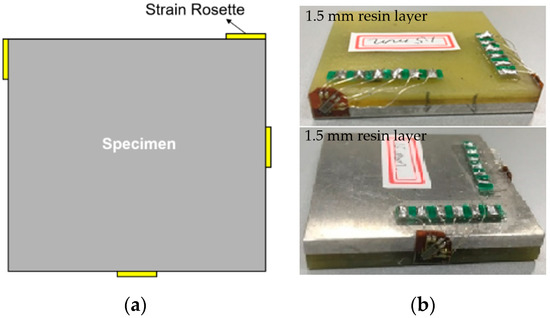
Figure 3.
Arrangement of strain gauges of the specimens: (a) schematic diagram; (b) test photos.
3.2. Testing Procedures
At the beginning of the test, the temperature of the environmental chamber was set at 60 °C under atmospheric pressure. The samples were put into the environment chamber for 3 h to reach thermal equilibrium. Then, every 30 min, the temperature of the environment chamber was lowered by 10 °C until a predetermined temperature of −10 °C was reached. The humidity of the environment chamber was kept at a low level to avoid the influence of humidity on the test.
4. Results and Discussion
4.1. Comparison of Experimental and Numerical Results
For verification, the results obtained by the numerical method were compared to the experimental data. The results of temperature–stress curves of the adhesive structure are shown in Figure 4 and Figure 5. It is seen that the finite element results were in good agreement with the experimental data. In addition, with the decrease of the ambient temperature, the thermal stress at the midpoints increased linearly, and the thermal stress at the corner point increased nonlinearly. This phenomenon indicates that the thermal deformation of the resin layer at the midpoint area is more even than in the corner point area.
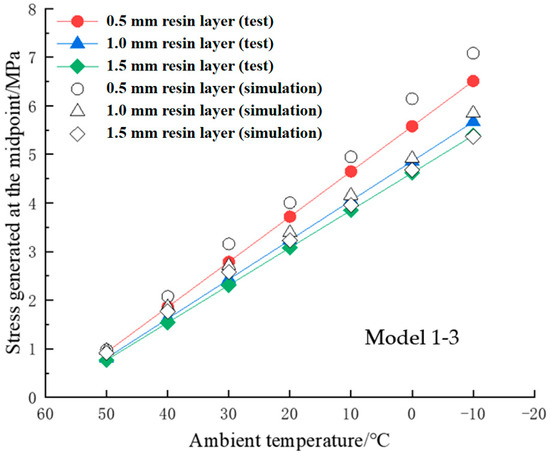
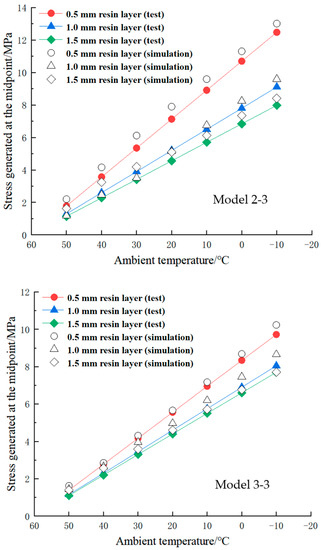
Figure 4.
Ambient temperature–thermal stress curves at the midpoint.
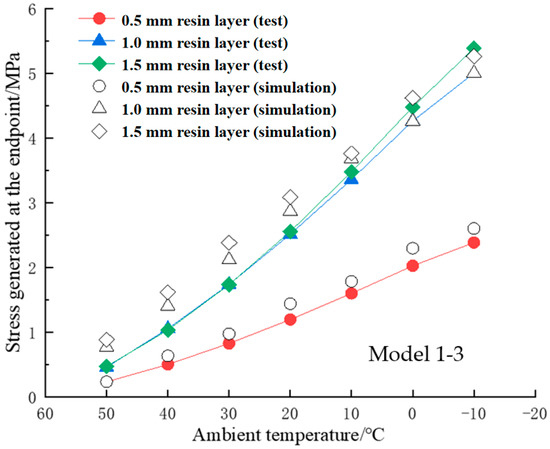
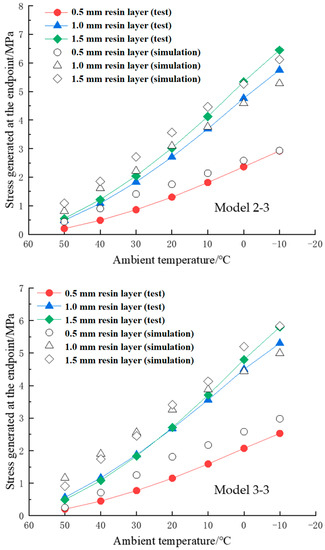
Figure 5.
Ambient temperature–thermal stress curves at the corner point.
4.2. Influence of the Sheet Materials and Resin Layer Thickness
Figure 6 displays the influence of sheet materials on the temperature stress curve. It can be seen that the maximum thermal stress of model 2 is the highest, model 1 is the second, and model 3 is the smallest. It indicates that the order of difference of CTE between upper and bottom sheet shown in Table 2 is consistent with the order of maximum thermal stress of three groups, which shows that the larger difference of CTE of the sheets combination is, the larger the maximum thermal stress of the resin layer is.
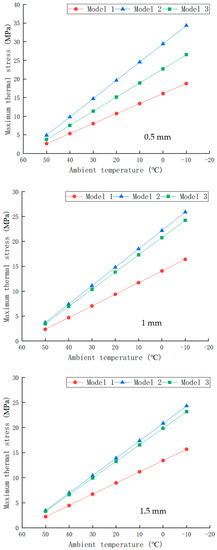
Figure 6.
Influence of sheet materials on ambient temperature–maximum thermal stress curves.
Figure 7 shows the influence of resin layer thickness on the maximum thermal stress of different models under the same condition. It was observed that the maximum thermal stress of the resin layer is decreased with the increasing thickness of the resin layer, and when the thickness is higher than 1 mm, the temperature–stress curves became flat.
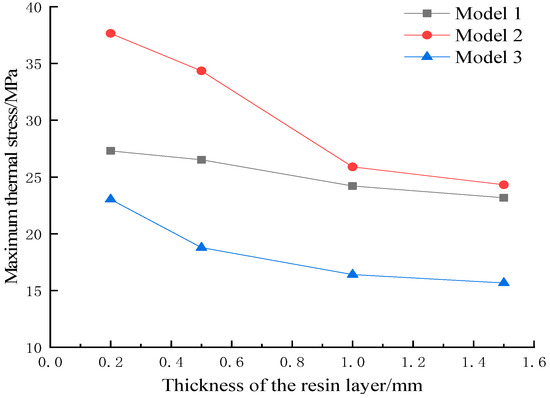
Figure 7.
Influence of resin layer thickness on maximum thermal stress.
4.3. Influence of the Sheet Stiffness
To study the effect of sheet stiffness on the maximum thermal stress of the resin layer, the material properties of the upper and bottom sheets were set to be the same in the FE model. The maximum thermal stress was observed to change with sheet stiffness when the temperature difference was 70 °C, and the resin layer thickness was 0.5 mm, as shown in Figure 8. In Figure 8, normalized elastic modulus means the ratio of the sheet stiffness to that of the CFRP sheet.
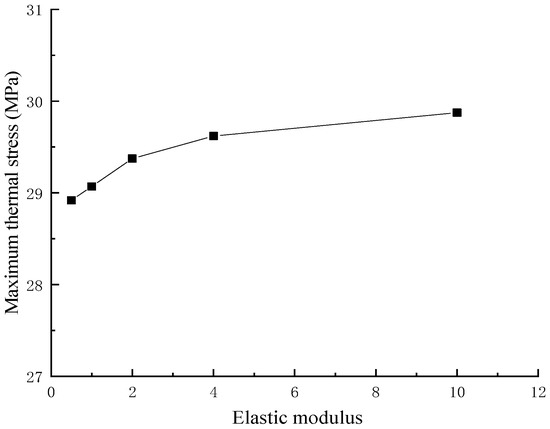
Figure 8.
Influence of sheet stiffness on the maximum thermal stress.
It is seen that with the increasing stiffness of the sheet, the maximum thermal stress increases slowly, and when the normalized stiffness reaches two, the curve became flat. When the stiffness of the sheet increased by 20 times, the maximum thermal stress increased by only 3%, which indicates the sheet stiffness had a very limited effect on the maximum thermal stress of the resin layer when above a certain threshold.
4.4. Influence of the Vertex Angle
The thermal stress distribution shown in Figure 9 indicates that the maximum thermal stress area occurs near the apex of the resin layer, which means that the structural corner may have an effect on the maximum thermal stress of the resin layer. For this reason, the structure vertices with different angles were obtained by cutting the model in Figure 1, as shown in Figure 9.
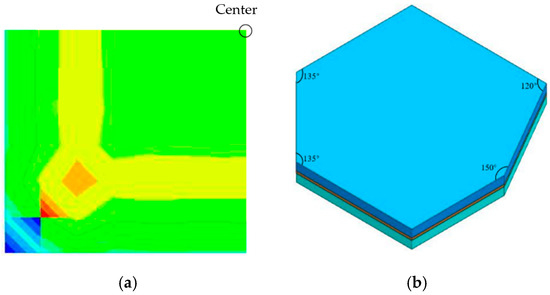
Figure 9.
Maximum thermal stress diagram (a) and structure vertices with different angles (b).
As shown in Figure 10, it was observed that the vertex angle changed from 90 degrees to 180 degrees, and the variation of the maximum thermal stress is less than 7%, which indicates that the vertex angle had a limited effect on the maximum thermal stress of the resin layer. In addition, the change in the maximum thermal stress is small when the vertex angle is in the range of 90° to 135°, and when the vertex angle is higher than 135°, a relatively significant drop shows up in the maximum thermal stress.
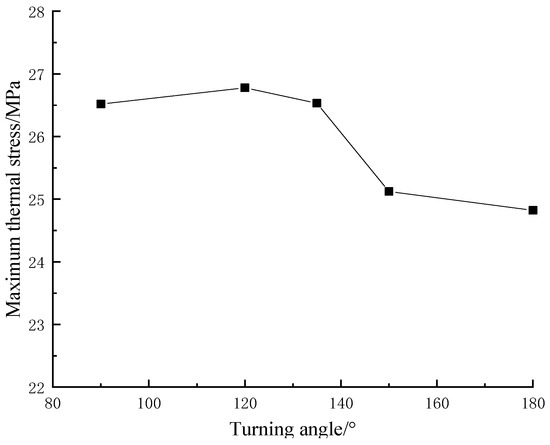
Figure 10.
Influence of the vertex angle on the maximum thermal stress.
5. Conclusions
The thermal stress distribution of the resin layer in the adhesive structure was investigated. The corresponding finite element model was established, and the verified environmental tests were carried out for the purpose of verification. Subsequently, the effects of material and structural parameters on thermal stress distribution were discussed. The following conclusions were obtained:
The finite element results agree with the experimental data, which shows the validity of the model in this paper. With the decrease of the ambient temperature, the lateral thermal stress of the resin layer increases linearly at the midpoint and nonlinearly at the corner point of the structure.
The more significant the difference in CTE of the combination of the sheets, the larger the maximum thermal stress of the resin layer with other structural parameters kept constant. Therefore, in structural design, the combination of the sheets with small differences in CTE should be selected for their adhesive structure under conditions with significant temperature variation.
Despite the increasing stiffness of the sheet that will cause an increase in the maximum thermal stress of the resin layer, the influence is limited in a particular range. The maximum thermal stress of the resin layer is decreased with the increasing thickness of the resin layer. When the thickness is higher than 1 mm, the effect becomes limited, which indicates that increasing the thickness of the resin layer is an effective method to avoid excessive thermal stress in the design of the adhesive structure. The maximum thermal stress occurs near the apex of the resin layer, and the vertex angle of the corner affects the maximum thermal stress, even though the effect is limited.
Author Contributions
Conceptualization, Y.Q. and D.C.; methodology, Y.Q. and D.C.; software, N.W.; validation, J.H., X.H. and D.C.; formal analysis, X.H.; investigation, N.W.; resources, D.C.; data curation, J.H.; writing—original draft preparation, Y.Q. and N.W.; writing—review and editing, D.C.; visualization, N.W.; supervision, D.C.; project administration, Y.Q. and D.C.; funding acquisition, Y.Q. and D.C. All authors have read and agreed to the published version of the manuscript.
Funding
This research was partially supported by the National Key Basic Research and Development Program (Grant No. 2019YFA0708904), the National Natural Science Foundation of China (Grant No. 52005256), the Natural Science Foundation of Jiangsu Province (Grant No. BK20190394), and the Priority Academic Program Development of Jiangsu Higher Education Institutions (PAPD).
Institutional Review Board Statement
Not applicable.
Informed Consent Statement
Not applicable.
Data Availability Statement
The data used to support the findings of this study are included within the article and are available from the corresponding author upon request.
Acknowledgments
Special thanks to Guangming Zhou for his guidance. The authors gratefully acknowledge the support of Jianfei Tang for the assistance in the experiments.
Conflicts of Interest
The authors declare no conflict of interest.
References
- Nagaraj, V.; Gangarao, H. Static behavior of pultruded GFRP beams. J. Compos. Construct. 1997, 1, 120–129. [Google Scholar] [CrossRef]
- Shi, S.C.; Paine, S.; Yao, Q.J.; Lin, Z.H.; Li, X.X.; Duan, W.Y.; Matsuo, H.; Zhang, Q.; Yang, J.; Ashley, M.C.B.; et al. Terahertz and far-infrared windows opened at Dome A, Antarctica. Nat. Astron. 2017, 1, 1. [Google Scholar] [CrossRef] [Green Version]
- Park, Y.B.; Song, M.G.; Kim, J.J.; Kweon, J.H.; Choi, J.H. Strength of carbon/epoxy composite single-lap bonded joints in various environmental conditions. Compos. Struct. 2010, 92, 2173–2180. [Google Scholar] [CrossRef]
- He, J.; Xian, G.; Zhang, Y.X. Effect of moderately elevated temperatures on bond behaviour of CFRP-to-steel bonded joints using different adhesives. Constr. Build. Mater. 2020, 241, 118057. [Google Scholar] [CrossRef]
- Huang, Y.; Bu, Y.; Zhou, L.; Shi, H.; Xie, H.; Feng, X. Fatigue crack growth and propagation along the adhesive interface between fiber-reinforced composites. Eng. Fract. Mech. 2013, 110, 290–299. [Google Scholar] [CrossRef]
- Liu, S.; Cheng, X.; Zhang, Q.; Zhang, J.; Bao, J.; Guo, J. An investigation of hygrothermal effects on adhesive materials and double lap shear joints of CFRP composite laminates. Compos. Part B Eng. 2016, 91, 431–440. [Google Scholar] [CrossRef]
- Jiang, X.; Kolstein, M.H.; Bijlaard, F.; Qiang, X. Experimental investigation on mechanical behavior of FRP-to-steel adhesively-bonded joint under combined loading-part 1: Before hygrothermal aging. Compos. Struct. 2015, 125, 672–686. [Google Scholar] [CrossRef]
- Jiang, X.; Qiang, X.; Kolstein, M.H.; Bijlaard, F. Experimental investigation on mechanical behaviour of FRP-to-steel adhesively-bonded joint under combined loading—Part 2: After hygrothermal ageing. Compos. Struct. 2015, 125, 687–697. [Google Scholar] [CrossRef]
- Zhou, H.; Torres, J.P.; Fernando, D.; Angus, L.; Richard, E. The bond behaviour of CFRP-to-steel bonded joints with varying bond properties at elevated temperatures. Eng. Struct. 2019, 183, 1121–1133. [Google Scholar] [CrossRef] [Green Version]
- Machado, J.J.M.; Marques, E.A.S.; Barbosa, A.Q.; da Silva, L.F.M. Effect of hygrothermal aging on the quasi-static behaviour of CFRP joints varying the overlap length. Compos. Struct. 2019, 214, 451–462. [Google Scholar] [CrossRef]
- Goswami, T. Low cycle fatigue life prediction—A new model. Int. J. Fatigue 1997, 19, 109–115. [Google Scholar] [CrossRef]
- Vassilopoulos, A.P. Fatigue Life Prediction of Composites and Composite Structures; Elsevier Science: Amsterdam, The Netherlands, 2010; pp. 439–465. [Google Scholar]
- Hart-Smith, L.J. Adhesive bonding of composite structures—Progress to date and some remaining challenges. J. Compos. Technol. Res. 2002, 24, 133–151. [Google Scholar]
- Renton, J.W.; Vinson, J.R. Fatigue behavior of bonded joints in composite material structures. J. Aircr. 1975, 12, 442. [Google Scholar] [CrossRef]
- Ashcroft, I.A.; Hughes, D.J.; Shaw, S.J. Adhesive bonding of fiber reinforced polymer composite materials. Assem. Autom. 2000, 20, 150–161. [Google Scholar] [CrossRef]
- Wang, Y. A generalized frequency modified damage function model for high temperature low cycle fatigue life prediction. Int. J. Fatigue 1997, 19, 345–350. [Google Scholar]
- Goswami, T. Development of generic creep-fatigue life prediction models. Mater. Des. 2004, 25, 277–288. [Google Scholar] [CrossRef]
- Zhang, Y.; Vassilopoulos, A.P.; Keller, T. Environmental effects on fatigue behavior of adhesively-bonded pultruded structural joints. Compos. Sci. Technol. 2009, 69, 1022–1028. [Google Scholar] [CrossRef]
- Quaresimin, M.; Ricotta, M. Fatigue behaviour and damage evolution of single lap bonded joints in composite material. Compos. Sci. Technol. 2006, 66, 176–187. [Google Scholar] [CrossRef]
- Wan, Y.; Suganuma, H.; Takahashi, J. Effects of fabrication processes and tape thickness on tensile properties of chopped carbon fiber tape reinforced thermoplastics. Compos. Commun. 2020, 22, 100434. [Google Scholar] [CrossRef]
- Lila, M.K.; Komal, U.K.; Singh, I. Thermal post-processing of bagasse fiber reinforced polypropylene composites. Compos. Commun. 2021, 23, 100546. [Google Scholar] [CrossRef]
Publisher’s Note: MDPI stays neutral with regard to jurisdictional claims in published maps and institutional affiliations. |
© 2022 by the authors. Licensee MDPI, Basel, Switzerland. This article is an open access article distributed under the terms and conditions of the Creative Commons Attribution (CC BY) license (https://creativecommons.org/licenses/by/4.0/).