Abstract
A hydrogen sulfide gas-sensitive chemiresistive sensor was screen printed on a flexible polyethylene terphthalate substrate using a nanocomposite of polyaniline(PANI)/WO3/CuCl2 (PET). FE-SEM analysis validated the nanoscale morphology of the composite, which revealed tungsten oxide particles in nano-rectangular forms, i.e., rod-like structures. The gas-sensing capabilities of the film were affected by the PANI and WO3 ratio, with the optimal ratio of 0.5 showing the best response. It was tested at various H2S gas concentrations and demonstrated a progressive response as the gas concentration increased. PANI/WO3/CuCl2 film was more sensitive than PANI/CuCl2 binary composite film. Around 1 ppm of gas concentration, with a response time of 67.9 s at room temperature, the highest response of two orders of magnitude change was observed, of 93%. This study found that PANI/WO3/CuCl2 is an excellent composite for improving the reversibility and humidity sensitivity of PANI/CuCl2 composite-based chemiresistors during H2S gas sensing, and that screen printing is a simple and cost-effective method for producing stable and uniform film-based chemiresistive gas sensors.
1. Introduction
Chemical sensors, specifically gas sensors, are produced in the form of thick and thin films to detect H2S gas in the environment as rapid, low-cost, and compact devices. They are evolving as significant environmental monitoring devices, delivering analytical data or signals of harmful gases. A gas sensor is a type of chemical analyzer that responds selectively and reversibly to the surrounding environment. It converts the concentration of a gas into a quantifiable signal. These analytical signals may result in a physical change or chemical reaction that occurs during the interaction of gas and sensing film [1].
First, a chemically selective layer, which works as a sensing material, changes its electrical conductivity under the influence of a particular gas. The second unit is a physical transducer; it reads the conductivity changes of the sensing material and converts it into an analytical signal [2]. Though various chemical sensors have been developed for H2S gas-sensing applications, chemiresistive, optical and electrochemical sensors are the most widely studied which can be further classified as shown in Figure 1.
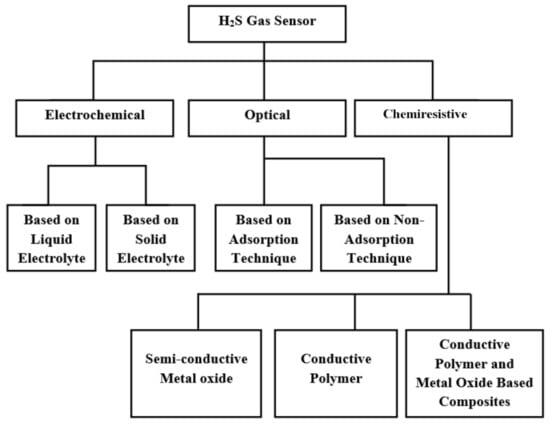
Figure 1.
Types of H2S gas sensors.
Chemiresistive sensors are noted for being the most basic, responsive, low-cost, and room temperature operable sensors, making them an affordable and reliable H2S gas sensor. Chemiresistive sensors modify their electrical resistance in response to chemical changes in the immediate environment. Typically, layers of sensing material are supplied over an array of electrodes to measure changes in the electrical resistance of the sensing material in the presence of a target gas [3]. The active material deposited over the electrodes is known as a receptor or host unit of the sensing device, devoted to provide information about the gas present in its environment through selective interaction with it. It is followed by a transduction process originating an easily measurable signal as shown in Figure 2.

Figure 2.
Schematic diagram of chemiresistive H2S gas sensor.
Chemiresistive sensors can be widely divided down into three categories, depending on the fabrication material used. Semi-conductive metal oxide, intrinsic conductive polymers (CPs) and chemiresistive sensors based on a hybrid composition of metal oxides and CPs all work on the same principle, while the active layer deposited has different sensing components according to the categories [4]. Each individual material has its own advantages and constraints corresponding to H2S gas detection.
The semi-conductive metal oxides such as WO3, SnO2, BaTiO3, CuO and Fe2O3 are classical materials for a highly sensitive H2S sensor [5]. Among these metal oxides, WO3 has been effective for hydrogen sulfide gas-sensing purposes, but the operating temperature required is as high as 200 to 500 °C which diminishes its long-term stability [6]. High temperature leads to more power consumption and decreases the life span of the sensor, and these sensors are poorly selective [7]. These inherent drawbacks of classical semiconducting materials are the reasons for the development of conductive polymers as a potential substitute which can be operated at room temperature and are environmentally friendly.
The conducting polymers consist of a conjugate backbone which has alternative single and double bonds. These bonds are stabilized via resonance [8]. The conjugated double bonds consist of one σ-bond and one π-bond. The σ-bond is responsible for the mechanical strength of the conducting polymer, while the π-bond, which is a weaker bond, consists of π electrons, which are delocalized throughout the polymer chain due to the π-orbital overlapping the neighboring molecules of the conjugate structure [9]. This delocalization causes the movement of charge throughout the polymer chain and develops a semi-conducting or conducting nature. A simple conjugated structure is presented in Figure 3.

Figure 3.
A simplified schematic of a conjugated backbone of conductive polymer.
Conjugated conductive polymers such as polythiophne (PTh), PANI ,and polypyrrole (PPy) have been developed as hydrogen sulfide gas-sensing materials due to their exceptional chemical and electrical properties, flexibility, and ease of processibility [6]. Among these CPs, PANI is considered as a fundamentally promising conductive polymer candidate for gas detection due to low cost, ease of preparation, environmental stability and controllable electrical properties [7]. However, for H2S gas-sensing application, the response of pure PANI is not as excellent as expected due to the weak acidic nature of H2S gas. PANI potentially responds to strong acids due to their high doping ability. Therefore, it reacts strongly with PANI which results in producing an exceedingly large change in conductivity, whereas weak acids result in only small changes in conductivity due to their partial doping abilities to PANI. Therefore, the composites of PANI are used for enhancing its response towards H2S gas [10].
Chemiresistive sensors are prepared by several film deposition techniques with a given active sensing material. Each film deposition technique develops different characteristics in the film. These techniques can be broadly classified as chemical film deposition and electrochemical film deposition [11], as shown in Figure 4.

Figure 4.
Types of film deposition techniques.
Chemical film deposition techniques generally include the pre-synthesis of material followed by deposition on the particular substrate. These techniques are good for mass production. It also permits in situ polymerization and its deposition on a broad span of substrates, while electrochemical deposition produces controlled thin films; however, these are strictly limited to film deposition on conductive substrates only.
Using a hybrid a-ZTO/GNS nanocomposite and a metal-semiconductor-metal (MSM)-type device, a dual-functional sensor was created by Huang et al. [12]. The sensor served as a photodiode (PD) for UV light detection and as a gas sensor for measuring O3. GNSs were incorporated with a-ZTO to create a nanocomposite film that improved the photoresponse and gas response of dual-functional sensors at the same time. Poongodi et al. [13] fabricated a tungsten oxide nanostructured thin film by the electro-deposition method for hydrogen sulfide gas sensing at low concentrations, ranging from 0.1 to 10 ppm. The resistance of the sensor decreased upon exposure to each H2S pulse and recovered completely to the initial value upon stopping the supply of H2S gas and exposure to air due to the reversible reaction of the film component with the gas molecules. It was reported that tungsten oxide is highly sensitive towards hydrogen sulfide among other metal oxides available for gas sensing, such as WO3, SnO2, BaTiO3, CuO, and Fe2O3. In addition, the nanoscale morphology within the film is highly desirable which could be conducive to provide direct conduits for the gas molecules to flow in from the environment. The similar sensing behavior of increasing conductivity at the metal oxide film surface was observed with pure n-type barium titanate which gave a maximum response to 100 ppm hydrogen sulfide gas at an optimum temperature of 350 °C [14]. Tin oxide film resulted in a 48% response for 5 ppm H2S at 300 °C [5], thus indicating the high dependency of sensitivity on operating temperatures.
Geng [15] synthesized PPy- and WO3-based composites and compared their H2S gas-sensing performance with their pure constituents at 20, 30, 60 and 90 °C, respectively. Intrinsic PPy film had a response time of 54, 135, and 124 s towards NH3, H2S, NOx, respectively, and a recovery time of longer than a day for NH3 and H2S, while there was no recovery towards NOx when tested against NOx (NO, NO2 and N2O4), H2S and NH3 at 1000 ppm at room temperature. On the other hand, WO3 and PPy/WO3 showed no sensitivity at 20, 30 or 60 °C, but showed sensitivity at 90 °C, which is still less than pure WO3. It had a response and recovery time of 70–80 s and 34–60 s, respectively, and a wide range of detection of 200–1000 ppm. It was observed that PPy loses its sensitivity at high temperatures due to the distortion of its linear structure.
For further optimization of conductive polymer and tungsten oxide composite film, Su and Peng [6] fabricated PPy/WO3-based nanocomposite thin film by brush coating to reduce the high working temperature of tungsten oxide. The fabricated sensor responded more strongly towards a low concentration of H2S gas at room temperature than the sensor based on pure WO3 (10% response) and polypyrrole (PPy) (25% response). The n-type nano-composite film showed a response of 81% and a response and recovery time of 6 min and 210 min, respectively, for 1 ppm H2S gas. It also had a wide H2S gas-sensing range of 100–1000 ppb. The enhanced behavior was possible because of the influence on the p–n junction induced at the PPy and WO3 interface and nanoscale morphology. In addition, the life cycle analysis of the sensor showed 83% initial responsive behavior after a long period of 54 days. Despite these advantages, this sensor was affected by NH3 and NO2 in cross-sensitivity analysis at 10 ppm and 1 ppm gas concentration, respectively.
Bai et al. [16] fabricated a polythiophene and WO3-hybrid-based nano-film for a low-temperature hydrogen sulfide gas detection device using the drop casting method. The gas-sensing characteristics of the hybrid film having 10% polythiophene in the WO3 nano-sheets showed 2–3 times more responsive behavior than pure WO3. The sensor had good sensitivity of 0.091 ppm−1 and a fast response/recovery of 25 s/<15 s towards 100 ppm H2S gas, along with a detection limit of about 2 ppm at an optimum temperature of 70 °C. The improved performance of the sensor was possible due to formation of a p-n junction at the interface of organic and inorganic semiconducting materials. On further increasing PTh content in the composite, it diminished the response, which implies that the PTh layer on WO3 would be too thick for the gas to make contact with the WO3.
Joshi et al. [17] prepared a polycarbazole (PCz) film-based chemiresistor by the Langmuir–Blodgett technique on flexible bi-axially oriented polyethylene terephthalate substrate. They obtained very stable 11, 35 and 71 Langmuir multilayer (ML) films with liquid expanded character. Among the deposited films, only 35 and 71 ML films were responsive as a typical p-type semiconductor to H2S at 10 ppm, which may be attributed to the absence of enough active sites for gas reactions on the surface of 11 ML film. Moreover, thinner film (35 ML) showed a comparatively higher response (91%) due to its relatively higher surface to volume ratio.
PANI individually has not been considered as an excellent H2S gas-sensing material because of the weak acidic nature of hydrogen sulfide gas. PANI gives a robust response to strong acids since they have the ability to fully dope PANI which results in a very large change in conductivity. However, weak acids only partially dope PANI which results in only a small change in conductivity. Despite the weak activity of PANI towards H2S, Agbor et al. [18] fabricated chemiresistive sensors using pristine polyaniline (PANI) film using different methods such as spin coating, thermal evaporation and the Langmuir–Blodgett (LB) technique. They compared the effect of these techniques on film properties and the corresponding responses towards H2S gas at room temperature. For spin-coated film, thickness was observed to be 2.0 ± 0.1 µm, and for thermal evaporation, the film thickness was 210 ± 10 nm, whereas for the LB technique, the film thickness was 6.0 ± 0.1 nm per layer. The thicknesses of the films showed that the film deposition techniques influence the characteristics of the film, which further affect its gas-sensing properties. They found an increase in conductivity for spin-coated and 18 LB layer-deposited film chemiresistors under the influence of H2S gas with a threshold detection limit of 4 ppm for both the films.
The interaction of H2S with water was responsible for increasing the film conductivity while evaporated film showed a decrease in resistance due to the absence of water molecules in the film which is an expected mechanism of conductive polymer to reduce gases such as H2S. The dissociated ions flow into the film. HS− ions compensate for N+ charge in polyaniline aromatic rings. The liberated H+ ions have much more mobility than HS−; therefore, the overall conductivity of polyaniline increases slightly due to having protons as the major charge carrier responsible for increasing its conductivity [10]. It was also reported by Agbor et al. [18] that among the conductive polymers investigated for gas detection, such as polypyrrole, polythiophene and polyaniline, etc., only polyaniline is readily processible due to its solubility in organic solvents from which free-standing films can be casted.
Liu et al. [19] developed a PANI nanofibers-based film using the electrochemical method. The film had no response to sample gas, while gold nanoparticles incorporating PANI nanofiber showed an 80% maximum response towards 1 ppm H2S gas, suggesting the functionalization of inorganic materials in polyaniline to improve its reactivity towards hydrogen sulfide gas along with using its fundamental advantages of easy processing and environmental stability. To improve the sensing characteristics of polyaniline towards H2S, Virji et al. [20] prepared polyaniline nanofiber composite films by drop casting using different metal salts such as copper, zinc, and cadmium. The film obtained by drop casting had a thickness of 0.25 µm. The incorporation of metal salts in PANI leads to its partial doping through the coordination of metal cations to the nitrogen atoms of both the benzenoid and quinoid groups of PANI. The incorporation of metal salts here very well facilitated the formation of strong acid through the release of metal sulfide when reacted with hydrogen sulfide gas, as shown in Equation (1).
where MCl2 is a metal chloride salt and MS is a metal sulfide.
The emeraldine base form of polyaniline presented in the composite film converted to its salt form, i.e., the conductive form of PANI which caused a high increase in the conductivity of the film due to the doping of polyaniline with a strong acid, HCl, as shown in Equation (2).
They investigated the sensing behavior of different metal salts, according to the stability of metal sulfide formation, which can be correlated with the solubility product constant (Ksp) of the resulting metal sulfide in aqueous solution according to Equation (3), where Ksp is the product of the dissociated ion concentration as shown in Equation (4). The metal salts showed a Cu > Cd > Zn trend with Ksp values.
A smaller Ksp value leads to more stable metal sulfide formation in aqueous solution, hence greater possibilities of releasing strong acid according to Equation (5). Therefore, copper sulfide (Cu2S, CuS) resulted in the highest response towards H2S.
PANI/copper chloride conventional film showed an 80% response in 30 min to 10 ppm gas exposure, while PANI/copper chloride nanofilm resulted in the great response with more than four orders of change in resistance in 1.1 min of response time. This is likely due to the high surface area and small diameters of the nanofibers that allow faster diffusion of the gas into the film.
After this research, the PANI/metal salt composite became specific to only copper chloride, given its higher sensing performance and stability. For further optimization of PANI/copper chloride towards H2S gas sensing, Crowley et al. [21] fabricated polyaniline/ copper chloride composite film using piezoelectric inkjet for layer-by-layer film deposition on screen-printed interdigitated electrodes using a flexible polyethylene terphthalate substrate. To fully assess the effect of hydrogen sulfide on the proposed composite, the current–time responses of pure PANI (ES), PANI (EB) on carbon interdigitated electrodes and PANI/CuCl2 composites on both carbon and silver interdigitated electrodes (IDE) were compared against 100 ppmv (parts per million by volume) hydrogen sulfide. PANI (ES) showed a very slight magnitude of less than one order and a weak reversible change in current, while PANI (EB) and PANI/CuCl2 displayed an irreversible sharp current change (no recovery) of four magnitudes on carbon IDE, indicating the protonation of the polyaniline base to its conductive salt form.
Sarfraz et al. [11] fabricated a low-cost hydrogen sulfide gas sensor. Polynailine and copper chloride composite films were deposited on silver interdigitated electrodes (IDE) using a paper substrate by screen-printing, spray-coating, and drop-casting methods. The spray coating and drop casting developed a thicker and rougher film compared with spray-coated film (400–600 nm) and screen-printed film (100 nm) which resulted in more pronounced changes in resistance of more than five orders of magnitude in the screen-printed films than in the spray-coated films upon 20 min of 15 ppm H2S exposure at room temperature. The gas interacted faster with film components due to the shorter gas diffusion path in printed film; moreover, both drop-casted and spray-coated films showed almost similar responses.
It can be concluded from the literature that despite having an excellent response of conductive polymer and metal salt composites towards hydrogen sulfide gas, their recovery and humidity in the background of the sensor have been problematic. In this work PANI/WO3/CuCl2 composite films were designed using the drop-casting method with screen-printed carbon IDE on a flexible polyethylene terphthalate (PET) substrate for fabricating a humidity-insensitive H2S gas sensor. These sensors are supposed to be highly sensitive and of low cost, and can be used in a H2S environment.
2. Materials and Methods
The polyethylene terphthalate (PET) was used as a substrate. It was purchased from Durga packaging, Faridabad, India (quality: non-absorbing flexible plastic substrate, thickness: 0.35 mm). Polyaniline (PANI) was used as conductive polymer. It was synthesized in the laboratory. Tungsten oxide (WO3) nanoplates were used as an n-type of inorganic semi-conductive material. They were synthesized in the laboratory. Copper chloride (CuCl2) was used as a metal salt. It was purchased from Labogen’s Research Chemicals, Ludhiana, India (molecular weight: 170.48 g/mol, density: 2.51 g/cm3). NMP (N-methyl-2-pyrrolidone) solvent was purchased from Labogen’s Research Chemicals, Ludhiana, India (molecular weight: 99.13 g/mol, density: 1.028 g/cm3). Conductive silver paste (Ag) was purchased from BNC Techno Solutions, Pune, India (resistivity: 30–35 µm). Hydrogen sulfide (H2S) gas was produced in the laboratory at room temperature (28 °C). All chemicals used were of analytical grade and were utilized without any further purification.
2.1. Methodology
2.1.1. Synthesis of Polyaniline (PANI)
Polyaniline (PANI) is usually found in three different oxidation states as follows [22]:
- Leucoemeraldine (pale brown amorphous powder readily prepared by reducing emeraldine with a strong reducing agent having the formula (C6H4NH)n);
- Emeraldine (the emeraldine base having the formula [C6H4NH]2[C6H4N]2)n forms an indigo blue powder which is insoluble in alcohol and benzene but readily soluble in pyridine;
- Pernigraniline (when a solution of emeraldine in acetic or formic acid is treated with an excess of strong oxidizing agent, the oxidation leads to the formation of a violet precipitate, which upon treatment with ammonia, yields a purple-brown compound called pernigraniline having the formula (C6H4N)n.
Only the emeraldine salt (ES) form of polyaniline is in a conductive state which is obtained by the protonation of the emeraldine base (EB) form of PANI through acid. Other states are non-conductive forms of PANI. The equilibria between these forms are shown in Figure 5. On partial oxidation or reduction these states are interchangeable and can be converted to salt forms with acid treatment. Salt forms are also interchangeable on oxidation or reduction. These states can be differentiated physically with the help of their distinctive hues, for example, the leucoemeraldine form of polyaniline shows a yellowish (sometimes colorless) hue. On the other hand, the emeraldine base shows a dark brown color. The conductive forms of polyaniline such as emeraldine salt are given as a green compound while pernigraniline shows a characteristic dark blue color [23].
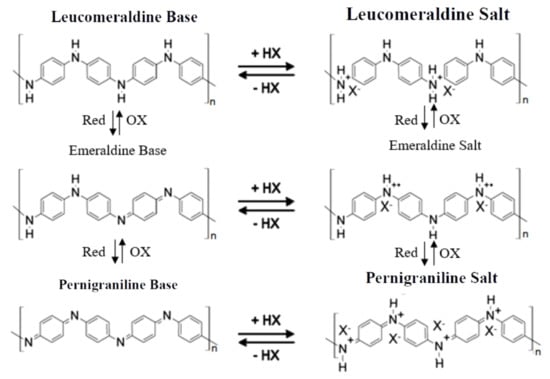
Figure 5.
Equilibria of different polyaniline (PANI) states. (X− = Cl−).
For the synthesis of polyaniline (ES), the chemical oxidation polymerization method was used. In general, the chemical synthesis of polyaniline (ES) involves the oxidization of an aniline monomer with the help of oxidizing agents such as hydrogen peroxide (), ammonium persulfate , ferric chloride , ceric nitrate and ceric sulfate in an acidic medium (, ). The oxidizing agent helps in removing protons from the aniline monomer unit without the formation of a coordinate complex at lower potential. The repeating monomer units are conjoined together by redox reaction, as shown in Figure 6, which completes the polymerization process [24].
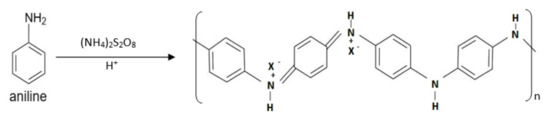
Figure 6.
Chemical synthesis of aniline with ammonium persulfate in HCl acidic medium to form PANI (ES) (X− = Cl−).
The reagents and detailed procedure involved in the preparation of PANI (ES) are as follows:
Reagents Used
Aniline (monomer), HCl (acid medium), and ammonium persulfate (oxidizing agent).
Procedure
Initially, 4.65 g of aniline was dissolved in 100 mL of 1M HCl to get the mixture. The temperature of the mixture was then allowed to decrease to below 5 °C by employing an ice bath. A separate pre-cooled solution of 100 mL of 1M HCl containing 11.40 g of was prepared. This separated solution was further mixed in the aniline and 1M HCl in a drop-wise manner under constant stirring. The mixture was allowed to stir until completion of the reactions. It took about 4 h for the reaction to be completed. There was a precipitate in the solution which was further filtered for recovery of the produced polymer. For eliminating un-reacted chemicals, the precipitate was washed thoroughly with the help of distilled water and 1M HCl. The obtained sake-like sample of the polymer was allowed to dry at room temperature (28 °C) and stored in an airtight glass bottle [25].
Figure 7 represents a simplified flow chart of the preparation of PANI (ES) by the chemical oxidation polymerization method.
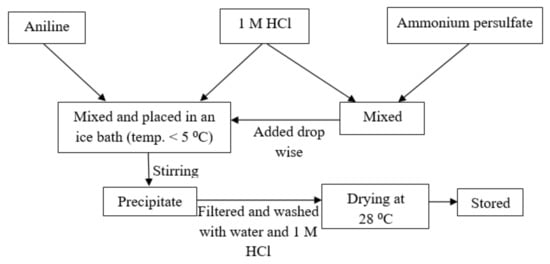
Figure 7.
Flow chart of synthesis of PANI (ES) by chemical oxidation polymerization.
2.1.2. Synthesis of Tungsten Oxide Nanoplates
Nanoscale tungsten oxide was prepared by using the facile hydrothermal technique. In general, hydrothermal synthesis refers to the synthesis of inorganic materials involving heterogeneous reactions in an aqueous media above atmospheric temperature and pressure [26]. The reagents and detailed procedure involved in the preparation of tungsten oxide are as follows:
Reagents Used
(sodium tungstate, dihydrate), citric acid, HCl, and distilled water.
Procedure
A total of 60 mL of distilled water was used as a solvent for dissolving 1.0 g of and 1.2 g of citric acid. The solution was allowed to stir for about 30 min, and 10 mL of 3M HCl solution was prepared. This HCl solution was mixed in the first solution in a drop-by-drop manner followed by 30 min of stirring. After mixing the acid solution drop by drop, the whole solution was stirred for a further for 10 min. As a result of the mixing, a clear light blue solution was obtained. The transparent solution was then transferred to a sealed container and heated at 120 °C in a heated oven. After 36 h of heating, the transparent solution turned into a yellow precipitate. The precipitate was allowed to be cooled at room temperature (28 °C) and then centrifuged at 4000 rpm for 15 min. The centrifugation cycle for washing the unreacted chemicals was repeated 3–4 times and retrieved successfully with the help of distilled water. The retrieved sample was dried in the oven at 80 °C for 24 h. The dried sample was placed in a calcination furnace at 400 °C for 4 h under air [16]. Thereafter, the dried sample was cooled at room temperature (28 °C) and stored in a glass bottle. Figure 8 represents a simplified flow chart of the preparation of tungsten oxide (WO3) nanoplates by hydrothermal technique. WO3 nano-plates were used as synthesized.

Figure 8.
Flow chart of synthesis of tungsten oxide (WO3) nanoplates by hydrothermal technique.
2.1.3. Development of Composites
Two composites were prepared by homogeneous mechanical mixing using a probe sonicator. The composites prepared are as follows:
- PANI/CuCl2 composite;
- PANI/WO3/CuCl2 composite.
Material Preparation
The synthesized materials were converted to the final form needed for film composite formation as follows. Here, the final form refers to the form of active sensing materials in which they are directly used for the formation of composite.
PANI (Emeraldine Base) Preparation
The conductive PANI salt form was converted to the emeraldine base form, which is non-conductive, by dipping it in 0.1M NH4OH solution for 12 h followed by filtration using a Buchner funnel. The sample was then rinsed using distilled water. Finally, the sample product was allowed to dry at about 80°C for two hours in a heated oven.
The base form is usually used in gas-sensing film deposition so that when it is exposed to hydrogen sulfide gas the resultant increase in the conductivity is large enough and PANI (EB) has better solubility than PANI (ES) in polar solvents such as NMP (N-methyl-2-pyrrolidone) [27].
CuCl2 Solution Preparation
CuCl2 solution of 0.08 M was prepared by dissolving CuCl2 powder in NMP (N-methyl-2-pyrrolidone) solvent.
2.1.4. Polyaniline/Copper Chloride Composite Preparation
The synthesized polyaniline (EB) powder was used for developing a dispersion medium by mixing 1% weight by weight polyaniline (EB) powder in NMP (N-methyl-2-pyrrolidone) solvent. The dispersion medium was left for 10 h of stirring. The dispersion was filtered and added to the prepared 0.08 M CuCl2 solution followed by homogeneous mixing using a probe sonicator (sonication time: 10 min, frequency: 0.5 Hz, Model: PKS: 500F, Bandi Technology, New Delhi, India). Finally, a homogeneous dispersion of PANI/CuCl2 composite was obtained.
2.1.5. Polyaniline/Tungsten Oxide/Copper Chloride Nanocomposite Preparation
PANI (EB)–WO3 powder with varying weight ratios (0.5, 0.75 and 1) was mixed in NMP (N-methyl-2-pyrrolidone) solvent. The dispersion mediums were left for 10 h of stirring followed by filtration. The filtered mixtures of PANI (EB)–WO3 were added to the prepared CuCl2 solution prepared. The dispersion was mixed homogeneously by probe sonicator (sonication time: 10 min, frequency: 0.5 Hz). The functionality of PANI/WO3/CuCl2 composite was optimized for hydrogen sulfide gas sensing in terms of polyaniline and tungsten oxide mixing ratio.
2.1.6. Printing Methods
The screen-printing technique was employed for printing interdigitated electrodes on flexible plastic substrate polyethylene terphthalate (PET). The films of prepared composites were deposited on the printed interdigitated electrodes by using drop-casting and screen-printing methods. The films obtained with these two techniques were compared and optimized in terms of their uniformity and stability, i.e., non-flakiness and non-cracking ability on the employed substrate, by observing the cracking and flaking behavior of the films with increasing thickness and time.
Screen Printing
A screen of mesh number 250 was used for the screen printing of interdigitated electrodes and films of prepared composites. The mesh number refers to the number of openings present per linear inch of a screen, as shown in Figure 9a which presents an example for knowing the mesh size of a screen corresponding to a given mesh number. The screen plate was made of a stretchy fine lattice designed with the desired shape of pattern. A silver conductive silver paste was utilized for the printing of an interdigitated electrode pattern on flexible polyethylene terphthalate (PET) substrate. The interdigitated space was kept at 1 mm. The structure was 1.5 cm wide and 3.5 cm long with 1 mm of digit breadth as shown in the illustration in Figure 9b. The illustration of the interdigitated electrode clearly shows the desired dimensions and pattern.
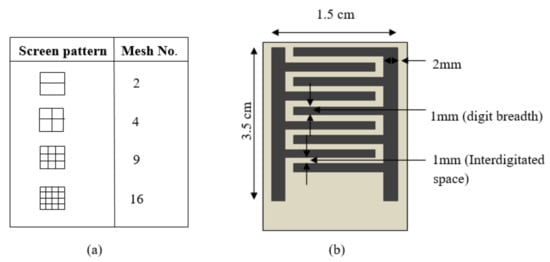
Figure 9.
(a) Examples of screen pattern corresponding to a given mesh number. (b) Illustration of interdigitated pattern with corresponding dimensions of fabricated pattern.
For the screen printing of interdigitated electrodes, the silver conductive paste was placed on the screen and squeezed down with high pressure to allow it to pass through the mesh with a given pattern, as shown in Figure 10. Similarly, for the screen printing of composite films, the prepared pastes of PANI/CuCl2 and PANI/WO3/CuCl2 were printed in a fabricated interdigitated electrode pattern on the flexible polyethylene terphthalate substrate. The films were deposited with a varying number of prints ranging from 1 to 7, i.e., varying film thickness. The printed films were allowed to dry at room temperature (28 °C).
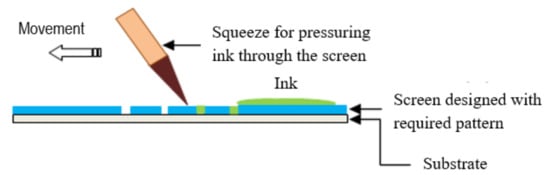
Figure 10.
Schematic diagram of screen printing.
In this work, screen printing was performed by employing a commercial manual screen-printing method. The pressure on the screen was applied manually in order to squeeze paste through the mesh and to deposit it on the given substrate.
Drop Casting
In this method, 10 µL drops of dispersion were deposited on the substrate. After full coverage of the desired area of substrate by the dispersion drops, it was placed in an oven for drying at 60 °C for 2 h as shown in Figure 11.
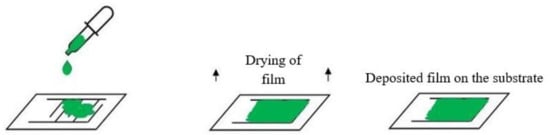
Figure 11.
Schematic diagram of drop-casting technique.
We used a micropipette for obtaining the micro droplets of the dispersion. An oven was used for drying of the deposited films at a given temperature.
2.1.7. Hydrogen Sulfide Gas Production
H2S gas was produced in the laboratory by allowing reaction between sodium sulfide (Na2S) flakes and hydrochloric acid (HCl) as shown in Equation (6).
A glass chamber connected with a controlled gas flow outlet pipe was used for producing H2S gas, as shown in Figure 12. The reaction chamber was placed on a magnetic stirrer for allowing the escape of gas molecules from the reaction mixture at a faster rate. Sodium sulfide and HCl were used at different concentrations and ratios in order to control the moles of gas produced in the reaction.

Figure 12.
Schematic diagram of set-up used for H2S gas production.
The gas streams of different moles were supplied in each cycle to a fixed volume testing chamber as shown in Figure 12. The varying concentration of the gas at ppm level inside the testing chamber was controlled by the moles of gas supplied into it.
2.2. Hydrogen Sulfide Gas-Sensing Set-Up and Method
Figure 13 shows the H2S gas-sensing set-up. A glass chamber of 250 mL was used for H2S gas detection. A digital multi-meter was connected to the two points of the sensor (two ends of the silver interdigitated electrodes) by clipping it to the multi-meter probes. The sensor was hanged inside the chamber from the top opening for observing changes in the electrical conductivity of the film during H2S gas exposure. A temperature and humidity sensor was also provided inside the chamber for observing the environmental conditions around the sensor during H2S gas detection. A leak-proof inlet and outlet connections were included in the detection chamber
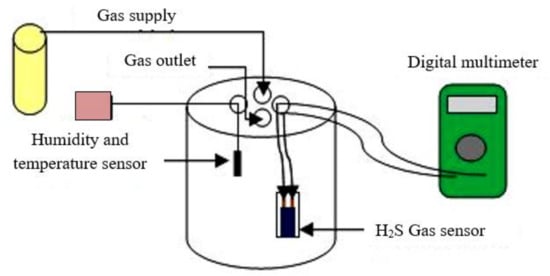
Figure 13.
Schematic for set-up used for H2S gas sensing.
2.3. Characterization Methods
The properties and characteristics of prepared composites and films were tested using different methods. The electrical conductivity of synthesized PANI (ES) and PANI (EB) was tested using the four-probe method and the change in electrical conductivity of the sensor under the influence of target gas was tested by digital multimeter. The FESEM (field emission scanning electron microscopy, JSM-7610F, JEOL Ltd., Tokyo, Japan) technique was used for investigation of the structural distribution of the synthesized tungsten oxide at the nanometer scale and analysis of its morphology and geometry. The X-ray diffraction technique (PANalytical Empyrean, Almelo, The Netherlands) was used for investigation of the phase crystallinity of the prepared composite. The UV–vis absorption spectrum, UV-1900 (Shimadzu, Kyoto, Japan) was used for chemical conversion analysis of the components present in the composite when it was dispersed in the NMP (N-methyl-2-pyrrolidone) solvent. The instruments used and characterization techniques are discussed in detail as follows.
2.3.1. Electrical Characterization
The electrical conductivity of synthesized polyaniline (ES) was measured using the four-probe method, and the electrical resistance change in the sensor during gas exposure was measured using a digital multimeter.
The conductivity of PANI (ES) was characterized using the four-probe electrical conductivity measurement technique. This method works by connecting the material pallet by the surface contact of equally spaced parallel probes. The contacting pattern of the probes has led the method to be referred to as the four-probe method, as shown in Figure 14a. For the measurement of the conductivity of the pallet, the voltage obtained at the inner two probes, corresponding to the applied DC current to the outer two probes of the system is measured.
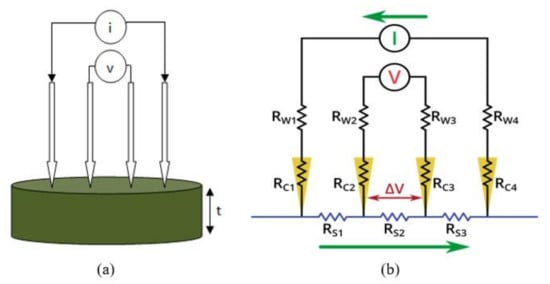
Figure 14.
(a) Four-probe contact for conductivity measurement of PANI (ES) pallet. (b) Equivalent circuit diagram of a four-point probe, showing the wire resistances as RW, contact resistances as RC, and sample resistances as RS. The green arrows represent current flow.
The formula employed for the measurement of sample resistance is given as
where Rs, V and i represent the resistance of the pallet (ohm), the obtained voltage (volt) between the inner probes, and the current (ampere) applied between the outer probes, respectively. There is also an additional factor present in Equation (7) as a geometrical correction factor as. This geometrical correction factor depends on the geometrical structure of the pallet placed under observation, as well as the positioning of the probes. It is also responsible for the limitations of the pathways of the applied current through the sample pallet. It is interesting to note that the most accurate measurements are obtained when the probes are positioned at the center of the sample. The resistivity of the sample pallet can be calculated, if the geometrical information of the sample is available, such as its thickness (t) using Equation (8).
Here, and t represent the resistivity (ohm-meter) and thickness (meter) of the sample pallet, respectively. The conductivity of the sample is the inverse of the resistivity and can be calculated by Equation (9).
where σ is the conductivity of the sample, expressed as S/m (1/ohm-meter), where S stands for Siemens and m for meter. The circuit resistance of the four-probe measurements is shown in Figure 14b, where sample resistance is measured by eliminating wire and contact resistance from the sample resistance. There is no current flow through the inner probes; hence, the wire resistance Rw and contact resistance Rc do not take part in influencing the voltage measurement. As a result, voltage change in inner probes is entirely dependent on the sample resistance Rs. This method is also familiar by the name of the Kelvin technique.
To measure the conductivity of synthesized PANI (ES), first, the polymer powder was compressed by pressing the powder using a hydraulic press to make the pallet.
For conductivity measurement by the four-probe method under laboratory conditions, a 20 mA current (i) was passed through the two outer contacts of the probes while the voltage drop (V) was measured and Equations (7)–(9) were employed for the conductivity calculations.
The electrical resistance variance of the gas sensor during hydrogen sulfide (H2S) gas exposure was measured using a digital multimeter. The two probes of the multimeter were connected to the ends of printed interdigitated electrodes.
2.3.2. Surface Characterization
FESEM was employed to identify morphology and geometry of synthesized tungsten oxide. The samples were sent to the instrumentation facility of Lovely Professional University Punjab (India) for carrying out FESEM characterization of tungsten oxide. The characterization was obtained in the magnification range of 4500 to 105, accelerating voltage of 15.0 kV, and working distance (WD) 8.1 mm.
2.3.3. Phase Characterization
The phase and crystal nature of the composite films before and after hydrogen sulfide gas exposure were characterized using XRD, at the instrumentation facility of Dr. B. R. Ambedkar National Institute of Technology, Jalandhar (India). The X-ray diffractometer (XRD) with a 2θ scan from 10° to 80° and Cu K -Alpha radiation (λ = 1.54060 Å) was used as the X-ray source.
2.3.4. Chemical Characterization
In this research work, UV–VIS was employed to characterize the chemical conversion of PANI (EB), PANI/WO3, PANI/CuCl2 and PANI/ WO3/CuCl2 in the NMP (N-methyl-2-pyrrolidone) solvent. The spectrometer used had an absorption range of 190 to 1100 nm, available in the Environment Pollution Laboratory, Department of Chemical Engineering Department, Dr. B. R. Ambedkar National Institute of Technology, Jalandhar, Punjab, India.
2.4. Parameters Used for Determining Performance of Chemiresistive H2S Gas Sensors
The performance of the chemiresistive gas sensor was characterized by various parameters such as sensor response %, response and recovery time, as explained below.
- Response time was calculated as the time required by the sensor’s resistance to reach up to 90% of its total resistance when exposed to the target gas.
- Recovery time was noted as the time required by the sensor’s resistance to reach up to 90% of its original state when the target gas is removed.
- Response %: where Rair: resistance of the sensor in air; and Rgas: resistance of the sensor in H2S gas environment.
3. Results
3.1. Conductivity Analysis of Synthesized Polyaniline
The synthesized polyaniline (ES) was finally obtained as a dark green color powder, as shown in Figure 15a. It is the desired conductive form of polyaniline (ES). For the conductivity analysis of the PANI (ES), first it was converted to a pellet with the help of a hydraulic press, as shown in Figure 15b.
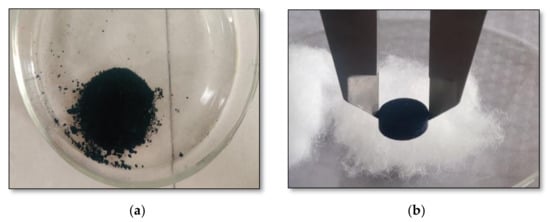
Figure 15.
(a) Polyaniline (ES) obtained after synthesis. (b) Pallet of PANI (ES).
- Size of the pallet: diameter—10 mm; thickness—3 mm
The conductivity analysis of the obtained pellet was performed using the four-probe method. The obtained voltage (mV) against applied current to the pellet in the range of 0–20 mA was noted. Figure 16 represents the data obtained for the applied current and the voltage in a graphical form. It can be seen that the obtained voltage is directly proportional to the applied current. The graph shows an almost linear relationship between the current and voltage, having an R2 = 0.995.
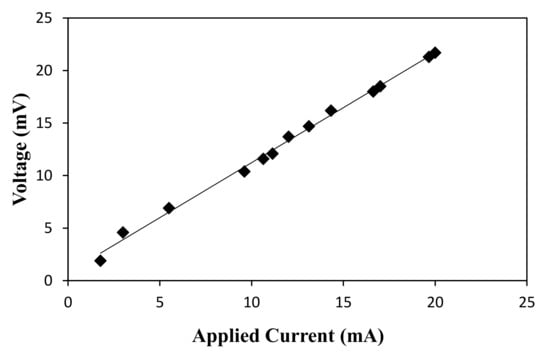
Figure 16.
Voltage obtained corresponding to the applied current in four-probe method.
When a D.C. current at 20 mA was applied to the two outer probes of the instrument, it obtained a voltage of 21.7 mV. By substituting the voltage readings obtained for the applied current in Equation (10), the calculated conductivity for synthesized PANI (ES) came out as 0.677 S/cm.
Similarly, the conductivity of PANI (EB) was calculated. For obtaining PANI (EB), PANI (ES) was treated with 0.1 M NH4OH solution for 24 h and then converted to pellet. The conductivity of the PANI (ES) pellet was found to be 1.83 × 10⁻² S/cm. The decreased conductivity confirmed the formation of PANI (EB), i.e., a non-conductive form of polyaniline
3.2. Morphological Analysis of Synthesized Tungsten Oxide
The finally obtained tungsten oxide powder had a greenish yellow color, as shown in Figure 17. This is the standard color of commercially available tungsten oxide.

Figure 17.
Final powder form of synthesized tungsten oxide.
The morphology and surface characteristics of tungsten oxide were characterized using the field emission scanning electron microscopy technique as follows.
The images in Figure 18 show the morphological and cross-sectional view of tungsten oxide particles at micro and nano measurement scales, showing its microstructure and nanostructure, respectively, in varying magnification. Figure 18a shows the morphological view of tungsten oxide at a 1 µm scale with 4500× magnification indicating light flecks on the surface assembled in a flower. Figure 18b shows a longer magnification view at the same scale, indicating a perpendicularly distributed cubical rod-like structure. In further close images in Figure 18c,d, homogeneously distributed well-aligned rods assembled in a round shape. Finally, the nano-scale images of the particles are presented in Figure 18e,f; it shows clear nano-rods from a cross-sectional view in vertically closed contact.
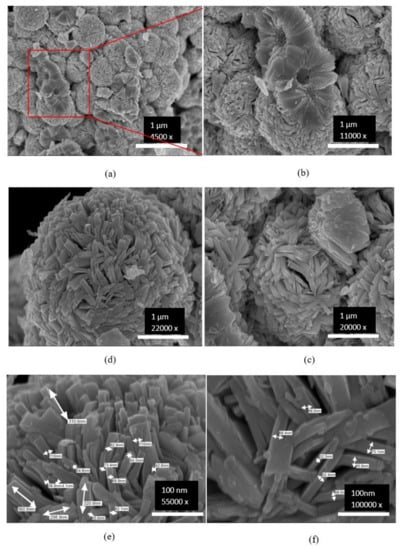
Figure 18.
(a–d) Scale images (1 µm) of tungsten oxide particles at 4500×, 11,000×, 20,000× and 22,000× magnification view, respectively. (e,f) Scale images (100 nm) of tungsten oxide at 55,000× and 100,000× magnification, respectively, along with its three-dimensional average size distribution.
From these images, it was confirmed that the synthesized tungsten oxide particles were in the nano-scale range. They were homogeneously distributed in the form of nano-rod-like structures. The images also show the three-dimensional size distribution of the particles which is as follows:
- The average size distribution of nano-plates: average width: 80 nm; average length: 320 nm; and average height: 60 nm.
The vertically distributed nano-rods were closely bound in a round particle shape. When these particles were mixed in conductive polymer composite, it resulted in a nano-composite form. Hence, these were responsible for increasing the surface to volume ratio of the composite film for better adsorption of target gas.
3.3. Stability Analysis of Deposited Films
The films of PANI/CuCl2 and PANI/WO3/CuCl2 composites were deposited by drop-casting and screen-printing methods. The films were deposited on the screen-printed silver interdigitated electrodes (IDEs). For the printing of silver IDEs, polyethylene terphthalate (PET) was used as a flexible plastic substrate. The drop-casted films were observed to be thick and non-uniform compared with screen-printed films. Moreover, the drop-casted films started to crack and flake off from the substrate within an hour after complete drying of the films which is not favorable for stability of the film.
The screen-printed composite films were obtained with a varying number of prints, ranging from 1 to 7 prints as shown in Figure 19. It was observed that the film thickness increased with an increasing number of prints. The characteristics of the films were also affected by the number of prints. The thin films obtained with less than four prints gave a high surface to volume ratio compared with the films obtained with a higher number of prints which is favorable for gas-sensing application. However, the thin films had pore spaces. The pore spaces affected the uniformity of the film which is not desirable for gas-sensing operations. On the other hand, a thicker film obtained with more than six prints showed an increasing tendency of cracking which is not favorable for the stability and continuity of the film. Hence, the optimum number of prints was selected as five for performing further experiments. The film with five prints was stable and non-flaky. The obtained films were uniform.

Figure 19.
PANI/CuCl2 screen-printed films with varying number of prints.
It was also observed that the films obtained with PANI/WO3/CuCl2 nano-composite were more closely bound as compared with PANI/ CuCl2 films at an equal number of prints. The better stability of the PANI/WO3/CuCl2 nano-composite film was due to the addition of WO3 nanoparticles which caused high intermolecular attraction among the particles of the ternary composite film. The relative uniformity and continuity of PANI/ CuCl2 and PANI/WO3/CuCl2 nano-composite films can be seen by comparing PANI/ CuCl2 film with five prints in Figure 19 and Figure 20 which shows a 5-print film of PANI/ WO3/CuCl2.

Figure 20.
PANI/WO3/CuCl2 screen-printed film with 5 prints.
From the above results, it was confirmed that, although the drop-casted films are extremely easy to develop with the minimum employment of equipment, the deposited films are not favorable for gas adsorption due to their instability and non-uniformity. On the other hand, screen-printed films are more stable and uniform which is favorable for gas adsorption processes.
3.4. Electrical Response of PANI/CuCl2 and PANI/WO3/CuCl2 Film-Based Chemiresistors towards H2S Gas
First, the screen-printed films of PANI/WO3/CuCl2 nano-composite were optimized in terms of polyaniline and tungsten oxide ratio in the mixture of PANI, WO3 and 0.08 M CuCl2 in NMP solvent. The ratios were kept at 0.25, 0.5, 0.75, and 1 and compared according to the corresponding responses obtained as shown in Figure 21. To test their responses, the screen-printed sensor was connected to a digital multimeter and closed in a glass container one by one provided with a 1.15 ppm H2S gas supply, temperature, and humidity sensors. The difference in the responses is attributed to the effect on the p–n junction at the interface of PANI and WO3. The mixing ratio influenced the thickness of the p–n junction-induced depletion layer which affected its sensing characteristics.

Figure 21.
Change in response of PANI/WO3/CuCl2-based sensors with varying ratio of PANI and WO3.
It can be observed in Figure 21 that the response % of the film changed from 60.56% to 93.62% for change in ratio from a 0.25 to 0.5 ratio. Upon further increasing the ratio in the composite, the response decreased, which implies that the PANI layer on WO3 would be too thick for the gas to be in contact with the WO3. Due to the high thickness, the reverse-bias resistance of the p–n junction would be too high for the migration of electrons, resulting in a decrease in response. The maximum response was obtained at a 0.5 ratio; therefore, it was taken as optimum for the study.
The response and recovery behavior of the sensor was further explored using PANI/CuCl2 and PANI/WO3/CuCl2 composite-based films at different concentrations of H2S gas, as shown in Table 1 and Table 2, respectively. The background conditions were kept at room temperature and 50% humidity. It can be seen that the resistance of both binary and ternary composite systems dropped under the influence of gas due to the doping of polyaniline; as a result, the conductivity of the sensor increased. Table 1 and Table 2 represent comparative data collected for hydrogen sulfide gas detection in terms of gas-sensing characteristics such as response %, response and recovery time for PANI/ CuCl2 and PANI/WO3/ CuCl2 nano-composite films.

Table 1.
Response and recovery behavior of PANI/CuCl2 film-based sensor when exposed to H2S gas.
Table 2.
Response and recovery behavior of PANI/WO3/ CuCl2 film-based sensor when exposed to H2S gas.
It can be seen that the ternary nano-composite film is more effective in terms of performance as shown in Figure 22. It also shows the change in resistance of the films under the influence of the gas, i.e., it shows the manner in which resistance started to decrease with time and after a saturation point the resistance became constant. Furthermore, when the gas was vented out of the system, the resistance of the film started to increase again and almost reached to its initial value. The change in resistance of the ternary composite is greater and faster as compared with others. The response time of the ternary system is faster due to the incorporation of tungsten oxide nanoplates which increased the number of sites for the gas to react with and reduced the gas diffusion rate. However, the recovery time increase may be attributed to the higher adsorption rate than the desorption rate due to the heavier nature of H2S gas.

Figure 22.
Change in resistance of PANI/CuCl2 and PANI/WO3/CuCl2-based sensors with time.
In the binary composite sensor, after six cycles of gas adsorption and desorption, the response declined due to consumption of available sensing material to react with gas because of the irreversible conversion of copper chloride into copper sulfide which is very stable. In the ternary sensor, the recovery is a more acceptable concept due to the reversible reactivity of tungsten oxide with the interacting gas. Moreover, the response of PANI/WO3/CuCl2 nano-composite film increased linearly with increasing gas concentration, having the lowest response of 58.97% and the highest of 93.62% at 0.3 and 1.15 ppm of gas concentration, respectively, as shown in Figure 23 which indicates the calibration curves of the binary and ternary composite films as a function of gas concentration. The calibration curve showed significant linearity with R² = 0.845 and R² = 0.982 for PANI/WO3/CuCl2 and PANI/CuCl2 films, respectively.
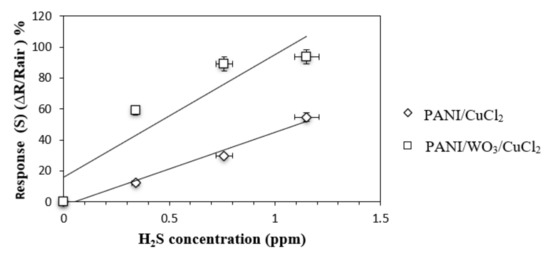
Figure 23.
Calibration curve for sensor response with increasing H2S gas concentration.
3.5. Electrical Response of PANI/WO3/CuCl2 Film towards Variable Ambient Humidity
The presence of humidity along with the gaseous environment of the sensor have been the major impact parameters of the sensor performance by blocking the gas adsorption sites of the sensing film due to the physisorption of water molecules or by causing ionic mobility. The incorporation of tungsten oxide improved the insensitivity of the composite film towards humidity. There was a negligible response towards lower relative humidity % (RH < 40%). However, a slight response was observed for higher RH% (RH > 50%), which shows that the films are capable of being used under dry as well as humid conditions, as shown in Figure 24. It represents the resistance change in the composite films as a function of ambient relative humidity in an exposure time of 100 min at room temperature. The binary composite film showed a significant change in resistance with increasing relative humidity, which suggests the application of this film sensor in dry conditions.
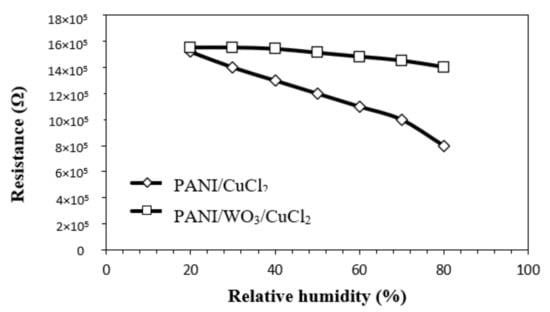
Figure 24.
Change in resistance of PANI/CuCl2 and PANI/WO3/CuCl2-based sensors with changing ambient relative humidity %.
3.6. Chemical Characterization of Active Components of PANI/WO3/CuCl2 Nano-Composite by Ultraviolet–Visible Spectrum (UV–vis)
The chemical conversion of components in the NMP (N-methyl-2-pyrrolidone) solution was characterized using the UV–vis absorption spectrum. The absorption spectrum helps in the qualitative analysis of prepared composites. The conversion of synthesized dark brown PANI (EB) to a blue coloration in NMP solutions indicated its partial oxidization which showed the absorption peaks as shown in Figure 25. The PANI (EB) in NMP shows two peaks at 328 and 630 nm, which are in good agreement with the literature values [28]. The first peak at 328 suggested excitations of the benzenoid rings due to π–π* transition. The peak at 630 originates from the excitation transition of the quinoid rings. This transition peak strongly favors the presence of conjugation bonding in the PANI. It can be seen that the UV–vis spectra of PANI and WO3 composite are almost analogous to pure PANI with some slight moving bands which may be caused by the aromatic polyaniline and tungsten oxide nanoplate interaction [29]. The absorption peaks of polyaniline and copper chloride in NMP solution were observed at 328 nm and 535 nm. The shift in peaks from pure PANI indicated the partial oxidization of polyaniline due to chemical interaction between PANI and Cu2+ ions [30]. This partial oxidation converts polyaniline (ES) to a polyaniline pernigraniline form which is a second kind of non-conductive form of polyaniline. The ternary composite prepared by the addition of WO3 in PANI/CuCl2 dispersion showed analogous absorption spectra to PANI/CuCl2 spectra. Some shifts were obtained which indicated aromatic ring transformation.

Figure 25.
Ultraviolet visible spectra of components present in PANI/WO3/CuCl2 composites to analyze their chemical conversion in NMP (N-methyl-2-pyrrolidone) solution.
3.7. Phase Characterization of the Film by X-ray Diffraction (XRD)
The crystallinity and phase of the PANI/WO3/CuCl2 nano-composite were checked using XRD with a 2θ scan from 10° to 80°. Cu K -Alpha radiation (λ = 1.54060 Å) was used as the X-ray source. Figure 26 shows the XRD pattern of PANI film synthesized by the chemical oxidative method and WO3 nano-film obtained by the hydrothermal method.
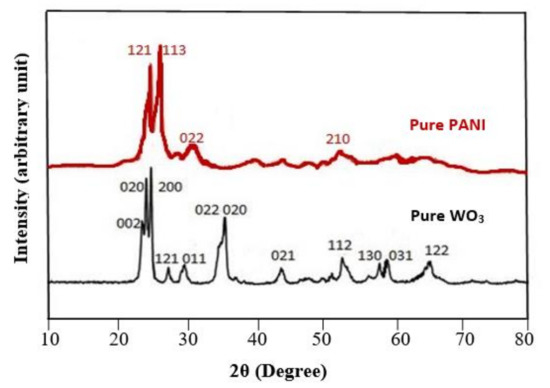
Figure 26.
XRD spectrum of pure PANI and WO3 nanoplates.
PANI yielded two major crystalline peaks at around 2θ = 22° and 26° with (121) and (113) plane directions, respectively. The sharpness (width) of the peaks represented the degree of orientation of the polymer chains in that particular crystal plane and the intensity (peak height) denoted the population of crystallites in that plane. Some broad peaks can be seen at around 30° and 52° indicating slight amorphous PANI nature. For pure WO3, the highest peaks were at 22.5°, 23.7°, and 25°, having plane directions of (002), (020), and (200), respectively. It can be clearly seen that the intensity of the observed peaks for the crystalline WO3 film is higher and the lines are comparatively sharper which indicates the high purity and crystalline nature of tungsten oxide.
The XRD pattern for PANI/WO3/CuCl2 nano-composite film before and after interaction with H2S were also obtained for analyzing the relative behavior of film due to gas exposure as shown in Figure 27 and Figure 28, respectively. It shows that the XRD spectra of the composite film is more pronounced which indicates the high purity and crystalline behavior of the composite. The pure components retained their identity in composite form by showing analogous peaks in the composite XRD spectrum. Some extra peaks other than PANI and WO3 are formed due to the incorporation of CuCl2 in the composite.

Figure 27.
XRD spectrum of PANI/WO3/CuCl2 composite.
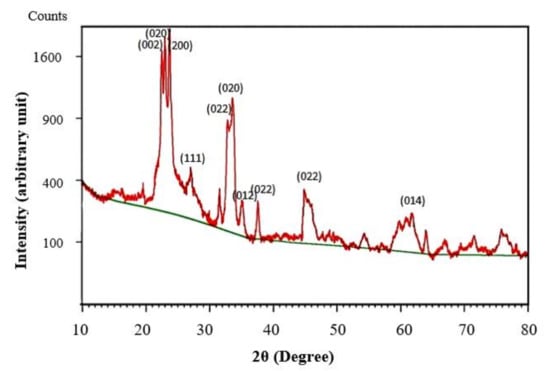
Figure 28.
XRD spectrum of PANI/WO3/CuCl2 after formation of copper sulfide in the composite due to interaction with H2S gas.
After hydrogen sulfide gas exposure to the composite film, the XRD pattern of formation of copper sulfide was also realized which confirms the presence of metal sulfide, that further favors the release of strong acid. The sulfide peaks were found at 2θ of 27.65°, 45.94°, and 76.215°. The sulfide peaks were not sharp which indicates that the inter planner spacing in the elements was large.
4. Discussion/Mechanism
The gas-sensing mechanism of semiconductors is generally surface controlled and used in air at atmospheric pressure, so the adsorption of oxygen and gas at the film surface plays an important role here. The addition of WO3 nanoparticles in the PANI matrix induced a porous structure in the film which is responsible for the high surface to volume ratio of the film. As a result, the gas diffusion becomes easier because of more active sites being available for gas to react with. The high response of the PANI-WO3-CuCl2 composite-based chemiresistive sensor is due to the occurrence of multiple phenomena happening simultaneously during H2S gas sensing as follows:
4.1. Formation of Depletion Layer Due to Inosorbed Oxygen
When the sensor is exposed to the open atmosphere, the oxygen present in the environment is absorbed on the surface of the film, termed as adsorbed oxygen (Equation (11)) due to the presence of metal oxides (WO3).
The adsorbed oxygen works as an electron acceptor to trap the electrons at the surface in the form of ions from the conduction band of the CP/metal oxide composite film, because they have electron affinity. This forms stable inosorbed oxygen species in different forms according to the operating temperature, as shown in Equations (12)–(14). It is well known that metal oxides work at high temperature; however, the inclusion of conductive polymer allows it to operate at room temperature, and hence Equation (12) is the most likely to occur during operation. As a result, an electron-depleted layer is obtained at the surface of the film [31] as shown in Figure 29a. In addition, due to coverage with conductive polymer, a larger surface area leads to an enhanced surface reaction of the hybrid structure through its accommodation of a large number of O2− adsorption sites [16].
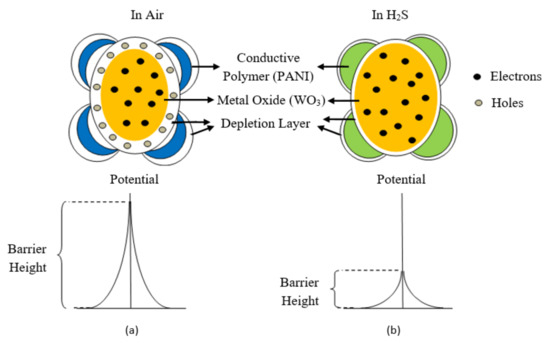
Figure 29.
(a) Formation of depletion layer as result of inosorbed oxygen and p–n junction at the surface of PANI/WO3 composite film. (b) Reduction in potential barrier due to thinning of depletion layer resulting in charge transport between PANI and WO3.
Inosorbed oxygen/absorbed oxygen species have been regarded as free oxygen ions, electrochemically stable on the surface (no local chemical bonding).
4.2. Formation of Depletion Layer Due to p–n Junction
Secondly, the amplification mechanism is dedicated to taking advantage of the variation in the p-n junction region in the heterostructures which can be very sensitive to gas adsorption. The heterojunction here refers to the physical interface between two dissimilar semiconducting materials, i.e., conductive polymer and metal oxide, by creating intimate electrical contact at their interface. It is well known that WO3 is an n-type inorganic semiconductor, which has electrons as a major charge carrier and PANI is a p-type organic semiconductor which has holes as a major charge carrier. When PANI and WO3 come into contact due to the difference in their work function, the Fermi level across the interface equilibrates to the same energy which results in charge transfer and the formation of a depletion layer [32]. The heterojunction-induced depletion layer coexists with the depletion layer induced by the adsorbed oxygen on the surface. Therefore, two simultaneous depletion layers result in a wider depletion layer than the pure metal oxide films. As a result, the potential barrier and resistance of the film at this point is very large, hindering the flow of charge carriers [6] as shown in Figure 29a.
4.3. Involvement of Silver Electrodes
Depositing PANI/WO3/CuCl2 film on silver IDE, the digits were seen to become dark brown which indicated the presence of metallic copper due to the oxidation of silver and reduction of copper in the presence of chloride ions as shown in Equation (15). Some formation of copper (I) chloride and silver chloride may also occur as per Equation (16).
These released metallic copper and silver chloride ions are involved in the reaction with hydrogen sulfide gas during sensing application and enhance the response of the sensor.
When electron-donating hydrogen sulfide gas is adsorbed at the surface of the film, it reacts with the metallic copper and silver chloride released in Equations (15) and (16) above. The formation of copper sulfide is realized during hydrogen sulfide metallic copper along with the release of protons and electrons, as shown in Equation (16). The interaction of silver chloride with hydrogen sulfide also formed a sulfide compound of silver along with the release of a strong acid, HCl, as shown in Equation (17).
The released proton and HCl strongly doped PANI (EB) and converted it to the conductive PANI (ES), as shown in Equation (19), and the electrons released started to migrate to the metal oxide surface simultaneously. As a result, the depletion layer started to become thinner due to the flow of charge carrier and induced increased film conductivity which decreased the potential barrier height as shown in Figure 29b. Due to the lower potential barrier, more electrons migrated from PANI to metal oxide which further increased the conductivity of the system.
In addition, the direct reactivity of nanostructured WO3 (tungsten oxide) with H2S gas may also be involved along with the heterojunction which may be attributed to the high sensitivity of WO3 towards H2S [13]. The sulfidation of WO3 during H2S gas exposure (Equation (20)) can increase the conductivity measurement of the PANI/ WO3/CuCl2 composite film, as tungsten sulfide is more conductive in nature than its oxide form.
It is known that PANI/CuCl2-based composites are unrecoverable or partially recoverable due to a limited reservoir of metallic copper. Hence, the reversible sulfidation of tungsten oxide provides a more acceptable explanation for the continuous reversible conductivity of the PANI/ WO3/CuCl2 composite film.
In recovery phase, when gas was cleaned out of the system, the WS2 was oxidized back to WO3 according to Equation (21), which refreshes the film surface from sulfur and takes the system back to its initial stage of high resistance.
5. Conclusions
The hydrogen sulfide gas-sensitive chemiresistive sensor using a nanocomposite of PANI/WO3/CuCl2 was screen printed on flexible plastic substrate of polyethylene terphthalate (PET). The nano-scale morphology of the composite was confirmed by FE-SEM analysis which showed tungsten oxide particles in nano-rectangular shapes, i.e., rod-like structure. The screen-printed films were uniform, stable, and non-flaky at an optimum number of prints of 5.
The ratio of PANI and WO3 affected the gas-sensing characteristics of the film and showed the highest response at an optimum ratio of 0.5. Furthermore, it was tested at different concentrations of H2S gas and showed an increasing response with increasing concentration of gas. PANI/WO3/CuCl2 film was more responsive than the binary composite film of PANI/CuCl2. The highest response of two orders of magnitude change, 93%, was found around 1 ppm of gas concentration with a response time of 67.9 s at room temperature. The high response of PANI/WO3/CuCl2 is associated with the incorporation of WO3 at the nano scale which induced a high surface to volume ratio that in turn increased the gas diffusion rate and p–n junction in the sensing mechanism. The sensor was able to significantly detect H2S gas at concentrations as low as 0.3 ppm. However, this nanocomposite showed a comparatively increased recovery time which may be attributed to the trapped gas molecules inside the porous structure of film due to the heavier nature of hydrogen sulfide gas.
This study suggested that PANI/WO3/CuCl2 is a great composite for improving the reversibility and humidity sensitivity of PANI/CuCl2 composite-based chemiresistors during H2S gas sensing, and that the screen-printing technique is a facile and economical way of developing stable and uniform film-based chemiresistive gas sensors.
Author Contributions
Conceptualization: M.K., R.K.A. and G.D.V.; Methodology: M.K., R.K.A. and G.D.V.; Formal analysis: M.K., D.T., R.K.A., G.D.V., S.B., G.H. and P.S.; Resources: M.K. and R.K.A.; visualization: M.K. and R.K.A.; Supervision: R.K.A. and G.D.V.; project administration: R.K.A., G.D.V., S.B., G.H. and P.S.; Writing: M.K. and D.T. All authors have read and agreed to the published version of the manuscript.
Funding
There was no funding for this work.
Institutional Review Board Statement
Not applicable.
Informed Consent Statement
Not applicable.
Data Availability Statement
Not applicable.
Acknowledgments
Raj Kumar Arya is highly thankful to Sarada Paul Roy for proof reading, language editing, her support, and encouragement.
Conflicts of Interest
The authors declare no conflict of interest.
References
- Hulanicki, A.; Glab, S.; Ingman, F. Chemical sensors: Definitions and classification. Pure Appl. Chem. 1991, 63, 1247–1250. [Google Scholar] [CrossRef]
- Stetter, J.R.; Penrose, W.R.; Yao, S. Sensors, chemical sensors, electrochemical sensors, and ecs. J. Electrochem. Soc. 2003, 150, S11. [Google Scholar] [CrossRef]
- Wong, Y.C.; Ang, B.C.; Haseeb, A.; Baharuddin, A.A.; Wong, Y.H. Conducting polymers as chemiresistive gas sensing materials: A review. J. Electrochem. Soc. 2019, 167, 037503. [Google Scholar] [CrossRef]
- Sarfraz, J.; Fogde, A.; Ihalainen, P.; Peltonen, J. The performance of inkjet-printed copper acetate based hydrogen sulfide gas sensor on a flexible plastic substrate-varying ink composition and print density. Appl. Surf. Sci. 2018, 445, 89–96. [Google Scholar] [CrossRef]
- Yoo, K.S.; Han, S.D.; Moon, H.G.; Yoon, S.-J.; Kang, C.-Y. Highly sensitive h2s sensor based on the metal-catalyzed sno2 nanocolumns fabricated by glancing angle deposition. Sensors 2015, 15, 15468–15477. [Google Scholar] [CrossRef]
- Su, P.-G.; Peng, Y.-T. Fabrication of a room-temperature h2s gas sensor based on ppy/wo3 nanocomposite films by in-situ photopolymerization. Sens. Actuators B Chem. 2014, 193, 637–643. [Google Scholar] [CrossRef]
- Suhail, M.H.; Abdullah, O.G.; Kadhim, G.A. Hydrogen sulfide sensors based on pani/f-swcnt polymer nanocomposite thin films prepared by electrochemical polymerization. J. Sci. Adv. Mater. Devices 2019, 4, 143–149. [Google Scholar] [CrossRef]
- Persaud, K.C. Polymers for chemical sensing. Mater. Today 2005, 8, 38–44. [Google Scholar] [CrossRef]
- Kang, S.D.; Snyder, G.J. Charge-transport model for conducting polymers. Nat. Mater. 2017, 16, 252–257. [Google Scholar] [CrossRef]
- Mekki, A.; Joshi, N.; Singh, A.; Salmi, Z.; Jha, P.; Decorse, P.; Lau-Truong, S.; Mahmoud, R.; Chehimi, M.M.; Aswal, D.K. H2S sensing using in situ photo-polymerized polyaniline–silver nanocomposite films on flexible substrates. Org. Electron. 2014, 15, 71–81. [Google Scholar] [CrossRef]
- Sarfraz, J.; Ihalainen, P.; Määttänen, A.; Peltonen, J.; Linden, M. Printed hydrogen sulfide gas sensor on paper substrate based on polyaniline composite. Thin Solid Film. 2013, 534, 621–628. [Google Scholar] [CrossRef]
- Peera, S.G.; Liu, C.; Shim, J.; Sahu, A.K.; Lee, T.G.; Selvaraj, M.; Koutavarapu, R. Mxene (ti3c2tx) supported electrocatalysts for methanol and ethanol electrooxidation: A review. Ceram. Int. 2021, 47, 28106–28121. [Google Scholar] [CrossRef]
- Poongodi, S.; Kumar, P.S.; Mangalaraj, D.; Ponpandian, N.; Meena, P.; Masuda, Y.; Lee, C. Electrodeposition of wo3 nanostructured thin films for electrochromic and h2s gas sensor applications. J. Alloy. Compd. 2017, 719, 71–81. [Google Scholar] [CrossRef]
- Jain, G.; Patil, L.; Wagh, M.; Patil, D.; Patil, S.; Amalnerkar, D. Surface modified batio3 thick film resistors as h2s gas sensors. Sens. Actuators B Chem. 2006, 117, 159–165. [Google Scholar] [CrossRef]
- Geng, L. Gas sensitivity study of polypyrrol e/wo3 hybrid materials to h2s. Synth. Met. 2010, 160, 1708–1711. [Google Scholar] [CrossRef]
- Bai, S.; Zhang, K.; Sun, J.; Zhang, D.; Luo, R.; Li, D.; Liu, C. Polythiophene-WO3 hybrid architectures for low-temperature H2S detection. Sens. Actuators B Chem. 2014, 197, 142–148. [Google Scholar] [CrossRef]
- Joshi, N.; Saxena, V.; Singh, A.; Koiry, S.; Debnath, A.; Chehimi, M.M.; Aswal, D.; Gupta, S. Flexible h2s sensor based on gold modified polycarbazole films. Sens. Actuators B Chem. 2014, 200, 227–234. [Google Scholar] [CrossRef]
- Agbor, N.; Petty, M.; Monkman, A. Polyaniline thin films for gas sensing. Sens. Actuators B 1995, 28, 173. [Google Scholar] [CrossRef]
- Liu, C.; Hayashi, K.; Toko, K. Au nanoparticles decorated polyaniline nanofiber sensor for detecting volatile sulfur compounds in expired breath. Sens. Actuators B Chem. 2012, 161, 504–509. [Google Scholar] [CrossRef]
- Virji, S.; Fowler, J.D.; Baker, C.O.; Huang, J.; Kaner, R.B.; Weiller, B.H. Polyaniline nanofiber composites with metal salts: Chemical sensors for hydrogen sulfide. Small 2005, 1, 624–627. [Google Scholar] [CrossRef]
- Crowley, K.; Morrin, A.; Shepherd, R.L.; in het Panhuis, M.; Wallace, G.G.; Smyth, M.R.; Killard, A.J. Fabrication of polyaniline-based gas sensors using piezoelectric inkjet and screen printing for the detection of hydrogen sulfide. IEEE Sens. J. 2010, 10, 1419–1426. [Google Scholar] [CrossRef]
- Green, A.G.; Woodhead, A.E. Ccxliii.—aniline-black and allied compounds. Part I. J. Chem. Soc. Trans. 1910, 97, 2388–2403. [Google Scholar] [CrossRef]
- Sarfraz, J. Development and characterization of thin printed films for gas sensing applications. Ph.D. Thesis, Åbo Akademi University, Turku, Sweden, August 2015. [Google Scholar]
- Khalid, M.; Honorato, A.; Varela, H. Polyaniline: Synthesis methods, doping and conduction mechanism. In Polyaniline—From Synthesis to Practical Applications; IntechOpen: London, UK, 2018. [Google Scholar]
- Colak, N.; Sökmen, B. Doping of chemically synthesized polyaniline. Des. Monomers Polym. 2000, 3, 181–189. [Google Scholar] [CrossRef]
- Huang, G.; Lu, C.-H.; Yang, H.-H. Magnetic nanomaterials for magnetic bioanalysis. In Novel Nanomaterials for Biomedical, Environmental and Energy Applications; Elsevier: Amsterdam, The Netherlands, 2019; pp. 89–109. [Google Scholar]
- Rahayu, I.; Eddy, D.R.; Novianty, A.R.; Anggreni, A.; Bahti, H.; Hidayat, S. The Effect of Hydrochloric Acid-Doped Polyaniline to Enhance the Conductivity; IOP Conference Series: Materials Science and Engineering; IOP Publishing: Bristol, UK, 2019; p. 012051. [Google Scholar]
- Nguyen, H.D.; Nguyen, T.H.; Hoang, N.V.; Le, N.N.; Nguyen, T.N.N.; Doan, D.C.T.; Dang, M.C. Ph sensitivity of emeraldine salt polyaniline and poly (vinyl butyral) blend. Adv. Nat. Sci. : Nanosci. Nanotechnol. 2014, 5, 045001. [Google Scholar] [CrossRef]
- Belardja, M.; Djelad, H.; Lafjah, M.; Chouli, F.; Benyoucef, A. The influence of the addition of tungsten trioxide nanoparticle size on structure, thermal, and electroactivity properties of hybrid material–reinforced pani. Colloid Polym. Sci. 2020, 298, 1455–1463. [Google Scholar] [CrossRef]
- Izumi, C.M.; Rodrigues, D.C.; Pelaes, L.A.G.; Ferreira, A.M.D.C.; Temperini, M.L. Influence of different copper (ii) salts on the oxidation and doping reactions of emeraldine base polyaniline. Vib. Spectrosc. 2016, 87, 129–136. [Google Scholar] [CrossRef]
- Ali, F.I.; Awwad, F.; Greish, Y.E.; Abu-Hani, A.F.; Mahmoud, S.T. Fabrication of low temperature and fast response H2S gas sensor based on organic-metal oxide hybrid nanocomposite membrane. Org. Electron. 2020, 76, 105486. [Google Scholar] [CrossRef]
- Bai, S.; Ma, Y.; Luo, R.; Chen, A.; Li, D. Room temperature triethylamine sensing properties of polyaniline–WO3 nanocomposites with p–n heterojunctions. RSC Adv. 2016, 6, 2687–2694. [Google Scholar] [CrossRef]
Publisher’s Note: MDPI stays neutral with regard to jurisdictional claims in published maps and institutional affiliations. |
© 2022 by the authors. Licensee MDPI, Basel, Switzerland. This article is an open access article distributed under the terms and conditions of the Creative Commons Attribution (CC BY) license (https://creativecommons.org/licenses/by/4.0/).