Article

Asynchronous Synergistic Damage Effect of Atomic Oxygen and Space Micro Debris on Kapton Film

1
School of Materials Science and Engineering, Hebei University of Technology, Tianjin 300401, China
2
School of Mechanical Engineering, Hebei University of Technology, Tianjin 300401, China
3
State Key Laboratory of Reliability and Intelligence Electrical Equipment, Hebei University of Technology, Tianjin 300130, China
*
Authors to whom correspondence should be addressed.
Coatings 2022, 12(2), 179; https://doi.org/10.3390/coatings12020179
Submission received: 31 December 2021 / Revised: 26 January 2022 / Accepted: 28 January 2022 / Published: 30 January 2022
(This article belongs to the Special Issue Novel Coatings for Corrosion Protection)

Abstract

:
In the low earth orbit environment, many environmental factors lead to the degradation of material properties. The synergistic effect of long-term atomic oxygen (AO) irradiation and instantaneous impact of micro debris (MD) on long-term and transient space environmental factors has attracted more and more attention. In this paper, the performance evolution of Kapton films under the conditions of MD, AO single factor load spectrum and MD + AO, AO + MD asynchronous synergistic load spectrum were studied by laser driven flyer and microwave atomic oxygen technology. The macro morphology, optical properties and quality changes of Kapton films before and after each load spectrum were compared, and the mechanism of micro morphology and structure changes was explored. The results show that compared with MD + AO loading spectrum, the surface holes of Kapton films are larger under AO + MD load spectrum condition, the residual aluminum particles formed by reverse sputtering of Al particles during impact are less, the average transmittance of the film decreases slightly, and the weight loss of Kapton film is slightly more under the same atomic oxygen exposure time. Under the condition of MD + AO load spectrum, plastic tearing cracks, craters and holes are formed on the surface of Kapton film; the edge of the hole formed under the condition of AO + MD load spectrum is straight, without obvious depression and tear characteristics. Under the condition of MD + AO load spectrum, due to the adhesion of Al after the impact of micro debris, the subsequent atomic oxygen erosion of the film is reduced, so the C-C bond is not seriously damaged, and a considerable part of the residual aluminum flyer is oxidized to alumina by atomic oxygen; The AO + MD loading spectrum test makes the film first eroded by atomic oxygen, resulting in the reduction in C–O bond and C–C bond. The fracture of C–N bond is caused by the hypervelocity impact of micro debris. Hypervelocity impact leads to the thermal decomposition of the material, destroys the C–N bond in the imide ring and generates an N–H bond. This study will provide a method reference and a reference for the multi-factor ground collaborative simulation of space environment of spacecraft materials.

1. Introduction

During the operation of a spacecraft in orbit, it will be affected by many environmental factors, such as micro debris (MD), atomic oxygen (AO), ultraviolet, charged particles, high vacuum and so on [1,2,3]. The data of material performance degradation in single factor ground simulation test is often inconsistent with the data of space in orbit test, so the synergistic effect caused by various environmental factors has gradually attracted attention [4,5]. According to the different duration of environmental factors, on the one hand, it can be manifested as the long-term effect of continuous degradation of spacecraft surface materials until failure and termination of service, including atomic oxygen erosion, ultraviolet irradiation, charged particle irradiation, etc.; On the other hand, it can be expressed as the instantaneous effect of sudden damage to spacecraft surface materials leading to failure, including micro debris impact, single particle effect and so on [6,7,8].
In recent years, the long-term synergistic damage mechanism of aerospace materials, such as the synergistic effect of atomic oxygen and vacuum ultraviolet [9,10,11], and the synergistic effect of atomic oxygen and electron irradiation [12], has been widely studied. In view of the dynamic changes of long-term and instantaneous synergistic effects in time and space, there are complex sequential and coupling relationships [13], so far, there are few relevant studies. The physical impact and chemical erosion of long-term atomic oxygen will degrade the mechanical properties. The weight loss of polymer materials will also reduce the thermal, optical and mechanical properties [14]. The impact of instantaneous effect small debris will lead to holes and cracks in polymer materials, reduce the performance of spacecraft surface materials and reduce the service time of spacecraft surface polymers [15]. The long-term irradiation of atomic oxygen and the transient impact of small debris are typical synergistic effects of long-term and instantaneous space environmental factors. Previous studies have shown that the accelerated corrosion of polyimide materials is mainly manifested in the generation of new radial holes induced by AO. Due to the residual stress on the material surface caused by high-speed impact, the local free volume of the polymer increases, which promotes the diffusion of oxygen atoms into the polymer, thus accelerating the local degradation process [16]. The synergistic effect of atomic oxygen and micro debris will greatly aggravate the erosion speed of space materials. It is pointed out that the synergistic effect with space debris must be given when considering the erosion effect of atomic oxygen [17,18]. However, these studies focus on the damage behavior of polymer materials first impacted by debris and then eroded by atomic oxygen, and the damage mechanism of materials in the case of different action sequences of AO and MD has not been studied clearly. For the damage of materials caused by the synergistic effect of the two effects and the different damage on materials under the action of a single factor, this also needs to be further studied.
Polymers are often used as spacecraft surface materials for service [19]. For example, polyimide is widely used in the fire compartment of spacecraft and the flexible substrate of a solar panel, and silicone rubber is used as the condenser lens or binder of a spacecraft solar cell array [20,21]. Therefore, it is necessary to conduct ground simulation evaluation for polymers applied on the spacecraft surface. In this paper, the synergistic effect of atomic oxygen and micro debris is studied on Kapton film, which has excellent mechanical properties, insulation properties and thermal stability. The damage mechanism of Kapton film caused by the asynchronous synergistic effect of atomic oxygen and micro debris with different load spectra was explored. At the same time, the damage behavior of Kapton film under the separate action of two environmental factors was also compared. This study will provide a method reference and a reference for multi factor ground collaborative simulation of space environment of spacecraft materials.

2. Experiment

2.1. Materials

The material used in this work is diphenylamine oxide pyromellitic dianhydride (ODA-PMDA) polyimide (produced by DuPont, Wilmington, DE, USA), and the molecular formula of ODA-PMDA polyimide is shown in Figure 1. The test sample was 25 µm thick and cut to 20 mm × 20 mm rectangle. Before use, the sample was washed with absolute ethanol through an ultrasonic cleaner for ten minutes, and then dried naturally.

2.2. Ground Simulation Method of Atomic Oxygen and Micro Debris

The laser driven flyer (LDF) method was used to carry out the hypervelocity impact test of space micro debris. The equipment diagram is shown in Figure 2a. The aluminum film with thickness of 20 µm (1060 Al with purity of 99.5%, Shanghai Yuanbao metal materials Co., Ltd., Shanghai, China) was cut into 40 mm in diameter. Using 9307 ultraviolet light curing adhesive as binder, Al film was pasted on quartz glass (Jiangsu Chengtai quartz Co., Ltd., Lianyungang, China) with thickness of 1.5 mm and diameter of 40 mm as flyer target. Quartz glass and Al film can be pasted and fixed by irradiation with 380 nm ultraviolet for 3 min. Nimma 900 (Nd: YAG, Beijing LeiBao company, Beijing, China) was used as the laser source. The single pulse energy of the laser was set to 826 mJ, the frequency was 1 Hz and the pulse width was 7 ns. The peak power of the laser was 1.18 × 10⁸ w. The laser beam was focused into a spot of about 1 mm by the focusing lens and irradiated on the flyer target placed in the vacuum chamber with vacuum degree of 1 × 10⁻³ Pa. Laser ablation of flyer target resulted in rapid expansion of plasma with extremely high pressure and temperature, resulting in tensile stress along the vertical direction of aluminum film. When the tensile stress exceeds the tensile strength of the aluminum film, the micro aluminum flyer was formed, and with the plasma expansion, the flyer accelerated to a speed of about 2 km/s in a short distance and stroked the Kapton film material. In this paper, the average velocity of flyer was measured by piezoelectric method [22].
The atomic oxygen exposure test of Kapton film was carried out by using the ground simulation device of microwave plasma source. The equipment diagram is shown in Figure 2b. During the operation of the equipment, oxygen entered the atomic oxygen cavity. At the same time, the microwave generated by the microwave source entered the atomic oxygen cavity after being selected by the circulator. The gas was ionized by microwave discharge to form plasma. Under the action of magnetic field, the plasma accelerated to impact the metal target with negative bias, which made the plasma neutralize and reduce to obtain the neutral atomic oxygen beam [23]. The metal molybdenum sheet (Baoji Jiajun metal material Co., Ltd., Beijing, China) was used as the neutralization target with a diameter of 12 cm. The negative bias voltage on the target was provided by a 36 V direct current regulated power supply. The average energy of atomic oxygen was about 5 eV. The equivalent flux at the sample location was 8.2 × 10¹⁵ O-atoms cm−2·s−1.

2.3. Development of Load Spectra

In order to facilitate the description of the types and sequence of atomic oxygen and micro debris in the test scheme, the load spectrum method was used in this paper. Four groups of different load spectrum tests of atomic oxygen and micro debris were carried out. The test method is shown in Figure 3. Single factor load spectrum: (a) MD load spectrum: micro debris hypervelocity impact test was carried out on Kapton film; (b) AO load spectrum: atomic oxygen corrosion test was carried out on Kapton film, and the samples were exposed to atomic oxygen for 5, 10, 15, 20 and 25 h, respectively. Asynchronous cooperative load spectrum; (c) MD + AO load spectrum: five samples were subjected to micro debris hypervelocity impact test, and then atomic oxygen exposure test for 5, 10, 15, 20 and 25 h, respectively; (d) AO + MD load spectrum: Kapton films were exposed to atomic oxygen for 5, 10, 15, 20 and 25 h, respectively, and then each sample was subjected to micro debris hypervelocity impact test.

2.4. Material Performance Test and Characterization

The mass loss of Kapton film was measured by analytical balance (x-56, accuracy 0.1 mg, Mettler Toledo, Zurich, Switzerland). The atomic oxygen reaction coefficient of the corresponding sample was calculated according to the following formula [24]:
Re = Δ m φ · 1 ρ · A
where Δm is the mass change of the sample before and after atomic oxygen exposure, g; φ is the atomic oxygen flux, atoms/cm2; ρ is the sample density, 1.4 g/cm2; A is the exposed area of the sample, 4 cm2.
The optical properties of Kapton films were characterized by the average transmittance in the range of Φ20 mm in diameter. The optical property was characterized by ultraviolet, visible near infrared spectrophotometer (Lambda 1050, PerkinElmer, Waltham, MA, USA). The test wavelength ranged from 250 to 800 nm and the resolution was 0.5 nm. The surface morphology of Kapton film after erosion and impact was observed by high resolution field emission scanning electron microscope (SEM, JSM-7610F, JEOL, Tokyo, Japan) equipped with an energy dispersive spectrometer (EDS). It had an acceleration voltage of 10 kV. The sample surface was plated with gold (palladium alloy, particle size about 20 nm) before observation. Fourier transform infrared spectrometer (vertex80v, Bruker, Karlsruhe, Germany) was used for infrared spectrum test, and the spectral range was 2000–400 cm−1. X-ray photoelectron spectrometer (Escalab 250xi, Thermo Fisher, Waltham, MA, USA) was used to analyze the chemical bond states. The excitation source is Al Kα radial. All elements were corrected with C1s (about 284.8 eV) as a reference.

3. Results and Discussion

3.1. Optical Performance Analysis

The macro comparison of the original Kapton film, after MD + AO load spectrum and AO + MD load spectrum test Kapton film is shown in Figure 4. The atomic oxygen erosion time of the sample in Figure 4b,d,e was 25 h. It can be seen from the Figure 4a, the surface of the original Kapton film had luster. The film after atomic oxygen single factor loading spectrum test is shown in Figure 4b, and the surface lost gloss. In Figure 4c, after MD single factor load spectrum, there were many holes and cracks on the film surface, as well as Al particles. The film still had luster outside the impact area. Compared with MD + AO load spectrum, the surface holes of Kapton film under AO + MD load spectrum were larger and the residual aluminum particles were less.
The optical transmittance of Kapton film and the film after each load spectrum test is shown in Figure 5. In the load spectrum involving atomic oxygen the Figure 5, the exposure time of samples in atomic oxygen was 25 h. It can be seen from the figure that the transmittance trend of the film under the original and various load spectrum test conditions was the same as that in the literature [25,26,27]. In the ultraviolet region below 400 nm, the optical transmittance was about 5%. In the wavelength range of 470–800 nm, the optical transmittance of the film increased with the increase in wavelength. The transmittance increased rapidly in the wavelength range of 500–550 nm. In the 550–650 nm band, the increase in transmittance slowed down. The transmittance of 650–750 nm band increased obviously, and tends to be flat again when the wavelength was close to 800 nm.
The original Kapton film had the highest transmittance as a whole. Under the condition of MD single factor loading spectrum, the transmittance of Kapton film decreased by about 2% in the wavelength range of 600–800 nm. This can be attributed to the decrease in transmittance caused by the residual Al particle pollution on the surface of Kapton film after impact. After MD + AO loading spectrum test, the transmittance of the film was the lowest, which was about 10% lower than that of the original film in the wavelength range of 600–800 nm. The reason being, in addition to the Al particle pollution effect, the entire Kapton film surface was eroded by atomic oxygen, resulting in a significant decrease in film transmittance.
After AO single factor load spectrum test and AO + MD load spectrum test, the transmittance of the film was almost the same, which was about 8% lower than that of the original film. This can be attributed to the larger holes on the surface of Kapton film and less residual aluminum particles under the condition of AO + MD load spectrum, which increased the transmittance of the film to a certain extent. This is also consistent with the observation results of macro photo morphology in Figure 4.

3.2. Quality Change of Kapton Film

The weight loss curve of Kapton film with atomic oxygen etching time after different load spectrum tests is shown in Figure 6. It can be seen from Figure 6 that in the three load spectrum conditions, the weight loss of Kapton film increased with the extension of atomic oxygen exposure time. The three weight loss curves shown in the figure are approximately parallel and linear, and the fitting slope is about −0.197, which shows that the weight loss rate of Kapton film was almost the same under three different load spectrum test conditions. The mass loss law of Kapton film in AO single factor load spectrum is consistent with that in the literature [28,29].
It can be seen from the figure that under the same atomic oxygen exposure time, the test conditions of weight loss of Kapton material from large to small are AO single factor, AO + MD load spectrum and MD + AO load spectrum test. The average atomic oxygen reaction coefficient of Kapton materials can be calculated according to Formula (1) as 2.12 × 10⁻²⁴, 1.70 × 10⁻²⁴ and 0.99 × 10⁻²⁴ cm3/atom, respectively. The atomic oxygen reaction coefficient of Kapton film under AO single factor condition is close to 3.0 × 10⁻²⁴ cm3/atom reported in the literature [30], while the atomic oxygen reaction coefficient decreased to a certain extent under the conditions of AO + MD load spectrum and MD + AO load spectrum.
Under the three loading spectrum conditions, the difference in atomic oxygen erosion weight loss of Kapton films was mainly due to the impact of small Al flyers and the action sequence. The process mechanism of Al flyer impacting Kapton film at high speed is shown in Figure 7. When the Al flyer strikes the Kapton film, the integrity of the film is destroyed and shock waves S1 and S2 are generated. They propagate in the flyer and film, respectively, and sparse waves R1 and R2 propagate inward from the side. Under strong compression, the strength of the flyer target decreases, and then it breaks under the action of sparse wave, and some fragments splash back. When the incident shock wave reaches the free surface of Kapton film, a sparse wave R3 is generated. When the tensile stress amplitude exceeds the dynamic fracture strength of the material, the region where the film is impacted breaks [31]. It can be seen that in addition to the cracks and holes formed by the impact of Al flyer through Kapton film, a certain amount of Al contaminated particles will remain on the surface of Kapton film due to the reverse sputtering and redeposition of Al particles formed during the impact process. This is the reason for the difference of atomic oxygen erosion weight loss of Kapton film under three load spectrum test conditions. Without the influence of residual Al particles, the weight loss of Kapton film was the most obvious under the condition of AO single factor load spectrum. Compared with the MD + AO load spectrum test condition, the weight loss of Kapton film under AO+ MD load spectrum conditions was slightly more, which may be attributed to the reduction in material erosion and aging strength of Kapton film after atomic oxygen erosion. Therefore, the reverse sputtering and redeposition of Al particles formed during impact are relatively small.

3.3. Microstructure Characterization

Figure 8a shows the SEM observation of the surface microstructure of Kapton film. In the load spectrum involving atomic oxygen in Figure 8, the exposure time of samples in atomic oxygen was 25 h. It can be seen that the original Kapton surface was smooth and flat. The surface morphology of Kapton after AO single factor load spectrum test is shown in Figure 8b. Due to the erosion of atomic oxygen, the film surface presented a classic rough carpet shape with high roughness, which is consistent with the literature report [28,32,33]. The surface morphology of Kapton after MD single factor load spectrum test is shown in Figure 8c. After aluminum flyer impacts Kapton film, pits, even cracks and holes appear on the surface. Further observation shows that there were granular substances in the pits, which are mainly aluminum by EDS energy spectrum analysis. This indicated that the integrity of Al flyer was destroyed and a debris cloud was formed during the impact. The formation of a debris cloud is an obvious feature of a hypervelocity collision [34]. When the splashed secondary fragments fall back to the film surface, the momentum was small, and then impact the film surface again to form pits and deposit.
After MD + AO load spectrum test, the surface microstructure of Kapton film is shown in Figure 8d–f. Similar to the MD single factor load spectrum test results, pits, holes and cracks on the film surface were clearly shown in Figure 8d. Figure 8e,f show the local enlargement of the crack area in Figure 8d. The crack showed a tearing state and belongs to the characteristics of plastic deformation. After atomic oxygen erosion, the surface near the crack was rough.
The surface microstructure of Kapton film after AO + MD load spectrum test is shown in Figure 8g–i. In Figure 8g, it can be observed that the central area was an impact hole with a diameter of 1.4 mm. The hole size was significantly larger than the hole size of 0.69 mm in Figure 8d, and the hole edge was straight without obvious depression and tear characteristics. Kapton film was first eroded by atomic oxygen, and a rough carpet shape was formed on the material surface, which became the crack source of subsequent flyer impacts. At the same time, the atomic oxygen corrosion aging of the surface material reduced the fracture strength, and the flyer showed brittle fracture when impacted at high speed, forming holes with a larger diameter. It is worth noting that in Figure 8h,i, the thin film away from the crack area was eroded by atomic oxygen to form a carpet shape, and the morphology near the crack showed a certain directivity. The dilution wave and shock heat effect produced in the hypervelocity impact of small debris make the original carpet shape into an “impact like plain”.

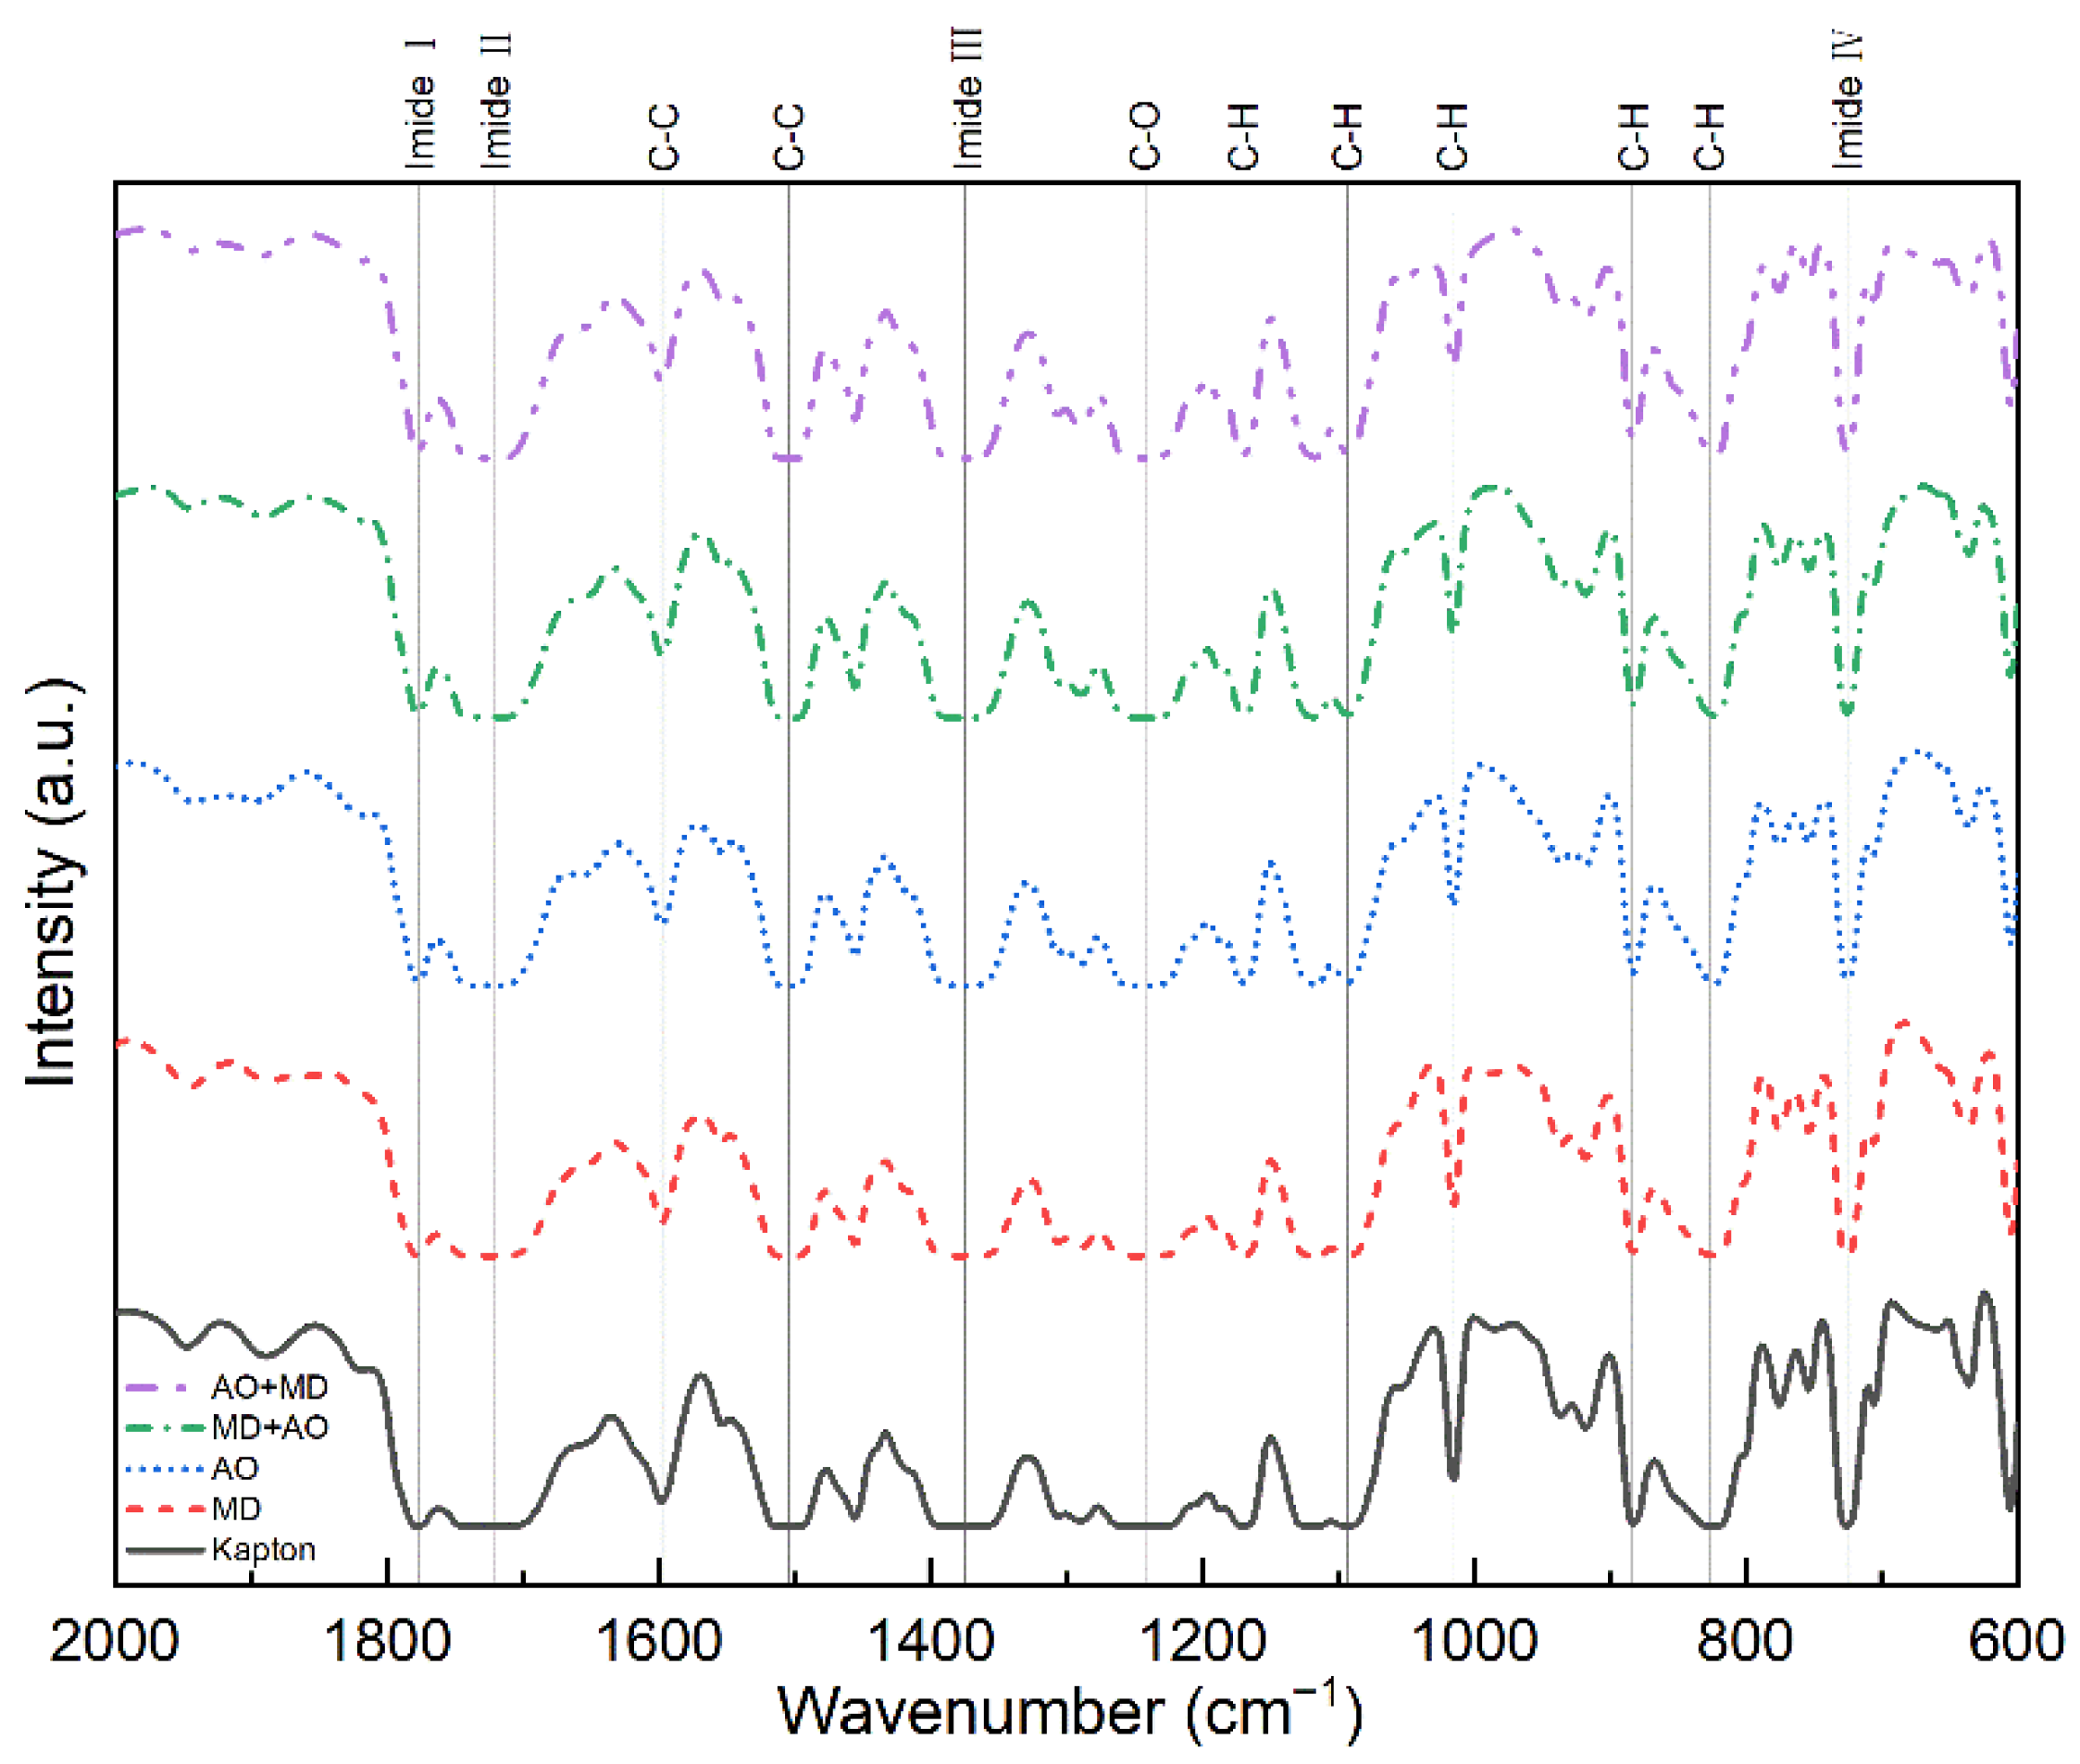
3.4. Infrared Spectrum Analysis
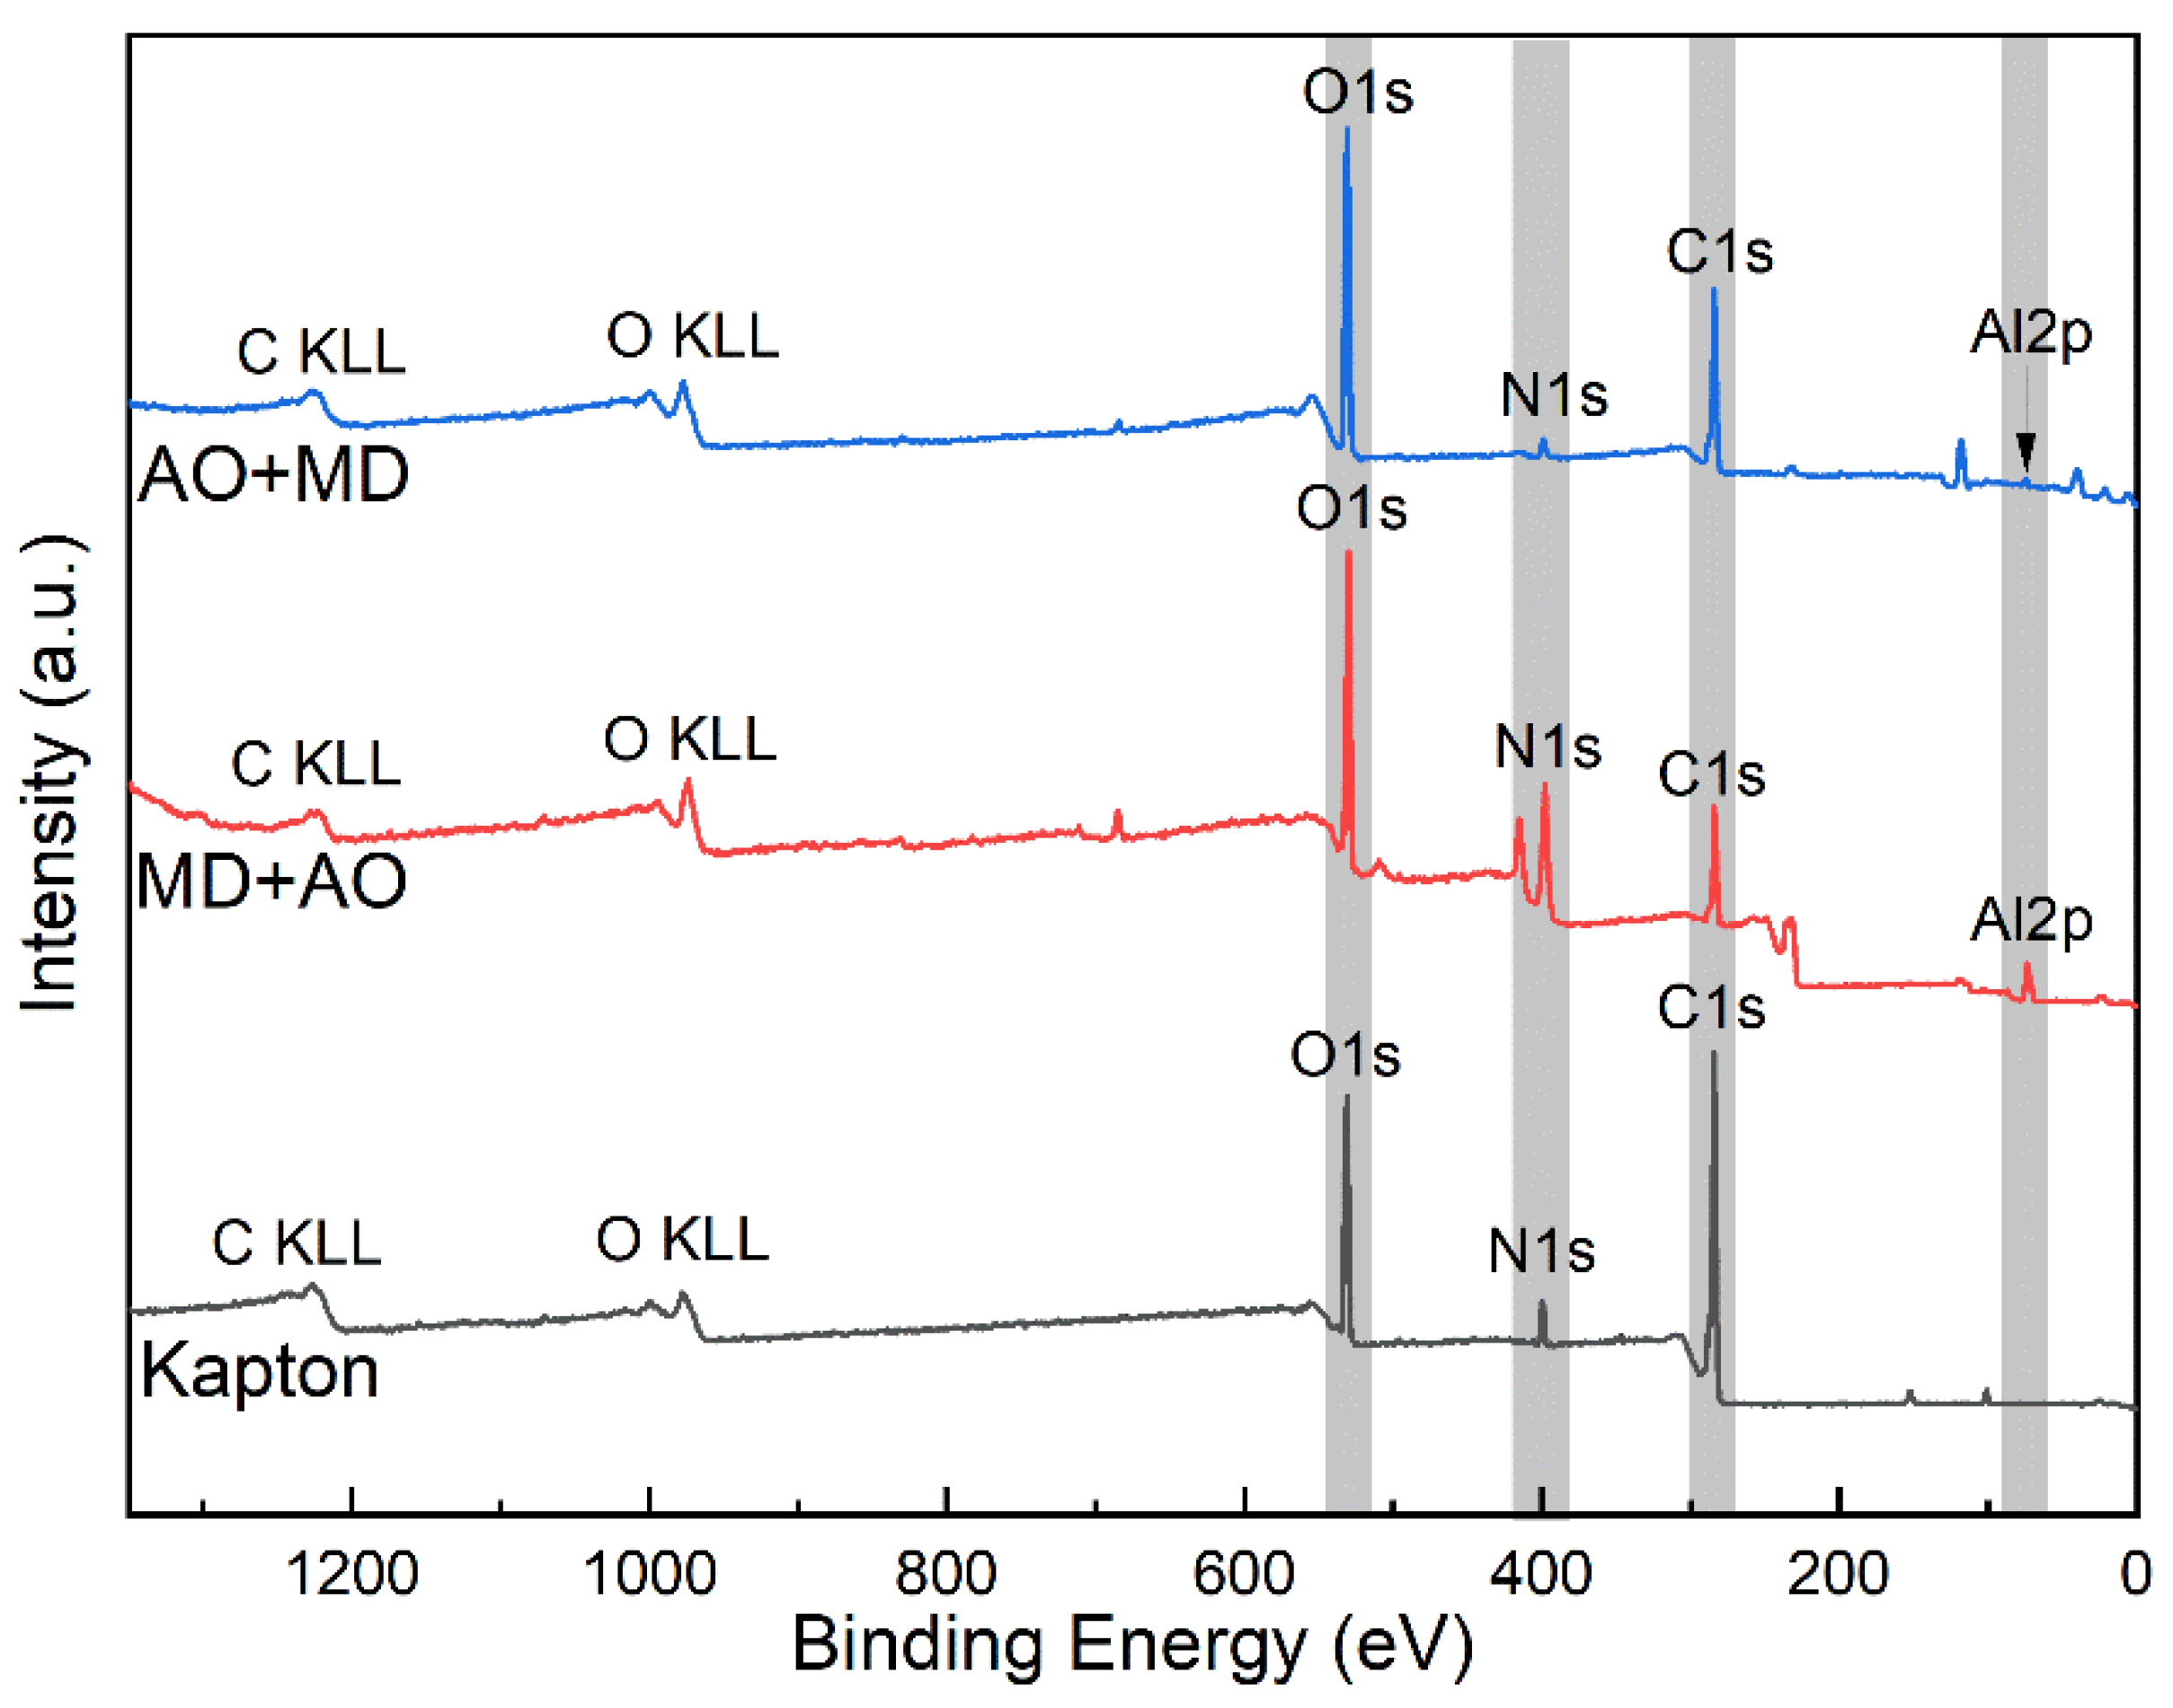
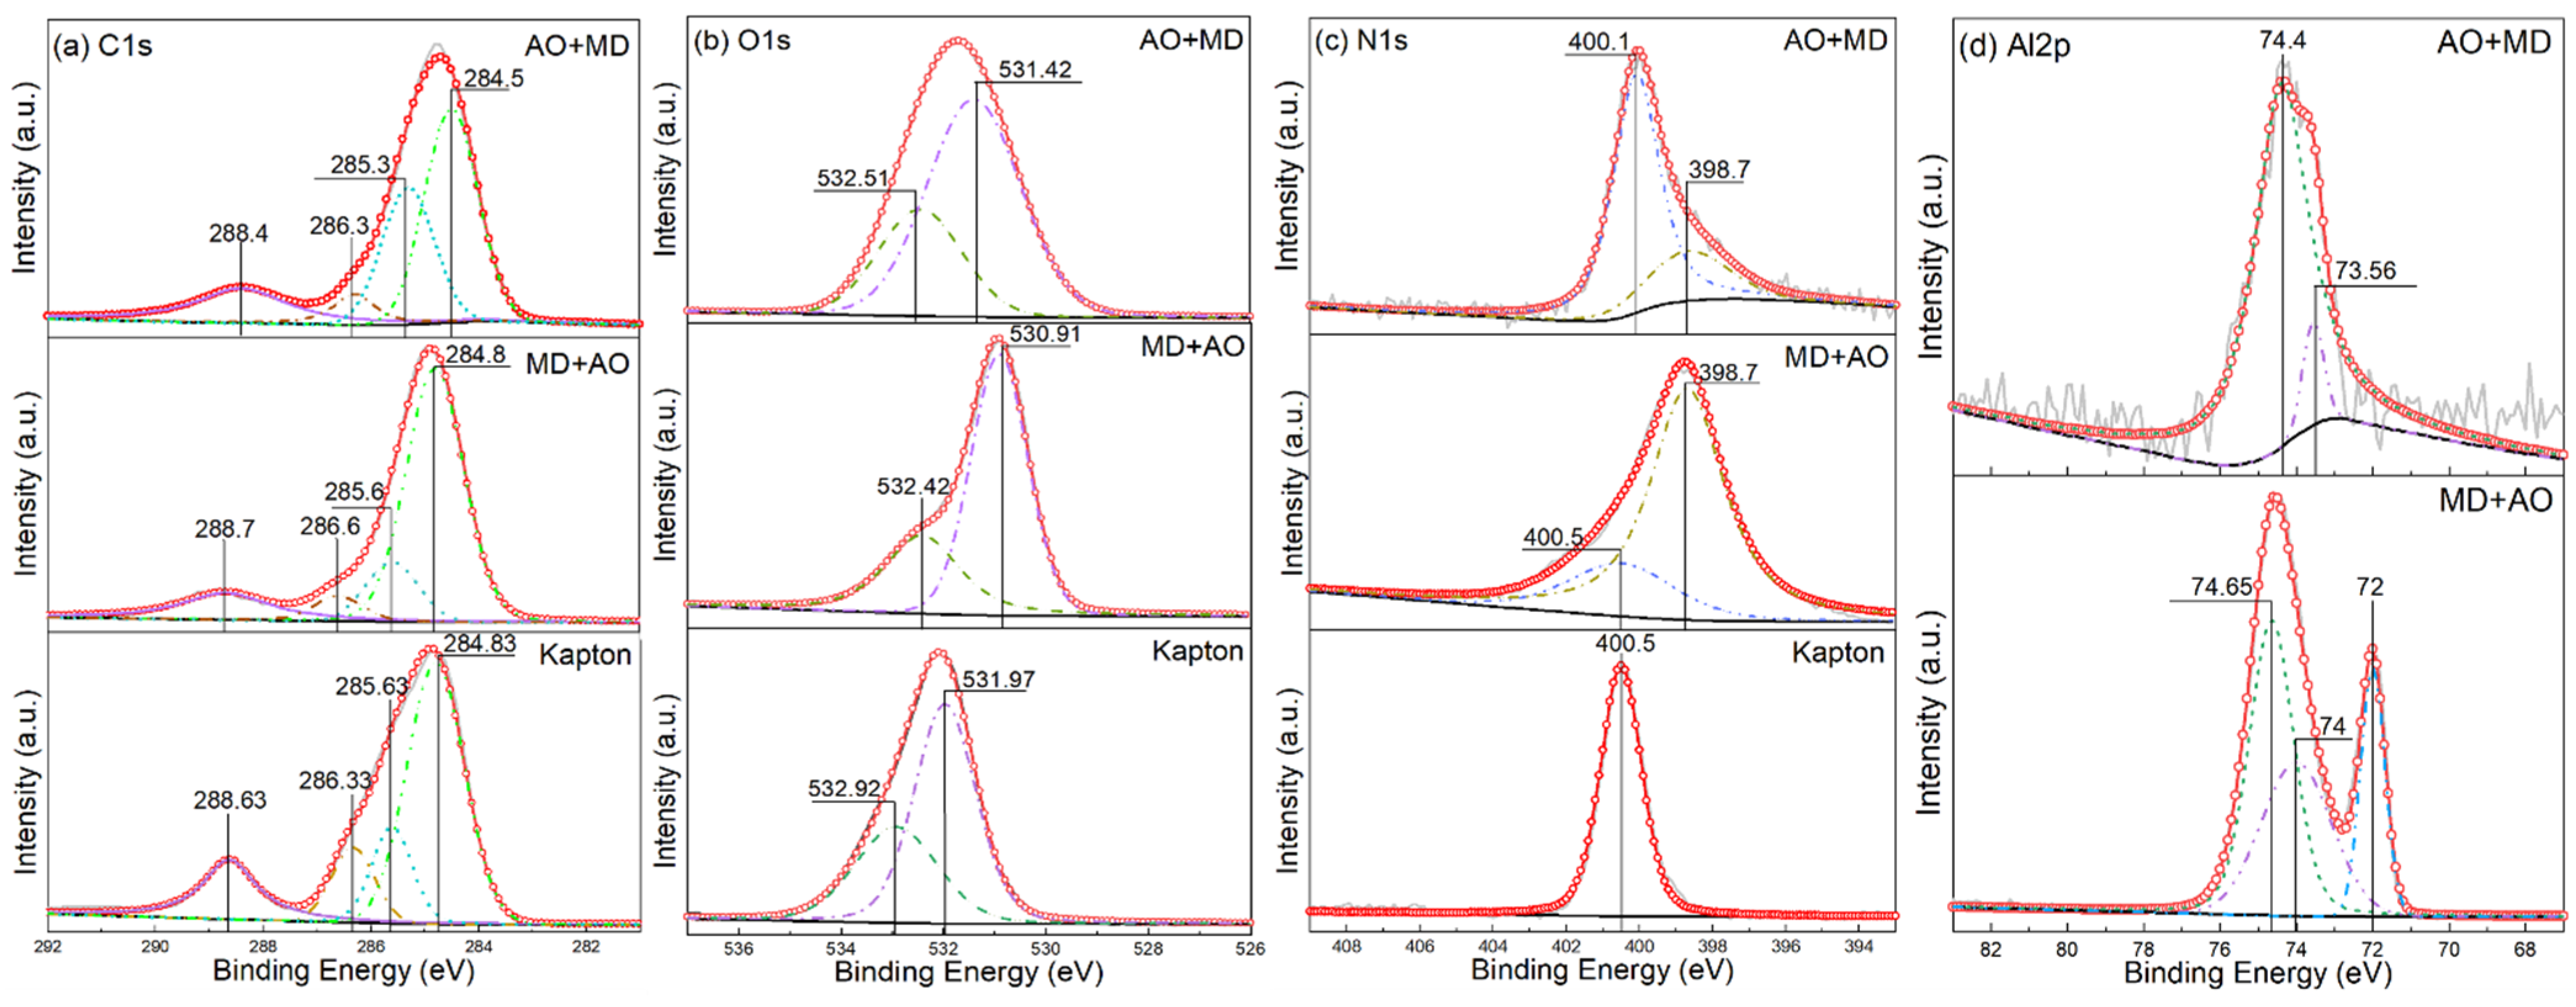
In order to study the changes of functional groups on the surface of Kapton films before and after each load spectrum test, the test samples were analyzed by infrared spectroscopy. Figure 9 is the infrared spectrum of each sample, in which the positions of functional groups are given. In the load spectrum involving atomic oxygen in Figure 9, the exposure time of samples in atomic oxygen was 25 h. According to the infrared spectrum of the original Kapton film, 1774 and 1704 cm−1 absorption bands appear in the range of 1800–1680 cm−1, corresponding to imide I band and II band, respectively, representing the symmetrical and asymmetric stretching vibration of two carbonyls (C=O) on the five membered imine ring. Absorption bands of 1366 and 719 cm−1 correspond to imide III and IV bands, respectively, which are C–N stretching vibration and C=O symmetric stretching vibration in polyimide. These are the four amide bands of a typical Kapton film [35]. Absorption bands of 1596 and 1502 cm−1 are the stretching vibration of benzene ring carbon skeleton in aryl ether. An absorption band of 1232 cm−1 is the stretching vibration of C–O in aryl ether, and shows wide and strong absorption. The 1163 cm−1 and 1111 cm−1 absorption bands can be attributed to the variable angle vibration in the =C–H plane on the substituted benzene ring. The 1012 cm−1 absorption band is the in-plane rocking vibration of para substituted phenyl hydrogen atoms. The 880 and 813 cm−1 absorption bands are out of plane deformation vibrations of isolated hydrogen atoms and ortho hydrogen atoms of benzene ring, respectively [36,37]. These are the characteristic peaks of Kapton films.
The infrared spectrum is shown in Figure 8. It can be observed that the position and shape of the infrared absorption peak of the original Kapton were basically unchanged compared with the samples after the MD single factor load spectrum test. There were few functional groups affected, which was attributed to the area affected by micro debris accounts for a small proportion. For the three samples eroded by atomic oxygen, it can be seen that although the position of the absorption peak does not change significantly, the strong absorption peaks were weakened. The obvious changes were 1704 cm−1 imide II band, 1596, 1502 and 1232 cm−1 absorption band. This showed that atomic oxygen will erode C=O on the five membered imine ring and C–C and C–O of the benzene ring carbon skeleton in the aryl ether.

3.5. XPS Analysis

Kapton could produce a series of changes such as mass loss and surface morphology after MD + AO and AO + MD load spectrum tests. In order to further analyze the damage mechanism of Kapton induced in the test, the changes of surface elements and valence bonds of the sample were analyzed by X-ray photoelectron spectroscopy to explain the interaction mechanism of atomic oxygen and micro debris. In MD + AO and AO + MD load spectrum tests, the atomic oxygen erosion time is 25 h. The XPS full scan energy spectrum is shown in Figure 10, and the surface composition of the sample is shown in Table 1. As shown in Figure 10, Kapton thin film is composed of three elements C, O and N, while it is composed of four elements C, O, N and Al after atomic oxygen and micro debris impact test, which is caused by the sputtering deposition of aluminum flyers on the film during hypervelocity impact. It can be seen from Table 1 that the C element in Kapton film was greatly reduced after MD + AO and AO + MD load spectrum tests. This may be attributed to atomic oxygen that has a strong oxidation ability and has reacted with the polyimide film, so that the surface C element was oxidized to CO2 and CO volatilization [33,38]. The increase in the proportion of O indicates that atomic oxygen was adsorbed on the surface of the film and reacts with the film. The decrease in N indicates that it participates in the chemical reaction. The reaction mechanism is further investigated by High-resolution XPS spectra, as shown in Figure 11. And the reaction mechanism diagram of Kapton film MD + AO and AO + MD load spectrum is shown in Figure 12.
According to the C1s high-resolution spectrum shown in Figure 11a, there are four states of C atoms in Kapton films. According to the peak fitting curve of XPSPEAK software (version 4.1), the four carbon atoms of the original Kapton film are located at the binding energy of 284.83 eV (corresponding to C–C bond in ODA benzene ring), 285.63 eV (corresponding to C=C bond in PMDA benzene ring), 286.33 eV (C–O bond) and 288.63 eV (C=O bond). After MD + AO load spectrum test, the four peaks are located at the binding energies of 284.8, 285.6, 286.6 and 288.7 eV, respectively. Compared to the original Kapton film, the most obvious reduction in relative peak area is the C–O bond corresponding to 286.6 eV, indicating that this load spectrum made the C–O bond break. The fitting peak area after AO + MD load spectrum test decreased significantly, including the C–O bond corresponding to 286.3 eV and the C–C bond corresponding to 284.5 eV. AO + MD load spectrum made the C–O bond and C–C fracture. It can be seen that in the MD + AO test, due to the adhesion of Al after the impact of small debris, the subsequent atomic oxygen erosion of the film was reduced, so the C–C bond was not seriously damaged. However, after the AO + MD load spectrum test, the film was first eroded by atomic oxygen, resulting in the reduction in the C–O bond and the C–C bond.
According to Figure 11b, the oxygen element energy spectrum of the original Kapton film can be fitted to two peaks of 532.92 and 531.97 eV, with peak areas of 36.6% and 63.4%, respectively, corresponding to the C–O bond and the C=O bond [39]. After MD + AO load spectrum test, the peak positions were 532.42 eV (C–O) and 530.91 eV (C=O), the peak areas were 33.2% and 66.8%, respectively, and the peak area of the C–O bond decreased slightly. After AO + MD load spectrum test, the relative peak area of the C–O bond corresponded to 532.51 eV is 30.17%, which was 6.43% lower than that of the original film and indicated that the C–O bond was seriously damaged by this load spectrum test. The results are the same as those of C1’s fine spectrum analysis, which is attributed to the fact that the deposited Al particles on the MD + AO load spectrum test film delayed the erosion of atomic oxygen, and the atomic oxygen in the AO + MD load spectrum could directly destroy the C–O bond.
It can be seen from Figure 11c, that the original Kapton film has only one characteristic peak with binding energy of 400.5 eV, which is the C–N bond [40]. After the MD + AO load spectrum test, the N–H bond corresponding to the characteristic peak with a binding energy of 398.7 eV appeared in the sample [41]. Compared with the two characteristic peaks in the sample after the AO + MD load spectrum test, it can be seen that micro debris had a great impact on the C–N bond. Hypervelocity impact led to thermal decomposition of the material, destruction of the C-N bond in the imide ring and the generation of the N–H bond. After the AO + MD load spectrum test, the film also has two characteristic peaks in Figure 11c, although only a small amount of N–H bond, which showed that atomic oxygen has little effect on the C–N bond, and the fracture of the C–N bond was caused by high-temperature pyrolysis of materials caused by hypervelocity impact [42].
After the MD + AO load spectrum test, the peak fitting of Al element on the sample surface is shown in Figure 11d. The three peaks are located at 74.65, 74 and 72 eV, respectively, corresponding to Al–O bond, Al–N bond and Al-Al bond [43,44]. The relative peak area of Al–O bond is 46.2%, indicating that after hypervelocity impact, a considerable part of the residual aluminum flyer on the sample was oxidized to alumina by atomic oxygen. The relative peak area of the Al–N bond is 34.5%, which may be due to the cross-linking between Al debris and N in the sample. A small amount of Al has not been oxidized and reacted. The peak fitting of the sample after AO + MD load spectrum test is shown in Figure 11d. Only two peaks are located at 74.4 and 73.56 eV, respectively, corresponding to the Al–O bond and Al-N bond, respectively. It can be seen from Figure 10 AO + MD that the intensity of Al peak was very low, and the Al element content on the sample surface in Table 1 was also very small. This is because the mechanical strength and impact resistance of the sample were reduced after being corroded by atomic oxygen. The impact of aluminum flyers on the film caused perforation and reduced residual al fragments. After the AO + MD loading spectrum test, the Al element on the sample surface was oxidized, and a small part was crosslinked with n to form an Al-N bond.

4. Conclusions

In this paper, the damage effects of a single factor of atomic oxygen (AO) and micro debris (MD), and the asynchronous synergy of MD + AO and AO + MD load spectra on Kapton films were studied. The results show that:
  • After the asynchronous synergistic action of atomic oxygen and small debris, the Kapton film changed from brown yellow to light yellow; the gloss disappeared, and the transmittance decreased in the wavelength range of 600–800 nm. Under the condition of AO + MD load spectrum, the surface hole of Kapton film was larger than that under the MD + AO load spectrum, the residual aluminum particles formed by the reverse sputtering of Al particles produced during the impact process were less, the average transmittance of the film decreased slightly, and the weight loss of Kapton film was slightly more under the same atomic oxygen exposure time;
  • Under the condition of MD + AO load spectrum, plastic tearing cracks, pits and holes appeared on the surface of Kapton film; under the condition of AO + MD load spectrum, the hole edge on the surface of Kapton film was straight, without obvious depression and tear characteristics. This is attributed to the fact that the film was eroded by atomic oxygen first, and the rough carpet shape was formed on the material surface, and the subsequent flyer impact became the crack source; at the same time, the atomic oxygen corrosion aging fracture strength of the surface material decreases.
  • Under the condition of MD + AO load spectrum, due to the adhesion of Al after the impact of micro debris, the subsequent atomic oxygen erosion of the film was reduced, so the C–C bond was not seriously damaged, and a considerable part of the residual aluminum flyer was oxidized to alumina by atomic oxygen. While the AO + MD loading spectrum test made the film first eroded by atomic oxygen, resulting in the reduction in the C–O bond and the C–C bond. The impact of micro debris had a great impact on the C–N bond. Hypervelocity impact leads to the thermal decomposition of the material, destroyed the C–N bond in the imide ring and generated N–H bond.

Author Contributions

Conceptualization, Q.W., methodology, Q.W.; investigation, Q.W. and P.T., writing—original draft preparation, P.T., writing—review and editing, Q.W. and P.T., supervision, X.C. and N.H., project administration, Q.W. and N.H., funding acquisition, Q.W. and N.H. All authors have read and agreed to the published version of the manuscript.

Funding

This research was funded by the National Natural Science Foundation of China (Grant No. 51873146), the Fund for Innovative Research Groups of Natural Science Foundation of Hebei Province (Grant No. A2020202002), and Natural Science Foundation of Hebei Province (Grant No. E2019202106).

Institutional Review Board Statement

Not applicable.

Informed Consent Statement

Not applicable.

Data Availability Statement

Data sharing is not applicable to this article.

Conflicts of Interest

The authors declare no conflict of interest.

References

  1. Yeritsyan, H.N.; Sahakyan, A.A.; Grigoryan, N.E.; Harutyunyan, V.V.; Arzumanyan, V.V.; Tsakanov, V.M.; Grigoryan, B.A.; Davtyan, H.D.; Dekhtiarov, V.S.; Rhodes, C.J.; et al. Space low earth orbit environment simulator for ground testing materials and devices. Acta Astronaut. 2021, 181, 594–601. [Google Scholar] [CrossRef]
  2. Shivakumar, R.; Bolker, A.; Tsang, S.H.; Atar, N.; Verker, R.; Gouzman, I.; Hala, M.; Moshe, N.; Jones, A.; Grossman, E.; et al. POSS Enhanced 3D Graphene–Polyimide Film for Atomic Oxygen Endurance in Low Earth Orbit Space Environment. Polymer 2020, 191, 122270. [Google Scholar] [CrossRef]
  3. Shimamura, H.; Nakamura, T. Investigation of degradation mechanisms in mechanical properties of polyimide films exposed to a low earth orbit environment. Polym. Degrad. Stab. 2010, 95, 21–33. [Google Scholar] [CrossRef]
  4. Shimamura, H.; Nakamura, T. Mechanical properties degradation of polyimide films irradiated by atomic oxygen. Polym. Degrad. Stab. 2009, 94, 1389–1396. [Google Scholar] [CrossRef]
  5. Qiu, J.W.; Shen, Z.C.; Xiao, L. Study on Synergistic Effect of Space Environments on Spacecraft. Spacecr. Eng. 2013, 22, 15–20. [Google Scholar] [CrossRef]
  6. Lu, Y.F.; Shao, Q.; Yue, H.H.; Yang, F. A Review of the Space Environment Effects on Spacecraft in Different Orbits. IEEE Access 2019, 7, 93473–93488. [Google Scholar] [CrossRef]
  7. Han, J.-H.; Kim, C.-G. Low earth orbit space environment simulation and its effects on graphite/epoxy composites. Compos. Struct. 2006, 72, 218–226. [Google Scholar] [CrossRef]
  8. He, S.Y.; Yang, D.Z.; Jiao, Z.K. Space Materials Manual–Physical State of Space Environment, 1st ed.; Aerospace Press: Beijing, China, 2012; Volume 1, pp. III–IV. [Google Scholar]
  9. Chen, R.M.; Zhang, L.; Yan, C.W. Synergic Effect of Atomic Oxygen and Vacuum Ultraviolet on Organic Coatings Degradation. J. Aeronaut. Mater. 2007, 27, 41–45. [Google Scholar] [CrossRef]
  10. Yokota, K.; Ohmae, N.; Tagawa, M. Effect of Relative Intensity of 5 eV Atomic Oxygen and 172 nm Vacuum Ultraviolet in the Synergism of Polyimide Erosion. High Perform. Polym. 2004, 16, 221–234. [Google Scholar] [CrossRef]
  11. Shimamura, H.; Miyazaki, E. Investigations into Synergistic Effects of Atomic Oxygen and Vacuum Ultraviolet. J. Spacecr. Rockets 2009, 469, 241–247. [Google Scholar] [CrossRef]
  12. Zhai, R.Q.; Ren, G.H.; Tian, D.B.; Li, Y.; Yang, Y.B.; Liu, C. Advances in research on low-orbit ultraviolet, charged particles, thermal cycling and atomic oxygen synergistic effects. Vacuum 2019, 56, 72–76. [Google Scholar]
  13. Sun, P.W.; Song, L.M.; Wang, Z.H. A Study on Process Management and Control Technology of Asynchronous Coliaborative Simulation. J. Inn. Mong. Univ. Technol. 2007, 26, 65–70. [Google Scholar] [CrossRef]
  14. Tagawa, M.; Yokota, K. Atomic oxygen-induced polymer degradation phenomena in simulated LEO space environments: How do polymers react in a complicated space environment? Acta Astronaut. 2008, 62, 30203–30211. [Google Scholar] [CrossRef]
  15. Liu, T.; Qiu, X.M.; Zhang, X.H.; Cao, Y.; Liu, Y.F.; Yang, J.H. Experimental investigation on the hypervelocity impact damage behavior of polyimide film. Int. J. Impact Eng. 2020, 141, 103538. [Google Scholar] [CrossRef]
  16. Verker, R.; Grossman, E.; Gouzman, I.; Laikhtman, A.; Katz, S.; Freankel, M.; Maman, S.; Lempert, G.; Eliaz, N. Synergistic effect of simulated hypervelocity space debris and atomic oxygen on durability of POSS-polyimide nanocomposite. In Proceedings of the 10th Int. Symp. on Materials in Space Environment & the 8th Int. Conf. on Protection of Materials and Structures in a Space Environment—ISMSE/ICPMSE 2006, Collioure, France, 19–23 June 2006. [Google Scholar]
  17. Li, H.W.; Cai, M.H.; Han, J.W.; Huang, J.G.; Li, X.Y.; Yu, J.X.; Gao, Z.X.; Liu, D.Q. Research of Combined Effect of Small Space Debris and Atomic Oxygen. Chin. J. Space Sci. 2011, 31, 503–508. [Google Scholar]
  18. Jiang, H.F.; Cao, Y.; Li, Y.; Chai, L.H. The combined effect of space micro-debris and atomic oxygen on ITO/Kapton/Al film. Spacecr. Environ. Eng. 2016, 33, 530–533. [Google Scholar] [CrossRef]
  19. Gouzman, I.; Grossman, E.; Verker, R.; Atar, N.; Bolker, A.; Eliaz, N. Advances in Polyimide-Based Materials for Space Applications. Adv. Mater. 2019, 31, 1807738. [Google Scholar] [CrossRef]
  20. Zhang, L.; Yan, C.W.; Qu, Q.; Li, M.S.; Cao, C.N. Effect of Atomic Oxygen on Spacecraft Materials and Its Protection II. Protection of Atomic Oxygen-Susceptible Materials. Mater. Rev. 2002, 16, 7–8. [Google Scholar] [CrossRef]
  21. Shit, S.C.; Shah, P.M. A Review on Silicone Rubber. Natl. Acad. Sci. Lett. 2013, 36, 355–365. [Google Scholar] [CrossRef]
  22. Man, Y.R.; Li, Z.H.; Shu, M.; Liu, K.; Liu, H.T.; Gao, Y. Surface treatment of 25-µm Kapton film by ammonia for improvement of TiO2 SiO2 coating’s adhesion. Surf. Interface Anal. 2017, 49, 843–849. [Google Scholar] [CrossRef]
  23. Song, L.H.; Wei, Q.; Bai, Y.; Wang, Z.H. Review on the Laser Technology Application in Space Environment Ground Simulation. Optoelectron. Technol. 2016, 33, 96–102. [Google Scholar] [CrossRef]
  24. Duo, S.W.; Li, M.S.; Zhang, Y.M. A Simulator for Producing of High Flux Atomic Oxygen Beam by Using ECR Plasma Source. J. Mater. Sci. Technol. 2004, 20, 759–762. [Google Scholar] [CrossRef]
  25. Liu, K.; Mu, H.; Shu, M.; Li, Z.; Gao, Y. Improved adhesion between SnO2/SiO2 coating and polyimide film and its applications to atomic oxygen protection. Colloids Surf. A Physicochem. Eng. Asp. 2017, 529, 356–362. [Google Scholar] [CrossRef]
  26. Lian, R.H.; Lei, X.F.; Xue, S.Y.; Chen, Y.H.; Zhang, Q.Y. Janus polyimide films with outstanding AO resistance, good optical transparency and high mechanical strength. Appl. Surf. Sci. 2021, 535, 147654. [Google Scholar] [CrossRef]
  27. Li, Y.; Fu, S.-Y.; Li, Y.-Q.; Pan, Q.-Y.; Xu, G.S.; Yue, C.-Y. Improvements in transmittance, mechanical properties and thermal stability of silica–polyimide composite films by a novel sol–gel route. Compos. Sci. Technol. 2007, 67, 2408–2416. [Google Scholar] [CrossRef]
  28. Wang, H.D.; Ma, G.Z.; Xu, B.S.; Xing, Z.G.; Li, G.L.; Zhang, S. The Erosion Effect of Kapton Film in a Groundbased Atomic Oxygen Irradiation Simulator. J. Wuhan Univ. Technol. Mater. Sci. Ed. 2014, 29, 1277–1282. [Google Scholar] [CrossRef]
  29. Buczala, D.M.; Brunsvold, A.L.; Minton, T.K. Erosion of Kapton® H by Hyperthermal Atomic Oxygen. J. Spacecr. Rockets 2006, 43, 421–425. [Google Scholar] [CrossRef]
  30. Reddy, M.R. Effect of low earth orbit atomic oxygen on spacecraft materials. J. Mater. Sci. 1995, 30, 281–307. [Google Scholar] [CrossRef]
  31. Maiden, C.J.; Mcmillan, A.R. An Investigation of the Protection Afforded a Spacecraft by a Thin Shield. Aerosp. Sci. Meet. 1964, 2, 1992–1998. [Google Scholar] [CrossRef]
  32. Huang, Y.X.; Tian, X.B.; Yang, S.Q.; Chu, P.K. A ground-based radio frequency inductively coupled plasma apparatus for atomic oxygen simulation in low Earth orbit. Rev. Sci. Instrum. 2007, 78, 103301. [Google Scholar] [CrossRef] [Green Version]
  33. Wei, Z.; Weiping, L.; Huicong, L.; Liqun, Z. Erosion of a Polyimide Material Exposed to Simulated Atomic Oxygen Environment. Chin. J. Aeronaut. 2010, 23, 268–273. [Google Scholar] [CrossRef] [Green Version]
  34. Cui, W.F.; Zeng, X.W. Simulation investigations on debris cloud impact damage potential. Explos. Shock. Waves 2009, 29, 434–438. [Google Scholar] [CrossRef]
  35. Yang, Y.; Yin, D.; Xiong, R.; Shi, J.; Tian, F.Q.; Wang, X.; Lei, Q.Q. FTIR and Dielectric Studies of Electrical Aging in Polyimide under AC Voltage. IEEE Trans. Dielectr. Electr. Insul. 2012, 19, 574–581. [Google Scholar] [CrossRef]
  36. Naddaf, M.; Balasubramanian, C.; Alegaonkar, P.S.; Bhoraskar, V.N.; Mandle, A.B.; Ganeshan, V.; Bhoraskar, S.V. Surface interaction of polyimide with oxygen ECR plasma. Nucl. Instrum. Methods Phys. Res. Sect. B Beam Interact. Mater. At. 2004, 222, 135–144. [Google Scholar] [CrossRef]
  37. Wang, W.; Li, C.X.; Zhang, G.B.; Sheng, L.S. Synthesis and Studies of Polyimide. Mater. Rev. 2008, 22, 119–128. [Google Scholar] [CrossRef]
  38. Duo, S.W.; Li, M.S.; Zhou, Y.C.; Tong, J.Y.; Sun, G. Investigation of Surface Reaction and Degradation Mechanism of Kapton during Atomic Oxygen Exposure. J. Mater. Sci. Technol. 2003, 19, 535–539. [Google Scholar] [CrossRef]
  39. Jiang, D.H.; Wang, D.; Liu, G.; Wei, Q. Atomic Oxygen Adaptability of Flexible Kapton/Al2O3 Composite Thin Films Prepared by Ion Exchange Method. Coatings 2019, 9, 624. [Google Scholar] [CrossRef] [Green Version]
  40. Shen, Z.C.; Ma, Z.L.; Dai, W.; Mu, Y.Q.; Bai, Y.; Ding, Y.G. Evolution Mechanism for Mechanical Property of Polyimide Film by Far Ultraviolet Irradiation. Surf. Technol. 2018, 47, 22–26. [Google Scholar] [CrossRef]
  41. Xin, J.J.; Shen, S.C.; Wang, J.B. X-ray Photoelectron Spectroscopy Study of Polyimide Film by Ar Ion Bombardment. Adv. Sci. Technol. 2015, 29, 1–3. [Google Scholar] [CrossRef]
  42. Lu, X.; Han, S.; Li, Q.M.; Huang, X.Y.; Wang, X.L.; Wang, G.Y. Reactive Molecular Dynamics Simulation of Polyimide Pyrolysis Mechanism at High Temperature. Trans. China Electrotech. Soc. 2016, 31, 14–23. [Google Scholar] [CrossRef]
  43. Rosenberger, L.; Baird, R.; McCullen, E.; Auner, G.; Shreve, G. XPS analysis of aluminum nitride films deposited by plasma source molecular beam epitaxy. Surf. Interface Anal. 2008, 40, 1254–1261. [Google Scholar] [CrossRef]
  44. Motamedi, P.; Cadien, K. XPS analysis of AlN thin films deposited by plasma enhanced atomic layer deposition. Appl. Surf. Sci. 2014, 315, 104–109. [Google Scholar] [CrossRef]
Figure 1. Molecular formula of ODA-PMDA polyimide.
Coatings 12 00179 g001
Figure 2. Schematic diagram of ground environment simulation test: (a) Laser driven flyer; (b) Atomic oxygen erosion.
Coatings 12 00179 g002
Figure 3. Schematic diagram of four load spectrum tests.
Coatings 12 00179 g003
Figure 4. Macro images of Kapton film: (a, ×2) original film; (b, ×2) film after AO load spectrum test; (c, ×2) film after MD load spectrum; (d, ×2) film after MD + AO load spectrum test; (e, ×2) film after AO + MD load spectrum test.
Coatings 12 00179 g004
Figure 5. Optical transmittance of Kapton film before and after different load spectrum tests.
Coatings 12 00179 g005
Figure 6. Weight loss curve of Kapton film before and after different load spectrum tests.
Coatings 12 00179 g006
Figure 7. Schematic diagram of debris cloud formation process.
Coatings 12 00179 g007
Figure 8. SEM surface morphology of Kapton film after different load spectrum tests: (a, ×500) original Kapton film; (b, ×2000) film after AO single factor load spectrum test; (c, ×50) film after MD single factor load spectrum test; (d, ×30); (e, ×200); (f, ×1000) film after MD + AO load spectrum test; (g, ×50); (h, ×1000); (i, ×2000) film after AO + MD load spectrum test.
Coatings 12 00179 g008
Figure 9. Infrared spectra of Kapton film before and after different load spectrum tests.
Coatings 12 00179 g009
Figure 10. XPS full scan energy spectrum of original Kapton film and film after MD + AO and AO + MD load spectrum test.
Coatings 12 00179 g010
Figure 11. High-resolution XPS spectra of: (a) C1s, (b) O1s, (c) N1s, (d) Al2p on Kapton film before and after MD + AO, AO + MD load spectrum.
Coatings 12 00179 g011
Figure 12. Reaction mechanism diagram of Kapton film MD + AO and AO + MD load spectrum.
Coatings 12 00179 g012
Table 1. Relative content of surface elements after original Kapton film and MD + AO, AO + MD load spectrum test.
MaterialSurface Composition (%)
CONAl
Original Kapton75.1819.185.64-
MD + AO Kapton45.6632.583.6218.15
AO + MD Kapton47.3248.950.153.58
Publisher’s Note: MDPI stays neutral with regard to jurisdictional claims in published maps and institutional affiliations.

