1. Introduction
Molybdenum disulfide MoS
2 is the most commonly used solid lubricant. Like liquid ones such as oils and greases, solid lubricants create a continuous lubricating film on the surfaces of the tribo-interface bodies in order to reduce friction and wear in a dry environment. As a rule, solid lubricants are used under conditions where oils and greases prove to be ineffective, e.g., at high or cryogenic temperatures, in vacuum, under radiation, or at high contact pressures [
1,
2,
3].
The lubricating effect of molybdenum disulfide is based on the layered structure of the material crystals. MoS
2 consists of separate sulfur-molybdenum-sulfur layers. The atoms in each layer are ordered due to ionic and covalent bonds, and the layers are connected to each other by weak van der Waals forces. The lubricating effect of molybdenum disulfide is therefore provided by comparatively easy sliding of these layers relative to each other, as in graphite [
3,
4,
5,
6,
7,
8]. The ability of molybdenum disulfide to reduce the friction coefficient with increasing load and the absence of stick-slip effect render MoS
2-based solid lubricants indispensable for applications in vacuum conditions in a wide temperature range [
8]. Friction mechanisms operating under extreme conditions associated with high temperature, pressure, corrosion, and wear sometimes require using composite materials with the addition of molybdenum disulfide [
6]. Such materials are prepared through powder metallurgy, for example, and are used to produce bearing parts, mechanical transmissions and brake systems, etc.
Molybdenum disulfide coatings are applied in aerospace vehicles, hardening furnaces, cryopumps, nuclear and thermonuclear reactors, and the bearings of optical devices [
4,
5]. In particular, molybdenum disulfide is utilized in unique constructions intended for thermonuclear fusion studies: tokamaks (ITER, France; JET, UK; EAST, China) and stellarators (Wendelstein 7-X, Germany) [
8,
9,
10,
11,
12]. In the Wendelstein 7-X stellarator, the superconducting magnet support devices operate in vacuum and are cooled down by liquid helium. As a result of thermal deformations, ultrahigh currents, and magnetic fields, narrow supporting elements make small movements. These movements must be smooth and happen with as little resistance as possible. To guarantee a low value of friction coefficient and the absence of stick–slip effect in high vacuum (less than 10
−6 mbar) and at low temperature (4.2 K) [
8,
9], the supporting elements are coated with molybdenum disulfide. In tokamaks, the features of operation are high vacuum and elevated temperature (80–100 °C). In this case, molybdenum and tungsten disulfide coatings are deposited on the surfaces of support devices to ensure smooth movements due to thermal deformation and to prevent sticking [
11]. As an antiseizure coating, molybdenum disulfide is applied to threads of fasteners used in ITER and JET to fasten blankets—assemblies of the first wall of tokamaks that are put in contact with plasma. EAST Articulated Maintenance Arm (EAMA) is used to service the facility and to carry out repair work without venting the vacuum chamber. To increase the speed of movement, a multicomponent coating based on molybdenum disulfide is applied to the elements of the friction units of the EAMA arm [
12].
There are a number of different ways to grow solid lubricating coatings on the surfaces of parts of friction pairs, which include painting, spray deposition, and plasma physical and chemical deposition methods (PVD and CVD). Particularly, the most widespread method of applying solid lubricating coatings is magnetron sputtering [
3,
8].
In magnetron sputtering systems, the characteristics of coatings can be controlled over a wide range depending on the deposition mode. The parameters of the deposition mode include discharge power, working gas composition, working gas pressure, substrate temperature, bias voltage, tilt of the substrate with respect to the direction of deposited particle flux, distance from the substrate to the target, and the magnetron power supply type (Direct Current Sputtering, Radio Frequency Sputtering, High Power Impulse Magnetron Sputtering, etc.) By tuning these parameters, one can prepare coatings with different microstructures, modify the surface roughness, obtain different elemental compositions of the film, adjust the adhesive properties of coatings, etc., [
4,
5,
13,
14,
15]. For example, in [
7], coatings were deposited from a sintered MoS
2 target in the HiPIMS mode, with the S/Mo ratio varying from 1.6 to 2.0 depending on the discharge power. The S/Mo ratio turned out to decrease with the increase in discharge power.
When selecting the conditions for MoS
2 coating deposition, one should take into account the occurrence of possible chemical reactions of molybdenum disulfide with the material it would be deposited on (base material). If the base material of the part provides a weak chemical bond or does not bind at all with the elements of an antifriction coating (AFC), the film would exhibit low adhesive properties, which would shorten its lifetime. In such cases, an intermediate layer should be applied. In [
16], possible compounds of molybdenum disulfide with various metals are considered in thermodynamic terms. These data enable the prediction of whether or not an intermediate binding layer between the base material and the MoS
2 coating is required. Often, a titanium film with a thickness of up to 200 nm is applied as an intermediate layer by magnetron deposition. In the case of chemical reactions, the lubricity of molybdenum disulfide might be reduced. Molybdenum disulfide is also often used as a part of composite materials, where the mechanism for reducing friction and wear is significantly different [
3]. Metals such as iron (Fe) and copper (Cu) do not form compounds with molybdenum disulfide under normal conditions [
16]. However, in [
2,
17] it is indicated that in the study of composites based on iron with molybdenum disulfide, compounds of iron sulfide and iron with molybdenum were formed. This led to reducing friction and wear under the studied conditions [
2], and, on the contrary, the addition of MoS
2 turned out to be ineffective, since the lubricating ability of the coating was lost due to the formation of compounds [
17]. Such discrepancy in the results can be explained by the difference in test conditions and highlights the need for testing under the real operating conditions of materials.
When choosing an antifriction coating, it should be kept in mind that molybdenum disulfide is sensitive to such operating conditions as temperature and moisture content in the environment. In humid environments, friction increases as a result of physical interactions between water molecules and the MoS
2 surface. Water molecules adsorb on the surface, penetrate into the lubricating film bulk, oxidize it, and impede the sliding ability of molybdenum disulfide layers [
2,
7,
18]. In a vacuum, a solid lubricant made of molybdenum disulfide shows a friction coefficient of 0.03 and lower; however, in air with normal humidity, its friction coefficient increases to 0.15–0.30 and increased wear is observed [
8] (all remaining conditions are the same).
Improvement in performance when operating in a humid environment and at atmospheric pressure is achieved when titanium is integrated into molybdenum disulfide films in a simultaneous magnetron sputter co-deposition process. However, in dry vacuum, pure molybdenum disulfide behaves more effectively [
10,
19].
The operating temperature range of solid lubricating coatings based on molybdenum disulfide, with good lubricity, is from −100 to +400 °C. At higher temperatures, lubricant degradation is observed due to its oxidation and sulfur removal from the coating in the form of volatile compounds [
1,
2].
Extreme operating conditions of friction units with AFC complicate their maintenance and replacement that as a rule can be performed only when the device is stopped. Therefore, the service lifetime of solid lubricating coatings based on molybdenum disulfide should be no less than the service lifetime of the equipment as a whole.
In the discussed studies, the friction coefficient, mechanical properties, and other properties of antifriction materials based on molybdenum disulfide were studied. Tests prior to the destruction of coatings were carried out in [
8].
Since the operating conditions of AFCs vary depending on application and their antifriction properties change with the surface state, the substrate composition, and the deposition modes, the structural analysis, measurements of mechanical properties, and lifetime tests under application-specific operating conditions are highly anticipated. The purpose of this work is to determine the effects of the physical and mechanical properties of molybdenum disulfide based coatings on their service lifetime indicators and tribological properties.
Here we report the study of the surface structure, chemical composition, and adhesive strength of molybdenum disulfide coatings applied by magnetron sputter deposition on steel and bronze samples and determine tribological properties and service lifetime of these coatings.
2. Materials and Methods
The samples were rectangular plates with dimensions 40 mm × 20 mm × 4 mm made of two base materials: steel AISI 316L and bronze CuAl9NiFe4Mn1. Their surfaces were prepared using grinding paper made of SiC with various grain sizes (P800–P4000), prepared by sandblasting (100–150 μm grain size), or left in the original state after rolling.
All samples were cleaned in an ultrasonic bath at a power of 50 W in alcohol. Prior to coating deposition, additional ion cleaning of samples was carried out in a vacuum chamber in a glow discharge at argon pressure pAr = 2 × 10⁻² mbar and substrate voltage Ugd = −1500 V. Processing time was 15 min.
2.1. MoS2 Deposition
The molybdenum disulfide coatings were deposited by magnetron sputtering. A slightly unbalanced 3-inch Magneto series (Pinch, LLC, Moscow, Russia) circular magnetron was used. Sputtering was performed from a sintered MoS
2 target with 99.95% purity (Goodwill Metal Tech Co. LTD, Beijing, China). The samples were placed opposite the magnetron target, at a distance of 8 cm, together with a witness sample. The vacuum chamber was pumped with an oil-free pumping system down to a residual pressure of ~10
−4 Pa. The pressure of the working gas—argon—was set by the gas flow regulator (Bronkhorst High-Tech B.V., AK Ruurlo, the Netherlands). During the deposition, a constant bias voltage was applied to the samples, with different polarity depending on the experiment. Sputter deposition modes are listed in
Table 1. The obtained coating thickness was 6.0 ± 1.3 µm. At the end of the deposition, the samples were cooled for 15 min in argon atmosphere. The thickness of the prepared coatings and the roughness of the samples were determined with Dektak 150 (Veeco, Tucson, AZ, USA) surface profiler.
In our experiments, two deposition modes were considered, differing in bias voltage (+100 and −20 V). An important aspect is that when applying a positive bias voltage of +100 V, the deposition rate of the coating increased by ~30% compared to the deposition rate at −20 V bias voltage (which was nearly the same as at zero bias voltage). The main goal of this work is to compare these modes in terms of the main tribological, mechanical, and structural characteristics.
To study the tribological properties, 11 samples with coatings were prepared. Their characteristics are presented in
Table 2.
2.2. Tribological Tests
Tribological tests were carried out in accordance with the ASTM G133 standard with reciprocating relative displacement of the sample and the counter-sample—a 6 mm diameter ball made of 100Cr6 steel. The studies were carried out in vacuum, and the samples were heated. The test mode parameters are given in
Table 3.
The coefficient of friction and the service lifetime of the coatings were determined separately. The duration of tests aimed at friction coefficient measurement was 30 min. These tests were mainly done to compare friction coefficient values with known published data. The service lifetime tests were carried out until the moment of coating destruction, which was established by increasing the friction coefficient up to 0.3.
Tribological tests in vacuum with sample heating were performed in a special facility developed at IMASH RAS and certified for testing in accordance with the ASTM G133 standard. Detailed description of the facility operation can be found in [
20]. During the test, the pressure in the chamber, the temperature of the samples, and the friction coefficient were recorded. The results were processed using the NI DIAdem 2017 software (version 17.0.0f6657).
Each sample was tested three times to determine the average value of the friction coefficient; the confidence interval was calculated with a confidence level of α = 95%.
2.3. Adhesive Strength of Coatings
The adhesive strength of the coatings was evaluated in scratch tests carried out in air at room temperature with a certified CSM Revetest instrument (Anton Paar, Graz, Austria). A 200 µm radius Rockwell diamond indenter (Anton Paar, Graz, Austria) moved over the coated surface with a load increase rate of 10 N/min. Initial load was 0.3 N, final load was 20 N, and track length was 5 mm. During the tests, the penetration depth of the indenter and acoustic emission were recorded together with changing load. During each test, the values of the normal load (in N), the penetration depth of the indenter (in µm), the surface coordinate (in mm), and the acoustic signal (in %) were recorded.
2.4. Structure and Composition of Coatings
The structure of the coatings after deposition was investigated using a Vega 3 scanning electron microscope (Tescan, Brno, Czech Republic). The nature of surface wear and destruction after tribological tests were analyzed. Images were obtained at an accelerating voltage of 5 kV. An energy-dispersive spectrometer (EDS), (Oxford Instruments High Wycombe, UK) was used to diagnose the elemental composition of the coating. The atomic ratios of oxygen and sulfur (S/O) and sulfur and molybdenum (S/Mo) in the coating composition were analyzed before and after tribological tests.
2.5. X-ray Phase Analysis
X-ray diffraction (XRD) for phase analysis was performed using a XRD-6000 vertical X-ray diffractometer (Shimadzu, Kyoto, Japan)at room temperature, normal atmospheric pressure and humidity, with monochromatic copper radiation with a wavelength λKα,av = (2λKα1 + λKα2)/3 = 1.54178 Å. Crystalline phases were identified using the ICDD-2003 database.
3. Results and Discussion
3.1. Coatings Surface prior to Testing
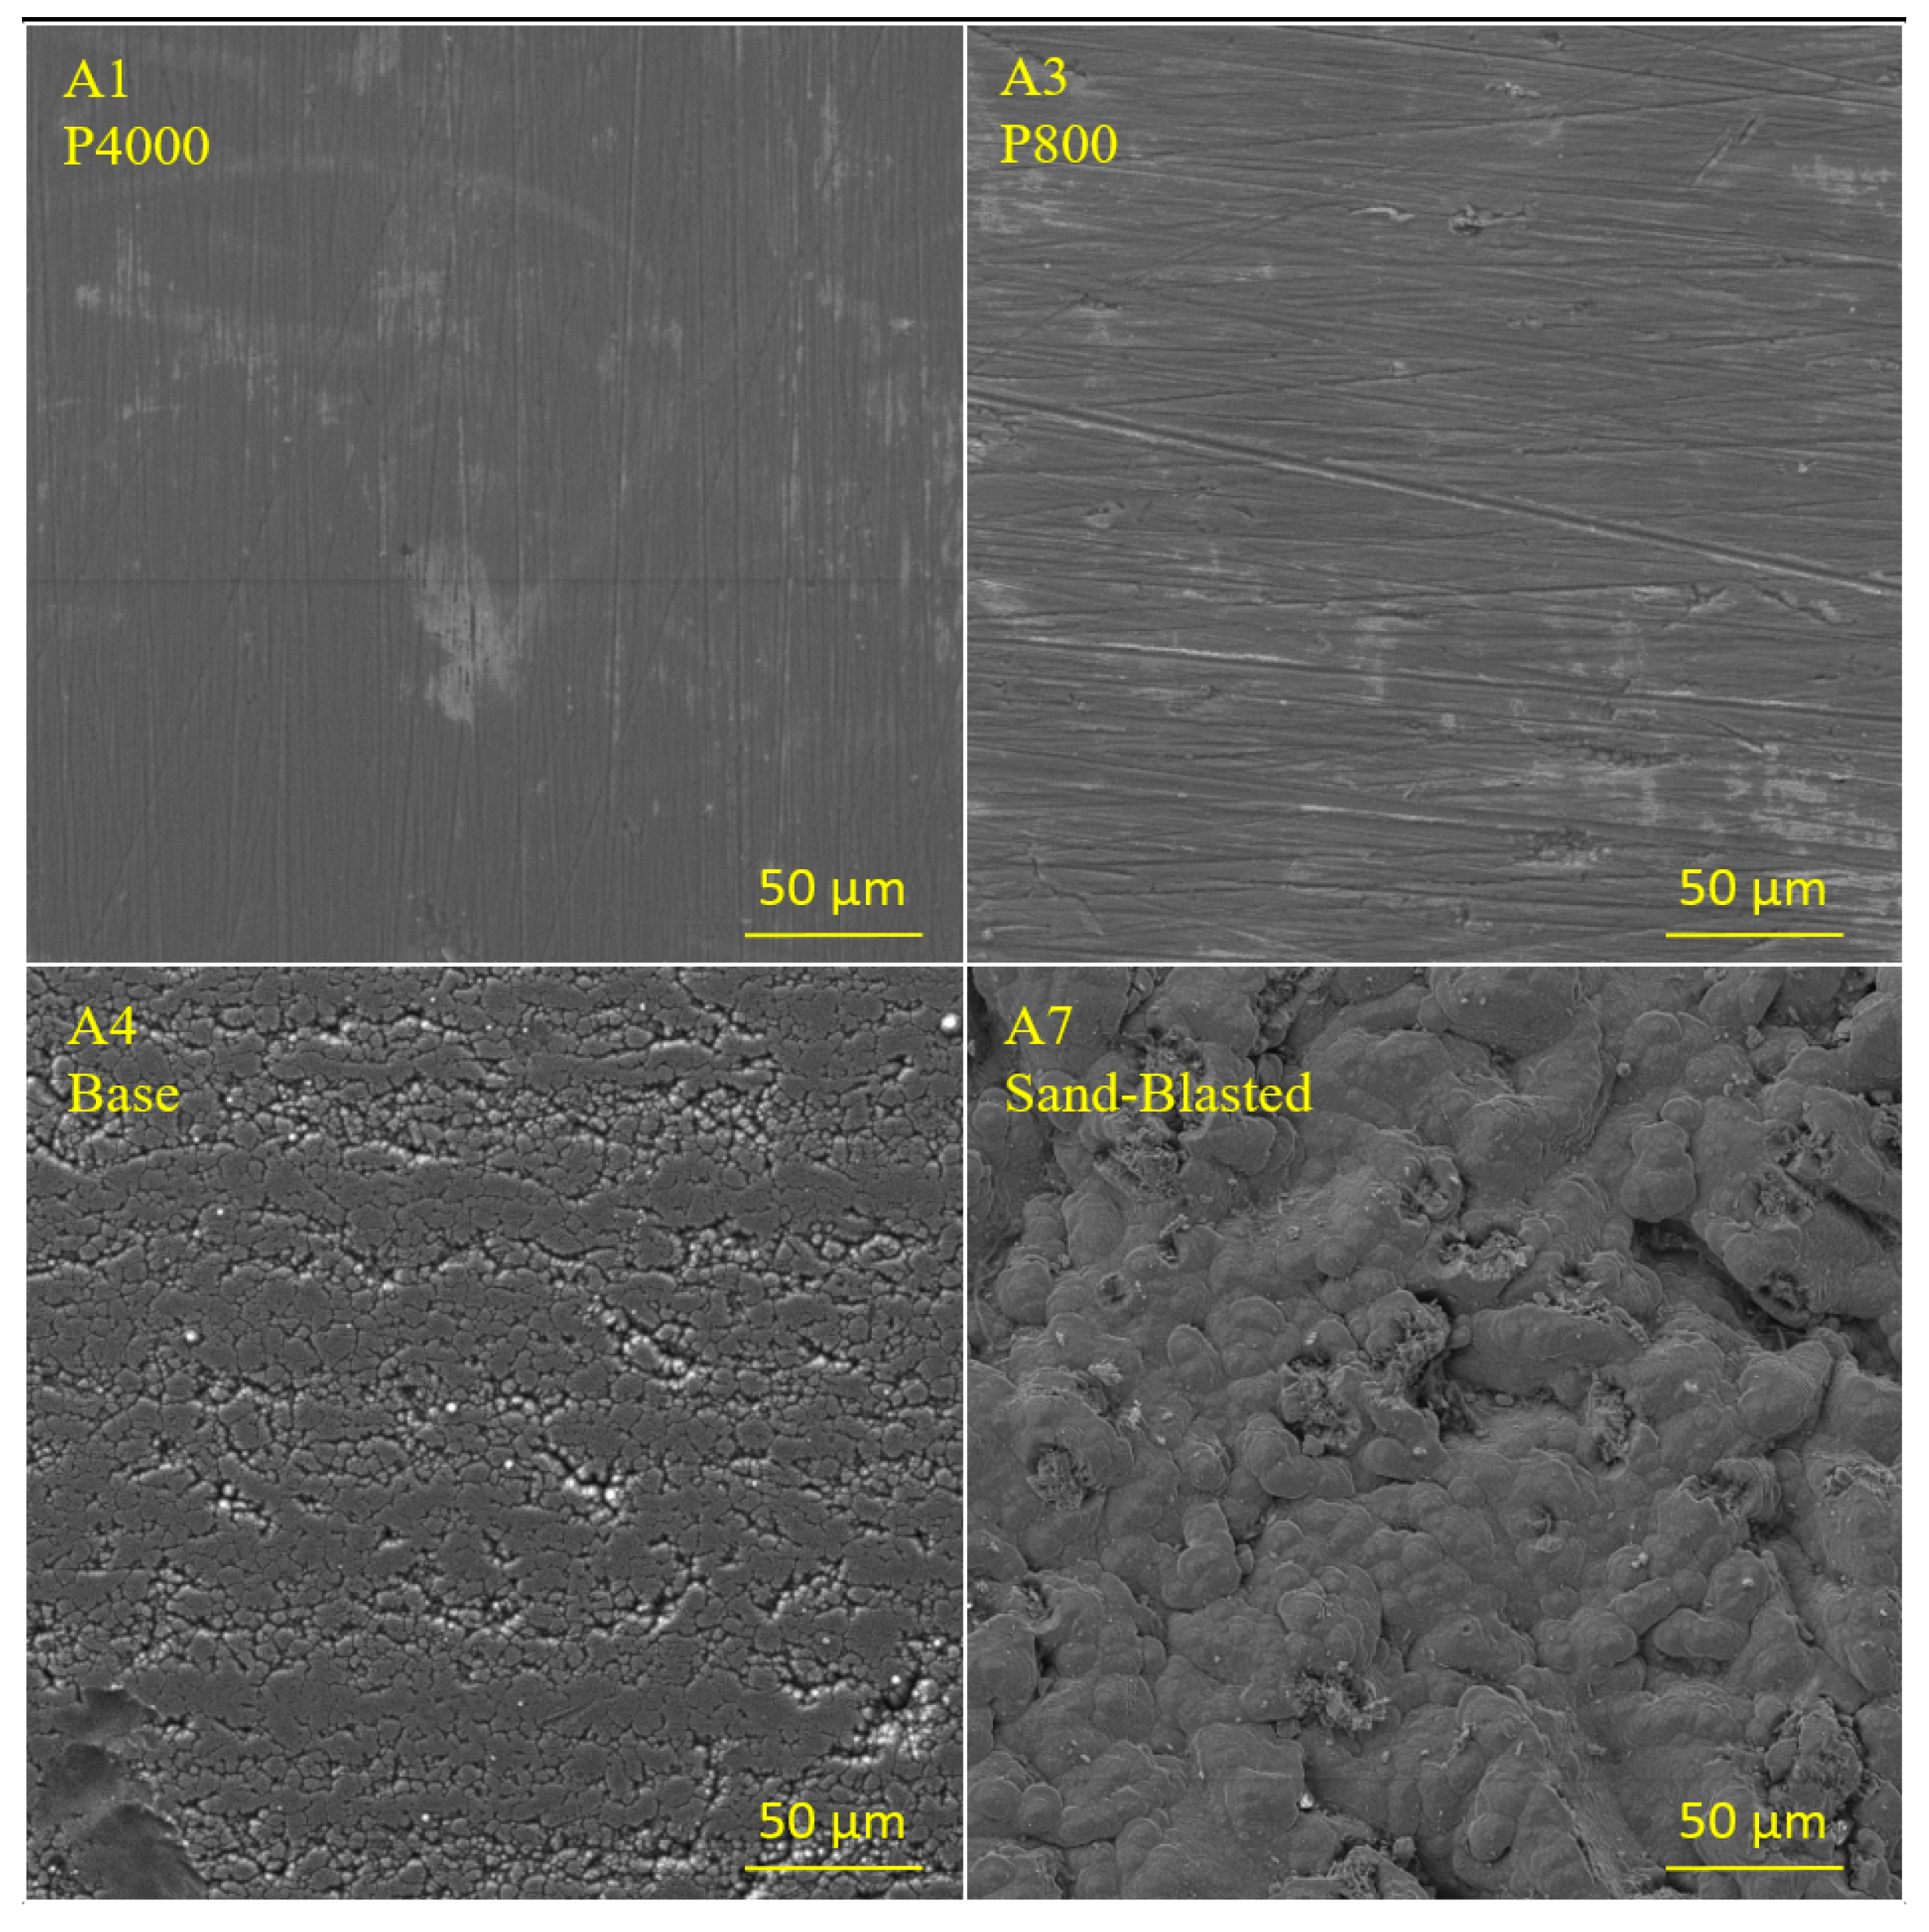
Surface images of coated bronze samples are shown in
Figure 1. The morphology of the coating surface duplicates the structure of the original surface and demonstrates the pattern of abrasive marks. On some samples, defects are observed that do not compromise the overall uniformity of the coatings.
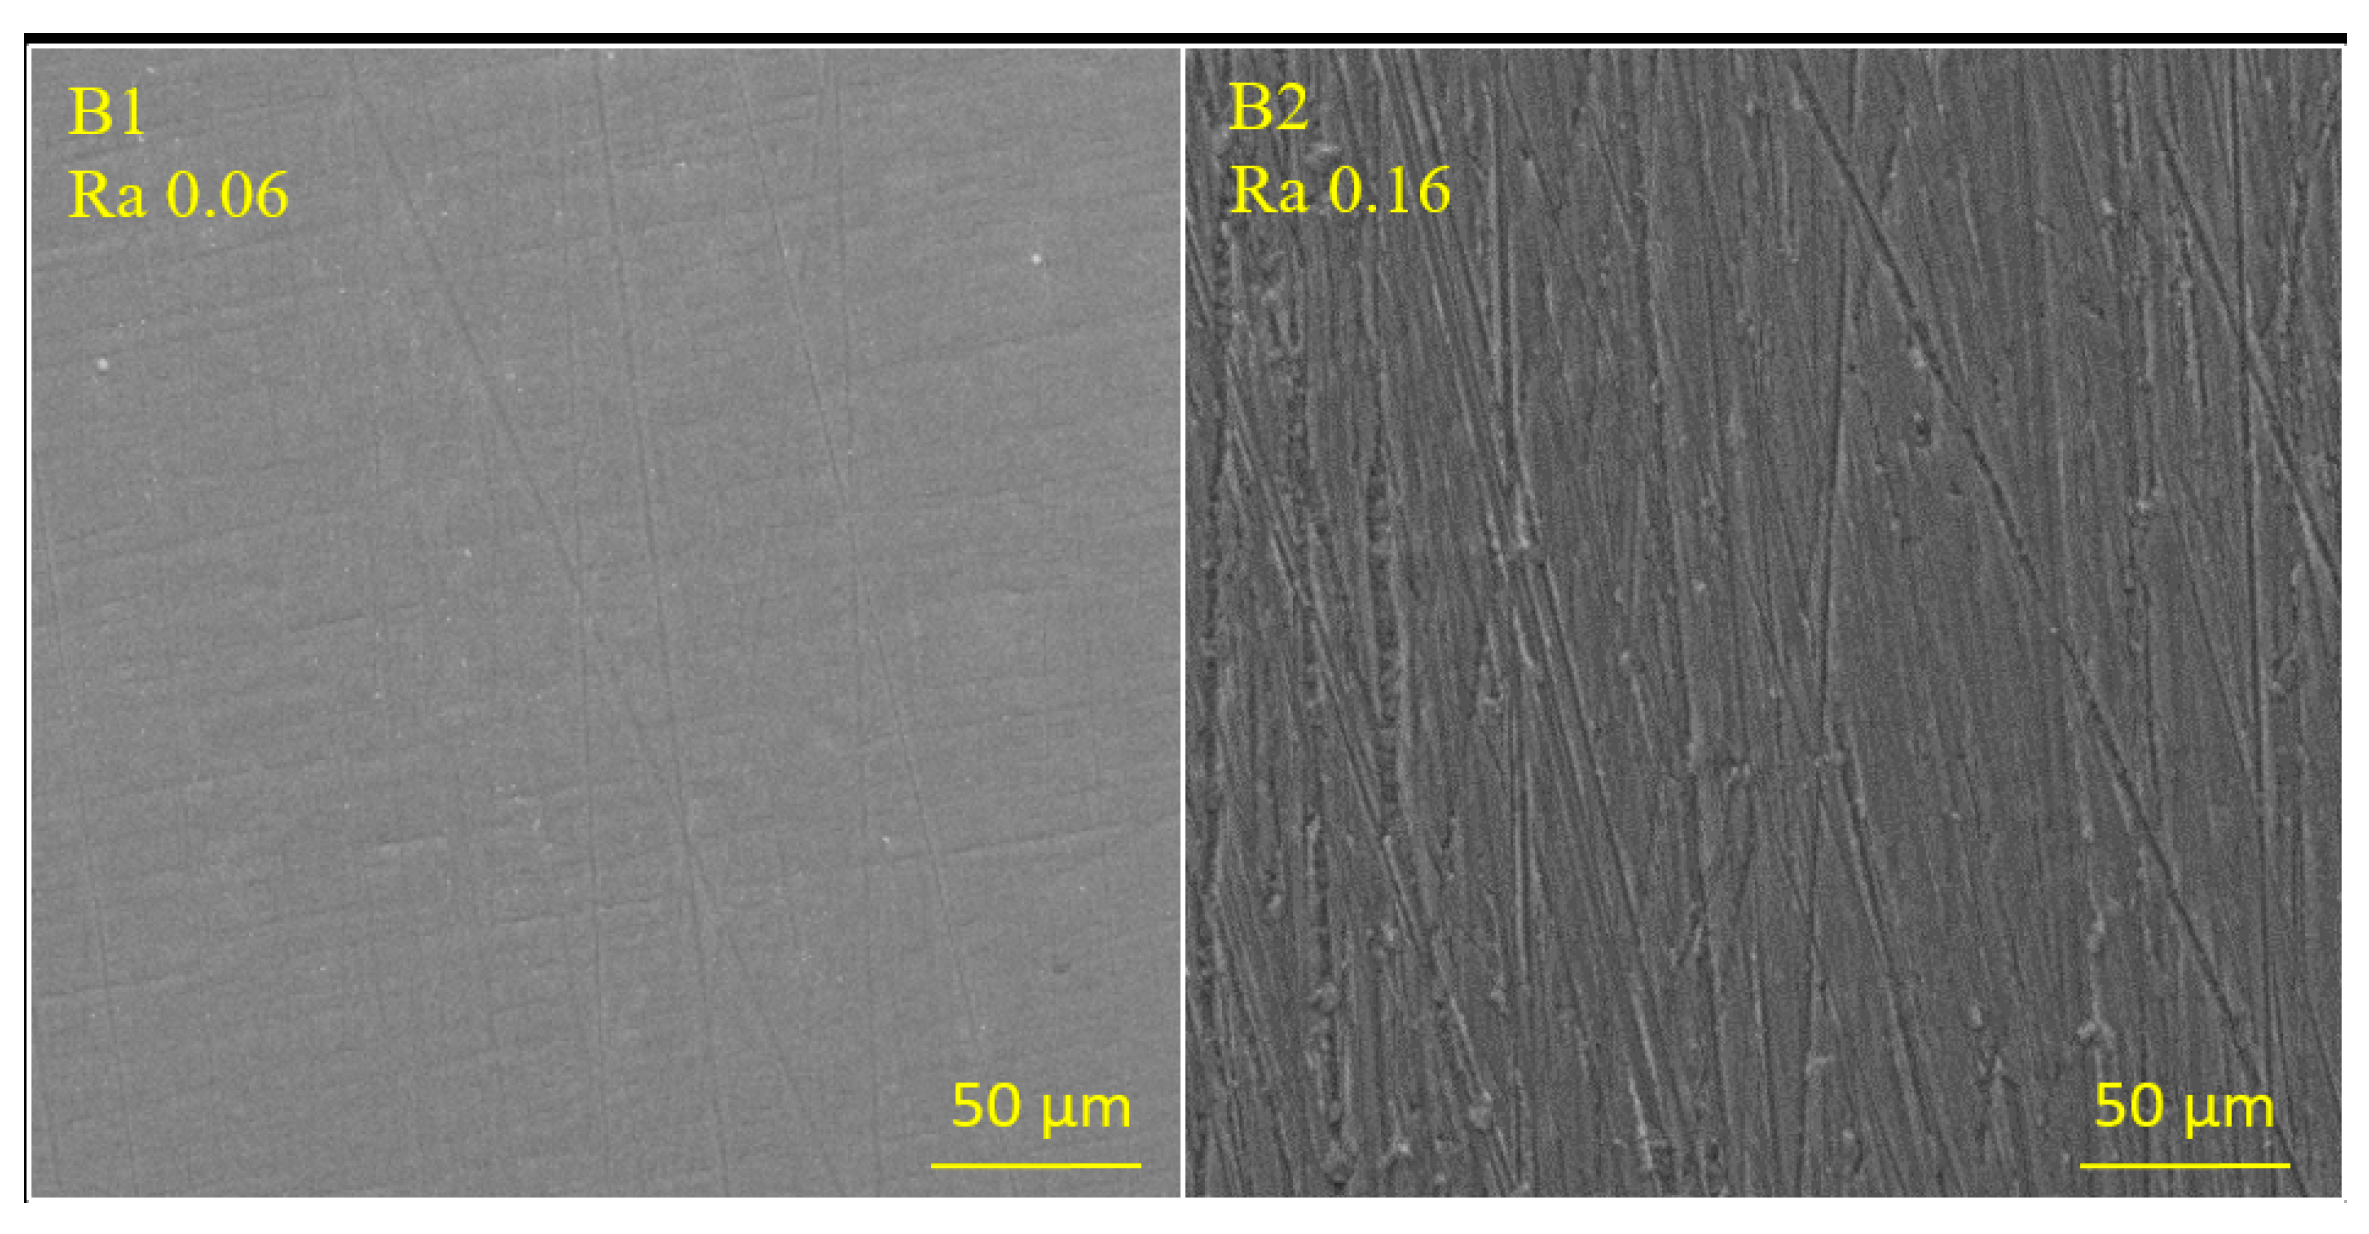
Surface images of coated steel samples are shown in
Figure 2. Again, the surface of the coatings replicates the structure of the initial surface and shows the pattern of abrasive marks. Scratches from abrasive particles on sample A2 with a lower roughness, Ra 0.05, are visually smaller.
The initial surface of steel samples has a granular structure; however, it also demonstrates directional waviness as a result of the original material production process (metal rolling). The coating duplicates the initial roughness for all samples. Visually, the surface contains pores and voids, but the EDS shows that the ratios of the intensities of main peaks of molybdenum- and sulfur-to-iron do not change. This indicates that there is no violation of the coating continuity. For the samples initially subjected to sandblasting, we observed a significant difference in the coating surface structure from the untreated ones. After deposition, globular structures are observed on the surface instead of sharp-edged features, which are typically found as a result of sandblasting. Thorough examination reveals that the structure is columnar with the growth direction normal to the corresponding surface element.
3.2. Results of Tribological Tests for MoS2 Coatings on Bronze
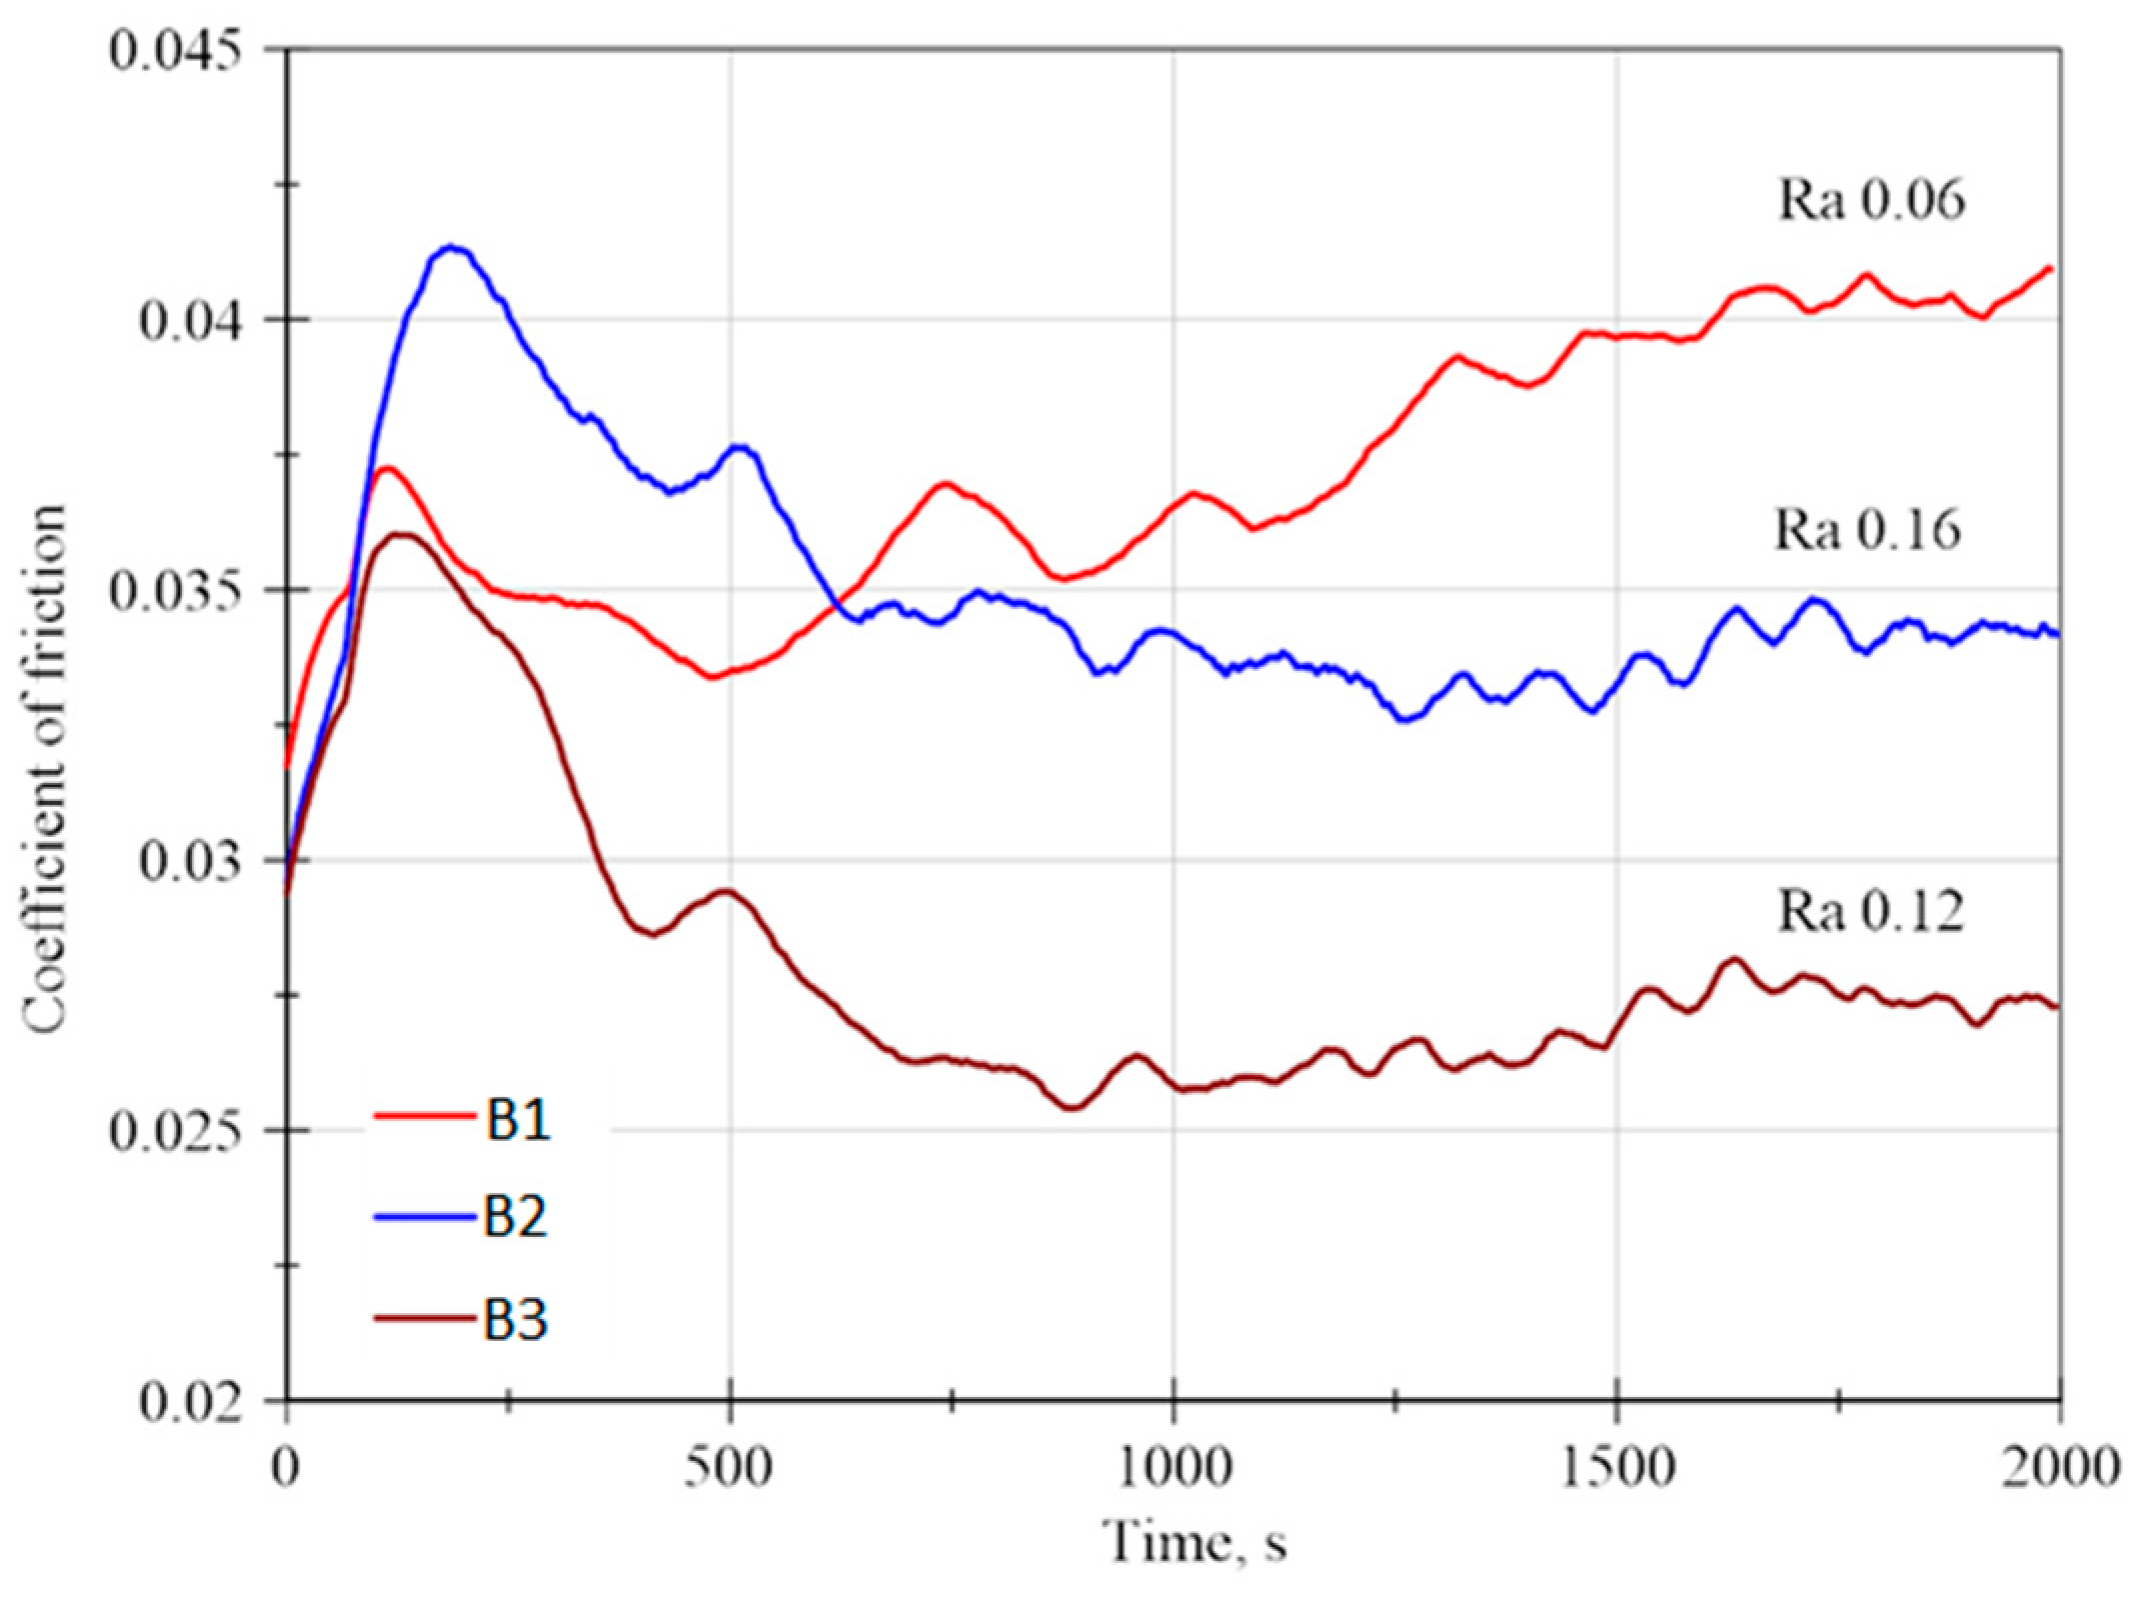
Results of the friction coefficient measurements for coatings deposited on bronze CuAl9NiFe4Mn1 are shown in
Figure 3. The resulting plotted value was averaged over three measurements of the friction coefficient during tests in vacuum and at sample temperature of 250 °C.
In the beginning, an elevation in the friction coefficient is observed from the initial value to a certain local maximum, followed by a decrease during the running-in process. Eventually, the friction coefficient reaches the “steady state” plateau region. Such behavior of the friction coefficient can be explained as follows: At first, the contact is established only along the top points of the coating and the counter-body surface textures. Then, gradual increase in the contact area occurs, while the surface structure remains not completely destroyed. After that, the counter-body is rubbed in, and the surface microstructure of the coating becomes erased completely. The coating starts to behave according to the conventional friction model. In this case, a gradual increase in the friction coefficient is observed on samples with low roughness. For samples with roughness Ra > 0.1 μm, the situation is quite the opposite. This might be associated with the formation of a dispersed molybdenum disulfide.
The friction coefficient of the sample B1 in the steady-state region exceeds both the initial value and the value corresponding to the local maximum in the running-in stage. For samples B2 and B3, the maximum value during testing is reached in the running-in stage, and in the steady-state friction stage, the coefficient value is minimal.
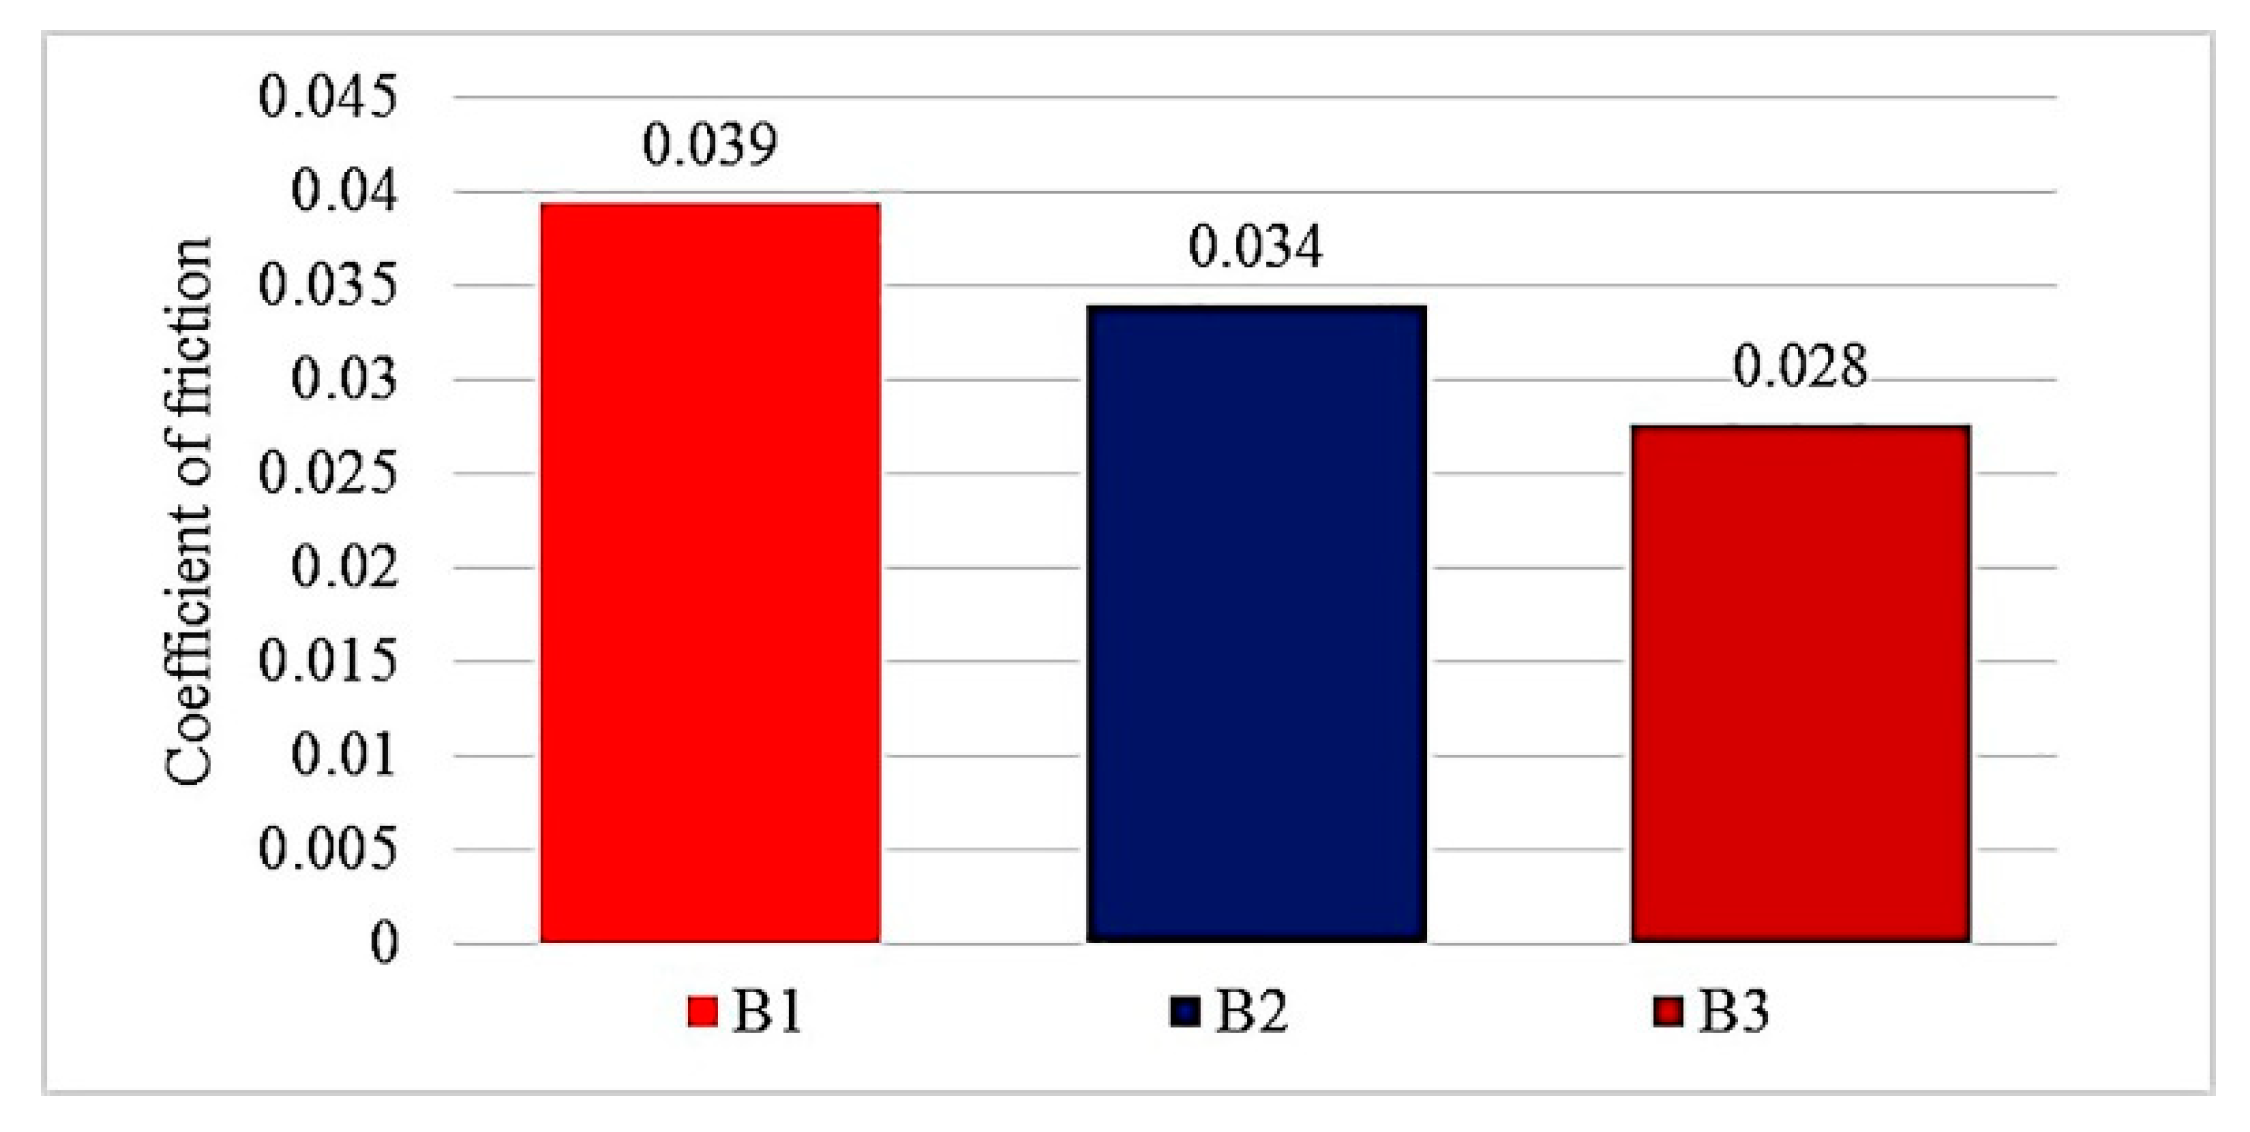
The average value of the friction coefficient in the steady-state friction stage, which was considered from 1500 to 2000 s, is shown in
Figure 4. Samples with a bronze base B2 (Ra 0.16) and B3 (Ra 0.12) demonstrate a similar character of change in the friction coefficient. With an increase in roughness, both the friction coefficient and the running-in period increase. After that, in steady state, the value of the friction coefficient decreases. Sample B1 (Ra 0.06), initially treated with fine-grained sanding paper (P4000), with roughness 2–2.7 times lower than that of all other samples, is characterized by an increase in the friction coefficient after running-in. This is in agreement with the results reported in [
8]. For samples B1 and B2 coated in the +100 V mode, the friction coefficient turned out to be higher than that for sample B3.
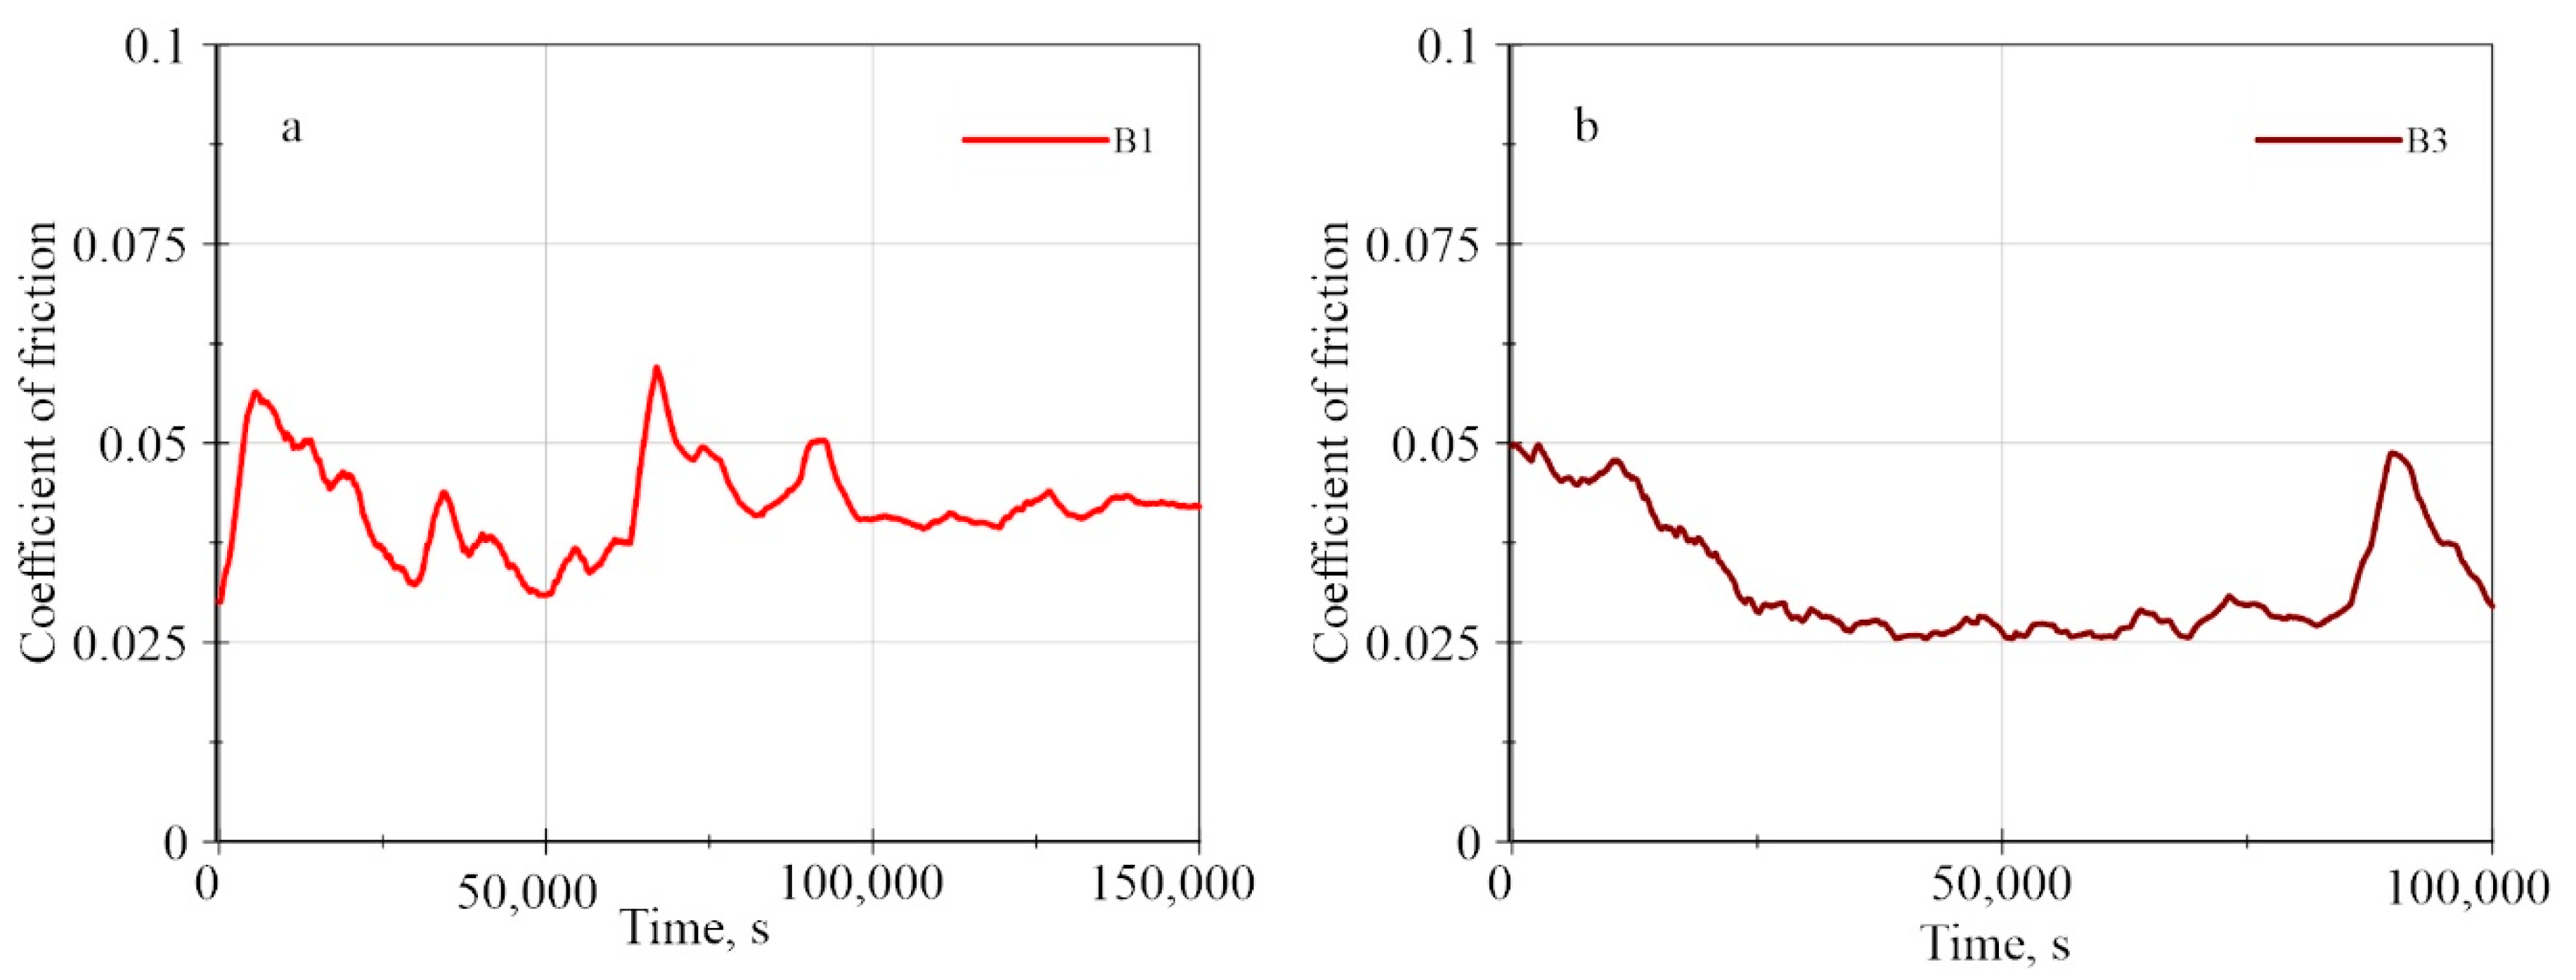
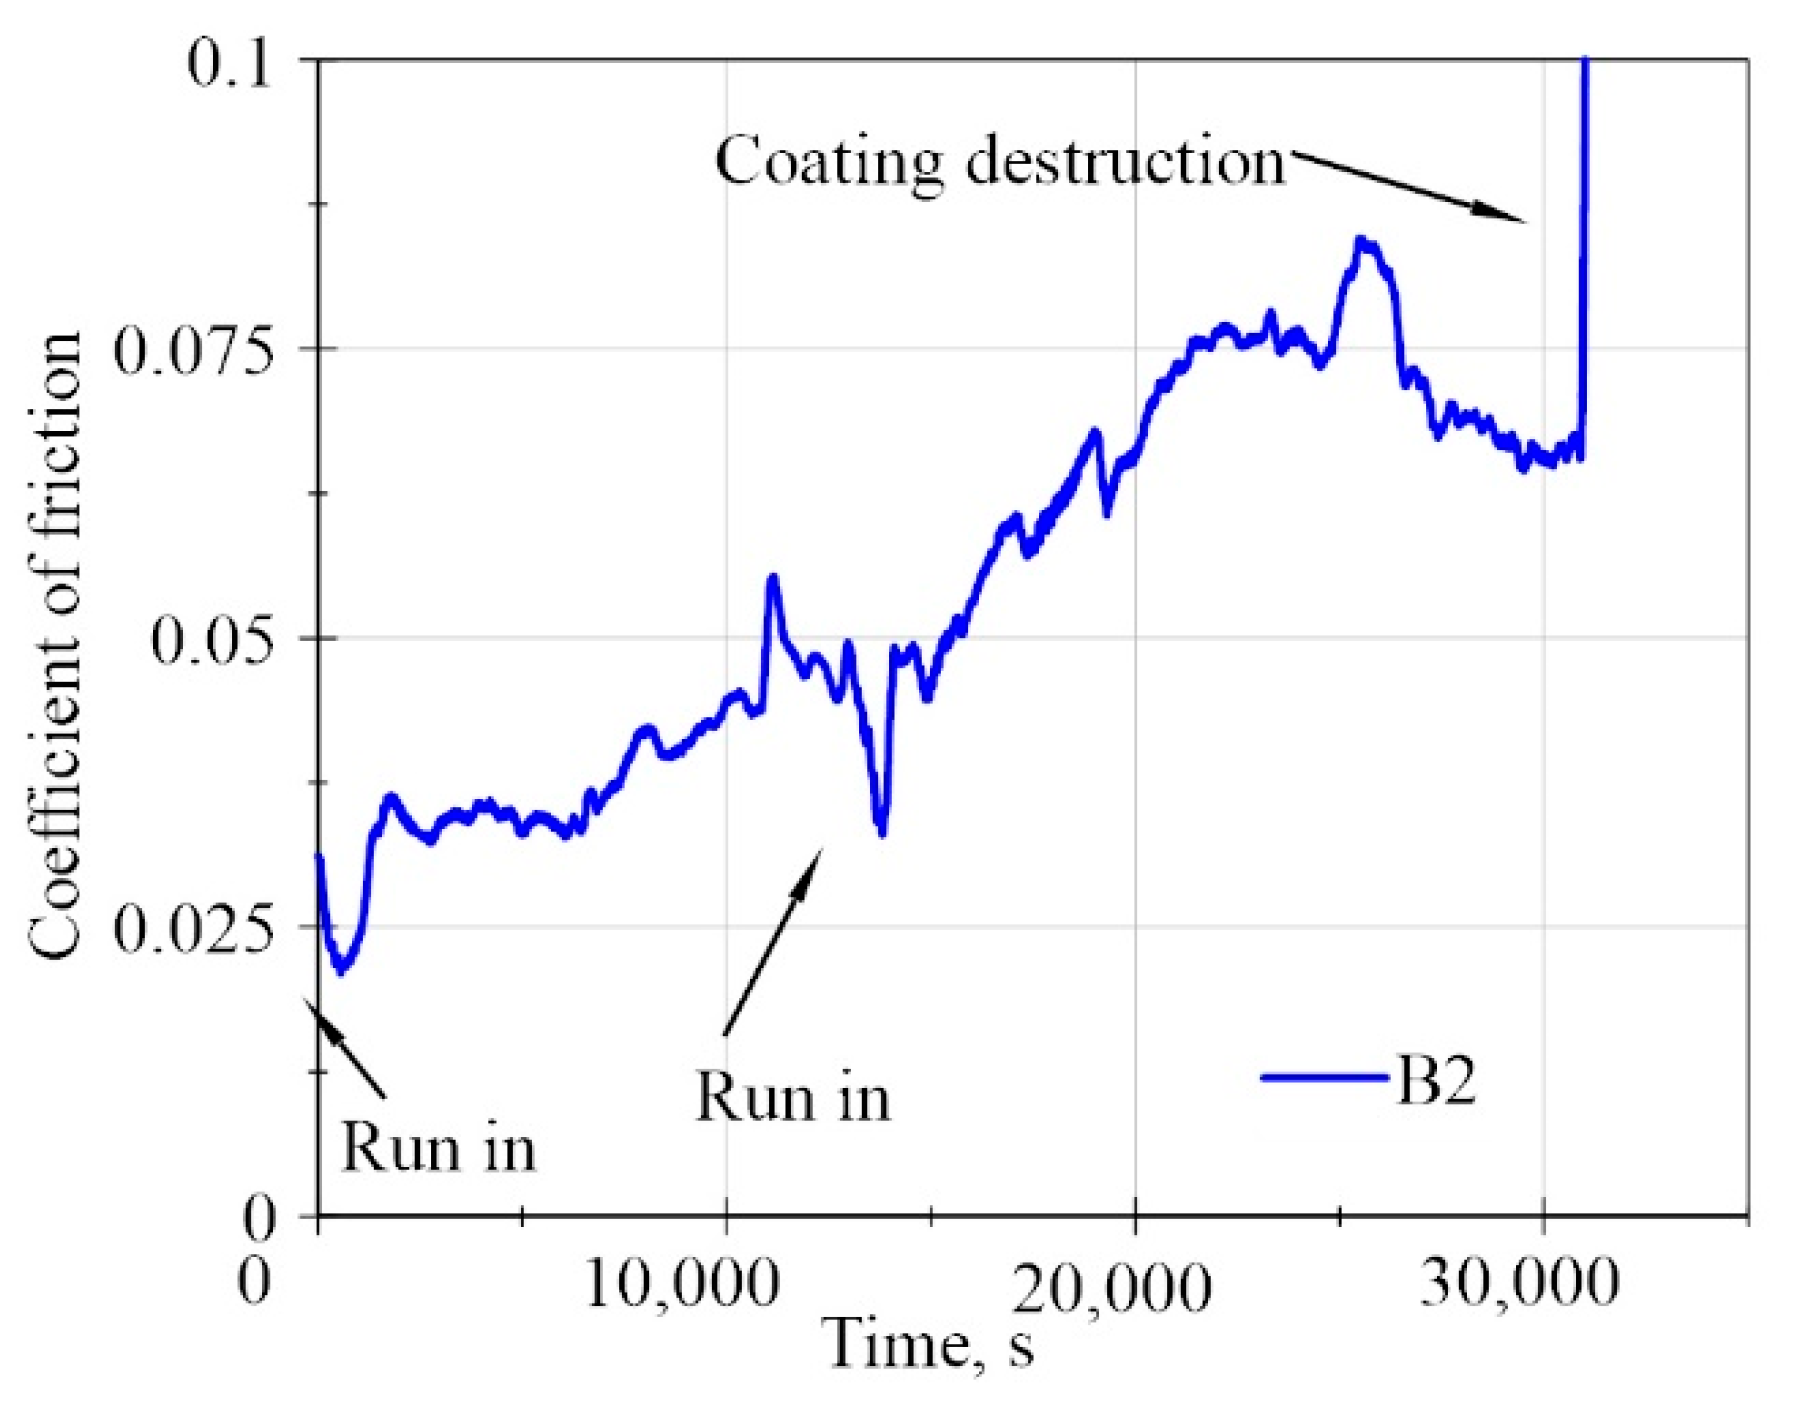
The results of service lifetime tests for samples with a bronze substrate are shown in
Figure 5 and
Figure 6. In these tests, the long-term performance of the coatings in vacuum at a temperature of 250 °C was estimated. Samples B1 and B3 passed service lifetime tests and lasted more than 27 h without destruction (
Figure 5). One should note that sample B3 demonstrated the more stable value of the friction coefficient in time.
Long-term tests were carried out over several days with periodic stops. Typical re-running-in periods associated with stopping the test and resuming it the next day are indicated in
Figure 6 by arrows (run in). The event of coating destruction and the beginning of the friction process between the indenter and the base substrate material was determined by a sharp increase in the friction coefficient—at this moment, the test was stopped. The failure of the coating of sample B2 occurred after 8.6 h. When testing samples B1 and B3, periodic peaks in the friction coefficient approximately twice the average value were observed, which are not associated with repeated starts and stops of the test. Sample B3 showed a consistently low friction coefficient (0.025) throughout the 7 to 23 h test.
The average value of the friction coefficient during the service lifetime tests exceeds the values obtained in previous short-term experiments for sample B1 by 8%, B2 by 59%, and B3 by 18%.
3.3. Results of Tribological Tests of Coatings on a Steel Substrate
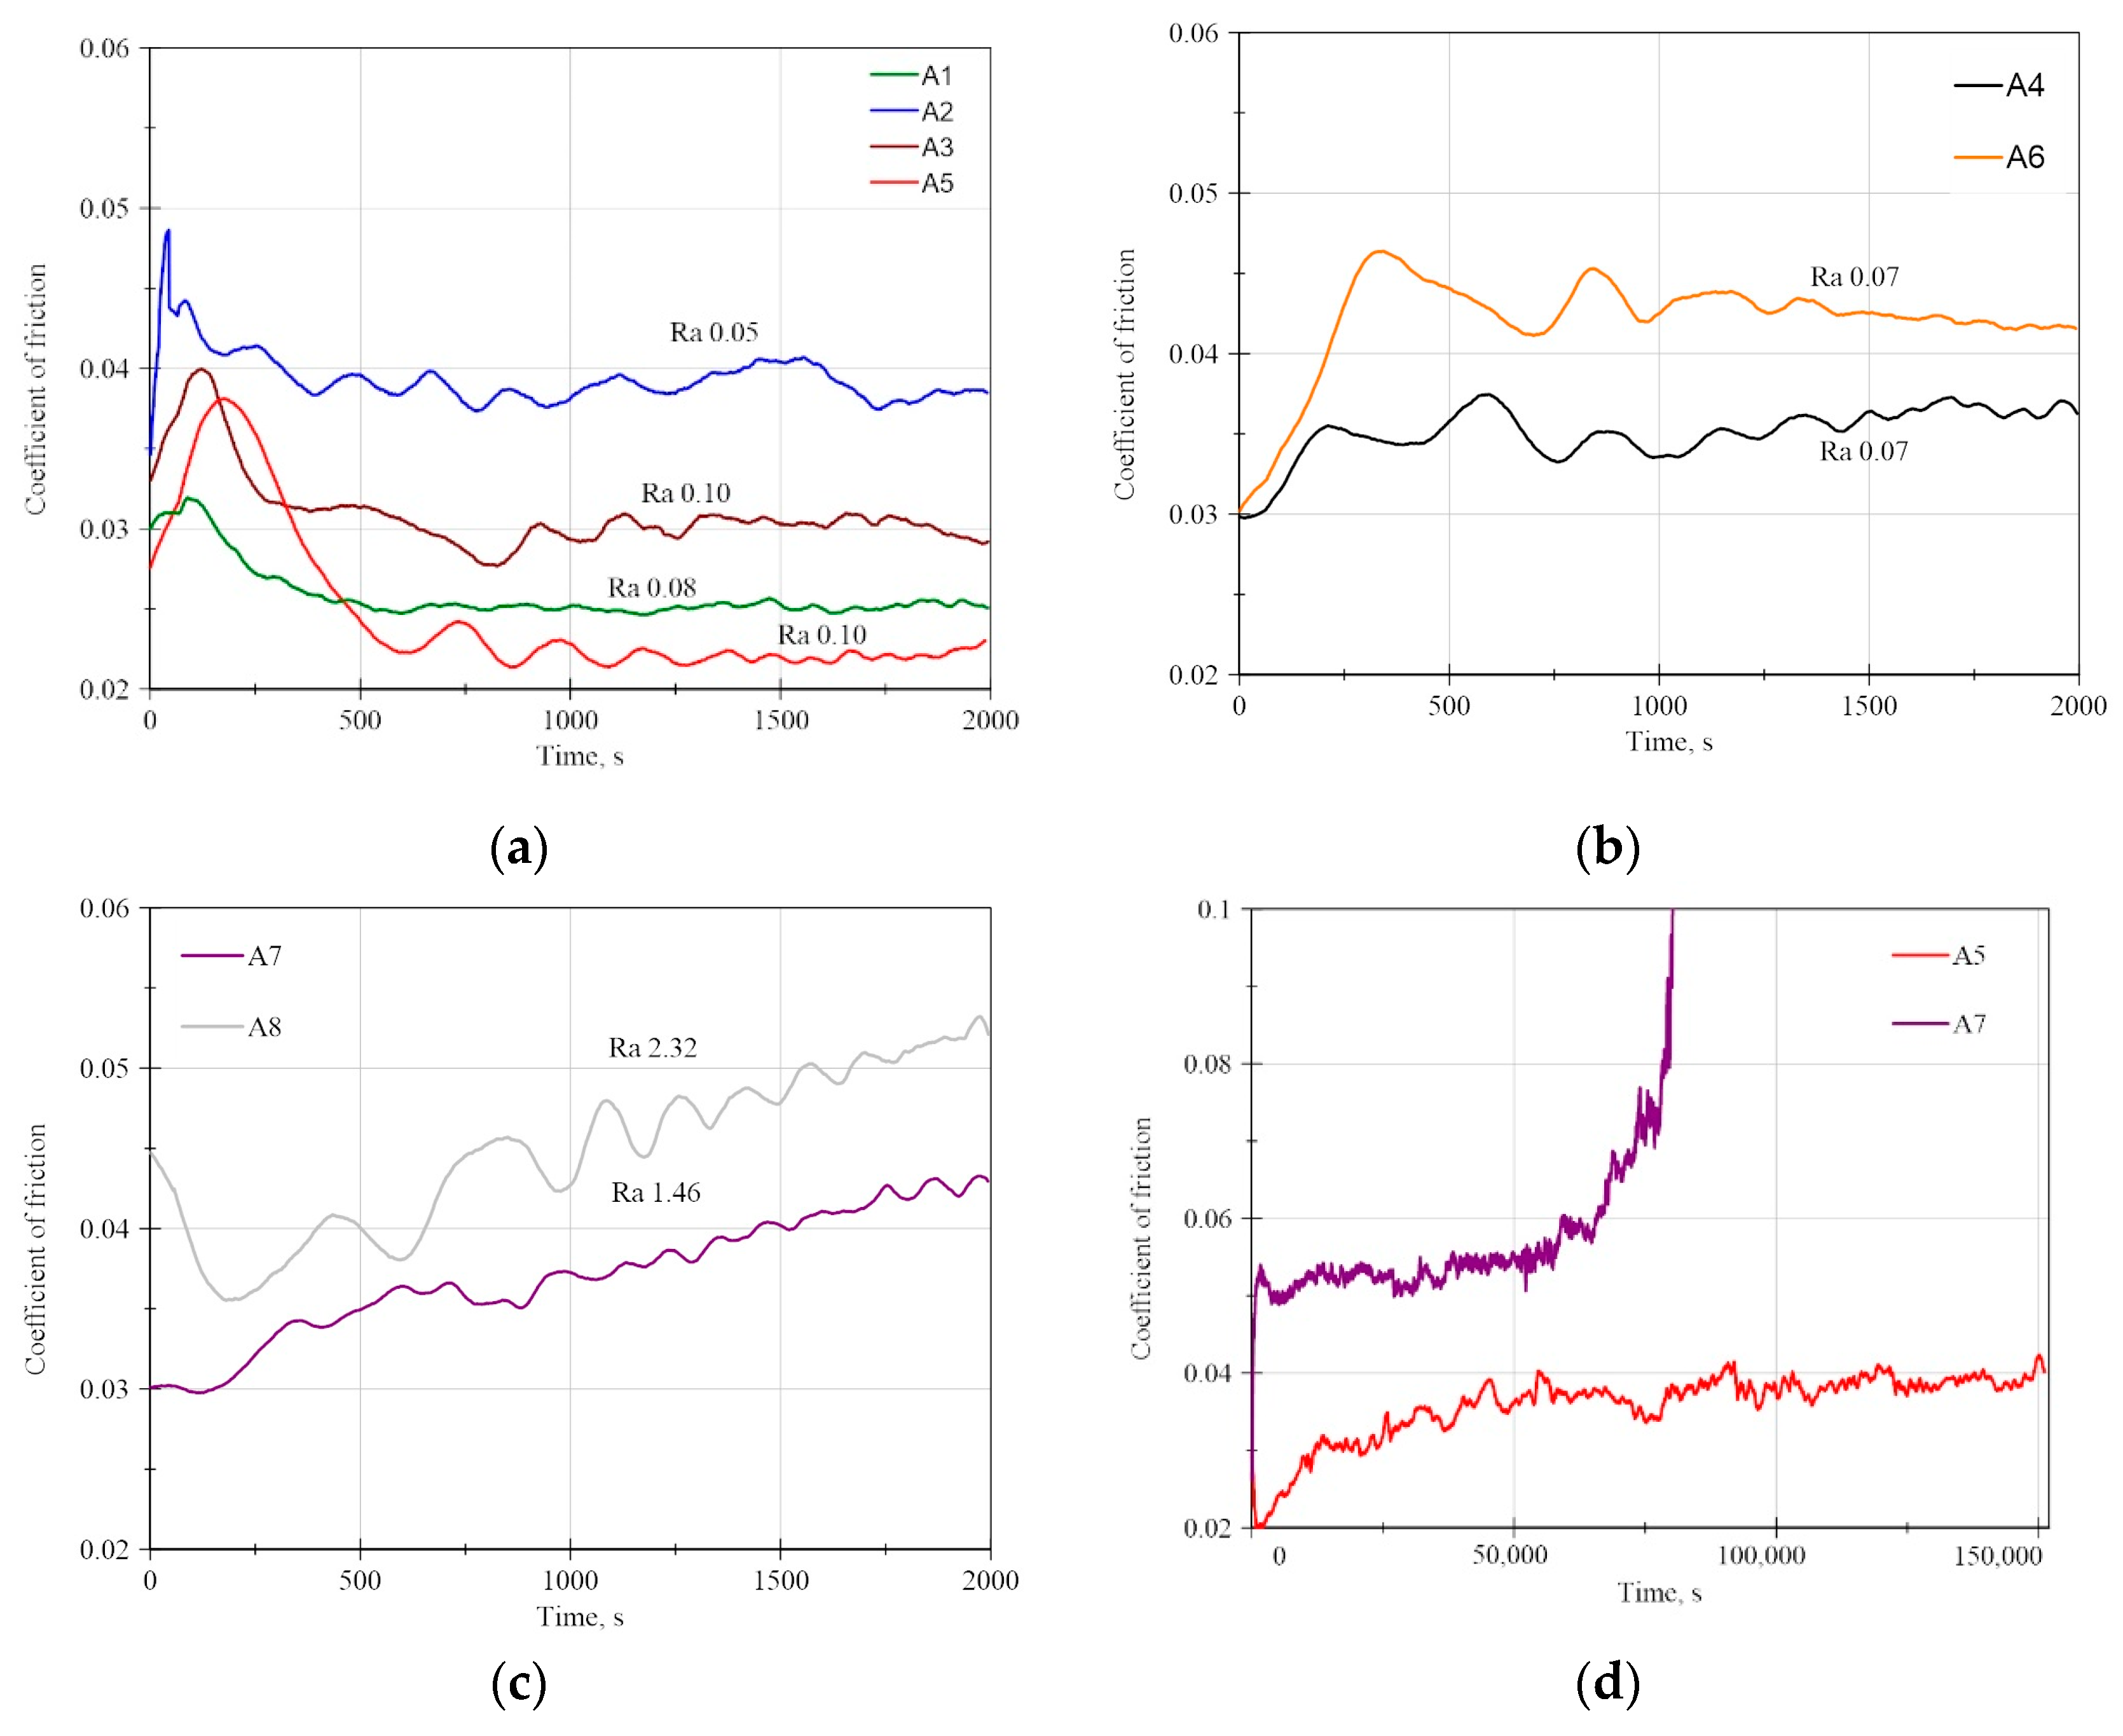
Results of the friction coefficient measurements for coatings deposited on AISI 316L steel, averaged over three experiments, during tests in vacuum at a sample temperature of 250 °C are shown in
Figure 7.
Samples treated with sandpaper of different grain sizes (
Figure 7a) at the beginning of the test demonstrate a steep increase in the friction coefficient up to the maximum value and then a sharp drop down to the steady-state value. With an increase in the roughness of the samples, it takes more time to reach the maximum value of the friction coefficient and the beginning of the running-in period. In the latter, the friction coefficient decreases until reaching the steady-state plateau. Samples A3 and A5 were deposited in different modes (see
Table 2). Despite their roughness being the same, the friction coefficient differs by a factor of 1.5. In the +100 V deposition mode, a lower friction coefficient is observed.
For samples with untreated initial surface, the steady-state friction stage is reached with an increase in the friction coefficient (
Figure 7b). For MoS
2 deposited in +100 V mode, the friction coefficient is 1.2 times lower.
Samples after sandblasting, with higher roughness (
Figure 7c), demonstrate a slight initial decrease in the friction coefficient, followed by its gradual increase and reaching a steady state at the end of the test, which is detected by flattening the curve. Since the surface roughness for these samples differs by a factor of 1.6, it is not possible to perform a correct comparison of the deposition modes.
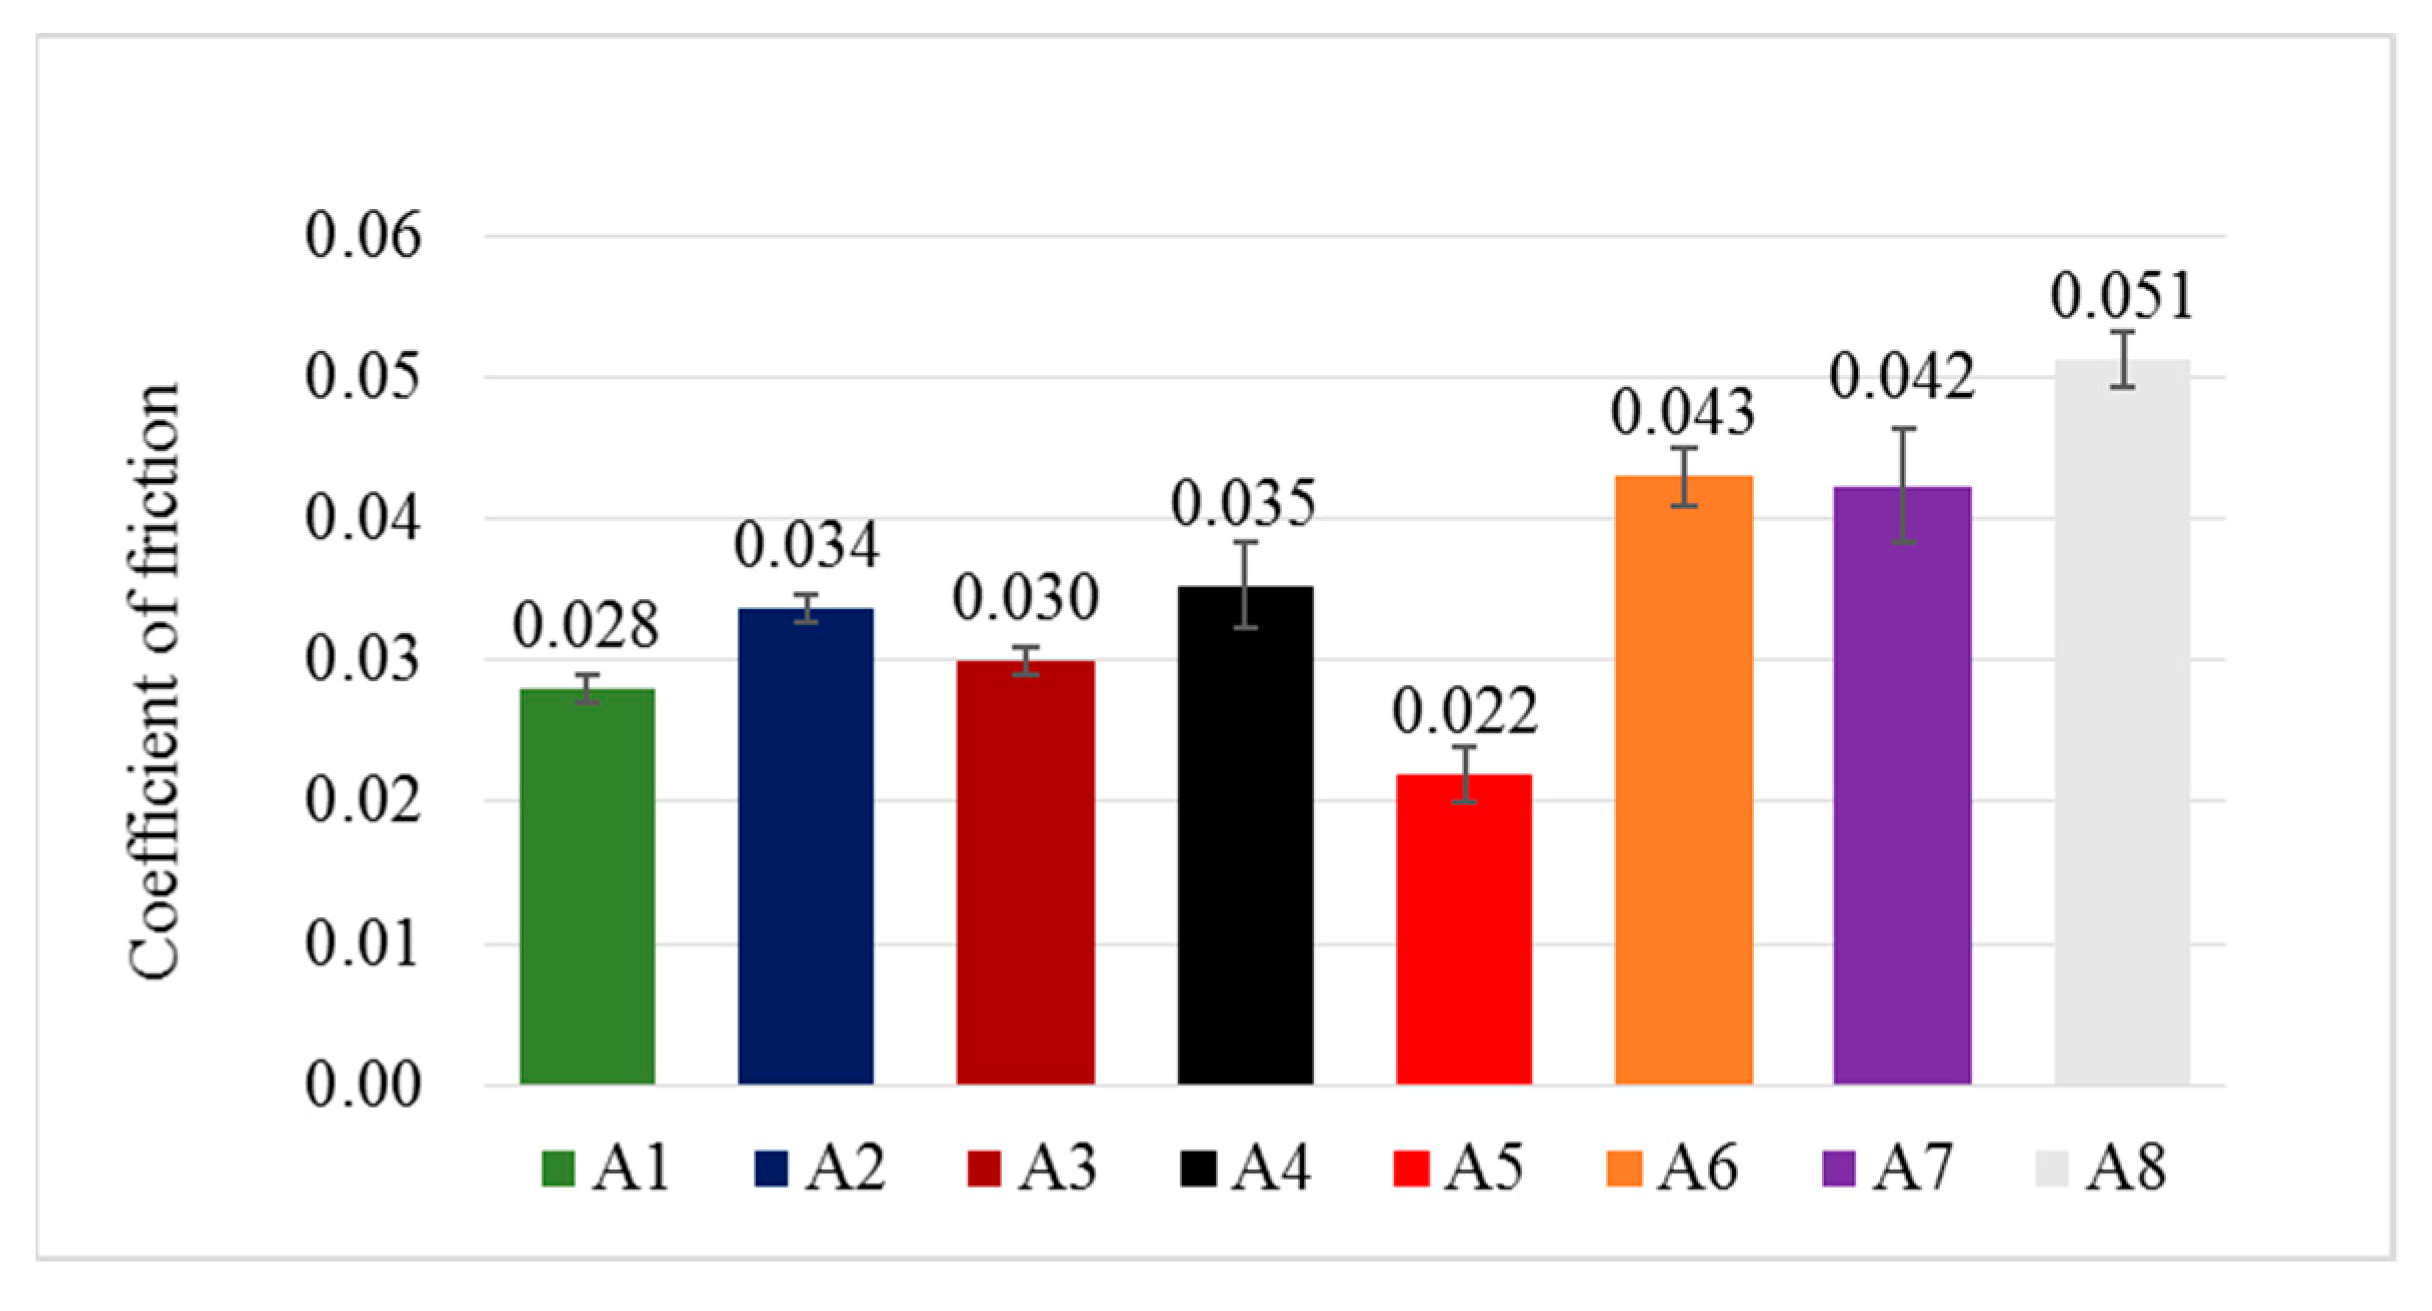
The average values of the friction coefficient in the steady-state stage for samples with a steel substrate are shown in
Figure 8. The steady-state friction stage was considered from 750 to 2000 s for all samples except A7 and A8; for A7 and A8, it was 1750 to 2000 s.
Samples initially treated with sandpaper exhibit lower values of friction coefficient in the steady state as compared to both those with the original surface after metal rolling and those after sandblasting. The lowest value of the friction coefficient was obtained during deposition of the coating in the +100 V mode for sample A5 (0.022). The highest friction coefficient values (~2 times greater) were measured for A8 (0.051), A6 (0.043), and A7 (0.042).
For the service lifetime tests, two samples differing in the friction coefficient by a factor of 2 and in the roughness by a factor of 15 were selected (A5 and A7,
Figure 7d). Sample A7 was destroyed after 22.7 h of operation; sample A5 lasted over 42 h. Unlike samples with bronze substrate, samples with steel substrate demonstrated a stable value of the friction coefficient without sharp fluctuations in the long-term tests. The increase in the friction coefficient, which was used to determine the failure of the A7 coating, was in fact much slower than for the samples on the B2 bronze substrate. The friction coefficient measured during service lifetime tests exceeds the values obtained in short-term experiments: for sample A5, nearly by 2 times; for sample A7, by 1.3 times. It can be seen that the value corresponding to the average friction coefficient in short-term experiments for sample A5 (0.022) was briefly observed in the initial period of the service lifetime tests.
In summary, we should note that steel samples with deposited MoS2 coatings showed different evolution of the friction coefficient and the running-in period depending on the method of surface treatment. Samples initially treated with abrasive paper run in quickly (within 200 s), and in the steady state their friction coefficient decreases. The running-in of samples with coarser initial surface (after sandblasting) takes longer (up to 1800 s) and is completed only by the end of the test with an increase in the friction coefficient in the steady state. Samples with initially untreated surface (after metal rolling) run in with an increase in the friction coefficient associated with the establishment of optimal roughness for the given conditions of the sample and counter-body.
It is indicated in [
8] that the optimal range of substrate roughness Ra is from 0.10 to 0.15 µm for a minimum friction coefficient. In our study, samples with roughness outside the specified range have higher friction coefficient values than those falling within this range, which is consistent with the results of Gradt et al. For coatings deposited on bronze substrates, sample B1 (Ra 0.06) in the steady state has the friction coefficient 1.2–1.4 times higher than that of B2 and B3. For coatings on steel substrates, samples A2 (Ra 0.05), A4 (Ra 0.07), A6 (Ra 0.07), A7 (Ra 1.46), and A8 (Ra 2.32) show friction coefficient values higher than those of samples whose roughness falls within the 0.10–0.15 range.
3.4. Measurement Results of Coating Adhesion
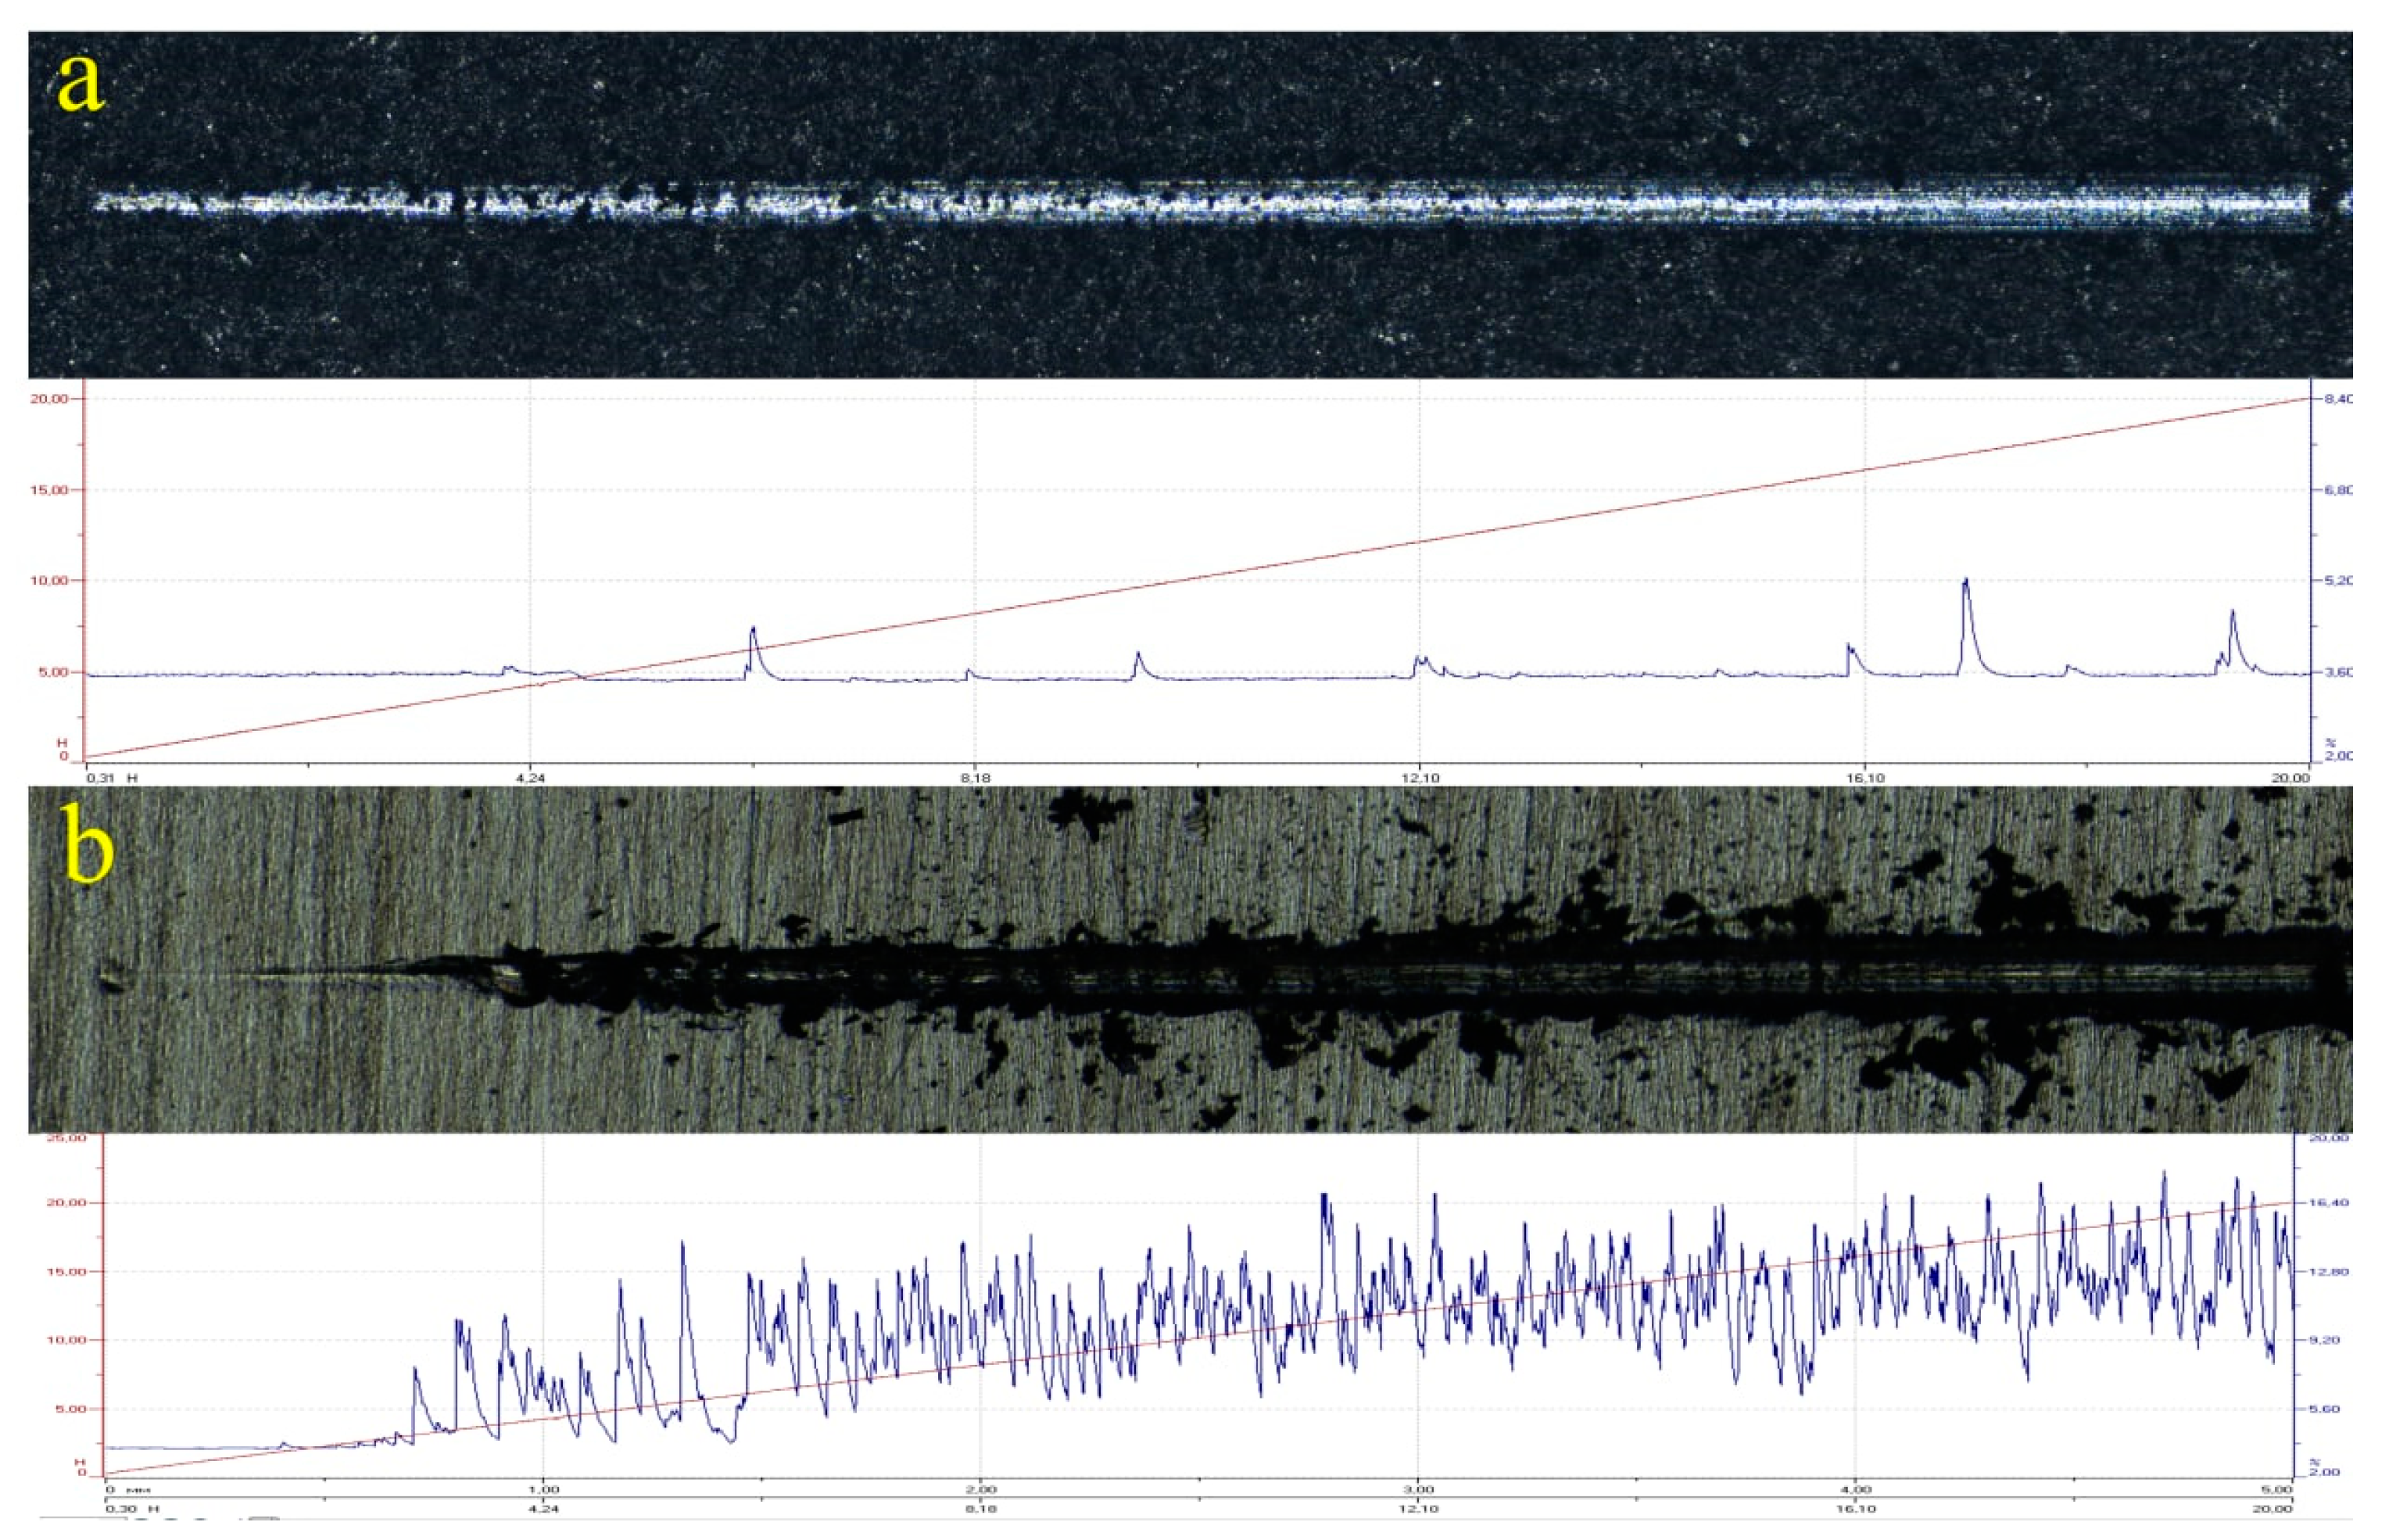
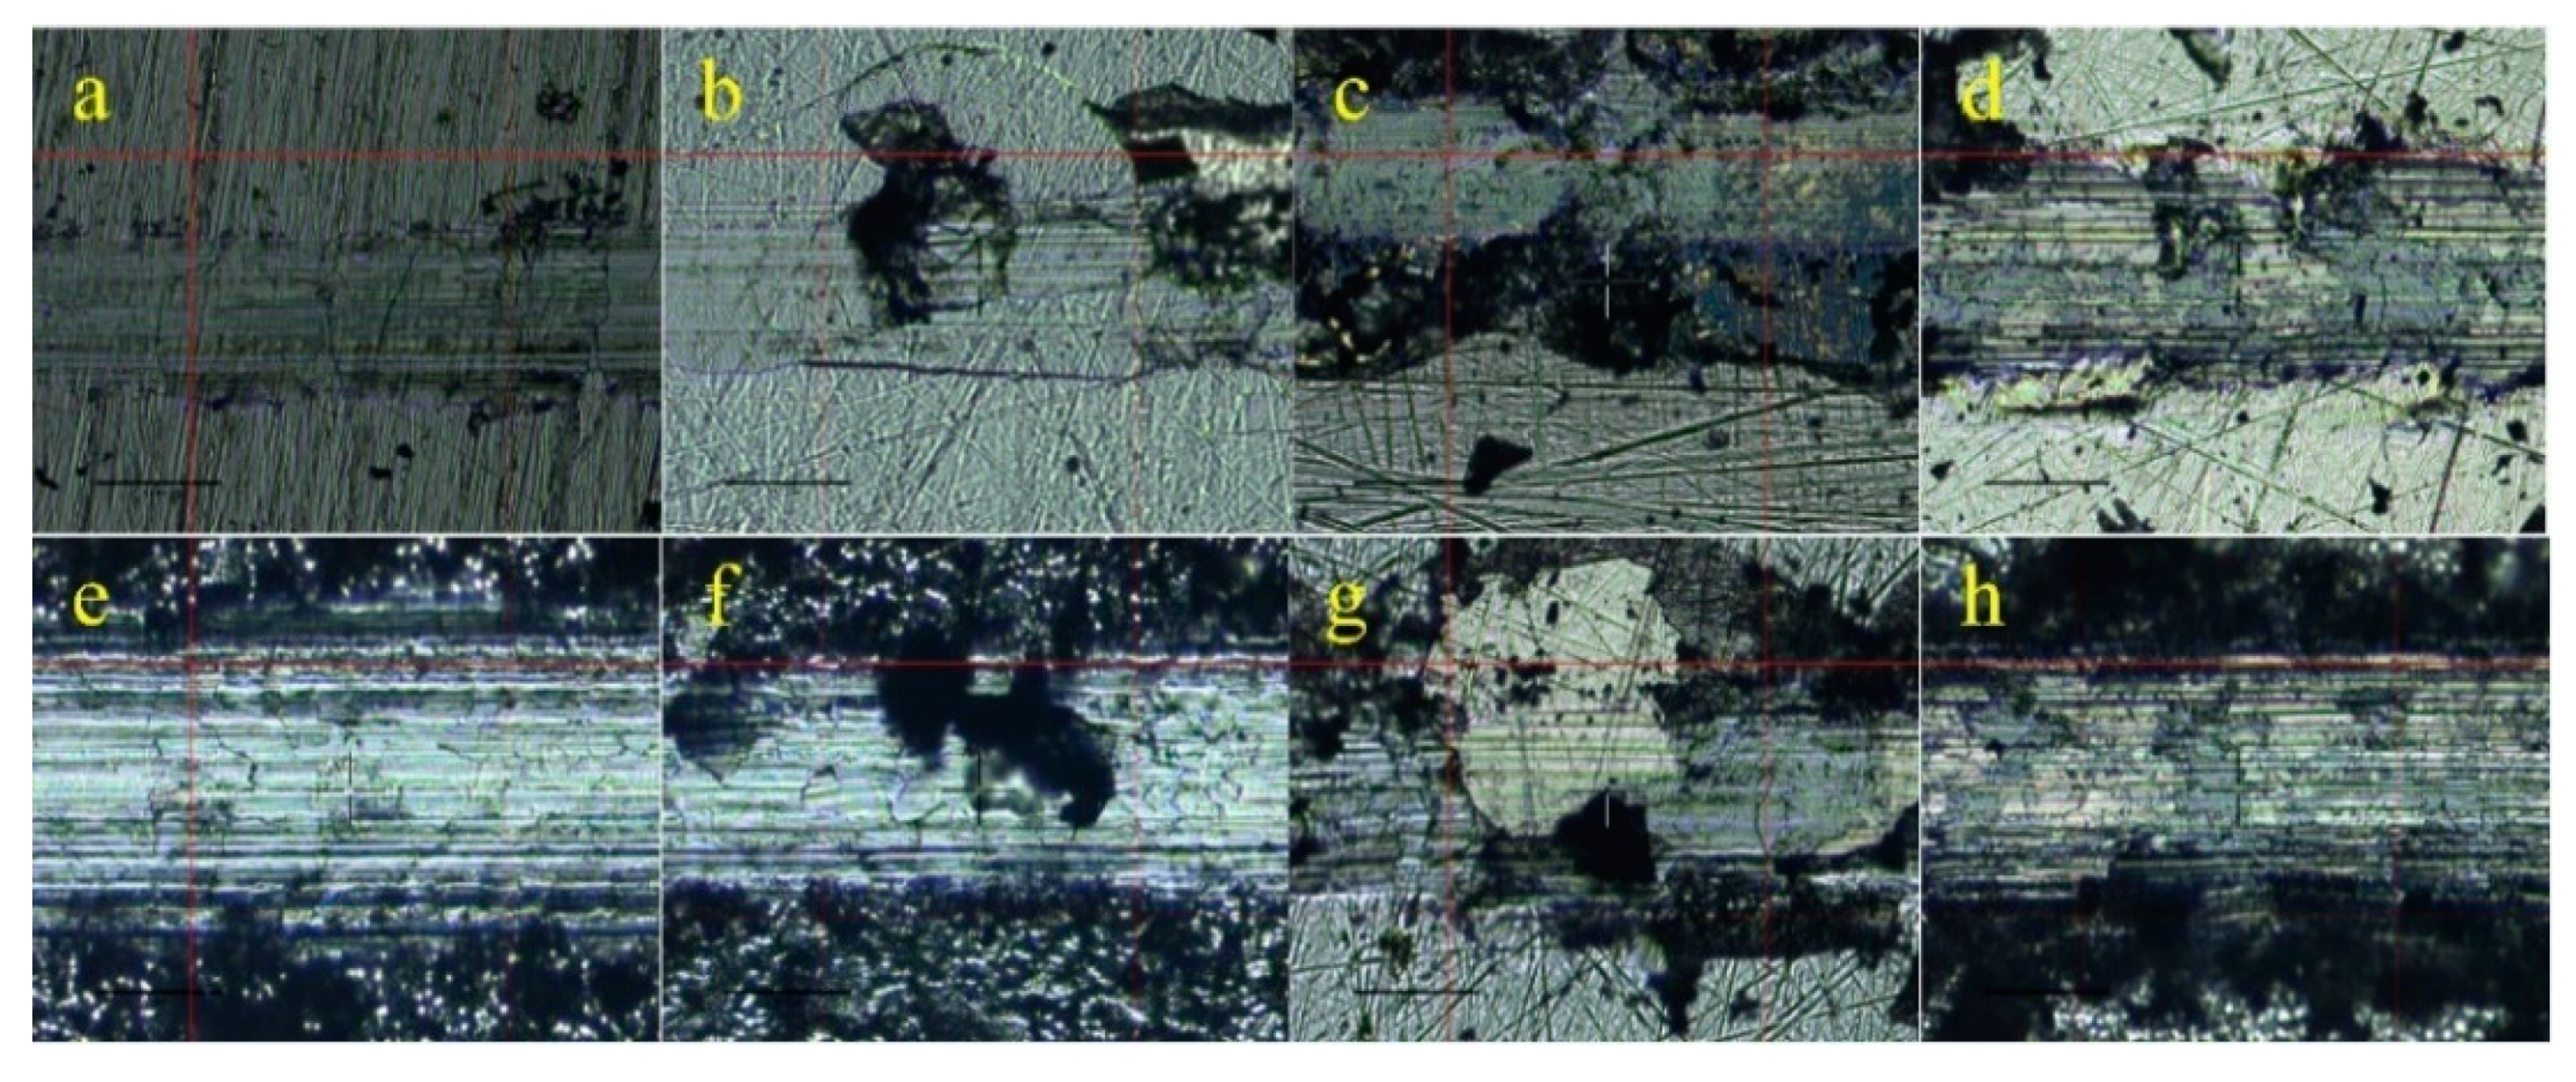
Typical images of the surface features corresponding to critical loads Fc1–3 in accordance with ENV 1071-3, 1994 BCR-692 standard, are shown in
Figure 9. The surface images were analyzed together with the measured dependences of acoustic emission on the load. Initially, small forward chevron cracks appear at the borders of the scratch track, which do not cause acoustic emission (
Figure 9a,e); this situation corresponds to the first critical load (Fc1). The forward chevron cracks at the borders of the scratch track, with local interfacial spallation or with gross interfacial spallation accompanied by a burst in the acoustic signal (
Figure 10b), which corresponds to the appearance of small detached or displaced elements of the coating on the track (
Figure 9b,f), determine the second critical load (Fc2). The third critical load (Fc3) is associated with gross interfacial shell-shaped spallation (
Figure 9c,g) and delamination of large clusters of the coating outside the track (
Figure 9d,h). A typical acoustic signal for destroyed coatings is shown in
Figure 10b. Images of tracks after the scratch test are shown in
Figure 11.
The results for the first critical load are presented in
Table 4. With an increase in the load applied to sample B1, the coating is partially peeled off in the region of the track; however, no delamination of clusters occurs. The coating does not fail completely. However. on sample B2, starting from 16 N (Fc3), the indenter comes in contact with the base material. Overall, on bronze samples, Fc3 (when the coating peels off in large clusters) is not reached. These results indicate a sufficiently high adhesive force that compensates for the longitudinal load in the surface plane. In this case, the width of characteristic fractures along the track is smaller for samples B2 and B3 that have greater roughness than sample B1. Among bronze samples, the poorest adhesion is observed for a coating applied at –20 V bias voltage. For the steel samples with the same roughness values, either there no differences are observed or the adhesion is lower for the coatings deposited in the +100 V mode. No clear dependence on the deposition regime was found.
The adhesive strength of steel samples substrate is 1.5–2 times lower in comparison with bronze substrate samples with the same roughness. For samples A1 and A3, three critical loads are observed, and the destruction begins with displacement of larger coating elements than on the other samples. The indenter penetrates through the coatings of samples A4 and A6 at load values of 10 and 18 N, respectively. Fc1 is reached on samples A2 and A5, and no characteristic failures that might correspond to Fc2 or Fc3 are observed. For the samples with high roughness (A7 and A8), the acoustic signal does not exceed 5% (
Figure 10a), which does not meet our criteria of reaching Fc1. Nevertheless, many exfoliated coating elements are clearly visible on the surface of A8 despite the low acoustic emission signal. The track width on a rough surface turns out to be smaller, which indicates that the adhesive force on a rough surface compensates for the longitudinal load. The sample coating lasts up to 20 N. Despite the bronze (B1) and steel (A4, A6) samples having similar roughness values, the destruction of the coating occurs at lower loads on steel samples. However, the long-term tests showed a shorter service lifetime for A7 (22.7 h) and a service lifetime of more than 42 h for A5, which had worse adhesion. This again confirms that the mechanisms of destruction during scratch testing and tribological tests are different. Accordingly, to prevent the sintering of parts, it is viable to deposit antifriction coatings on the surface with preliminary air-abrasive treatment. However, if we consider such coatings as solid lubricants, this combination is less suitable than MoS
2 deposition on the initially untreated surface.
Steel substrate coating samples treated with sanding paper with increasing roughness show an increase in adhesive strength. The fracture load of sample A4 with the initial surface after rolling is higher than that of A1 (Ra 0.08), yet lower than that of A3 (Ra 0.10).
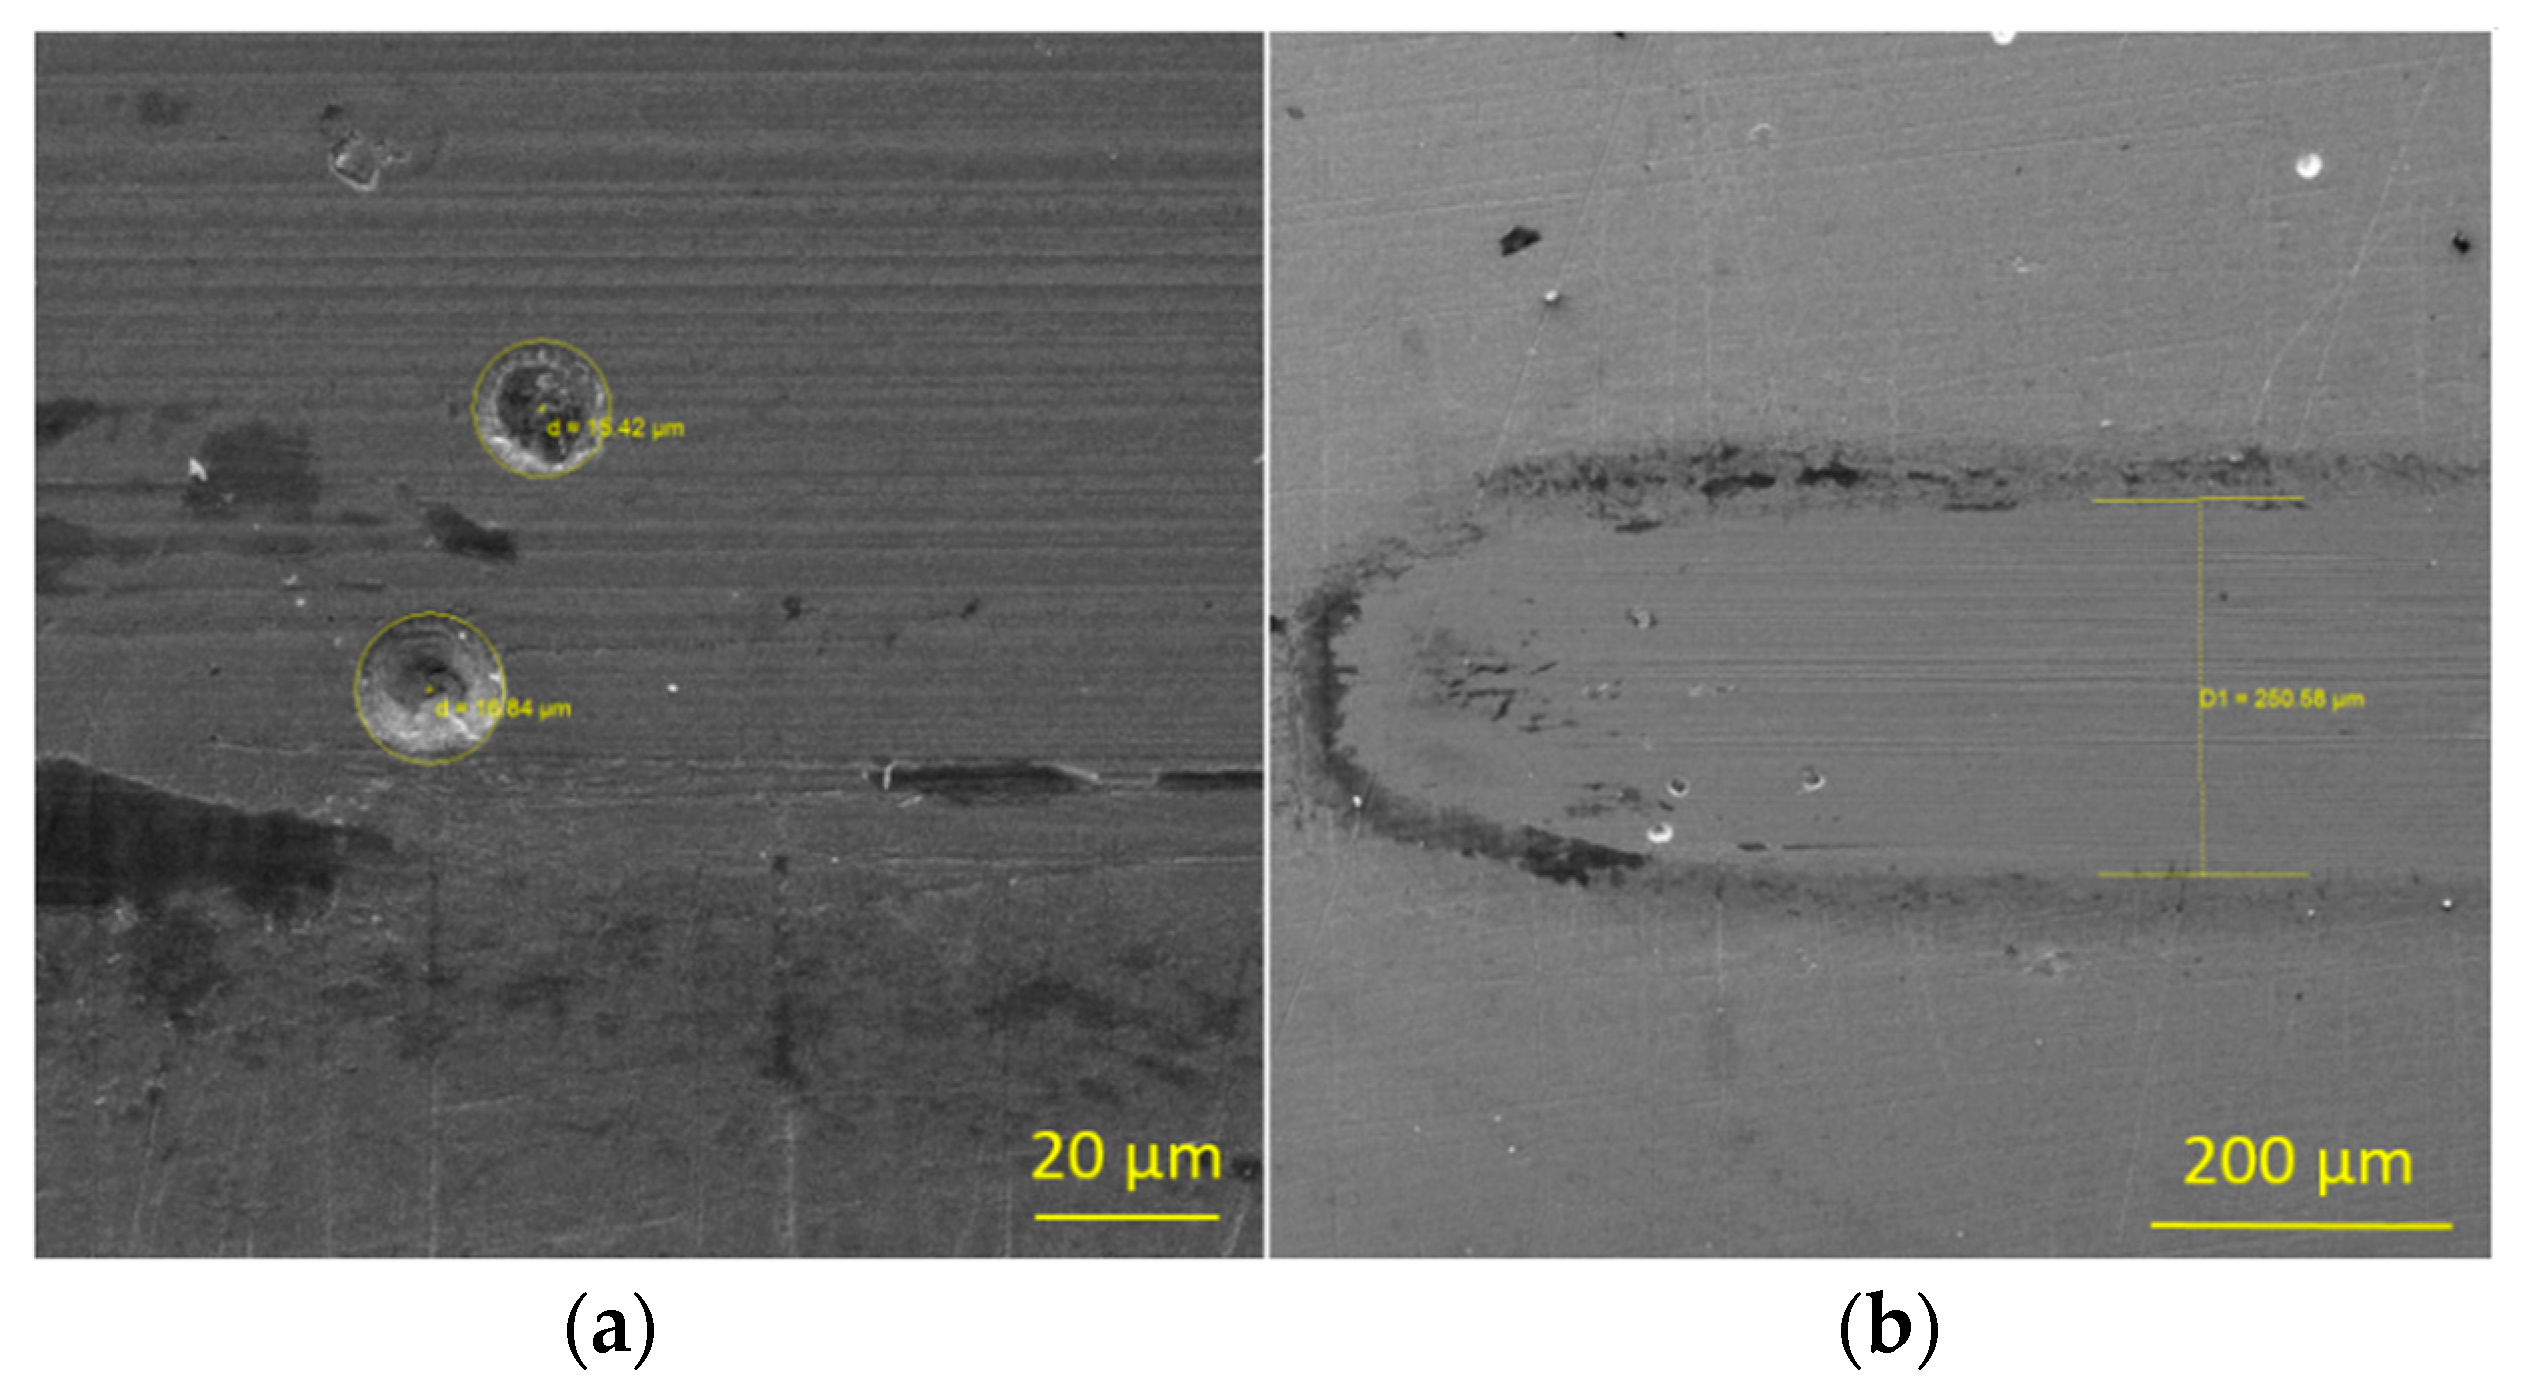
3.5. Wear Track Analysis
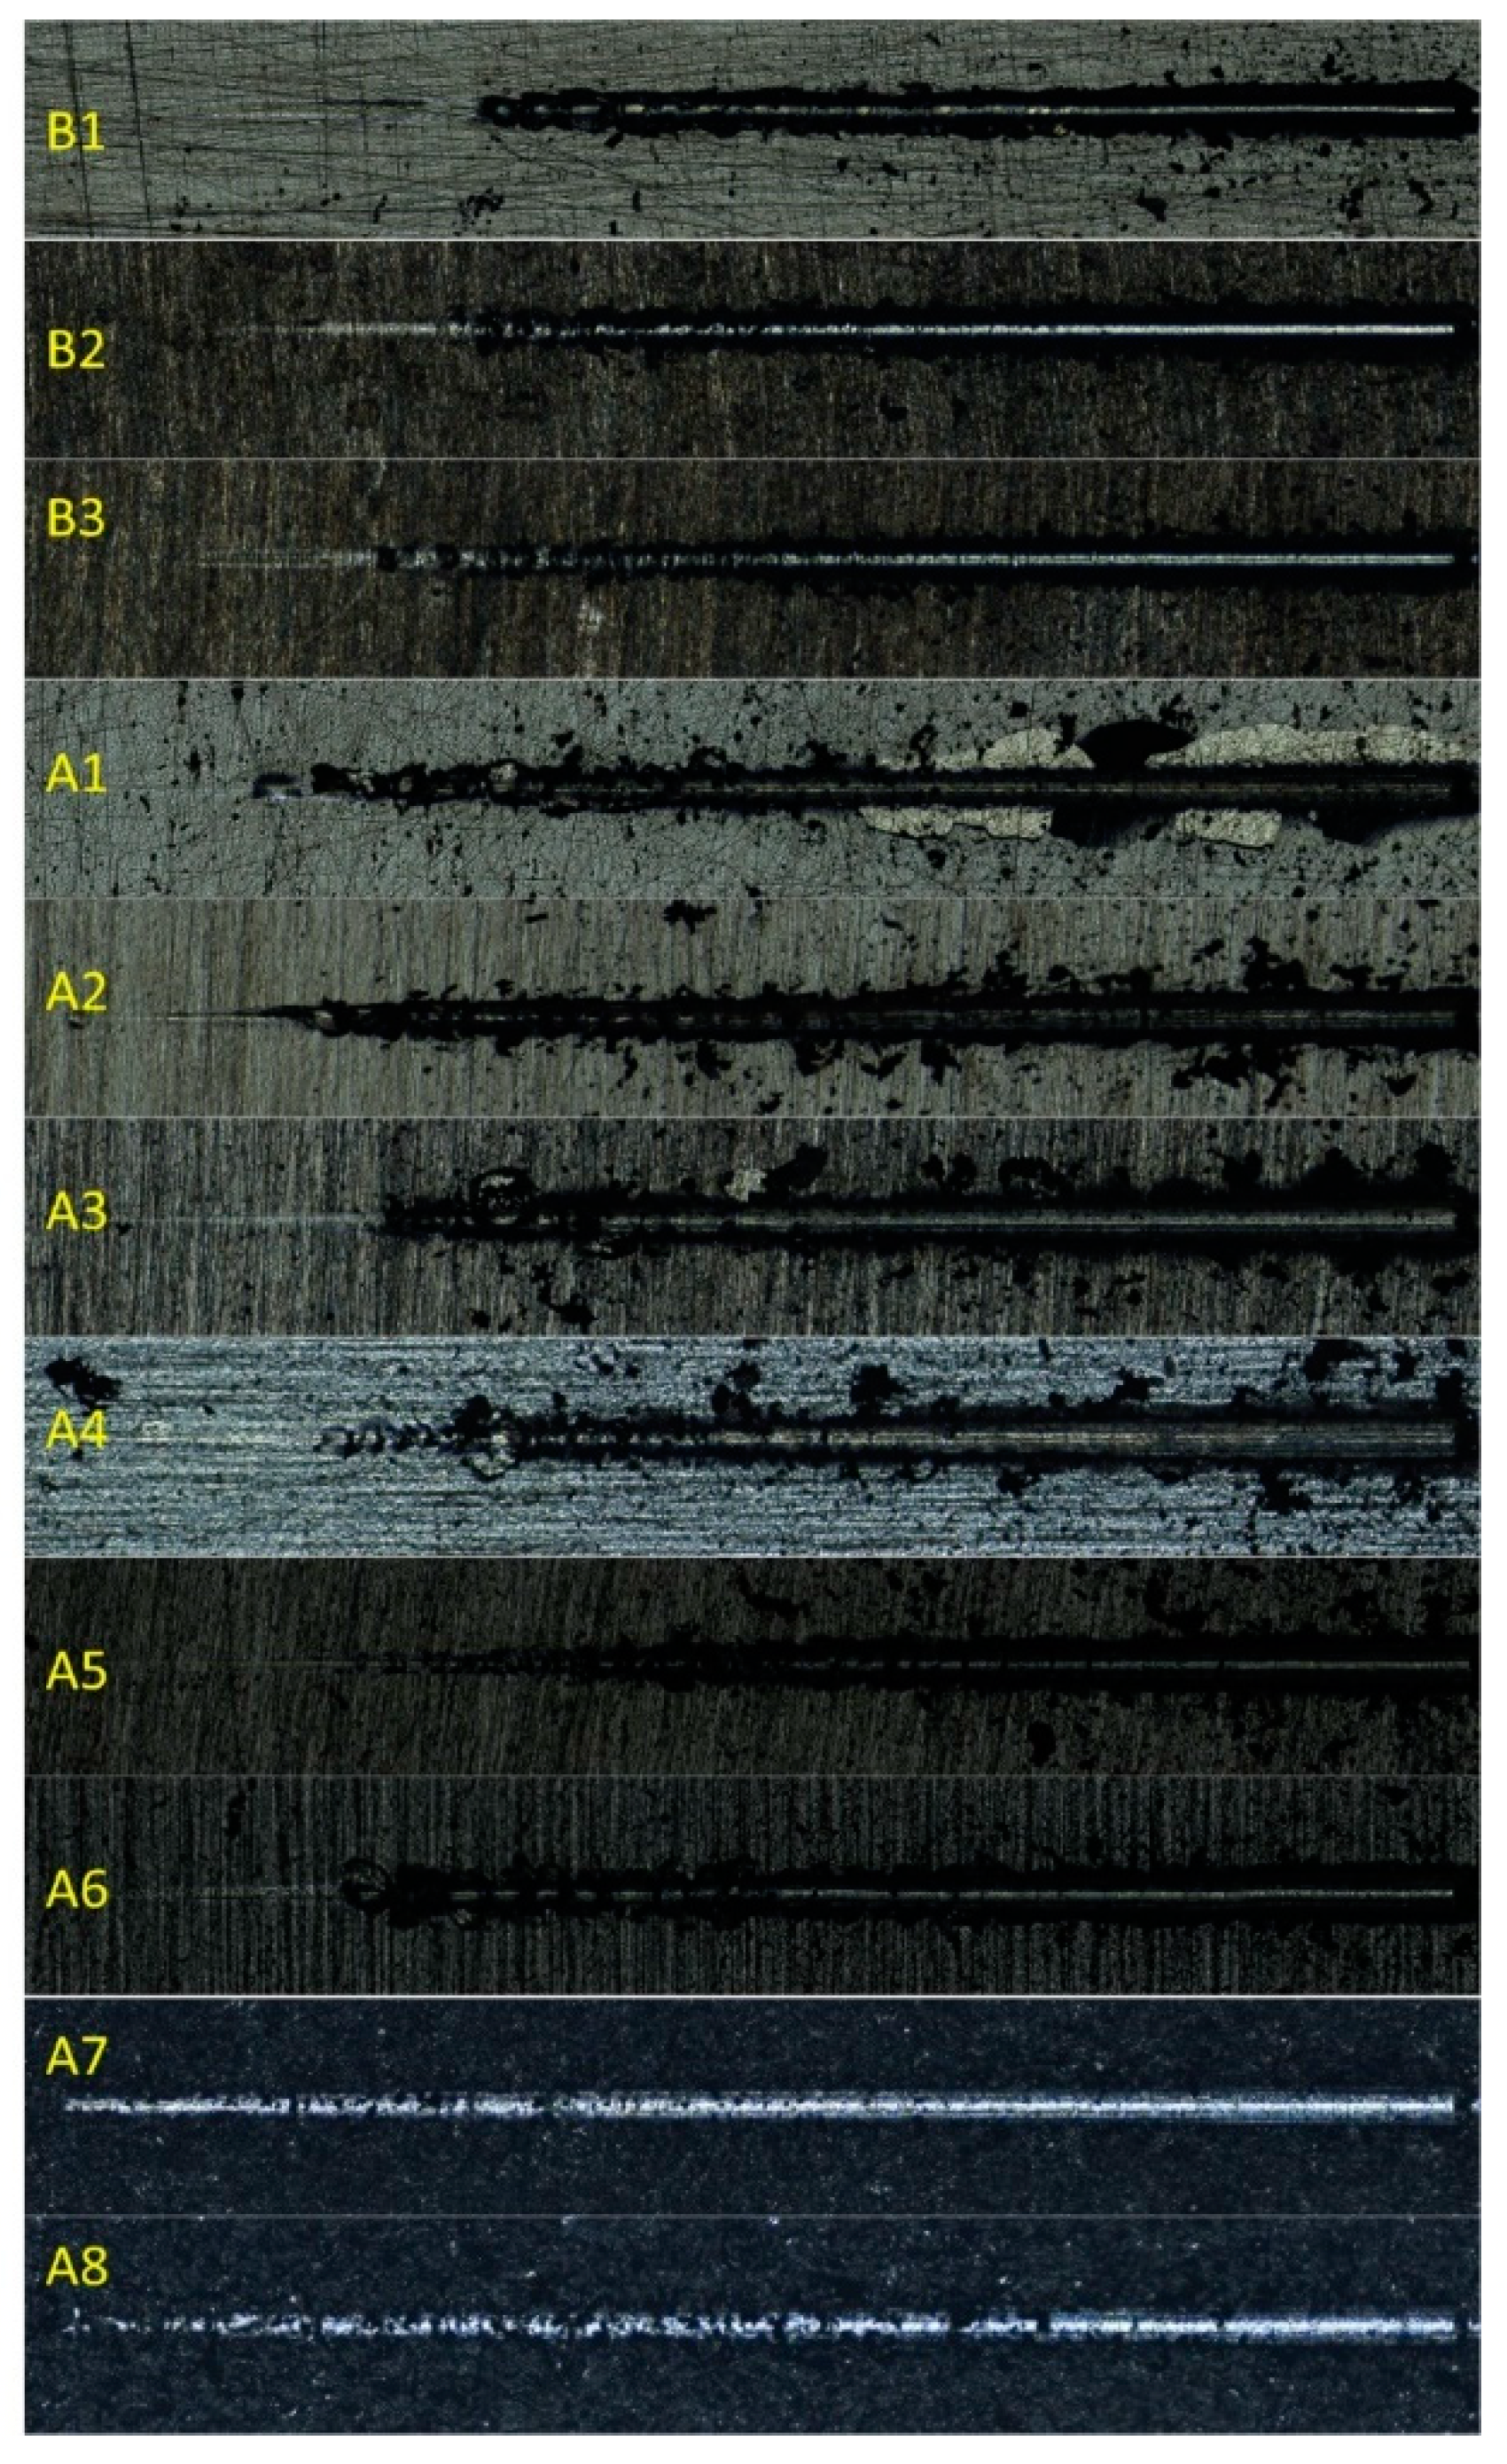
Typical images of coatings that have passed tribological tests are shown in
Figure 12 and
Figure 13. It can be seen that defects in the coatings do not trigger their destruction, at least in short-term tests. The original morphology pattern is absent in the track, and the observed lines are directed along the motion of the counter-body. The dispersed fraction of MoS
2 is accumulated along the track edges.
In service lifetime tests, the destruction of coatings B2 and A7 occurred sporadically along the tracks. In
Figure 13 one can notice the uncoated regions on the friction track. Typically, these areas contain particles in the form of MoS
2 powder with particle sizes ranging from 0.1 to 5 µm.
Chemical analysis of coatings (
Table 5) shows that all samples, except for A6–A8, have a S/Mo ratio of 1.68–1.74. Samples A6–A8 in their stoichiometric composition are close to the theoretical ratio for molybdenum disulfide. It is known [
4,
7] that coatings with a stoichiometric ratio of 1.5–1.6 have a lower friction coefficient in vacuum conditions. Sample A6 shows a high coefficient of friction (0.043) along with A7 and is second only to sample A8, the high friction of which is associated with increased surface roughness after sandblasting.
Oxygen content in the coatings deposited on bronze and steel increases after tribological tests. During the tests, the constituent elements of the coating are subject to oxidation. The sulfur-to-molybdenum ratio decreases as a result of water decomposition on the coating surface followed by the release of volatile H
2S molecules, which are eventually pumped out by vacuum pumps. An increase in oxygen content on the sample surface is associated with the occurrence of known chemical reactions with the formation of MoO
3 or MoO
2 [
7].
The friction coefficient of the steel deposited coating samples increases with an increase in the oxygen content. This is valid for all samples except A4, where we assume the influence of the surface preparation method.
The parameters of coating deposition considered and adjusted in this work do not affect the stoichiometric composition of the coatings; the change in the S/Mo ratio for individual samples is associated with the state of the target only. A new target was used for deposition on samples A6–A8.
During tribological tests, coatings accumulate oxygen by dissociation of water desorbed on the heated sample surface. At temperatures below 100 °C, moisture and water adsorbed on the surface affect the tribological properties and wear resistance of molybdenum disulfide coatings significantly. At temperatures above 100 °C and up to 300 °C, thermally activated oxidation processes prevail. Above 300 °C, accelerated degradation of molybdenum disulfide occurs, and at such temperatures, the solid lubricant coatings are not applicable [
7,
18].
Application conditions can affect the oxygen content of the coating [
5]. The presence of oxygen disrupts the layered structure of the material and increases the friction coefficient. However, the results are consistent with those obtained in [
7], where coatings with ideal stoichiometric structure (S/Mo ratio = 2) showed a higher friction coefficient than those with a sulfur-to-molybdenum ratio of 1.6.
Steel substrates deposited coatings samples demonstrate an increase in the friction coefficient with increasing oxygen content. The highest value was measured for sample A6 (0.043) with an oxygen content in the coating of 3.87%, and the lowest one (0.022) was measured for sample A5 with the lowest oxygen content (1.67%). Sample A4 (2.0% O) shows a friction coefficient (0.035) higher than that of sample A2 (0.034) with an oxygen content of 2.59%; however, we attribute this to the influence of the initial surface treatment method.
The saturation of the worn surface with oxygen was confirmed by measuring the chemical composition of the coating samples after testing. The adsorption of oxygen on the surface of the molybdenum disulfide coating is thermodynamically valid, and oxygen atoms fill sulfur vacancies in the coating [
21].
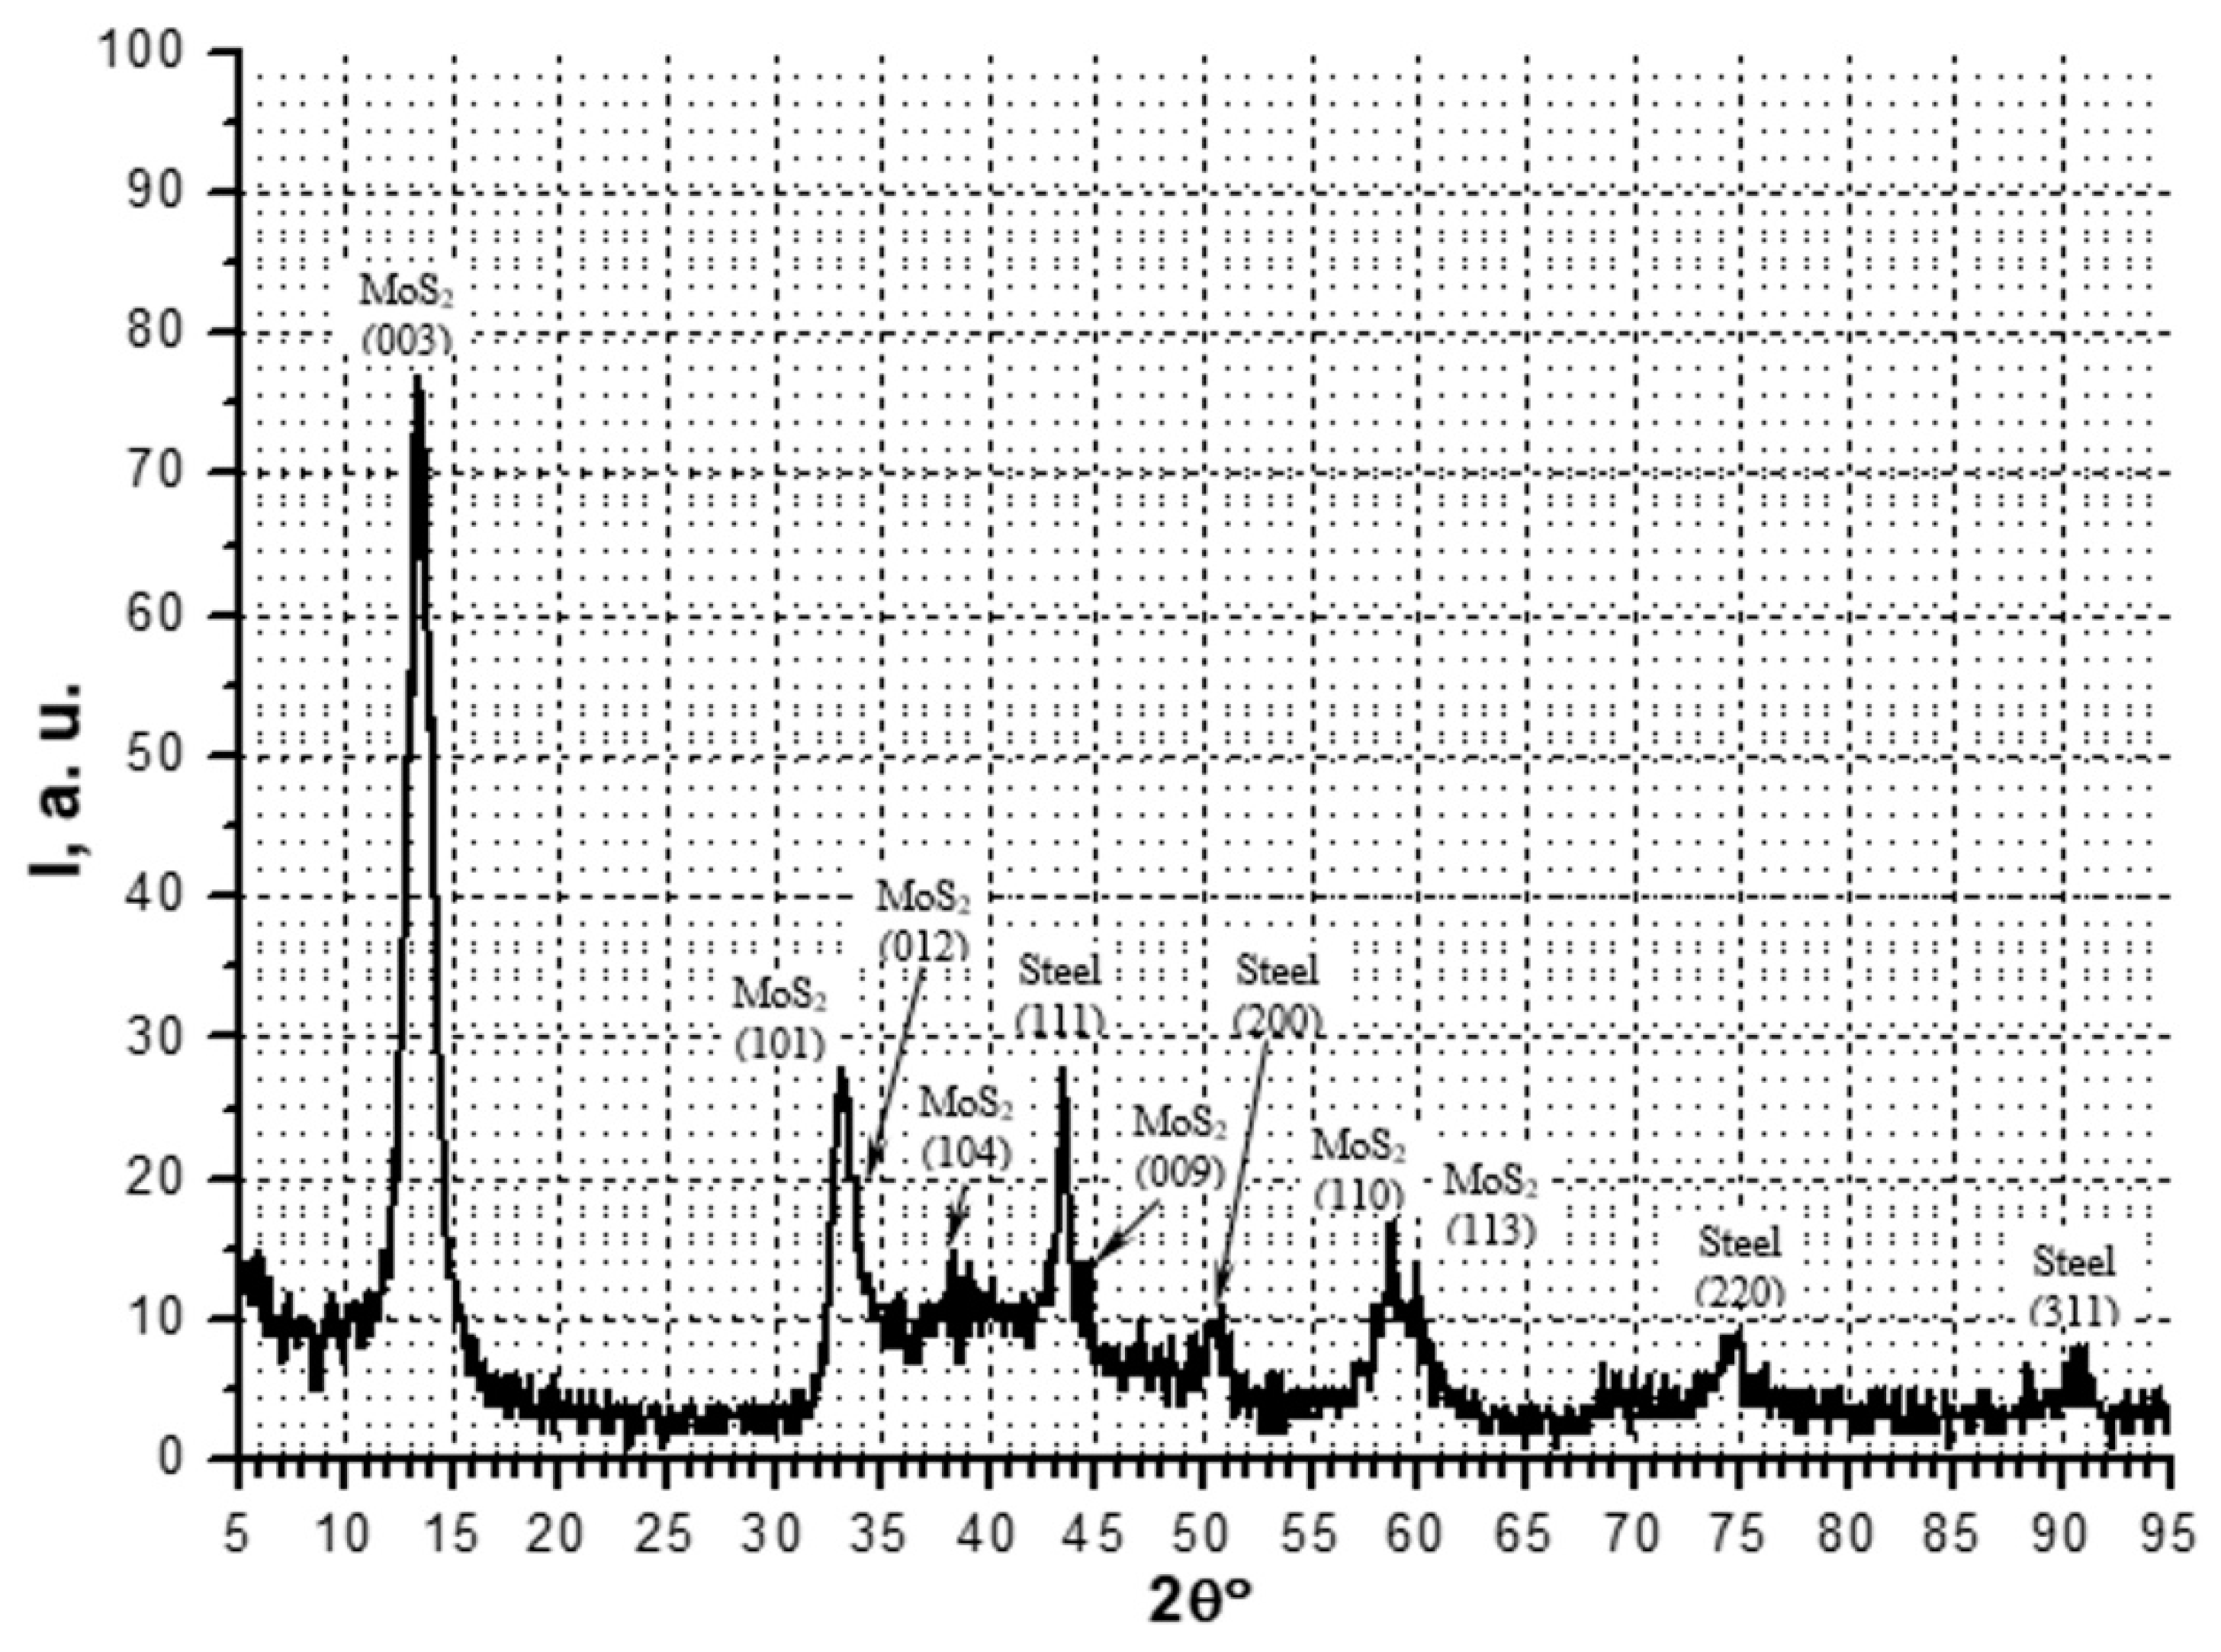
3.6. XRD Results
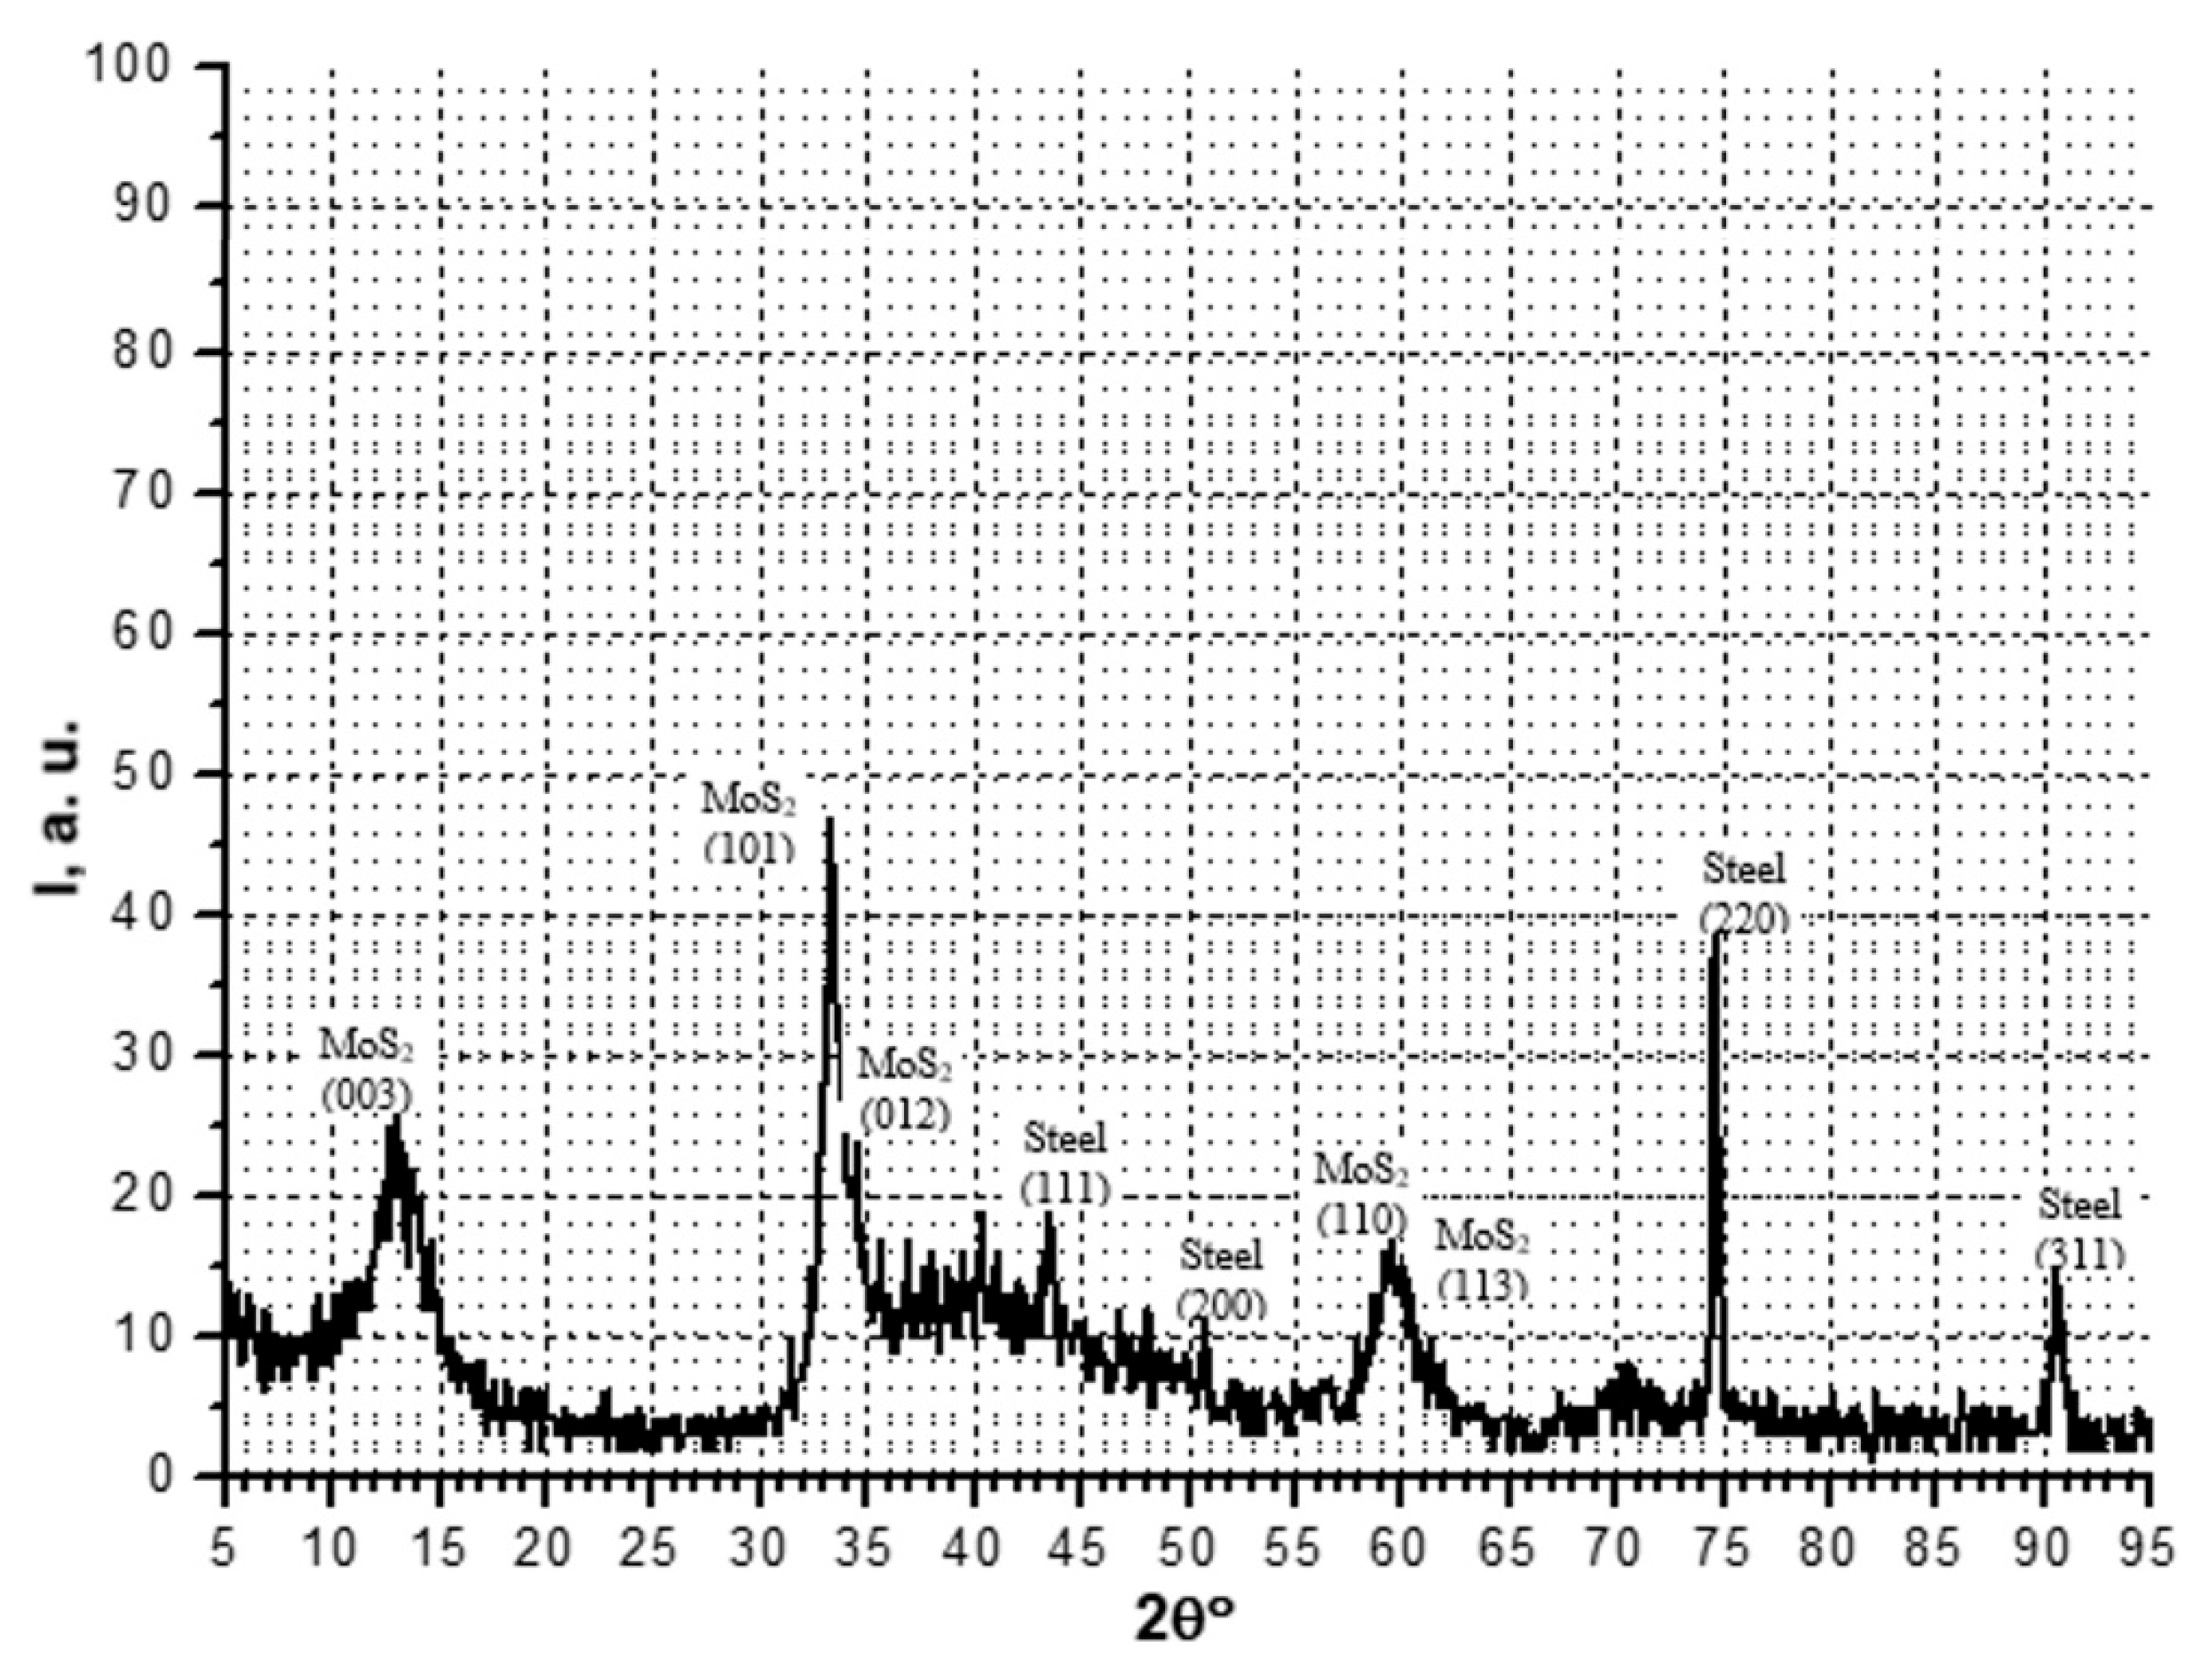
X-ray phase analysis shows the content of various phases in the coating. Diffraction patterns of samples A6 and A8 are shown in
Figure 14 and
Figure 15. The signal (intensity) received from the diffractometer, depending on the angle of rotation of the detector (2θ), is shown in black. The peaks corresponding to the sample substrate material are marked in red, and those corresponding to molybdenum disulfide MoS
2 are marked in green.
Due to relatively small coating thickness, the XRD spectra of the films contain signals of the substrate elements as well. In all coatings, the nonzero contents of the phases of the substrate material and molybdenum disulfide were observed, as were various combinations of the phases of sulfur and molybdenum compounds from the Mo–S system and intermetallic alloys (complex compounds) from the Fe–Mo–S system. Dependence of the contents of specific phases on the deposition modes, coating thickness, or surface preparation or the influence of these factors on tribological or adhesive properties was not detected. Supposedly, the phase composition of the coating depends on the state of the target during deposition or on other process parameters that were not considered in this study.
Analysis of the diffractograms of the samples presented in
Table 6 shows that all samples are characterized by the presence of peaks of radiation intensity at a detector angle of 12°; peaks on diffractograms have different intensities and reflect the content of the molybdenum disulfide compound phases. At angles 44°, 51°, 75°, and 90°, the peaks are characteristic of the substrate material and are observed for all samples. Samples A5, A7, and A8 exhibit peaks at the detector rotation angles of 33° and 60°; these coatings contain phases that were not observed in other samples. All samples are characterized by a wide zone with a high radiation intensity in the range of angles 30°–50°. For samples A7 and A8, two peaks from this zone are noticeable at 33° and 44°, and the zone between them has lower radiation intensity. Wide areas of increased radiation indicate the presence of an amorphous phase. The crystallinity of samples A7 and A8 is higher.
The XRD results (
Table 7) show that samples A7 and A8 have a 2 times larger coherent scattering region. This indicates their greater crystallinity. Samples with the highest friction coefficient (A4, A6, A7, and A8) are distinguished by a smaller value of the interplanar spacing
d(003) in comparison with other samples. No dependence of the interplanar distance on the deposition mode is observed. We assume that with a decrease in the interplanar distance, the bonds of molybdenum disulfide molecules become stronger, and the shift of atomic planes is therefore hampered, which in the end causes an increase in the friction coefficient. However, we do not observe a direct correlation between the interplanar distance and the value of the friction coefficient.
XRD of the coatings shows that the treatment of the substrate surface affects the growth of molybdenum disulfide crystals. Sandblasted samples with steel base A7 and A8 contain more crystalline phases. Sandblasting hardens the surface layer and promotes the growth of crystals of the molybdenum disulfide coating. As shown in
Table 7, the size of the coherent scattering region of molybdenum disulfide on samples A7 and A8 after sandblasting reaches 60 Å, while the remaining samples do not exceed 35 Å.
4. Conclusions
Tribological tests of antifriction coatings based on molybdenum disulfide, intended for operation in a vacuum (at a pressure of less than 10−6 Pa) at elevated temperatures (250 °C) were conducted in accordance with the ASTM G133 standard.
Magnetron deposition modes that differ in bias voltage (−20 or +100 V), with all other parameters fixed, do not affect the mechanical properties and structure of the AFCs. This means that in order to increase the efficiency of the magnetron sputtering system, it is feasible to utilize modes with a positive bias voltage, in which an increase in the deposition rate is observed.
As the surface roughness increases, the adhesion strength of the coatings improves. However, as shown by the service lifetime tests, the adhesion strength does not determine the service lifetime of the coating.
During long-term service lifetime tests, the average friction coefficient for all samples is higher than that during the short-term tests, in which we determined the value of the friction coefficient. During the operation of the coating, fluctuations in the friction coefficient occur, which can be as high as twice the average value.
Long-term service lifetime tests demonstrate the performance of molybdenum disulfide coatings under specific operating conditions and give a correct estimation of the friction coefficient value over the entire period of operation.
The tribological properties and service lifetime of molybdenum disulfide coatings depend on many factors associated with the surface preparation method prior to coating deposition, with the mode of deposition process itself, and with the operating conditions. In order to assess the performance of MoS2 film deposition method, coatings must be subjected to service lifetime tests. Based on the results of such tests, it is possible to draw a conclusion about the operating time of the coatings, the conditions affecting their lifetime, and the dynamics of the friction coefficient as well.
Degradation of MoS2 coatings is associated with oxidation that leads to elevation of the friction coefficient. During service lifetime tests, the coating with the highest oxygen content was destroyed.


 ,
, 


