Article

Research and Experimental Application of New Slurry Proportioning for Slag Improvement of EPB Shield Crossing Sand and Gravel Layer

1
College of Water Resources & Civil Engineering, China Agricultural University, Beijing 100083, China
2
Zhongbing Survey and Design Research Institute Co., Ltd., Beijing 100053, China
*
Author to whom correspondence should be addressed.
Coatings 2022, 12(12), 1961; https://doi.org/10.3390/coatings12121961
Submission received: 4 November 2022 / Revised: 9 December 2022 / Accepted: 10 December 2022 / Published: 14 December 2022
(This article belongs to the Special Issue Current Research in Cement and Building Materials)

Abstract

:
Based on the construction practice of the Beijing Metro Line 10 shield tunneling project, this paper describes research on soil improvement technology for Beijing stratum characteristics (sandy gravel stratum) and covers similar engineering conditions. It also describes the development of a new type of mud improver. Based on the laboratory tests with bentonite as the base mud and different additives, the effects of guar gum, CMC, xanthan gum, and clay medium particles on mud performance are analyzed. Then, two kinds of mud were used to conduct indoor simulated muck improvement tests (mixing test, slump test, sliding plate test, and adhesion resistance test), and the improvement effects of new mud and ordinary mud applied in pebble/round gravel and sandy soil layers were compared. The results show that xanthan gum is the best material to improve the performance of slurry, using the contrast test of bentonite-based slurry and different additives. The optimum slurry preparation scheme is 4% bentonite, 0.2% xanthan gum, 0.04% soda ash, and 1% clay particles. Using indoor simulated muck improvement tests (mixing test, slump test, slide plate test, and adhesion resistance test), the improvement effects of applying new mud and ordinary mud in pebble/round gravel and sandy soil layers are compared, and the advantages of the new mud in the application of the above two formations are verified. Among them, the new slurry has great advantages for improving the two parameters of the soil adhesion resistance coefficient and slump during shield tunneling. When the improved soil mass reaches the flowing plastic state, the proportion of new mud added to different soil mass is different. The proportion of new mud added to improved pebble/pebble soil is 28%, and that of sand and clay is 32%. It can be seen that new mud is more suitable for improving pebble/pebble soil.

1. Introduction

With the rapid development of urban rail transit construction, subway shield construction has been widely used with its unique advantages [1]. The EPB shield tunneling in Beijing is often carried out in sandy gravel soil [2,3,4], and the excavated soil mass in the natural state cannot meet the requirements of plastic fluidization of soil mass [5,6,7]. Therefore, this can easily lead to the instability of the excavation surface [8,9,10,11,12], and cause the closure of the pressure chamber [13,14,15], the caking of the pressure chamber [16], gushing [17,18], and other technical problems often encountered in the construction of soil layers. To ensure the normal operation of shield tunneling, the soil must have good plasticity [19,20] and low permeability [21,22,23].
As one of the key technologies of EPB shield, muck improvement technology has been paid more and more attention in current shield research [13,24,25]. At present, the improvement additives mainly include foam agents, dispersant, clay minerals and flocculant. The clay minerals are predominantly bentonite and clay [26,27], which are mainly used to supplement the fine particles in order to reduce the internal friction angle of the soil mass in the pressure chamber [28]. Foam agent is composed of special foam agent and compressed air, which can be used to improve the fluidity [29,30] and impermeability [31,32] of the excavated soil mass. Flocculant is mainly applicable to water-rich consolidated clay, silt, sand and fine gravel formation, which can cause particles to agglomerate in the slag to improve the plastic flow behavior of the slag [33,34]. Dispersants can disperse substances in the water to form colloidal solutions, reducing the adhesion between particles [35,36]. At present, different scholars have conducted a great deal of research on the improvement effect of the selection and proportion of these soil improvers on the EPB shield construction, and these improvement evaluations are mostly seen in indoor tests.
Relying on a tunnel project in Fuzhou, Wang, S.M [37] carried out a study on the construction of an earth pressure shield machine in high permeability and high-pressure formation by using nano bentonite CMC as the muck improver, and they evaluated the effect of this soil improver through field tests. Zhu H. H and others [38,39,40,41] evaluated the stability of the earth pressure shield in the sandy gravel stratum by establishing the DEM model, and proposed measures to improve the fluidity and wear resistance. Zhao S. S. [36] discussed the effect of adding dispersant in mud on controlling clay cake, and verified the effectiveness of the dispersant in reducing viscosity through laboratory tests. Cheng Chihao and others [42,43] carried out laboratory soil improvement test research on the micro mechanism of soil improvement with different proportioning of foam and bentonite in the EPB shield construction, and evaluated the improvement effect of different schemes in combination with field tests. Jiang Houting and others [44,45,46] conducted relevant tests on foam improving round gravel formation during EPB shield construction and obtained the experimental law of foam’s impact on plastic fluidity of round gravel formation and the optimal foam injection ratio suitable for EPB shield construction. Xiao Chao [47] studied the influence of modified bentonite grouting on the shield driving in the sand gravel layer by simulating the earth pressure balance shield system, and obtained the mixed proportion of modified bentonite slurry for the earth pressure shield driving in the sand gravel layer. Xu Q. W and others [48,49,50,51] injected different amounts of air bubbles into the soil with different water content to reflect the effect of air bubble mixed soil on torque reduction through the reduction rate of power consumption of the mixer. The results show that adding air bubbles to sandy pebble soil can reduce the power consumption of mixing by more than 50%.
In combination with the current research on the improvement of EPB shield tunneling, there is a lack of systematic theoretical evaluation standards and methods for the basic properties of the improver, the matching relationship between the improver and the improved soil, the improvement effect of the improver, and the relationship between the improver and the shield construction parameters, which leads to the blindness of the use of the improver in shield tunneling, and may cause problems such as large material consumption and environmental pollution. Therefore, based on the construction practice of Beijing Metro Line 10 shield tunneling project, this paper conducts research on soil improvement technology for Beijing stratum characteristics (sandy gravel stratum) and covers similar engineering conditions, as well as developing a new type of mud improver. Based on the laboratory tests with bentonite as the base mud and different additives, the effects of guar gum, CMC, xanthan gum, and clay medium particles on the mud performance are analyzed, and a new mud performance improvement material with the best performance is obtained. Then, two kinds of mud were used to conduct indoor simulated muck improvement tests (mixing test, slump test, sliding plate test, and adhesion resistance test), and the improvement effects of new mud and ordinary mud applied in pebble/round gravel and sandy soil layers were compared.

2. Study on Properties of New Mud Modifier

The soil state control in the pressure chamber is the key to EPB shield construction. The soil state in the pressure chamber is different in different strata. When most undisturbed soil enters the pressure chamber, it will cause construction difficulties, which are manifested in the increased torque of the cutterhead, the dumping efficiency of the screw conveyor, and the thrust of the shielding jack, which will lead to “blocking”, “gushing”, “caking” and other construction problems, and even lead to the instability of the excavation surface. To solve these problems, the ideal state of the soil mass in the pressure chamber, namely the “plastic flow state”, is proposed. Its physical and mechanical indexes include the permeability coefficient, internal friction angle, slump, and compression coefficient. To effectively solve these problems in construction, it is necessary to add additives to the soil for soil improvement.

2.1. Site Mud Solution

The stability of the earth pressure balance shield excavation surface is achieved by the pressure of the sealed cabin. When the mud penetrates the soil, a layer of mud film with very low permeability is formed, and the mud pressure effectively acts on the excavation surface through the mud film, so it can prevent the deformation and collapse of the excavation surface and ensure the stability of the excavation surface. One of the key issues in earth pressure shield construction is to use of a muck modifier suitable for engineering geological conditions.
To compare the development of the mud, the mud configuration scheme adopted in the construction site was studied first. The mud used on the construction site is pure bentonite mud with a bentonite content of 9%, that is, 90~120 Kg of bentonite is added to one side of the water, and the performance parameters are shown in Table 1:
It can be seen from the above parameters that the mud of this formula has a high consistency and does not flow easily. After standing, it is even more difficult for the mud in the test tube to flow out. Therefore, the comprehensive performance of the mud should be improved by adding other additives. At the same time, the cost can be reduced by reducing the amount of bentonite.

2.2. New Mud Solution

In this paper, a new type of soil amendment that combines mineral improvement materials and water-soluble polymer improvement materials is developed. Bentonite is the main raw material of mineral modifiers, and the mineral material used in the test is the red sodium bentonite produced by the Shamaying Sodium Clay Factory in Weifang City, Shandong Province, which is used in the construction site. The solution is prepared as follows: add water to the container, stir with a mixer at medium speed, and at the same time add the sodium bentonite and other materials evenly into the container and stir. If the solution is thick, stop the mixer every few minutes. Stir the bentonite attached to the bottom layer with your hands or with sticks to speed up the dissolution, then stir at medium speed for about ten minutes.
On the one hand, if only bentonite is used to prepare slurry, the amount of bentonite is large, which leads to high slurry cost. On the other hand, the performance of the slurry is difficult to guarantee, which cannot meet the requirements for slag improvement in the EPB shield. It is therefore necessary to optimize the mud performance by adding appropriate additives. Common additives mainly include: 1. tackifier: guar gum, sodium carboxymethyl cellulose (CMC), xanthan gum, polyacrylamide; 2. lubricant; 3. PH value regulator, mainly sodium carbonate; 4. other additives such as clay particles.
Soda ash has greatly improved the performance of mud. Therefore, a proper amount of soda ash is added to the subsequent formula to improve the PH value of mud. According to the mud configuration plan of the construction site, the bentonite dosage is 9%, but the thickness is too high and the viscosity is not high. The topic of this lesson is to reduce the bentonite dosage to reduce the cost and improve the mud performance to adapt to the earth pressure balance shield. Therefore, the bentonite dosage is preliminarily determined to be 3%~5%.
In this paper, four additives will be added to evaluate the mud improvement effect, and the research scheme of the mud improvement test with different additives is shown in Table 2.
Where AV represents apparent viscosity, PV represents plastic viscosity, YP represents dynamic shear, Gelin represents initial shear, Gel10 represents final shear, FL represents filtration, K represents consistency index, n represents fluidity coefficient, and YP/PV represents a dynamic plastic ratio.
See Table 3 for data of mud properties with different additives.
It can be seen from Table 3 that the overall viscosity of the slurry added with guar gum is low, and the colloid rate is about 80%, indicating that there is more water precipitation. After adding CMC, the mud performance is obviously improved, the viscosity is improved, and the filtration is within 20 mL/30 min, meeting the requirements of filtration. The colloid rate is also greatly improved. During the preparation of the three schemes F10-F12, a large number of insoluble matters were precipitated, most of which were white blocky colloids. During the API filtration test, the liquid continued to flow downwards, with a filtration loss of about 45 mL/30 min, which seriously exceeded the requirements. Therefore, the application of polyacrylamide in mud was extremely insoluble, and the viscosity increasing effect of the mud was not ideal, so it was abandoned in future tests.

2.3. Comparative Study on Mud Performance after Adding Different Additives

2.3.1. Viscosity Contrast

The plastic viscosity is the total reflection of the internal friction between solid particles, between solid particles and liquid phases, and between liquid molecules when the slurry flows. Apparent viscosity refers to the ratio of shear stress to the shear rate at a certain shear rate, which is the sum of plastic viscosity and structural viscosity.
The viscosity comparison of different mud schemes is shown in Figure 1.
It can be seen in Figure 1 above that the apparent viscosity of all schemes is higher than F0 except that the F1 and F4 schemes are lower than F0 of mud for a construction site. According to the requirements for the sand gravel layer of Beijing Metro Line 10, the slurry viscosity is high and favorable, so F1 and F4 schemes were abandoned. In the scheme of adding guar gum, CMC and xanthan gum, the formula with a bentonite dosage of 5% has the highest apparent viscosity value of mud, among which F9 is the highest, indicating that xanthan gum is superior to guar gum and CMC for improving the apparent viscosity of mud. In terms of plastic viscosity, the plastic viscosity of mud can be improved by adding a viscosity increaser, and the rule is roughly the same as the apparent viscosity. In comprehensive consideration, xanthan gum is higher than guar gum and CMC in improving mud viscosity.

2.3.2. Dynamic Shear Force Comparison

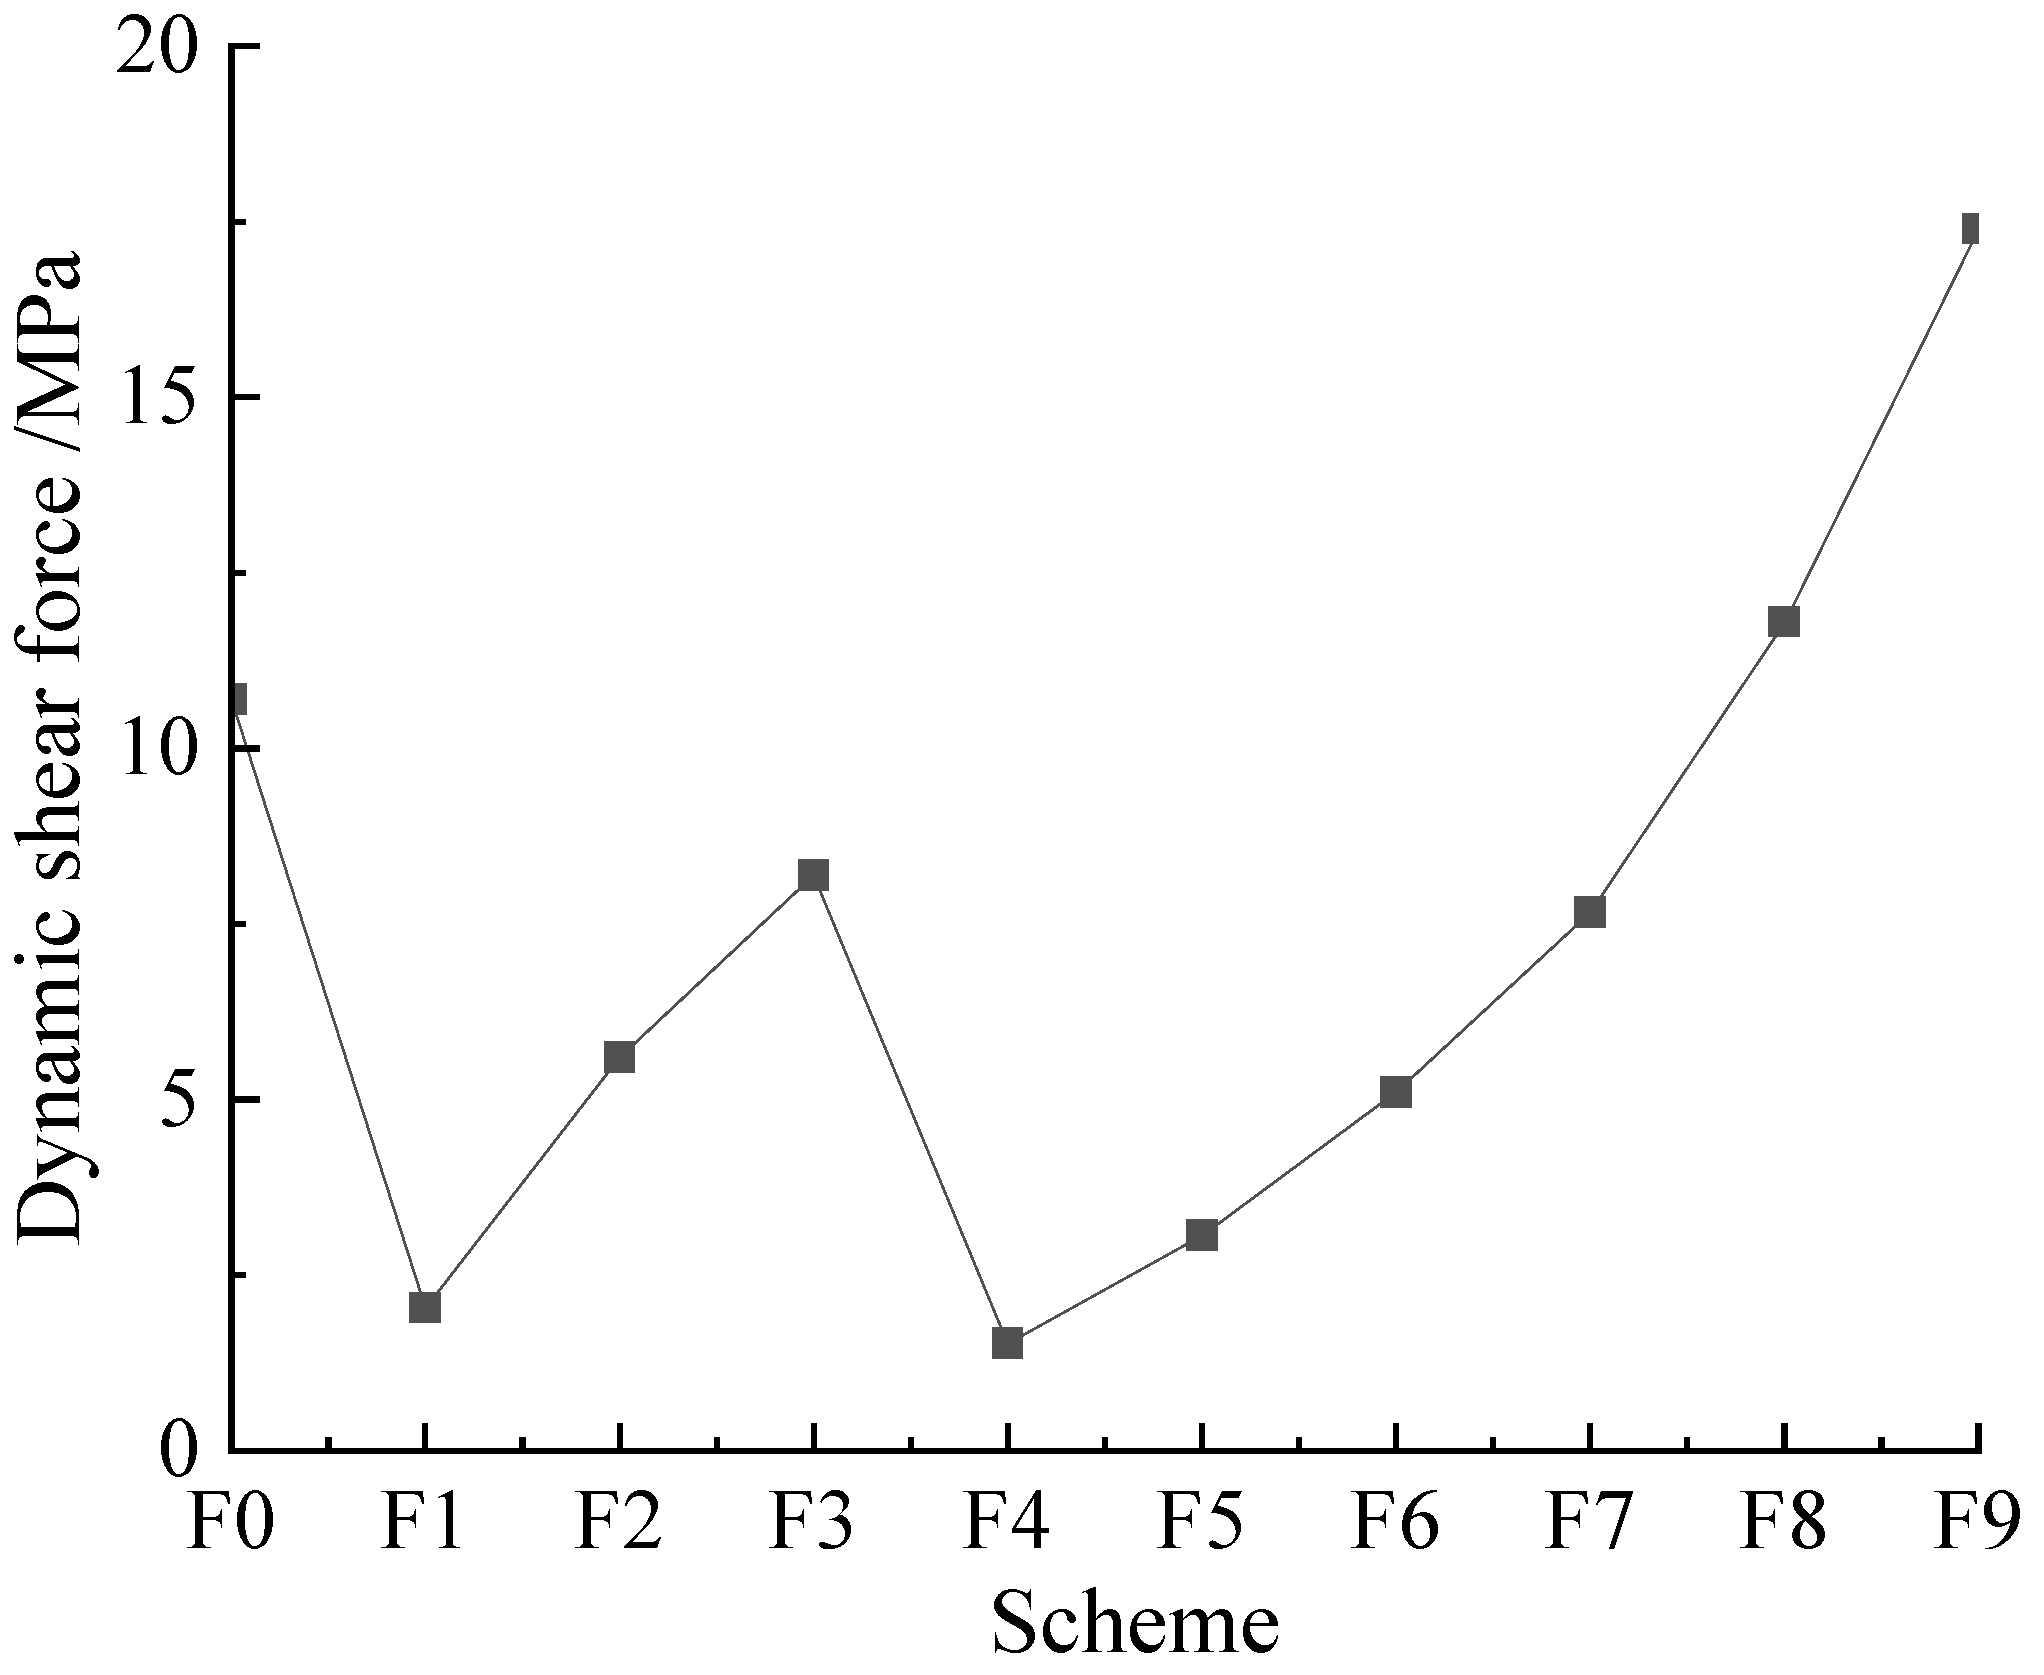
Microscopically, the dynamic shear force is the reaction of space grid structure force formed between clay particles when slurry flows, which can reflect the ability of slurry to carry sand and gravel to a certain extent. The dynamic shear force comparison of each scheme is shown in Figure 2.
As can be seen in Figure 2 above, among the schemes, only the F8 and F9 schemes have higher mud dynamic shear force values than the F0 scheme, indicating that only the addition of xanthan gum can effectively improve the mud dynamic shear force.

2.3.3. Static Shear Force Comparison

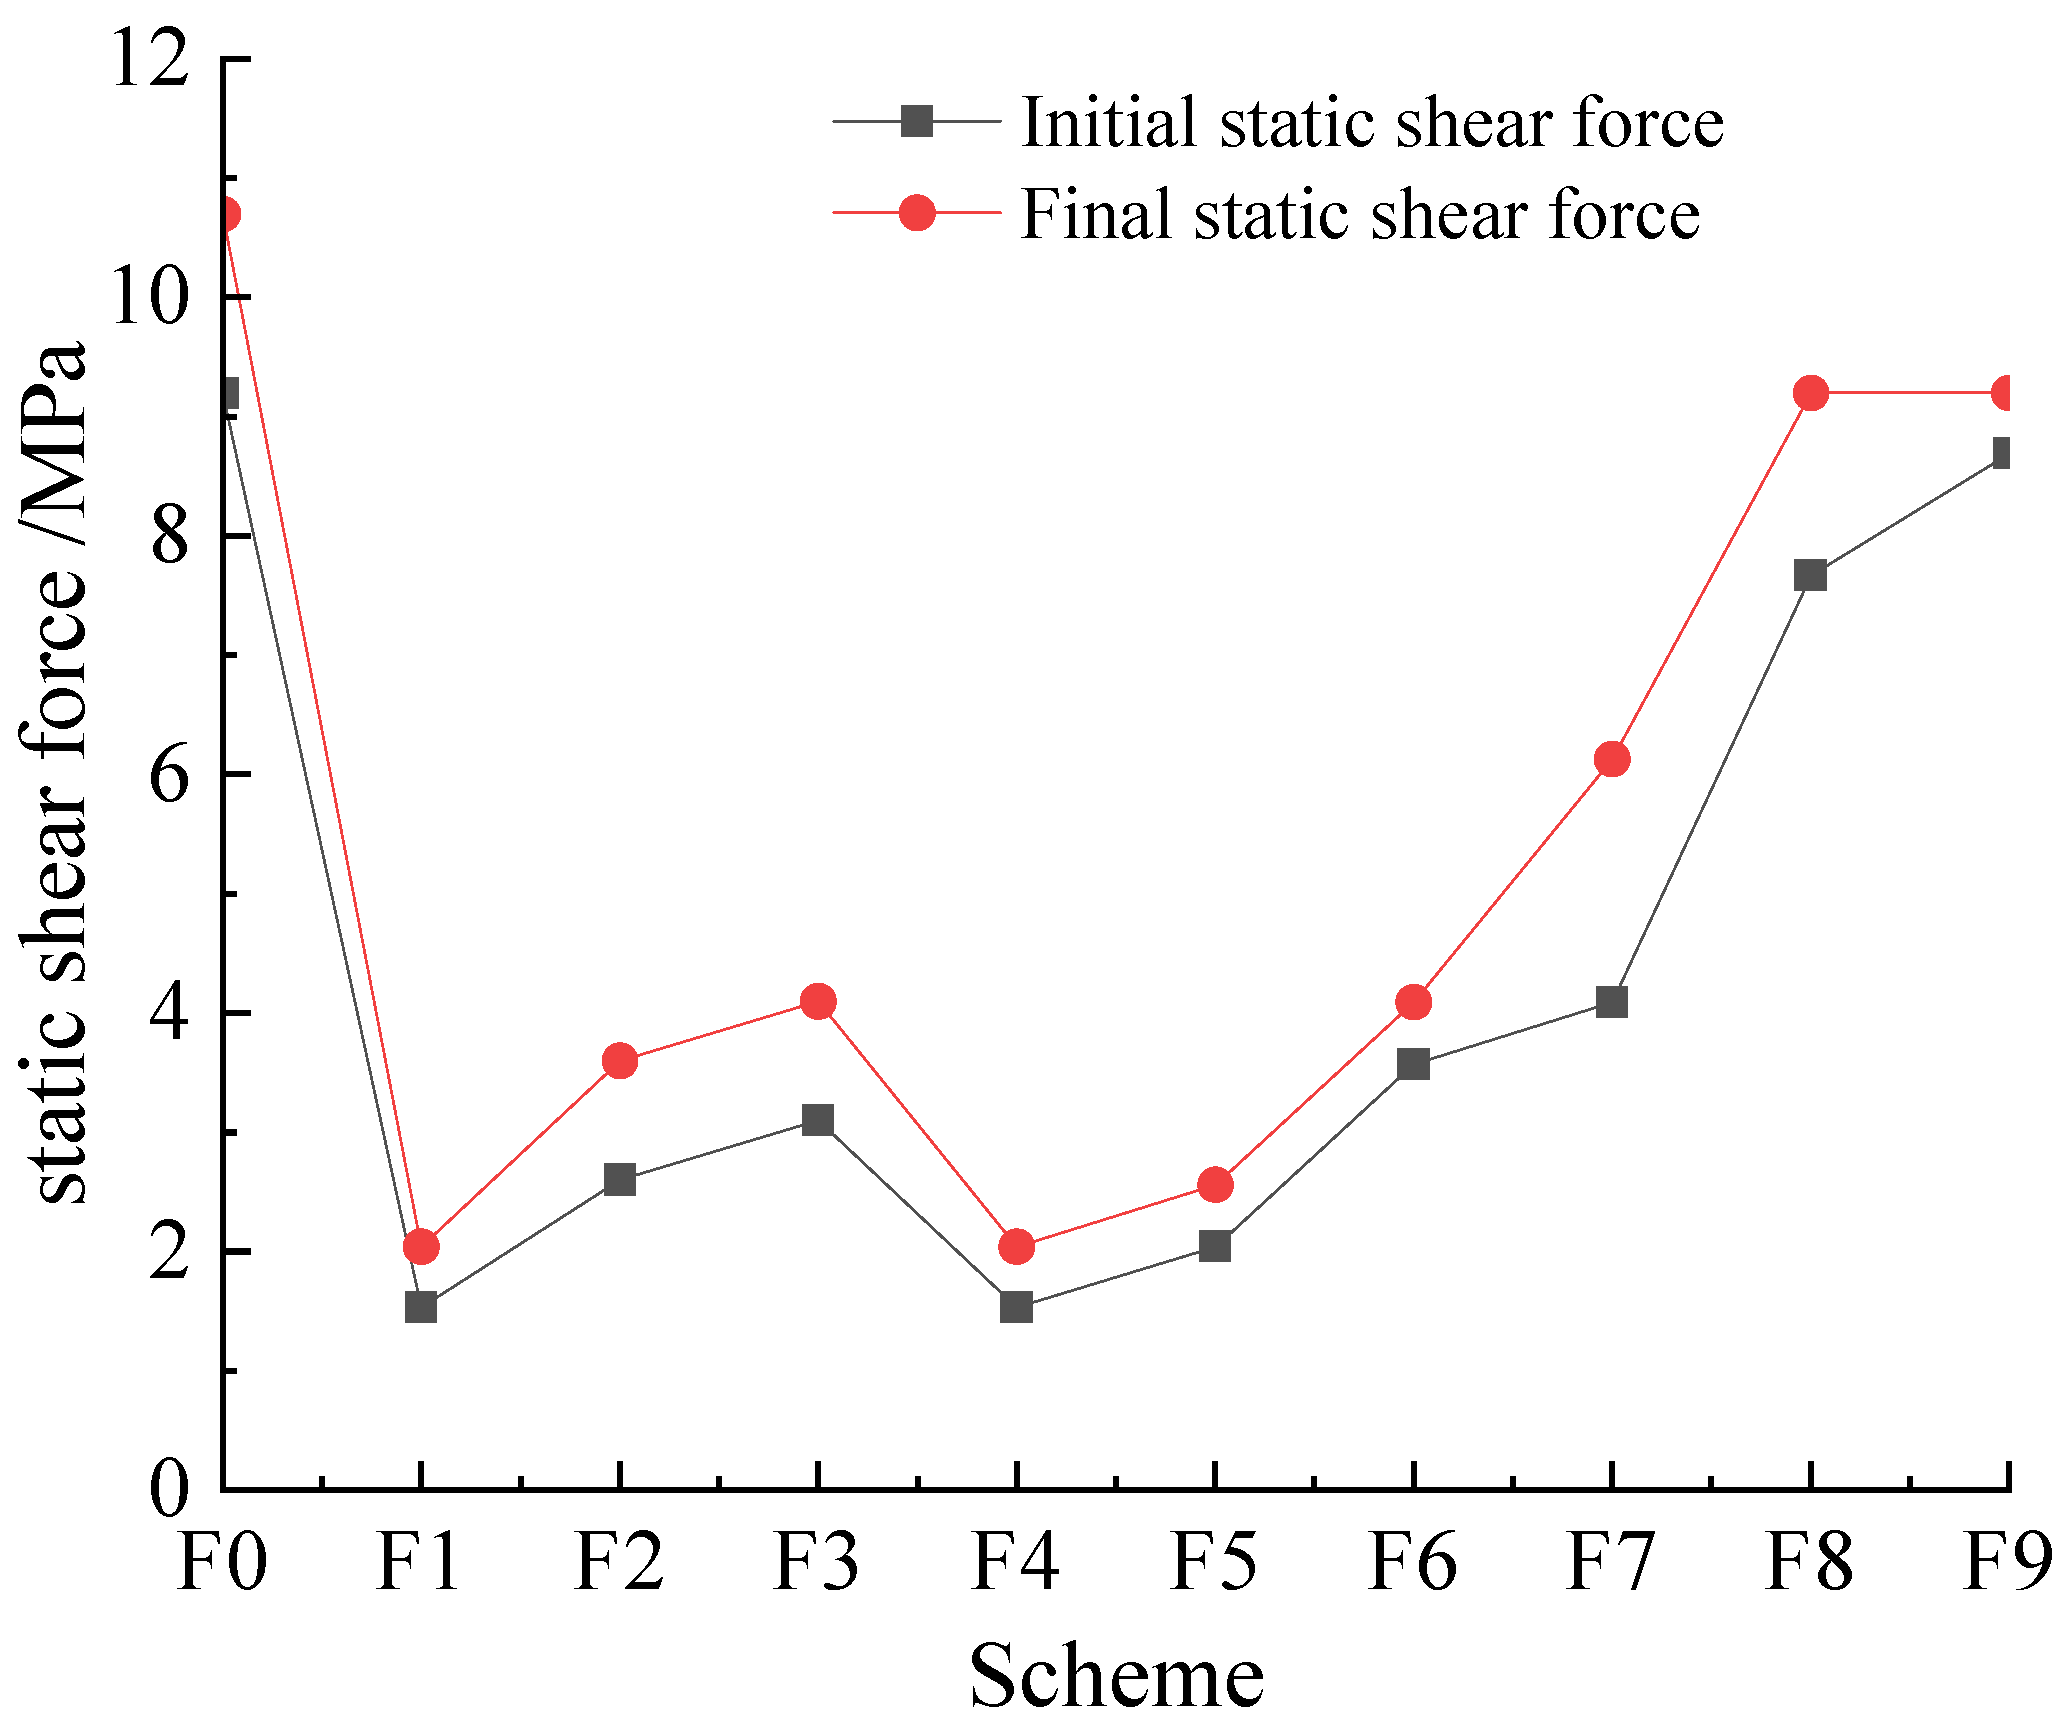
The static shear force comparison of each scheme is shown in Figure 3.
The static shear force reflects the strength of the internal gel network structure when the drilling fluid is in a static state. A small initial shear force is conducive to reducing the starting power of the shield machine, so the initial shear force should be appropriately reduced; for larger sand and pebble formations, the large final shear force is conducive to the suspension and transportation of mud to the muck, so it should be appropriately increased. From the comparison of the above figures, it can be seen that except for schemes F8 and F9, the static shear forces of the other schemes are relatively small and unfavorable to the sandy cobble stratum. Only the plans F8 and F9 of adding xanthan gum are close to the construction site mud, and the initial shear force and final shear force of scheme F8 are more suitable.

2.3.4. Dynamic Plastic Ratio Comparison

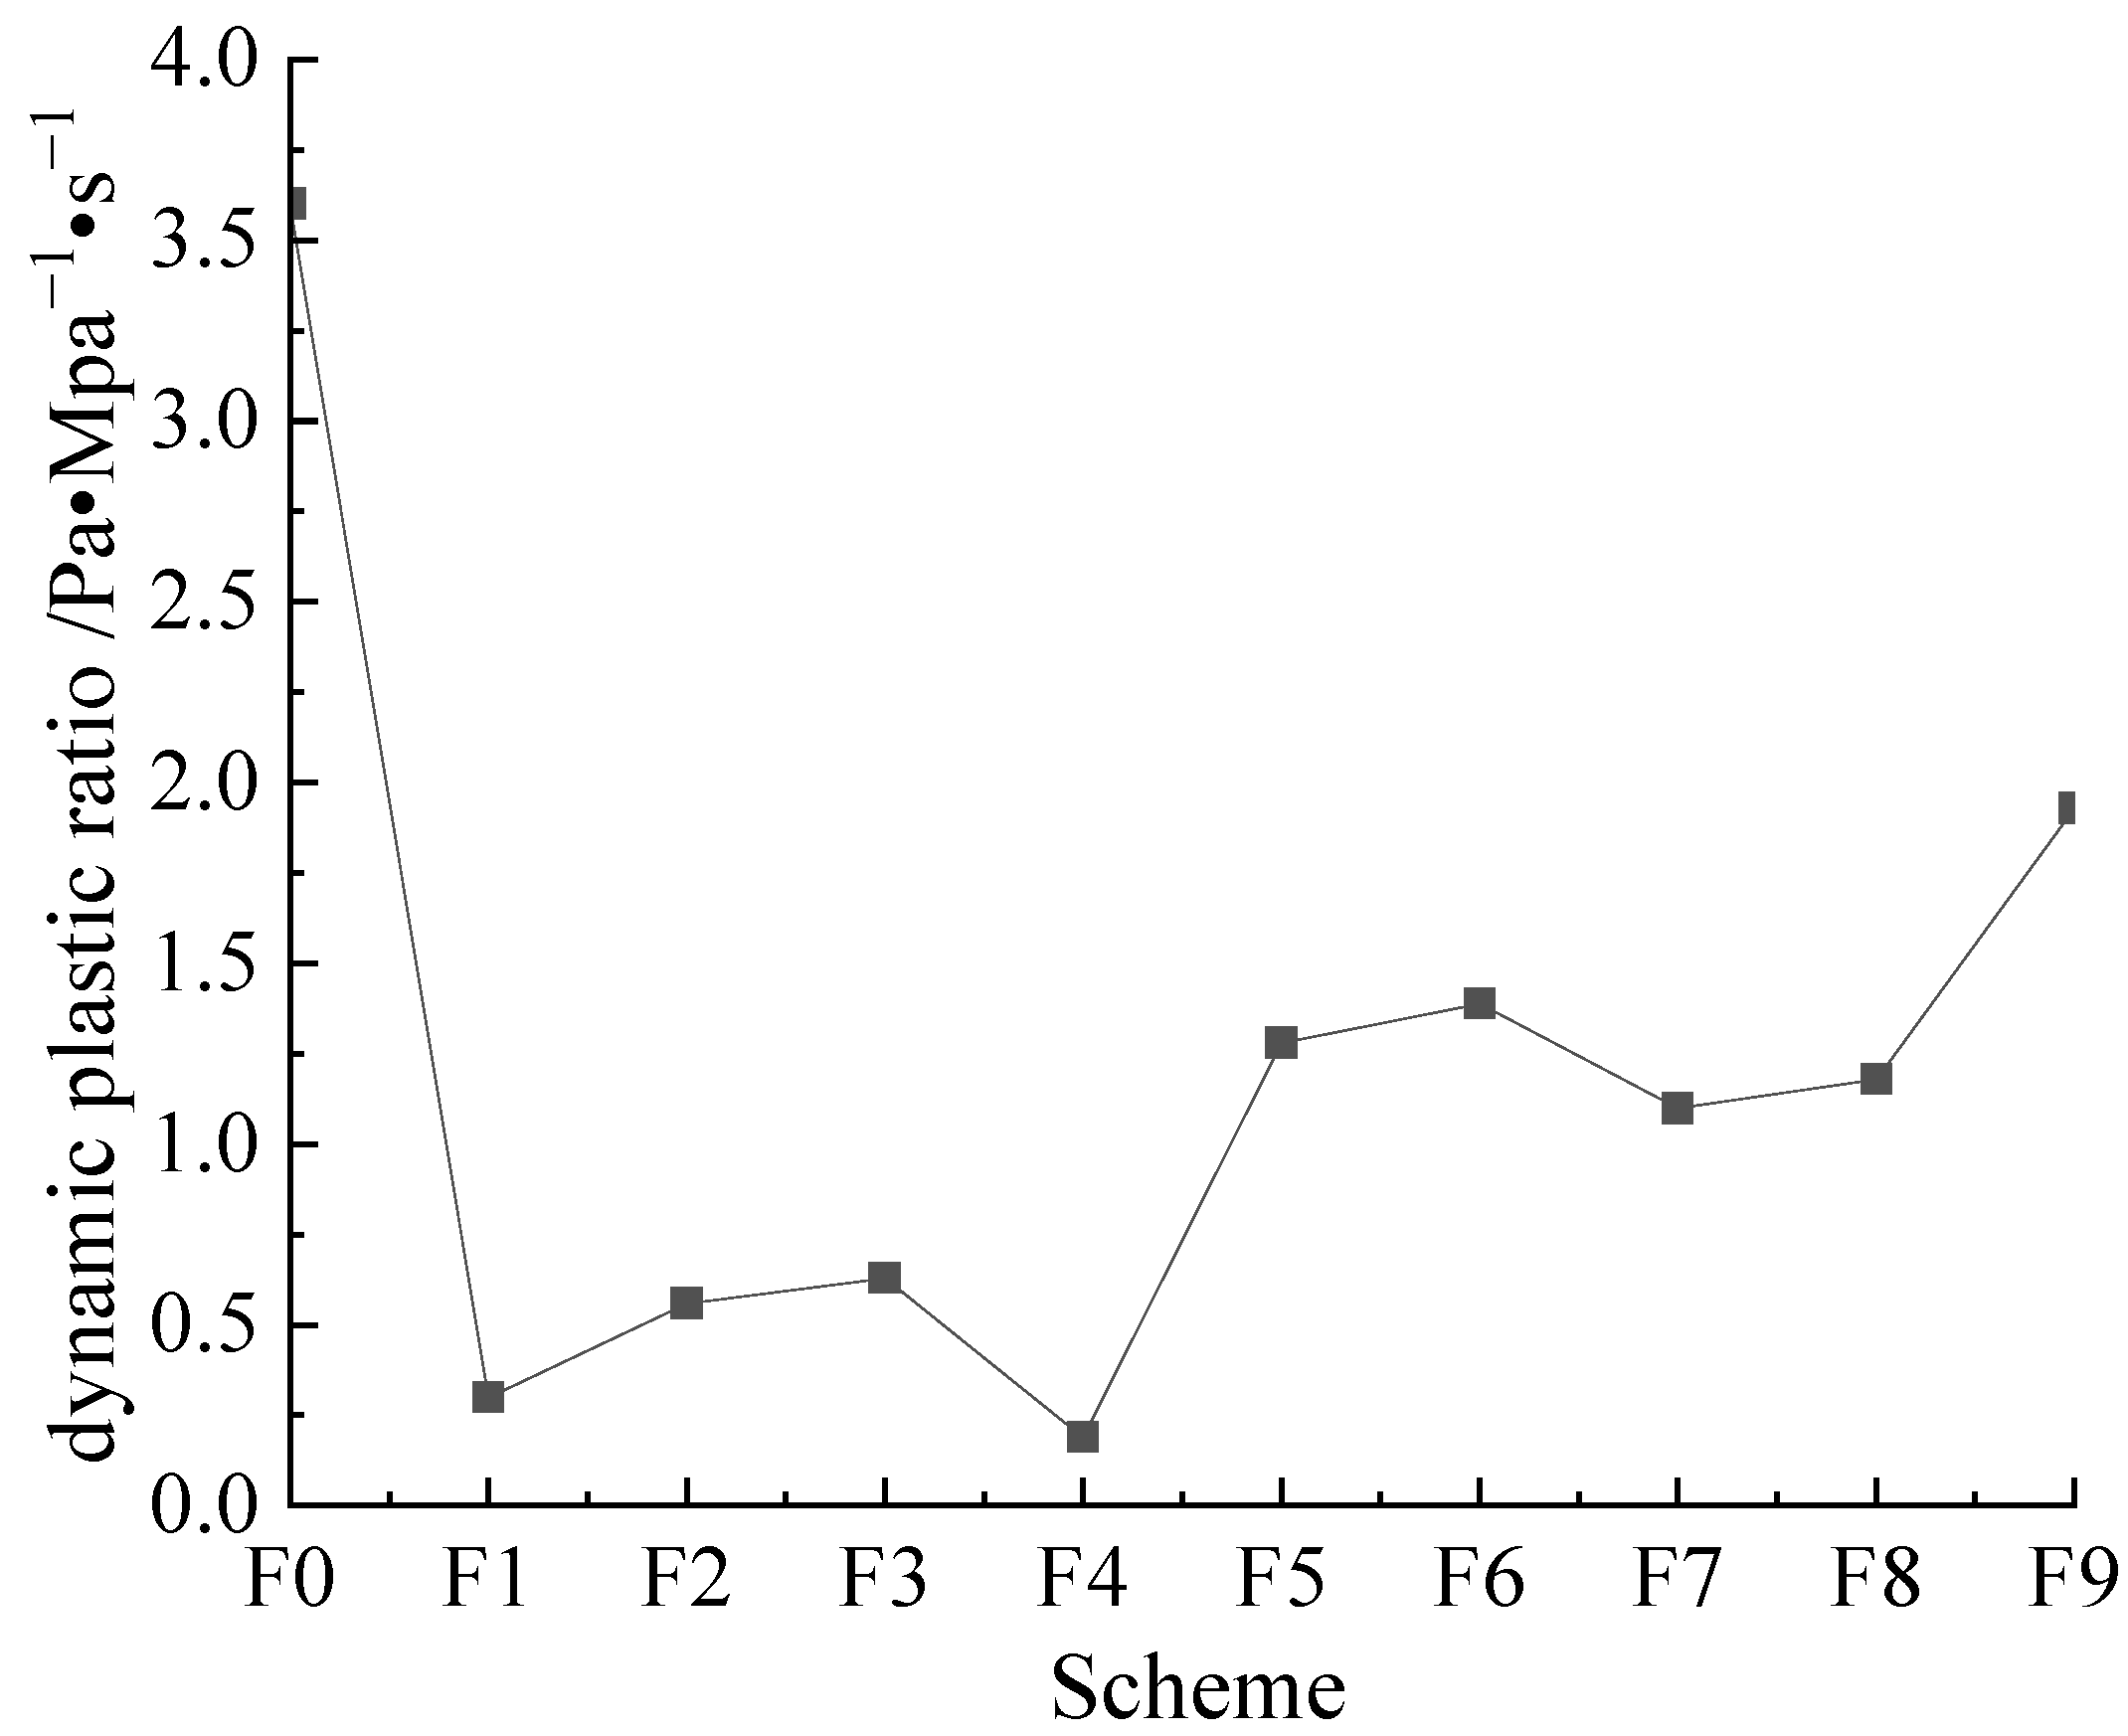
The dynamic plastic ratio ( τ d / η p ) is an important indicator to measure the shear dilution characteristics of mud. Given the particularity of shield soil improvement materials, to prevent the excavated soil from settling and accumulating at the bottom of the earth ballast tank, the mud is required to have a greater rock-carrying capacity, and the dynamic-plastic ratio is recommended to be between 0.5–1.5 Pa/MPa·s in this test. The dynamic-plastic ratio comparison of each mud scheme is shown in Figure 4.
An analysis of Figure 4 above shows that the F0 dynamic-plastic ratio of the mud scheme used on the construction site was too large, it is not conducive to the pumping of mud, and the dynamic-plastic ratio of the mud in the schemes F1~F6 was too small, which is not conducive to carrying cuttings. Scheme F8 is more suitable.

2.3.5. Flowability Index and Consistency Coefficient Comparison

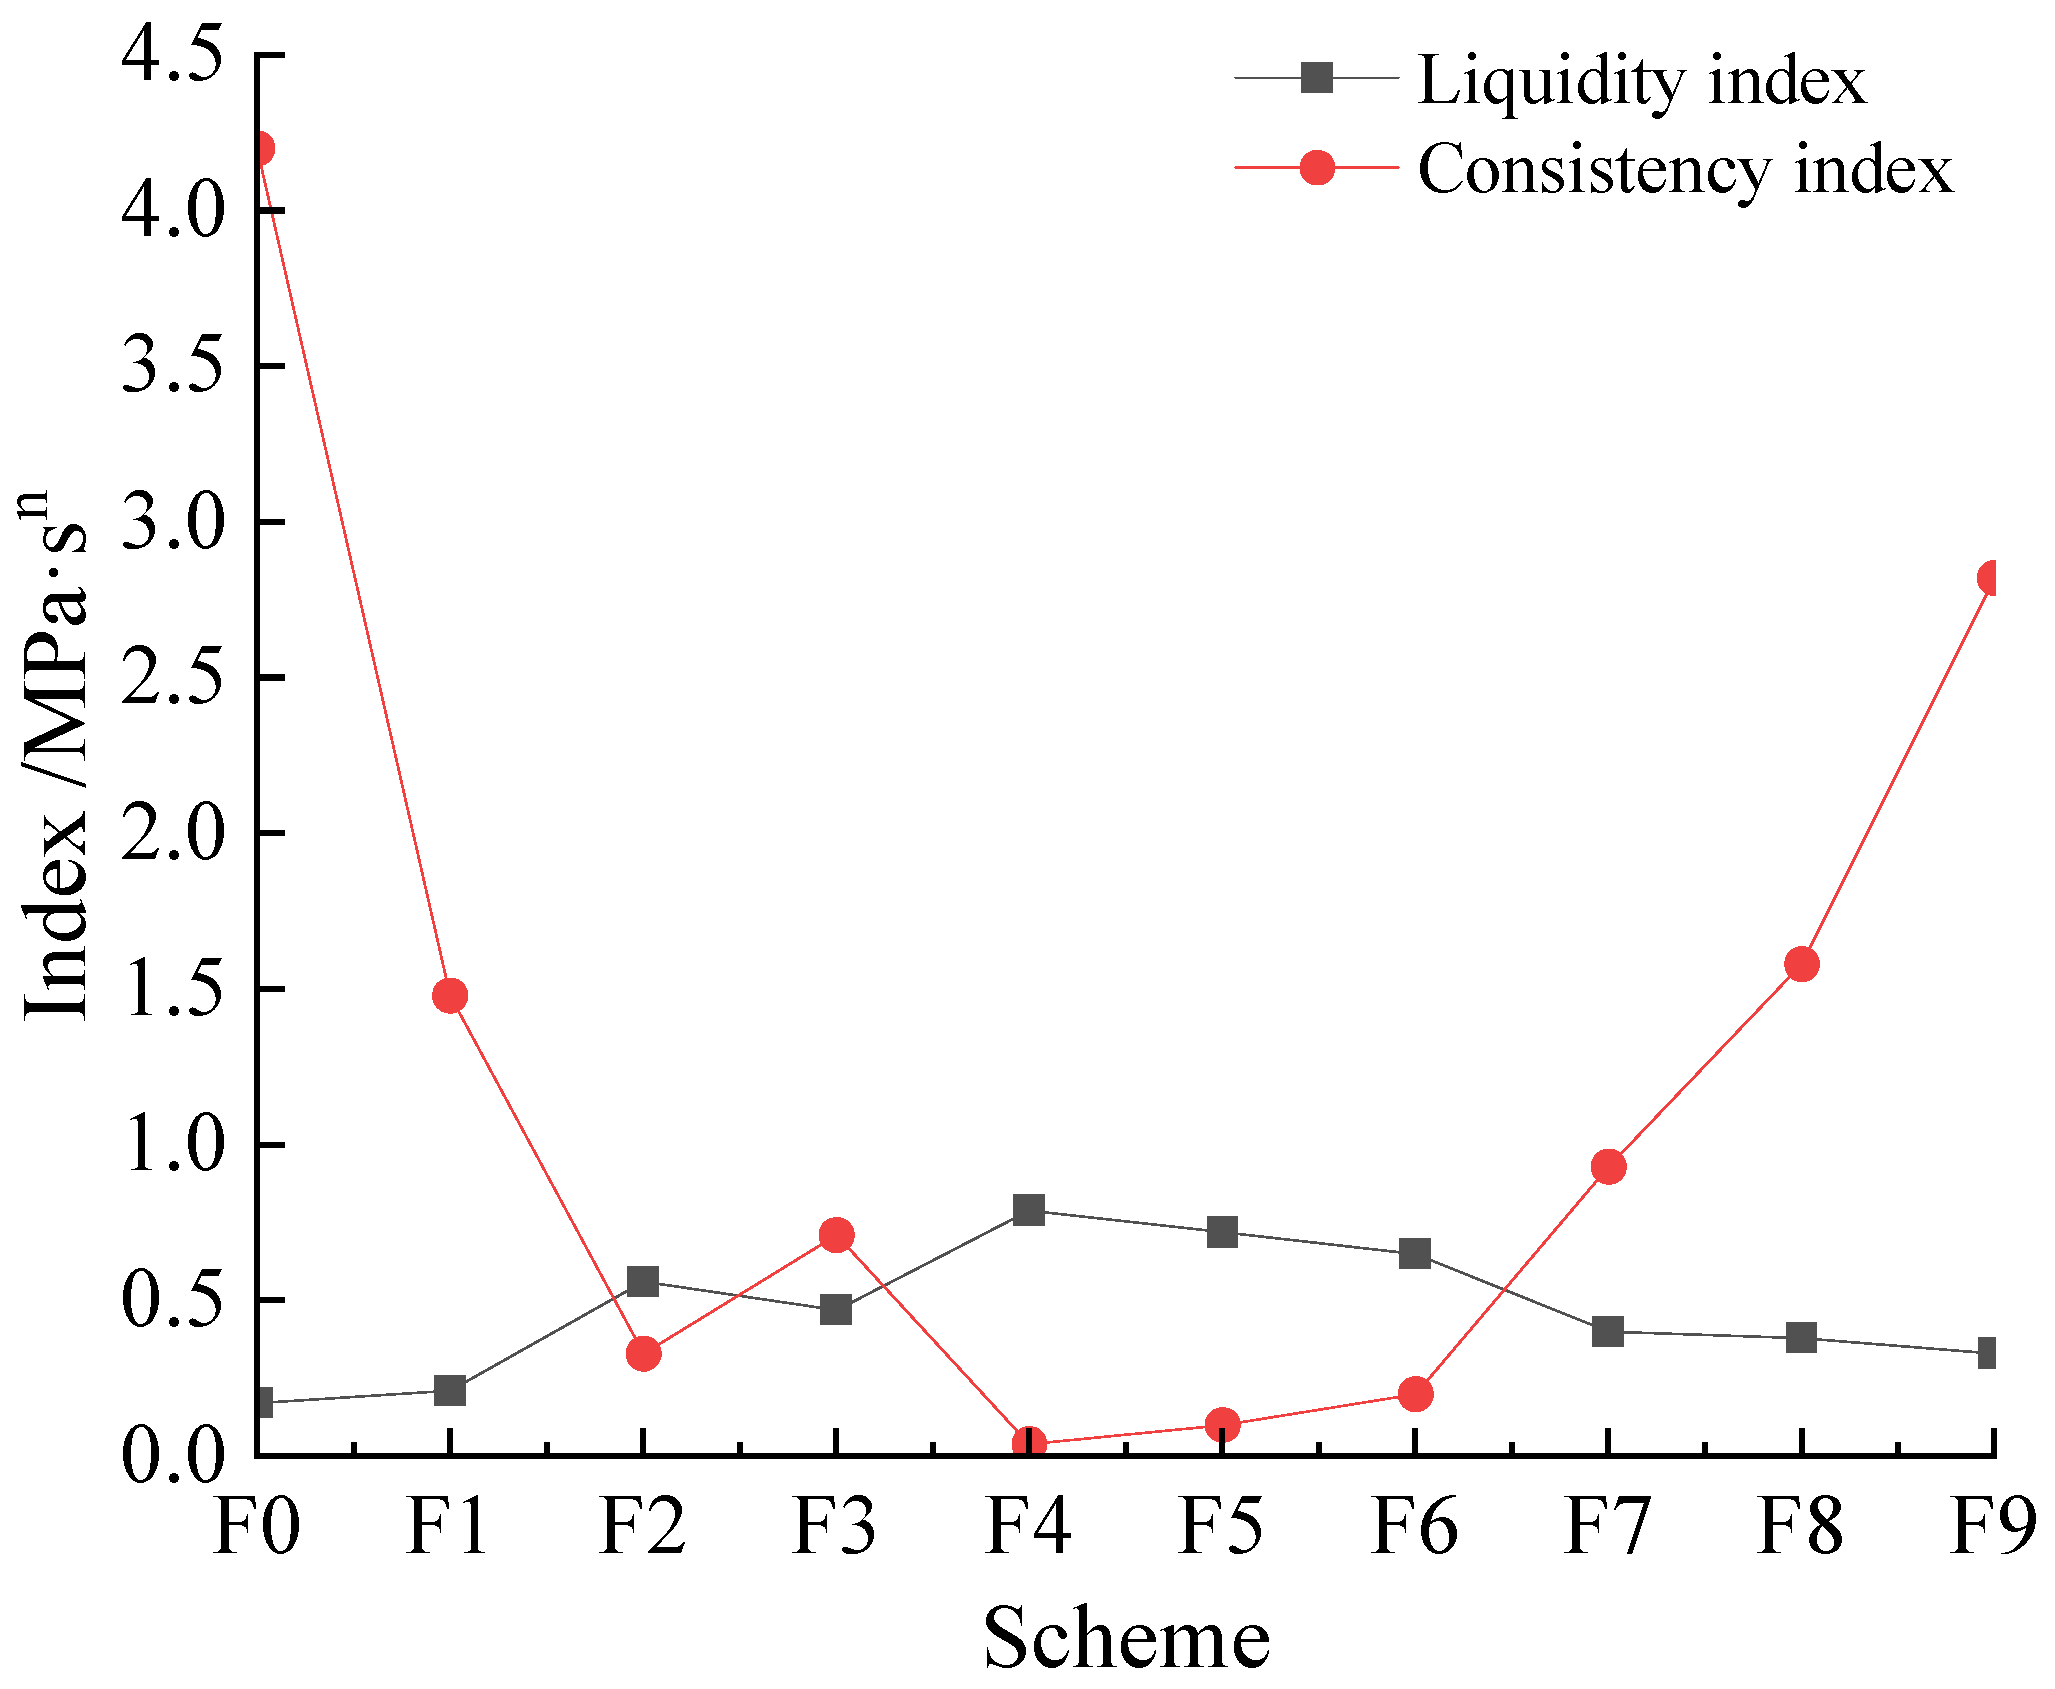
The fluidity index n represents the non-Newtonian degree of the fluid within a certain flow velocity range, and the fluidity index is the representation of the fluidity of the mud. According to the knowledge of drilling fluids, the popularity index n is best around 0.5, and generally less than 1. The consistency coefficient k is the viscosity of the fluid under the 1 s−1 flow velocity gradient, and it is a reflection of the viscosity of the fluid; the larger the consistency coefficient, the more viscous the fluid. For the larger sand and pebble formation, the K value of the earth pressure balance shield should be 1.5~2. Figure 5 shows the fluidity index and consistency coefficient of the mud in each scheme.
An analysis of the Figure 5 above shows that the fluidity index of the mud F0 scheme used in the construction site is 0.17, which is too small; it will influence the effect of mud carrying gravel, and if the consistency coefficient is too large, the pumpability of the slurry will be poor. The consistency coefficients of schemes F2~F7 are all less than 1. It is more appropriate to comprehensively consider the fluidity index and consistency coefficient of scheme F8.

2.3.6. API Filtration Loss Comparison

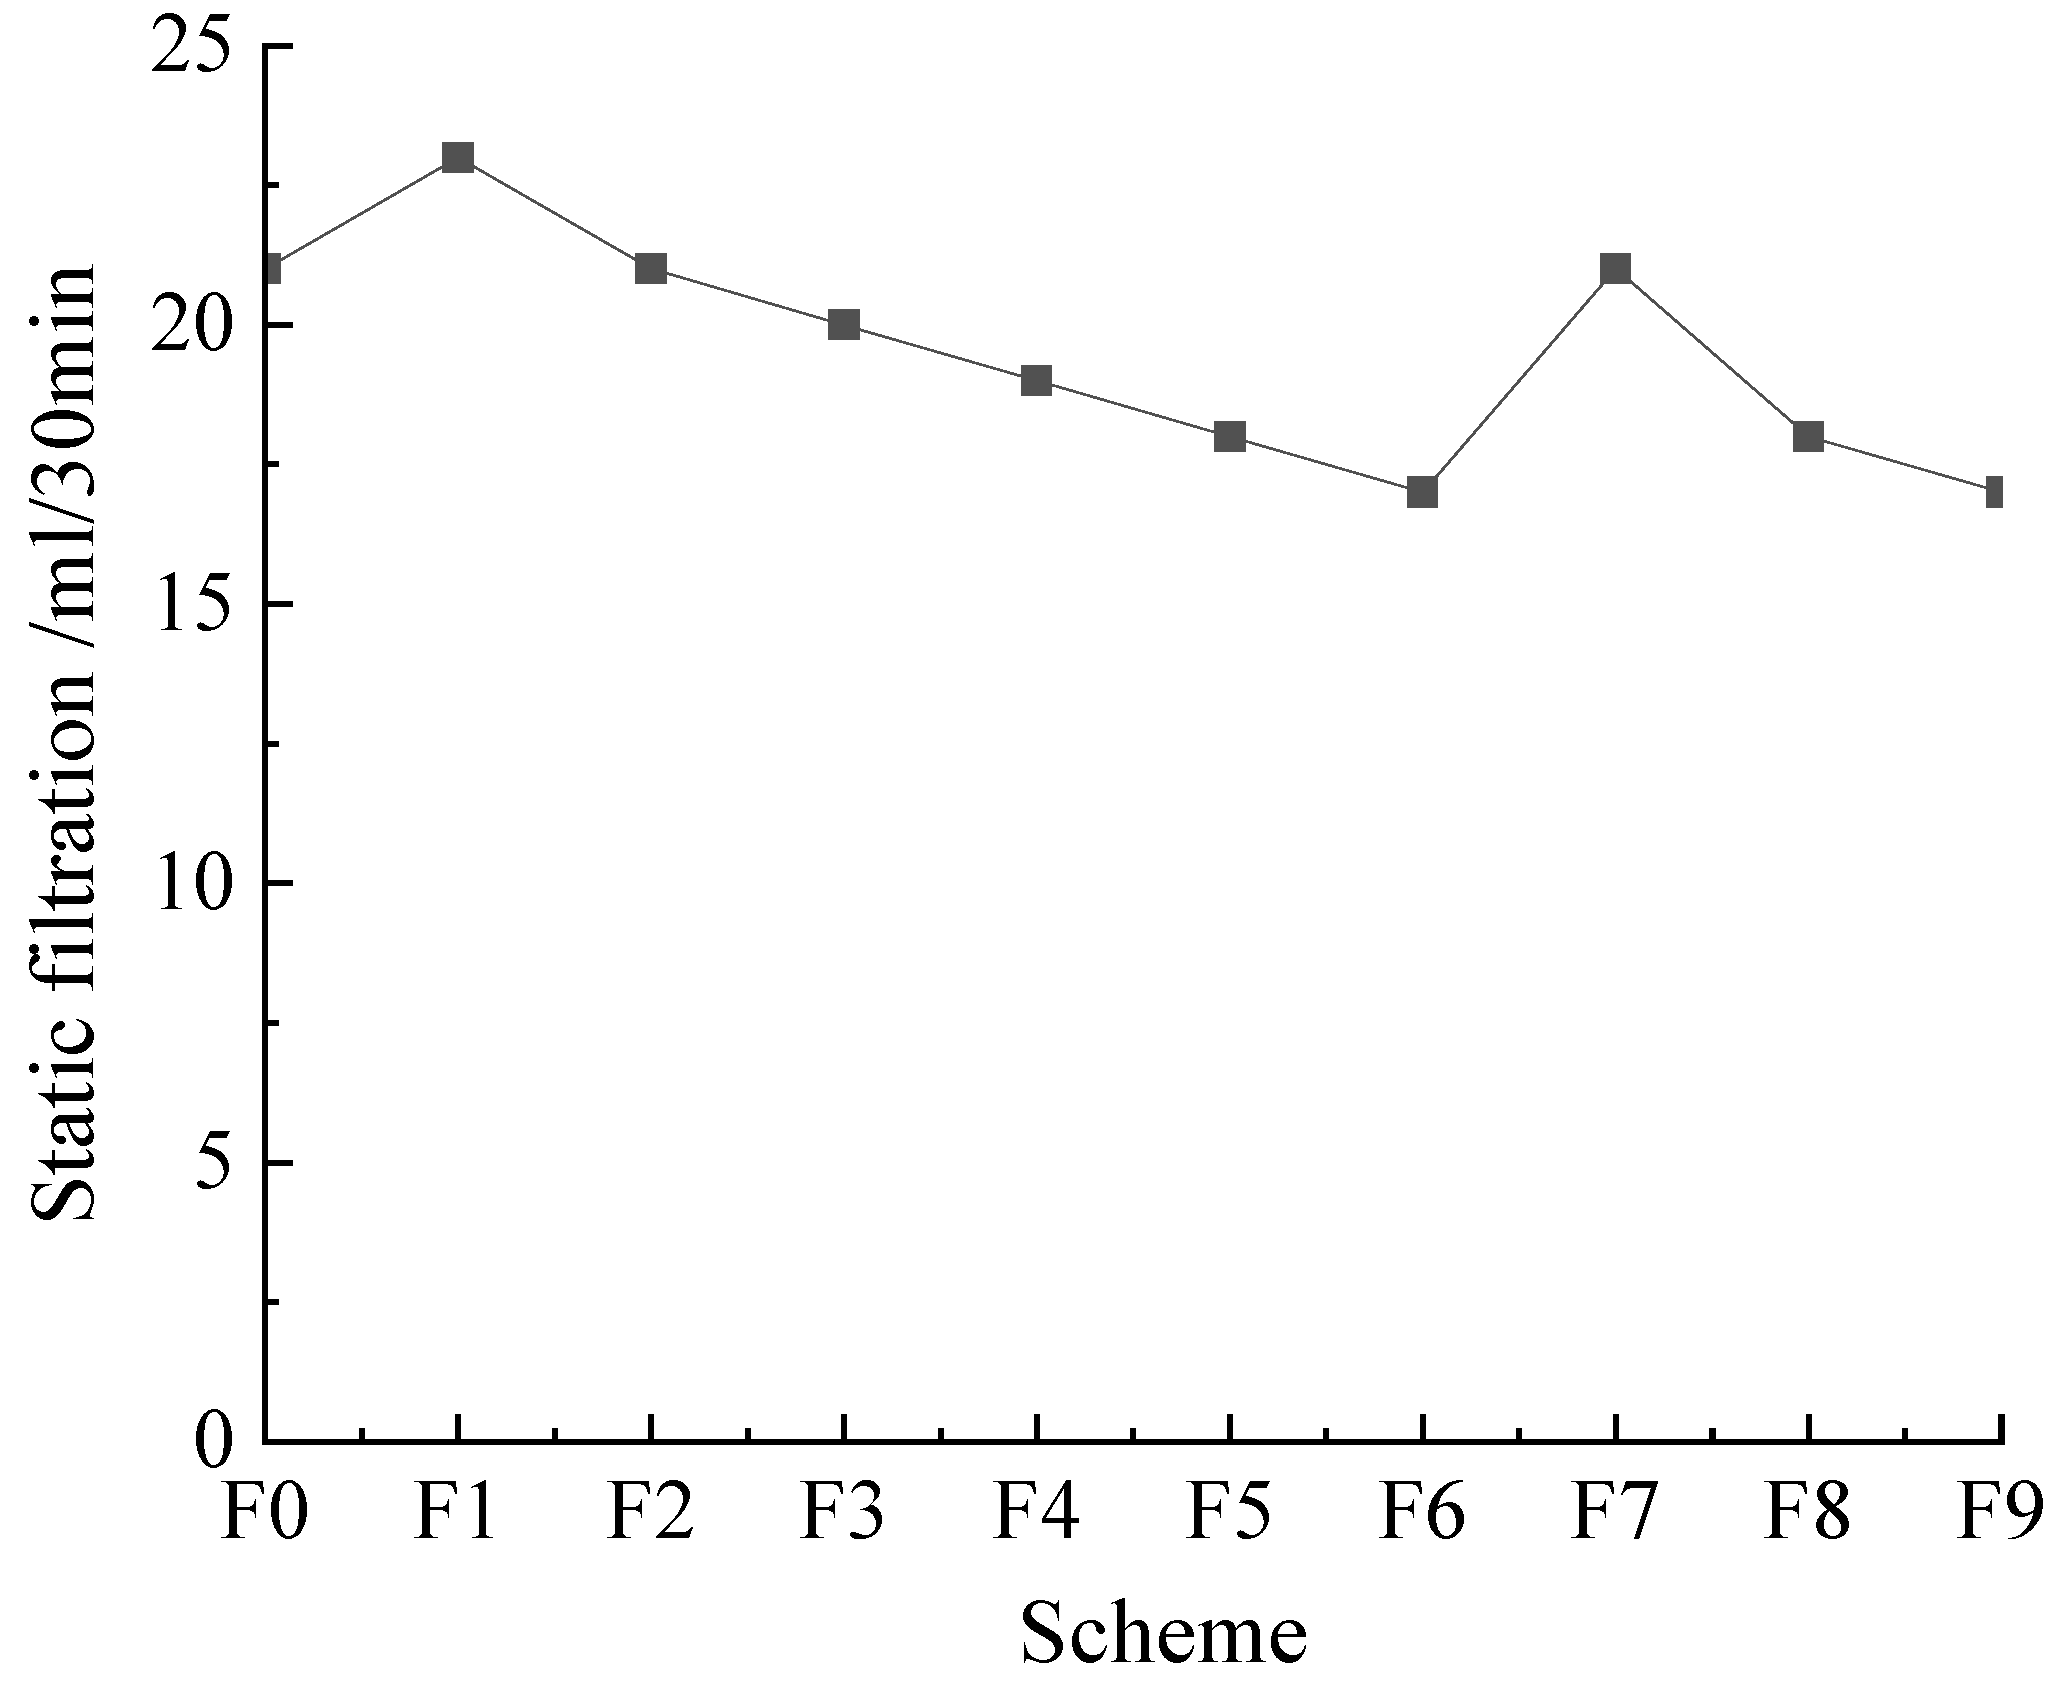
Filtration loss is the degree of stability of the mud. The amount of water filtered by the mud is small, which can make the pore water pressure close to the excavation face rise less, ensuring that the effective mud-water pressure acting on the digging face remains unchanged after the mud film is formed, conducive to the stability of the excavation surface. To ensure mud performance, the smaller the water loss, the better. See Figure 6 for the comparison of mud filtration in each scheme.
For the earth pressure balance shield, the filtration loss is generally required to be less than 20 mL/30 min. Therefore, schemes F4, F5, F6, F8, and F9 can all meet the requirements.

2.4. Comprehensive Analysis of Mud Plan

Through the above comparative analysis of each index parameter of the mud of each scheme, it can be concluded that xanthan gum is superior to guar gum, CMC, and polyacrylamide in improving mud performance; in particular, the index parameters of scheme F8 are the most suitable, and follow-up programs were therefore carried out concerning the ratio of program F8.

2.5. Effect of Clay Particles on Mud Properties

When clay particles are added to the slurry, the particle surface dissolves, forming a layer of coating with viscous slurry. During shield construction, it will be filled in the space between sand and gravel, which plays a role in lubrication and drag reduction, increasing plasticity and reducing cutting power. To study the influence of clay particles on mud properties, the following experiments were conducted for scheme F8.
The additional amount of clay particles should not exceed 2%. The test plan is shown in Table 4.
The data on mud properties are shown in Table 5.
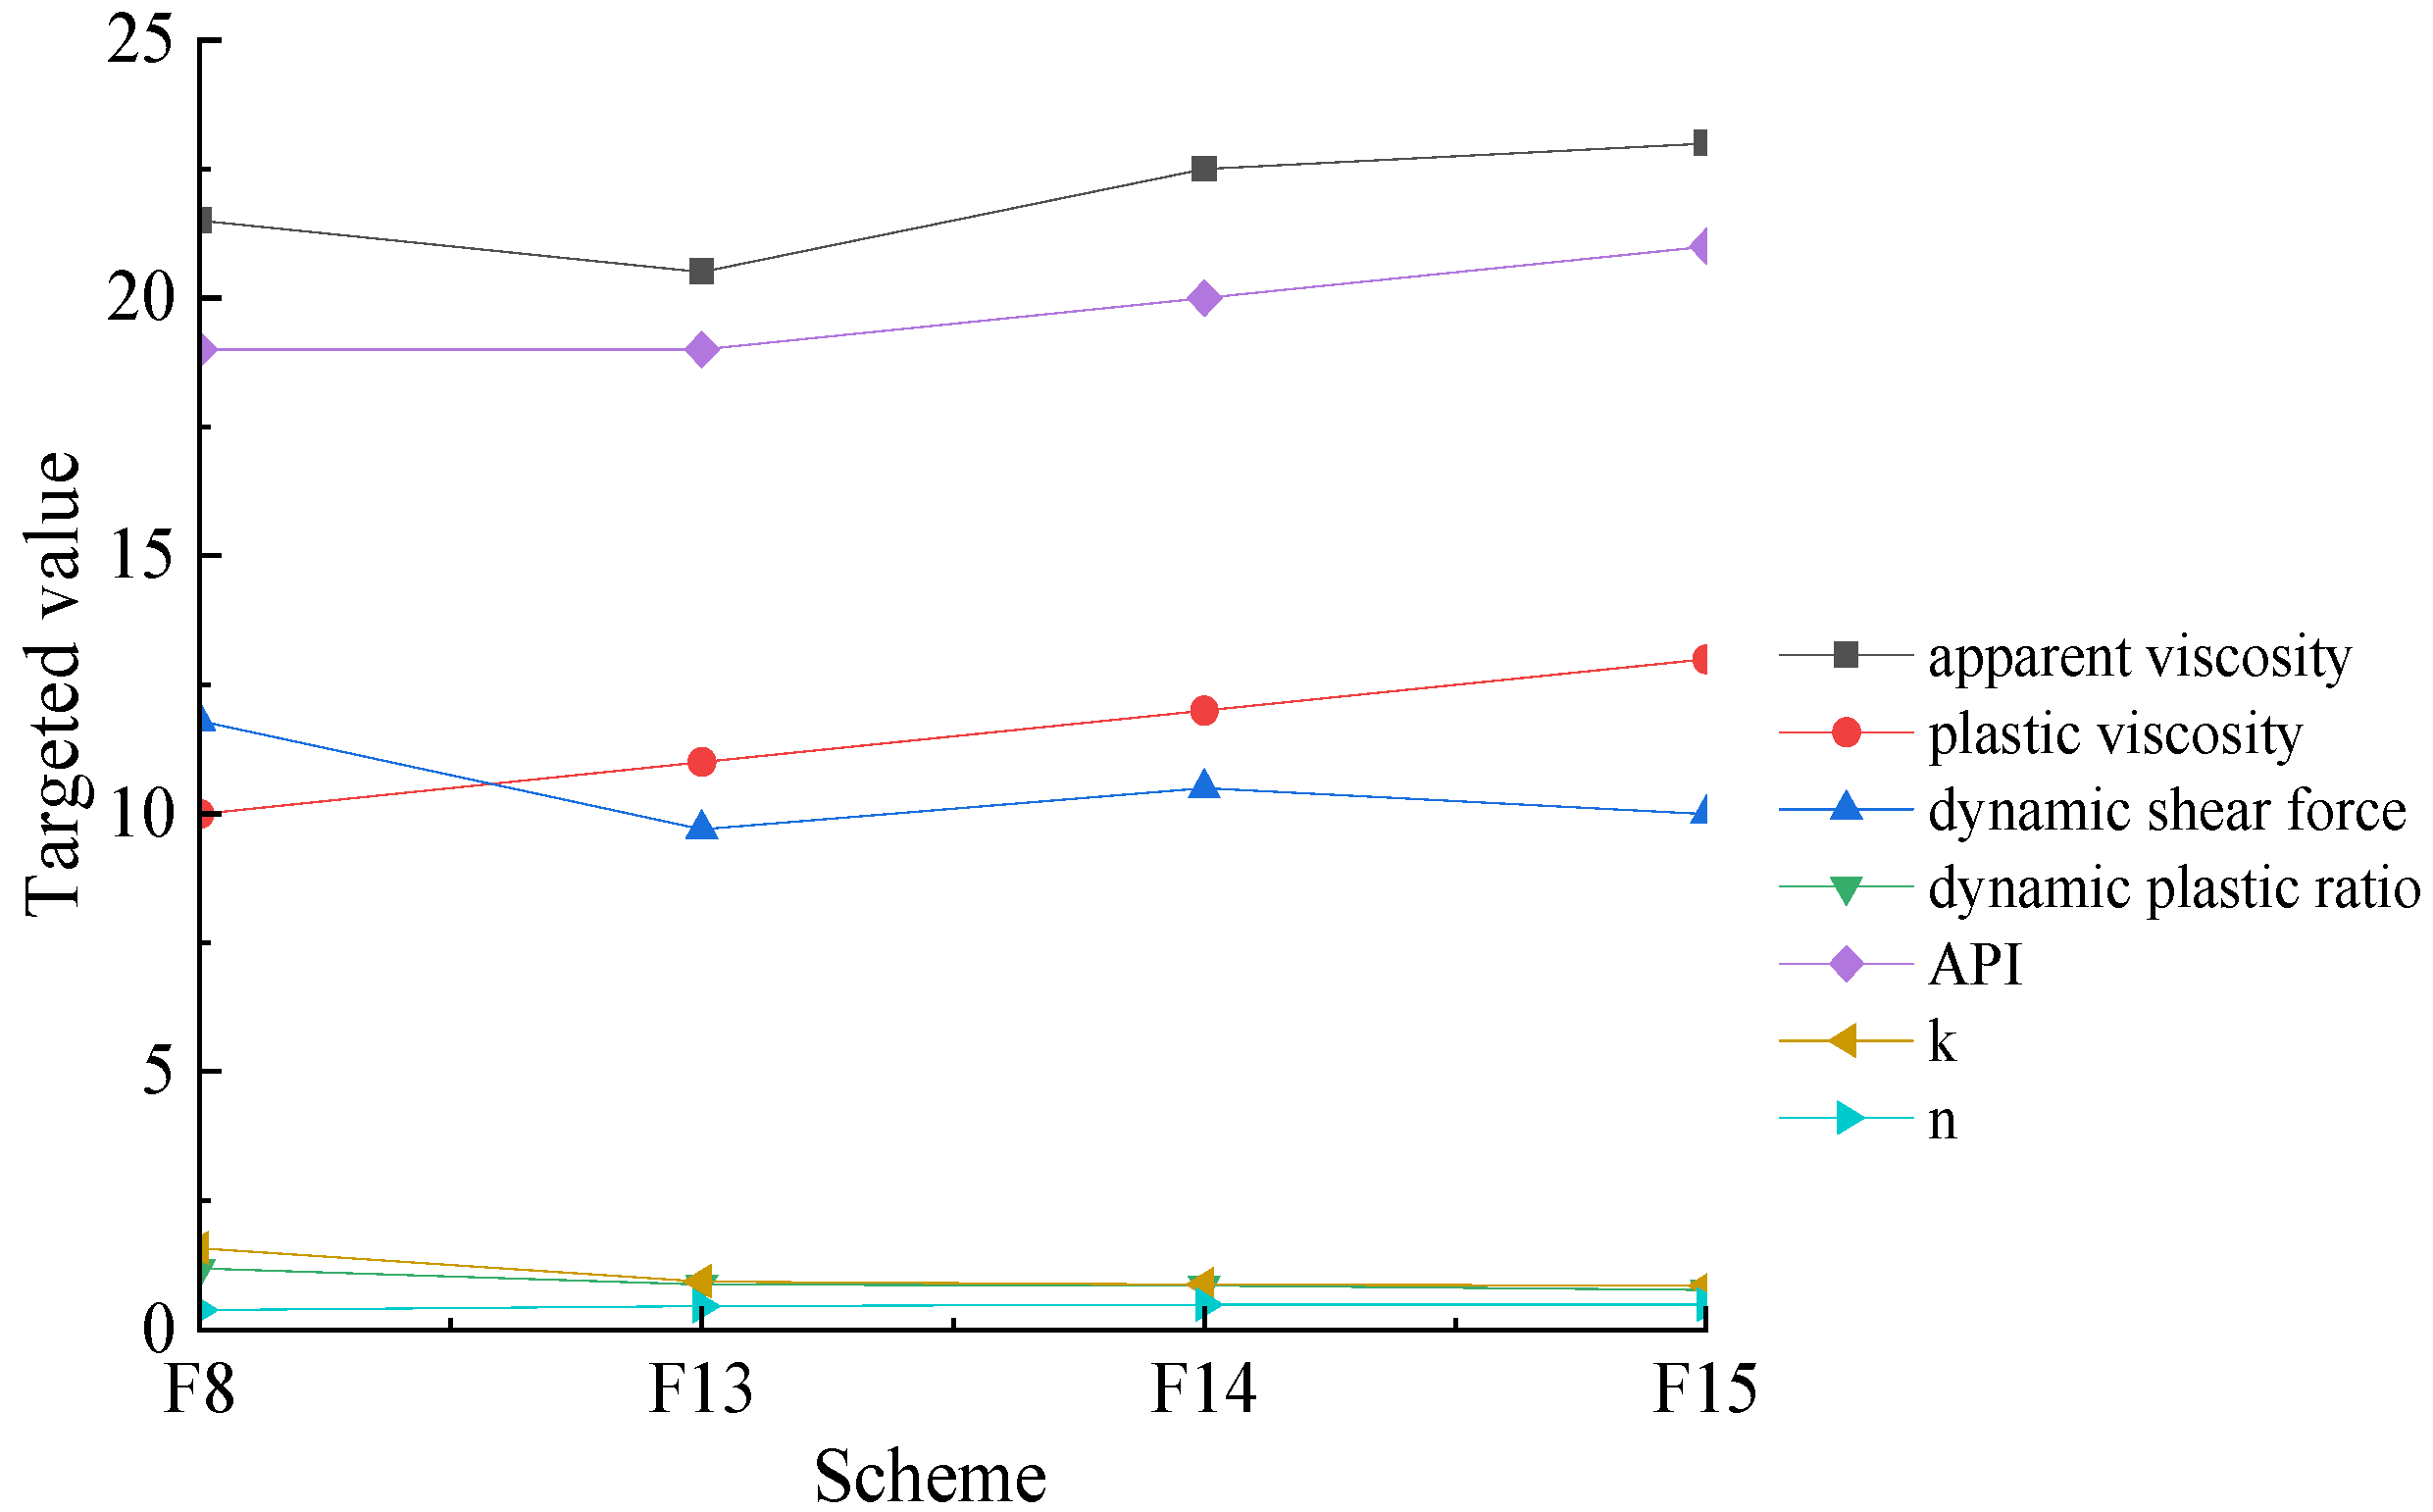
See Figure 7 for a comparison of the parameters of each scheme.
It can be seen from the analysis of the above figure that the viscosity of medium particles has little impact on the overall performance of the mud. It is found in the test that the clay medium particles contain a small number of insoluble substances, and when the addition amount exceeds 1%, the insoluble substances in the mud will increase, which will have adverse effects on mud filtration and plastic viscosity. Therefore, the added amount will be controlled at 1% in the future.

3. Analysis of Indoor Muck Improvement Test

3.1. Soil Mixing Test Design

The soil mixing test mainly uses the mixing process of the mixer to simulate the soil mixing process in the pressure chamber of the earth pressure balance shield, to evaluate the improvement effect of the developed modifier on the simulated soil. The amount of soil amendment added can be controlled by changing the stirring power of the mixer. See Figure 8 for indoor mixer test. The steps of the soil stirring test are as follows:
(1)
Use a plastic measuring cup to measure a certain volume of soil and pour it into the mixer, stir for 3 min, stop stirring after the reading of the power meter is stable, and record the stirring power when the reading is stable.
(2)
Take out a certain amount of soil from the mixing tank and conduct the friction coefficient test, adhesion resistance test, and slump test in sequence.
(3)
Pour the test soil back into the mixer, add a certain amount of soil amendment, stir the soil with a mixer for soil improvement, stir for 3 min and stop stirring after the reading of the power meter is stable. Record the stirring power when the reading is stable, and then remove the soil from the mixing drum for subsequent tests. The test cannot be terminated until the soil reaches the ideal plastic flow state. There were 3–5 groups in each experiment, and the results were averaged.

3.2. Friction Coefficient Test Design

The main purpose of the design of the friction coefficient test is to simulate the process of friction between the soil and the steel during the excavation process of the screw excavator. By measuring the external friction angle between the soil and the steel, the friction coefficient between the soil and the steel is obtained.
The specific test steps are as follows:
(1)
Place the plastic ring on a stainless-steel plate, fill it with improved soil, and smooth the top of the plastic ring.
(2)
Fix one end of the steel plate, and slowly lift the other end. When the ring with the improved soil starts to slide, stop and continue to lift.
(3)
The angle at which the steel plate is tilted at this time is measured, which is the external friction angle φ between the improved soil and the steel plate.
(4)
The friction coefficient between the improved soil and the steel plate can be obtained by the following formula. There were 3–5 groups in each experiment, and the results were averaged.
f = tan φ
f—Improve the friction coefficient between soil and steel plate; φ —Improve the external friction angle between the soil and the steel plate.

3.3. Adhesion Resistance Test

The adhesion resistance test is to simulate the process of the soil adhesion to the steel surface during the excavation process of the screw excavator. By measuring the adhesion resistance of soil and steel, the adhesion resistance coefficient between soil and steel is obtained, which can be used to measure the fluidity of soil. The specific test steps are as follows:
(1)
Place the iron cylinder on the iron box, fill it with the improved soil, and smooth the upper part of the improved soil.
(2)
Lift the iron cylinder slowly, and stop lifting the iron cylinder when the iron cylinder is high enough.
(3)
Measure the adhesion resistance F at this time, which is the adhesion resistance between the improved soil and the iron cylinder.
(4)
After the adhesion resistance between the improved soil and the iron cylinder is measured, this does not provide the adhesion resistance between the reaction soil and the iron surface used, because this adhesion resistance only reflects the situation of this test. Therefore, this adhesion resistance should also be treated to a certain extent, obtaining the size of the adhesion resistance per unit area, to better reflect the change in the adhesion resistance between the soil and the iron cylinder. There were 3–5 groups in each experiment, and the results were averaged. The adhesion resistance coefficient k is obtained by the following formula. This adhesion resistance measuring device is shown in Figure 9.
Since the original adhesion resistance dimension measured in this test is a mass unit, to convert to weight units, first convert using the following formula:
F = M × g
The surface area of the inner surface of the iron cylinder is:
S = π × D × h
The adhesion resistance coefficient between the improved soil and the iron cylinder is:
K = F/S = (M × g)/(S = π × D × h)
M is the measured original lifting weight (kg); F is the adhesion resistance (N) between the improved soil and the iron cylinder; S is the surface area of the inner surface of the iron cylinder (m2); D is the inner diameter of the iron cylinder (m); h is the height of the iron cylinder (m); K is the adhesion resistance coefficient between the improved soil and the iron cylinder (N/m2).

3.4. Slump Test Design

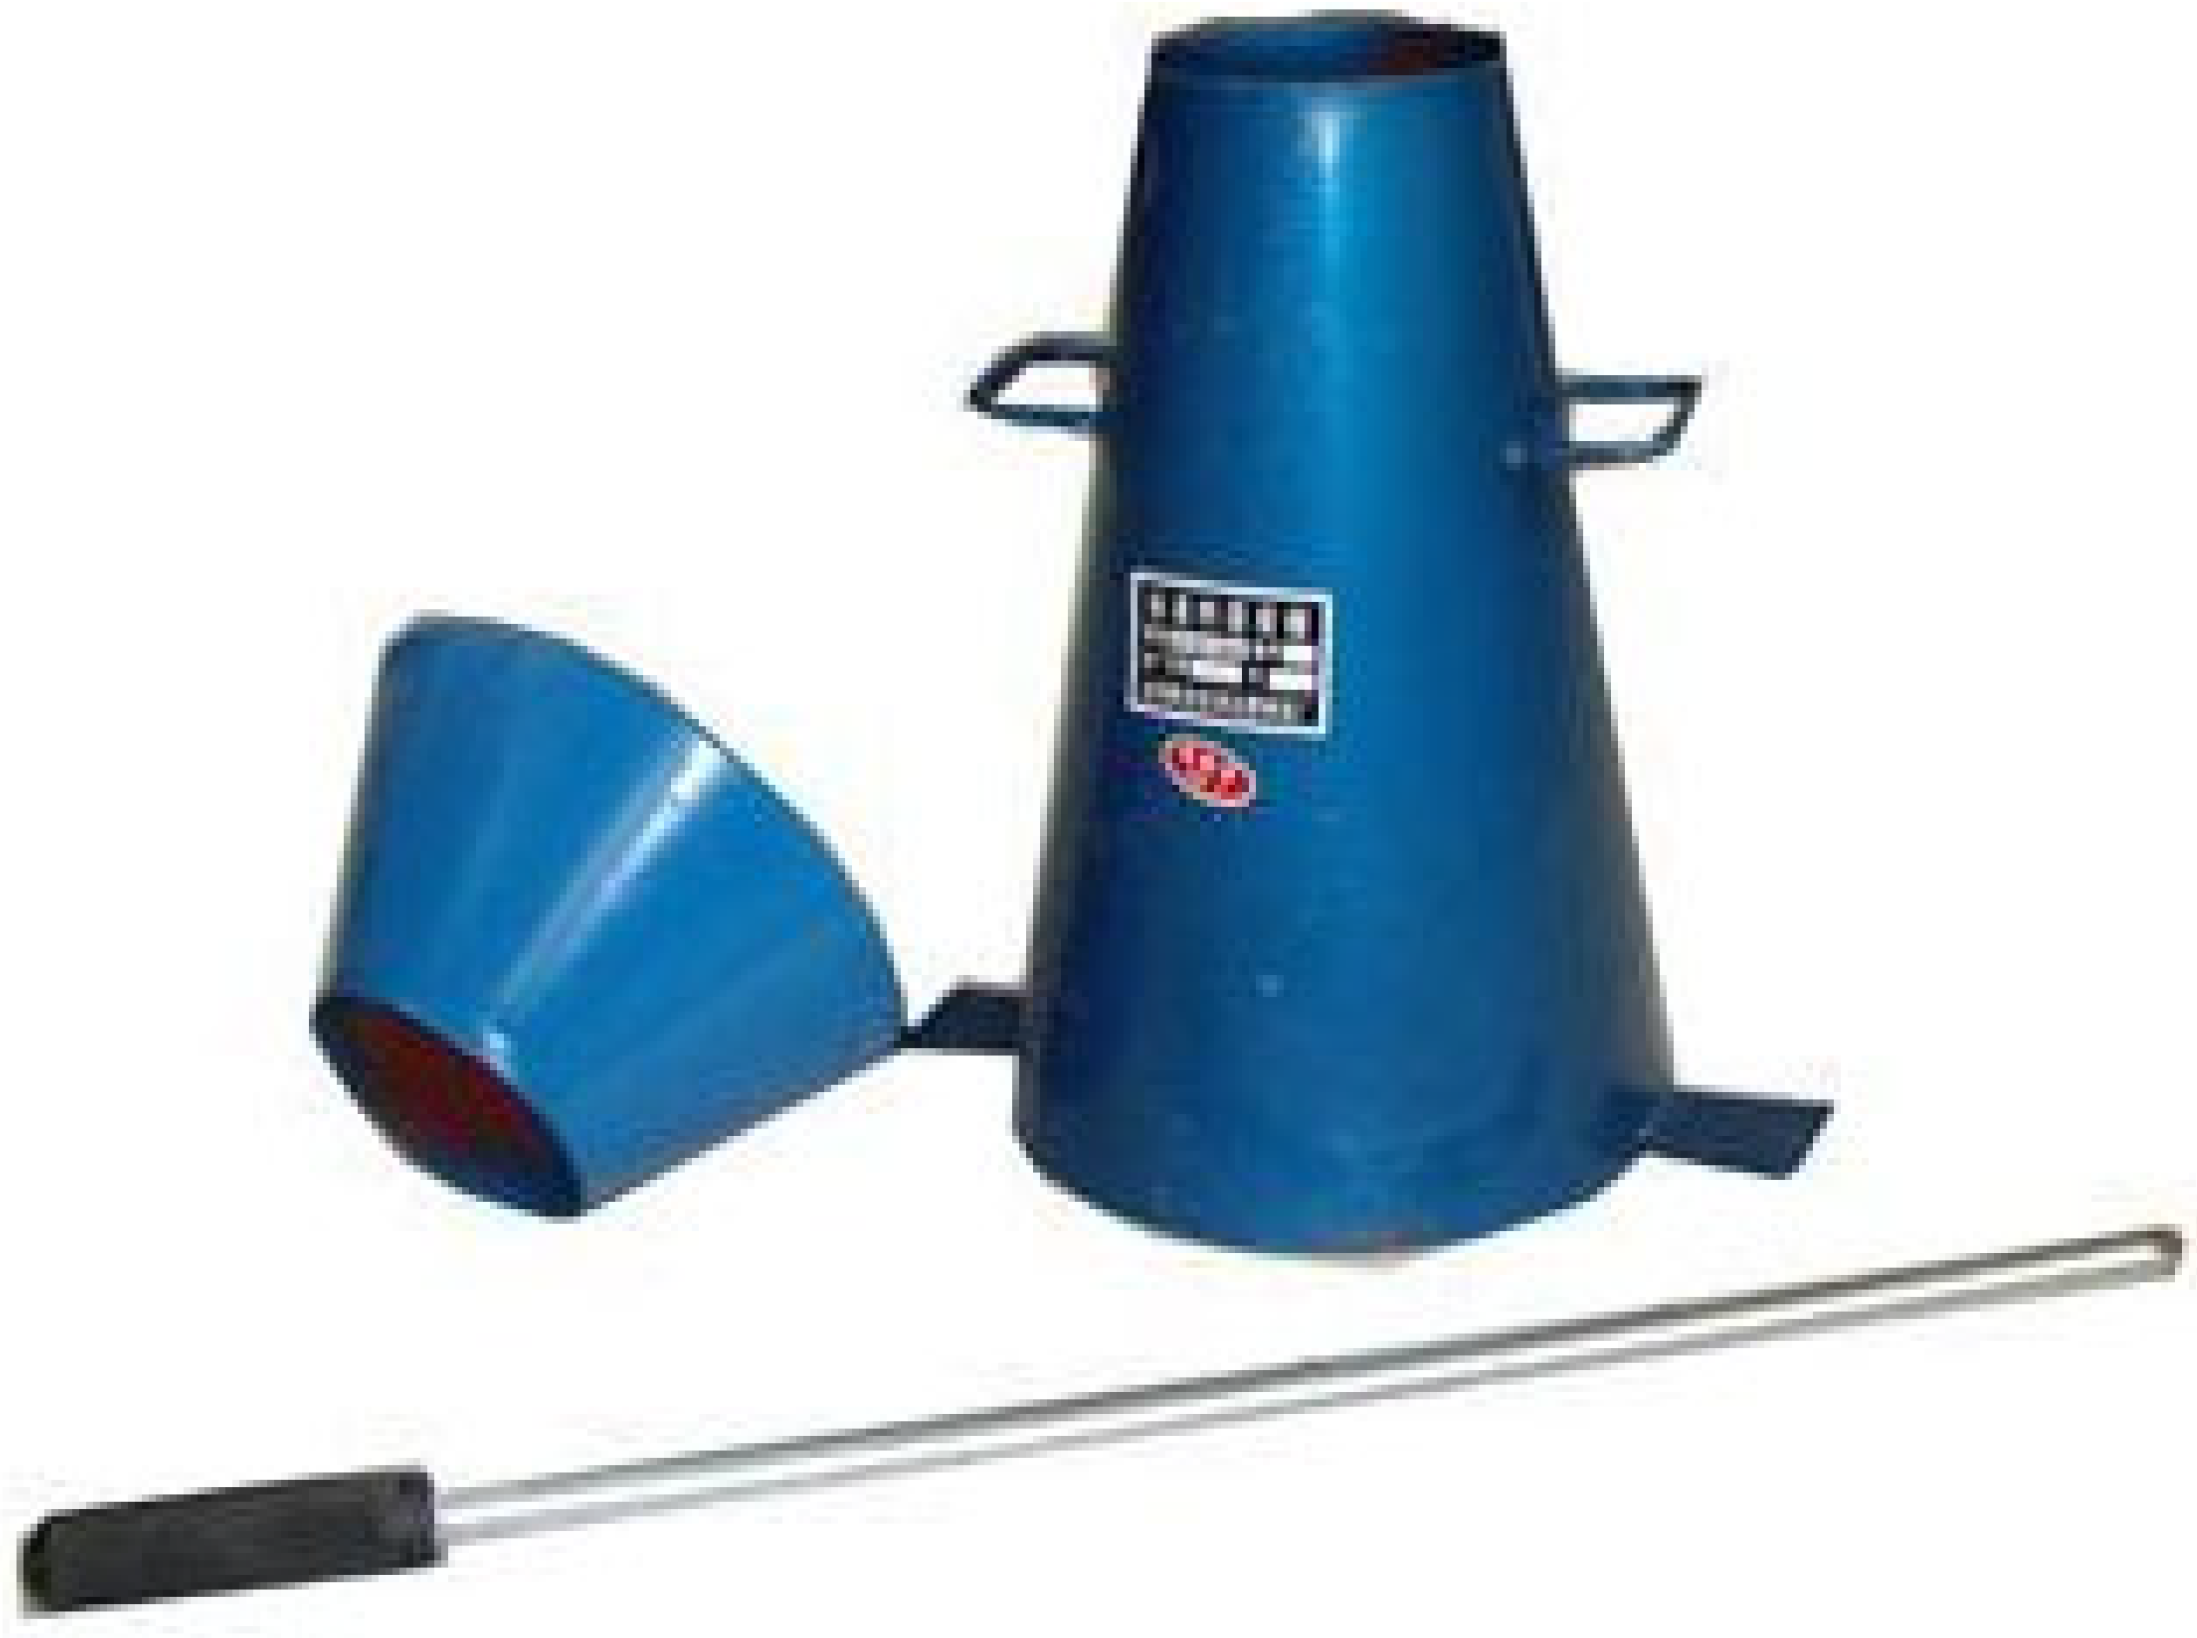
The slump test uses standard test equipment, which is a standard slump tube. Its specifications are: the slump tube, the diameter of the upper mouth is 100 mm, the diameter of the lower mouth is 200 mm, and the height of the tube: 300 mm; Tamper, 16 mm diameter, 650 mm long, steel round bar with hemispherical ends. The slump test device is shown in Figure 10. Each experiment was conducted in 3-5 groups, and the average value of the data of each group was obtained.

4. Results of Soil Improvement Test

The new mud formula is shown in Table 6.

4.1. Experimental Study on Improvement of Pebble/Gravel Soil

Through the qualitative analysis of the applicability of the new type of mud to pebble/gravel and sand, the improvement effect of the new mud soil amendment on the pebble/round gravel soil can be seen, and compared with the mud used in the construction site to determine the superiority of the new mud.
The test conditions are as follows: the amount of soil added is 7.5 L, after the initial test analysis, the amount of mud added was determined to be 18% of the soil volume (1350 mL), after each parameter measurement, the amount of mud added is 2% of the soil volume (150 mL) until the soil reaches the ideal plastic flow state.

4.1.1. Slump Test Design

The test soil is anhydrous round gravel soil, and the soil particle sieving is shown in Table 7.
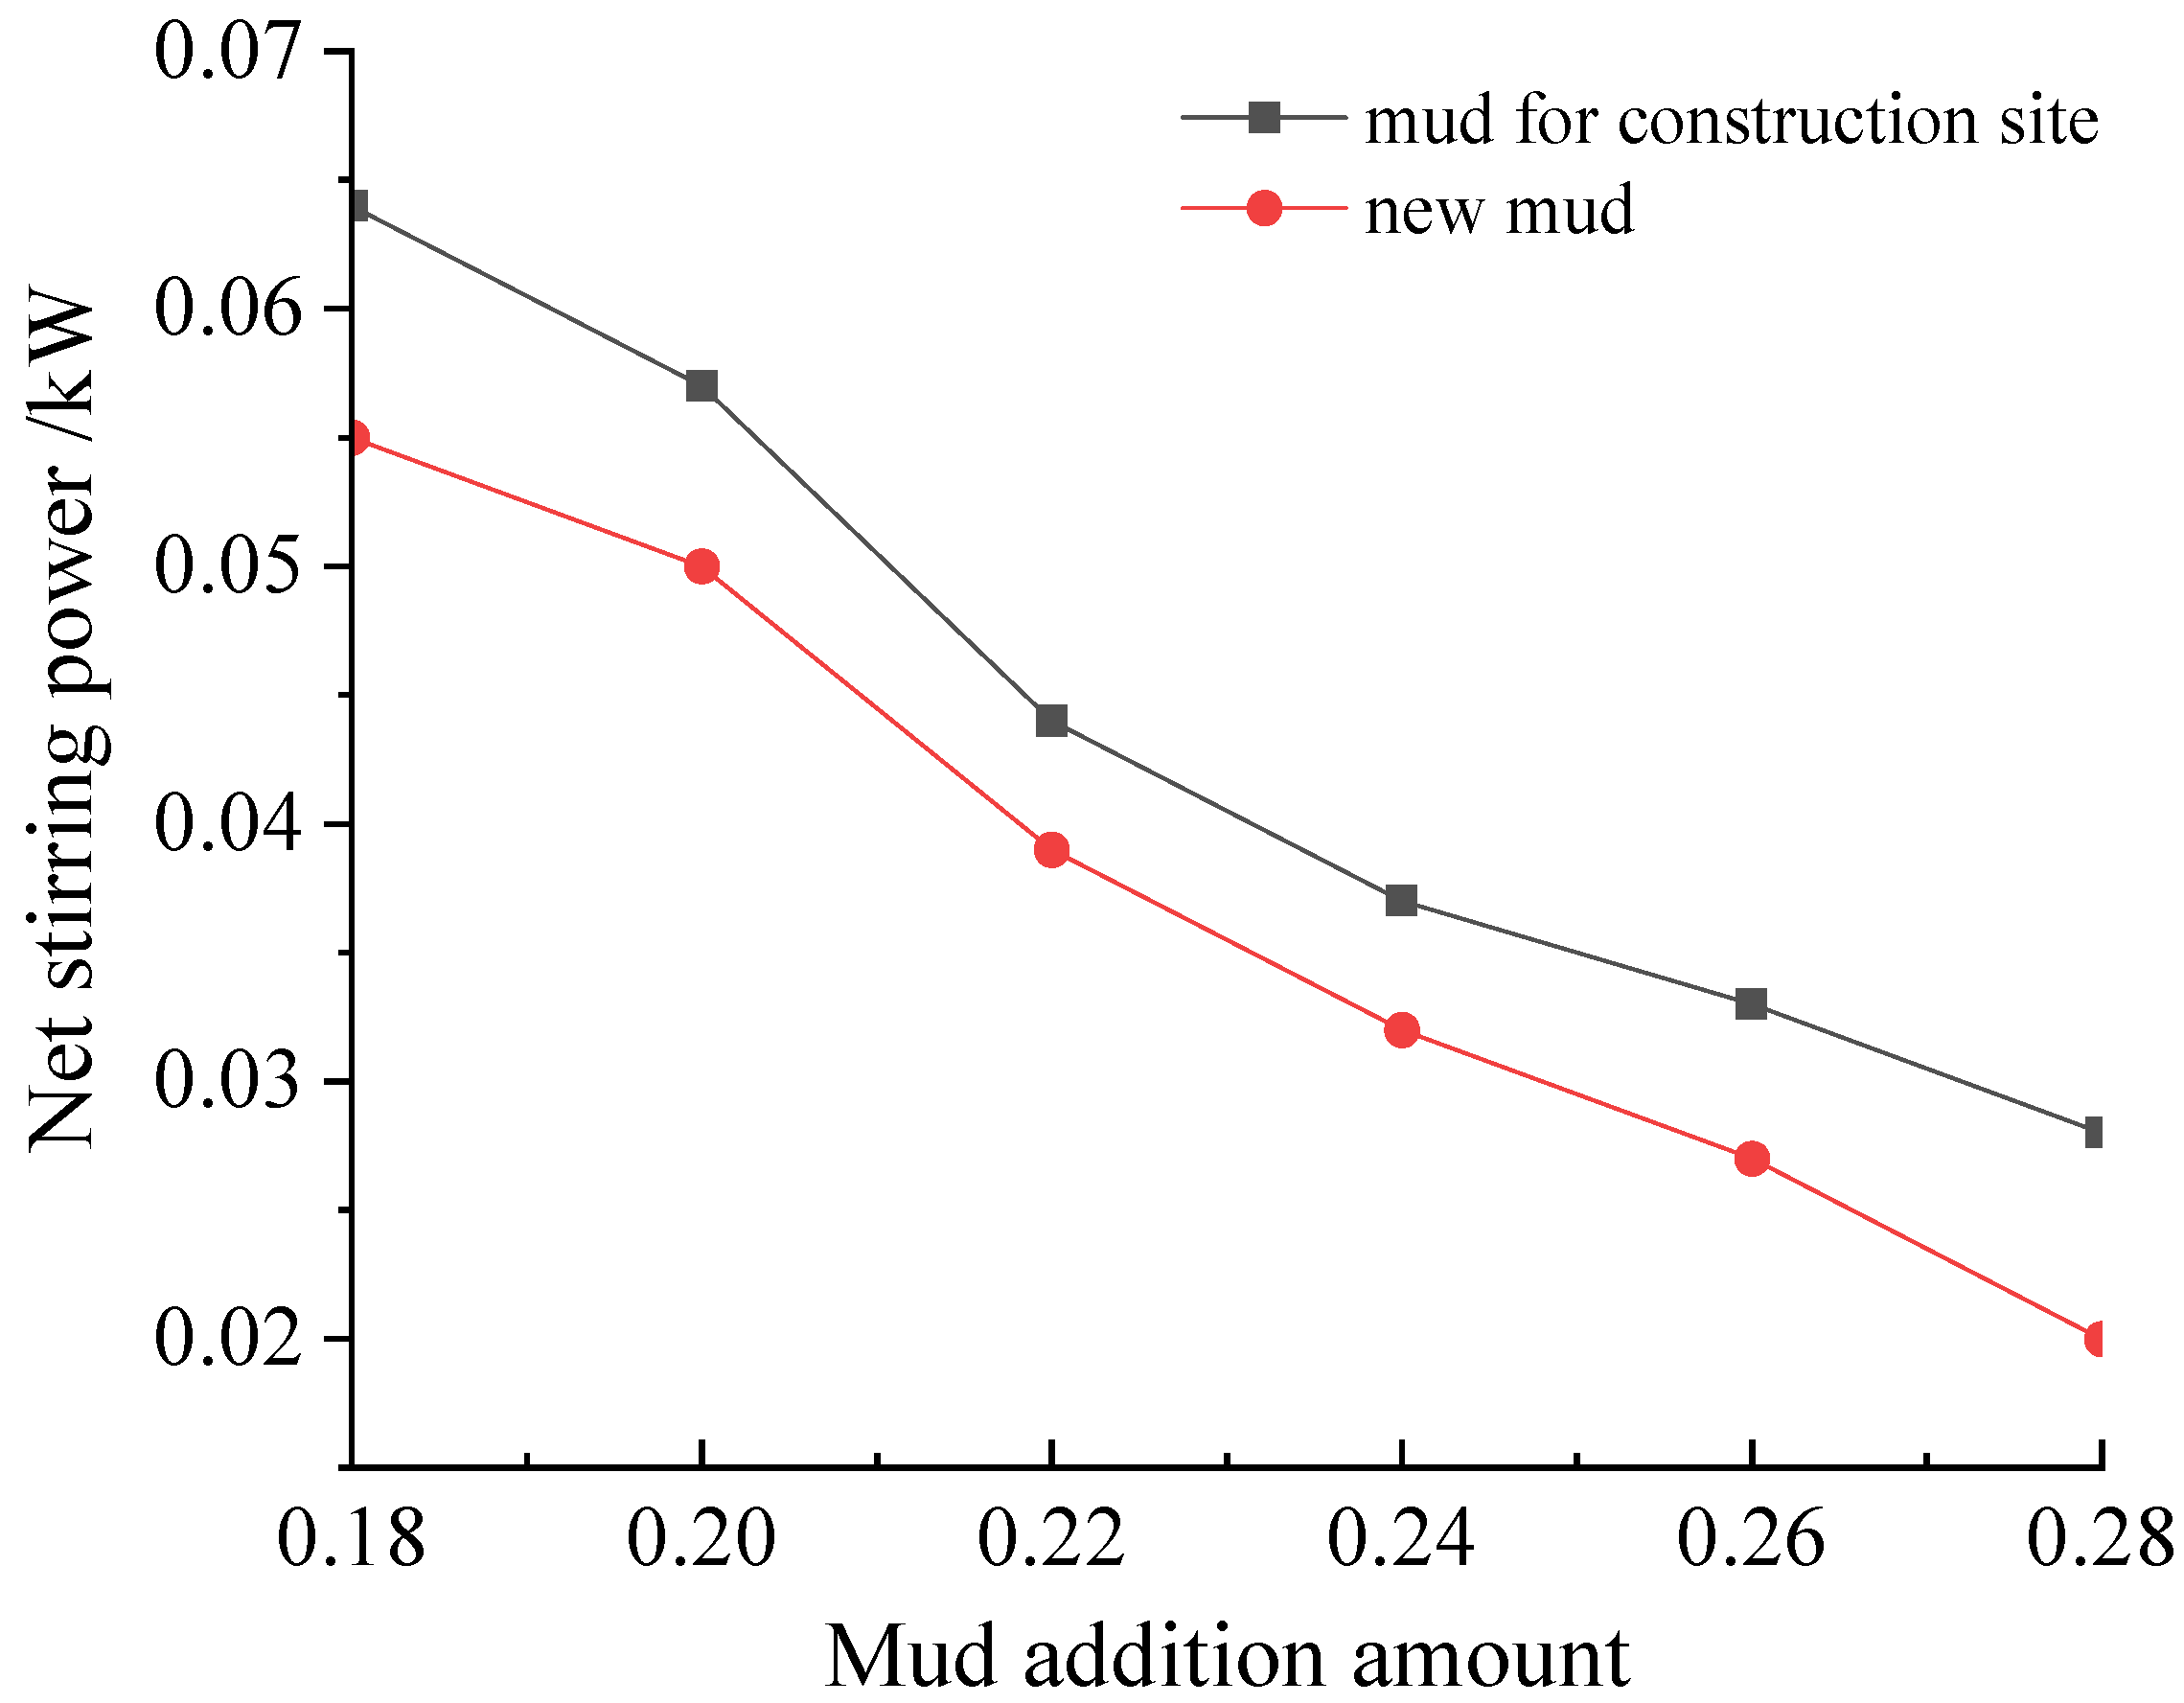
The net power comparison curve is shown in Figure 11.
In Figure 11 above, it can be seen that the net stirring power of the soil is significantly reduced after adding the mud, and the influence of the two kinds of mud on the stirring power is roughly equal. It is found that when the net power is close to 0, the slag is in a better flow-plastic state. The net power of the new mud is smaller than that of the mud used on the construction site, therefore the effect of the new type of mud in reducing stirring power is better than that of the mud used in the construction site.

4.1.2. Friction Coefficient Test

The friction coefficient comparison curve is shown in Figure 12.
Through the comparison of friction coefficients, it can be seen that the friction coefficients tend to increase first and then decrease with the increase in mud addition; when the amount of mud used in the construction site is 26%, the friction coefficient has a maximum value of 0.6. The maximum value is 0.58 when the new mud addition is 22%. It was found in the test that when the friction angle was about 20°, the flow plasticity of the slag was better. When the amount of mud added was 28%, the friction coefficient of the new mud was smaller than that of the land-use mud, therefore, the performance of the new type of mud for improving the coefficient of friction of the muck is better than that of the mud used in the construction site.

4.1.3. Adhesion Resistance Test

The adhesion resistance comparison curve is shown in Figure 13.
It can be seen from the above curve that when the amount of mud added was less than 24%, the adhesion resistance of the slag increased with the increase in the amount of mud added. When the amount of mud added was about 28%, the adhesion resistance coefficient had a low, stable value, and the adhesion resistance coefficient of the new mud was smaller than that of the mud used on the construction site, therefore the new type of mud can better reduce the adhesion resistance coefficient of the muck, which is beneficial to the smooth discharge of the muck.

4.1.4. Slump Test

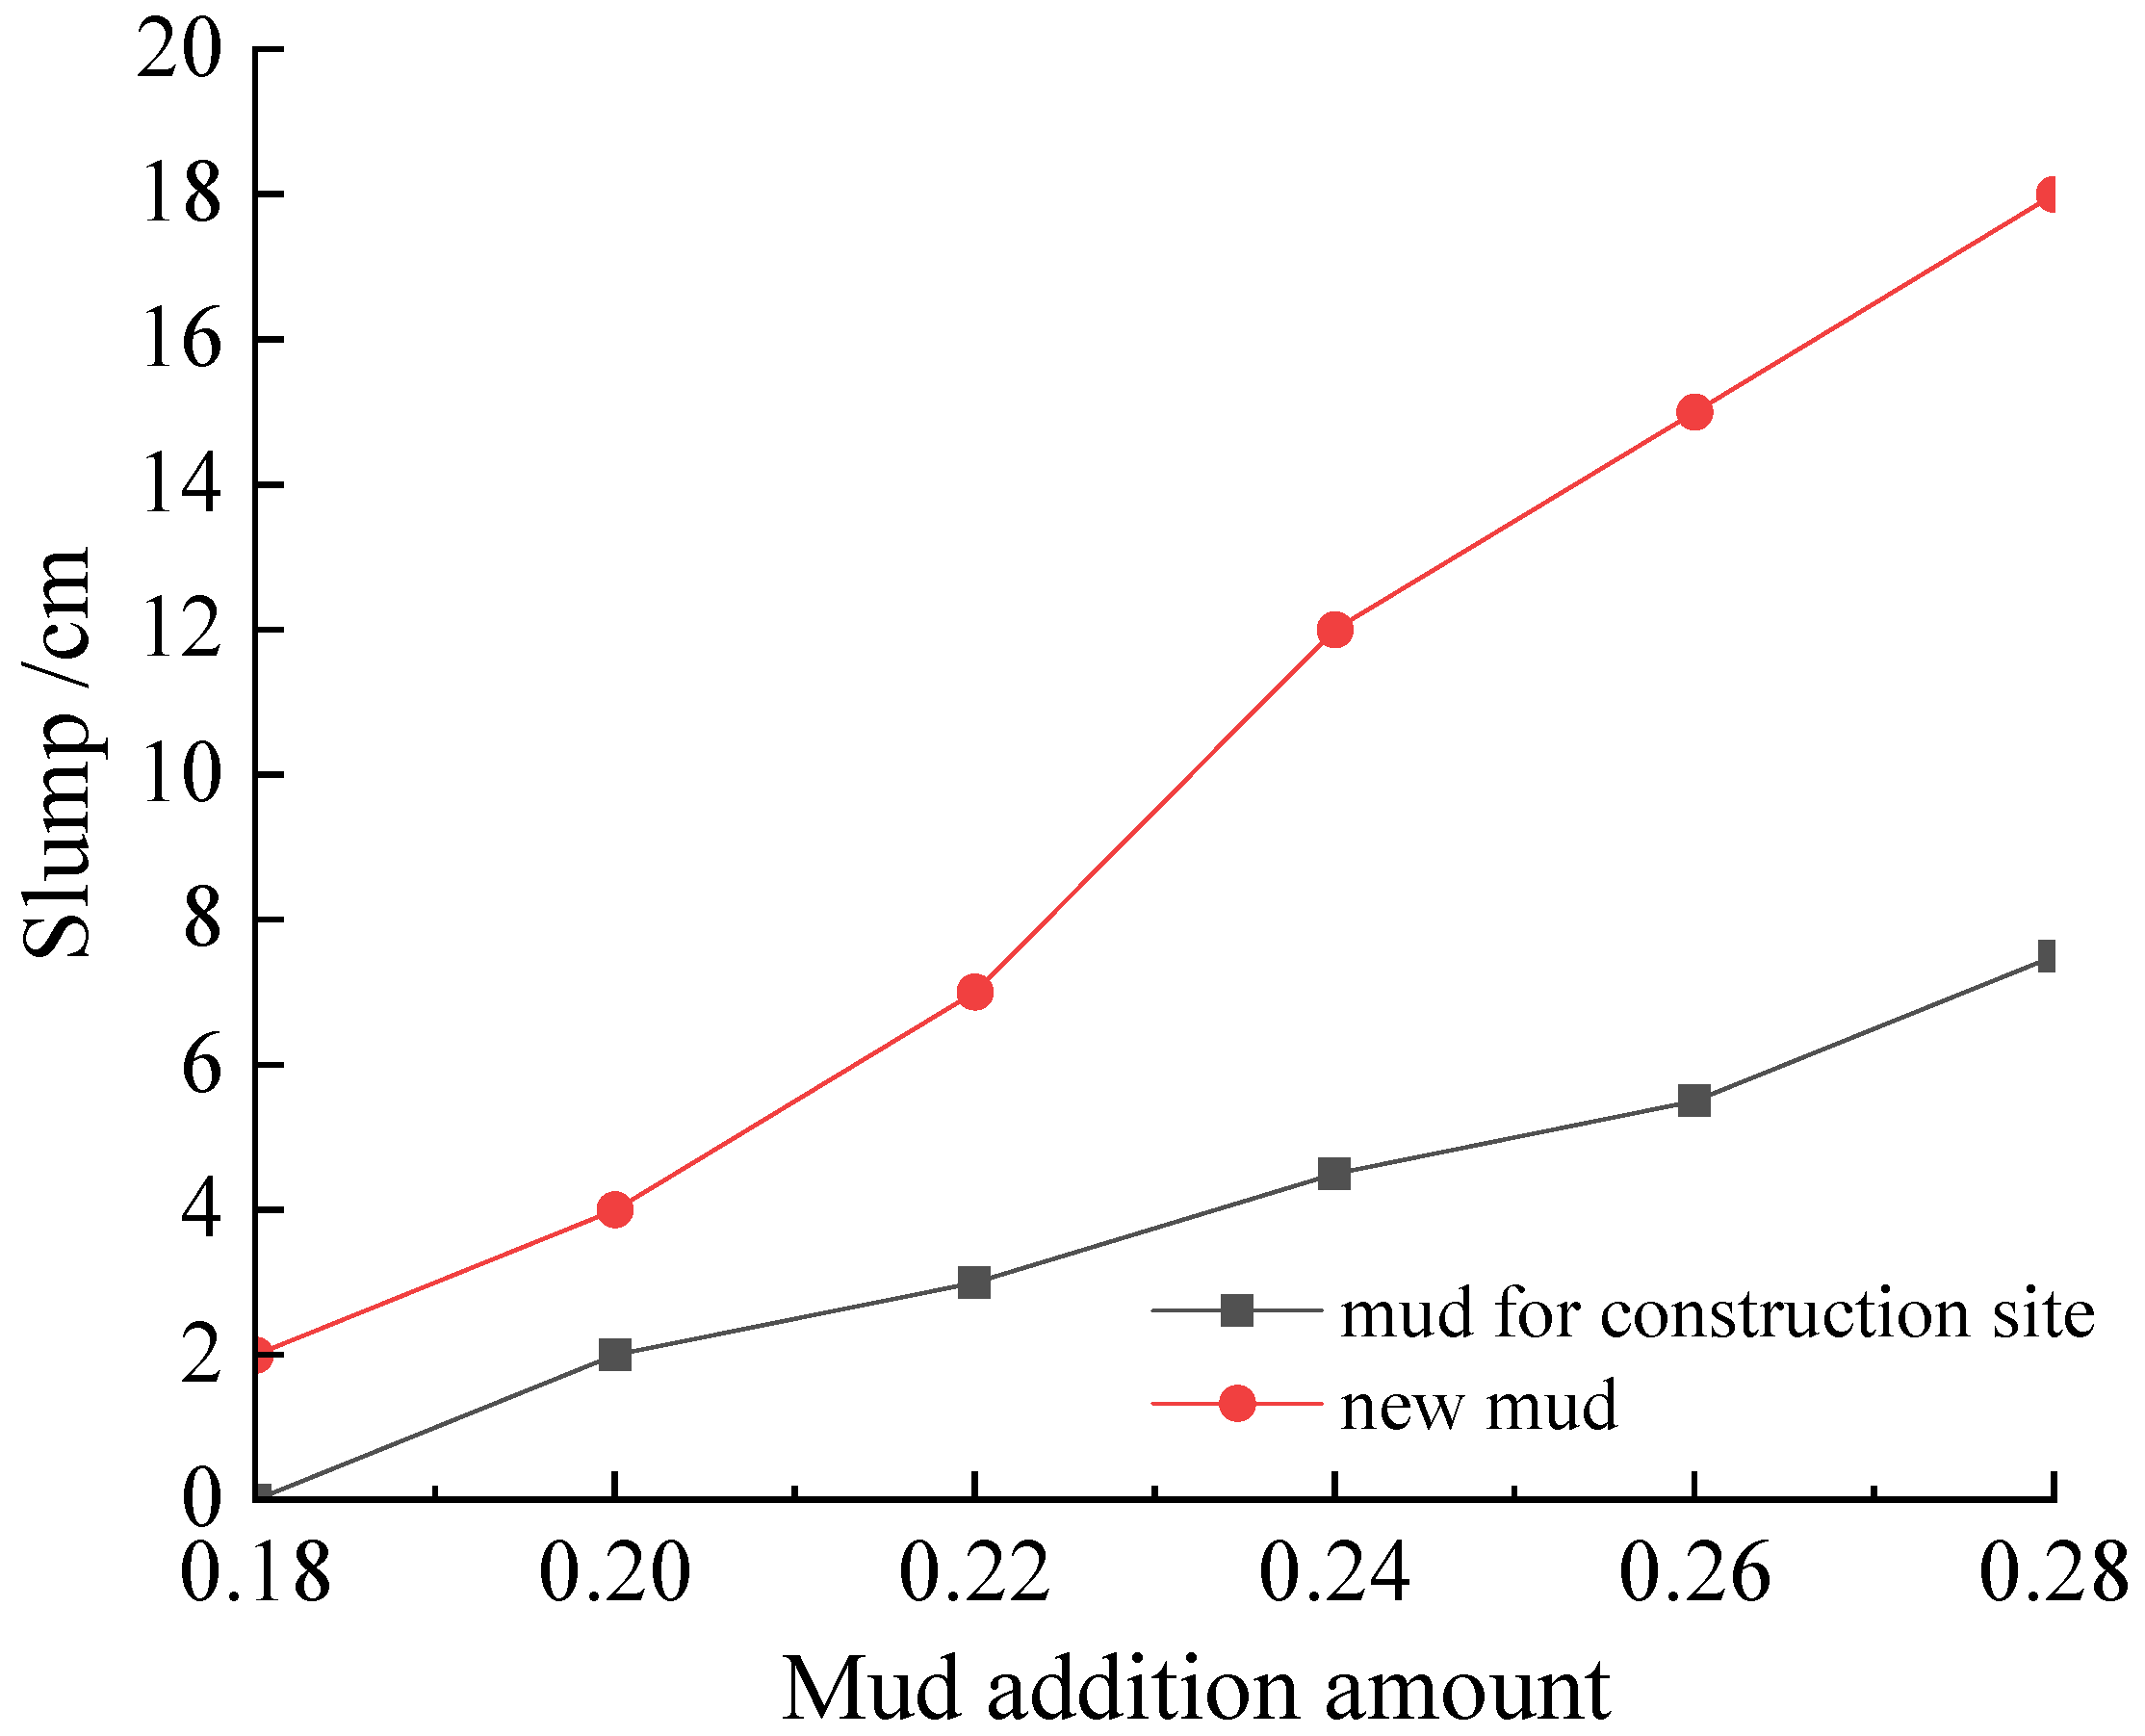
The slump comparison curve is shown in Figure 14.
It can be seen in Figure 14 above that with the increase of the amount of mud added, the slump of the muck increased significantly. When the amount of mud added was 28%, the slump of mud used on site was only 7.5 cm, and the soil slump requirement (12~20 cm) of the earth pressure balance shield was not met, while the slump of the new type of mud is 18 cm, which meets the requirement. Therefore, the new mud was better than the mud used on the construction site for improving the slump of the muck.

4.2. Experimental Study on Sandy Soil Improvement

Through qualitative analysis of the applicability of soil amendment and sandy soil, the applicability relationship between soil amendment and sandy soil was determined.
The soil volume used in the test analysis process was 7.5 L, and the amount of soil amendment added was determined according to the volume of the soil. The test soil was anhydrous sand, and the particle size distribution of the sand is shown in Table 8. After initial experimental analysis, the initial amount of mud added was determined to be 20% of the soil volume (1500 mL): After each parameter measurement, the amount of mud added was 4% of the soil volume (300 mL) until the soil reached the ideal plastic flow state. The following sub-soil improvement test categories were analyzed for the test results.

4.2.1. Sand Mixing Test

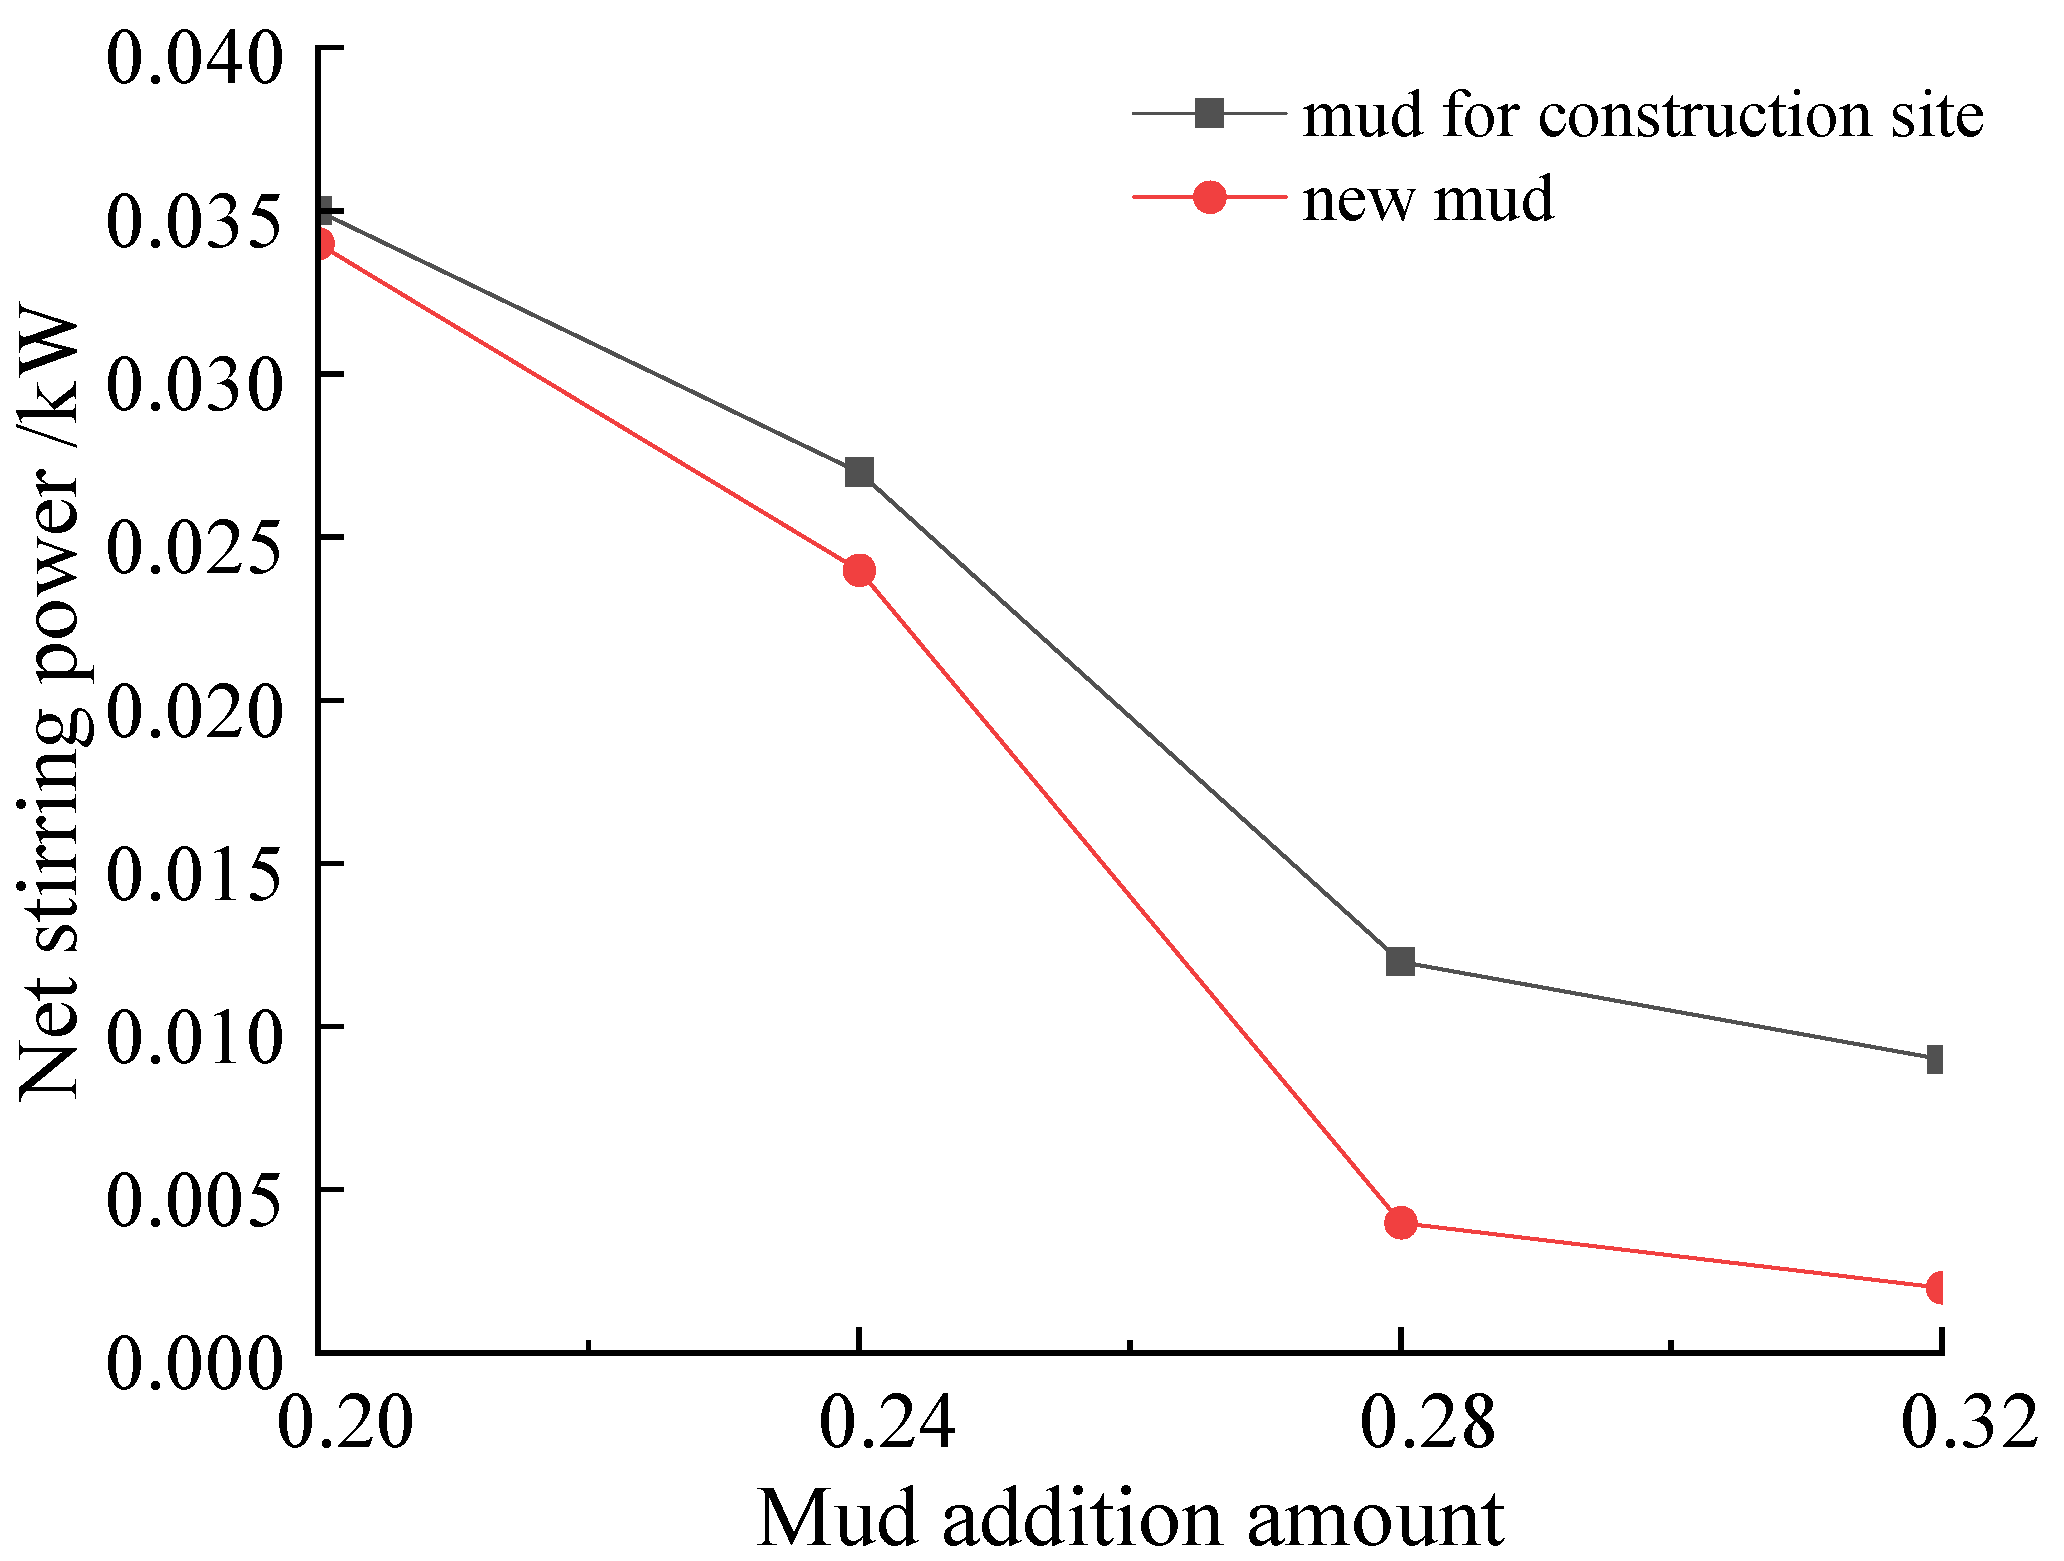
The net power comparison curve is shown in Figure 15.
When mud was added to the sand, the net stirring power was significantly reduced. When the mud addition amount was 32%, the net stirring power of the new mud was 0.002 KW, which means that the sandy soil is in a good fluid plastic state. The net stirring power of the mud used in the construction site was 0.009, significantly higher than the new type of mud, therefore the improved performance of the new mud on sandy soil was better than that of mud used on site.

4.2.2. Sand Friction Coefficient Test

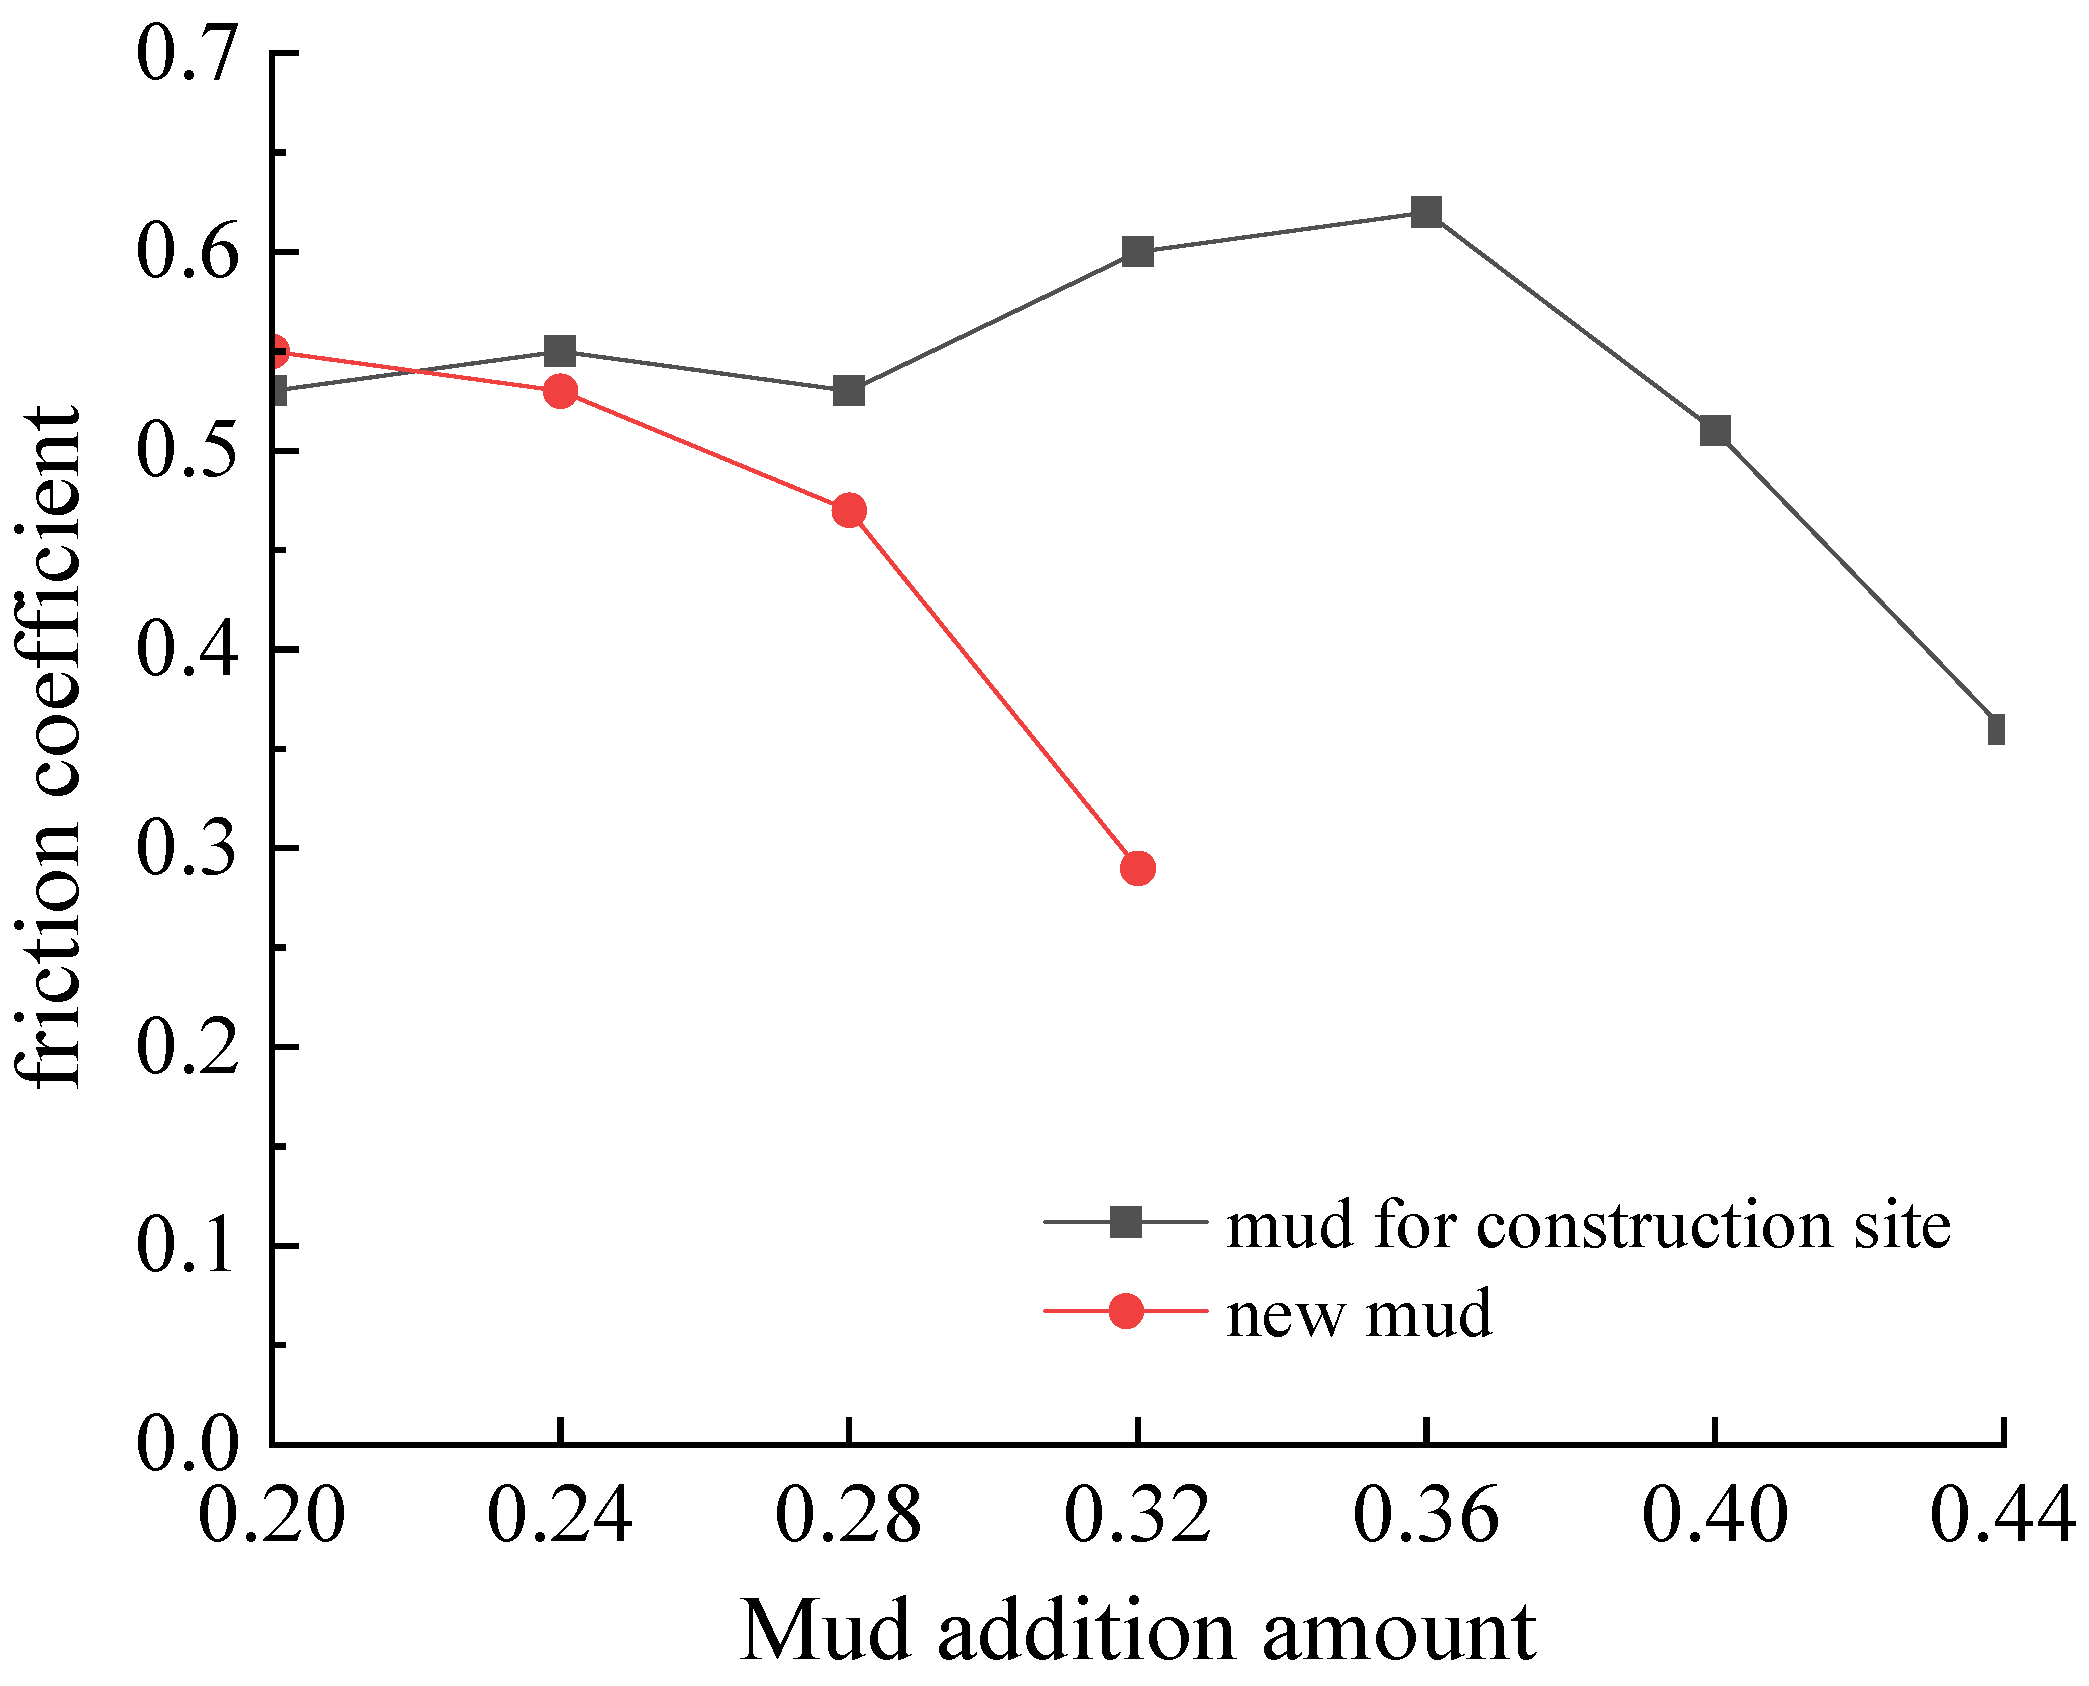
The friction coefficient comparison curve is shown in Figure 16.
As can be seen in Figure 16 above, when the mud addition amount was 32%, the friction coefficient of the new mud was 0.29, which meets the requirements of fluid plasticity. The construction site mud rose to a maximum value of 0.62, and then gradually decreased. When the amount of mud added to the construction site was 44%, the friction coefficient was reduced to 0.36, therefore the new type of mud was superior to the mud used on the construction site.

4.2.3. Sand Adhesion Resistance Test

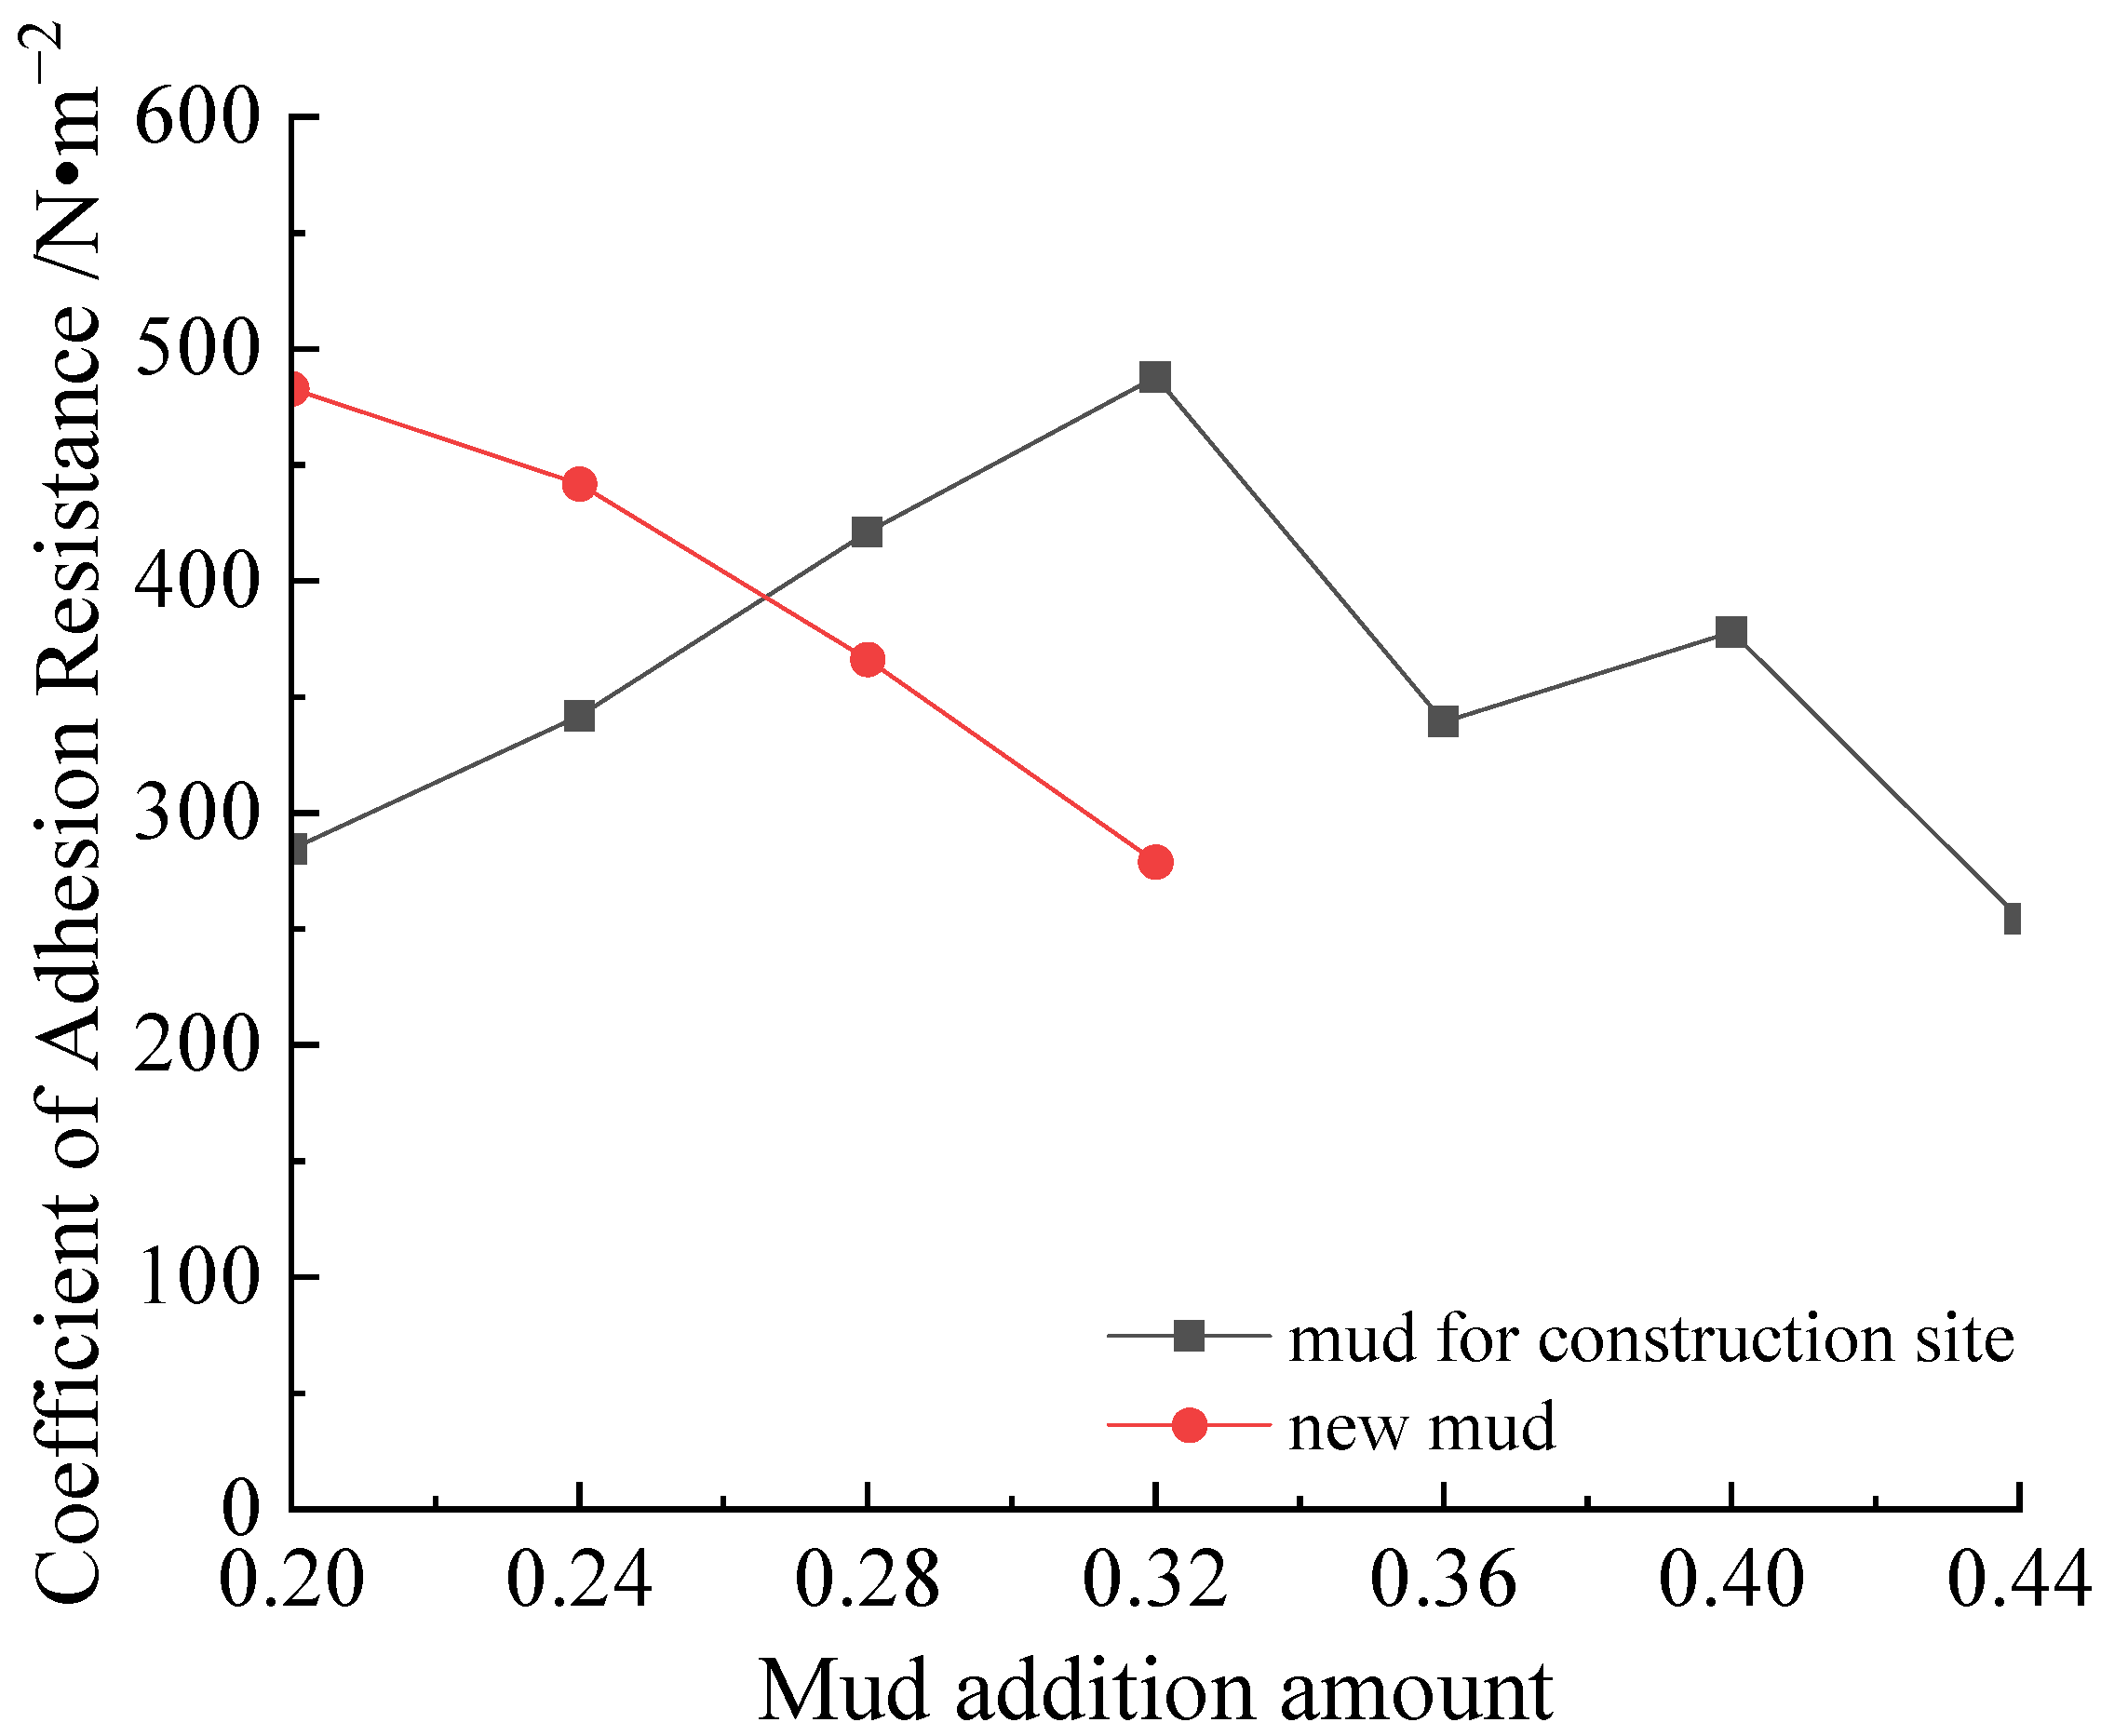
The comparative analysis curve of adhesion resistance is shown in Figure 17.
It can be seen in the above figure that with the increase in the amount of mud added, the sandy soil increases, and the adhesion resistance coefficient first increases and then decreases. After adding the new mud to 20%, the adhesion resistance coefficient began to decrease. When the addition amount is 32%, the mud is in a fluid plastic state. The adhesion resistance reached the maximum value when the amount of mud used in the construction site was 32%; after that, it began to decrease. When the addition amount was 44%, the sand was in a fluid plastic state. Therefore, the improvement effect of the new mud was better than that of the mud used on the construction site.

4.2.4. Sand Slump Test

The slump comparison curve is shown in Figure 18.
From Figure 18 above, it can be seen that the sand slump gradually increased with the increase in the amount of mud. When the amount of new mud was 32%, the slump was 18 cm, which meets the requirements. The slump did not reach 16 cm until the amount of mud used on the construction site was 44%. Therefore, the new mud can effectively improve the sand slump.

5. Conclusions

(i)
Through laboratory tests, the effects of guar gum, CMC, xanthan gum, and polyacrylamide, which are different additives, on the performance of the slurry are analyzed with bentonite as the base slurry. It was found that xanthan gum was the best material to improve the performance of the slurry. The best slurry preparation scheme is 4% bentonite, 0.2% xanthan gum, 0.04% soda ash, and 1% clay particles.
(ii)
Through indoor simulated muck improvement tests (mixing test, slump test, slide plate test, and adhesion resistance test), the improvement effects of applying new mud and ordinary mud in pebble/round gravel and sandy soil layers were compared to verify the superiority of the new mud in the application of the above two kinds of formations.
(iii)
In the soil improvement test, the effect of the new mud was similar to that of ordinary mud. However, it had greater advantages in improving the two parameters of the soil adhesion resistance coefficient and slumps during shield tunneling.
(iv)
When used to improve pebble/round gravel soil, the test showed that when the net power was close to 0, the slag soil was in a good flow plastic state, and the net power of the new mud was less than that of the mud used in the construction site. When the friction angle was about 20°, the flow plasticity of slag was better. When the mud dosage was 28%, the friction coefficient of the new mud was smaller than that of the land mud. When the amount of mud was about 28%, the adhesion resistance coefficient had a low, stable value, and the adhesion resistance coefficient of the new mud was smaller than that of the mud used in the construction site. When the amount of mud added was 28%, the slump of the mud used at the construction site was only 7.5 cm, which cannot meet the requirements of the earth pressure balance shield on the slump of the muck, while the slump of the new mud was 18 cm, which meets the requirements.
(v)
When used to improve the sand, the test found that when the amount of mud added was 32%, the net mixing power of the new mud was 0.002 KW, indicating that the sand was in a good flow plastic state, while the net mixing power of the mud used at the construction site is 0.009, which is significantly greater than the new mud. When the amount of mud added was 32%, the friction coefficient of the new mud was 0.29, which meets the requirements of flow plasticity. The site mud rose to the maximum value of 0.62, and then the friction coefficient decreased to 0.36 as the amount of mud added reached 44%. When the new mud dosage was 32%, the mud was in the flow plastic state, while when the mud dosage was 32%, the adhesion resistance reached the maximum value, and when the mud dosage reached 44%, the sand was in the flow plastic state. When the dosage of new mud was 32%, the slump was 18 cm, meeting the requirements. When the amount of mud used at the construction site was 44%, the slump reached 16 cm.
(vi)
The new mud addition ratio was 28% for improved pebble/round gravel soil, and 32% for improved sand and clay. By comparison, it can be seen that the new mud is more suitable for improved pebble/round gravel soil and meets the requirements for the improvement of sandy pebble stratum.

Author Contributions

Data curation, D.Z.; Writing—original draft, Y.S.; Writing—review and editing, Y.S.; Supervision, D.Z.; Project administration, D.Z. All authors have read and agreed to the published version of the manuscript.

Funding

This research received no external funding.

Institutional Review Board Statement

Not applicable.

Informed Consent Statement

Not applicable.

Data Availability Statement

All data that support the findings of this study are available from the corresponding author upon reasonable request.

Conflicts of Interest

The authors declare no conflict of interest.

References

  1. He, C.; Feng, K.; Fang, Y. Review and prospects on constructing technologies of metro tunnels using shield tunnelling method. J. Southwest Jiaotong Univ. 2015, 50, 97–109. [Google Scholar]
  2. Qingke, N.; Guang, S.; Siyuan, G.; Hongtao, L.; Lichao, Z.; Jianpeng, H. Disturbance Process of Sandy Gravel Stratum Caused by Shield Tunneling and Ground Settlement Analysis. Front. Earth Sci. 2021, 9, 994. [Google Scholar] [CrossRef]
  3. Hasheminezhad, A.; Farzalizadeh, R.; Rahimi, H.; Bahadori, H. Seismic performance assessment of wall-type gravel and rubber drains in liquefaction mitigation of sands. Bull. Earthq. Eng. 2022, 20, 3699–3714. [Google Scholar] [CrossRef]
  4. Zhao, J.S.; Jiang, Q.; Lu, J.F.; Chen, B.R.; Pei, S.F.; Wang, Z.L. Rock fracturing observation based on microseismic monitoring and borehole imaging: In situ investigation in a large underground cavern under high geostress. Tunn. Undergr. Space Technol. 2022, 126, 104549. [Google Scholar] [CrossRef]
  5. Chen, Z.T.; Bezuijen, A.; Fang, Y.; Wang, K.; Deng, R.Y. Experimental study and field validation on soil clogging of EPB shields in completely decomposed granite. Tunn. Undergr. Space Technol. 2022, 120, 104300. [Google Scholar] [CrossRef]
  6. Wang, H.B.; Wang, S.Y.; Zhong, J.Z.; Qu, T.M.; Liu, Z.R.; Xu, T.; Liu, P.F. Undrained compressibility characteristics and pore pressure calculation model of foam-conditioned sand. Tunn. Undergr. Space Technol. 2021, 118, 104161. [Google Scholar] [CrossRef]
  7. Farzalizadeh, R.; Hasheminezhad, A.; Bahadori, H. Shaking table tests on wall-type gravel and rubber drains as a liquefaction countermeasure in silty sand. Geotext. Geomembr. 2021, 49, 1483–1494. [Google Scholar] [CrossRef]
  8. Dai, C.Q.; Sui, H.T.; Ma, C. Study on the Ultimate Supporting Force of Shield Excavation Face Based on Anisotropic Strength Theory. Appl. Sci. 2020, 10, 5222. [Google Scholar] [CrossRef]
  9. Hasheminezhad, A.; Bahadori, H. Seismic response of shallow foundations over liquefiable soils improved by deep soil mixing columns. Comput. Geotech. 2019, 110, 251–273. [Google Scholar] [CrossRef]
  10. Zhao, J.S.; Chen, B.R.; Jiang, Q.; Lu, J.F.; Hao, X.J.; Pei, S.F.; Wang, F. Microseismic Monitoring of Rock Mass Fracture Response to Blasting Excavation of Large Underground Caverns Under High Geostress. Rock Mech. Rock Eng. 2022, 55, 733–750. [Google Scholar] [CrossRef]
  11. Liang, X.; Ye, F.; Ouyang, A.H.; Han, X.; Qin, X.Z. Theoretical Analyses of the Stability of Excavation Face of Shield Tunnel in Lanzhou Metro Crossing beneath the Yellow River. Int. J. Geomech. 2020, 20, 04020200. [Google Scholar] [CrossRef]
  12. Sui, H.T.; Ma, C.; Dai, C.Q.; Yang, T.Z. Study on Stability of Shield Tunnel Excavation Face in Soil-Rock Composite Stratum. Math. Probl. Eng. 2021, 2021, 5579103. [Google Scholar] [CrossRef]
  13. Huang, X.; Li, L.F.; Zhang, C.F.; Liu, B.; Li, K.J.; Shi, H.B.; Jing, B.Y. Multi-Step Combined Control Technology for Karst and Fissure Water Inrush Disaster During Shield Tunneling in Spring Areas. Front. Earth Sci. 2021, 9, 795457. [Google Scholar] [CrossRef]
  14. Liu, P.F.; Wang, S.Y.; Ge, L.; Thewes, M.; Yang, J.S.; Xia, Y.M. Changes of Atterberg limits and electrochemical behaviors of clays with dispersants as conditioning agents for EPB shield tunnelling. Tunn. Undergr. Space Technol. 2018, 73, 244–251. [Google Scholar] [CrossRef]
  15. Liu, W.; Shi, P.X.; Yu, M.; Jia, P.J. Analysis of working face stability during obstruction removal from a box tunnel machine. Acta Geotech. 2022, 17, 4627–4639. [Google Scholar] [CrossRef]
  16. Zizka, Z.; Schoesser, B.; Thewes, M. Investigations on the transient support pressure transfer at the tunnel face during slurry shield drive Part 2: Case B-Deep slurry penetration exceeds tool cutting depth. Tunn. Undergr. Space Technol. 2021, 118, 104169. [Google Scholar] [CrossRef]
  17. Newton, R.C. A Geo-Experimental Diagram for Garnet Amphibolite and Its Bearing on the Origin of Continents. J. Geol. 2018, 126, 531–539. [Google Scholar] [CrossRef]
  18. Tomiczek, T.; Prasetyo, A.; Mori, N.; Yasuda, T.; Kennedy, A. Physical modelling of tsunami onshore propagation, peak pressures, and shielding effects in an urban building array. Coast. Eng. 2016, 117, 97–112. [Google Scholar] [CrossRef] [Green Version]
  19. Zhu, C.H.; Wang, S.H.; Peng, S.; Song, Y.L. Surface settlement in saturated loess stratum during shield construction: Numerical modeling and sensitivity analysis. Tunn. Undergr. Space Technol. 2022, 119, 104205. [Google Scholar] [CrossRef]
  20. Yu, H.J.; Mooney, M.; Bezuijen, A. A simplified excavation chamber pressure model for EPBM tunneling. Tunn. Undergr. Space Technol. 2020, 103, 103457. [Google Scholar] [CrossRef]
  21. Cui, G.; Cui, J.; Fang, Y.; Chen, Z.T.; Wang, H.W. Scaled model tests on segmental linings of shield tunnels under earth and water pressures. Int. J. Phys. Model. Geotech. 2020, 20, 338–354. [Google Scholar] [CrossRef]
  22. Wang, S.Y.; Huang, S.; Zhong, J.Z.; Zhang, S.; Hu, Q.X.; Qu, T.M.; Ye, X.Y. Permeability stability calculation model of foam-conditioned soil based on the permeability constant. Int. J. Numer. Anal. Methods Geomech. 2021, 45, 540–559. [Google Scholar] [CrossRef]
  23. Zhang, P.; Chen, R.P.; Wu, H.N.; Liu, Y. Ground settlement induced by tunneling crossing interface of water-bearing mixed ground: A lesson from Changsha, China. Tunn. Undergr. Space Technol. 2020, 96, 103224. [Google Scholar] [CrossRef]
  24. Lee, H.; Kim, D.Y.; Shin, D.; Oh, J.; Choi, H. Effect of foam conditioning on performance of EPB shield tunnelling through laboratory excavation test. Transp. Geotech. 2022, 32, 100692. [Google Scholar] [CrossRef]
  25. Qu, T.M.; Wang, S.Y.; Hu, Q.X. Coupled Discrete Element-Finite Difference Method for Analysing Effects of Cohesionless Soil Conditioning on Tunneling Behaviour of EPB Shield. KSCE J. Civ. Eng. 2019, 23, 4538–4552. [Google Scholar] [CrossRef]
  26. Kou, L.; Zhao, J.J.; Miao, R.H.; Lian, F.L. Experimental Study on Dynamic Mechanical Characteristics of Mud Slurry Penetrating into Excavation Surface of Large Diameter Slurry Shield. Arab. J. Sci. Eng. 2022, 47, 13139–13150. [Google Scholar] [CrossRef]
  27. Ling, F.L.; Wang, S.Y.; Hu, Q.X.; Huang, S.; Feng, Z.Y. Effect of bentonite slurry on the function of foam for changing the permeability characteristics of sand under high hydraulic gradients. Can. Geotech. J. 2022, 59, 1061–1070. [Google Scholar] [CrossRef]
  28. Huang, Z.Q.; Wang, C.; Dong, J.Y.; Zhou, J.J.; Yang, J.H.; Li, Y.W. Conditioning experiment on sand and cobble soil for shield tunneling. Tunn. Undergr. Space Technol. 2019, 87, 187–194. [Google Scholar] [CrossRef]
  29. Liang, Y.; Huang, X.M.; Gao, S.J.; Yin, Y.H. Study on the Floating of Large Diameter Underwater Shield Tunnel Caused by Synchronous Grouting. Geofluids 2022, 2022, 2041924. [Google Scholar] [CrossRef]
  30. Qian, Y.J.; Min, F.L.; Mo, Z.Z.; Fan, X.H. Experimental Study of the Influence of Excavation Surface Stability and Sand Flowability Caused by Dense Slurry-Earth Pressure Balance Shield Tunneling in Silty Sand Stratum. Adv. Civ. Eng. 2020, 2020, 8883190. [Google Scholar] [CrossRef]
  31. Shevtsov, A.N.; Zhamaletdinov, A.A. Temperature and Rheological Parameters of the Baltic Shield Lithosphere from Electromagnetic Sounding Results. Izv. Atmos. Ocean. Phys. 2021, 57, 712–728. [Google Scholar] [CrossRef]
  32. Yang, Z.Y.; Yang, X.; Ding, Y.J.; Jiang, Y.S.; Shao, X.K.; Qi, W.Q.; Liu, N. Effect of Soil Conditioning on Saturated Sand Layers in EPB Shields: A Microstructural Analysis Based on CT Scanning and SEM. Arab. J. Sci. Eng. 2022, 47, 12387–12397. [Google Scholar] [CrossRef]
  33. Zhen, Z.; Ge, X.S.; Zhang, J. Soil Conditioning Tests on Sandy and Cobbly Soil for Shield Tunneling. KSCE J. Civ. Eng. 2021, 25, 1229–1238. [Google Scholar] [CrossRef]
  34. Milligan, G. Lubrication and Soil Conditioning in Tunnelling, Pipe Jacking and Microtunnelling: A State-of-the-Art Review; Geotechnical Consulting Group: London, UK, 2000. [Google Scholar]
  35. Wang, S.Y.; Liu, P.F.; Hu, Q.X.; Zhong, J.Z. Effect of dispersant on the tangential adhesion strength between clay and metal for EPB shield tunnelling. Tunn. Undergr. Space Technol. 2020, 95, 103144. [Google Scholar] [CrossRef]
  36. Zhao, S.S.; Li, S.C.; Wan, Z.; Wang, X.W.; Wang, M.L.; Yuan, C. Effects of anti-clay agents on bubble size distribution and stability of aqueous foam under pressure for earth pressure balance shield tunneling. Colloid Interface Sci. Commun. 2021, 42, 100424. [Google Scholar] [CrossRef]
  37. Wang, S.M.; Lu, X.X.; Wang, X.M.; He, C.; Xia, X.; Ruan, L.; Jian, Y.Q. Soil Improvement of EPBS Construction in High Water Pressure and High Permeability Sand Stratum. Adv. Civ. Eng. 2019, 2019, 4503219. [Google Scholar] [CrossRef] [Green Version]
  38. Zhu, H.H.; Cheng, P.P.; Zhuang, X.Y.; Li, Y.H.; Li, P.N. Assessment and and structural improvement on the performance of soil chamber system of EPB shield assisted with DEM modeling. Tunn. Undergr. Space Technol. 2020, 96, 103092. [Google Scholar] [CrossRef]
  39. Lee, H.; Choi, H.; Choi, S.W.; Chang, S.H.; Kang, T.H.; Lee, C. Numerical Simulation of EPB Shield Tunnelling with TBM Operational Condition Control Using Coupled DEM-FDM. Appl. Sci. 2021, 11, 2551. [Google Scholar] [CrossRef]
  40. Liu, B.; Li, T.; Han, Y.H.; Li, D.Y.; He, L.L.; Fu, C.Q.; Zhang, G. DEM-continuum mechanics coupling simulation of cutting reinforced concrete pile by shield machine. Comput. Geotech. 2022, 152, 105036. [Google Scholar] [CrossRef]
  41. Wu, L.; Qu, F.Z. Discrete element simulation of mechanical characteristic of conditioned sands in earth pressure balance shield tunneling. J. Cent. South Univ. Technol. 2009, 16, 1028–1033. [Google Scholar] [CrossRef]
  42. Cheng, C.; Liao, S.; Chen, L.; Fan, M.; Huo, X.; University, T. Experiments of Soil Conditioning for Shield Tunneling in Watery Quartz Sand-Gravel Ground. J. Shanghai Jiaotong Univ. 2018, 52, 1492. [Google Scholar]
  43. Shu-chao, Z.; Shao-hui, H.; Zi-peng, Z.; Cheng-hui, L. Research on soil conditioning for earth pressure balance shield tunneling in Lanzhou sandy pebble strata with rich water. Rock Soil Mech. 2017, 38, 279–286. [Google Scholar]
  44. Jiang, H.; Gong, Q.; Du, X. Experimental study on soil conditioning in cobble layer by use of earth pressure balanced machine. Chin. J. Geotech. Eng. 2013, 35, 284–292. [Google Scholar]
  45. Lee, H.Y.B.; Kwak, J.; Choi, J.; Hwang, B.; Choi, H. A lab-scale experimental approach to evaluate rheological properties of foam-conditioned soil for EPB shield tunnelling. Tunn. Undergr. Space Technol. 2022, 128, 104667. [Google Scholar] [CrossRef]
  46. Zhao, S.S.; Li, S.C.; Wan, Z.; Wang, M.L. Dispersant for Reducing Mud Cakes of Slurry Shield Tunnel Boring Machine in Sticky Ground. Adv. Mater. Sci. Eng. 2021, 2021, 5524489. [Google Scholar] [CrossRef]
  47. Xiao, C.; Tan, L.; Chen, R.; Zhong, Z.; Yang, J. Dynamic coupling simulation of shield construction mechanics considering characteristics of soils. Chin. J. Geotech. Eng. 2019, 41, 1108–1115. [Google Scholar]
  48. Xu, Q.W.; Zhang, L.Y.; Zhu, H.H.; Gong, Z.Y.; Liu, J.G.; Zhu, Y.H. Laboratory tests on conditioning the sandy cobble soil for EPB shield tunnelling and its field application. Tunn. Undergr. Space Technol. 2020, 105, 103512. [Google Scholar] [CrossRef]
  49. Li, L.P.; Sun, S.Q.; Wang, J.; Yang, W.M.; Song, S.G.; Fang, Z.D. Experimental study of the precursor information of the water inrush in shield tunnels due to the proximity of a water-filled cave. Int. J. Rock Mech. Min. Sci. 2020, 130, 104320. [Google Scholar] [CrossRef]
  50. Wang, L.; Zhu, W.; Qian, Y.J.; Xu, C.; Hu, J.N.; Xing, H.T. Phenomenon and Critical Conditions of Chamber Soil Sliming during EPB Shield Tunneling in Water-Rich Weathered Diorite: Case Study of Jinan Metro, China. Adv. Civ. Eng. 2020, 2020, 6530832. [Google Scholar] [CrossRef]
  51. Wei, Y.J.; Zheng, X.; Su, F.; Li, M.M.; Li, F.; Yang, Y.Y. Evaluation of Cutting Tool Wear of Earth Pressure Balance Shield in Granular Soil Based on Laboratory Test. J. Test. Eval. 2019, 47, 927–941. [Google Scholar] [CrossRef]
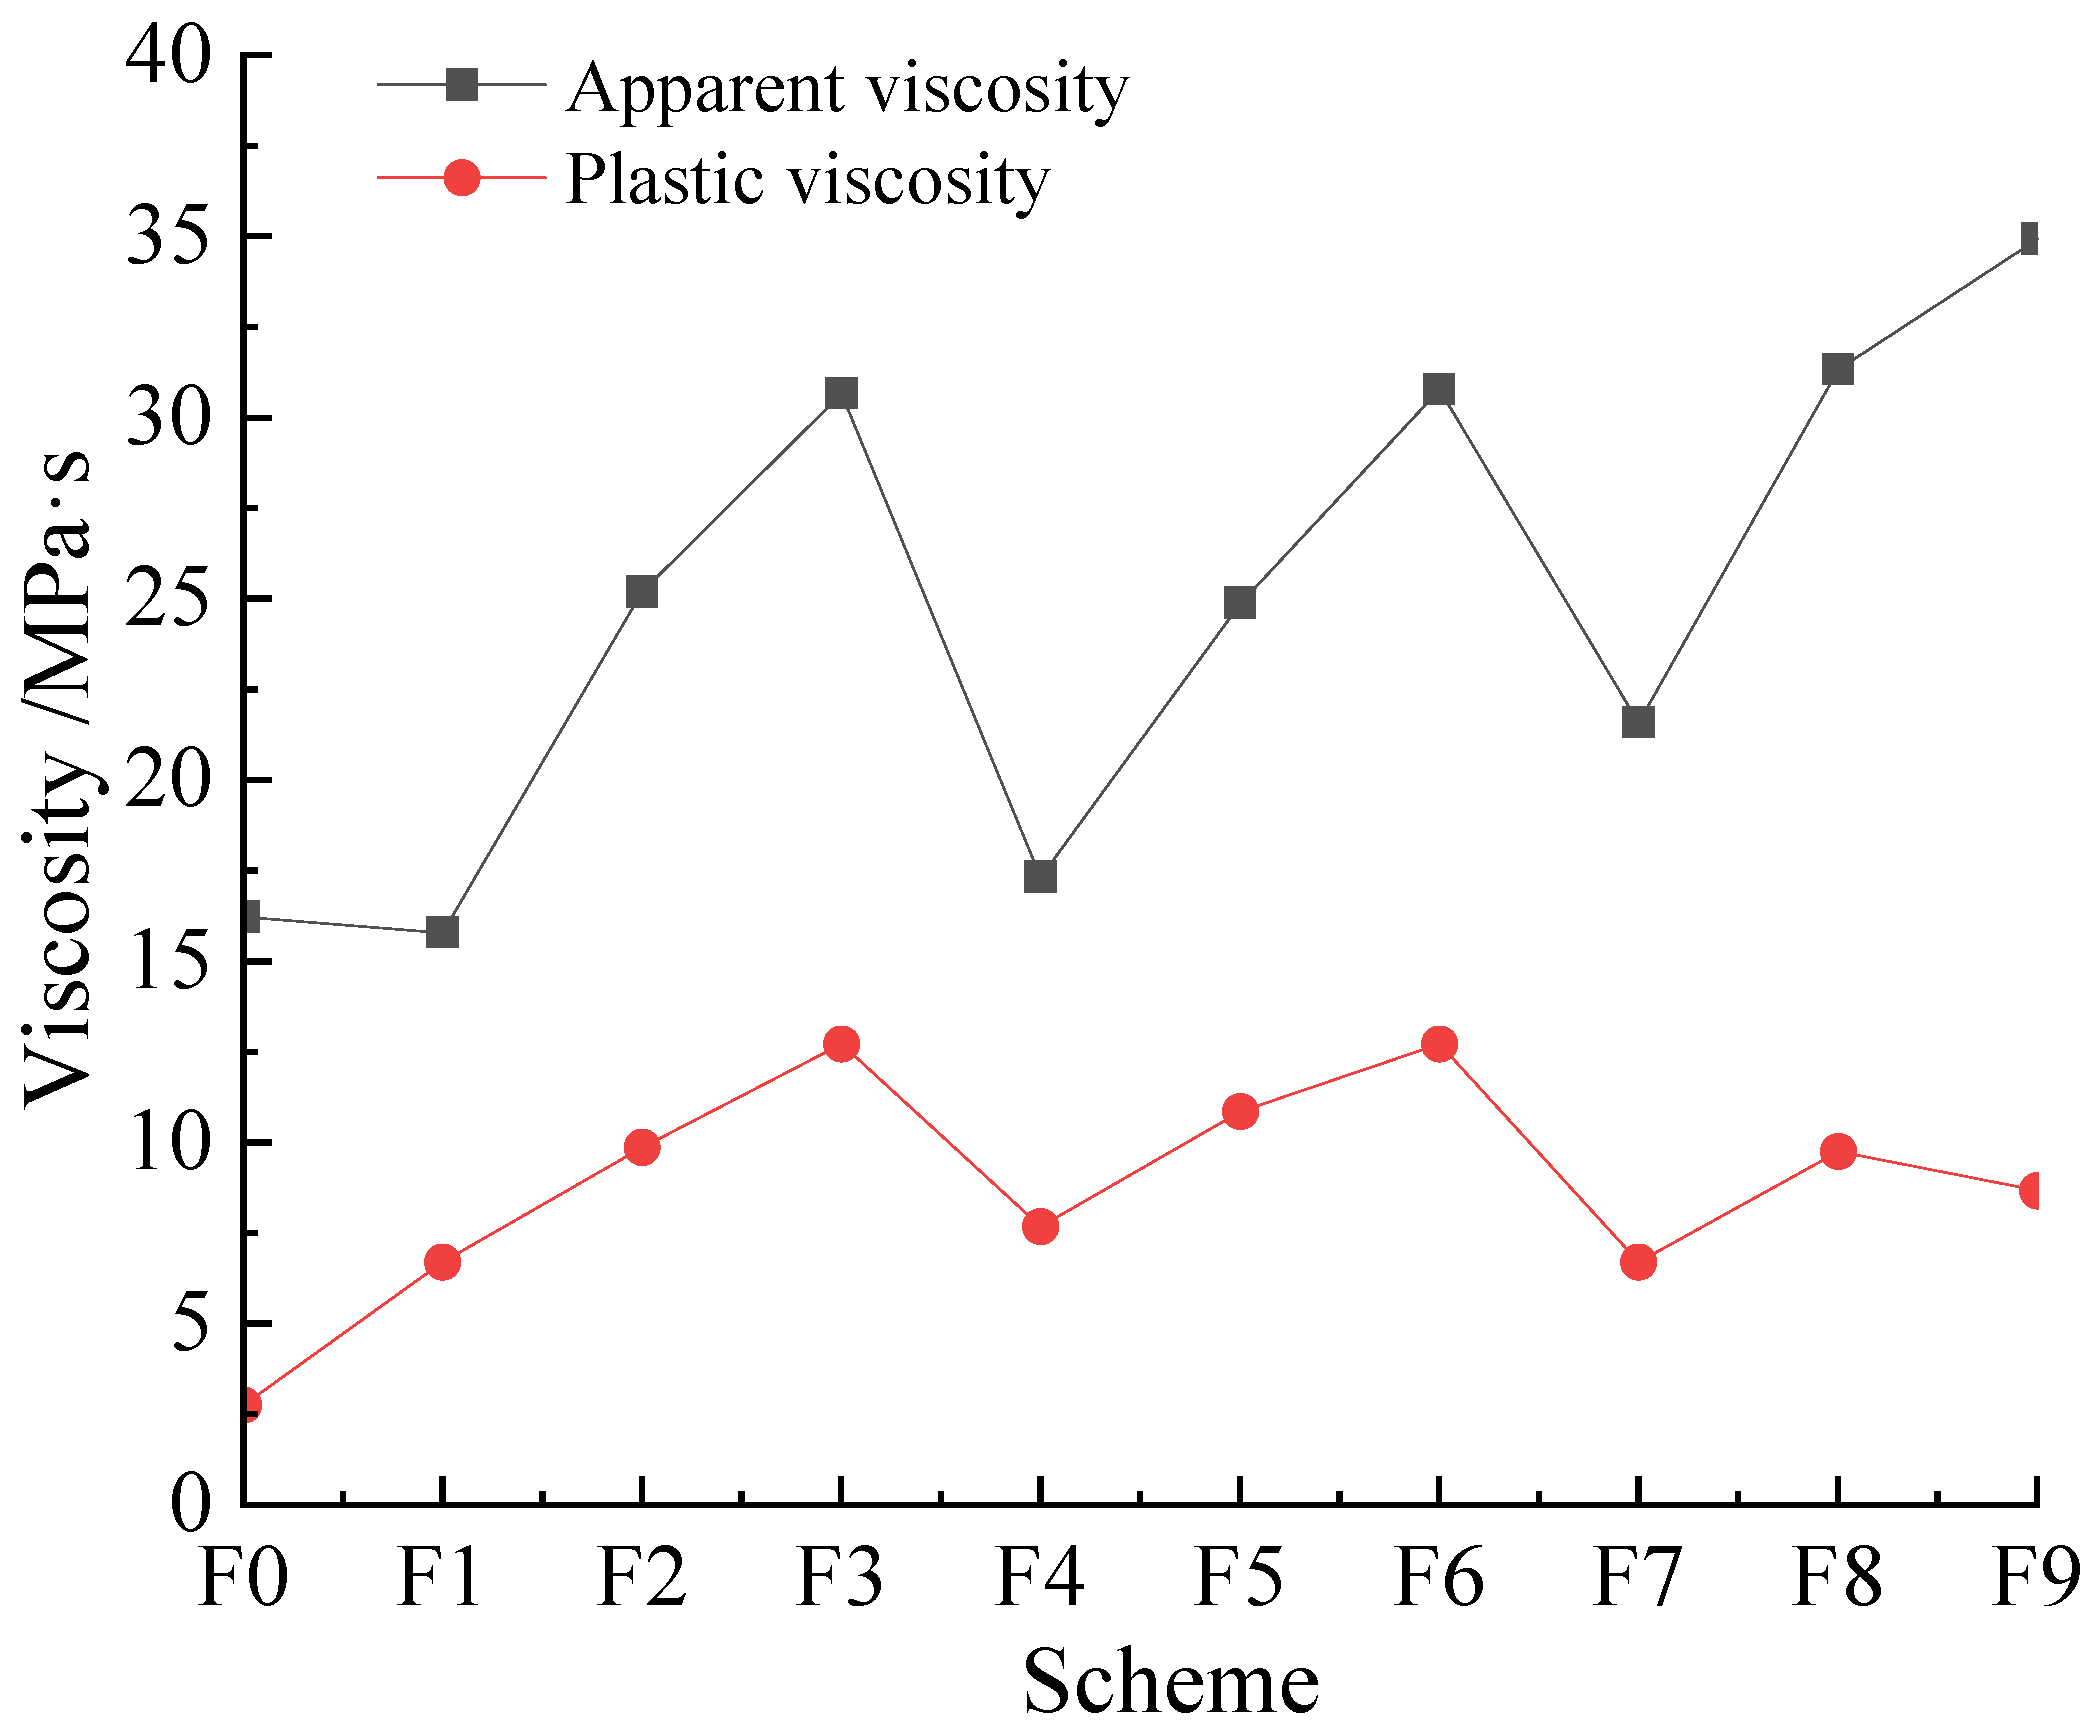
Figure 1. Viscosity Comparison of Different Mud Schemes.
Coatings 12 01961 g001
Figure 2. Dynamic shear force change diagram.
Coatings 12 01961 g002
Figure 3. Variation diagram of static shear force of different muds.
Coatings 12 01961 g003
Figure 4. Changes in the dynamic-plastic ratio of different schemes.
Coatings 12 01961 g004
Figure 5. Changes of fluidity index and consistency coefficient for different schemes.
Coatings 12 01961 g005
Figure 6. Variation diagram of filtration volume in different schemes.
Coatings 12 01961 g006
Figure 7. Comparison of clay particles’ influence on mud.
Coatings 12 01961 g007
Figure 8. Indoor mixer test.
Coatings 12 01961 g008
Figure 9. Design of Adhesion Resistance Test Device.
Coatings 12 01961 g009
Figure 10. Slump Test Device.
Coatings 12 01961 g010
Figure 11. Comparison of net power of pebble/round gravel improved by two kinds of mud.
Coatings 12 01961 g011
Figure 12. Comparison of friction coefficient of pebble/round gravel improved by two kinds of mud.
Coatings 12 01961 g012
Figure 13. Comparison of adhesion resistance of pebble/round gravel improved by two kinds of mud.
Coatings 12 01961 g013
Figure 14. Comparison of the slump of pebble/round gravel improved by two kinds of mud.
Coatings 12 01961 g014
Figure 15. Comparison of net power of sand improved by two kinds of mud.
Coatings 12 01961 g015
Figure 16. Comparison of friction coefficient of the sand improved by two kinds of mud.
Coatings 12 01961 g016
Figure 17. Comparison of adhesion resistance of sand improved by two kinds of mud.
Coatings 12 01961 g017
Figure 18. Comparison of the sand slump of pebble/round gravel improved by two kinds of mud.
Coatings 12 01961 g018
Table 1. Site mud performance parameters.
Mud Performance Index
Density (g/cm3)1.04pH10
Marsh funnel viscosity (″)40Static filtration (mL/30 min)21
Apparent viscosity η A (MPa·s)13.5Plastic viscosity η p (MPa·s)3
Dynamic shear τ d (Pa)10.7Dynamic to plastic ratio τ d / η p 3.6
Initial static shear force (Pa)9.2Final shear force (Pa)10.7
Liquidity Index0.17Consistency coefficient (Pa·sn)4.2
Colloid rate90%
Table 2. Test Design Scheme of Different Additives.
Drugs
Scheme
Water (g)Bentonite (g)Sodium Carbonate (g)Guar Gum (g)Sodium Carboxymethylcellulose (g)Xanthan Gum (g)Polyacrylamide (g)
F1100030 (4%)0.5 (0.05%)2 (0.2%)///
F2100040 (5%)0.5 (0.05%)2 (0.2%)///
F3100050 (3%)0.5 (0.05%)2 (0.2%)///
F4100030 (4%)0.5 (0.05%)/2 (0.2%)//
F5100040 (3%)0.5 (0.05%)/2 (0.2%)//
F6100050 (3%)0.5 (0.05%)/2 (0.2%)//
F7100030 (3%)0.5 (0.05%)//2 (0.2%)/
F8100040 (3%)0.5 (0.05%)//2 (0.2%)/
F9100050 (3%)0.5 (0.05%)//2 (0.2%)/
F10100030 (3%)0.5 (0.05%)///2 (0.2%)
F11100040 (3%)0.5 (0.05%)///2 (0.2%)
F12100050 (3%)0.5 (0.05%)///2 (0.2%)
Table 3. Mud Performance Test Data of Different Schemes.
SchemeAV (Mpa·s)PV (Mpa·s)YP (Pa)Gelin PaGel10 (Pa)FL (mL)K (Pa.sn)nMarsh Funnel Viscosity SColloid Rate (%)YP/PV
F013.5310.79.210.7214.20.174090%3.6
F1972.041.532.04 1.480.213580%0.3
F215.5105.62.63.6 0.330.563880%0.56
F318138.23.14.1 0.710.474082%0.63
F49.581.531.532.04190.040.793699%0.19
F514113.072.042.56180.100.724199%0.28
F618135.113.574.09170.200.655499%0.39
F714.577.674.096.13210.930.404799%1.10
F821.51011.87.679.20191.580.386199%1.18
F926917.48.699.20172.820.3394100%1.93
Table 4. Test Scheme for Adding Clay Medium Particles.
Drugs
Scheme
Water (g)Bentonite (g)Sodium Carbonate (g)Xanthan Gum (g)Clay Particles (g)
F13100040 (4%)0.5 (0.05%)0.5 (0.05%)5 (0.5%)
F14100040 (4%)0.5 (0.05%)0.5 (0.05%)10 (1%)
F15100040 (4%)0.5 (0.05%)0.5 (0.05%)15 (1.5%)
Table 5. Test Data of Influence of Clay Particles on Mud Performance.
SchemeAV (Mpa·s)PV (Mpa·s)YP (Pa)Gelin (pa)Gel10 (Pa)FL (mL)K (Pa.sn)nMarsh Funnel Viscosity SColloid Fraction(%)YP/PV
F1320.5119.77.678.18190.930.4563100%0.88
F1422.51210.57.678.18200.850.4865100%0.88
F152313108.188.69210.850.4867100%0.77
Table 6. The new mud formula.
Raw MaterialBentoniteXanthan GumSodium CarbonateClay Particles
Increase the amount4%0.2%0.04%1%
Table 7. Particle size distribution of anhydrous round gravelly soil.
Particle Size(mm)60~2020~55~22~0.50.5~0.250.25~0.0750.075~0.005
content(%)302015151055
Table 8. Sand particle size distribution.
Particle Size (mm)2~0.50.5~0.250.25~0.0750.075~0.005
Content (%)30303010
Publisher’s Note: MDPI stays neutral with regard to jurisdictional claims in published maps and institutional affiliations.