Article

Load Transfer Mechanism and Bond–Slip Behavior of Recycled Concrete-Encased Steel (RCES) Subjected to Cyclic Loading

1
School of Civil Engineering and Mechanics, Yanshan University, Qinhuangdao 066004, China
2
Water Resources and Electric Engineering, Hebei University, Cangzhou 061001, China
*
Author to whom correspondence should be addressed.
Coatings 2022, 12(12), 1806; https://doi.org/10.3390/coatings12121806
Submission received: 5 October 2022 / Revised: 18 November 2022 / Accepted: 18 November 2022 / Published: 23 November 2022
(This article belongs to the Special Issue Current Research in Cement and Building Materials)

Abstract

:
RCES composite structures, which combine the advantages of high bearing- and good anti-seismic capacity of ordinary steel reinforced concrete (SRC) with the characteristics of energy-saving and environmental protection of recycled concrete, are beneficial to promote the use of recycled concrete. However, the bond–slip behavior and load transfer mechanism are essential issues of RCES composite structures. This paper primarily focused on the load transfer mechanism and bond–slip behavior of RCES composite structures subjected to cyclic loading. A total of 14 specimens, which were designed with different replacement ratios of recycled concrete, cover thicknesses of H-shaped steel, transverse reinforcement ratios, and recycled concrete strengths, were tested to investigate the load transfer mechanism and interface damage. The results indicate that the whole loading procedure can be divided into four phases and four limit points. The bonding shear damage of a specimen develops rapidly, and most damage happened during 0~0.2 mm slip. The bonding stress values of chemical bonding stress τca, friction resistance stress τf, and mechanical biting stress τm were calculated. Moreover, in order to reflect the influence of cyclic loading, a degradation factor ξ was proposed. The mean values of chemical bonding stress τca: friction resistance stress τf: mechanical biting stress τm are 1:0.187:0.696, in which the chemical bonding stress is the largest, friction resistance stress is the second, and the mechanical biting stress is the least.

1. Introduction

In recent years, the construction industry has seen a rapid development. However, the rapid development of construction consumes a lot of non-renewable natural resources such as sand and stone. On the other hand, the demolition of many old buildings generates an astonishing amount of construction waste due to the rapid urbanization [1]. These wastes have a significant impact on the environment and mostly contribute to landfill saturation. In order to solve this problem, it is necessary to recycle the construction waste and reduce environmental degradation, as well as the negative effects due to construction processes [2]. Recycled concrete, which is made by using recycled coarse aggregates (RCA) to replace natural aggregate partially or completely, is believed to be a good way to solve this problem [2]. Recently, many countries have attached great importance to environmental protection and are paying great attention to research on recycled concrete. A larger number of research studies, performed worldwide, have focused on the mechanical properties or recycled concrete [3,4,5,6,7,8,9,10,11]. Most of the studies show that although some mechanical properties of RCA are inferior to those of natural concrete, it is appropriate for recycled concrete to be used in structural engineering [12].
In order to popularize the application of recycled concrete, studies concerning the beams [13,14,15,16], columns [17,18], beam-column joints [12,19], and frames [20,21] were investigated. The research results of most previous studies show that the anti-seismic behavior and failure mode of RCES structures are similar to those of ordinary reinforced concrete structures. However, the bearing capacity of RCES structures was reduced to some allowable extent. Nowadays, SRC structures have already been widely used in engineering construction due to their advantages, such as better seismic capacity and good ductility [22,23]. In this regard, RCES composite structures are proposed to broaden the application scope of recycled concrete [24]. It is believed that RCES composite structures, which combine the shape steel and recycled concrete, can achieve a better seismic performance, as the attractive features of SRC can make up for the shortcomings of recycled concrete. However, the bond–slip capacity is a key problem of RCES composite structures, which provide enough shear resistance at the interface and ensure that H-shaped steel and recycled concrete are working together [25,26]. Zhang et al. (2019) [27] investigated the flexural capacity of composite beams and found that about 27–35% deflection underestimation happened if the interlayer slip was neglected. Hotta et al. (1977) [28] studied the influence of the lateral restraint stress of concrete on the bond–slip behaviors between steel and concrete. Zheng et al. (2016) [29] studied the bond mechanisms and failure modes of SRRC composite structures. Bai et al. (2016) [30] studied the bond–slip capacity of RCES composite structures by using the orthogonal method and pull-out test. The results of the above investigation showed that the bond–slip failure process of RCES composite structures were similar to that of ordinary steel-reinforced concrete, both of which undergo four stress phases: no slip phase, slip phase, failure phase, and residual phase. The concrete cover thickness of H-shaped steel and recycled concrete strength have positive effects on the average bonding strength, while the replacement ratio of recycled coarse aggregates lead to an allowable decrease in average bonding strength. Chen et al. (2013) [31] designed 22 SRRC test specimens and carried out pull-out tests, in which they found that the ultimate bond stress and residual bond stress increased with the compressive recycled concrete strength. The bond stress of different parts of H-shaped steel is different; the web adhesion stress is the smallest, followed by the outer flange, and the inner flange adhesion stress is the largest. The bonding force at the interface of an SRRC specimen is exponentially distributed along the longitudinal direction of H-shaped steel. Chen et al. (2013) [32] tested 11 SRRC specimens with different replacement ratios of recycled coarse aggregates and found that the interface energy dissipation capacity of SRRC specimens is not significantly affected by the replacement ratio of recycled coarse aggregates when the replacement ratio is less than 70%. However, when the replacement ratio is greater than 70%, the energy dissipation coefficient increases with the replacement ratio. The shear stiffness of the interfacial bond decreases with the increase in the replacement ratio. Finally, a τ-s constitutive model was proposed. Most of the previous research, especially for the studies mentioned above, is focused on the investigation of bond strength and stress. There is little research on the degradation of bond capacity and no research on the full-stage analysis of load transfer mechanism at the interface between recycled concrete and steel. Studies generally indicate that the bond stress at the interface between concrete and H-shaped steel is composed of chemical bond stress, mechanical bite stress, and friction stress, but there are no quantitative calculation methods for the calculation of each part. Consequently, a series of RCES specimens were tested to investigate the load transfer mechanism, degradation of bond capacity, and to calculate the components of bond stress.

2. Test program

2.1. General

Materials used in this experiment include: (1) cement: ordinary Portland cement; (2) natural coarse aggregate (NCA): natural stones which were screened with continuous gradation from 0 to 25 mm; (3) recycled coarse aggregate (RCA): RCA comes from a recycled building material company; (4) fine coarse aggregate: the common river sand with a fineness modulus of 2.75; (5) water: city tap water; (6) water reducing agent: polycarboxylic type high performance water reducer; (7) channel steel: No. 10 U-shaped channel steel; (8) steel bar: Φ6 smooth bars were selected as the transverse reinforcement (Φ means hot rolled plain steel bars with strength grade 300 MPa), Coatings 12 01806 i001 12 ribbed steel bars were selected as the longitudinal reinforcement (Coatings 12 01806 i001 means hot rolled ribbed steel bars with strength grade 335 MPa); and (9) steel plate: Q235 steel plate with thickness of 6 mm. The mechanical properties of shape steel and steel bars were tested according to the Chinese standard GB/T228, and the results are shown in Table 1.
In order to ensure the quality of recycled concrete and investigate the influence of coarse aggregate on the mechanical properties of recycled concrete, a series of material property tests have been performed on NCA and RCA. The test results show that for the NCA and RCA used in the experiment, bulk density (kg/m3) is 1580:1330, apparent density (kg/m3) is 2800:2570, 24(h) water absorption (%) is 0.1:4.8, crush index (%) is 5.0:13.0, porosity (%) is 44:48, and mud content (%) is 0.4:0.6. It should be noted that both the bulk and apparent density of NCA is bigger than that of RCA, which means the bulk of recycled aggregates have more voids. The 24(h)-water absorption of RCA is 48 times that of NCA. Moreover, the crush index of RCA is higher than NCA which means the strength of RCA is lower than NCA.

2.2. Specimen Design

Fourteen RCES specimens were conducted, including 13 RCES cyclic loading specimens and 1 RCES pull-out loading contrast specimen. Six 150 mm × 150 mm × 150 mm concrete test cubs were cast and tested after 28 days of standard curing. Demolding of both RCES specimens and concrete cubs was carried out three days later after casting. Figure 1 shows the cross-section and elevation dimensions of typical RCES specimen.
Table 2 shows the parameters investigated and details the mix properties of recycled concrete used in this paper. The effect of shrinkage was omitted due to the short-term test. The effect of steel surface treatment on adhesion was not studied in this paper and the steel used in this test was obtained directly from the factory. Four design parameters were mainly considered to investigate the bond capacity of RCES specimens as follows:
  • Replacement ratio of recycled concrete (r): The chemical bonding force is an important part of the bond capacity at the interface. The magnitude of chemical bonding force depends on the amount and quality of cement colloid formed in the process of concrete mixing, curing, and finally coagulation. However, r has a great impact on the formation of cement colloid. Thus, specimens RCES-2, RCES-3, RCES-4, and RCES-5 with different r of 0%, 30%, 70%, and 100% were investigated. The other parameters remain constant.
  • Thickness of recycled concrete cover (Css): The cover thickness provides much constraint to the interface and makes the slip difficult to happen. Specimens RCES-2, RCES-6, RCES-7, and RCES-8 with different concrete cover 50, 60, 70, and 80 mm were tested to investigate the relationship between bond capacity and restrain effect.
  • Transvers reinforcement ratio (ρsv): The transvers reinforcement ratio also can provide constraint to the interface and improve the bond capacity to some extent. Specimens RCES-2, RCES-9, RCES-10, and RCES-11 were designed with different reinforcement ratios to study how the reinforcement improved the bond stress transferred at the interface.
  • Compressive recycled concrete strength (fc): The same as r, different concrete strengths require different mix proportions; different mix proportions influence the formation of cement colloid; which as a result affects the chemical bond stress. Therefore, some other factors, such as aggregate size, the type of cement, the additives and admixtures were omitted as the compressive strength was considered. In this test, specimens RCES-2, RCES-12, RCES-13, and RCES-14 with different compressive strengths of 31.90 MPa, 40.32 MPa, 45.44 MPa, and 50.05 MPa, respectively, were studied.

2.3. Loading Procedure and Instrumentation

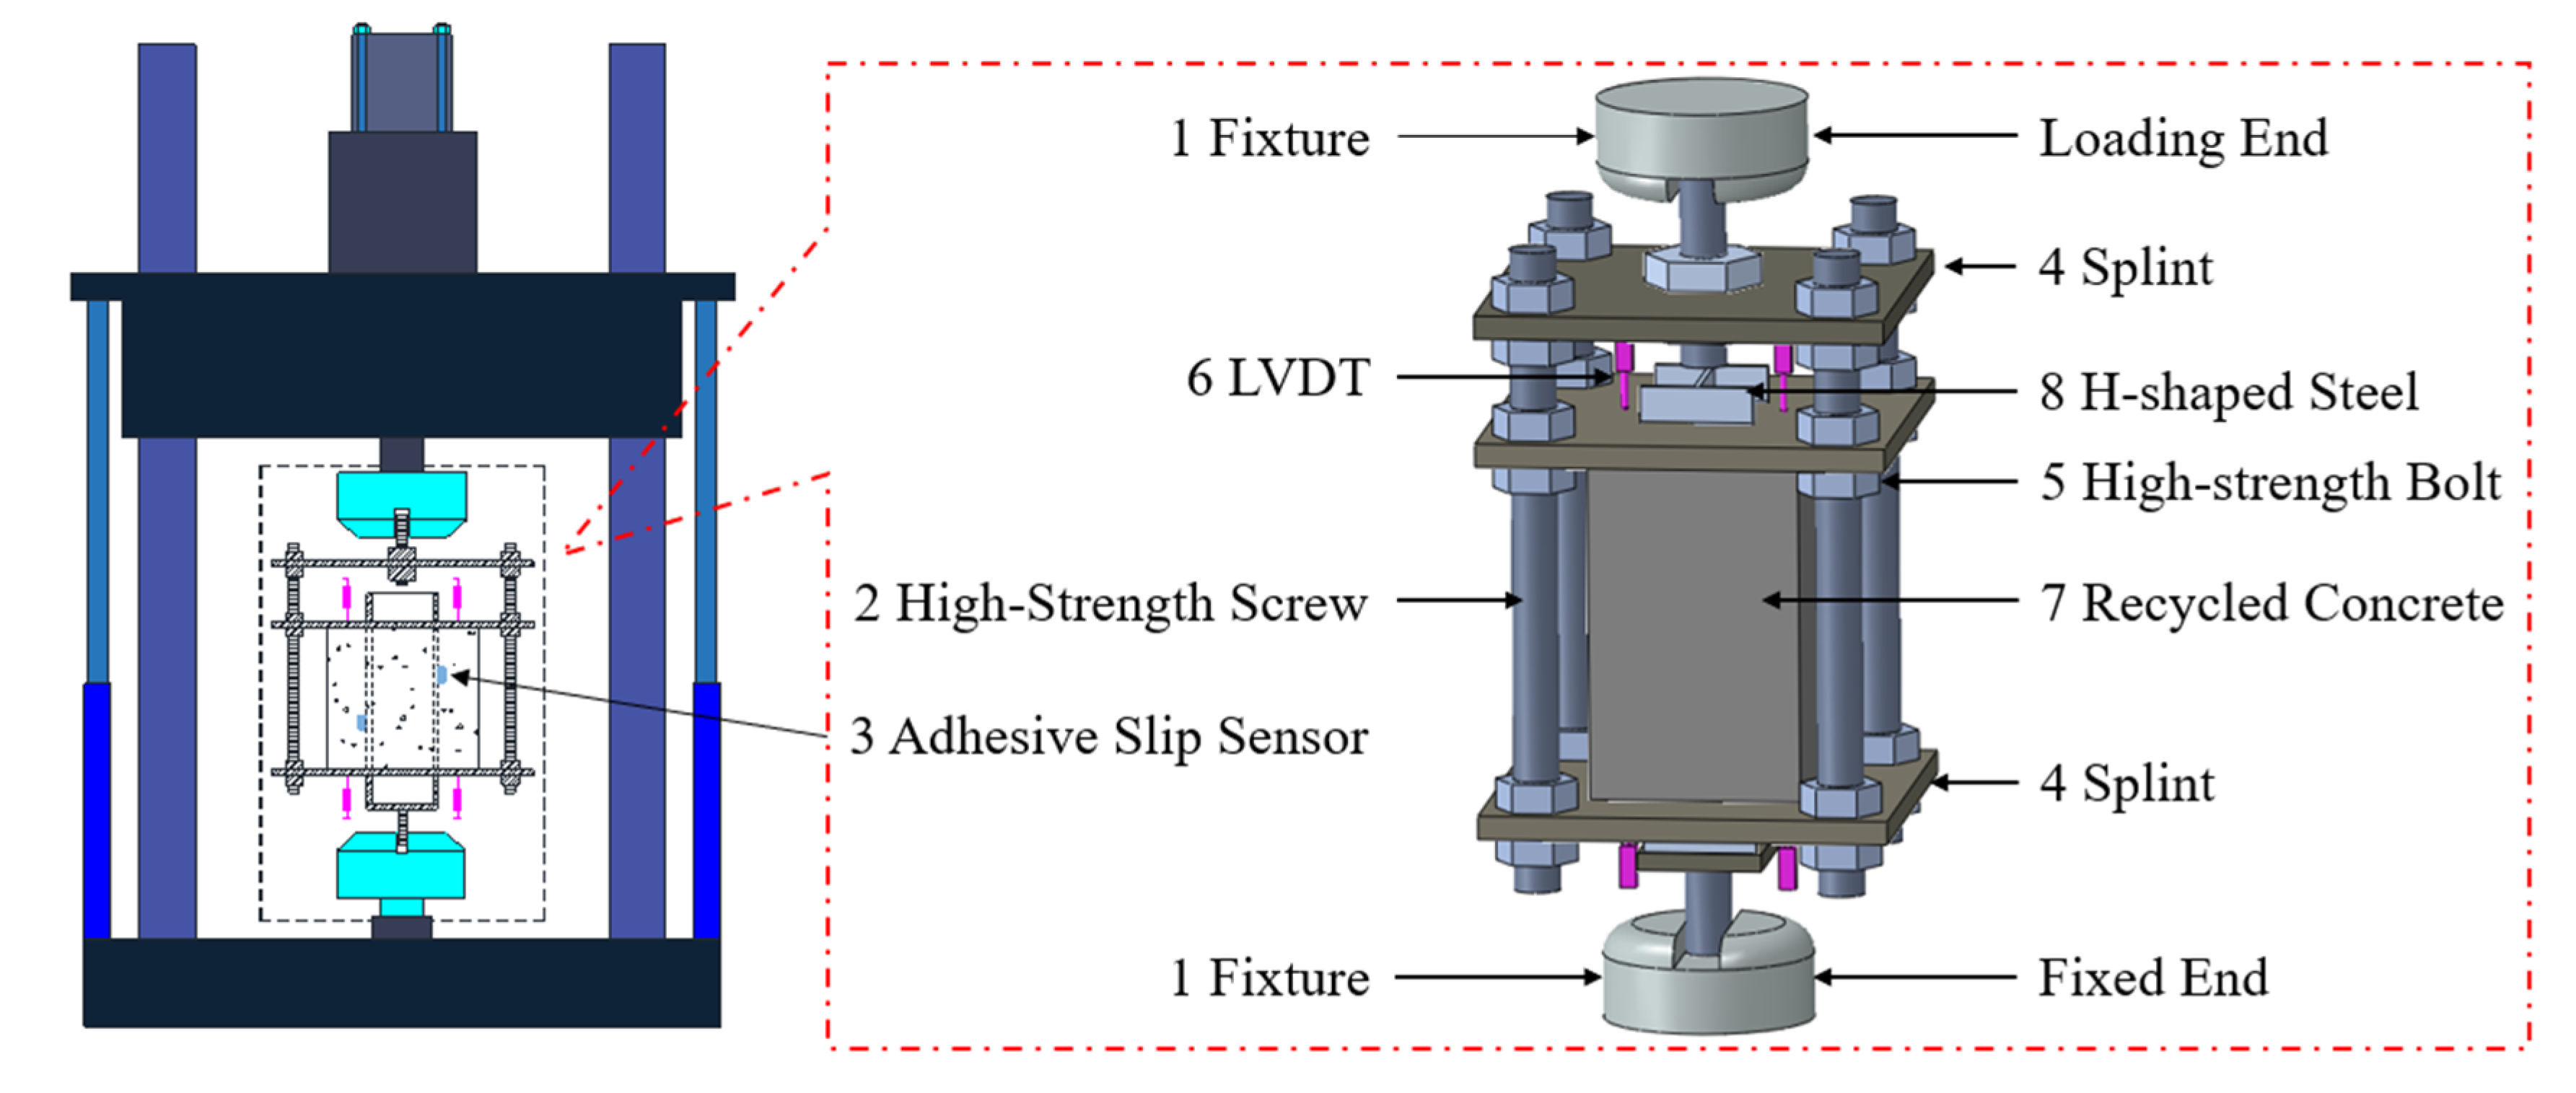
This test was conducted at the key laboratory of structural engineering and earthquake resistance in Xi’an University of Architecture and Technology. The test setup and a typical RCES specimen were illustrated in Figure 2. Four linear variable displacement transducers (LVDTs) were placed vertically on the concrete splint at the end of recycled concrete (two at the top and two at the bottom) to measure the relative bond–slip along the vertical direction, as the slip was distributed unevenly along the longitudinal direction. In order to measure the inner slip of RCES specimens, two adhesive slip sensors were placed on the one-third place outside of the steel flange. The load machine, LVDTs, and adhesive slip sensors were calibrated before used. The loading device is mainly composed by eight parts: (1) fixture; (2) high-strength screw; (3) adhesive slip sensor; (4) splint; (5) high-strength bolt; (6) LVDT; (7) recycled concrete; and (8) H-shaped steel. The top of RCES specimen is defined as the loading end, while the bottom of the RCES specimen where H-shaped steel is fixed by the fixture and cannot move is defined as the fixed end, as presented in Figure 2. The H-shaped steel and recycled concrete were fixed by the bottom fixture and loading steel frame separately. As a result, the shear load at the interfacial transferred from concrete to steel through the bond effect.
The displacement control loading procedure was used in this test, as shown in Figure 3. The cyclic loading was loaded at a rate of 0.1 mm/s. Each level of displacement was loaded for three cycles to study the interface damage degradation. An amount of 1~2 kN was loaded at the beginning to keep all parts in close contact. Afterwards, the initial load was removed, and the loading was begun. The loading was terminated once 10 mm of relative slip was recorded at the fixed end.
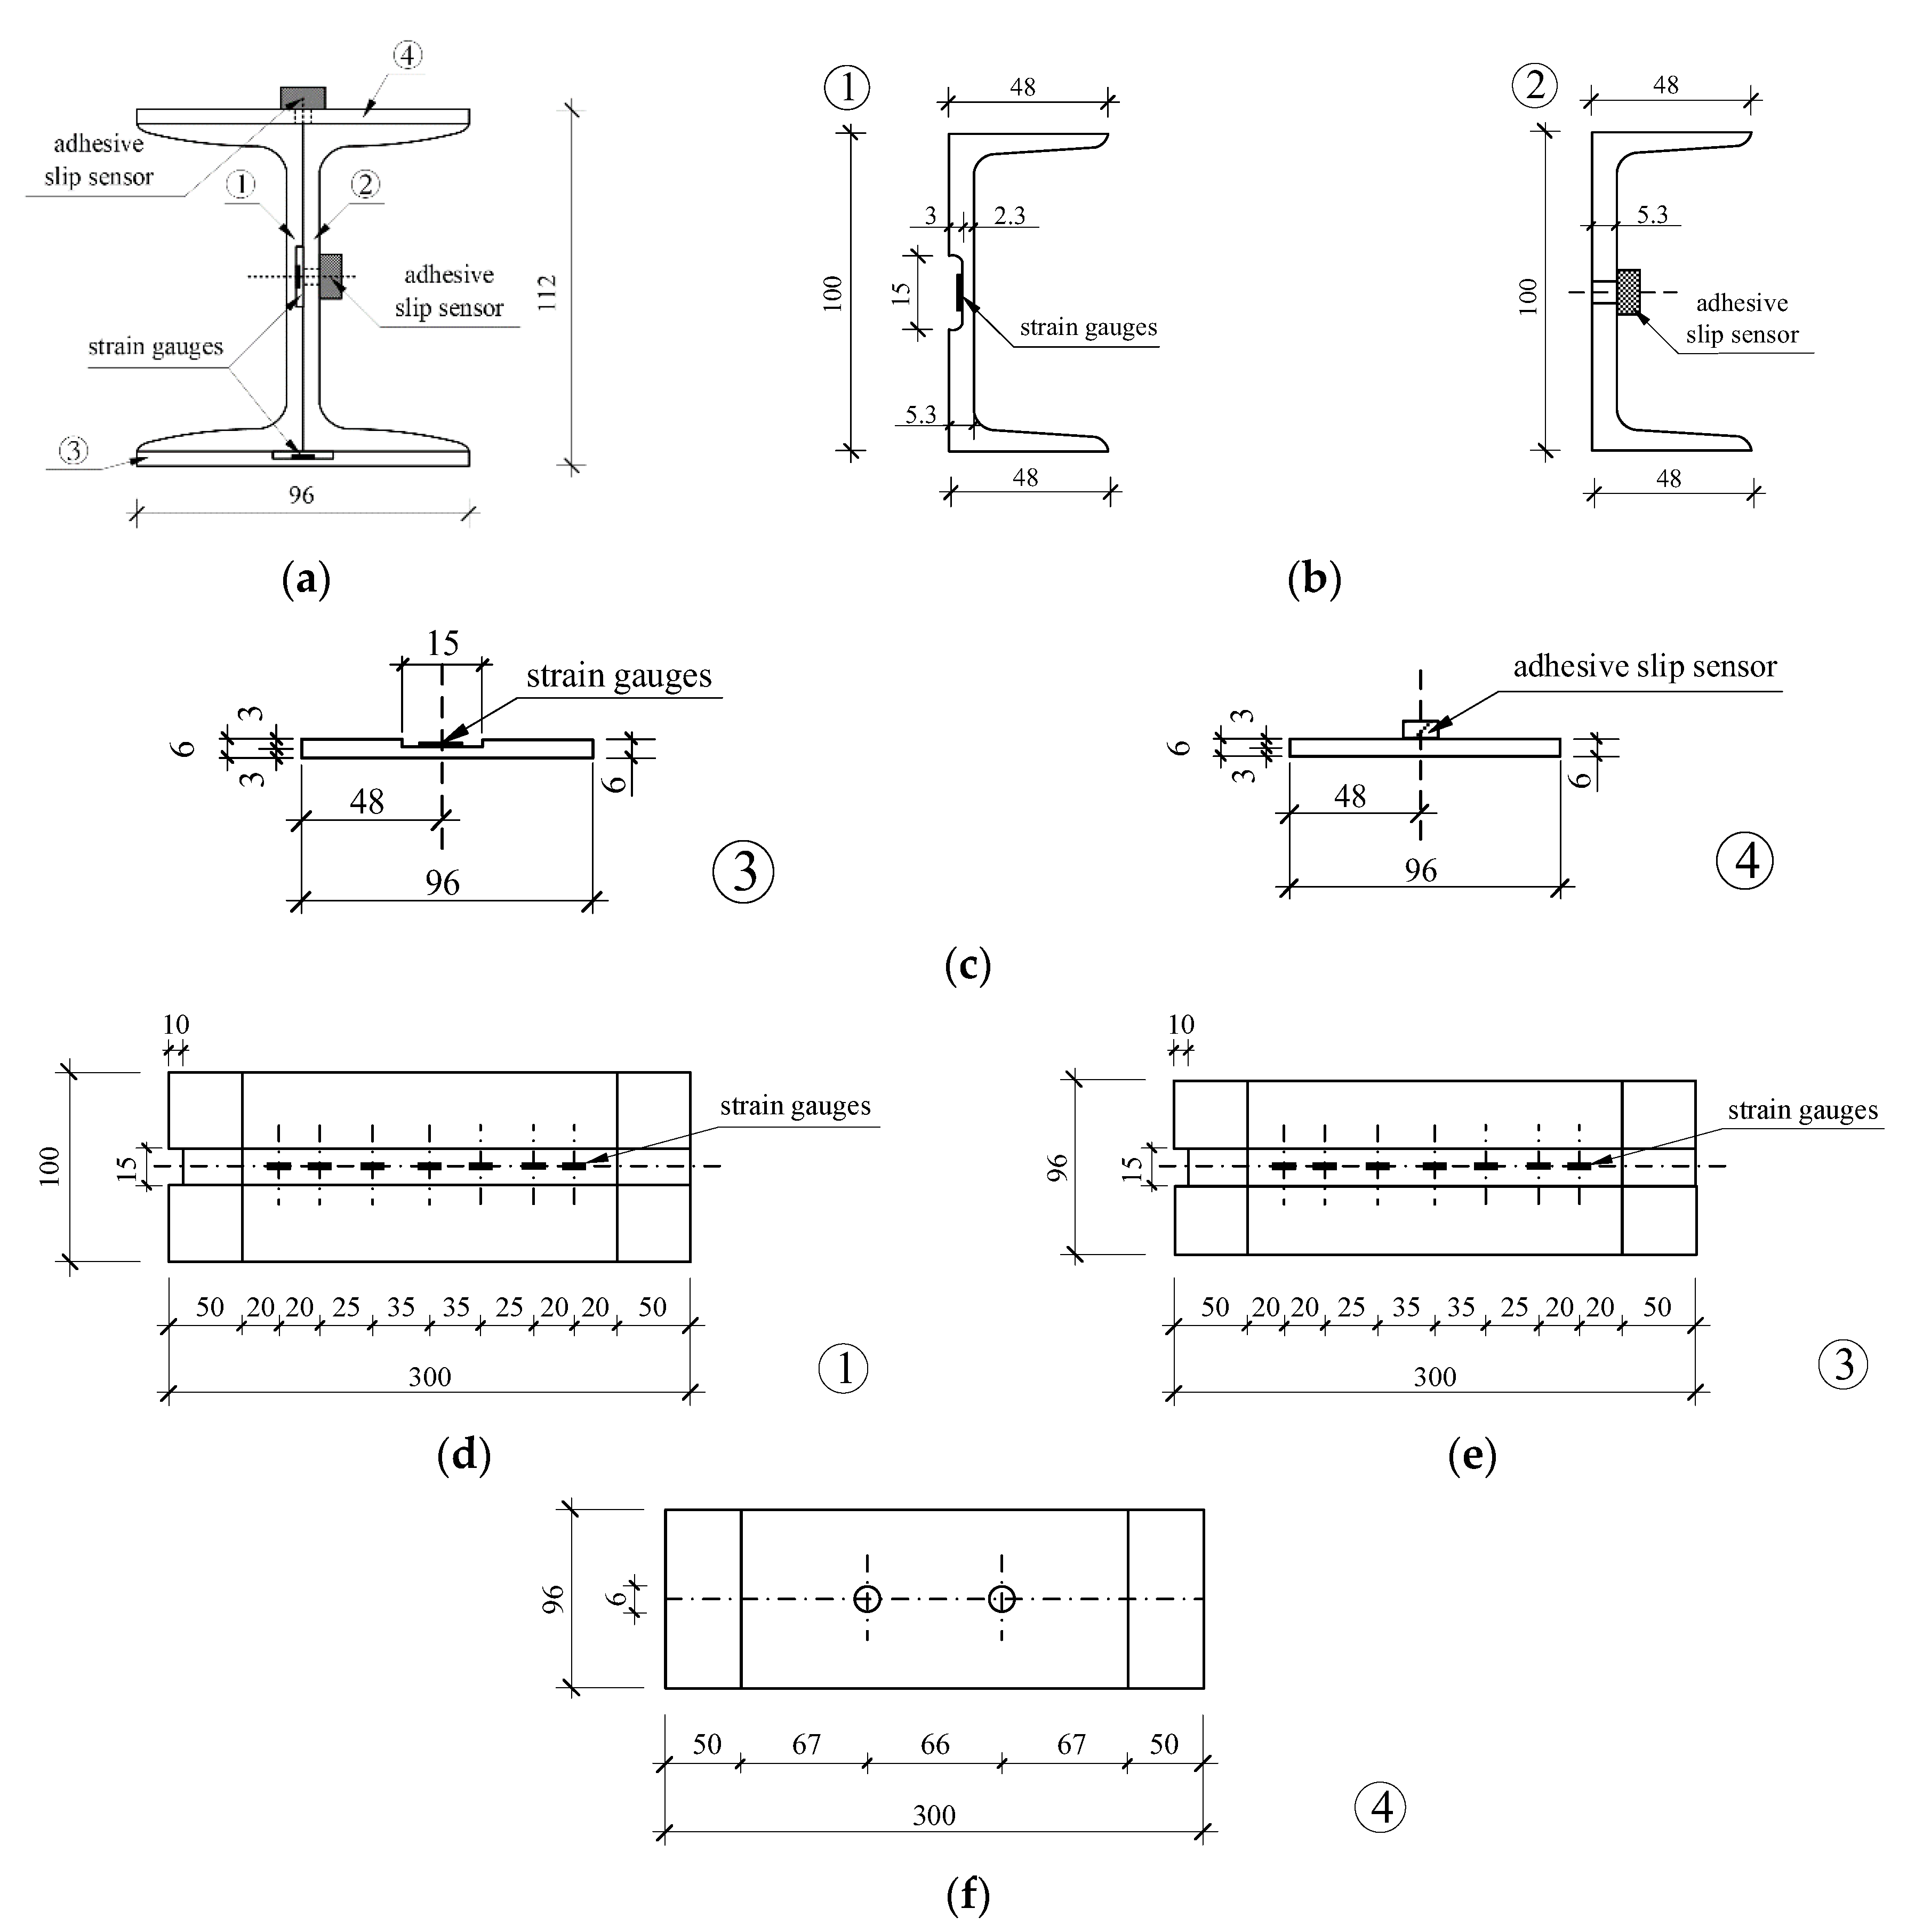
The distribution of strain gauges and adhesive slip sensors is presented in Figure 4. The measuring points are arranged by attaching strain gauges in the slot to prevent the strain gauges from being damaged during the loading process. Therefore, a composite H-shaped steel which is made up of two No. 10 channel steels and two 6 mm steel plates was used in this test.

3. Results and Analysis

3.1. The Whole Loading Process

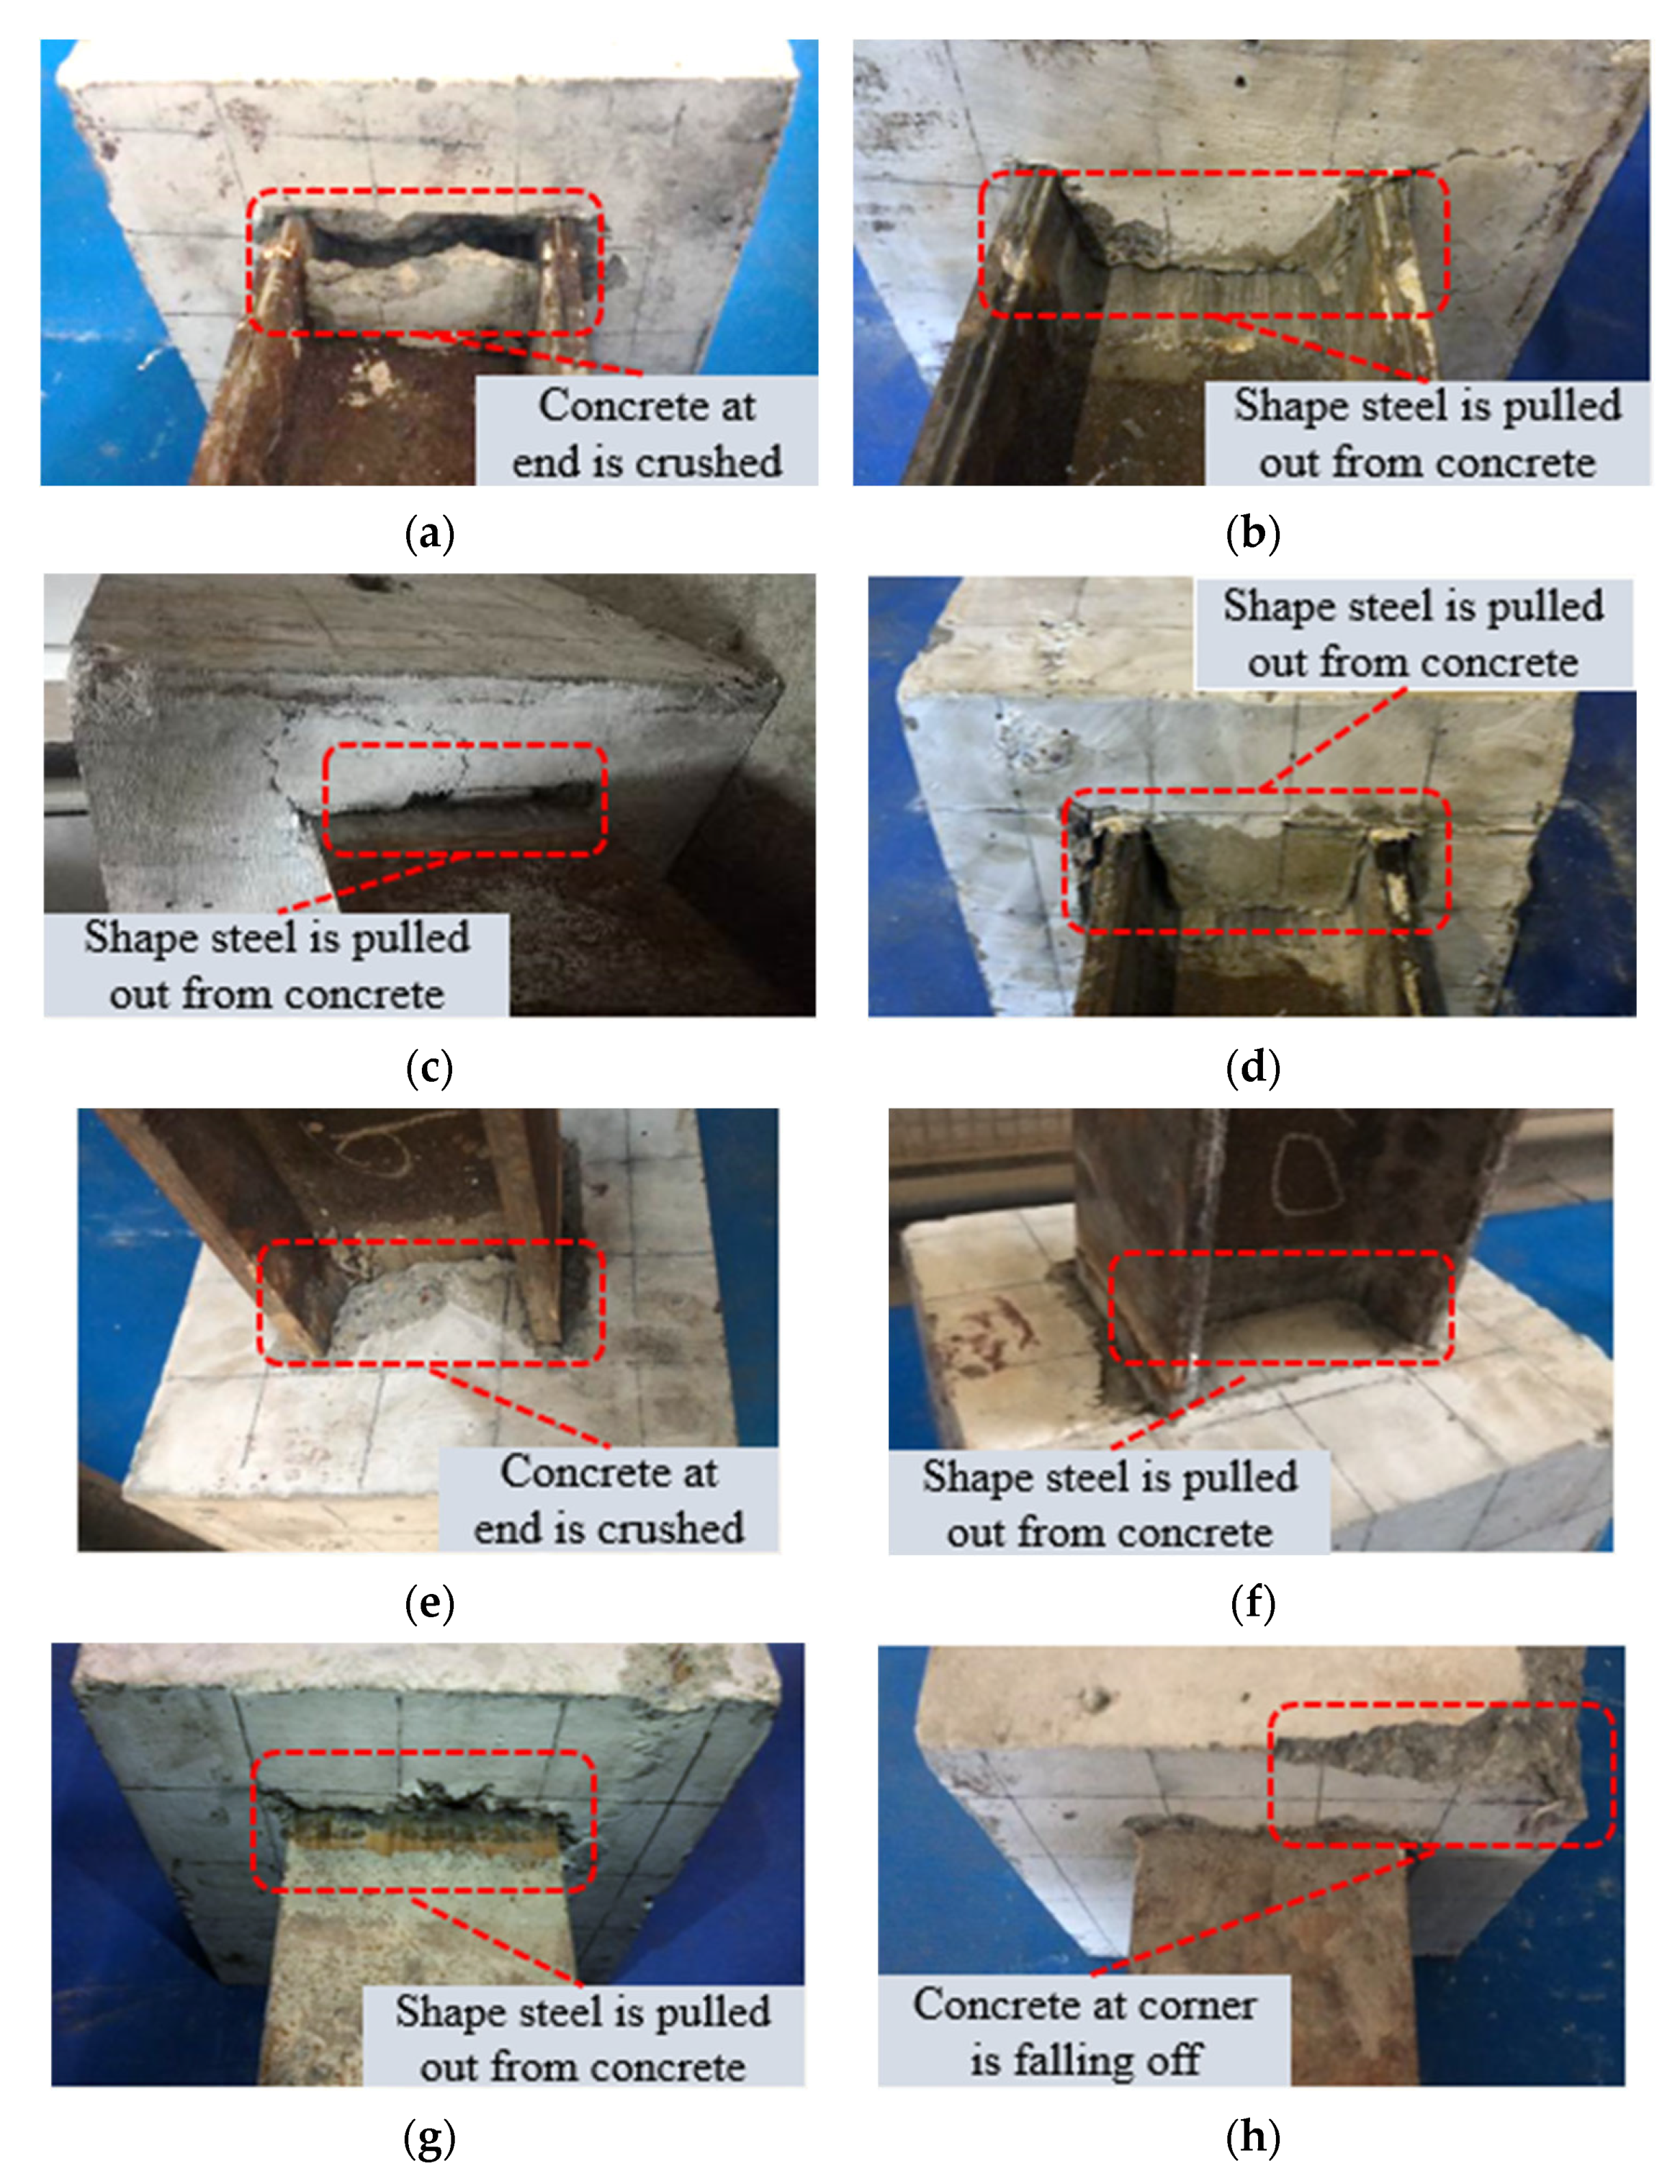
At the beginning of loading process, there was little damage at the bonding interface, the slip at both the top and bottom surface of specimen was very small, and the load increased dramatically. In this state, the transferred shear force at interface was mainly carried by chemical adhesive force and static friction resistance. However, the chemical adhesive force plays a major role. When the cyclic loading increased to 30~40% of ultimate load, the slip at the load end and fixed end gradually increased, specimen RCES-06, RCES-09, RCES-10, and RCES-12 showed obviously slip. As the cyclic load increased gradually, the other specimens begin to slip one after another. In contrast, RCES-03 and RCES-14 begin to slip later. This is because RCES-03 has a lower r and RCES-14 has a higher recycled concrete strength, both lower r and higher fc affects the formulation of chemical adhesive stress and make it more difficult to slip at the interface. The slip increases with the increase in cyclic loading. At this stage, most H-shaped steel flanges showed concrete powder that was ground due to the sliding at the interface as presented in Figure 5b,d,e. The concrete covers of a few specimens were crushed and peeled off, as shown in Figure 5h. As the bond damage increased, the cyclic loading began slow down. The chemical bonding stress was completely damaged until the cyclic loading reached to the peak value. Therefore, the shear force at interface was carried by the frictional resistance and mechanical bite stress. Then, the cyclic load decreased rapidly and the slip increased correspondingly. In the end, the cyclic load remained the same, and the bond interface was completely destroyed. As the anchorage length of H-shaped steel is small, no bonding cracks occurred in this test. Most specimens generally failed due to the pull of the steel out of the concrete. Some typical failure modes which happened during the loading process are shown in Figure 5.

3.2. Analysis of Loading Procedure

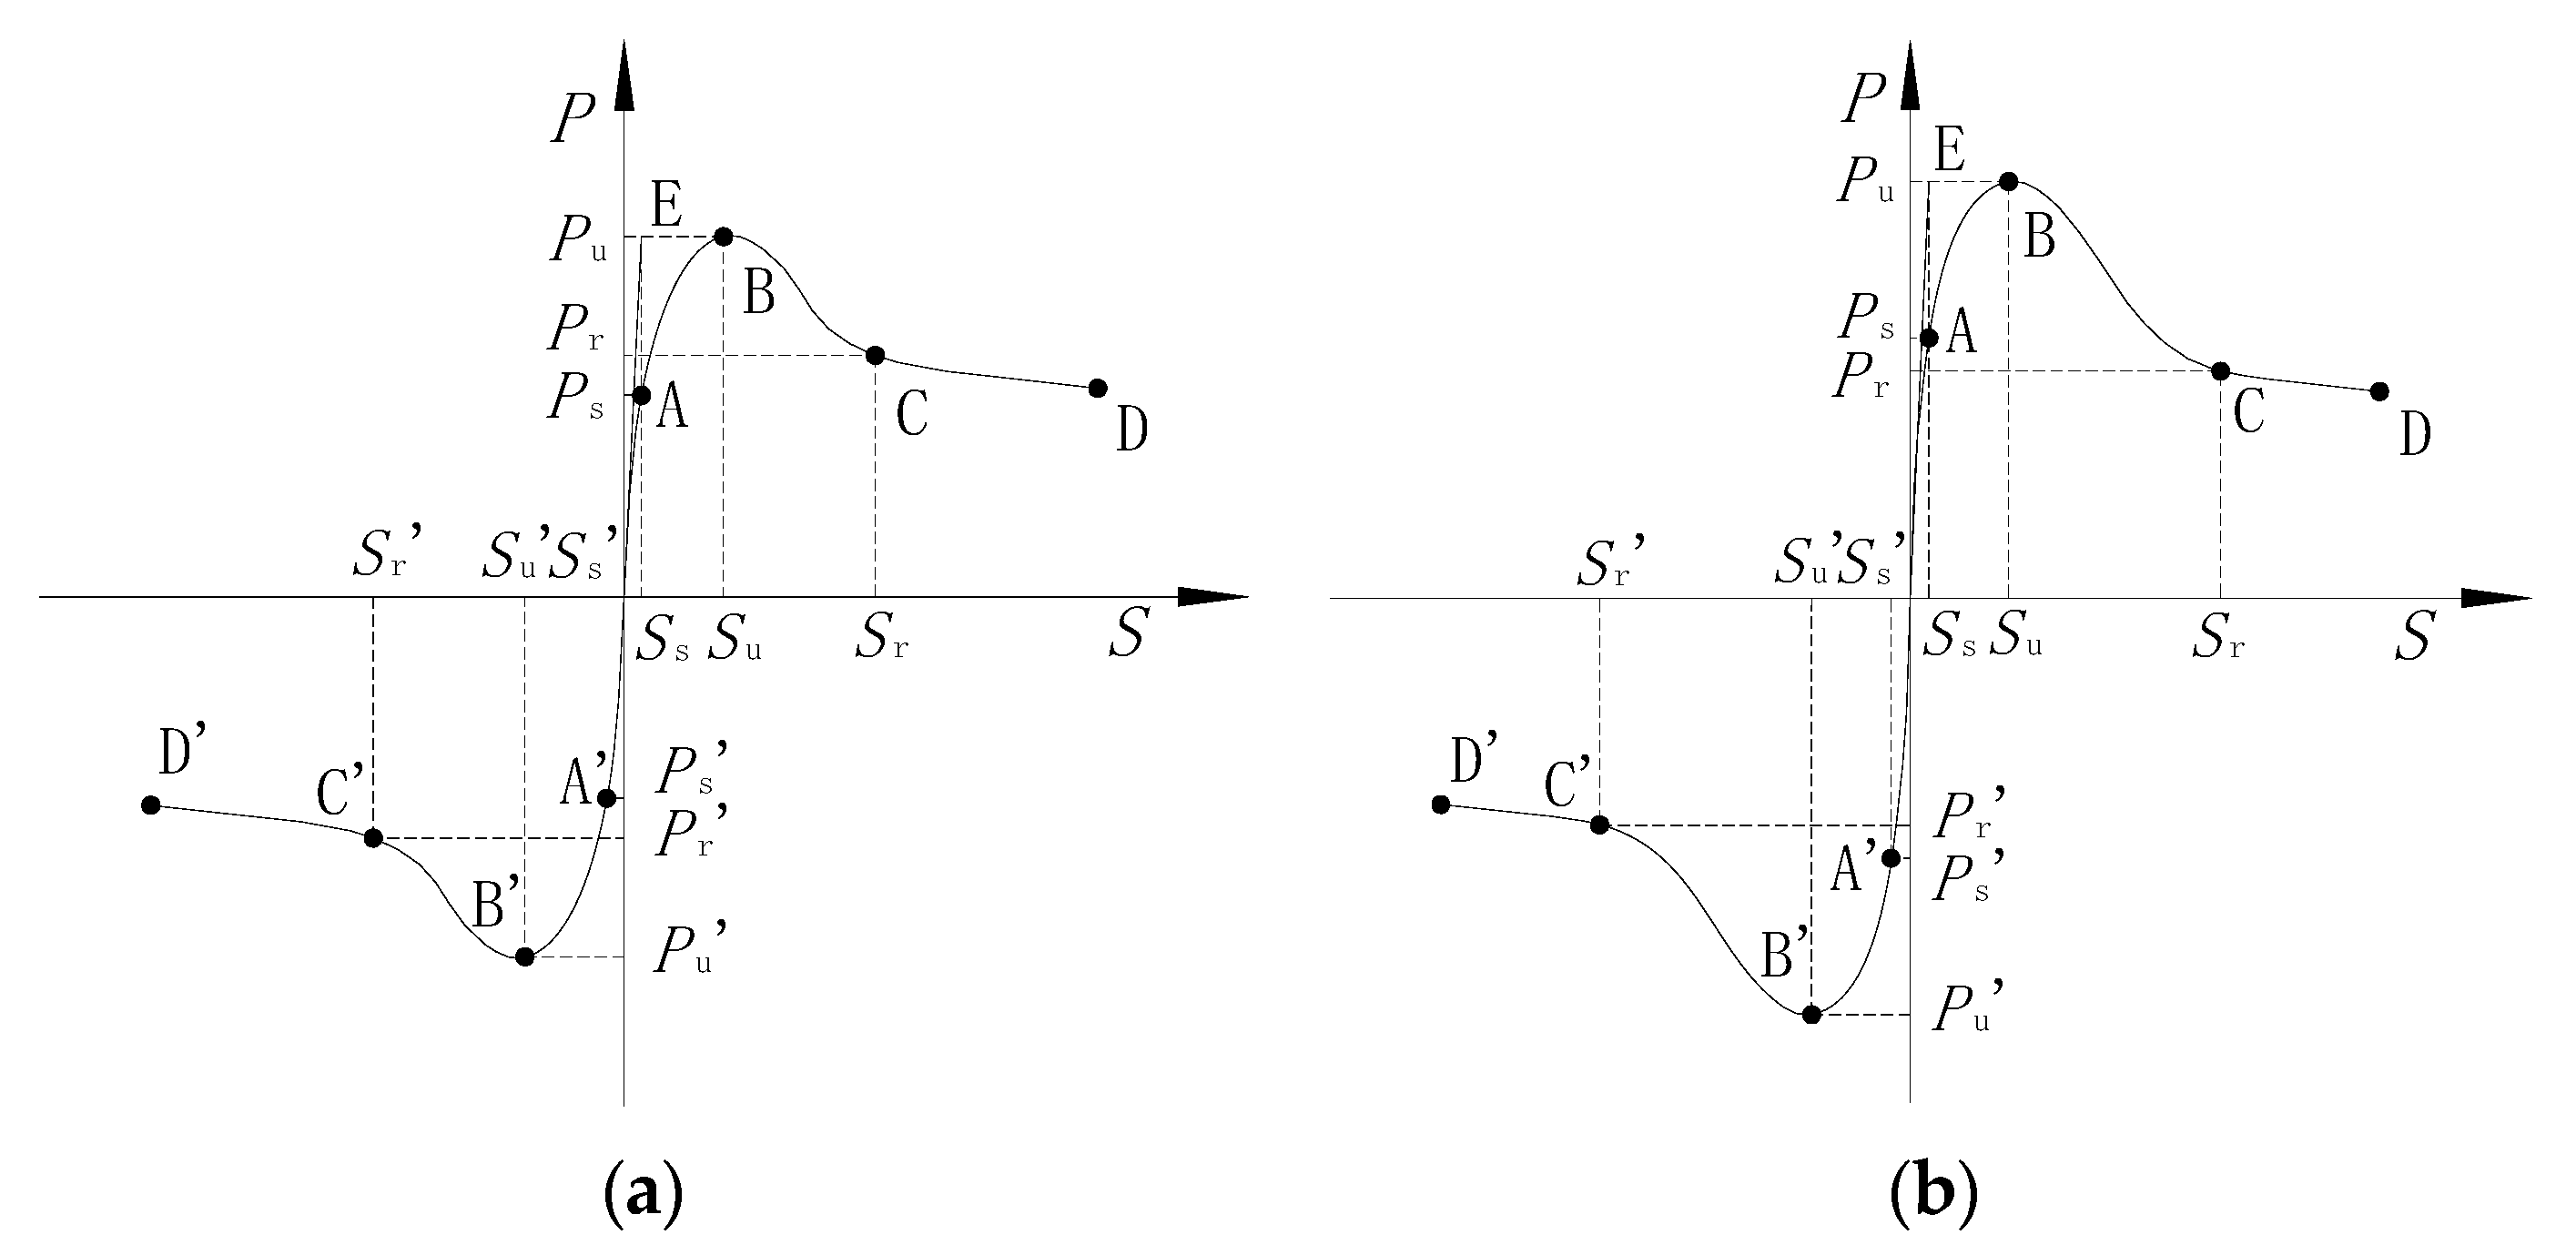
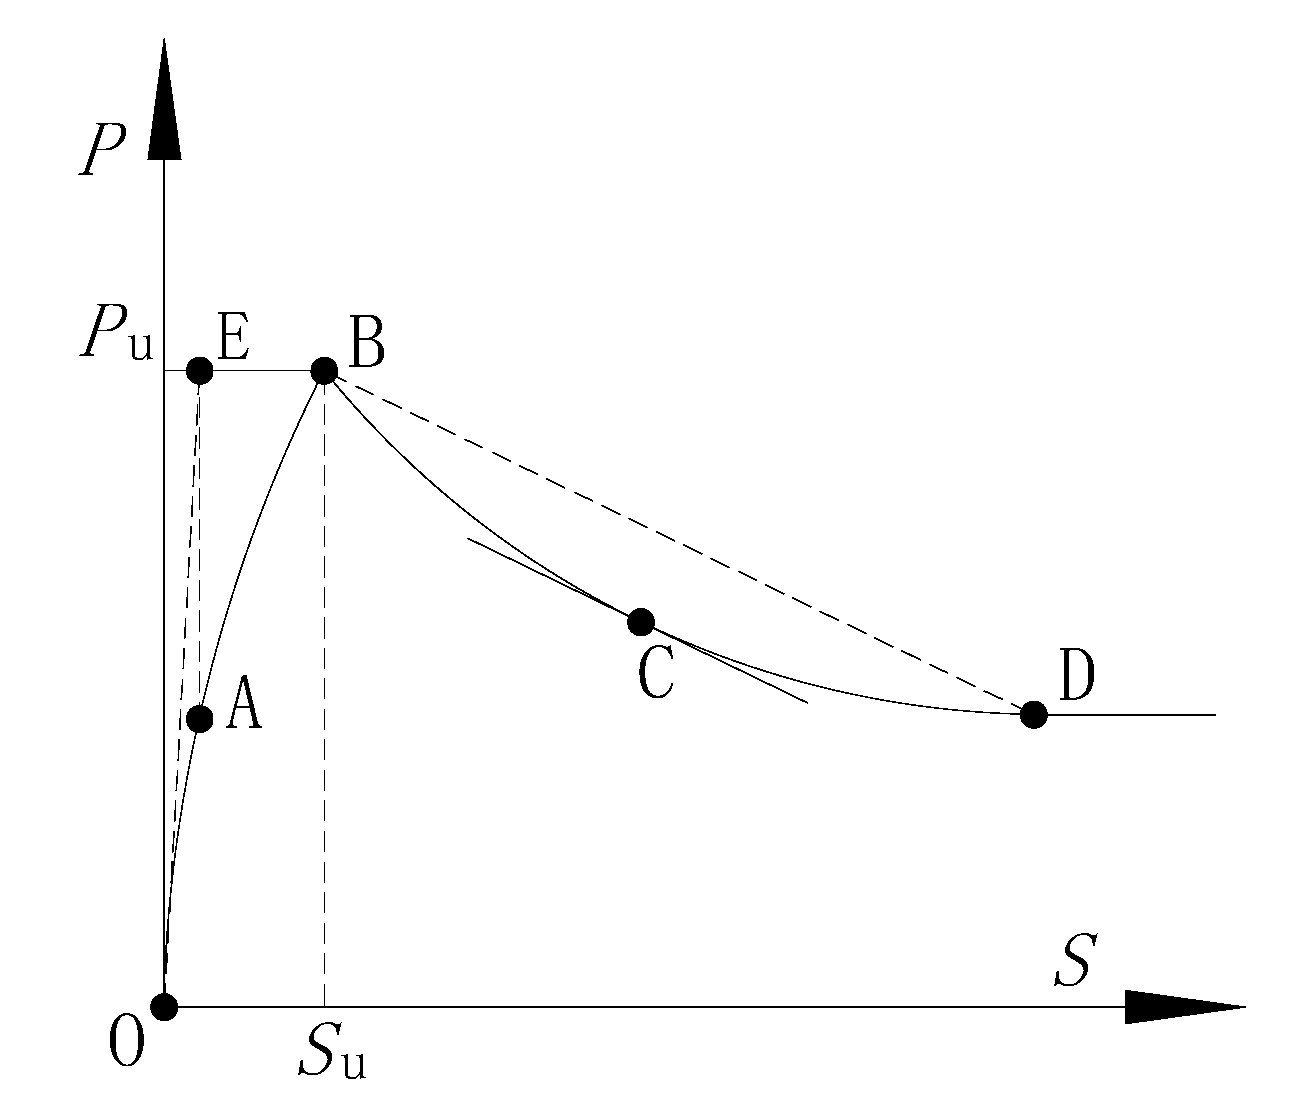
The whole failure process of RCES specimens can be divided into two types by analyzing the full bond–slip skeleton curve, as shown in Figure 6. Four characteristic points were defined according to the variation of bonding force.
Micro slip point (A): The characteristic point A was defined using the geometric method as shown in Figure 7. Initially, a tangent line was made at point O which intersects the horizontal line BE at point E, then a vertical line was made through the E point that intersects the curve at point A, which is the micro slip point of the bond–slip curve. The bond–slip curve shows a linear relationship before point A [33]. The chemical bond stress reaches the ultimate value at point A.
Ultimate point (B): The peak point which the bond–slip curve reaches. As the cyclic loading increased gradually, the chemical adhesive stress was damaged completely. The transferred shear force at the interface is carried by the frictional resistance and mechanical bite stress.
Residual point (C): A line was drawn connecting point B and D. The point where the slope of tangent line in the bond–slip curve is equal to the slope of line BD is defined as the residual point C, as shown in Figure 7.
Failure point (D): The point reaches to 10 mm relative slip is defined as point D.
Correspondingly, there are four stages of the whole bond–slip curve: (1) micro slip phase (O–A); (2) slip development phase (A–B); (3) slip increases rapidly phase (B–C); and (4) residual phase (C–D).
(1)
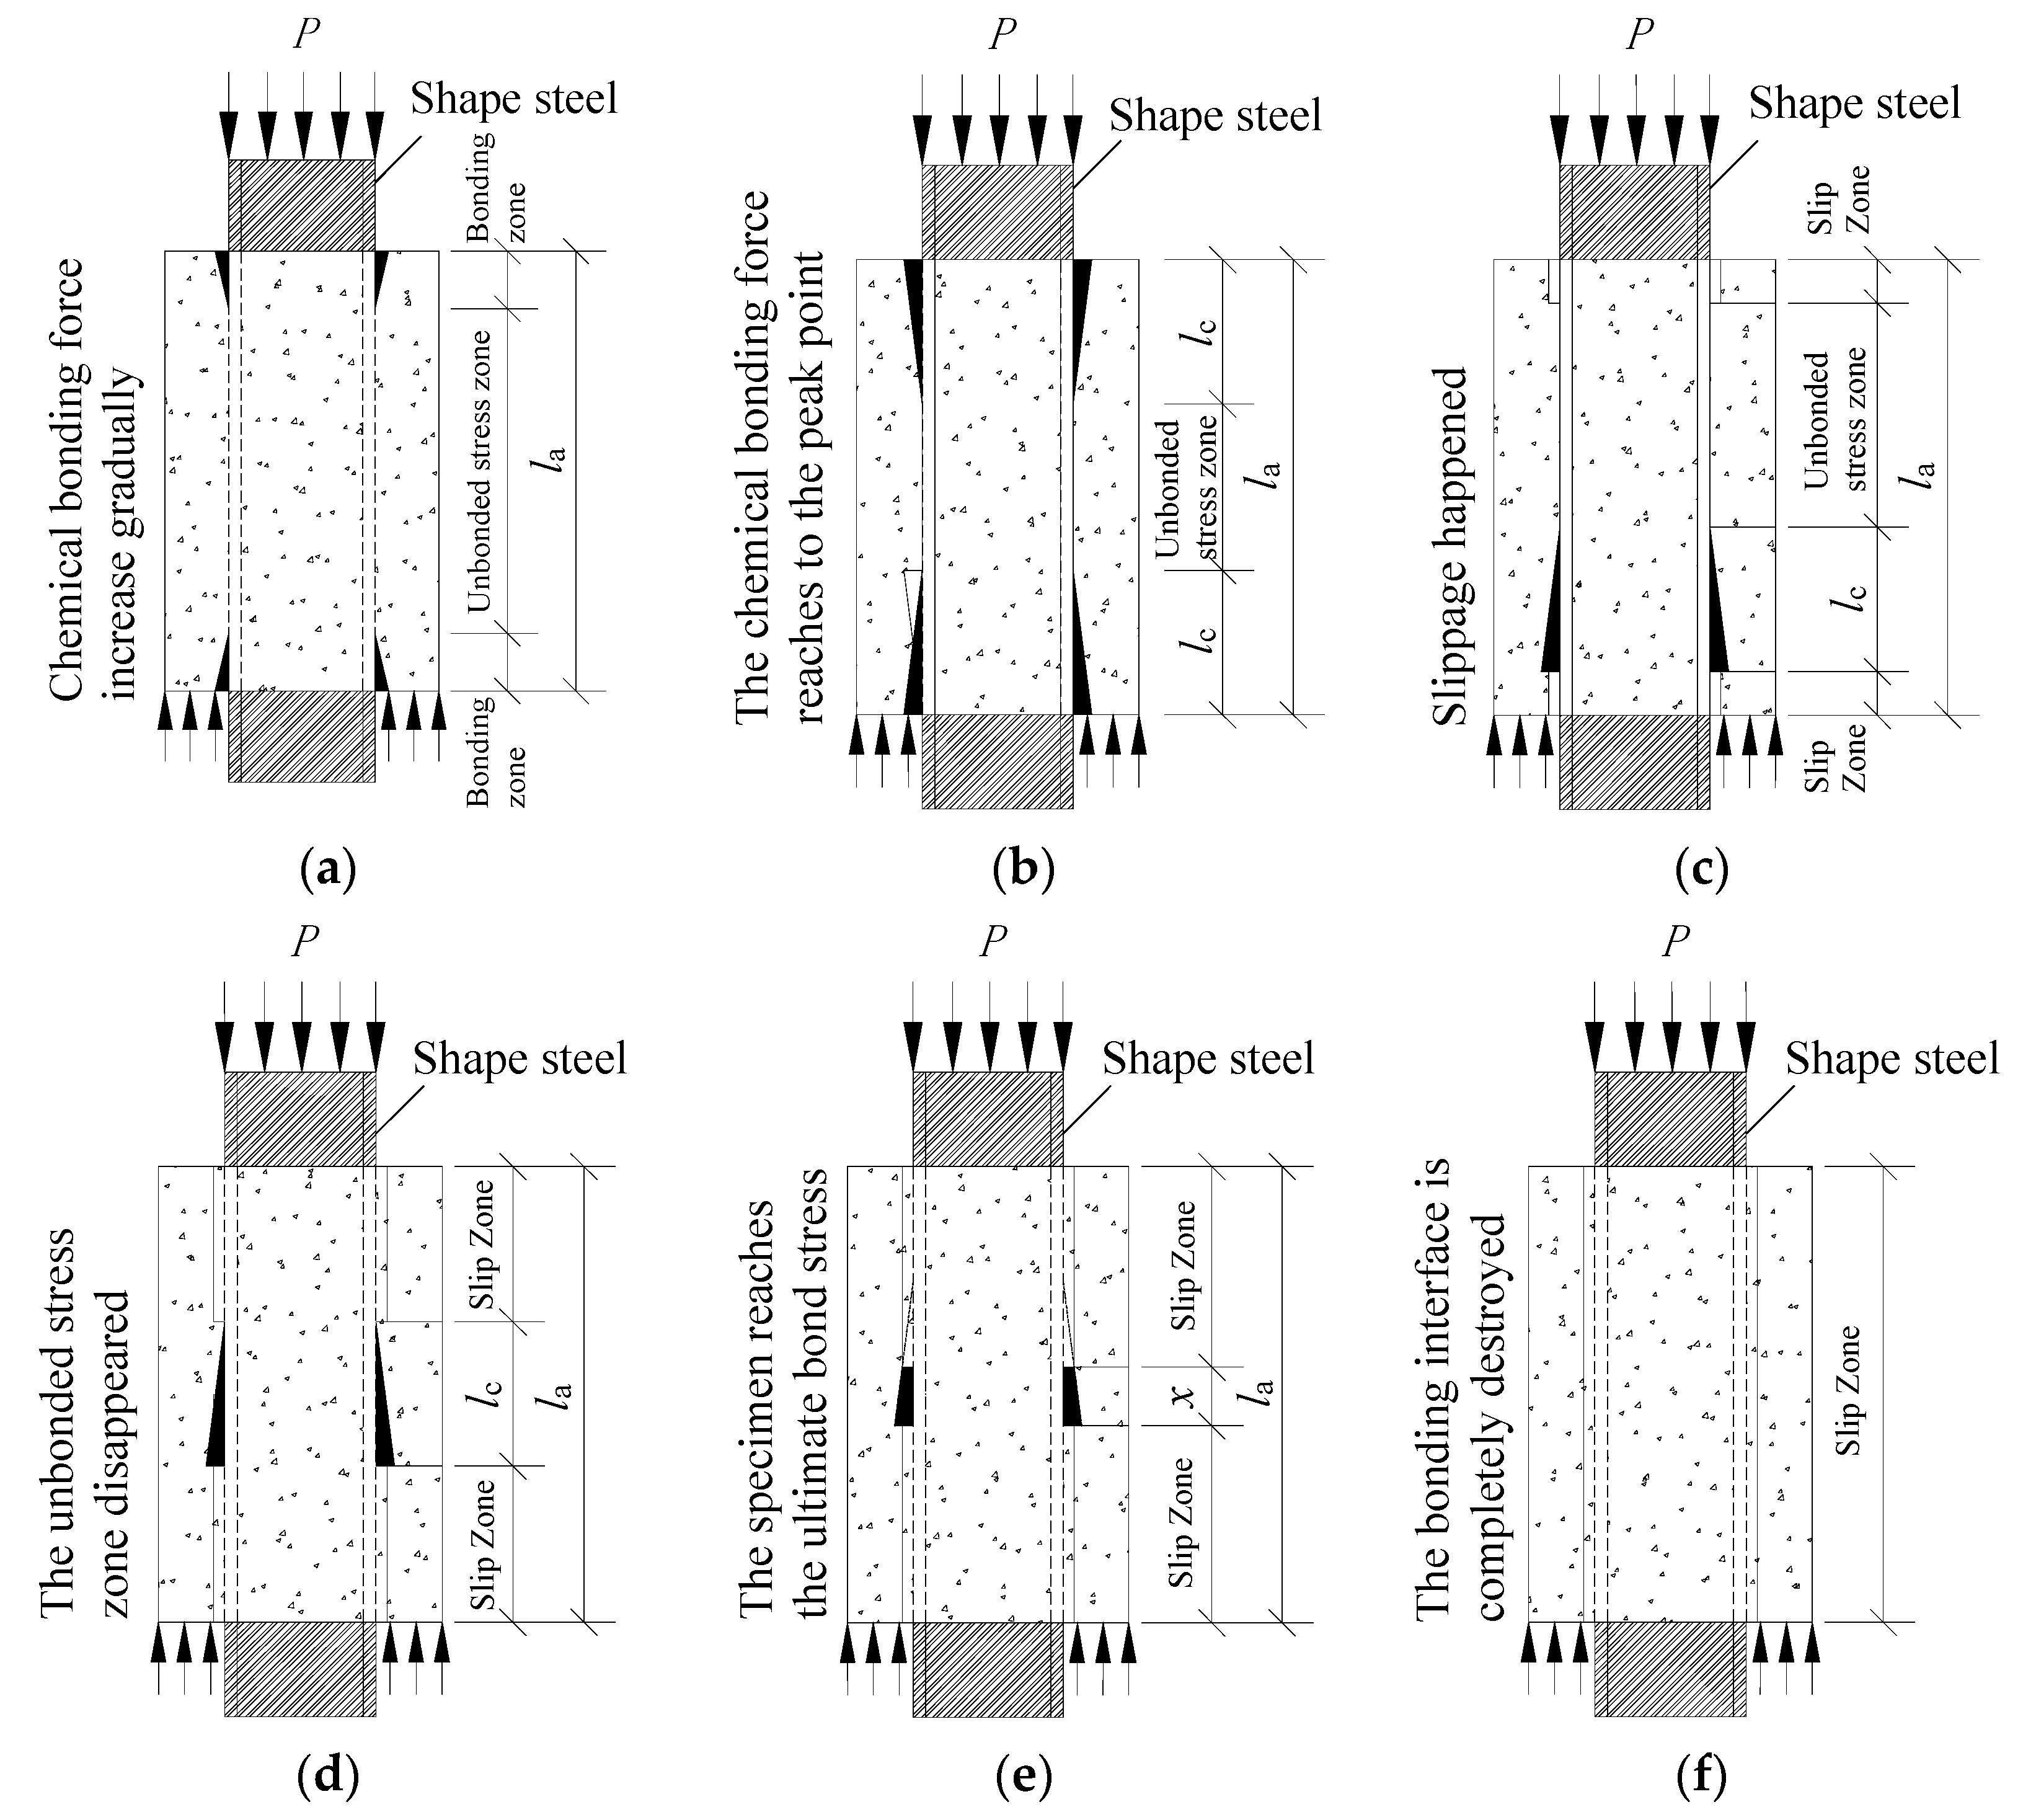
Micro slip phase (O–A): The cyclic load increases linearly with the slip from 0. As shown in Figure 8a, the bonding stress at the interface increases gradually with the cyclic load. However, the cyclic load applied in this phase is relatively small; the transferred shear force at the interface is mainly carried by the chemical bonding stress. As the cyclic load continues increasing, the bonding stress at a certain point of the interface increases to the limit value of chemical bonding stress. At this time, the specimen is in a critical slip state, as shown in Figure 8b. With the increase in cyclic load, the cement colloid was damaged and obvious slip happened at the interface.
(2)
Slip development phase (A–B): In this phase, the bond–slip curve changes from a straight line to nonlinear line. Moreover, part of cement colloid was sheared and more damaged happened as shown in Figure 8c. The bonding slip zone diffused from fixed and loading end to the middle. The cement colloid damaged increased gradually so as to the slip zone as shown in Figure 8d. The chemical adhesive stress decreases gradually, while the mechanical bite stress and frictional resistance stress increase.
(3)
Slip increases rapidly phase (B–C): As shown in Figure 8e, the cement colloid on the interface will be completely damaged after the cyclic load reached to Pu. With the increase in cyclic loading, the chemical adhesive stress was lost, and the axial load dropped steeply.
(4)
Residual phase (C–D): In this phase, a concrete failure layer was formed as shown in Figure 8f. As the slip increased, the failure layer gradually grinds smooth. The mechanical bite stress gradually decreases and disappears, while the transferred shear force at the interface is carried by friction resistance stress.
Based on the analysis above, the bond stress, slippage and values of characteristic points were obtained and summarized in Table 3.

3.3. Interface Damage Analysis

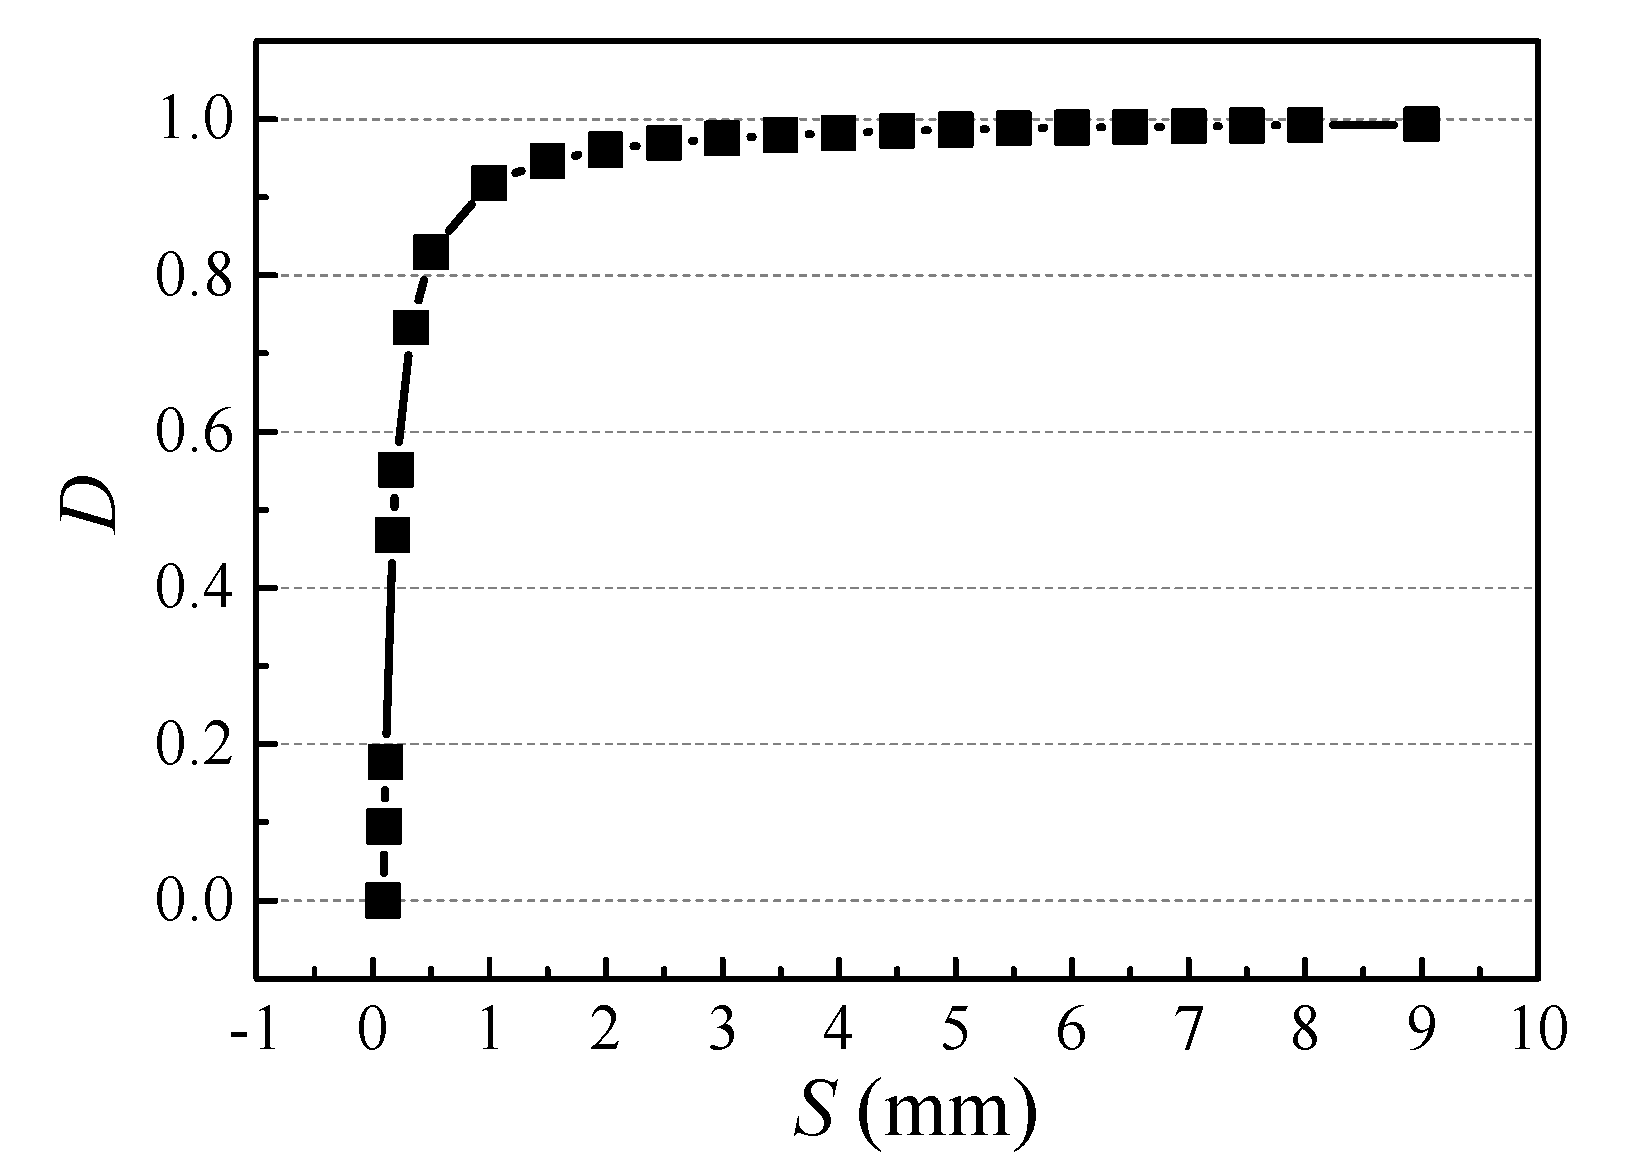
In order to quantitatively describe and analyze the damage degree of bonding interface between concrete and steel, the secant stiffness Ki was used to define the damage factor D. The damage factor D can be calculated as Equation (1).
D = K K i / K
where: K is the initial bonding stiffness of specimen; D is the damage factor of specimen, D = 0 means there is no damage happened at the bonding interface; D = 1 indicates that the bonding interface is destroyed. The larger the value of D, the more serious the damage the bonding interface.
Figure 9 shows a relationship curve between damage factor and the slip value of a typical specimen. The whole bond–slip damage process can be divided into three phases according to the DS curve. (1) Linear rapid damage phase (0~0.6): in this phase, the damage of specimen develops rapidly. DS curve presenting a vertical line, D increases linearly with S. (2) Damage accumulation transition phase (0.6~0.9): damage factor D changes from linear to nonlinear and the development rate of damage slows down gradually. In this phase, the damage of the interface is serious, and the development of damage is basically complete. Usually, some bonding and splitting cracks will occur in this phase. (3) Damage stabilization phase (0.9~1.0): DS curve shows a horizontal line parallel to x axis. Damage factor D does not change, and no new damage appeared.
Figure 10 shows the influence of different factors to DS curves. (1) Replacement ratio of recycled concrete: r has a slight effect on the damage development of bonding interface as shown in Figure 10a. The DS curves with different r will be different at the damage accumulation transition phase. This is because in this phase, most of the cement colloid on the bonding interface is broken, and at the same time, the recycled concrete appears to have bonding cracks, bonding splitting damage. (2) Cover thickness of H-shaped steel: at the initial damage stage, the D-S curves with different Css are basically the same. (3) Transvers reinforcement ratio: the transvers reinforcement ratio has little influence on the damage development of the bonding interface. At the initial loading stage, stirrups basically have little effect on the inhibition of damage. After the recycled concrete was cracked and damage, the stirrups provided lateral binding force to the recycled concrete and inhibited their mutual sliding. Stirrups enhanced the friction stress and mechanical bite stress, but had little influence on the damage development. (4) Strength of recycled concrete: the fc has a great effect on the damage development of the bonding interface. Specimens with higher fc had damage appear later. At the same damage degree, the specimen with higher strength had a small slip. This is mainly because the higher the fc is, the denser the concrete inside, the closer the bond between steel and concrete, and the interface is more difficult to damage.

4. Composition and Solution of Bonding Stress

4.1. Distribution of Bonding Stress

The bond between steel and recycled concrete is composed of chemical bonding stress τca, friction resistance stress τf and mechanical biting stress τm. The chemical bonding stress comes from the chemical adsorption on the bonding interface of cement colloid in recycled concrete after water absorption and hardening, which mainly exists in the area where there is no relative sliding on the bonding interface. When the bonding interface is relatively sliding, the cement colloid is sheared, and the chemical bonding force is greatly reduced. The friction resistance stress is the friction resistance caused by the non-smooth surface after the sliding. The frictional resistance is mainly determined by the normal stress and friction coefficient on the bonding interface, and is mainly related to the transverse constraints such as the cover thickness of H-shaped steel, transverse reinforcement ratio, and the smoothness of the steel surface. The mechanical biting stress is mainly caused by the relative sliding of the bonding interface, and a layered concrete debris is generated after the cement colloid is sheared. The furrow effect occurs when relative slide happens. The mechanical biting stress depends mainly on the transverse restraint and the smoothness of the steel surface.
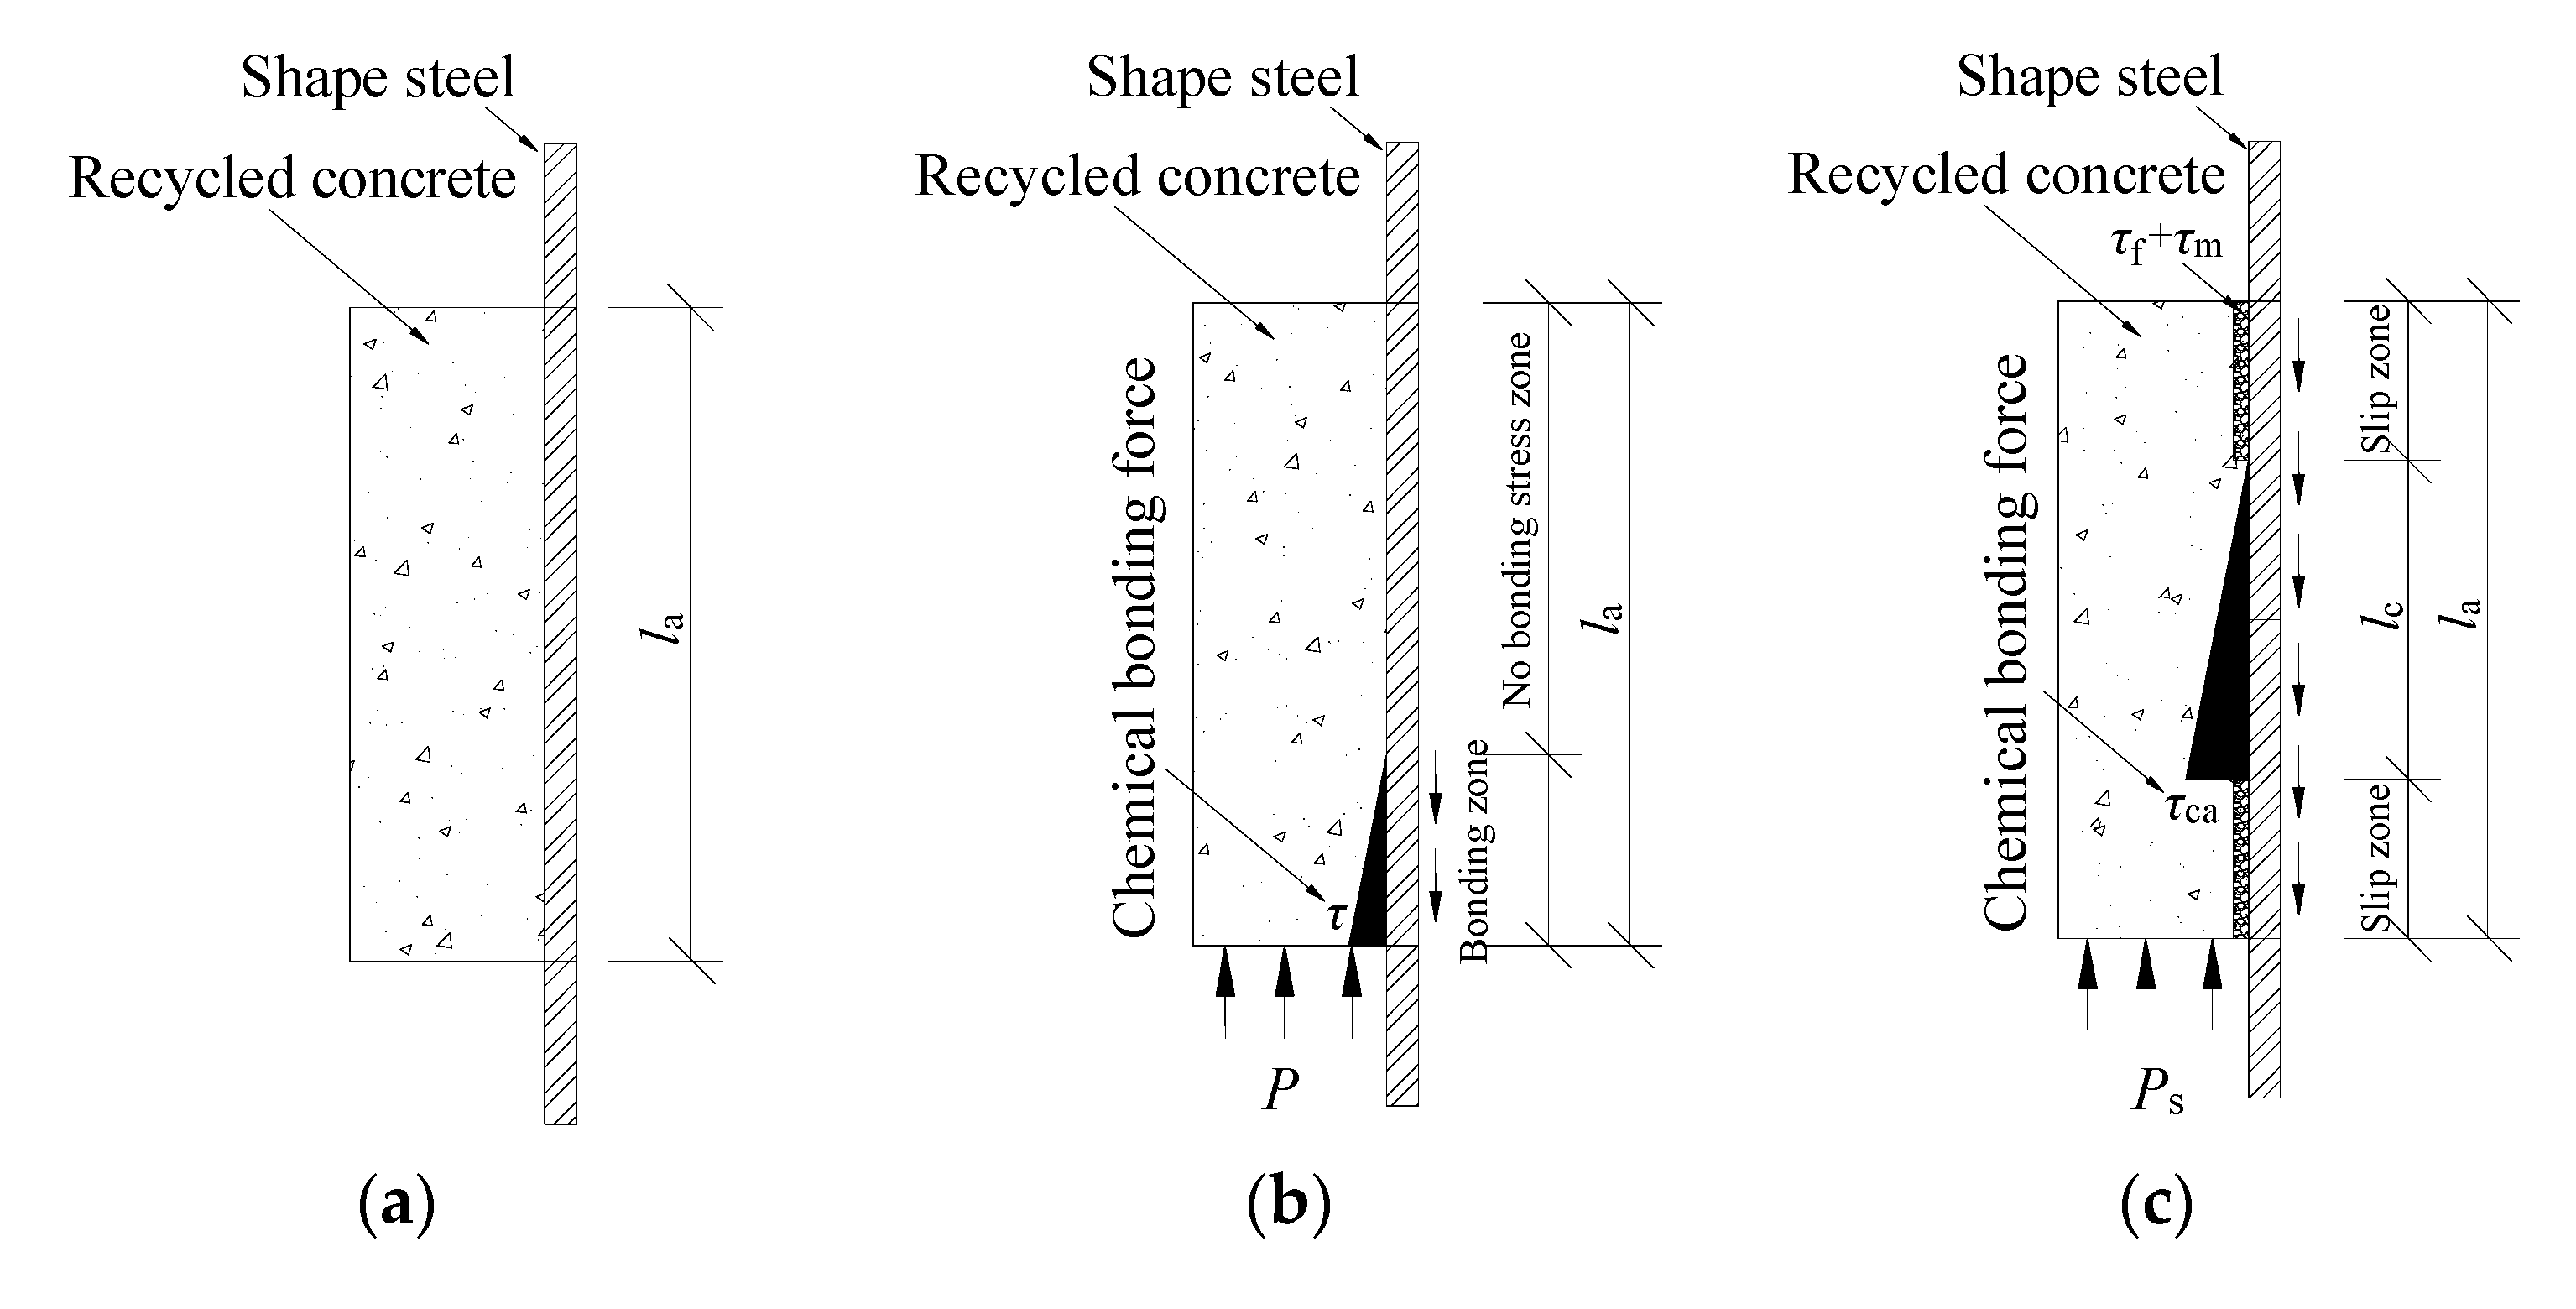
During the loading process, the bonding stress at the interface is not evenly distributed along the embedded length of the specimen. In order to analyze the stress transfer process of the bonding interface in detail, the embedded length la is divided into the slip zone and non-slip zone, as shown in Figure 11. The slip zone is the A region where the slip has already occurred, and the length is ls. The non-slip zone is the region where no slip occurs, including the bonding diffusion zone B (the length of the bonding diffusion zone is defined as lc) and the non-bonded stress zone C. Bonding diffusion zone B refers to a bonding diffusion length lc which always exists in the non-slip zone during the process of shear transfer at the bonding interface. The bonding diffusion zone is located between the slip zone A and the no bonding stress zone C. Zone B moves from both ends of specimen to the middle with the repeated application of load until the bonding interface is completely destroyed.

4.2. Calculation of Bonding Stress

Cyclic loading has a great influence on the bonding stress at the interface. In the process of cyclic loading, continuous loading and unloading causes damage to the bonding interface, resulting in constant changes in the state of bonding interface, which affect the calculation of interface bonding stress. According to the test results of cyclic loading, the bonding strength of the specimen before reaching the peak value has a small degradation and basically presents a straight line, that is, the cyclic loading has a small effect on the bonding stress before peak load. Therefore, it can be approximated that cyclic loading has no effect on the chemical bonding stress τca, friction resistance stress τf, and mechanical biting stress τm before peak loading. However, after peak load, especially in the region between the peak point and residual point, the bonding strength of the specimen degrades greatly, and the cyclic load has a great influence on the bonding stress of the interface. In this phase, the contact surface becomes smooth gradually due to repeated grinding, and the restraint effect of the lateral recycled concrete and transverse stirrups gradually weakens, which leads to the decrease in friction resistance stress τf and mechanical biting stress τm. Therefore, it can be considered that the mechanical biting stress and friction resistance stress of the bonding interface are weakened by cyclic loading, while the chemical bonding stress is not affected. In order to reflect the influence of cyclic loading on bonding stress, a degradation factor of bonding stress ξ was proposed. ξ can be calculated by Equation (2). Then the bonding stress composition of different characteristic loading points have the relationships shown in Equations (3) and (4).
ξ = τ u τ r τ u
τ ca = τ ca s = τ ca u
( τ f + τ m ) = ( τ f s + τ m s ) = ( τ f u + τ m u ) = ξ ( τ f r + τ m r )
where: τ ca s is the chemical bonding stress in micro slip phase; τ ca u is the chemical bonding stress at peak load; ( τ f s + τ m s ) is the friction resistance stress and mechanical biting stress in micro slip phase; ( τ f u + τ m u ) is the friction resistance stress and mechanical biting stress at peak load; and ( τ f r + τ m r ) is the friction resistance stress and mechanical biting stress in residual phase.
Based on the analysis of Section 3.2, the load–slip skeleton curve can be divided into four different characteristic loading points and four loading phases. Correspondingly, there are five critical states in the whole loading process: (a) No damage stage; (b) A state; (c) B state; (d) C state; and (e) D state, as shown in Figure 12.
At the origin point O, the load was just started to load, and no shear force is transferred on the interface. There is no damage occurred in the contact surface and the bond stress distribution is shown in Figure 12a. with the axial load increase, the chemical bonding stress τca and axial load balance each other appear in the bonding diffusion zone at the ends of specimen as shown in Figure 12b. With the application of cyclic loading, the bonding diffusion zone moves from both ends to the middle. The axial load increase linearly with the increase in slip zone. When the axial load increases to point A, the bonding diffusion zone has already moved to the middle of the specimen, and it is about to slide. The bonding stress distribution of the interface is shown in Figure 12c. At this critical point, the shear force transferred by the bonding interface is borne by the chemical bonding stress τca in the bonding diffusion zone, friction resistance stress τf, and mechanical biting stress τm in slip zone. Based on the balance condition of force, the bonding stress at the interface can be calculated by Equation (5).
P s = ( τ f + τ m ) ( l a l c ) C a + 0 l c τ ca l c τ C a d τ
where: la is the embedded length of H-shaped steel; lc is the length of bonding diffusion zone; and Ca is the perimeter of steel cross-section.
With the axial load increase, slip occurred in the bonding diffusion zone and the load–slip curve showed nonlinear growth. The increase rate of the axial load with the increase in slip zone slowed down. When the axial load increases to point B, part of the bonding diffusion zone has already slipped, the chemical bonding stress is reduced, while the friction resistance stress and mechanical biting stress are correspondingly increased. The area enclosed by the bonding stress curve and the embedded length of interface is the largest when the combined force of friction resistance stress and mechanical biting stress is equal to that of chemical bonding stress. At this time, the specimen reaches the peak value Pu. The relationship between peak load and bonding stress are shown in Equations (6)–(9).
P u = ( τ f + τ m ) l a ( l c x ) C a + x l c τ ca l c τ C a d τ
P u = ( τ f + τ m ) ( l a l c + 0.5 x ) C a + 0.5 τ ca l c C a
x l c τ ca = ( τ f + τ m )
x = ( τ f + τ m ) l c / τ ca
where: x is the sliding length of bonding diffusion zone in B critical state.
After B critical state, the bonding diffusion zone slips quickly, and the load drops rapidly. When the axial load increases to point C, all the bonding interfaces are destroyed, and the bonding diffusion zone disappears. The length of slip zone ls is equal to the embedded length of steel la, and the chemical bonding stress completely disappears. At the C state, the relationship between axial load and bonding stress are shown in Equation (10).
P r = ξ r ( τ f + τ m ) l a C a
where: ξ r is the bond stress degradation factor corresponding to residual points.
The bond interface damage is basically complete after C critical state. When the axial load increases to the critical point D, the bonding interface is ground very smooth, and the mechanical biting stress generated by the furrow phenomenon is lost. The shear force transferred by the bonding interface is only borne by the friction resistance stress. Therefore, the relationship between the axial load and bonding stress is shown in Equation (11).
P d = ξ d τ f l a C a
where: ξ d is the bond stress degradation factor corresponding to failure points.
The chemical bonding stress τca, friction resistance stress τf, and mechanical biting stress τm can be obtained by substituting the characteristic bond strength into Equations (5)–(11), and the results are shown in Table 4.

4.3. Parameter Analysis

4.3.1. Replacement Ratio of Recycled Concrete

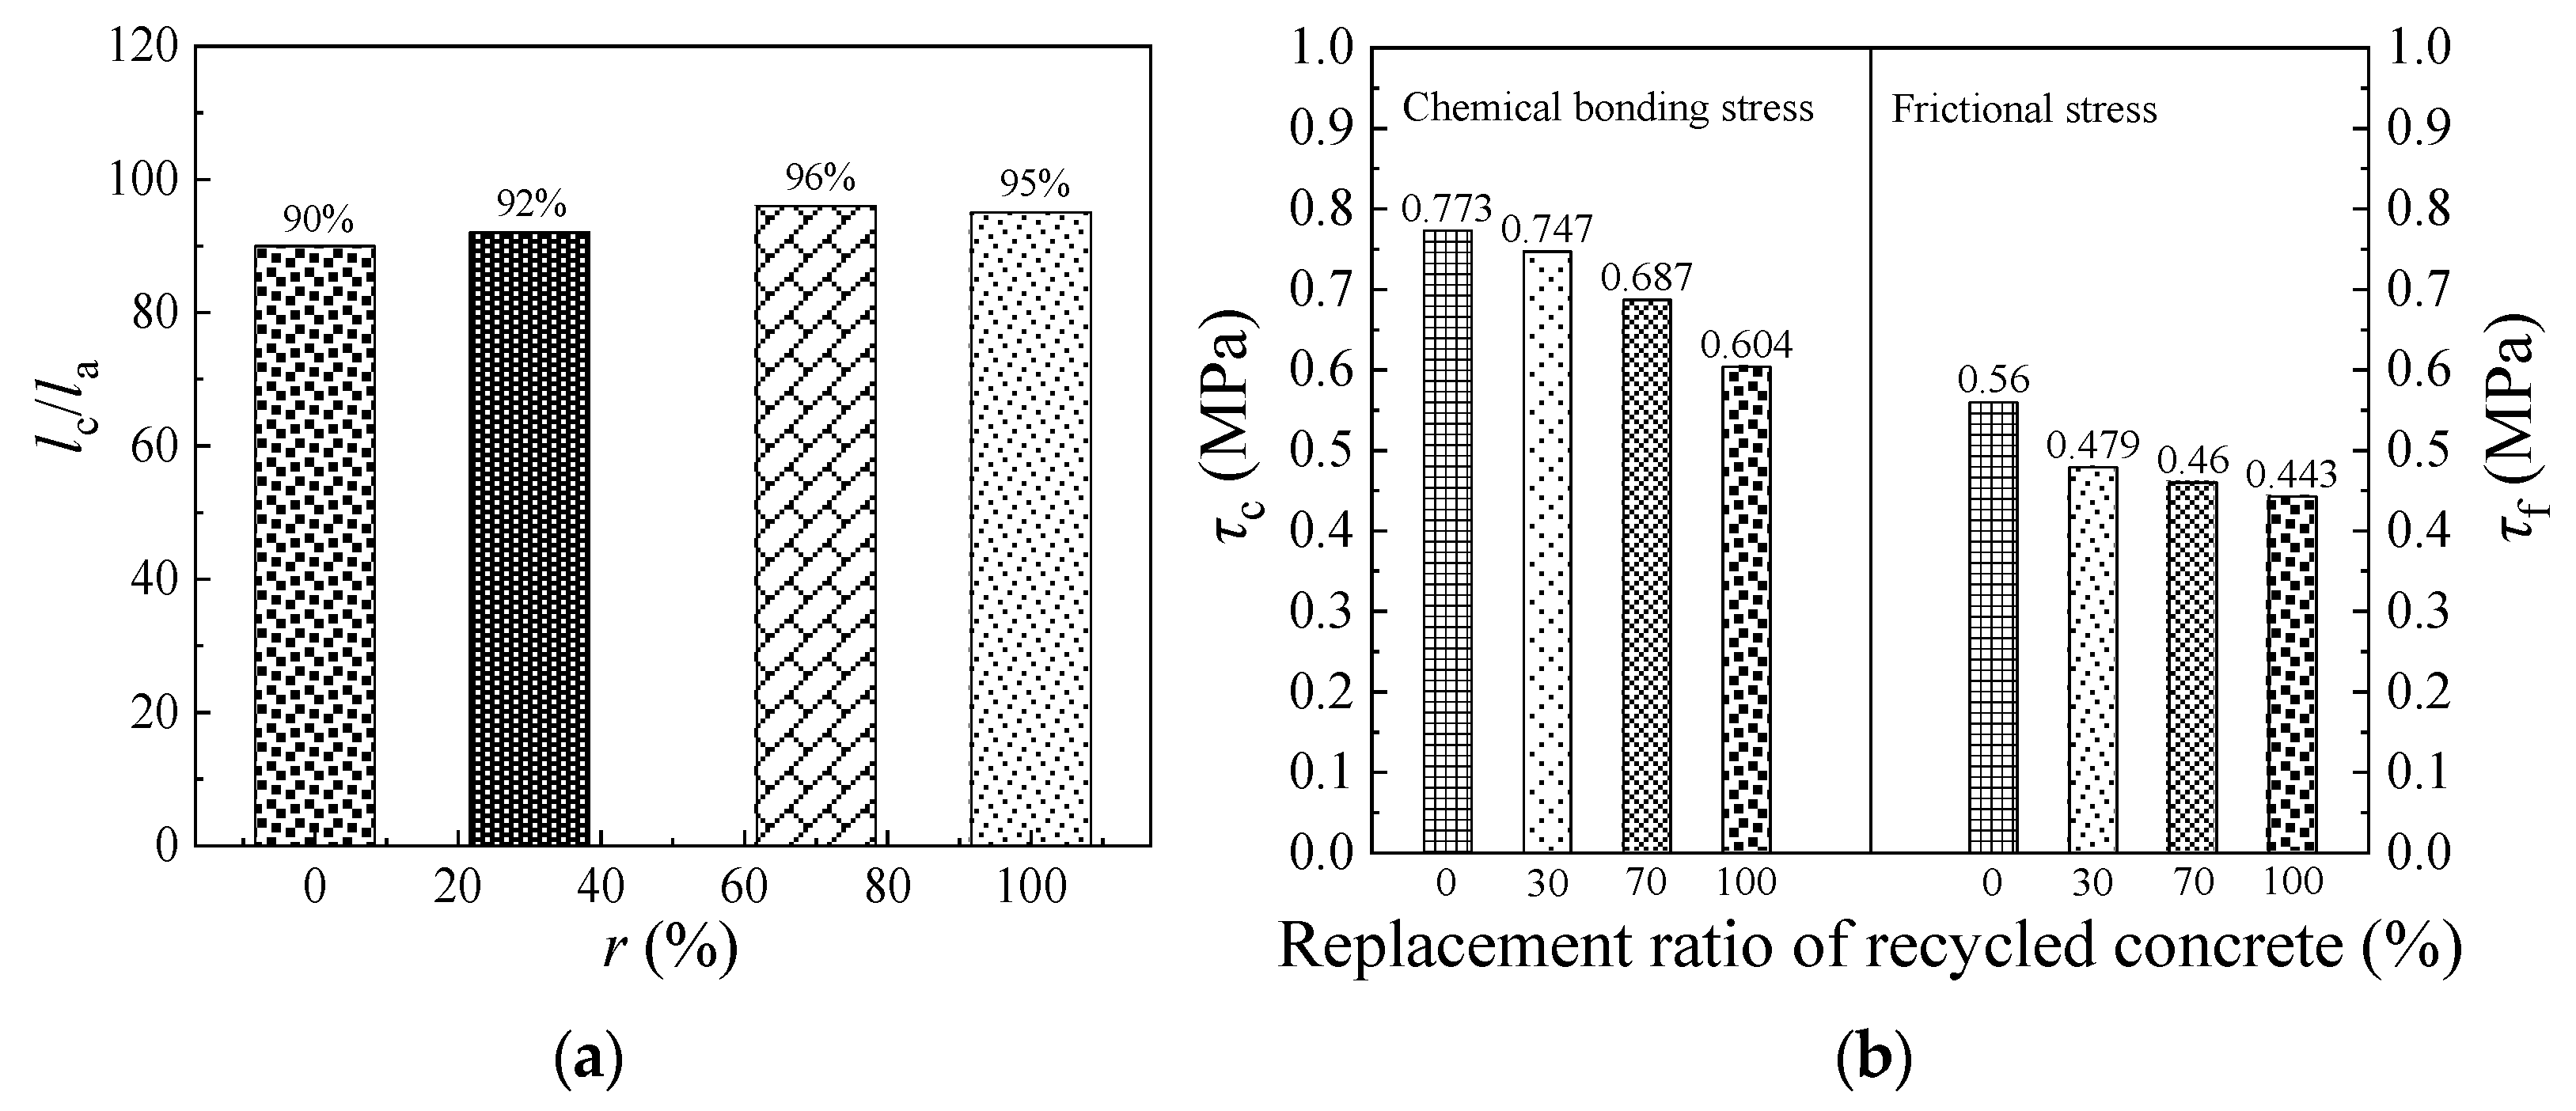
Figure 13a shows the relationship between lc/la (the length of bonding diffusion zone vs. the embedded length of steel) and the replacement ratio of recycled concrete under the same conditions of other analysis parameters. It can be seen from Figure 13a that the length of the bonding diffusion zone accounts for a large proportion of the embedded length of the specimen, reaching to more than 90%. This is partly due to the smaller embedded length designed in this test. lc/la increases with the replacement ratio of the recycled concrete, but not obviously, which indicates that the length of bonding diffusion zone with different replacement ratios of recycled concrete are not the same. The length of the bonding diffusion zone of ordinary concrete is the smallest, which indicating that the cement colloid formed by ordinary concrete has a better adhesive effect. The cement colloid effect gradually decreased with the increase in the replacement ratio.
Figure 13b shows the influence of the replacement ratio on the chemical bonding stress and friction resistance stress. Both chemical bonding stress and friction resistance stress decrease with the increase in replacement ratio. However, the replacement ratio has little effect on friction resistance stress.

4.3.2. Cover Thickness of Shape Steel

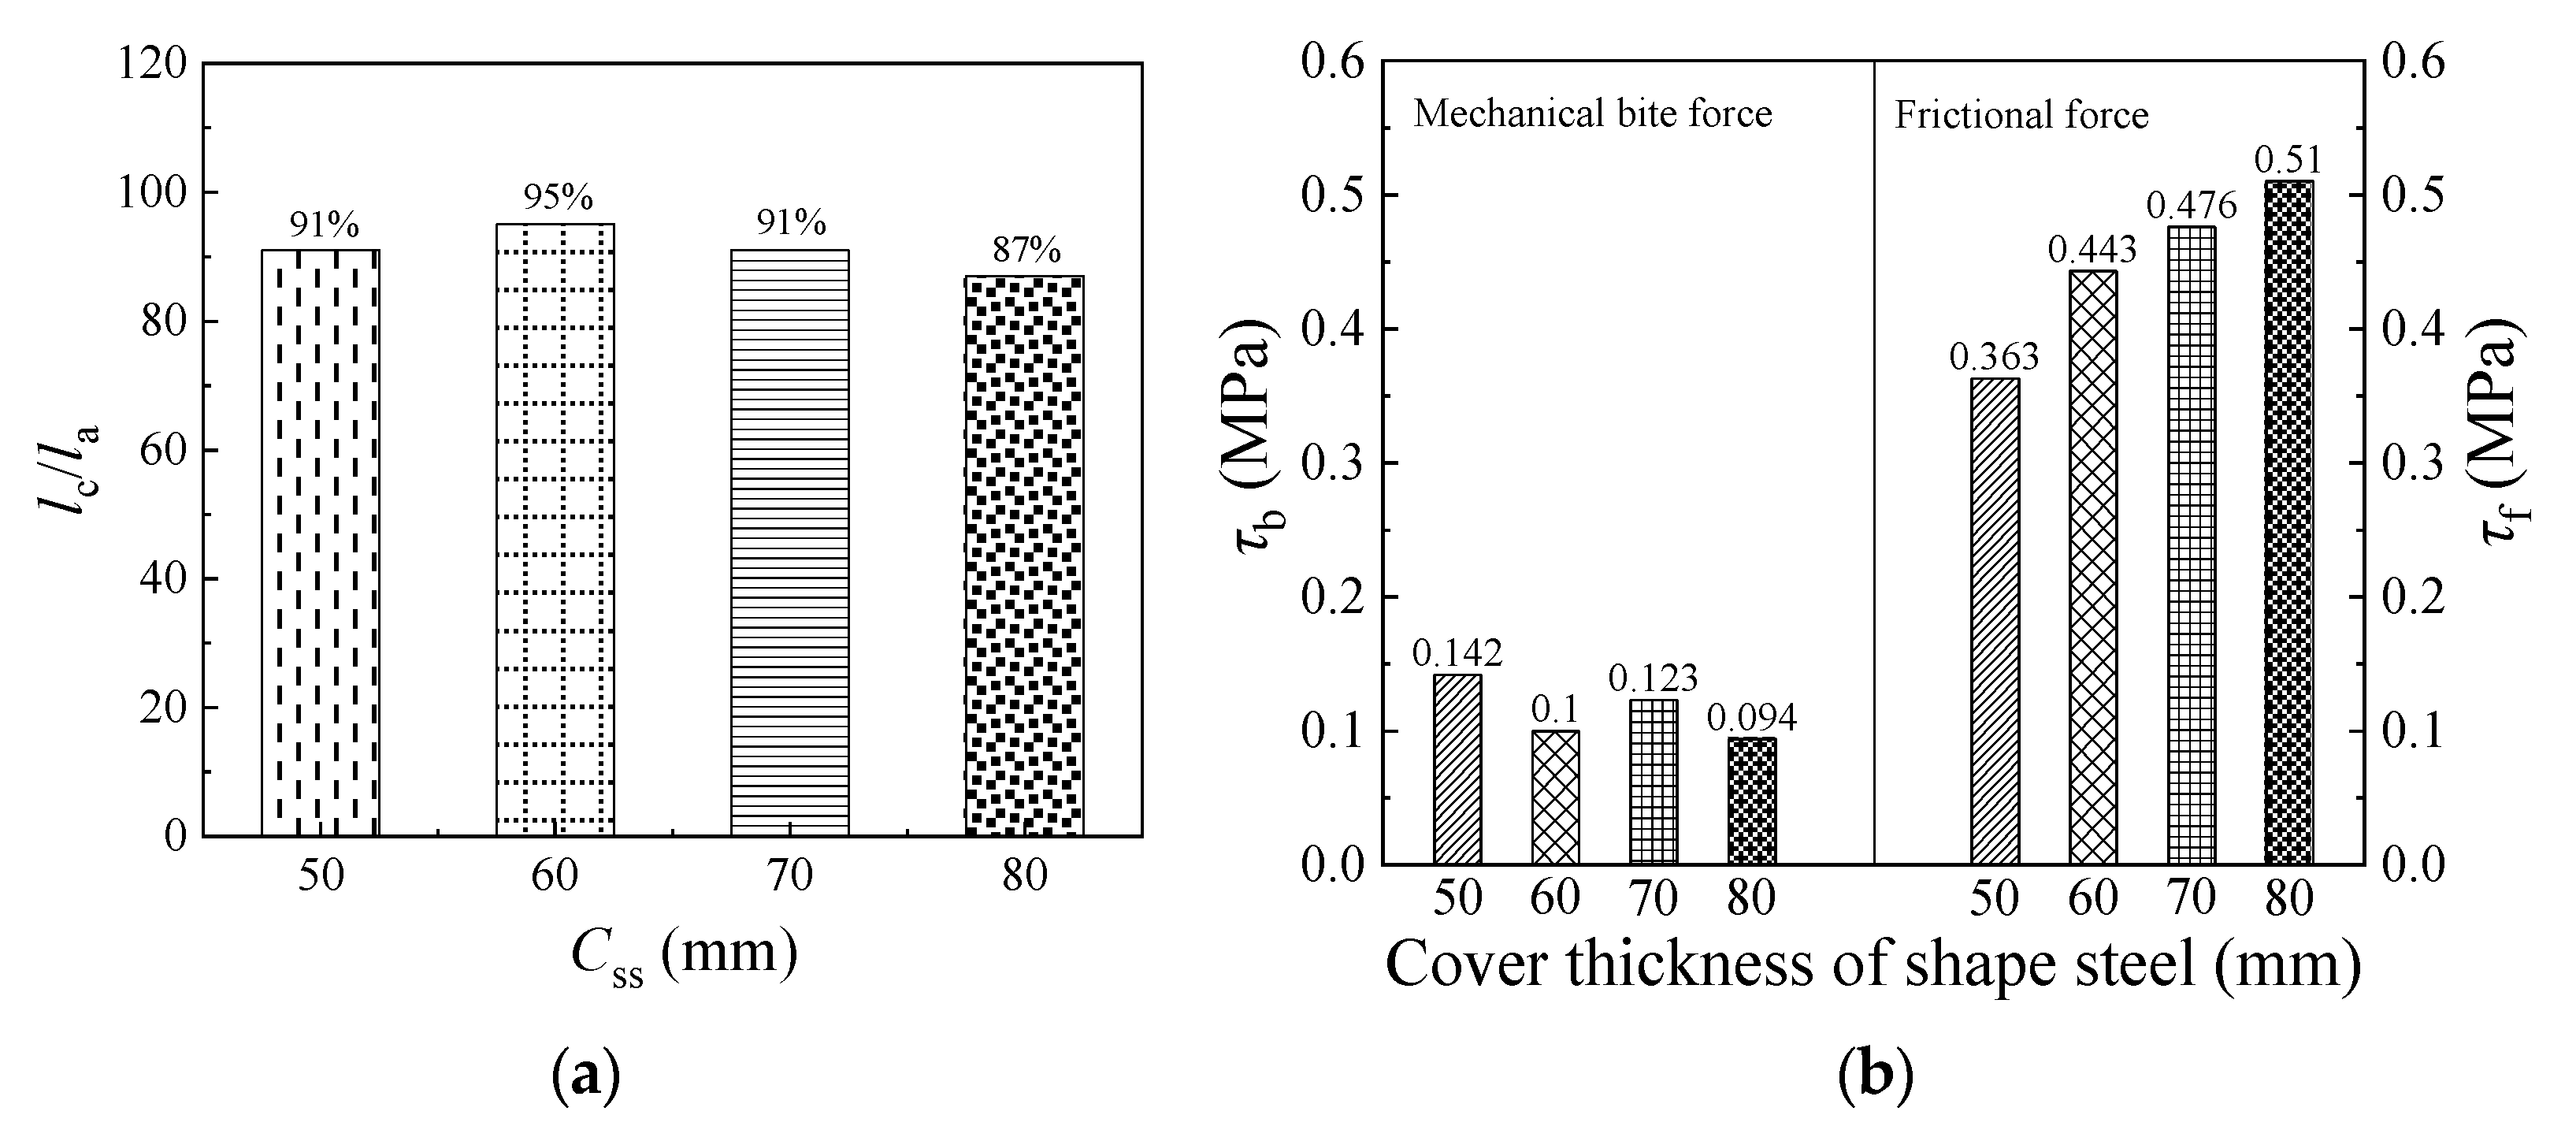
The influence of cover thickness of shape steel on the length of bonding diffusion zone vs. the embedded length of steel is shown in Figure 14a. It can be seen from Figure 14a that the lc/la increases fist then decreases with the increase in cover thickness of the shaped steel. The maximum lc/la value is 95% in SRRC-02, and the minimum lc/la value is 87% in SRRC-08. Within a certain range, increasing the cover thickness of shape steel is beneficial to the bonding performance of the bonding interface.
Figure 14b shows the influence of the cover thickness of shape steel on the mechanical biting stress and friction resistance stress. The cover thickness of shape steel has a more significant influence on the friction resistance stress. The friction resistance stress gradually increases with the increase in the cover thickness of shape steel. The friction resistance stress corresponding to the four cover thicknesses (50, 60, 70 and 80 mm) are 0.363 MPa, 0.443 MPa, 0.476 MPa, and 0.510 MPa, respectively. That is, for every 10 mm increase in the cover thickness, the friction resistance stress will increase by 0.038 MPa on average. This is mainly because the cover thickness provides a strong lateral constraint for the bonding interface, increasing the normal pressure to the bonding interface, and as a result increasing the friction resistance.

4.3.3. Reinforcement Ratio

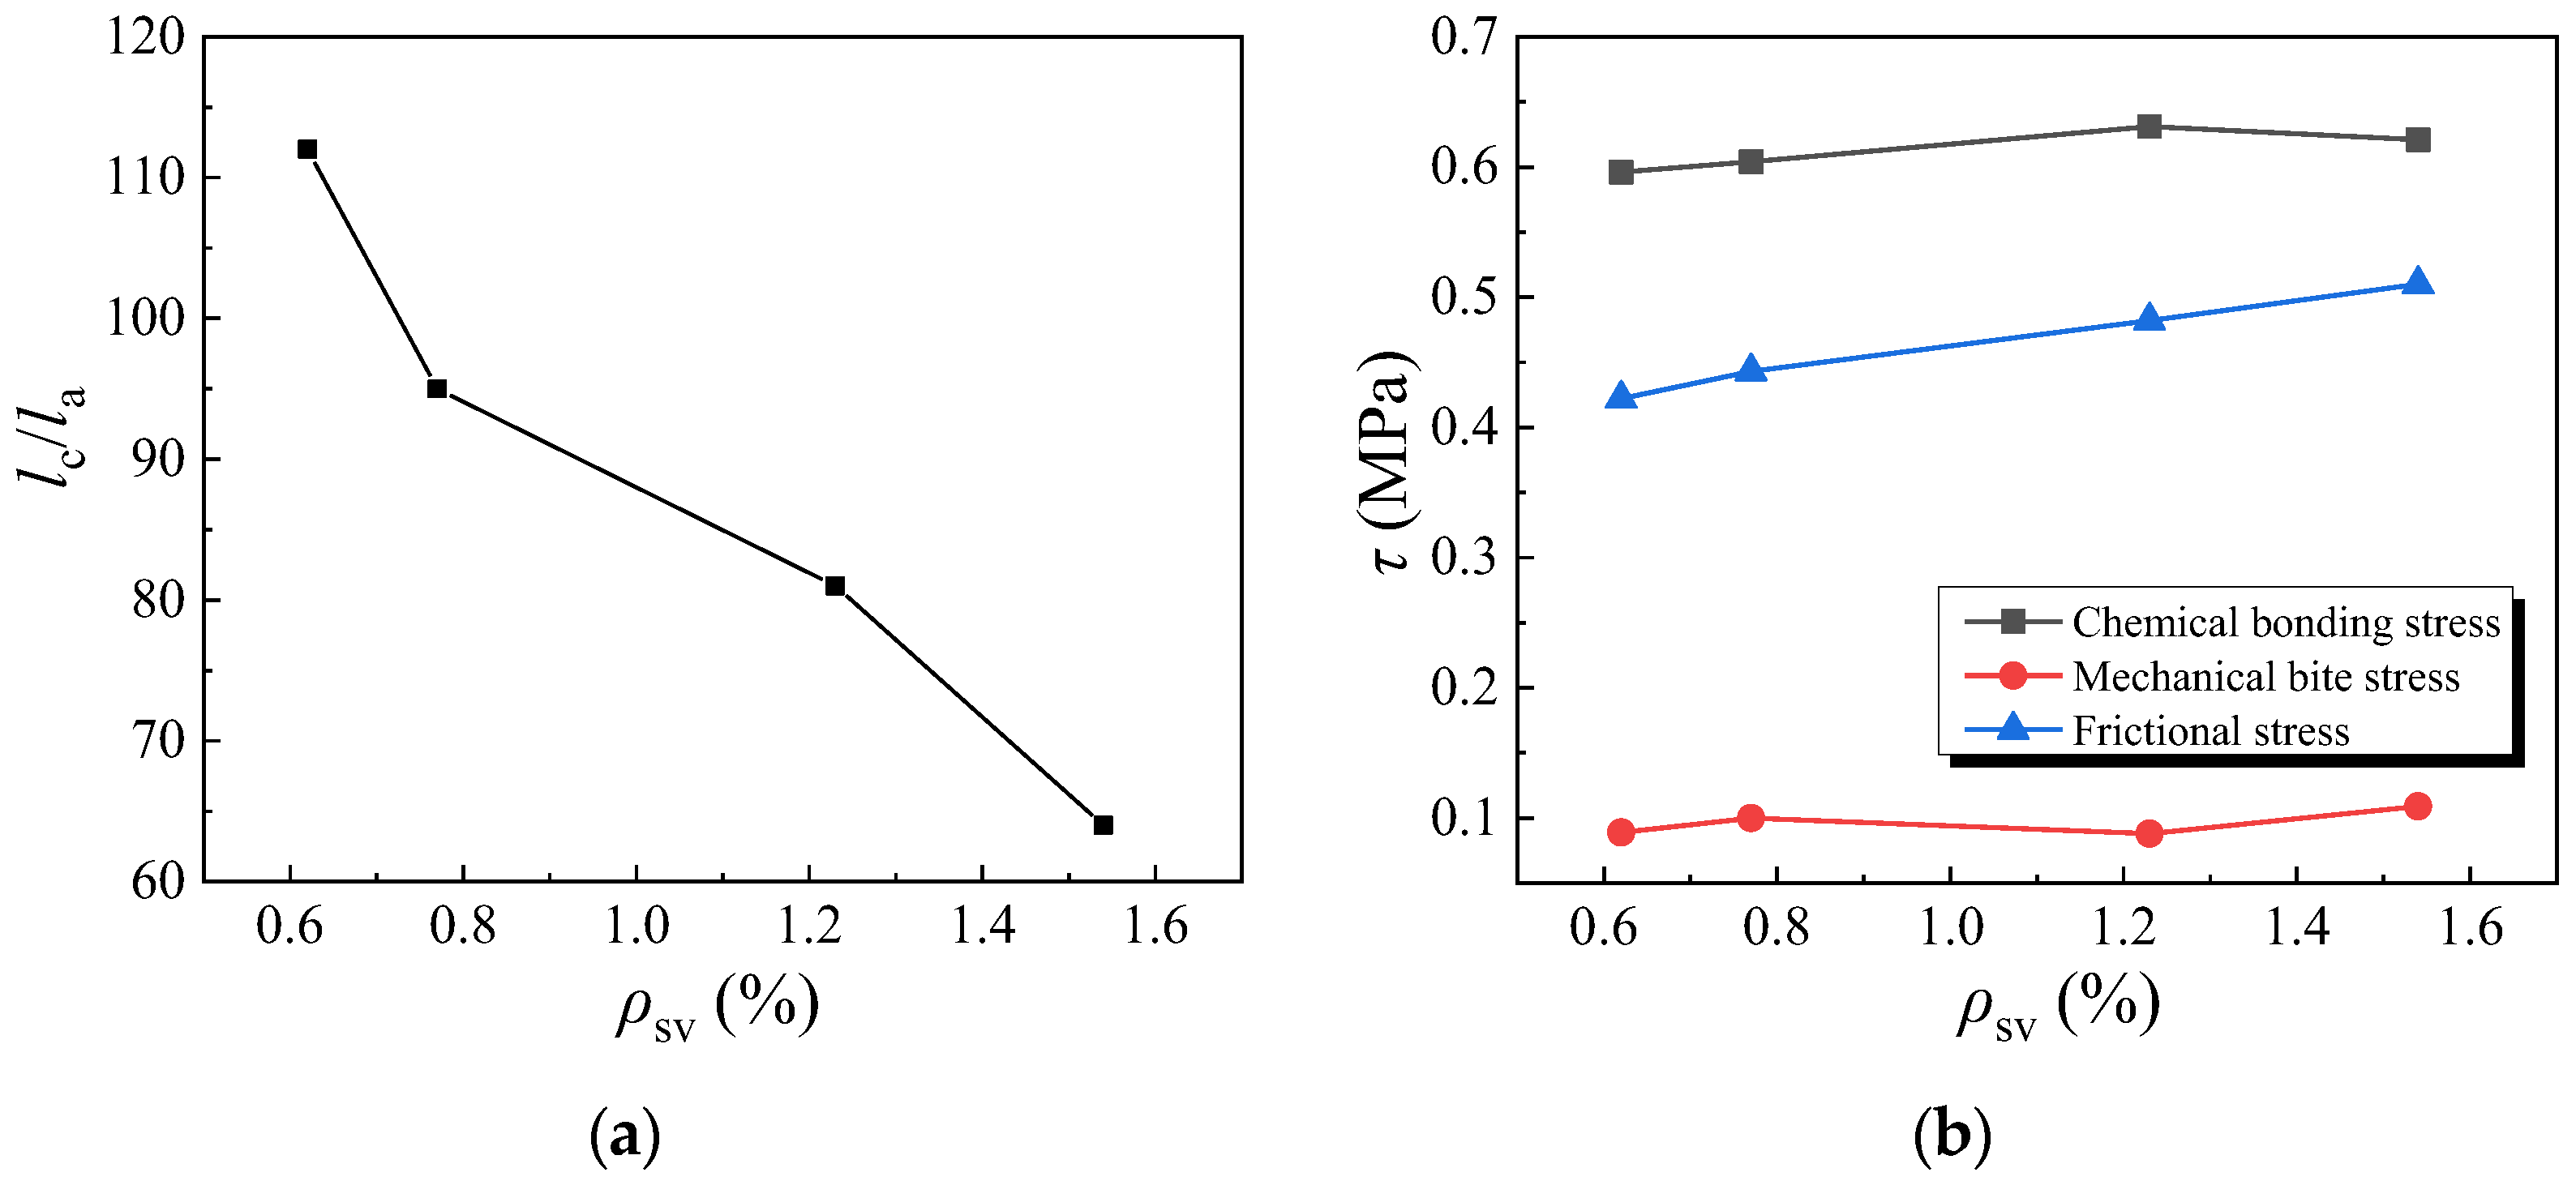
Figure 15a shows the influence of reinforcement ratio on lc/la. Compared with replacement ratio of recycled concrete and the cover thickness of shape steel, the reinforcement ratio has a significant influence on lc/la. lc/la decreases significantly with the increase in the reinforcement ratio, the lc/la value of SRRC-09 is 112%, which is the biggest, the lc/la value of SRRC-11 is 64%, which is smallest. It indicates that the reinforcement ratio has advantages in decreasing the bonding diffusion zone.
The influence of the reinforcement ratio on the chemical bonding stress τca, friction resistance stress τf, and mechanical biting stress τm is shown in Figure 15b. Both chemical bonding stress and friction resistance stress increase with the increase in the reinforcement ratio. When the reinforcement ratio increases from 0.62% to 1.54%, the chemical bonding stress increases from 0.596 MPa to 0.621 MPa, with an increase of 0.025 MPa; while the friction resistance stress increases from 0.422 MPa to 0.510 MPa, with an increase of 0.088 MPa. Therefore, the reinforcement ratio has more influence on the friction resistance stress, but not a significant impact on the mechanical biting stress.

4.3.4. Recycled Concrete Strength

Figure 16a shows the influence of recycled concrete strength on lc/la. lc/la decreases with the increase in recycled concrete strength to some extent, but not too much. Figure 16b shows the influence of recycled concrete strength on the chemical bonding stress and friction resistance stress. Both the chemical bonding stress and friction resistance stress increase with the increase in recycled concrete strength. As can be seen from Figure 16b, the recycled concrete strength has a relative great impact on the chemical bonding stress than friction resistance stress. The chemical bonding stress of SRRC-12 is 0.485, which is the smallest, while the chemical bonding stress of SRRC-14 is the biggest. The chemical bonding stress increases by 0.214 MPa when the concrete strength increased from C30 to C50. However, the influence of recycled concrete stress on frictional resistance is weak compared the impact on chemical bonding stress.

5. Summary and Conclusions

This paper investigated the bond capacity and load transfer mechanisms between H-shaped steel and recycled concrete under cyclic loading. Fourteen specimens were tested and performed to carry out a full-stage analysis. A degradation factor of bonding stress ξ was proposed to investigate the bond degradation at the interface under cyclic loading. The following conclusions can be drawn based on the results and analysis of the test:
  • Based on the effect of shear transfer on the bond capacity, the whole loading procedure can be divided into four phases with four limit points as follows: Micro slip phase (OA)→micro slip point (A)→slip development phase (AB)→ultimate point (B)→slip increasing rapidly phase (BC)→residual point (C)→residual phase (CD).
  • The bond–slip damage process can be divided into three phases: (1) linear rapid damage phase (0~0.6); (2) damage accumulation transition phase (0.6~0.9); and (3) damage stabilization phase (0.9~1.0). The bonding damage develops rapidly, which reaches over 50% when the slip at interface is about 0.2 mm.
  • The bonding stress between H-shaped steel and recycled concrete is composed of chemical bonding stress τca, friction resistance stress τf, and mechanical biting stress τm. The mean values of the chemical bonding stress τca: friction resistance stress τf: mechanical biting stress τm is 1: 0.187: 0.696. In the composition of bonding stress, the chemical bonding stress is the largest, friction resistance stress is the second-largest, and the mechanical biting stress is the least.
  • The average ratio of the length of bonding diffusion zone vs. the embedded length of steel lc/la is 89%. lc/la increases with the increase in the replacement rate of recycled aggregate, and decreases with the increase in the thickness of the section steel protective layer, the reinforcement ratio and the strength of recycled concrete. The chemical bonding stress τca and friction resistance stress τf decrease with the increase in the replacement ratio of recycled concrete, and increase with the increase in cover thickness of shape steel, reinforcement ratio, and recycled concrete strength. The effect of each design parameter on the mechanical biting stress is not obvious.

Author Contributions

Conceptualization, Methodology, Writing—Original draft, J.G.; Writing—Review & Editing, Resources, G.Z.; Supervision, Validation, X.Z. All authors have read and agreed to the published version of the manuscript.

Funding

The work presented herein was conducted as part of a comprehensive research of recycled concrete. A series of research studies about recycled concrete-encased steel frame were sponsored by National Natural Science Foundation of China (Grant No. 51178384 and Grant No. 51608435) and Scientific Research Project of Shanxi Province (Grant No. 2016JQ5113). The writers wish to thank to these sponsors.

Institutional Review Board Statement

Not applicable.

Informed Consent Statement

Not applicable.

Data Availability Statement

Not applicable.

Conflicts of Interest

The authors declare no conflict of interest

References

  1. Ma, H.; Xue, J.Y.; Liu, Y.; Zhang, X. Cyclic loading tests and shear strength of steel reinforced recycled concrete short columns. Eng. Struct. 2015, 92, 55–68. [Google Scholar] [CrossRef]
  2. Javier, E.L.; Sindy, S.P.; Belen, G.F.; Abella, F.M. Bond Behavior of Recycled Concrete: Analysis and Prediction of Bond Stress-Slip Curve. J. Mater. Civ. Eng. 2017, 29, 04017156. [Google Scholar] [CrossRef]
  3. Casuccio, M.; Torrijos, M.C.; Giaccio, G.; Zerbino, R. Failure mechanism of recycled aggregate concrete. Constr. Build. Mater. 2008, 22, 1500–1506. [Google Scholar] [CrossRef]
  4. Deepa, R.S.; Jithin, B. Strength and behaviour of recycled aggregate geopolymer concrete beams. Adv. Concr. Constr. 2017, 5, 145–154. [Google Scholar] [CrossRef]
  5. Kim, S.W.; Yun, H.D. Influence of recycled coarse aggregates on the bond behavior of deformed bars in concrete. Eng. Struct. 2013, 48, 133–143. [Google Scholar] [CrossRef]
  6. Prusty, R.; Mukharjee, B.B.; Barai, S.V. Nano-engineered concrete using recycled aggregates and nano-silica: Taguchi approach. Advances in concrete construction. Adv. Concr. Constr. 2015, 3, 253–268. [Google Scholar] [CrossRef]
  7. Suman, S.; Rajasekaran, C. Mechanical properties of recycled aggregate concrete produced with Portland Pozzolana Cement. Adv. Concr. Constr. 2016, 4, 27–35. [Google Scholar] [CrossRef]
  8. Tabsh, S.W.; Abdelfatah, A.S. Influence of recycled concrete aggregates on strength properties of concrete. Constr. Build. Mater. 2009, 23, 1163–1167. [Google Scholar] [CrossRef]
  9. Thomas, C.; Setién, J.; Polanco, J.A.; Alaejos, P.; de Juan, A.S. Durability of recycled aggregate concrete. Constr. Build. Mater. 2013, 40, 1054–1065. [Google Scholar] [CrossRef]
  10. Xu, J.; Wang, Y.; Ren, R.; Wu, Z.; Ozbakkaloglu, T. Performance evaluation of recycled aggregate concrete-filled steel tubes under different loading conditions: Database analysis and modelling. J. Build. Eng. 2020, 30, 101308. [Google Scholar] [CrossRef]
  11. Corinaldesi, V. Mechanical and elastic behaviour of concretes made of recycled-concrete coarse aggregates. Constr. Build. Mater. 2010, 24, 1616–1620. [Google Scholar] [CrossRef]
  12. Xue, J.; Zhai, L.; Bao, Y.; Ren, R.; Zhang, X. Seismic behavior of steel-reinforced recycled concrete inner-beam-column connection under low cyclic loads. Adv. Struct. Eng. 2017, 21, 631–642. [Google Scholar] [CrossRef]
  13. Han, B.C.; Yun, H.D.; Chung, S.Y. Shear capacity of reinforced concrete beams made with recycled aggregate. ACI Spec. Publ. 2001, 200, 503–516. [Google Scholar]
  14. Maruyama, I.; Sogo, M.; Sogabe, T. Flexural properties of reinforced recycled concrete beams. Mater. Struct. 2004, 8, 525–535. [Google Scholar]
  15. Sato, R.; Maruyama, I.; Sogabe, T.; Sogo, M. Flexural behavior of reinforced recycled concrete beams. J. Adv. Concr. Technol. 2007, 5, 43–61. [Google Scholar] [CrossRef]
  16. Ignjatović, I.S.; Marinković, S.B.; Mišković, Z.M.; Savić, A.R. Flexural behavior of reinforced recycled aggregate concrete beams under short-term loading. Mater. Struct. 2013, 46, 1045–1059. [Google Scholar] [CrossRef]
  17. Breccolotti, M.; Materazzi, A.L. Structural reliability of eccentrically-loaded sections in RC columns made of recycled aggregate concrete. Eng. Struct. 2010, 32, 704–712. [Google Scholar] [CrossRef]
  18. Choi, W.C.; Yun, H.D. Compressive behavior of reinforced concrete columns with recycled aggregate under uniaxial loading. Eng. Struct. 2012, 41, 285–293. [Google Scholar] [CrossRef]
  19. Corinaldesi, V.; Letelier, V.; Moriconi, G. Behaviour of beam-column joints made of recycled-aggregate concrete under cyclic loading. Constr. Build. Mater. 2011, 25, 1877–1882. [Google Scholar] [CrossRef]
  20. Xiao, J.Z.; Sun, Y.D.; Falkner, H. Seismic performance of frame structures with recycled aggregate concrete. Eng. Struct. 2006, 28, 1–8. [Google Scholar] [CrossRef]
  21. Xue, J.; Zhang, X.; Ren, R. Pseudo-dynamic test investigation of recycled concrete-encased steel frame. J. Build. Eng. 2020, 32, 101834. [Google Scholar] [CrossRef]
  22. Yang, Y.; Xue, Y.; Yu, Y.; Gao, F. Experimental study on seismic performance of partially precast steel reinforced concrete columns. Eng. Struct. 2018, 175, 63–75. [Google Scholar] [CrossRef]
  23. Chen, C.; Wang, C.; Sun, H. Experimental study on seismic behavior of full encased steel-concrete composite columns. J. Struct. Eng. 2014, 140, 04014024. [Google Scholar] [CrossRef]
  24. Zhang, X.; Xue, J.; Ren, R. Bond capacity between H-shaped steel and recycled concrete under cyclic loading. Struct. Des. Tall Spec. Build. 2021, 30, e1890. [Google Scholar] [CrossRef]
  25. Jurkiewiez, B.; Meaud, C.; Michel, L. Nonlinear behaviour of steel concrete epoxy bonded composite beams. J. Constr. Steel Res. 2011, 67, 389–397. [Google Scholar] [CrossRef]
  26. Tao, Z.; Song, T.Y.; Uy, B.; Han, L.H. Bond behavior in concrete-filled steel tubes. J. Constr. Steel Res. 2016, 120, 81–93. [Google Scholar] [CrossRef]
  27. Zhang, Q.H.; Jia, D.; Bao, Y.; Dong, S. Flexural behavior of steel-concrete composite beams considering interlayer slip. J. Struct. Eng. 2019, 145, 04019084. [Google Scholar] [CrossRef]
  28. Hotta, H.; Kihara, H.; Takiguchi, K. An empirical study on shear strength of steel encased reinforced concrete members concerning bond stress between steel and concrete. J. Struct. Constr. Eng. 1997, 62, 131–137. [Google Scholar] [CrossRef] [Green Version]
  29. Zheng, H.H.; Chen, Z.P.; Su, Y.S. Research on mechanical behavior and bearing capacity calculation method of steel reinforced recycle aggregate concrete combined component with stud connecters. Ind. Constr. 2016, 46, 97–104. (In Chinese) [Google Scholar]
  30. Bai, G.; Yin, Y.; Liu, C.; Han, Y. Experimental study on bond-slip behavior between section steel and recycled aggregate concrete in steel reinforced recycled concrete structures. J. Build. Struct. 2016, 37, 135–142. [Google Scholar] [CrossRef]
  31. Chen, Z.; Zheng, H.; Xue, J.; Su, Y. Push-out test on interface bond slip behavior and analysis on bond strength between steel and recycled coarse aggregate concrete. J. Build. Struct. 2013, 34, 130–138. [Google Scholar]
  32. Chen, Z.; Chen, Y.; Zheng, H.; Xue, J. Analysis of Influence Factors and Bond Strength of Steel-Recycled Aggregate Concrete Interface. Ind. Build. 2013, 43, 1–6. (In Chinese) [Google Scholar]
  33. Zhou, Y.; Zheng, S.; Chen, L.; Long, L.; Wang, B. Experimental investigation into the seismic behavior of squat reinforced concrete walls subjected to acid rain erosion. J. Build. Eng. 2021, 44, 102899. [Google Scholar] [CrossRef]
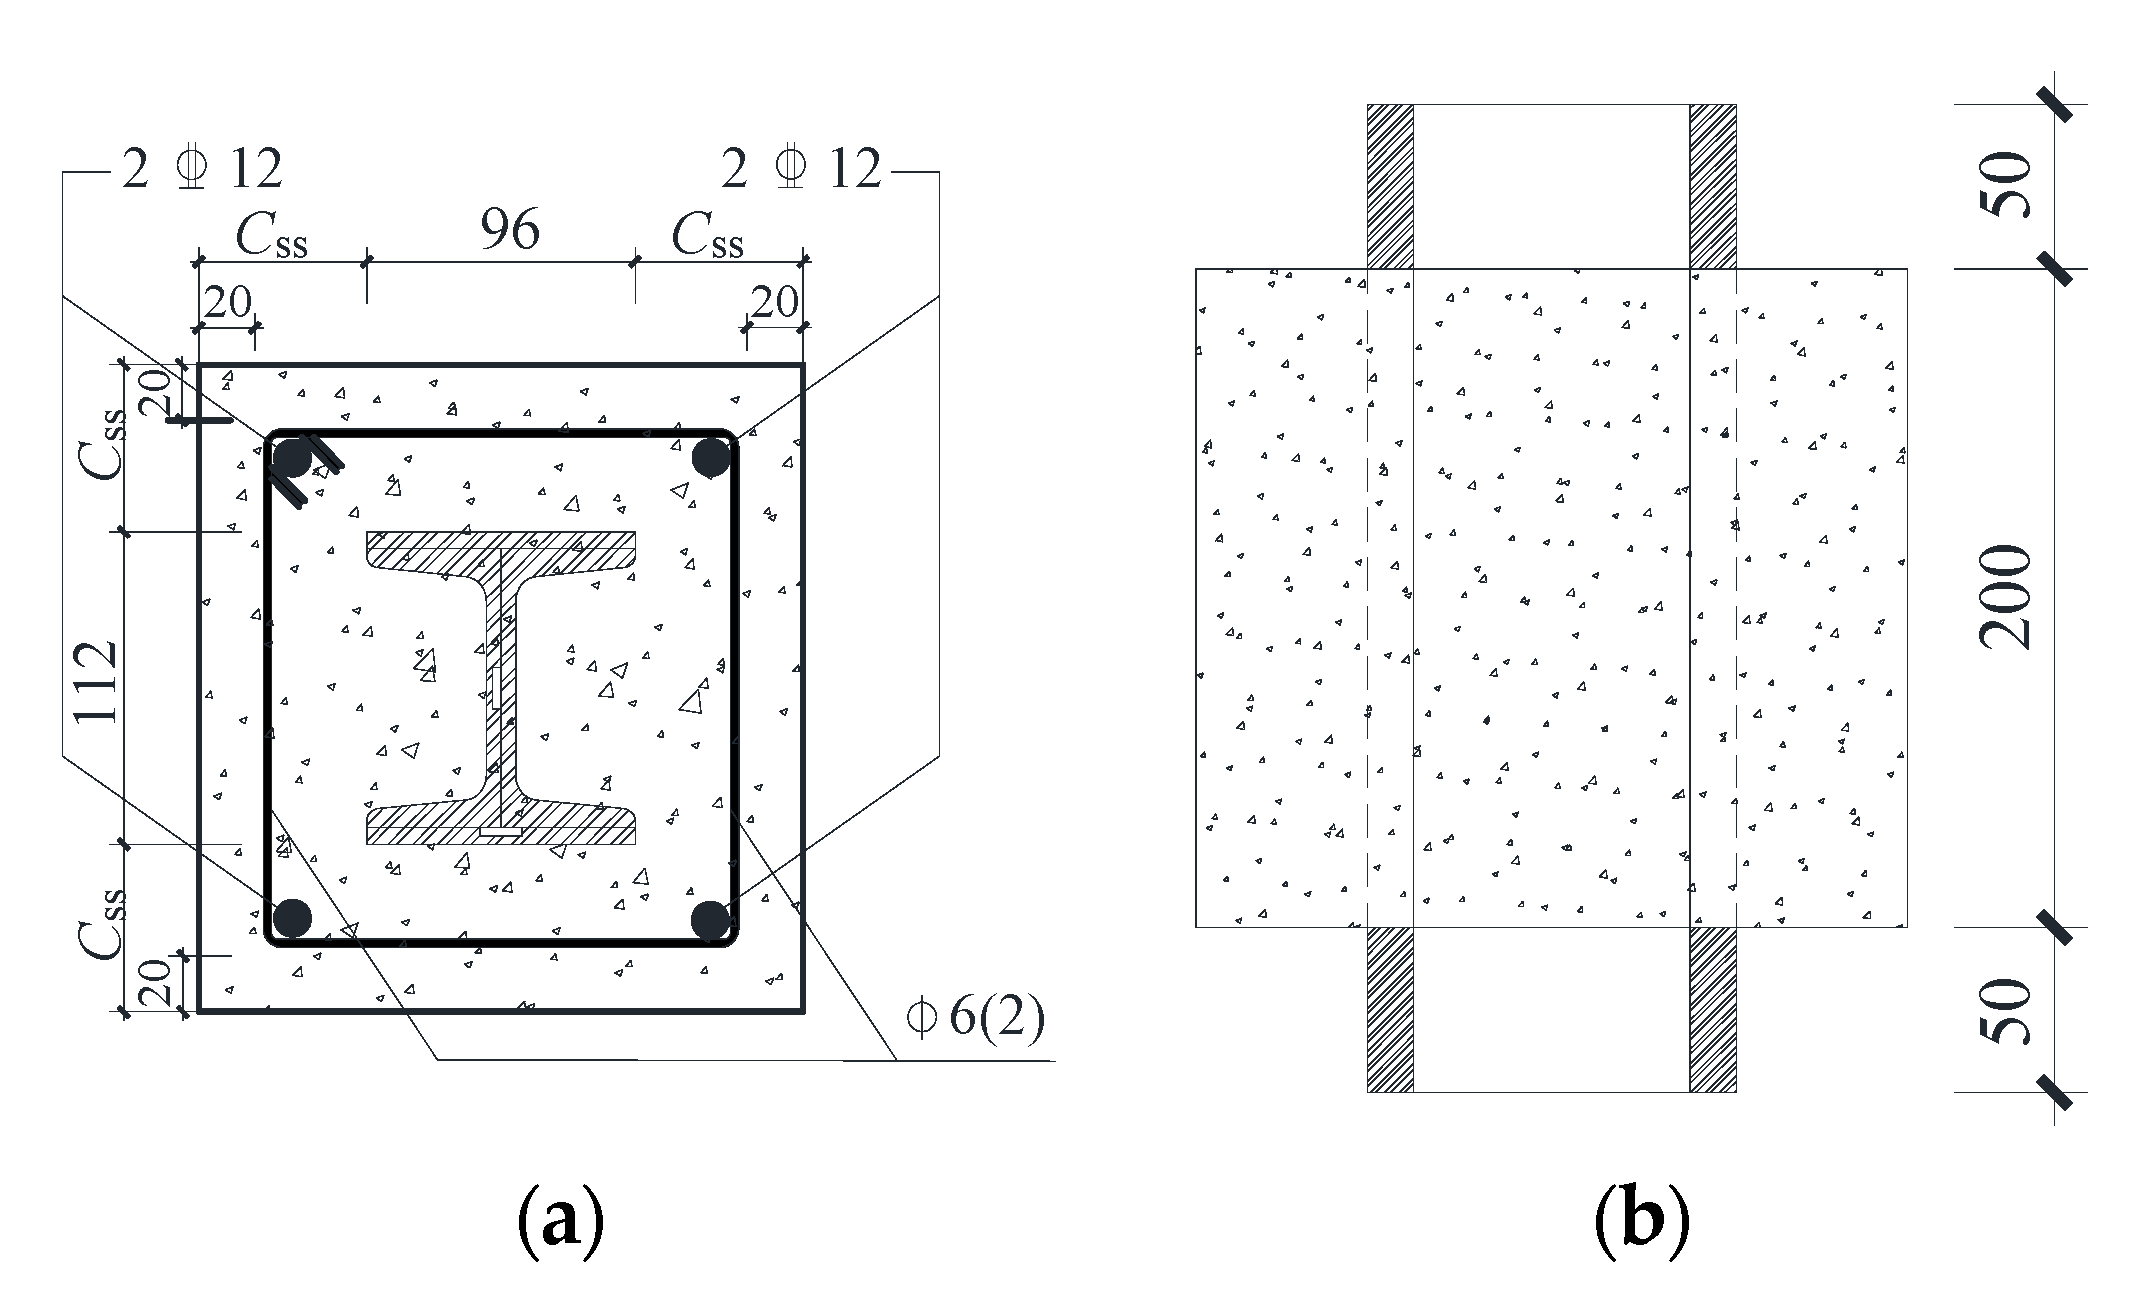
Figure 1. Design dimensions of typical RCES specimen, they should be listed as: (a) Cross-section of typical RCES specimen; (b) elevation of typical RCES specimen.
Coatings 12 01806 g001
Figure 2. Test setup and loading specimen.
Coatings 12 01806 g002
Figure 3. Loading procedure.
Coatings 12 01806 g003
Figure 4. Measure arrangement of RCES specimen, they should be listed as: (a) Cross-section of H-shaped steel (mm); (b) Cross-section of channel steel (mm); (c) Cross-section of steel plate (mm); (d) Layout of strain gauges on web of channel steel (mm); (e) Layout of strain gauges on steel plate (mm); (f) Layout of adhesive sensors on steel plate (mm).
Coatings 12 01806 g004
Figure 5. Typical failure modes of specimen, they should be listed as: (a) RCES-02; (b) RCES-03; (c) RCES-05; (d) RCES-08; (e) RCES-09; (f) RCES-10; (g) RCES-12; (h) RCES-13.
Coatings 12 01806 g005
Figure 6. Failure process of bond–slip skeleton curve, they should be listed as: (a) Ps < Pr; (b) Ps > Pr.
Coatings 12 01806 g006
Figure 7. Method to defined characteristic point.
Coatings 12 01806 g007
Figure 8. Failure process of specimen, they should be listed as: (a) Bonding stress increase; (b) slip critical state; (c) slippage happened; (d) the unbonded stress zone disappeared; (e) ultimate bonding state; (f) residual state.
Coatings 12 01806 g008
Figure 9. Damage factor vs. slip value curve.
Coatings 12 01806 g009
Figure 10. Influence of different factors on interface damage curves, they should be listed as: (a) Influence of r; (b) Influence of Css; (c) Influence of ρsv; (d) Influence of fc.
Coatings 12 01806 g010
Figure 11. Division of the bonding interface.
Coatings 12 01806 g011
Figure 12. Diagram of specimen under different critical states, they should be listed as: (a) No damage stage; (b) Stress development state; (c) A state; (d) B state; (e) C state; (f) D state.
Coatings 12 01806 g012aCoatings 12 01806 g012b
Figure 13. The effect of replacement ratio of recycled concrete on the bonding capacity, they should be listed as: (a) The effect of replacement ratio of recycled concrete on lc/la; (b) effect on the chemical bonding stress and friction resistance stress.
Coatings 12 01806 g013
Figure 14. The effect of cover thickness of steel on the bonding capacity. (a) The effect of cover thickness of steel on lc/la; (b) effect on the mechanical biting stress and friction resistance stress.
Coatings 12 01806 g014
Figure 15. The effect of reinforcement ratio on the bonding capacity. (a) The effect of reinforcement ratio on lc/la; (b) the effect of reinforcement ratio on the bonding stress.
Coatings 12 01806 g015
Figure 16. The effect of recycled concrete strength on the bonding capacity. (a) The effect of recycled concrete strength on lc/la; (b) the effect of recycled concrete strength on chemical bonding stress and friction resistance stress.
Coatings 12 01806 g016
Table 1. Mechanical property of shape steel and steel bars.
Shape Steel and Steel BarsYield Strength
fy/MPa
Yield Strain
εy/10−6
Ultimate Strength
fu/MPa
Elastic Modulus
Es/MPa
Φ6 smooth bars44518784902.12 × 105
Coatings 12 01806 i00112 longitudinal bars50519277152.09 × 105
Shape steelSteel flange35915884692.05 × 105
Steel web33214504292.13 × 105
Steel plate34012014452.15 × 105
Table 2. Mix property and design details of test specimen.
SpecimenW/CSp
(%)
Material Weight (kg·m−3)r
(%)
Css
(mm)
ρsv
(%)
fc
(MPa)
fcu
(MPa)
CementWRCANCASAdded WaterWater Reducer
RCES-010.45364061831158065155.64.07100600.77C4040.32
RCES-020.45364061831158065155.64.07100600.77C4040.32
RCES-030.453640618301158651--4.070600.77C4042.96
RCES-040.4536406183347.4810.665116.684.0730600.77C4041.44
RCES-050.4536406183810.6347.465138.924.0770600.77C4041.06
RCES-060.45364061831158065155.64.07100500.77C4040.32
RCES-070.45364061831158065155.64.07100700.77C4040.32
RCES-080.45364061831158065155.64.07100800.77C4040.32
RCES-090.45364061831158065155.64.07100600.62C4040.32
RCES-100.45364061831158065155.64.07100601.23C4040.32
RCES-110.45364061831158065155.64.07100601.54C4040.32
RCES-120.47373891831151067655.33.90100600.77C3031.90
RCES-130.40364501801132063754.44.50100600.77C4545.44
RCES-140.35355051771116060153.65.06100600.77C5050.05
Note: W represent water; C represent Portland cement; Sp represent sand ratio; r represents replacement ratio of recycled concrete; Css represent cover thickness of H-shaped steel; ρsv represent transvers reinforcement ratio; fc represent the design compressive strength of recycled concrete.
Table 3. Values of characteristic bond strength.
SpecimenPs
(kN)
τs (MPa)Ss (mm)Pu
(kN)
τu (MPa)Su (mm)Pr
(kN)
τr (MPa)Sr
(mm)
RCES-01141.901.290.074150.701.370.52171.500.655.131
RCES-0235.200.320.01889.100.810.48336.620.334.144
RCES-0346.200.420.024103.400.940.36942.900.393.760
RCES-0444.000.400.02396.800.880.40639.690.364.036
RCES-0539.600.360.02192.400.840.43537.450.344.763
RCES-0630.800.280.01681.400.740.50934.130.313.825
RCES-0736.300.330.01993.500.850.46440.470.374.964
RCES-0838.500.350.01994.600.860.41340.820.374.841
RCES-0930.800.280.01689.100.810.44834.480.313.985
RCES-1040.700.370.02189.100.810.39938.510.354.375
RCES-1147.300.430.02590.200.820.38241.800.384.406
RCES-1229.700.270.01673.700.670.39333.020.304.830
RCES-1337.400.340.02094.600.860.44640.710.374.295
RCES-1444.000.400.02397.900.890.48141.800.384.356
Table 4. Composition and solution of bonding stress.
Specimenlc (mm)lc/lax
(mm)
τ c a
(MPa)
τ m
(MPa)
τ f
(MPa)
τ m / τ c a τ f / τ c a
SRRC-02190.7295%168.420.6040.1000.4430.1650.733
SRRC-03179.9290%145.420.7730.0750.5600.0970.724
SRRC-04182.9992%141.600.7470.1090.4790.1460.641
SRRC-05191.7696%152.250.6870.0940.4600.1370.670
SRRC-06181.9291%179.830.5030.1420.3630.2820.723
SRRC-07181.8891%174.300.5960.1230.4760.2070.799
SRRC-08174.3687%166.470.6130.0940.5100.1540.833
SRRC-09223.92112%188.640.5960.0890.4220.1490.708
SRRC-10162.3181%144.360.6310.0880.4820.1400.764
SRRC-11126.4764%123.950.6210.1090.5100.1760.820
SRRC-12179.4090%167.050.4850.1180.3710.2440.765
SRRC-13176.2088%172.250.5970.1230.4790.2070.803
SRRC-14168.2284%146.410.6990.1450.4740.2070.678
Average178.0189%152.670.6850.1290.4600.1870.696
Publisher’s Note: MDPI stays neutral with regard to jurisdictional claims in published maps and institutional affiliations.