Abstract
In order to achieve a comprehensive and accurate evaluation of the safety of compression members made of circular steel tubes, image processing technology is commonly utilized to extract the morphology of the steel tubes before and after rust removal. The obtained results have validated the feasibility and applicability of employing digital cameras and image processing technology to analyze the images of the steel tubes before and after rust removal and to extract useful structural mechanics features. The feature values of the apparent morphology before rust removal grow with the increase of the corrosion depth, while after rust removal, the feature values first increase and then decrease with the growth of the corrosion depth. Based on this fact, a simplified equation is proposed to quantify the relationship between the feature values of the apparent morphology before and after rust removal and the corrosion depth. In continuing, a simple, fairly accurate, and comprehensive safety evaluation methodology for corroded circular steel tubes under compression is established. Finally, an example is illustrated to check the applicability and effectiveness of the proposed approach.
1. Introduction
Corroded circular steel tubes (CCSTs) under compression are often exploited in offshore or marine environments such as bridge structures and offshore wind power structures. Corrosion of the steel members is inevitable in such severe environments, particularly in the presence of high temperature, high humidity, and high chloride ion concentrations. Present studies of CCST-based members [1,2,3,4,5] reveal that corrosion directly influences the effective section and load-carrying capacity of steel members, thereby affecting the overall safety of the whole structure. Therefore, a convenient and accurate evaluation approach for detecting hidden corrosion sooner and avoiding economic losses in CCST-based structures is very important.
Corrosion detection can be performed in various ways according to the instruments and equipment utilized as well as the evaluation target [6,7,8,9,10]. Currently, the most common methods include ultrasonic detection, X-ray, eddy current detection, magnetic flux leakage detection, electrochemical detection, and image processing. Particularly, due to the advantages of simple operation, low cost, and automatic detection and classification, image processing technology has been extensively employed in corrosion detection of aluminum alloy, carbon steel, magnesium alloy, and other metals [11,12,13,14,15] as well as various steel structures, including aircraft, carbon steel storage tanks, pipelines, and others [16,17,18,19,20,21,22,23]. However, this methodology has high requirements for the extracted features, and mostly a single feature is exploited as the corrosion indicator. Additionally, it does not associate with the degradation of mechanical properties of corroded steel components. These limitations hinder the further application of image processing technology in the corrosion detection of steel structures.
Current research results of corrosion assessment methods [24,25,26,27,28,29,30] and specifications [31,32,33] for steel members are mostly focused on components such as underground pipelines, bridge cables, and steel gates, while few studies have been conducted on circular steel tube members. Additionally, the evaluation indicators and parameters employed in existing explorations are different. Most investigations utilized only a single indicator, and some indicators, including member load-carrying capacity and corrosion depth, are difficult to obtain. Thus, it is very challenging to achieve comprehensive assessment of corroded steel members quickly and systematically. Herein, based on the image processing technology, we extract various image feature values of the apparent morphology of CCSTs under compression before and after rust removal. Subsequently, by taking into account the degradation of load-carrying capacity, the corrosion depth, and the morphological characteristics before and after rust removal, a comprehensive corrosion evaluation approach for the safety of CCSTs under compression is proposed.
2. Corrosion Image Acquisition
According to Wu et al. [1], accelerated corrosion of CCSTs under both uniform corrosion and compression is achieved by manually spraying the steel tubes. Uniform corrosion assumption is adopted for CCSTs, that is, the corrosion ratio and corrosion depth of the same CCST are the same. Images of the corroded steel tubes are captured using a digital camera (Canon EOS600D, Canon, Tokyo, Japan) before and after rust removal. The shooting angle and distance are kept the same during image acquisition. The distance from the target is 22 cm ± 1 cm, the image resolution is 3456 × 5184, and the image format is *.JPG. Figure 1 demonstrates image acquisition equipment and schematic representation of members.
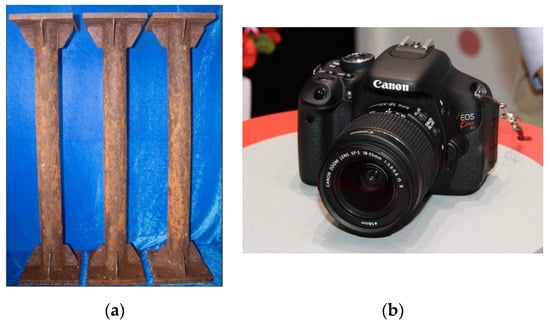
Figure 1.
Image acquisition equipment and schematic representation of members: (a) Schematic representation of CCSTs, (b) Canon EOS600D.
3. Image Preprocessing
In order to facilitate the extraction of image features and reduce the influence of weather, shooting angle, and lighting conditions on image quality, the images are preprocessed by implementing normalization, Gaussian filter denoising, and histogram equalization. Figure 2 shows a typical example of image preprocessing.
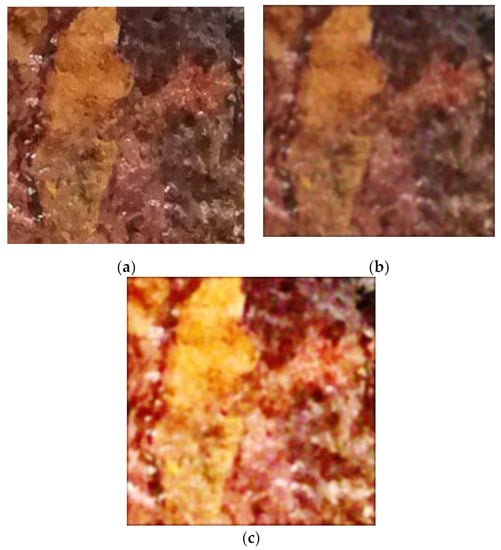
Figure 2.
Preprocessing of the collected images: (a) image normalization, (b) Gaussian filter denoising, (c) histogram equalization.
4. Feature Extraction
Based on the existing methodologies of image feature extraction, the features of the images before and after rust removal are extracted, and the changes of various features with the corrosion depth are appropriately examined.
4.1. Image Features before Rust Removal
4.1.1. Sub-Image Energy Value
The sub-images obtained after the wavelet transform contain scale and direction information. The features calculated from sub-images of different scales constitute a feature set that reflects the scale of corrosion morphology. Generally, the energy feature is exploited for this purpose. Therefore, the energy values of the sub-images after the wavelet transform are extracted, and the calculation equations are provided by [34]:
where H(i) represents the ratio of points with pixel value i to the total number of pixels in the image, n(i) denotes the number of points with pixel value i in the image, and P stands for the total number of pixels in the image.
The energy values of sub-images in various directions and at different decomposition levels have been presented in Table 1. The factor tw denotes the corrosion depth and EH1, EV1, and ED1 represent the sub-image energy values in the horizontal, vertical, and diagonal directions after application of the one-level wavelet transform, respectively. EH2, EV2, and ED2 are the sub-image energy values after applying the two-level wavelet transform in the above-mentioned directions, while EH3, EV3, and ED3 denote the sub-image energy values after application of the three-level wavelet transform in the directions explained above.

Table 1.
Corresponding energy value of sub-images and information entropy for various corrosion depths.
According to Table 1, it can be seen that the energy value of each sub-image before rust removal changes in a different pattern with the growth of corrosion depth. In general, there is a strong relationship between the energy value of each sub-image and the corrosion depth after applying the three-level wavelet transform in all considered directions. Therefore, the energy values (plus error bars) in each direction after application of the three-level wavelet transform are plotted, as illustrated in Figure 3. The relationship between the energy value and corrosion depth can be suitably fitted. The fitting equation and the significance test results have been provided in Table 2.
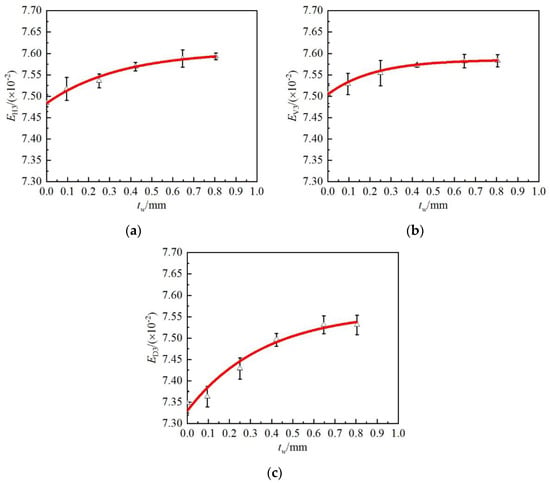
Figure 3.
Relationship between energy values of the sub-images obtained after applying the three-level wavelet transform and corrosion depths: (a) EH3-tw, (b) EV3-tw, (c) ED3-tw.

Table 2.
Fitting equation and significance test of the relationship between image features before rust removal and corrosion depth.
According to Figure 3 and Table 2, after application of the three-level wavelet transform, the energy values in the horizontal, vertical, and diagonal directions all rise with the growth of the corrosion depth, and commonly there exists an exponential relationship between them. The corresponding fitting equation reveals good applicability and effectiveness in the significance test, and thus it can be employed for the calculation of the corrosion depth and corrosion level in engineering practice.
4.1.2. Information Entropy Value
Information entropy represents a measure of the amount of information contained in an image, and it has a negative correlation with the image distribution probability. It implies that the smaller the image probability, the larger the information entropy value. By this view, the information entropy values of the images are appropriately extracted after preprocessing, and the corresponding calculation equations are [35]:
where pi denotes the probability distribution of the i-th gray level in the image.
The calculated information entropy value has been presented in Table 1 and Figure 4. The relationship between the information entropy and corrosion depth is fitted. The fitting equation and the significance test results are given in Table 2.
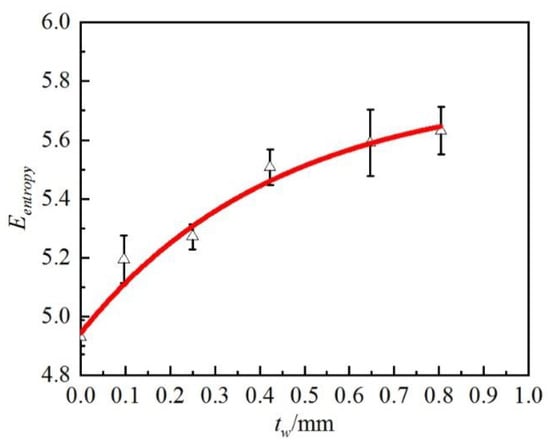
Figure 4.
Relationship between the information entropy value and corrosion depth.
According to Figure 4 and Table 2, the presented results reveal that the information entropy value of the image before rust removal increases with the growth of the corrosion depth, and there exists an exponential relationship between these two factors. The fitting equation suggested for the relationship between the information entropy value and the corrosion depth shows good applicability and effectiveness in the significance test. As a result, the proposed equation can be employed for the evaluation of corrosion depth and corrosion level in engineering practice.
4.2. Image Features after Rust Removal
4.2.1. Sub-Image Energy Value
Similar to Section 4.1.1, the energy values of sub-images in various directions and at different decomposition levels are obtained, as demonstrated in Table 3. It can be seen that the energy value of each sub-image after rust removal changes to varying degrees with the growth of the corrosion depth. Commonly, there is a strong relationship between the energy values after one-level wavelet transform and corrosion depth in all three directions. Figure 5 illustrates the energy values (plus error bars) in each direction after employing the one-level wavelet transform, and the fitting equation and significance test results have been presented in Table 4.

Table 3.
Energy value and information entropy of sub-images corresponding to different corrosion depths.
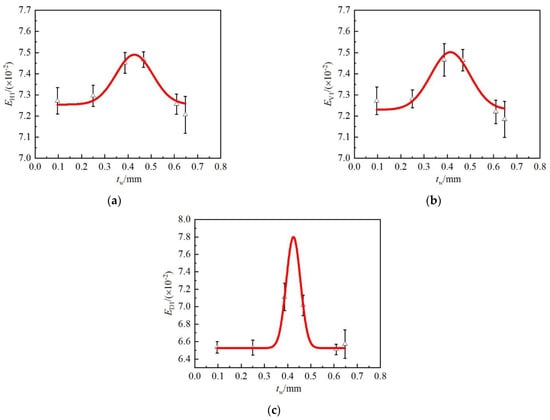
Figure 5.
Relationship between energy values of the sub-images obtained after one-level wavelet transform and the corrosion depths: (a) EH1-tw, (b) EV1-tw, (c) ED1-tw.

Table 4.
Fitting equation and significance test of the relationship between image features after rust removal (sub-image energy value, information entropy value) and corrosion depth.
Based on Figure 5 and Table 4, it can be seen that the energy values in the horizontal, vertical, and diagonal directions after one-level wavelet transform first grows and then decreases with the growth of the corrosion depth, and the relationship corresponds to the Gaussian distribution. The fitting equation for the relationship between the energy value and the corrosion depth reveals good applicability and effectiveness in the significance test. It implies that the proposed formula can be exploited for calculating the corrosion depth and corrosion level in engineering practice.
4.2.2. Information Entropy Value
Similar to Section 4.1.2, the information entropy values are calculated, as presented in Table 3. The information entropy values (plus error bars) have been plotted in Figure 6, and the fitting equation for the relationship between the information entropy value and corrosion depth can be obtained. The fitting equation and significance test results have been provided in Table 4.
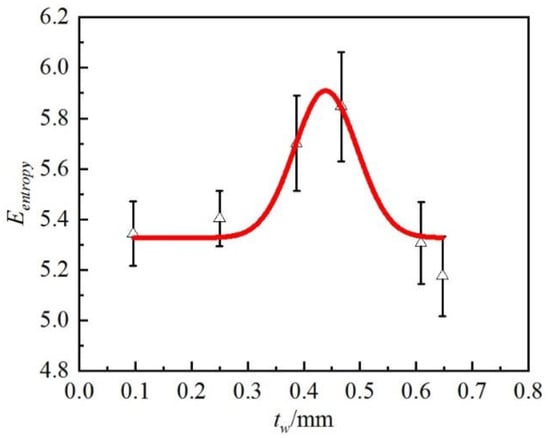
Figure 6.
Relationship between information entropy value and corrosion depth.
According to Figure 6 and Table 4, the results show that the information entropy values after rust removal first rise and then lessen with the increase of the corrosion depth, and their relationship is chiefly governed by a Gaussian distribution. The fitting equation associated with the relationship between the information entropy value and the corrosion depth reveals good applicability and effectiveness in the significance test. This means that the fitting equation can be rationally utilized for evaluating the corrosion depth and corrosion level in engineering practice.
4.2.3. Image Fractal Dimension
The fractal theory is essentially based on fractal geometry and is employed to examine complex natural morphology such as surface roughness and irregularity. It has been broadly applied in image processing, material structure, and quality control. The fractal dimension, as the core of the fractal theory, is a measure of the fractal characteristics. In the present study, the box-counting method, which is the most common and easy to implement, is utilized to evaluate the fractal dimension, D, of the image after rust removal. The calculation equation is expressed by [36]:
where ε represents the size of the box, N(ε) denotes the number of boxes for the morphology after rust removal, which can be calculated according to Equation (6). Vi,j is the volume of the cuboid, and zmaxi,j and zmini,j are the maximum and minimum elevations after rust removal, respectively. If lnN(ε) increases linearly with ln(1/ε), this indicates that the image features after rust removal have fractal characteristics, and the slope of the lnN(ε)~ln(1/ε) curve is the fractal dimension, D, of the image features after rust removal.
The calculated fractal dimensions of the images have been provided in Figure 7 and Figure 8. The relationship between the fractal dimension and the corrosion depth is appropriately fitted. The fitting equation and significance test results are presented in Table 5.
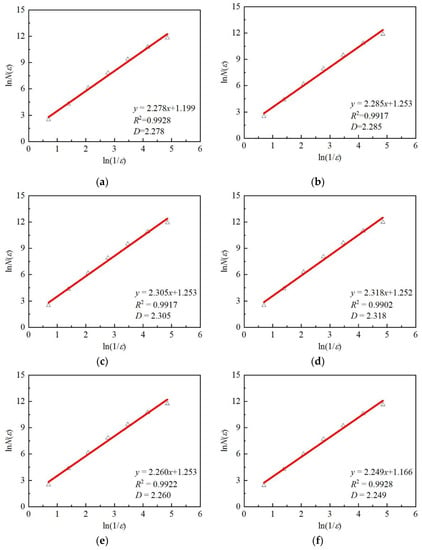
Figure 7.
Fractal dimensions of images at various corrosion depths: (a) tw = 0.096 mm, (b) tw = 0.250 mm, (c) tw = 0.387 mm, (d) tw = 0.467 mm, (e) tw = 0.609 mm, (f) tw = 0.647 mm.
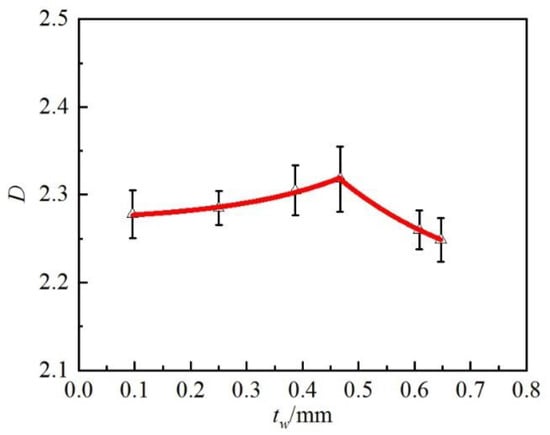
Figure 8.
Relationship between the fractal dimensions and corrosion depths.

Table 5.
Fitting equation and significance test of the relationship between image features after rust removal (fractal dimension) and corrosion depth.
The presented results in Figure 8 and Table 5 display that the fractal dimensions after rust removal first magnify and then drop with the growth of the corrosion depth, which is similar to the image feature laws of sub-image energy value and information entropy value. The fitting equation for the relationship between the fractal dimension and the corrosion depth exhibits good applicability and effectiveness in the significance test. As a result, such a relation can be utilized for expressing the corrosion depth in terms of the corrosion level in engineering practice.
5. Comprehensive Safety Evaluation Method and Verification
According to the specifications in Unified Standard for Reliability Design of Engineering Structures (GB 50153-2008) [32] and Standards for Appraisal of Reliability of Civil Buildings (GB 50292-2015) [33], Table 6 should be employed when steel members are evaluated according to the load-carrying capacity. The grade of each item should be distinctly computed, and then the lowest grade is taken as the safety grade according to the principle of worst action. The standards for each safety grade have been given in Table 7.

Table 6.
Evaluation of load-carrying capacity grades of steel structural members.

Table 7.
Safety grading standards.
For cold-formed thin-walled steel structures, light-weight steel structures, steel piles, and steel structures located in industrial areas with corrosive media or high-humidity and coastal areas, the rusting condition should be employed as an inspection item to determine the grade, as demonstrated in Table 8.

Table 8.
Evaluation of corrosion of steel structural members unsuitable for carrying loads.
In the current specifications, the criteria for the grading of the load-carrying capacity of the members and the corrosion of the members affecting the load-carrying capacity are given. However, in the evaluation of corroded steel members, it is necessary to assess the degree of degradation of the load-carrying capacity and the average corrosion depth of the members. These parameters are often difficult to obtain in practice, which hinders the evaluation of corroded steel members. Hence, it is imperative to establish a simple, fast, and accurate method for evaluating the safety level of corroded members.
5.1. Establishment of the Comprehensive Evaluation Method
Based on the relationship equations between the image features and the corrosion depth before and after rust removal, as well as the equation for the load-carrying capacity of corroded circular steel compression members explained by Wei [5], the classification grades are refined. Subsequently, a comprehensive evaluation approach accounting for the load-carrying capacity degradation, corrosion depth, and morphological features before and after rust removal is proposed. The proposed methodology evaluates the corroded steel compression members from various aspects, and the principle of worst action is utilized to classify the corrosion degree of the members. The specific grades are presented in Table 9, and the criteria for each grade are also given in Table 10.

Table 9.
Comprehensive safety evaluation of CCSTs under compression.

Table 10.
Grading criteria for CCSTs under compression.
To sum up, the application steps of the comprehensive evaluation method for CCSTs can be summarized as follows:
(1) The images of CCSTs are acquired according to the requirements of Section 2;
(2) The images of CCSTs are preprocessed according to the methods in Section 3;
(3) The corresponding image features of the preprocessed corrosion images are extracted according to the methods in Section 4;
5.2. Calculation Example
Taking the three members, i.e., C0–30, C35–90, and C15–180, as introduced by Wu et al. [1] as examples, the overall morphology of these members before and after rust removal has been presented in Figure 9. According to the method mentioned above, the feature values of the images of each member before and after rust removal are extracted, and the safety of the steel compression members is evaluated based on Table 9. The achieved results have been provided in Table 11.
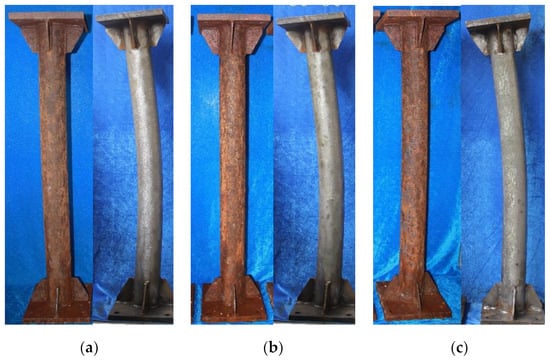
Figure 9.
Morphology of each member before and after rust removal: (a) C0–30, (b) C35–90, (c) C15–180.

Table 11.
Comprehensive safety evaluation results of calculation examples.
According to Table 11, it can be seen that by taking the load-carrying capacity degradation and corrosion depth as the evaluation criteria, only the corrosion of C0–30, C35–90, and C15–180 are classified as Grade c, Grade c, and failure, respectively. By taking the features before and after rust removal as the evaluation criteria, then C0–30, C35–90, and C15–180 are categorized as Grade c, Grade c, and failure, respectively. By implementing the comprehensive evaluation method proposed in this study, C0–30 is Grade c, C35–90 is Grade c, and C15–180 is failure. The obtained results demonstrate that the evaluation results of all these methods are consistent with the results of the standard approach. This implies that the comprehensive evaluation method has good applicability and effectiveness. Compared with the standard evaluation method, the proposed approach is essentially based on the morphological features of the steel members. Therefore, the parameters can be easily obtained, and the evaluation process is simpler than the standard evaluation approach. As a result, the proposed method can be exploited in the practical corrosion evaluation of steel members.
It is necessary to state that in this paper the study mainly focuses on the comprehensive safety evaluation method established for the image features of CCSTs in offshore atmospheric environments. When the component type is square steel tube or angle iron, and the corrosion environment is industrial atmosphere or rural atmosphere, the laws of image features may be different from the results of this paper due to different light, shooting angle, corrosion products, etc. Therefore, the applicability of the study results of this paper to different component types, such as square steel tube and angle iron, and to different atmospheric corrosion environments, such as industrial atmosphere and rural atmosphere, needs further research and discussion.
6. Conclusions
(1) It is feasible and applicable to employ a digital camera and image processing technology for image acquisition and morphological feature extraction of the steel compression members before and after rust removal. Thereafter, simplified calculation equations for the relationships between the feature values and the corrosion depth before and after rust removal were established.
(2) Both the energy value and information entropy value of the sub-images of the members before rust removal increased with the increase of the corrosion depth. After rust removal, the energy value, information entropy, and fractal dimension increased first and then decreased with the increase of the corrosion depth.
(3) A comprehensive evaluation method for CCSTs under compression was established, considering four indicators, namely, the load-carrying capacity degradation, the corrosion depth, and the morphological features before and after rust removal. An example was used to verify the applicability and effectiveness of the proposed method. Compared with the standard evaluation method, the proposed method is simpler, more accurate, and more suitable for practical engineering applications.
Author Contributions
Conceptualization, Z.W.; Data curation, Y.W. and Y.L.; Formal analysis, Y.W. and Y.L.; Funding acquisition, Y.W.; Investigation, Y.W. and Y.L.; Methodology, Y.W. and Z.W.; Project administration, Y.L. and X.X.; Resources, Z.W., J.C., S.-F.J. and D.L.; Supervision, Y.L., Z.W., J.C., S.-F.J. and D.L.; Validation, Y.W. and Y.L.; Writing—original draft, Y.W.; Writing—review & editing, Z.W. and J.C. All authors have read and agreed to the published version of the manuscript.
Funding
This research was funded by the State Grid Fujian Electric Power Co., Ltd. Technology Project (Grant No. 52130422002Z).
Institutional Review Board Statement
Not applicable.
Informed Consent Statement
Not applicable.
Data Availability Statement
All data analyzed in this study are included in this published article.
Acknowledgments
The support provided by the Environmental Corrosion of Electrical Equipment Observation and Research Station is gratefully acknowledged.
Conflicts of Interest
The authors declare that they have no known competing financial interests or personal relationships that could have appeared to influence the work reported in this paper.
References
- Wu, Z.; Wei, Y.; Wang, X.; Huang, C.; Jiang, S.-F. Mechanical Behavior of Circular Steel Tubular Beam-Columns Corroded Uniformly in Atmospheric Environment. Appl. Sci. 2020, 10, 1998. [Google Scholar] [CrossRef]
- Wei, Y.; Wu, Z.; Wang, X.; Jiang, S.-F. Mechanical behavior of locally corroded circular steel tube under compression. Structures 2021, 33, 776–791. [Google Scholar] [CrossRef]
- Wu, Z.Q.; Wei, Y.; Wang, X.T.; Jiang, S.F. Orthogonal experimental study on axial mechanical behavior of locally corroded circular steel tubes. Eng. Mech. 2020, 37, 144–152. [Google Scholar]
- Wang, H.; Zhang, Z.; Qian, H.; Song, G.; Wang, J.; Fan, F. On the axial bearing capability of construction steel tube considering the uniform corrosion effect. India J. Eng. Mater. Sci. 2020, 27, 168–178. [Google Scholar] [CrossRef]
- Wei, Y. Mechanical Behavior and Safety Performance Comprehensive Evaluation Method of Corroded Circular Steel Tube under Compression. Ph.D. Thesis, Fuzhou University, Fuzhou, China, 2021. [Google Scholar]
- Tang, Q.; Du, C.; Hu, J.; Wang, X.; Yu, T. Surface Rust Detection Using Ultrasonic Waves in a Cylindrical Geometry by Finite Element Simulation. Infrastructures 2018, 3, 29. [Google Scholar] [CrossRef]
- Jamshidi, V.; Davarnejad, R. Simulation of corrosion detection inside wellbore by X-ray backscatter radiography. Appl. Radiat. Isot. 2018, 145, 116–119. [Google Scholar] [CrossRef] [PubMed]
- Angani, C.S.; Park, D.G.; Kim, G.D.; Kim, C.G.; Cheong, Y.M. Differential pulsed eddy current sensor for the detection of wall thinning in an insulated stainless steel pipe. J. Appl. Phys. 2010, 107, 09E720. [Google Scholar] [CrossRef]
- Xia, R.; Zhou, J.; Zhang, H.; Liao, L.; Zhao, R.; Zhang, Z. Quantitative Study on Corrosion of Steel Strands Based on Self-Magnetic Flux Leakage. Sensors 2018, 18, 1396. [Google Scholar] [CrossRef]
- Mohammad, N.B.; Jaber, N.; Mohammad, H.S. Development of time-frequency analysis in electrochemical noise for detection of pitting corrosion. Corrosion 2019, 75, 183–191. [Google Scholar]
- Itzhak, D.; Dinstein, I.; Zilberberg, T. Pitting corrosion evaluation by computer image processing. Corros. Sci. 1981, 21, 17–22. [Google Scholar] [CrossRef]
- Frantziskonis, G.N.; Simon, L.B.; Woo, J.; Matikas, T.E. Multiscale characterization of pitting corrosion and application to an aluminum alloy. Eur. J. Mech. A/Solids 2000, 19, 309–318. [Google Scholar] [CrossRef]
- Quin, M.J.; Bailey, M.G.; Ikeda, B.M.; Shoesmith, D.W. Image-Analysis Techniques for Investigating Localized Corrosion Processes; Atomic Energy of Canada Limited, AECL(Report): Mississauga, Canada, 1993; pp. 1–51. [Google Scholar]
- Codaro, E.; Nakazato, R.; Horovistiz, A.; Ribeiro, L.; Ribeiro, R.; Hein, L. An image processing method for morphology characterization and pitting corrosion evaluation. Mater. Sci. Eng. A 2002, 334, 298–306. [Google Scholar] [CrossRef]
- Livens, S.; Scheunders, P.; Wouwer, G.V.D.; Dyck, D.V.; Smets, H.; Winkelmans, J.; Bogaerts, W. Classification of corrosion images by wavelet signatures and LVQ networks. In Proceedings of the International Conference on Computer and Patterns, Prague, Czech Republic, 6–8 September 1995; pp. 538–543. [Google Scholar]
- Momber, W.A. Quantitative performance assessment of corrosion protection systems for offshore wind power transmission platforms. Renew. Energy 2016, 94, 314–327. [Google Scholar] [CrossRef]
- Palakal, M.J.; Pidaparti, R.M.V.; Rebbapragada, S.; Jones, C.R. Intelligent computational methods for corrosion damage assessment. Aiaa J. 2015, 39, 1936–1943. [Google Scholar] [CrossRef]
- Medeiros, F.N.S.; Ramalho, G.L.B.; Bento, M.P.; De Medeiros, L.C.L. On the Evaluation of Texture and Color Features for Nondestructive Corrosion Detection. EURASIP J. Adv. Signal Process. 2010, 2010, 817473. [Google Scholar] [CrossRef]
- Wang, S.Y.; Kong, D.Y.; Song, S.Z. Diagnosing corrosion modality system of metallic material in seawater based on fuzzy pattern recognition. Acta Metall. Sin. 2001, 37, 517–521. [Google Scholar]
- Kong, D.Y.; Wang, S.Y.; Song, S.Z. Study on relativity between corrosion images and data of metallic samples in seawater. J. Chin. Soc. Corros. Prot. 2001, 21, 352–356. [Google Scholar]
- Xia, Y. A Study on Corrosion Detection for q235 Steel in Seawater Based on Image Analysis. Master’s Thesis, Dalian University of Technology, Dalian, China, 2017. [Google Scholar]
- Su, M. Research on Feature Extraction of Metal Plate Defects Based on Image Information. Master’s Thesis, Northeastern University, Shenyang, China, 2013. [Google Scholar]
- Huang, L.J. Research on Surface Damage Characteristic Acquirement and Evalutaion Technology for Water Pipeline. Master’s Thesis, Harbin Institute of Technology, Harbin, China, 2008. [Google Scholar]
- Zhu, Z.T.; Mu, Z.T.; Su, W.G.; Chen, D.H. Corrosion Grade Evaluation of Aluminum Alloy Based on Image Processing Technique. J. Nanjing Univ. Aeronaut. Astronaut. 2010, 42, 383–386. [Google Scholar]
- Momber, A. Colour-based assessment of atmospheric corrosion products, namely of flash rust, on steel. Mater. Corros. 2010, 63, 333–342. [Google Scholar] [CrossRef]
- Su, W.G.; Guo, S.C.; Zhou, J.G.; Song, Q.; Zhang, L. Study of corrosion grade assessment method based on invariant moment theory. Equip. Environ. Eng. 2012, 9, 17–22. [Google Scholar]
- Gong, Y.Z.; Li, Z.C.; Feng, X.L.; Guan, L.; Su, Q.Y.; Zhang, X.W. Evaluation of copper strip corrosion test based on color features. Corros. Prot. 2013, 34, 117–120. [Google Scholar]
- Yao, G.W.; Chen, X.S.; Zhong, L. Study on Corroded Cable Evaluation Based on Gray Image Analysis. J. Chongqing Jiaotong Univ. (Nat. Sci.) 2016, 35, 10–12. [Google Scholar]
- Qan, E.M.; Xu, H.K.; Huang, F.W.; Zhou, J. Study on assessment of corrosion of steel-strand cable in cable structure bridge. J. Highw. Transp. Res. Dev. 2017, 34, 69–76. [Google Scholar]
- Zhao, X.F.; Fu, D.M.; Pei, Z.B.; Li, X.G. Optimization of sectional dose response function and determination method of corrosion category for carbon steel. Corros. Prot. 2018, 39, 805–809. [Google Scholar]
- SY/T 10048-2003; Recommended Practice for Evaluation of Corroded Pipelines. China Architecture & Building Press: Beijing, China, 2003.
- GB 50153-2008; Unified Standard for Reliability Design of Engineering Structures. China Architecture & Building Press: Beijing, China, 2008.
- GB 50292-2015; Standard for Appraisal of Reliability of Civil Buildings. China Architecture & Building Press: Beijing, China, 2015.
- Tao, L.; Song, S.Z.; Wang, S.Y.; Zhang, X.Y.; Liu, M.; Lu, F. Image analysis of periodic rain accelerated corrosion of aeronautical aluminum alloys. Mater. Sci. Eng. A 2008, 476, 210–216. [Google Scholar] [CrossRef]
- Zhang, Z.; Wang, Y.P.; Xue, G.X. Digital Image Process and Computer Vision; Posts and Telecom Press: Beijing, China, 2010. [Google Scholar]
- Sun, X.; Wu, Z.Q.; Huang, Y. Fractal Theory and Its Applications; Press of University of Science and Technology of China: Hefei, China, 2003. [Google Scholar]
Publisher’s Note: MDPI stays neutral with regard to jurisdictional claims in published maps and institutional affiliations. |
© 2022 by the authors. Licensee MDPI, Basel, Switzerland. This article is an open access article distributed under the terms and conditions of the Creative Commons Attribution (CC BY) license (https://creativecommons.org/licenses/by/4.0/).