
Study on Composite Improvement of Silt Sites by Lignin and Sodium Methylsilicate and Its Micro Mechanism

Abstract
:1. Introduction
2. Materials and Test Methods
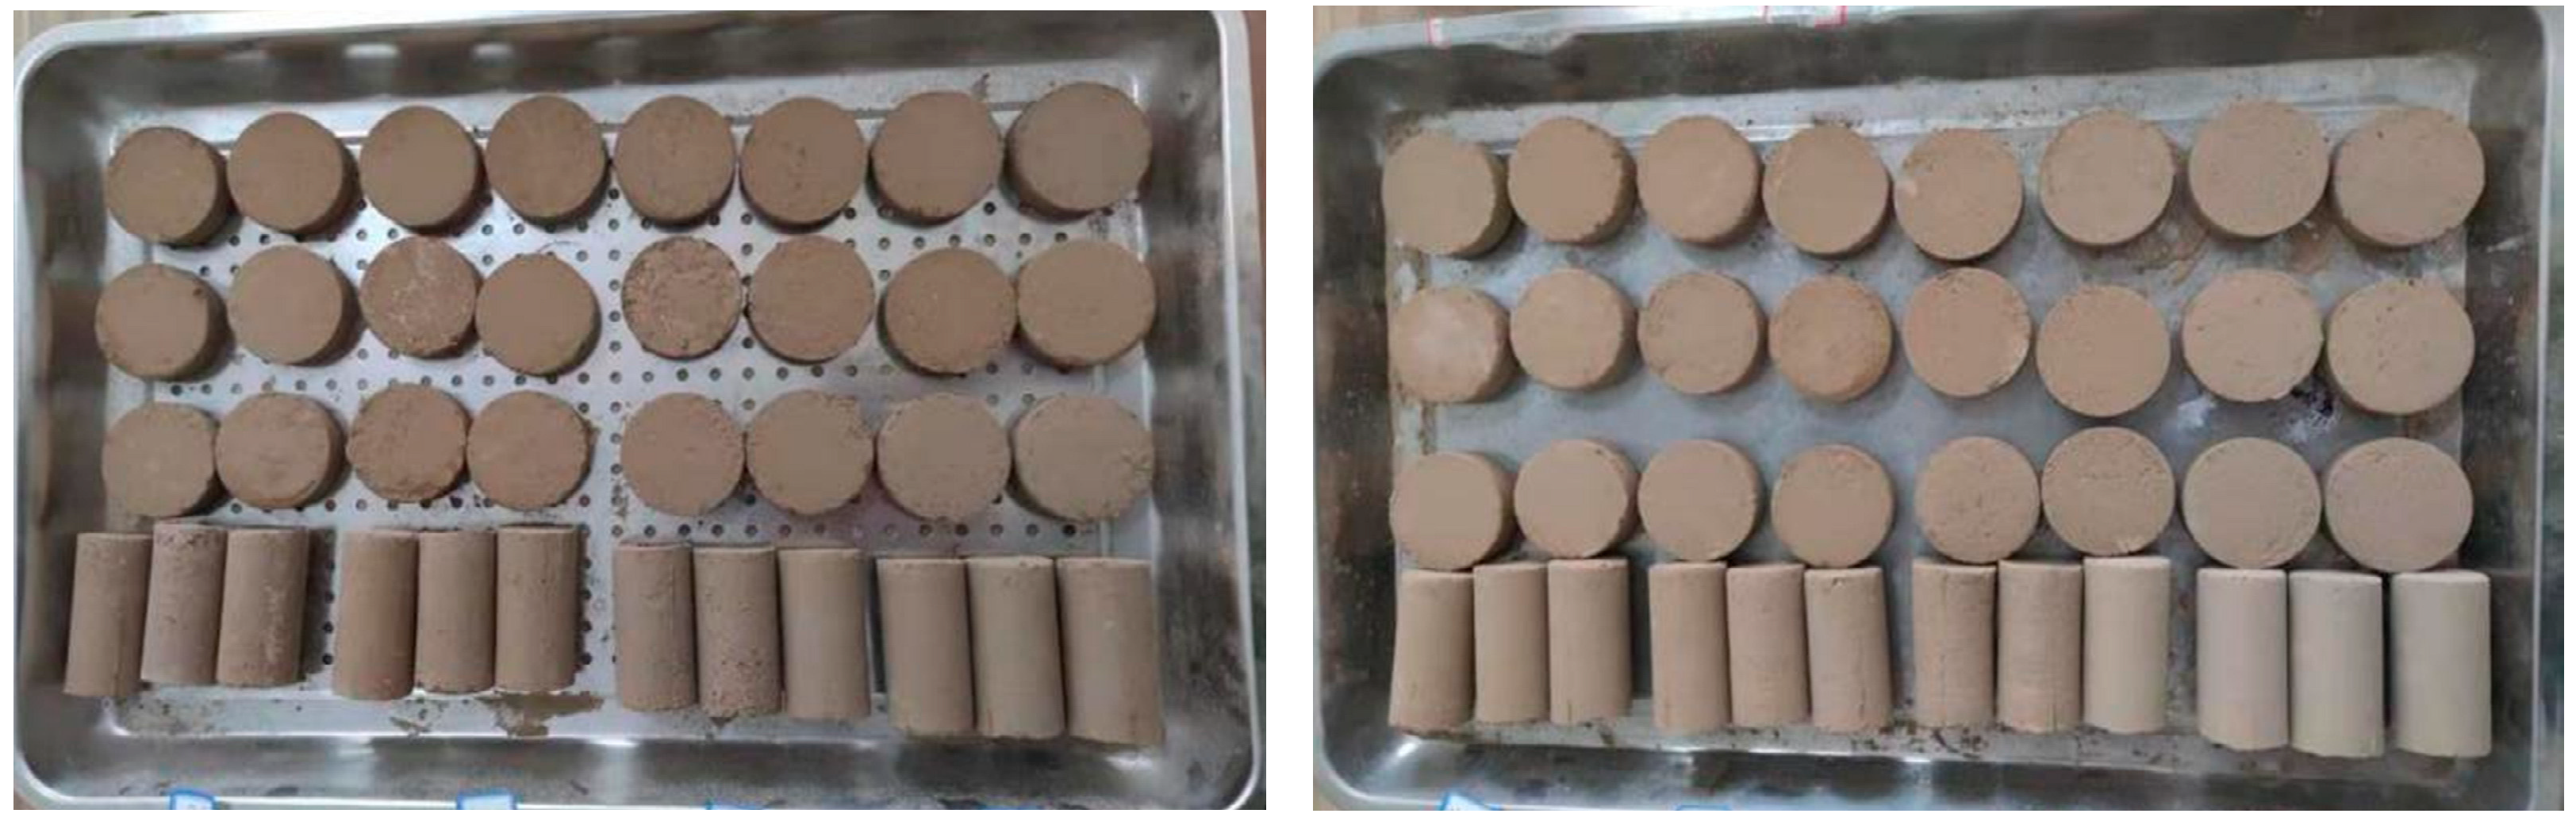
2.1. Materials and Sample Preparation
2.2. Unconfined Compressive Strength Testing
2.3. Direct Shear Testing
2.4. Dry Wet Cycle Testing
2.5. Scanning Electron Microscopy (SEM) Analysis
2.6. Energy Dispersive Spectrometer (EDS) Analysis
3. Results and Discussion
3.1. Unconfined Compressive Strength Testing Results and Analysis
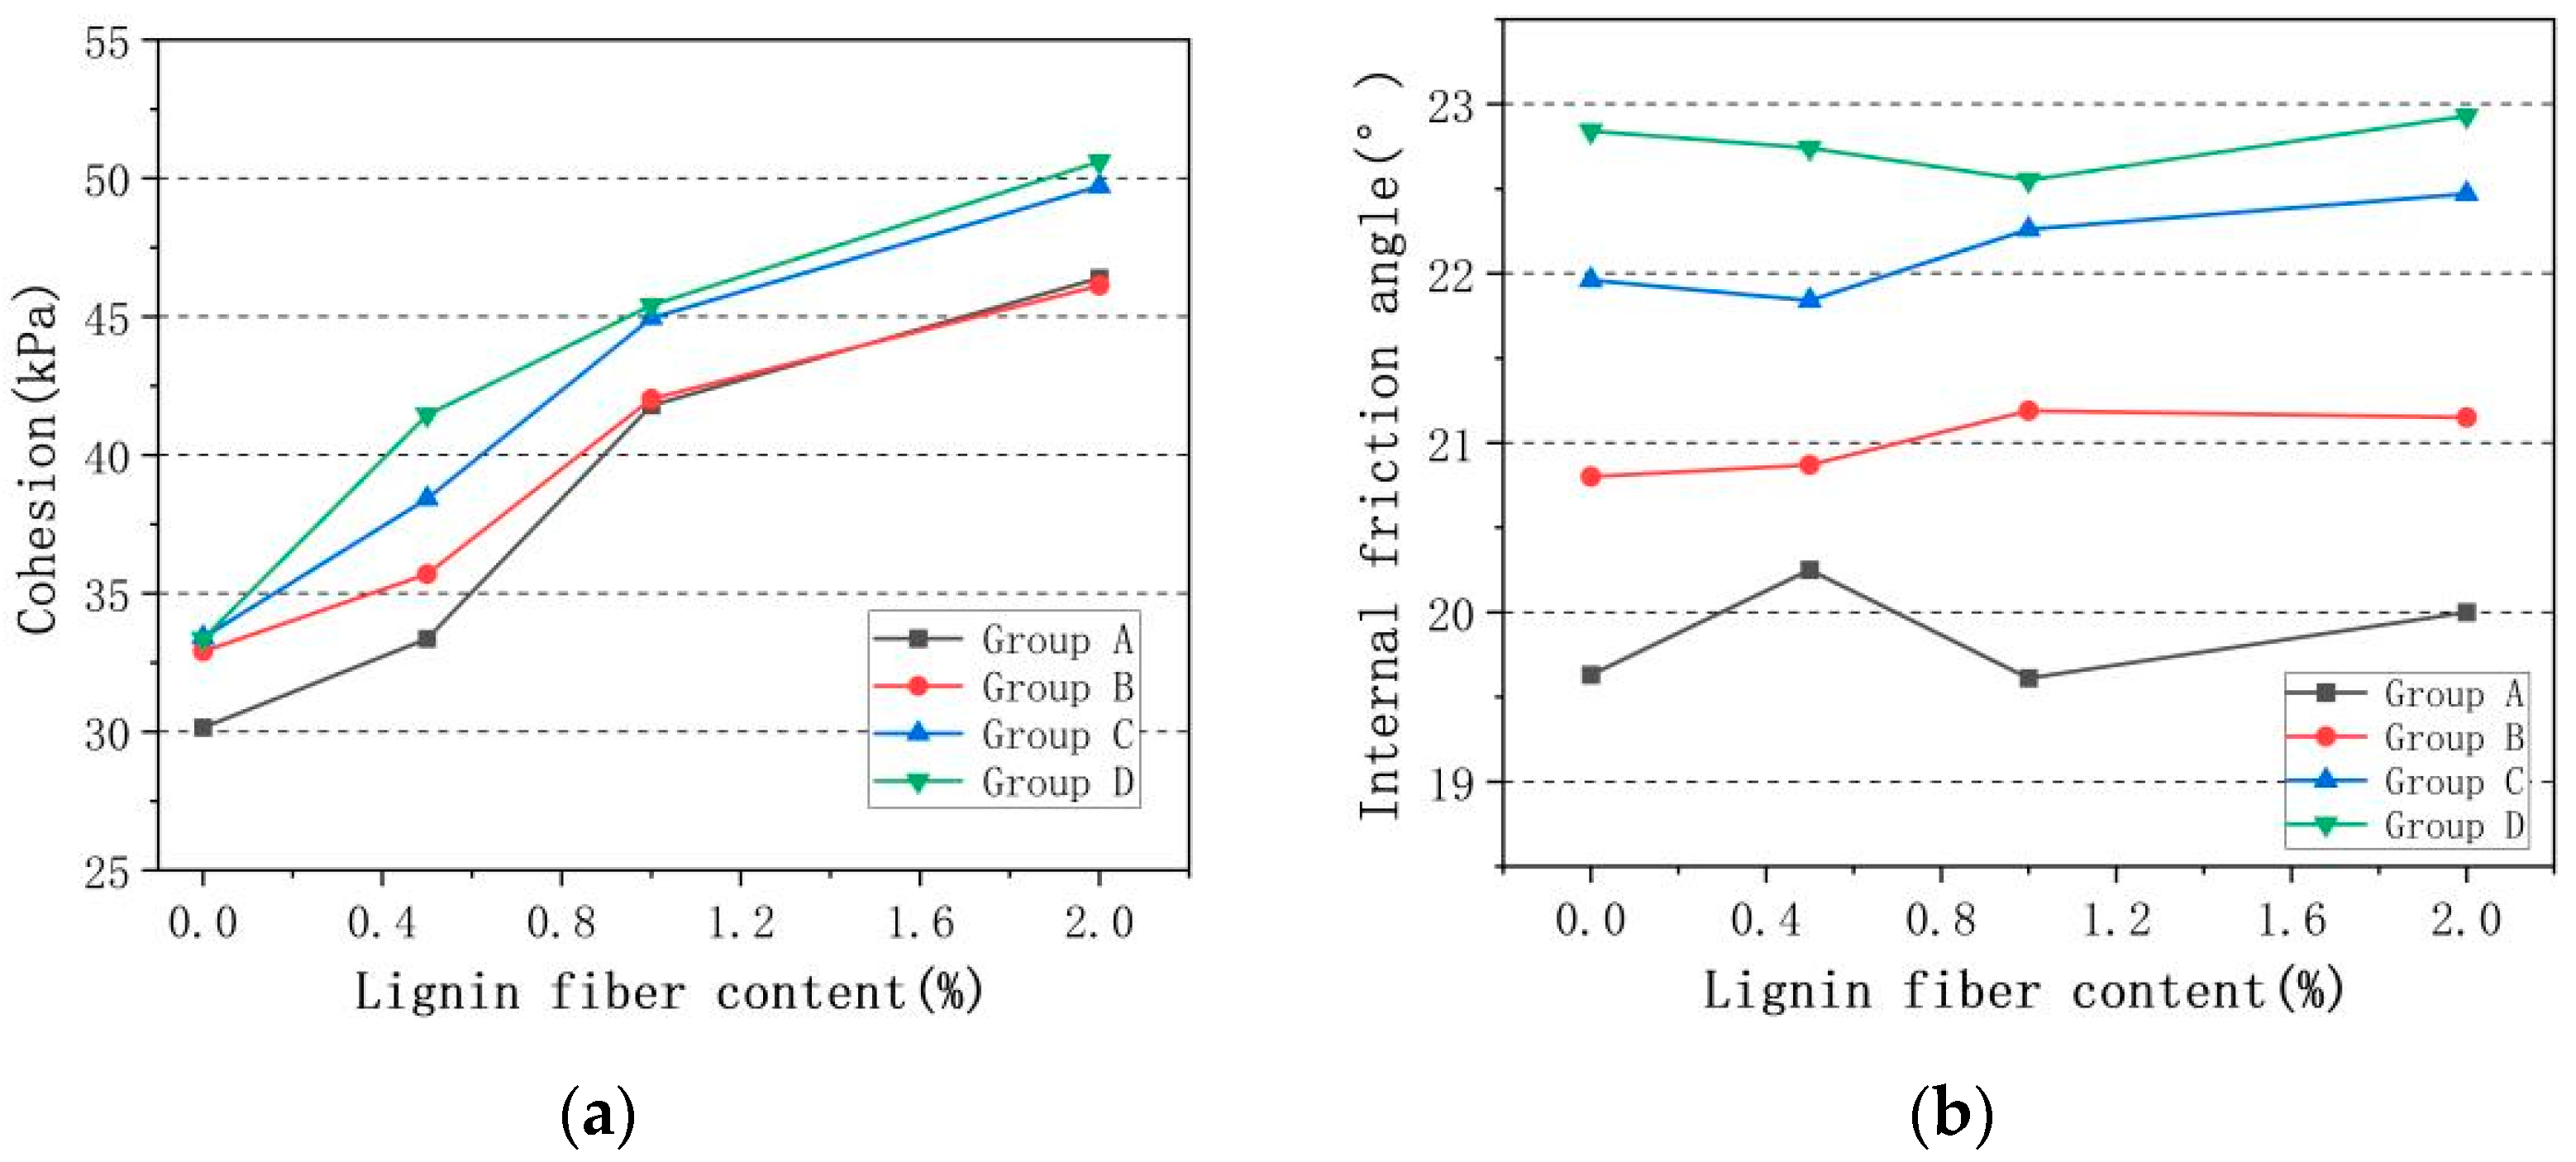
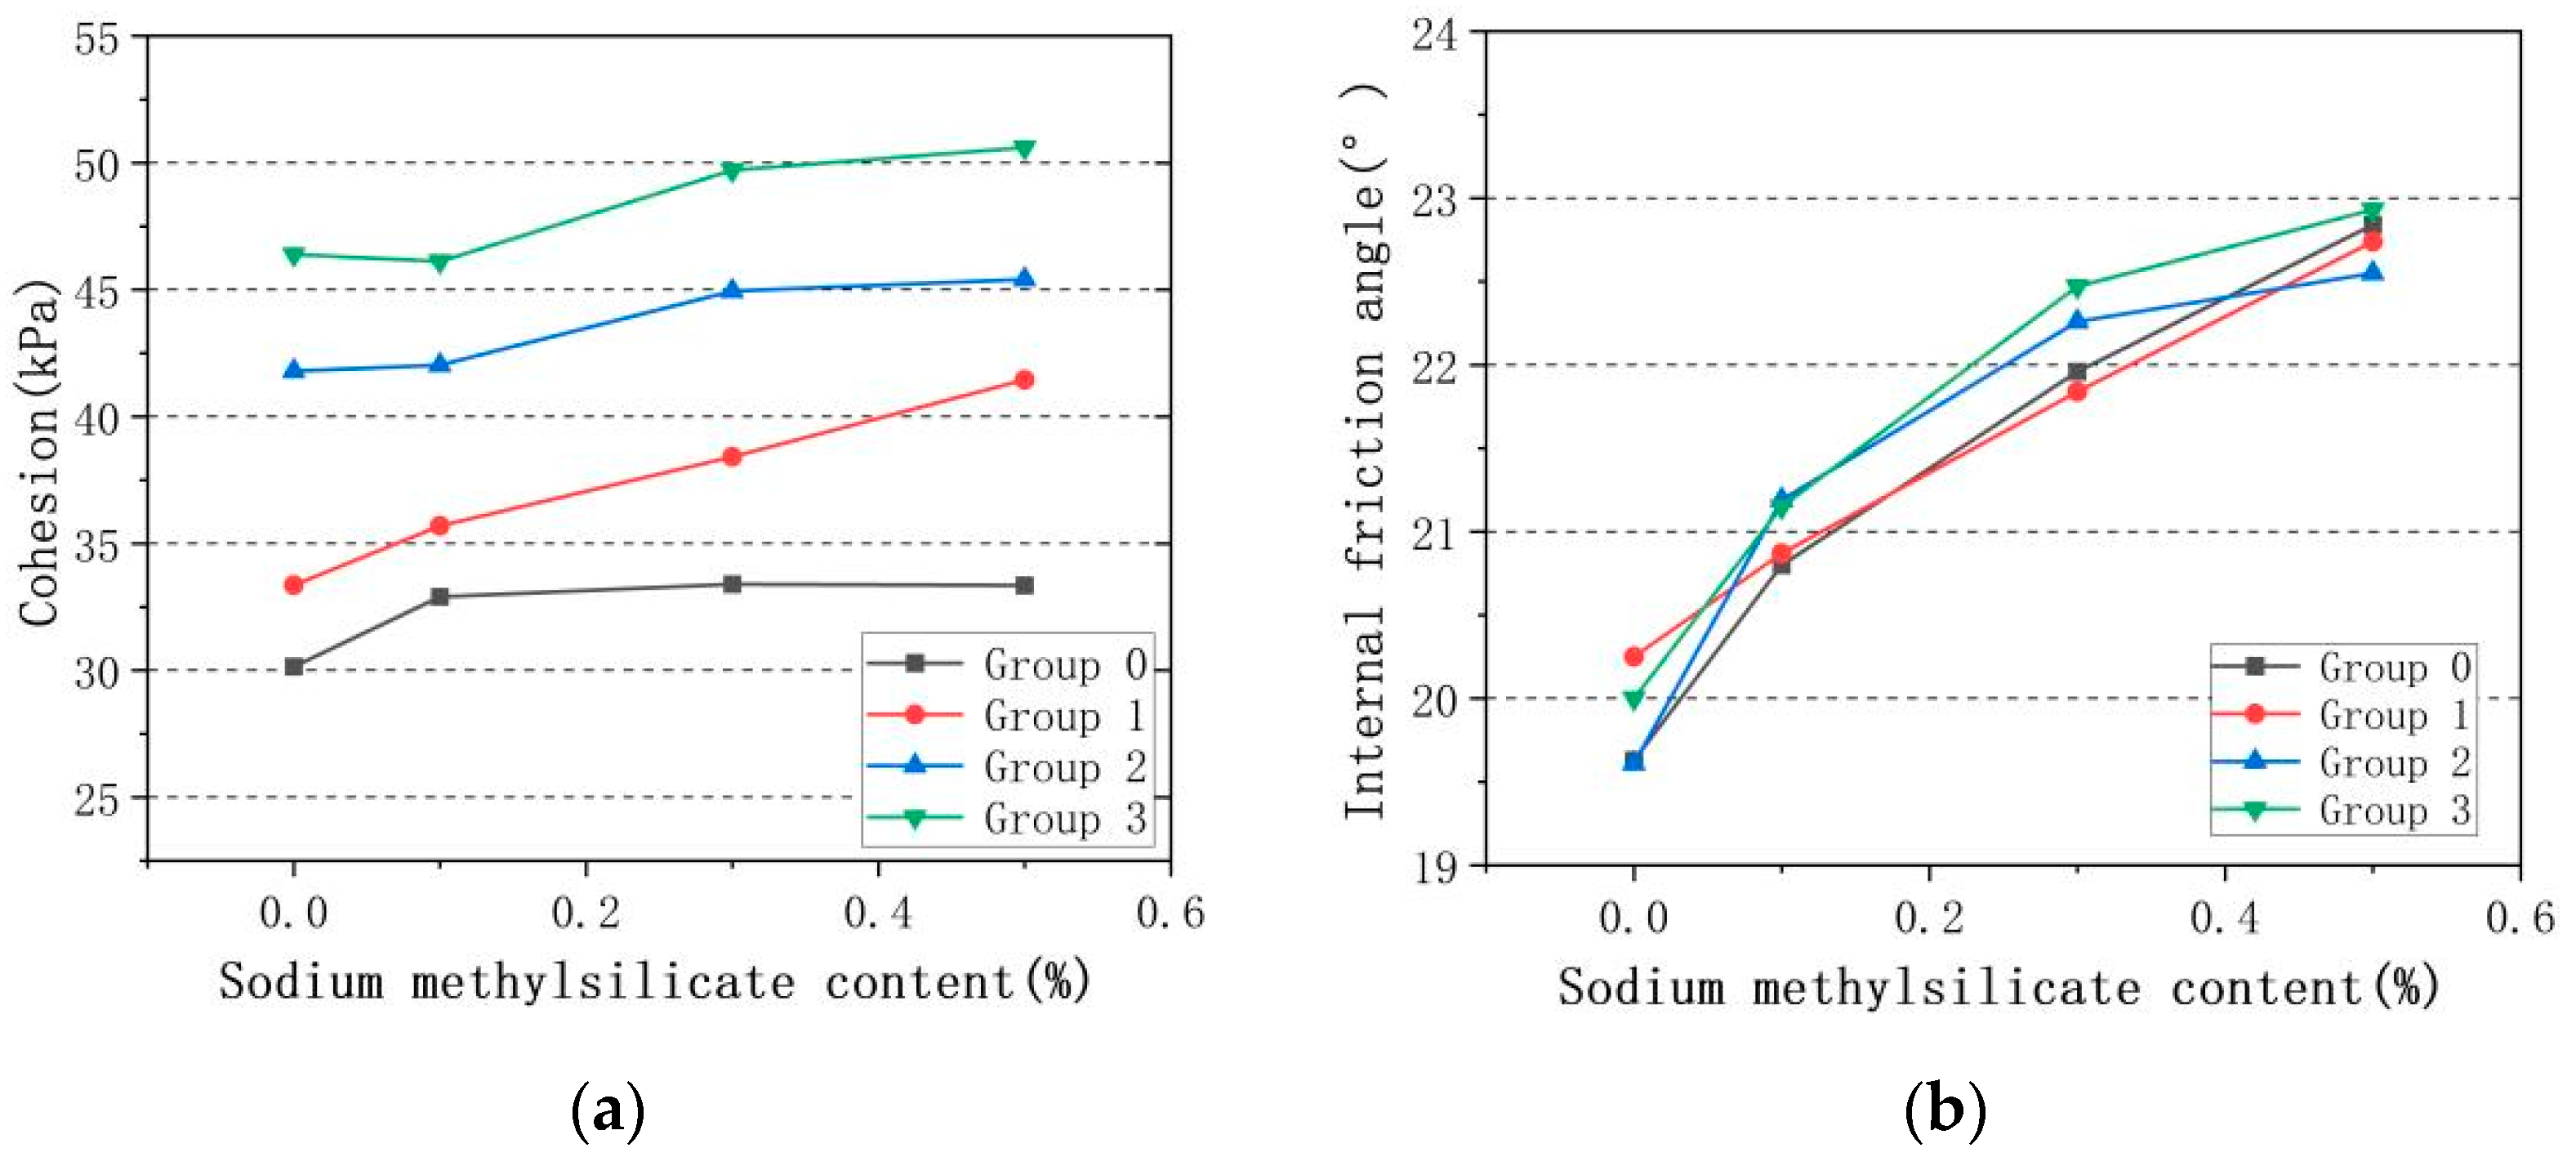
3.2. Direct Shear Testing Results and Analysis
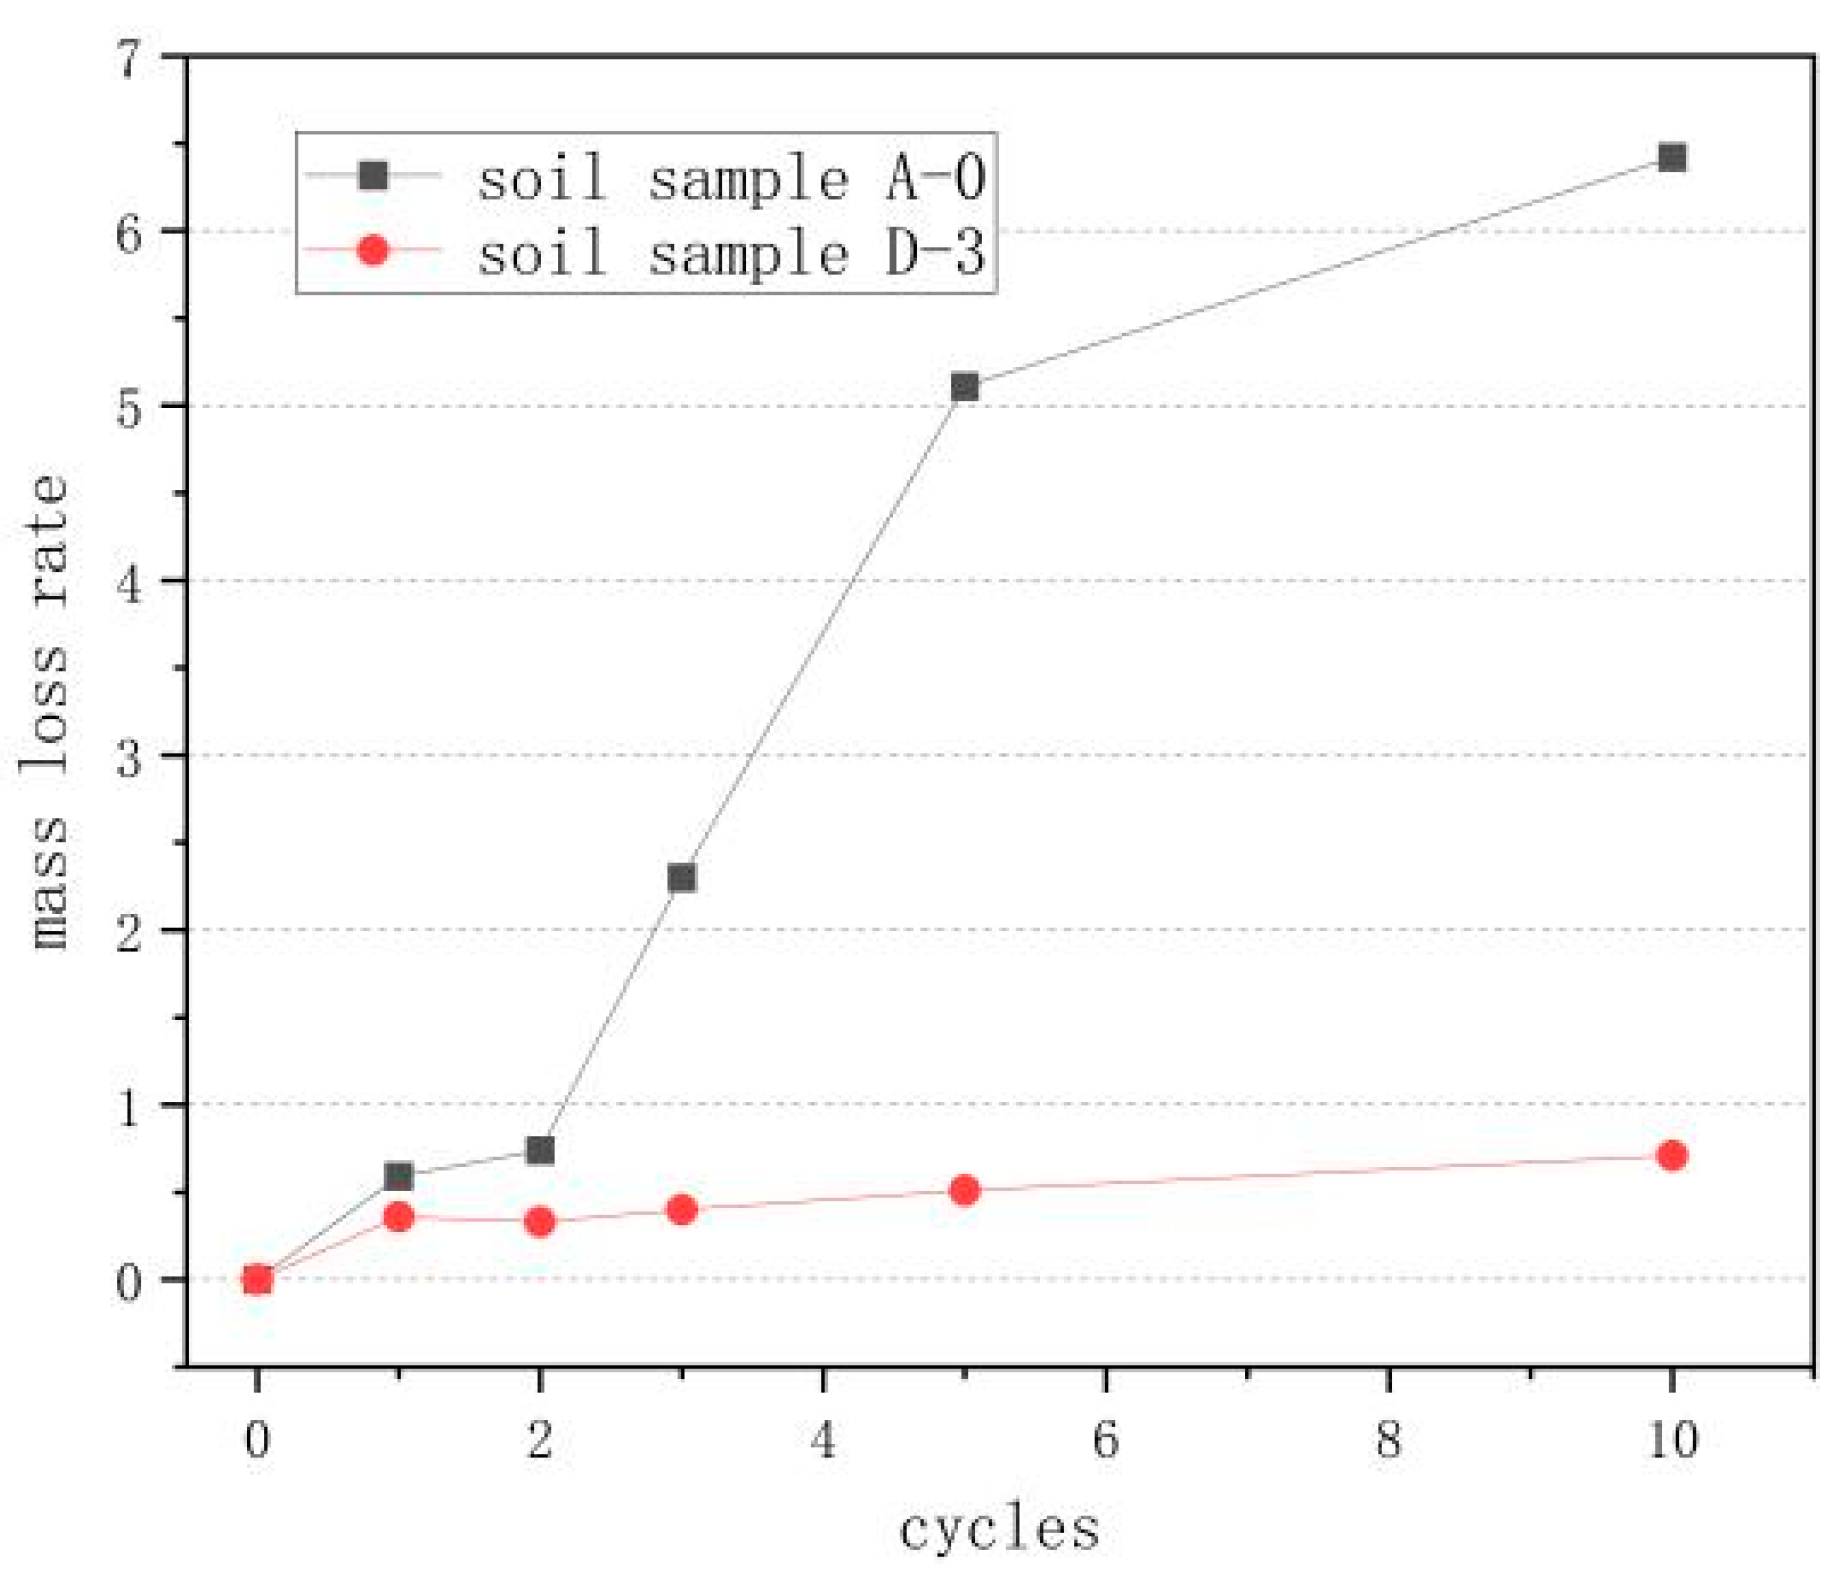
3.3. Dry Wet Cycle Testing Results and Analysis
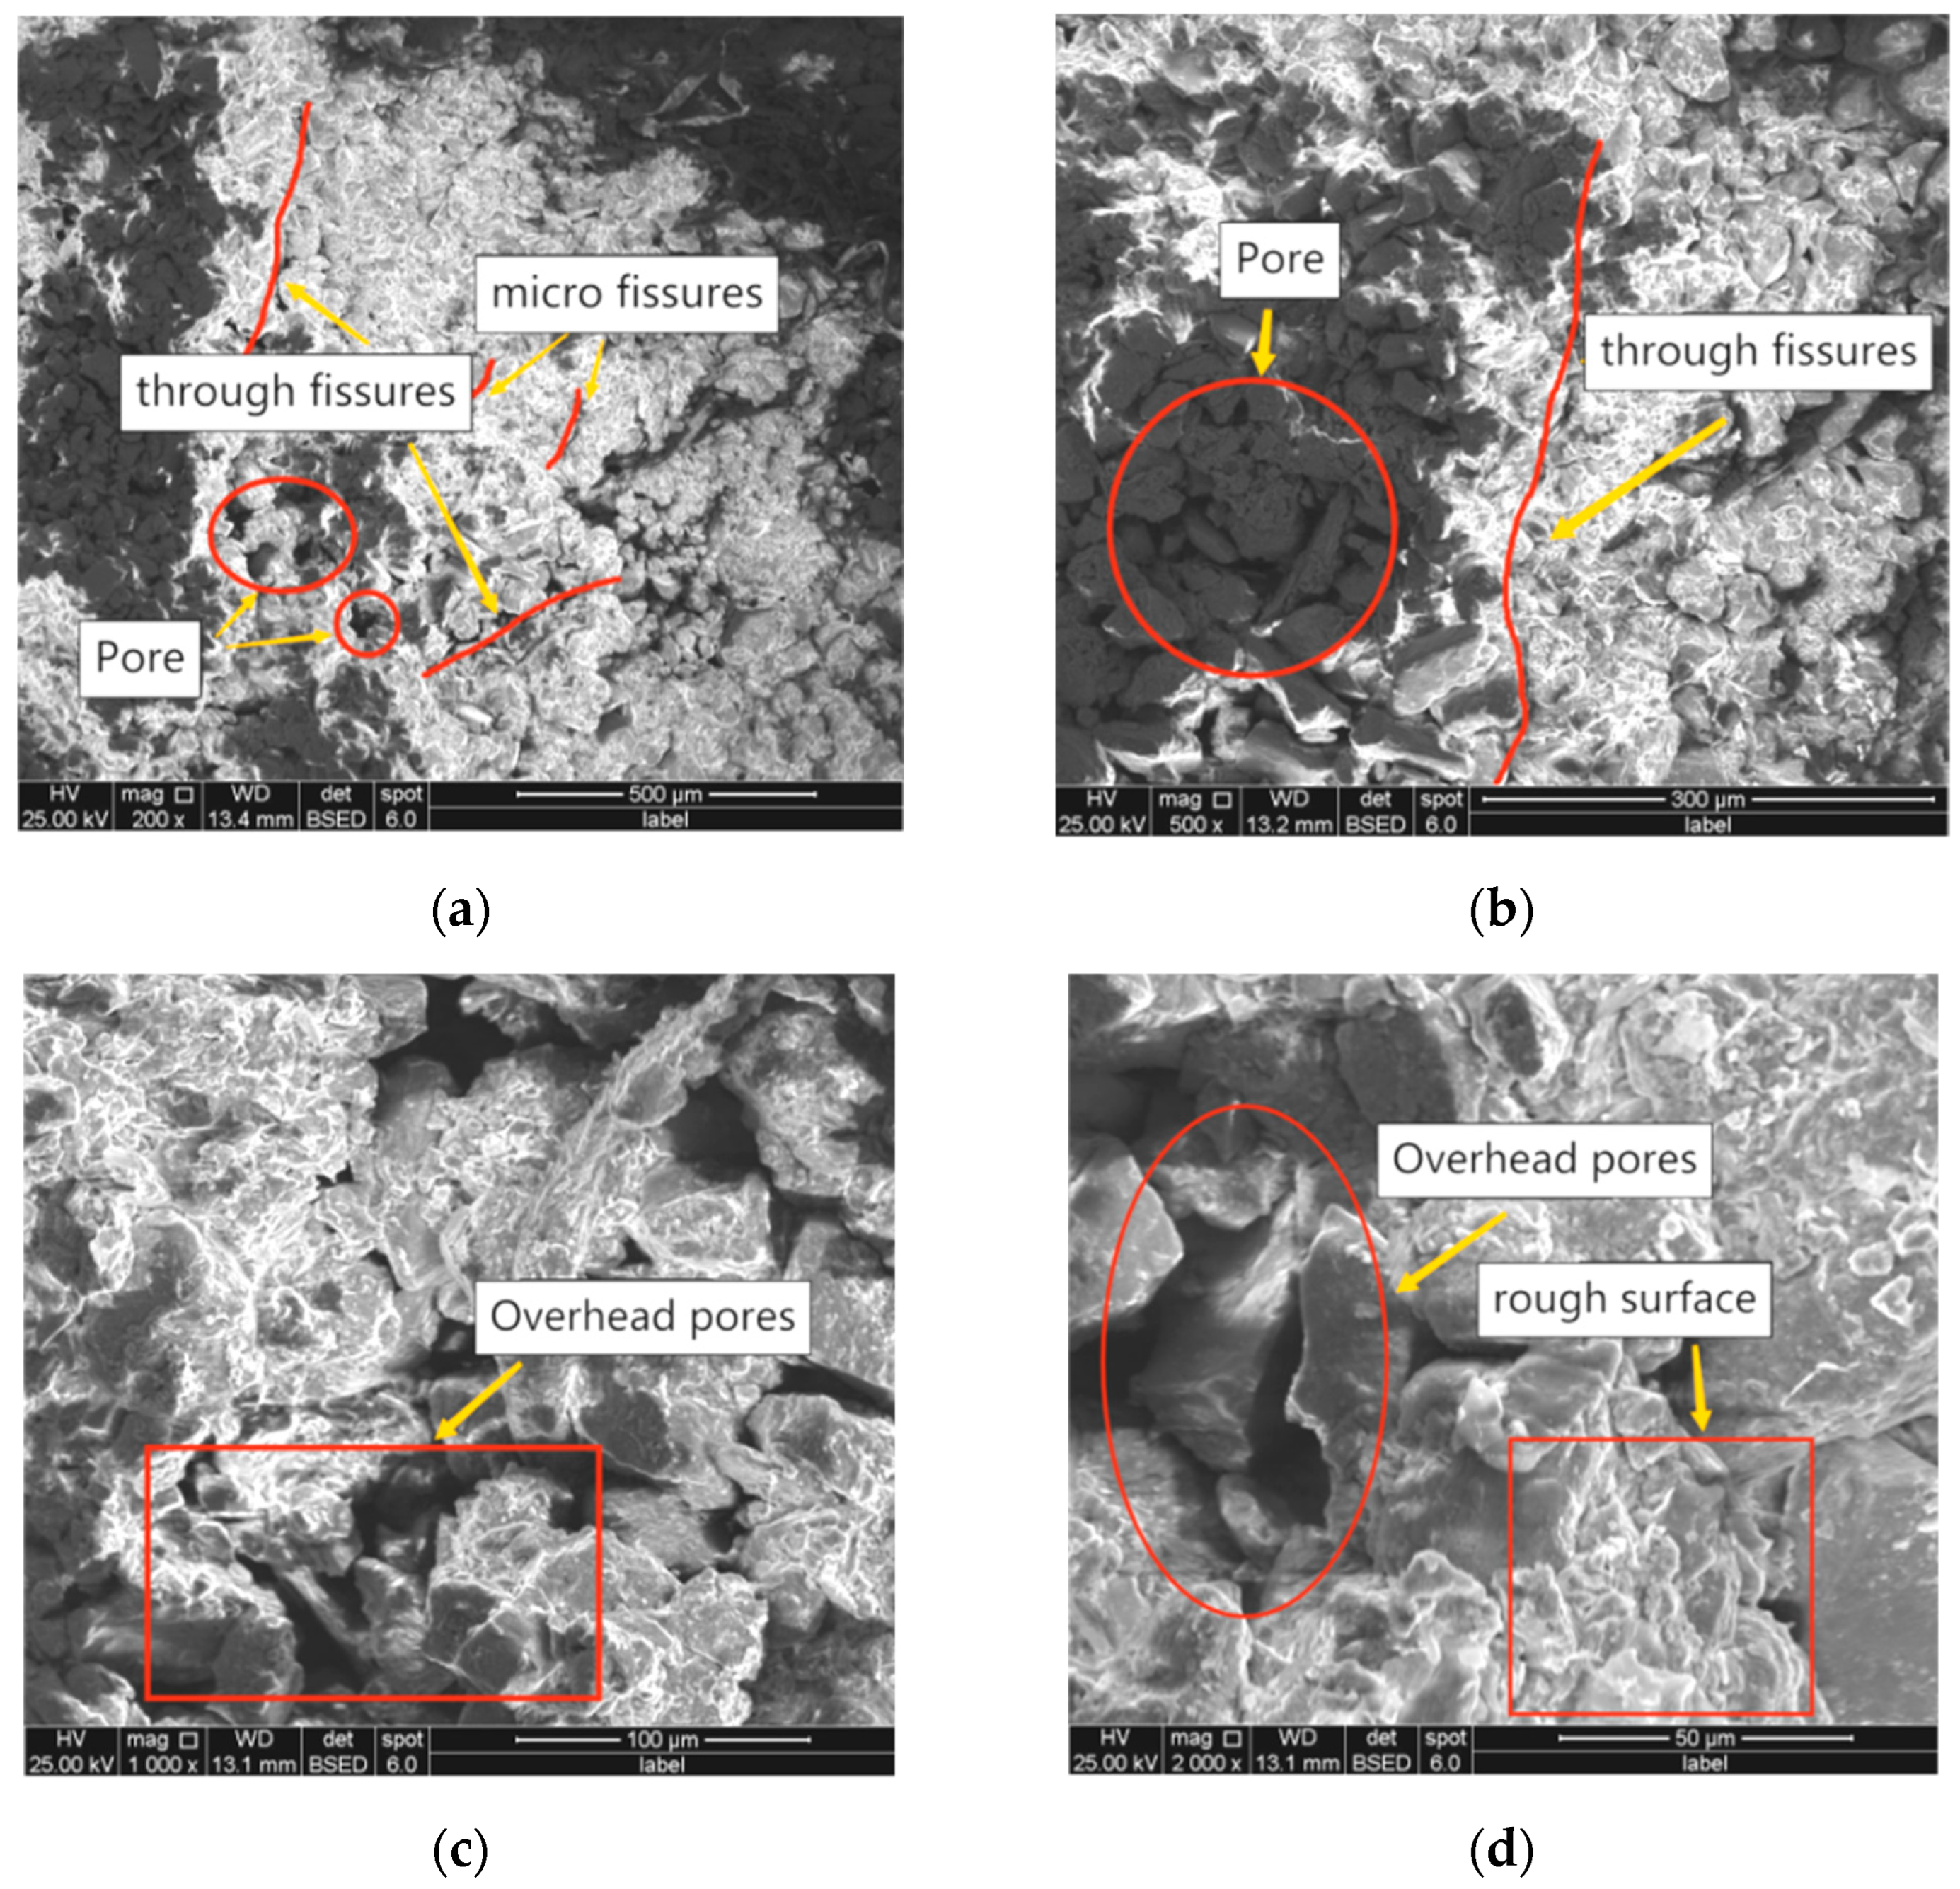
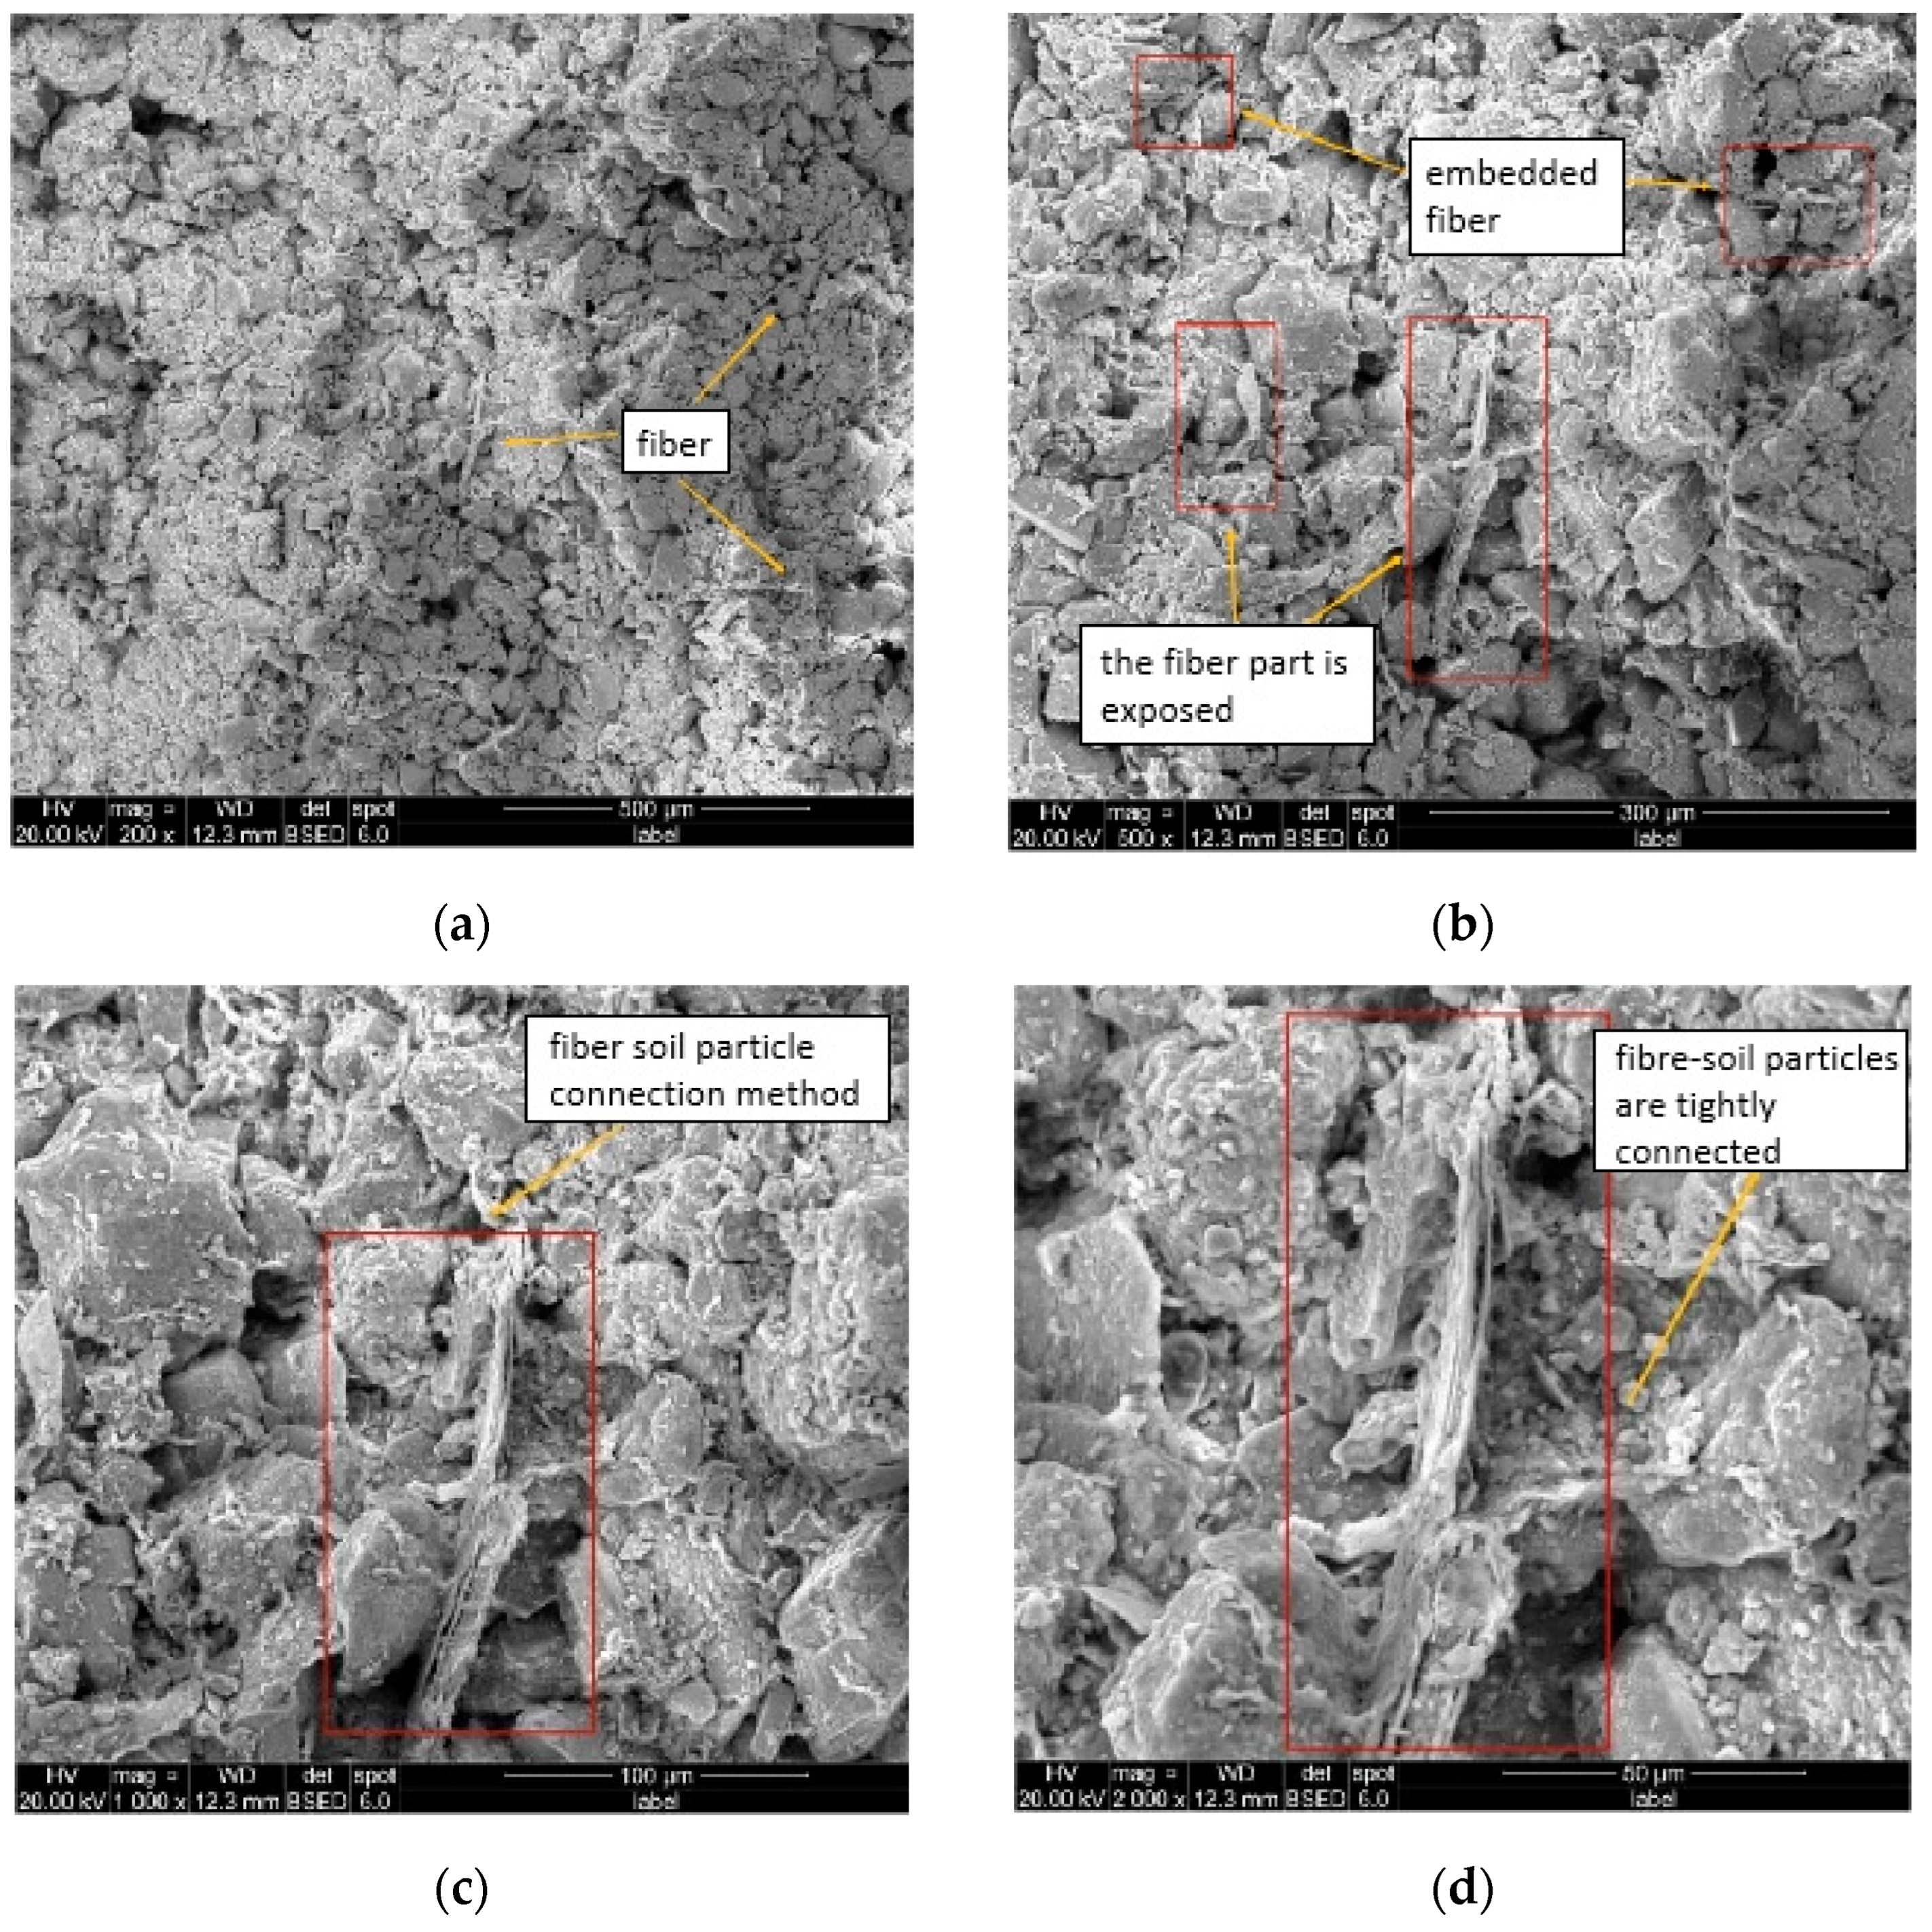
3.4. SEM Testing Results and Analysis
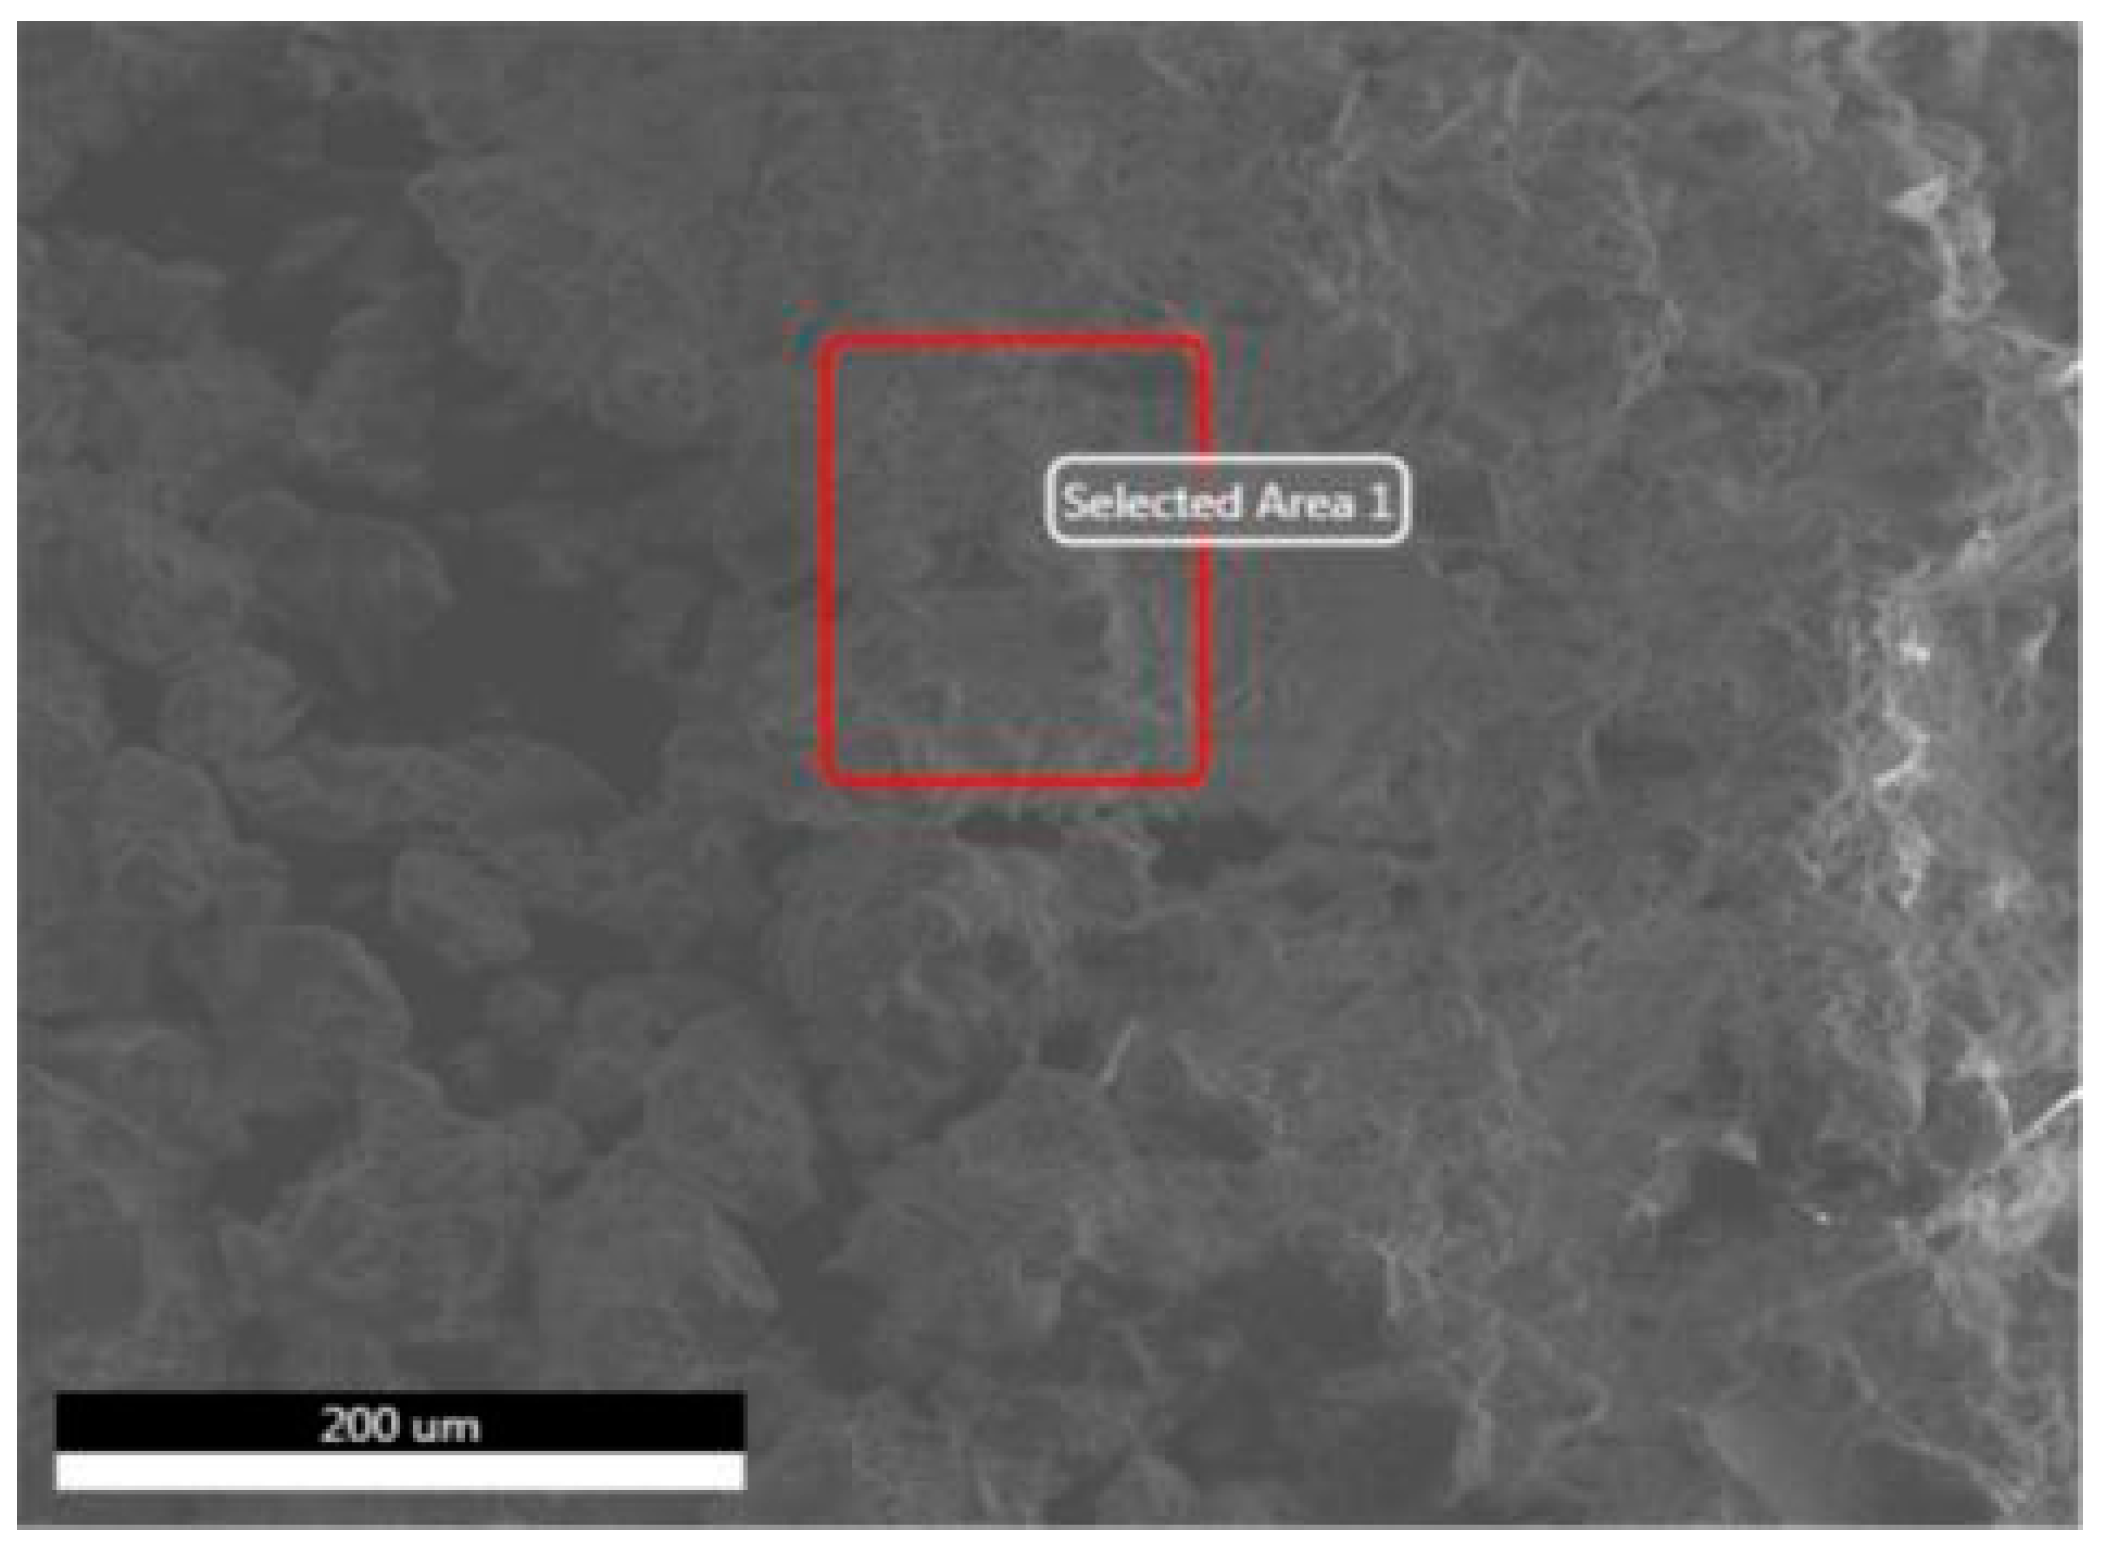
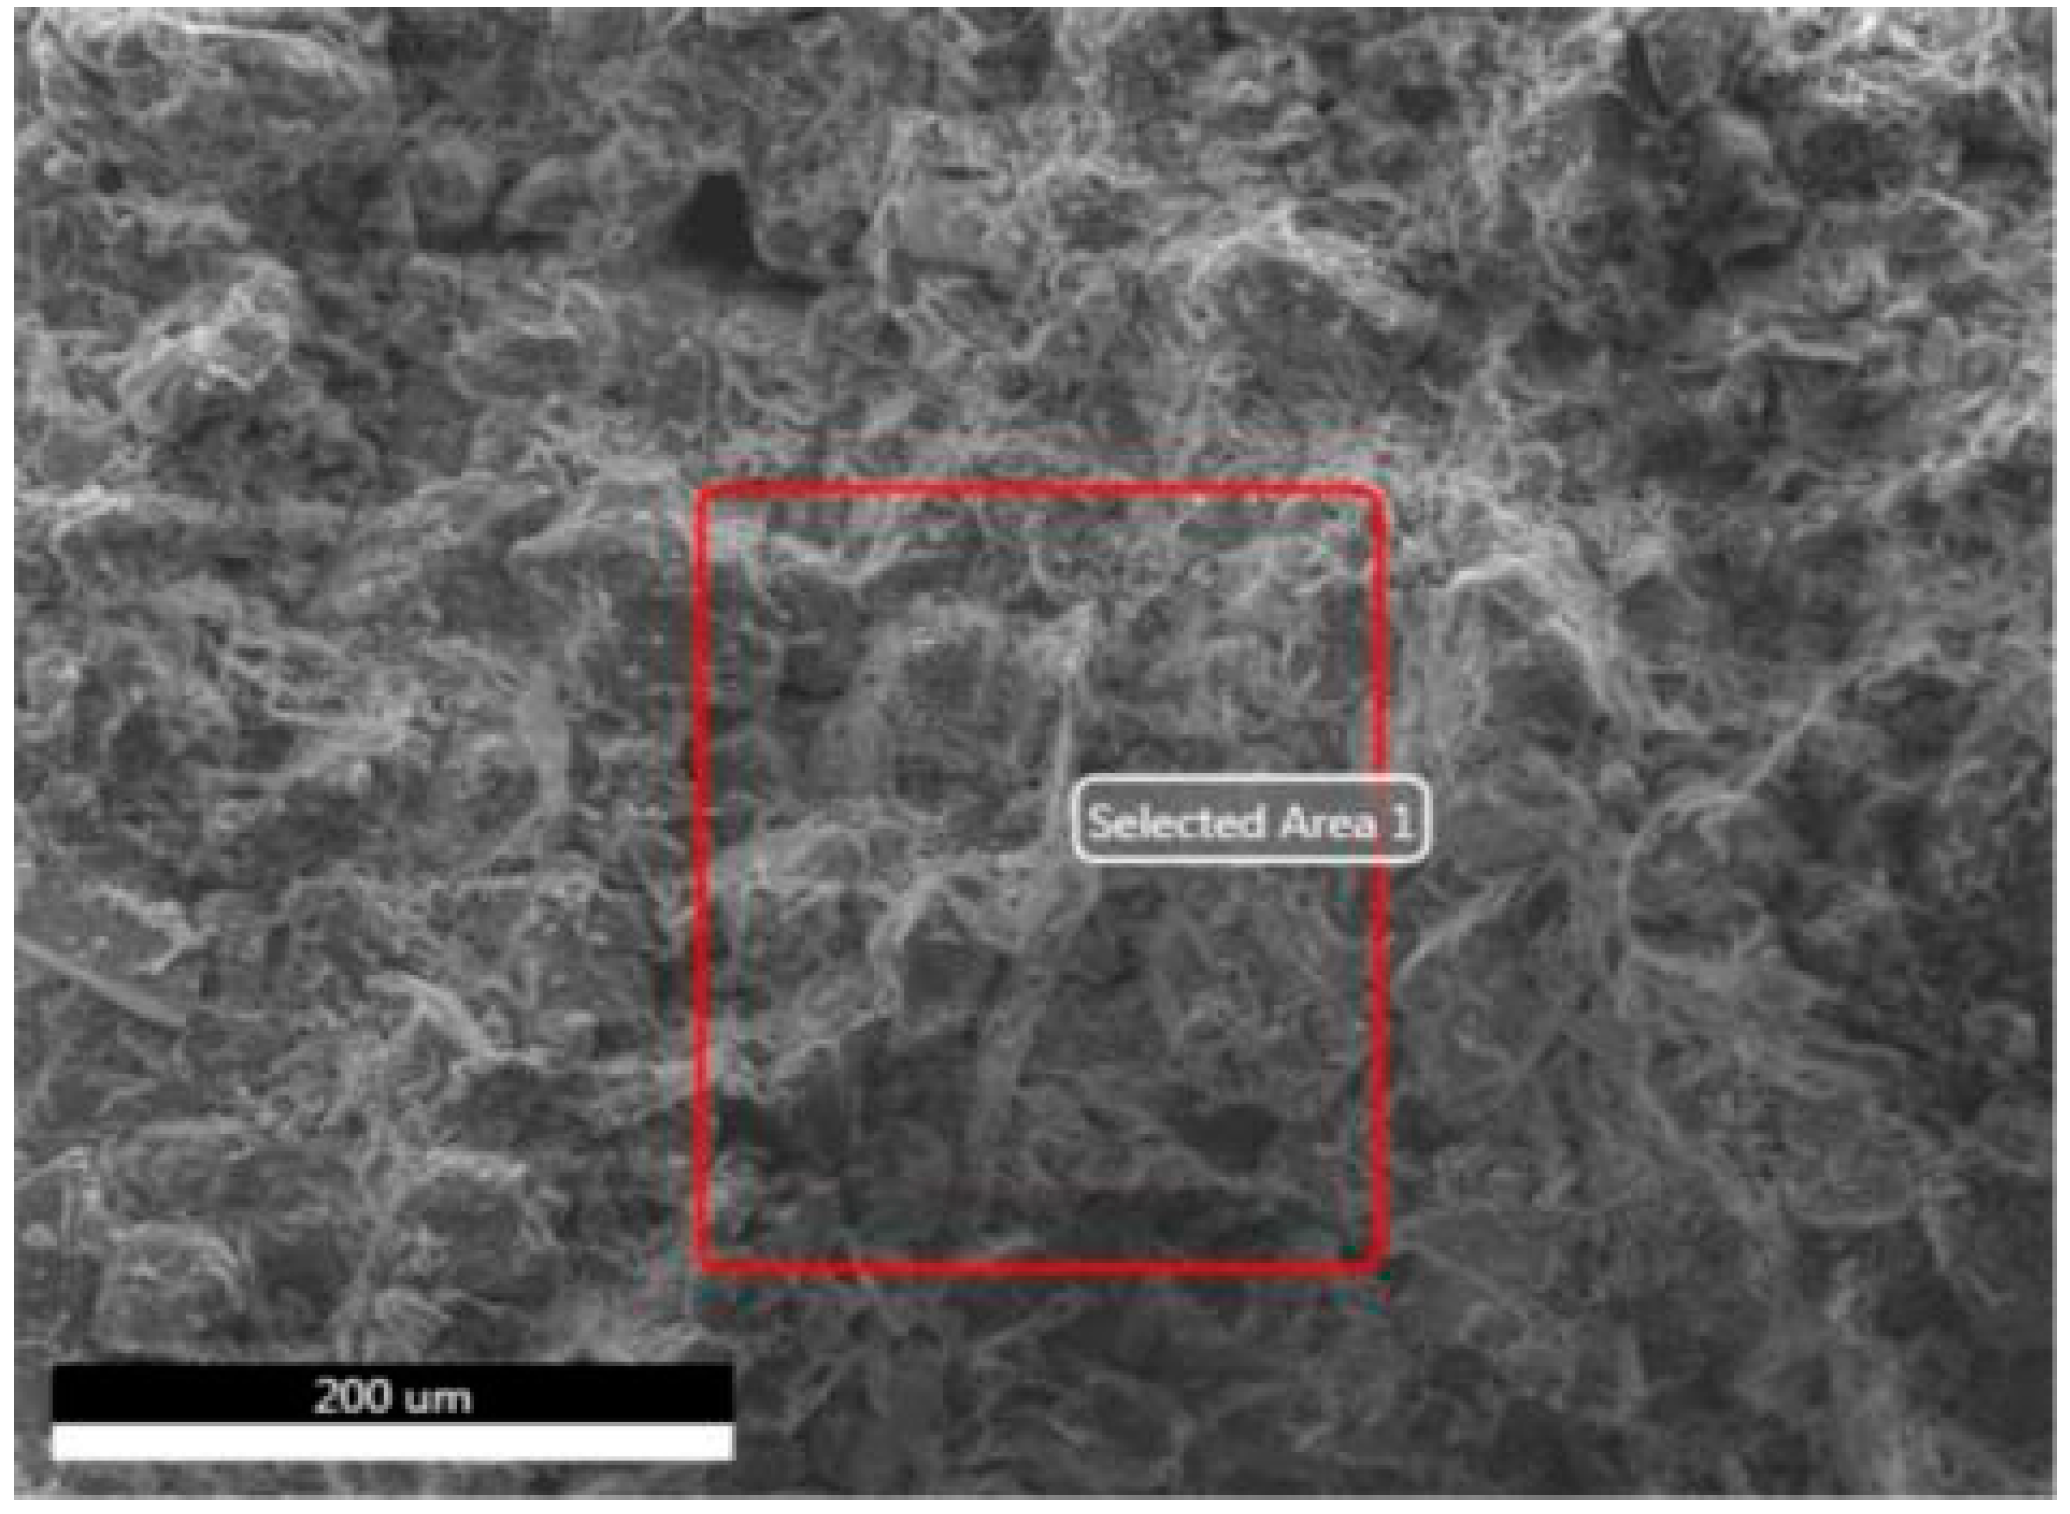
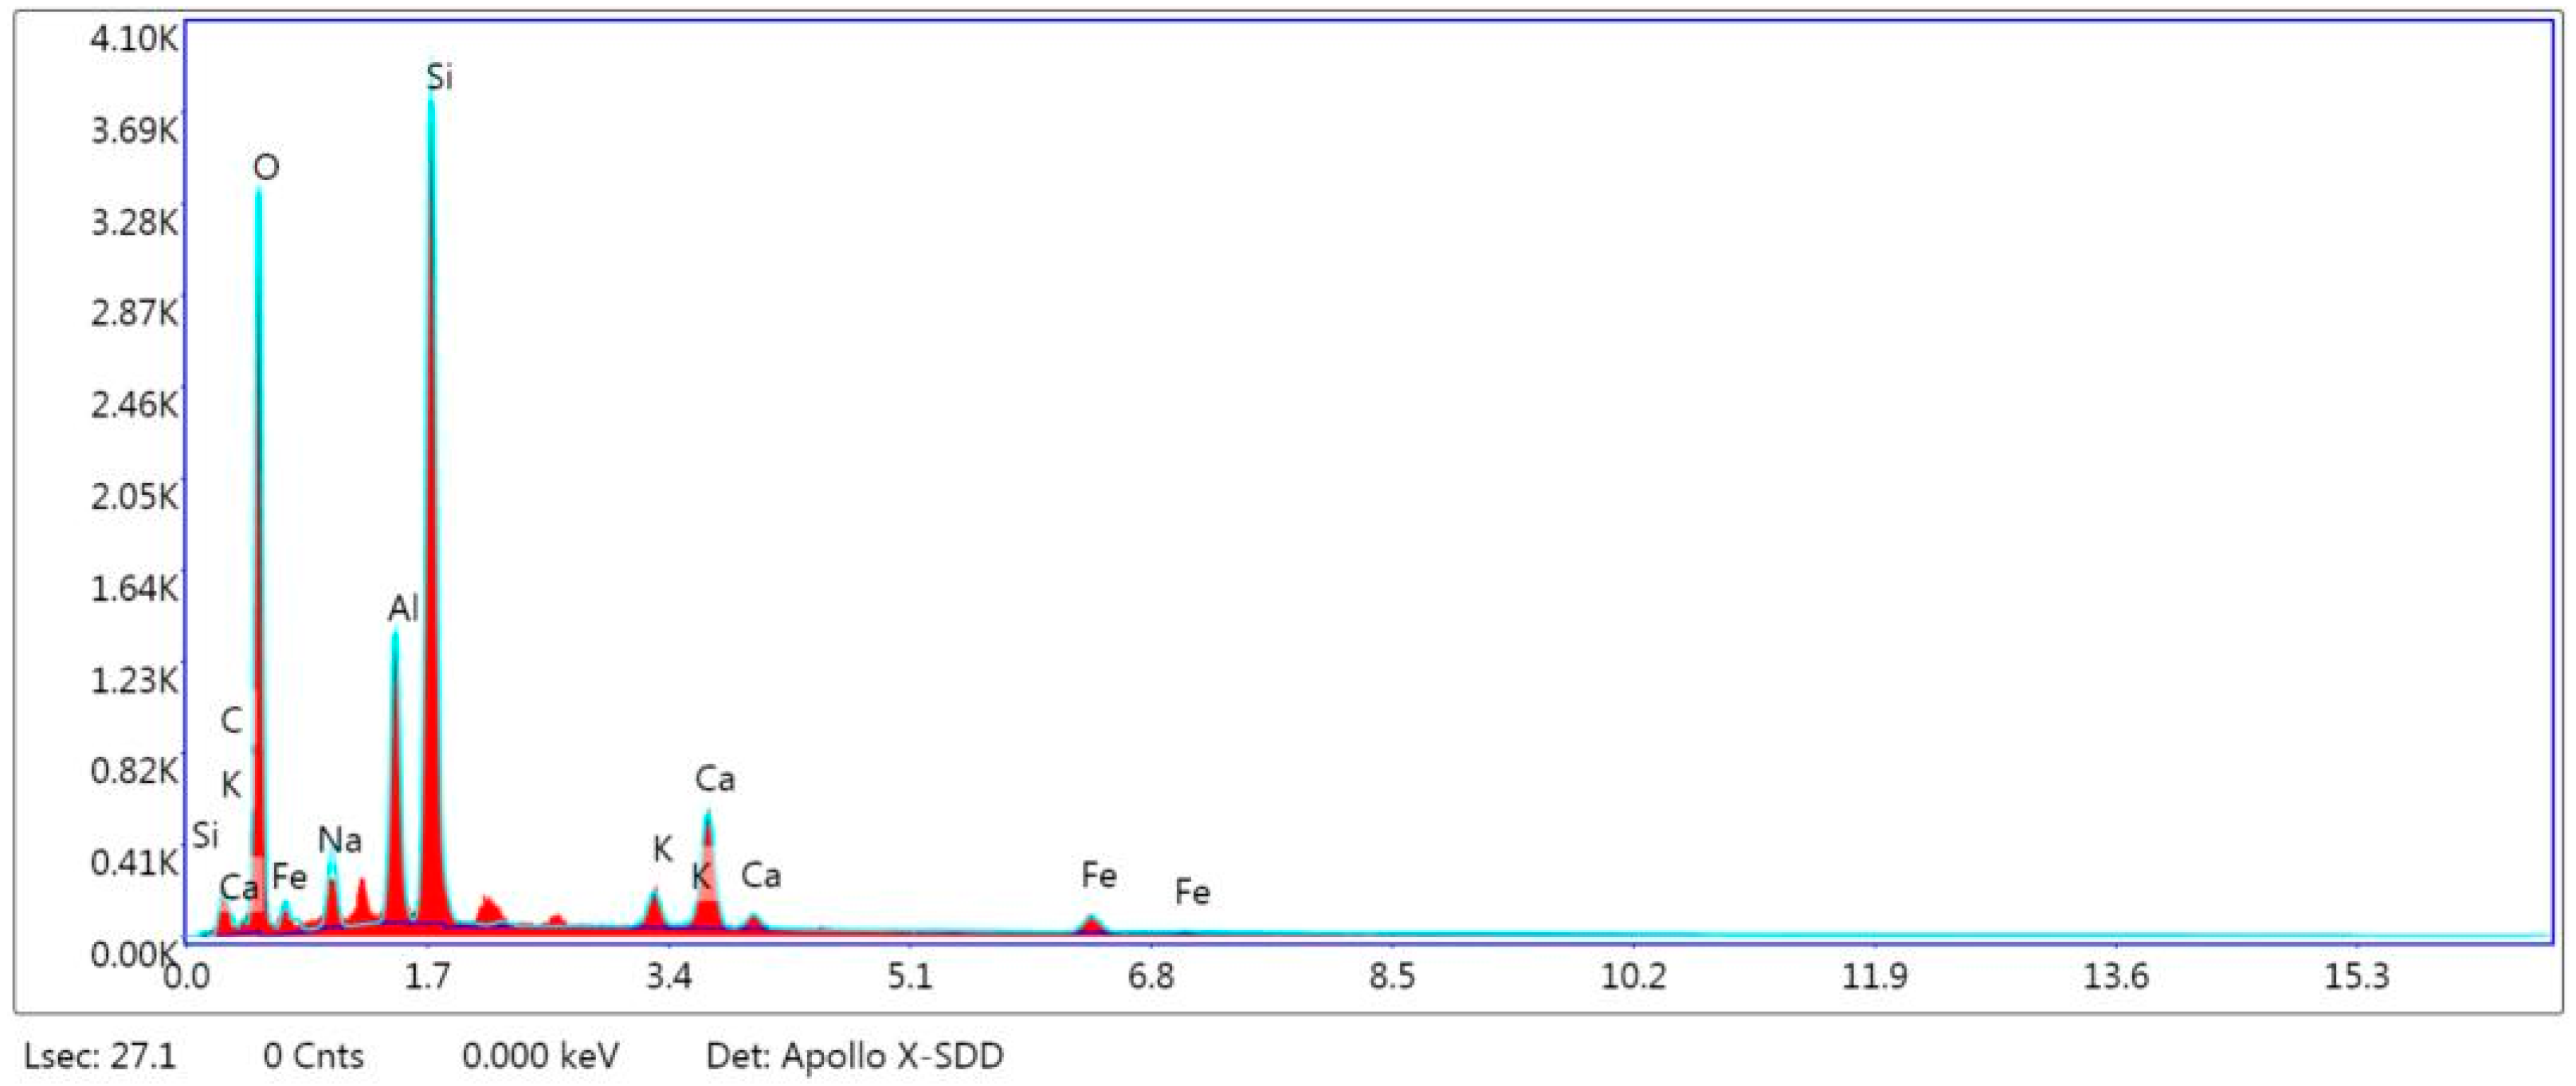
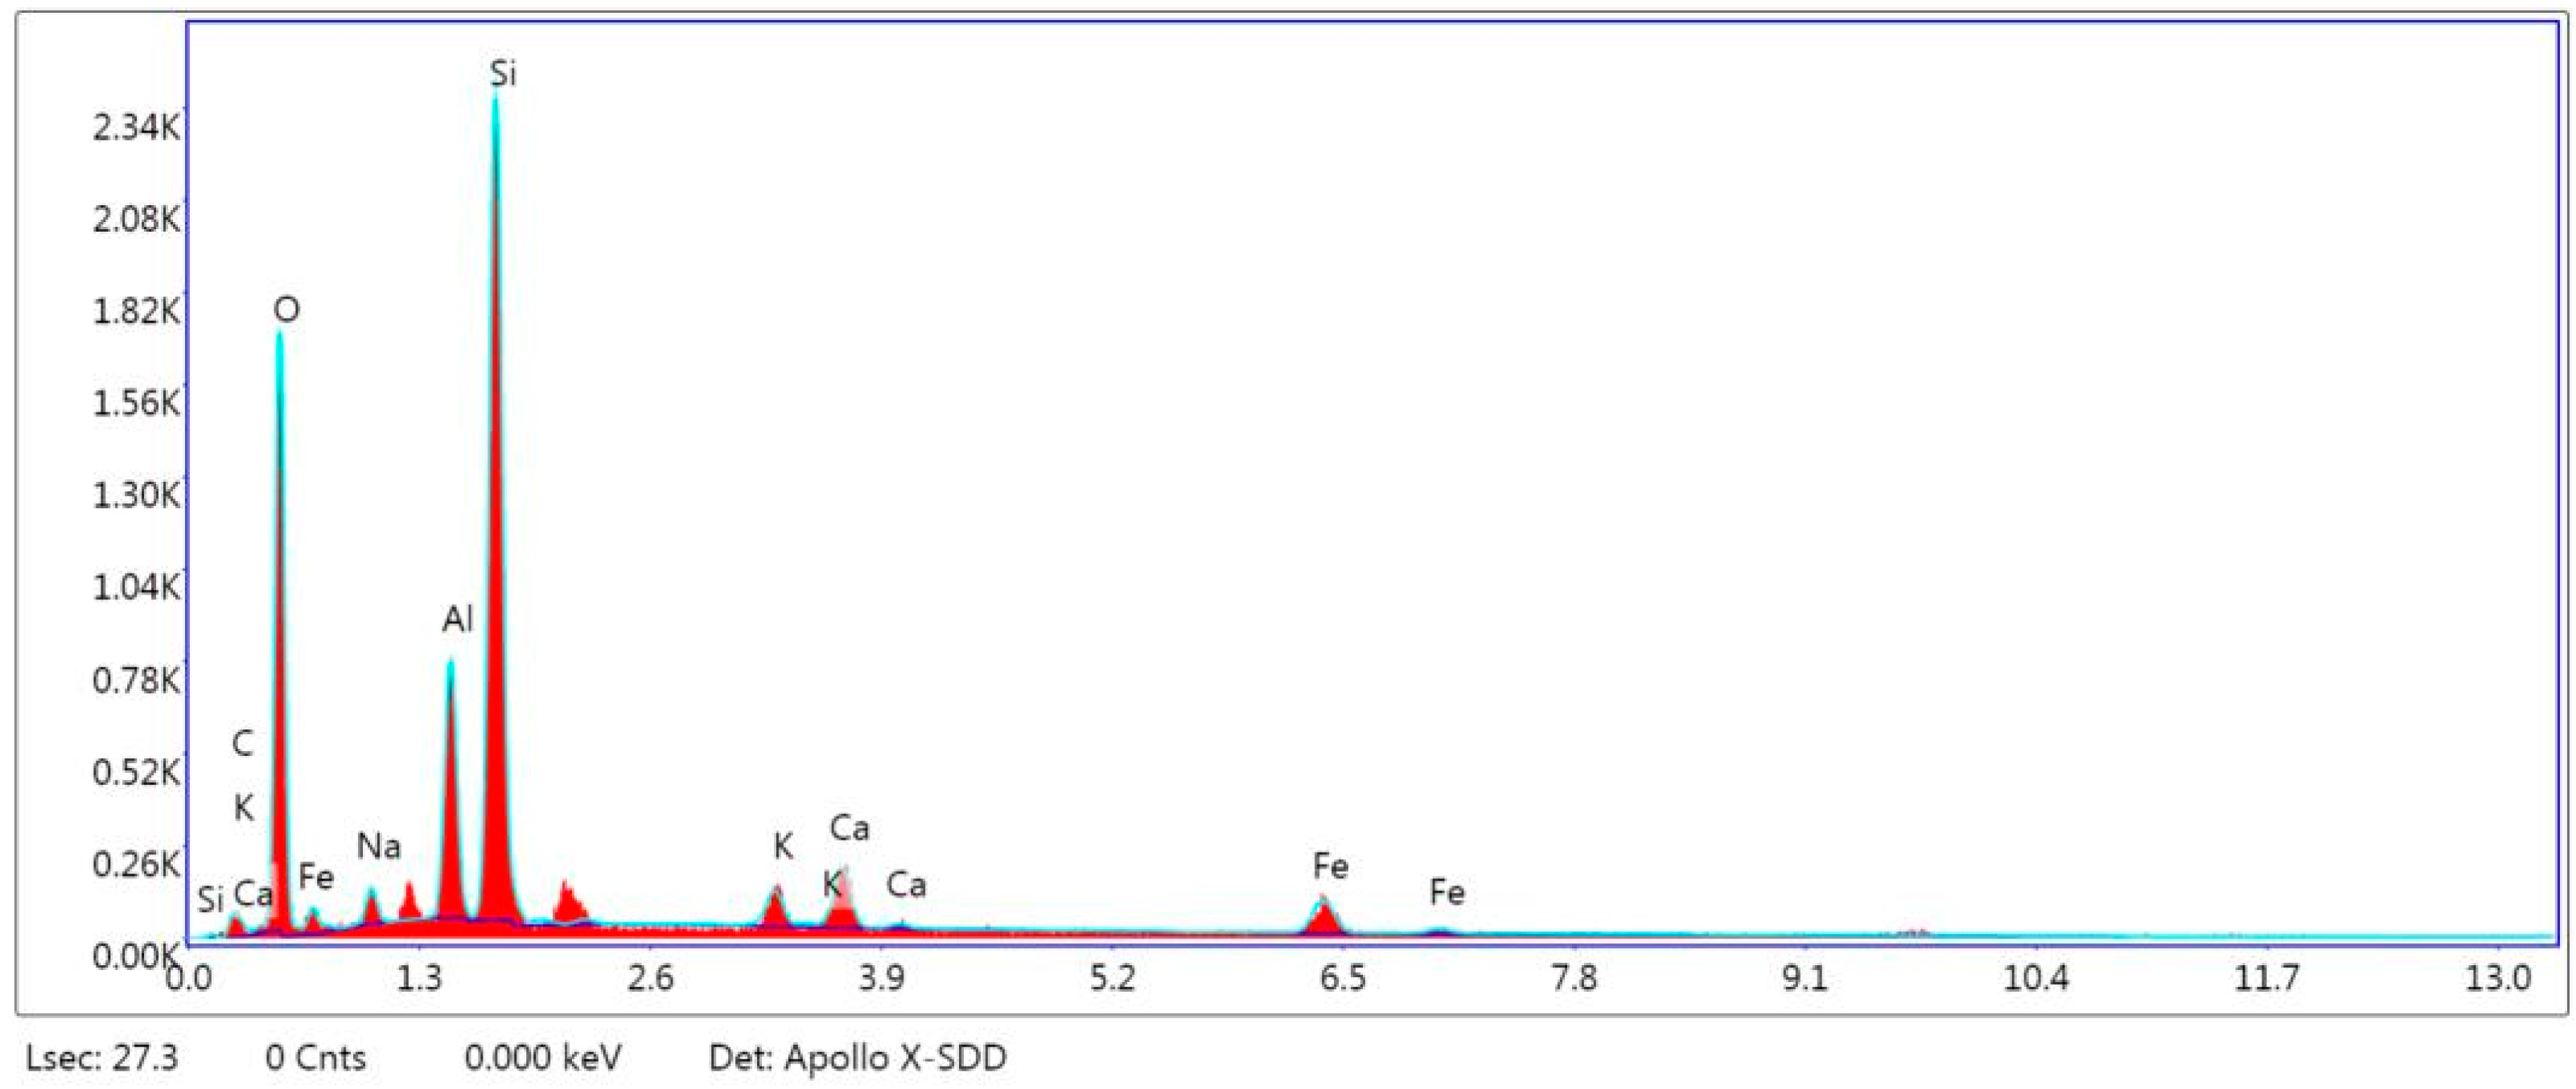
3.5. EDS Testing Results and Analysis
4. Conclusions
- (1)
- The content of sodium methylsilicate has a positive effect on improving the compressive strength of soil samples, and can delay the appearance of cracks in the samples; Although the lignin fiber cannot directly improve the compressive strength of the soil sample, it can maintain the integrity of the soil sample when it is damaged and provide a certain toughness for the soil sample.
- (2)
- Sodium methylsilicate can improve the cohesion and internal friction angle of soil samples, while lignin fiber has little effect on the internal friction angle of soil, but can significantly improve its cohesion. Through comprehensive comparison, it is considered that 0.5% sodium methylsilicate and 2% lignin fiber are the best proportion of modified materials.
- (3)
- Composite modified materials can effectively improve the durability of soil. Compared with plain soil, the modified soil can maintain stability and integrity after undergoing dry wet cycle and anti-scouring test. In the test of the compressive strength of soil samples with different dry and wet cycles, the strength of plain soil samples is seriously reduced, while the modified soil can still maintain good mechanical properties after many dry and wet cycles.
- (4)
- The addition of modified materials did not significantly change the composition of soil samples. The compactness of the sample was improved by adding sodium methylsilicate. After the addition of lignin fiber, the fiber is closely connected with the surrounding soil particles, thus forming an integral structure composed of fiber and surrounding soil, strengthening the connection between soil particles, effectively limiting the sliding between soil particles, and jointly improving the overall structural stability of soil samples with sodium methylsilicate.
Author Contributions
Funding
Institutional Review Board Statement
Informed Consent Statement
Data Availability Statement
Conflicts of Interest
References
- Zhu, C.; Shi, W.; Li, X.; Chen, P.; Deng, G. Comprehensive evaluation of engineering properties of several traditional modified soils and their application in the restoration of earthen sites. J. Rock Mech. Eng. 2022, 41 (S1), 3033–3043. [Google Scholar] [CrossRef]
- Dong, X. Physical and Mechanical Properties of Modified Soil and Its Application in Raw Soil Buildings. Master’s Thesis, Xi’an University of Technology, Xi’an, China, 2021. [Google Scholar] [CrossRef]
- Li, S. Experimental study on freezing and thawing properties of calcium lignosulfonate modified soil. Tech. Superv. Water Resour. 2022, 8, 26–28, 50. [Google Scholar]
- Zhang, M.; Yuan, F.; Li, Z.; Su, A. Study on mechanical properties of lignin modified carbonated saline soil under freezing and thawing. Water Conserv. Sci. Cold Area Eng. 2022, 5, 8–11. [Google Scholar]
- Ji, S.; Wang, B.; Yang, X.; Fan, H. Experimental study on dispersible soil modified by calcium lignosulfonate. Geotech. Mech. 2021, 42, 2405–2415. [Google Scholar] [CrossRef]
- Li, J. Experimental Study on Engineering Properties of Expansive Soil Improved by Lignin Basalt Fiber. Master’s Thesis, Southwest University of Science and Technology, Mianyang, China, 2021. [Google Scholar] [CrossRef]
- Chen, X.; Ding, X.; Song, Y.; Xu, K. Effect of lignin on physical and mechanical properties of red clay. Sci. Technol. Eng. 2021, 21, 5922–5928. [Google Scholar]
- Ding, X. Study on Physical and Mechanical Properties of Lignin Modified Red Clay. Master’s Thesis, Guilin University of technology, Guilin, China, 2021. [Google Scholar] [CrossRef]
- Niu, C.; Ji, X.; Pan, W.; Wang, J.; Su, X.; Wang, Y.; Chen, H. experimental study on improving the dispersibility of saline soil in Western Jilin. Exp. Technol. Manag. 2022, 39, 13–18. [Google Scholar] [CrossRef]
- Han, W.; Li, Y.; Tan, X. Performance and mechanism of methylsilicate inhibiting clay hydration. Explor. Eng. 2018, 45, 19–23. [Google Scholar]
- Jiang, G.; Wang, J.; Xuan, Y. Performance evaluation and action mechanism of potassium methylsilicate shale inhibitor. Sci. Technol. Eng. 2014, 14, 6–10. [Google Scholar]
- Guo, Z.; Zhu, Q.; Liu, C.; Xing, Z. Preparation of Ca~Al~Fe deicing salt and modified with sodium methyl silicate for reducing the influence of concrete structure. Constr. Build. Mater. 2018, 172, 263–271. [Google Scholar] [CrossRef]
- Zhu, Y. Experimental Study on Restoration of Water Physical Properties of Kaifeng Earth Site. Master’s Thesis, Henan University, Kaifeng, China, 2022. [Google Scholar] [CrossRef]
- Yue, J.; Yang, X.; Zhao, L.; Zhang, D. Mix ratio test of Kaifeng city wall restoration soil. J. Build. Mater. 2022, 25, 532–536+544. [Google Scholar]
- Ma, Q.; Liu, S. Effect on Silt Capillary Water Absorption upon Addition of Sodium Methyl Silicate (SMS) and Microscopic Mechanism Analysis. Coatings 2020, 10, 724. [Google Scholar] [CrossRef]
- Ma, Q.; Liu, Q.; Cheng, K.; Liu, S. Study on the Durability of Hydraulic Lime Soil Mixed with Sodium Methyl Silicate. Coatings 2022, 12, 903. [Google Scholar] [CrossRef]
- Li, X.; Ma, Q.; Ji, Y.; Cheng, K.; Sun, Z. Study on the Improvement of Waterproof Performance of Historical Silt Sites with Silicone Waterproofing Agent. Coatings 2022, 12, 1162. [Google Scholar] [CrossRef]
- Fan, K.; Yan, J.; Liu, L.; Pei, Q.; Zou, W. Study on strength characteristics and microstructure of expansive soil in seasonal frozen zone modified by lignin fiber. J. Cent. South Univ. 2022, 53, 326–334. [Google Scholar]
- GB/T50123-2019; Geotechnical Test Standard. Ministry of Water Resources of the People's Republic of China: Beijing, China, 2019.
- GB/T36747-2018; Test Code For Protection Of Earth Sites. Ministry of Water Resources of the People's Republic of China: Beijing, China, 2018.
- Liu, X. Analysis on interannual changes of temperature and precipitation in Kaifeng in recent 60 years. Henan Sci. 2012, 30, 1327–1330. [Google Scholar] [CrossRef] [PubMed]
- Vidal, H. The Principle of Reinforced Earth; Highway Research Record: Washington, DC, USA, 1969; pp. 1–16. [Google Scholar]
- Yuan, Y.; Jia, M.; Li, W. Experimental study of sodium methylsilicate stabilized silty sand in the Yellow flood area. Chin. Sci. Technol. Pap. 2017, 12, 831–833+844. [Google Scholar]
- Liu, S. Study on Water Stability Test and Micro Mechanism of Sodium Methylsilicate Modified Silt. Master’s Thesis, Zhengzhou University, Zhengzhou, China, 2021. [Google Scholar]
- Wang, Y. Research and new formulation of silicone-acrylic emulsion for reinforcement and protection of soil sites. Sichuan Build. Res. 2011, 37, 227–229. [Google Scholar]
- Ma, J. Modification Test and Mechanical Property Simulation of Northwest Silt Site Restoration Materials. Master’s Thesis, Chang’an University, Xi’an, China, 2018. [Google Scholar]
- Liang, Y. Experimental Study on Mechanical Properties and Durability of Lignin Fiber Composite Cement Soil. Master’s Thesis, Inner Mongolia Agricultural University, Hohhot, China, 2020. [Google Scholar]


| Particle Size Interval Group/mm | Less Than a Certain Particle Size Mass Fraction/% |
|---|---|
| >2.0 | 100.00 |
| 2.0–1.0 | 98.58 |
| 1.0–0.5 | 98.13 |
| 0.5–0.25 | 97.66 |
| 0.25–0.15 | 96.25 |
| 0.15–0.075 | 88.57 |
| Soil Type | Density/g·cm−3 | Initial Water Content/% | Porosity/% | Liquid Limit/% | Plastic Limit/% | Plasticity Index |
|---|---|---|---|---|---|---|
| Silt | 1.7 | 6.8 | 33.8 | 23.4 | 18.1 | 8.9 |
| Number | Sodium Methyl Silicate (%) | Lignin Fiber (%) | Number | Sodium Methyl Silicate (%) | Lignin Fiber (%) |
|---|---|---|---|---|---|
| A-0 | 0 | 0 | C-0 | 0.3 | 0 |
| A-1 | 0.5 | C-1 | 0.5 | ||
| A-2 | 1 | C-2 | 1 | ||
| A-3 | 2 | C-3 | 2 | ||
| B-0 | 0.1 | 0 | D-0 | 0.5 | 0 |
| B-1 | 0.5 | D-1 | 0.5 | ||
| B-2 | 1 | D-2 | 1 | ||
| B-3 | 2 | D-3 | 2 |
| Number of Cycles | Soil Sample Quality (g) | Mass Loss Rat (%) | Apparent Phenomenon |
|---|---|---|---|
| 0 | 93.36 | - | - |
| 1 | 92.81 | 0.59 | The soil sample has no obvious change |
| 2 | 92.67 | 0.74 | There is a small amount of powdering on the surface |
| 3 | 91.21 | 2.30 | The phenomenon of pulverization is increased, with a small amount of peeling, and the surface is rough and uneven |
| 5 | 88.59 | 5.11 | A small amount of peeling occurs at the edges and corners, and the surface starts to dry and crack, and the phenomenon of powdering and peeling is obvious |
| 10 | 87.37 | 6.42 | The surface is severely peeled, powdered and cracked, and a small number of edges and corners fall off, with a small number of cracks |
| Number of Cycles | Soil Sample Quality (g) | Mass Loss Rat (%) | Apparent Phenomenon |
|---|---|---|---|
| 0 | 92.58 | - | - |
| 1 | 92.25 | 0.36 | The surface of soil sample is smoother |
| 2 | 92.27 | 0.33 | The soil sample has no obvious change |
| 3 | 92.21 | 0.40 | The soil sample has no obvious change |
| 5 | 92.11 | 0.51 | A small amount of powder appears on the surface |
| 10 | 91.92 | 0.71 | A small amount of powder appears on the surface |
| Element Type | C | O | Na | Al | Si | K | Ca | Fe | - |
|---|---|---|---|---|---|---|---|---|---|
| Mass ratio (%) | 7.26 | 57.07 | 2.66 | 7.89 | 20.22 | 1.17 | 1.91 | 1.82 | A-0 |
| Atomic ratio (%) | 11.17 | 65.94 | 2.14 | 5.41 | 13.31 | 0.55 | 0.88 | 0.60 | |
| Mass ratio (%) | 7.33 | 55.39 | 3.83 | 6.42 | 21.25 | 0.98 | 3.76 | 1.06 | D-0 |
| Atomic ratio (%) | 11.21 | 62.25 | 2.99 | 4.28 | 16.79 | 0.45 | 1.69 | 0.60 | |
| Mass ratio (%) | 22.21 | 51.94 | 1.43 | 5.51 | 13.57 | 1.30 | 1.58 | 2.46 | D-3 |
| Atomic ratio (%) | 31.01 | 54.46 | 1.04 | 3.43 | 8.10 | 0.56 | 0.66 | 0.74 |
Publisher’s Note: MDPI stays neutral with regard to jurisdictional claims in published maps and institutional affiliations. |
© 2022 by the authors. Licensee MDPI, Basel, Switzerland. This article is an open access article distributed under the terms and conditions of the Creative Commons Attribution (CC BY) license (https://creativecommons.org/licenses/by/4.0/).
Share and Cite
Ji, Y.; Ma, Q.; Li, X.; Tian, Y.; Cao, P. Study on Composite Improvement of Silt Sites by Lignin and Sodium Methylsilicate and Its Micro Mechanism. Coatings 2022, 12, 1647. https://doi.org/10.3390/coatings12111647
Ji Y, Ma Q, Li X, Tian Y, Cao P. Study on Composite Improvement of Silt Sites by Lignin and Sodium Methylsilicate and Its Micro Mechanism. Coatings. 2022; 12(11):1647. https://doi.org/10.3390/coatings12111647
Chicago/Turabian StyleJi, Yufu, Qingwen Ma, Xingang Li, Yang Tian, and Pengke Cao. 2022. "Study on Composite Improvement of Silt Sites by Lignin and Sodium Methylsilicate and Its Micro Mechanism" Coatings 12, no. 11: 1647. https://doi.org/10.3390/coatings12111647
APA StyleJi, Y., Ma, Q., Li, X., Tian, Y., & Cao, P. (2022). Study on Composite Improvement of Silt Sites by Lignin and Sodium Methylsilicate and Its Micro Mechanism. Coatings, 12(11), 1647. https://doi.org/10.3390/coatings12111647